Miniaturization of GPS patch antennas based on novel dielectric ceramics Zn(1−x)MgxAl2O4 by...
12
ORIGINAL PAPER Miniaturization of GPS patch antennas based on novel dielectric ceramics Zn (12x) Mg x Al 2 O 4 by sol–gel method Huda Abdullah • Wan Nasarudin Wan Jalal • Mohd Syafiq Zulfakar Received: 19 September 2013 / Accepted: 3 December 2013 / Published online: 24 December 2013 Ó Springer Science+Business Media New York 2013 Abstract The need for miniaturization and weight reduction of GPS patch antennas has prompted the search for new microwave dielectric materials. In this study, a sol–gel method was used to prepare Zn (1-x) Mg x Al 2 O 4 thin films and fabricate GPS patch antennas at a low annealing temperature (700 °C). X-ray diffraction (XRD) patterns, field emission scanning electron microscopy images, Fou- rier transform infrared spectra, and optical band gap anal- yses confirmed the nanostructure of (Mg/Zn)Al 2 O 4 . The XRD patterns displayed the characteristic peaks of (Mg/ Zn)Al 2 O 4 with a face-centered cubic structure. Mg addition decreased the crystallite size, surface morphology, and lattice parameters of the resultant films, evidently affecting their density and dielectric constant (e r ). Based on the material investigated and microwave antenna theory, GPS patch antennas were fabricated using Zn (1-x) Mg x Al 2 O 4 and then studied using a PNA series network analyzer. The fabricated patch antennas with different e r ceramics decreased in size from 12.5 to 10.8 cm 2 . The patch antennas resonated at a frequency of 1.570 GHz and pro- vided a return loss bandwidth between -16.6 and -20.0 dB; their bandwidth also improved from 90 to 255 MHz. The GPS patch antenna fabricated from Zn 0.70 Mg 0.30 Al 2 O 4 showed an excellent combination of return loss (-20.0 dB), small size (10.8 cm 2 ), and wide bandwidth (255 MHz). Therefore, addition of Mg improves antenna performance and decreases the dimen- sions of the device. Keywords Mg–Zn–Al 2 O 3 Patch antennas Dielectric constant Sol–gel method 1 Introduction Nanostructured transition metal-oxide spinels are important in many applications because of their low temperature sinterability, high thermal resistance, and increased hard- ness [1]; these properties make spinels promising catalytic or carrier materials and precursors for mixed oxides. Spi- nels have enormous potential to generate well-dispersed, active, and very stable catalysts. Zinc aluminate (ZnAl 2 O 4 ) and magnesium aluminate (MgAl 2 O 4 ) are members of a class of mineral gahnite and the spinel family (AB 2 O 4 ). The normal spinel AB 2 O 4 contains A 2? and Al 3? ions in tetrahedral and octahedral sites, respectively. Spinels have a close-packed face-centered-cubic (fcc) structure of oxy- gen ions [2]. Spinel oxides are wide-band gap semicon- ductors; for example, the reported optical band gaps of ZnAl 2 O 4 and MgAl 2 O 4 are in the ranges of 3.8 eV [3, 4] to 4.0 eV [5] and 5.36 eV [2] to 7.8 eV [6], respectively. These wide-band-gap structures are useful in photoelectric and optical applications and currently under study as can- didate materials for reflective optical coatings in aerospace applications [2, 3]. Considering their wide band gap, spinel oxides have attracted much interest among researchers for their potential applications in the telecommunications industry. The operating frequency ranges of microwaves for GPS applications has expanded to the range of millimeter-wave applications [7]. New ceramic materials that can reduce the size of GPS components are urgently required. Miniaturi- zation of GPS patch antennas can be done using a material with high dielectric constant (e r ). However, Lei et al. [8] H. Abdullah (&) W. N. W. Jalal M. S. Zulfakar Department of Electrical, Electronic and System Engineering, Faculty of Engineering and Built Environment, Universiti Kebangsaan Malaysia, 43600 Bangi, Selangor, Malaysia e-mail: [email protected] 123 J Sol-Gel Sci Technol (2014) 69:429–440 DOI 10.1007/s10971-013-3239-7
-
Upload
mohd-syafiq -
Category
Documents
-
view
214 -
download
1
Transcript of Miniaturization of GPS patch antennas based on novel dielectric ceramics Zn(1−x)MgxAl2O4 by...
ORIGINAL PAPER
Miniaturization of GPS patch antennas based on novel dielectricceramics Zn(12x)MgxAl2O4 by sol–gel method
Huda Abdullah • Wan Nasarudin Wan Jalal •
Mohd Syafiq Zulfakar
Received: 19 September 2013 / Accepted: 3 December 2013 / Published online: 24 December 2013
� Springer Science+Business Media New York 2013
Abstract The need for miniaturization and weight
reduction of GPS patch antennas has prompted the search
for new microwave dielectric materials. In this study, a
sol–gel method was used to prepare Zn(1-x)MgxAl2O4 thin
films and fabricate GPS patch antennas at a low annealing
temperature (700 �C). X-ray diffraction (XRD) patterns,
field emission scanning electron microscopy images, Fou-
rier transform infrared spectra, and optical band gap anal-
yses confirmed the nanostructure of (Mg/Zn)Al2O4. The
XRD patterns displayed the characteristic peaks of (Mg/
Zn)Al2O4 with a face-centered cubic structure. Mg addition
decreased the crystallite size, surface morphology, and
lattice parameters of the resultant films, evidently affecting
their density and dielectric constant (er). Based on the
material investigated and microwave antenna theory, GPS
patch antennas were fabricated using Zn(1-x)MgxAl2O4 and
then studied using a PNA series network analyzer. The
fabricated patch antennas with different er ceramics
decreased in size from 12.5 to 10.8 cm2. The patch
antennas resonated at a frequency of 1.570 GHz and pro-
vided a return loss bandwidth between -16.6 and
-20.0 dB; their bandwidth also improved from 90 to
255 MHz. The GPS patch antenna fabricated from
Zn0.70Mg0.30Al2O4 showed an excellent combination of
return loss (-20.0 dB), small size (10.8 cm2), and wide
bandwidth (255 MHz). Therefore, addition of Mg
improves antenna performance and decreases the dimen-
sions of the device.
Keywords Mg–Zn–Al2O3 � Patch antennas � Dielectric
constant � Sol–gel method
1 Introduction
Nanostructured transition metal-oxide spinels are important
in many applications because of their low temperature
sinterability, high thermal resistance, and increased hard-
ness [1]; these properties make spinels promising catalytic
or carrier materials and precursors for mixed oxides. Spi-
nels have enormous potential to generate well-dispersed,
active, and very stable catalysts. Zinc aluminate (ZnAl2O4)
and magnesium aluminate (MgAl2O4) are members of a
class of mineral gahnite and the spinel family (AB2O4).
The normal spinel AB2O4 contains A2? and Al3? ions in
tetrahedral and octahedral sites, respectively. Spinels have
a close-packed face-centered-cubic (fcc) structure of oxy-
gen ions [2]. Spinel oxides are wide-band gap semicon-
ductors; for example, the reported optical band gaps of
ZnAl2O4 and MgAl2O4 are in the ranges of 3.8 eV [3, 4] to
4.0 eV [5] and 5.36 eV [2] to 7.8 eV [6], respectively.
These wide-band-gap structures are useful in photoelectric
and optical applications and currently under study as can-
didate materials for reflective optical coatings in aerospace
applications [2, 3]. Considering their wide band gap, spinel
oxides have attracted much interest among researchers for
their potential applications in the telecommunications
industry.
The operating frequency ranges of microwaves for GPS
applications has expanded to the range of millimeter-wave
applications [7]. New ceramic materials that can reduce the
size of GPS components are urgently required. Miniaturi-
zation of GPS patch antennas can be done using a material
with high dielectric constant (er). However, Lei et al. [8]
H. Abdullah (&) � W. N. W. Jalal � M. S. Zulfakar
Department of Electrical, Electronic and System Engineering,
Faculty of Engineering and Built Environment, Universiti
Kebangsaan Malaysia, 43600 Bangi, Selangor, Malaysia
e-mail: [email protected]
123
J Sol-Gel Sci Technol (2014) 69:429–440
DOI 10.1007/s10971-013-3239-7
and Huang [9] reported that materials with er [ 15 are not
particularly interesting because the operating frequency of
GPS has reached the millimeter-wave operation range.
Tsunooka et al. [10] and Kim et al. [11] also reported that
special microwave dielectric ceramics used in millimeter-
wave technology must have ceramics properties with low er
and high quality (Q). High Q can be achieved using
materials with very low dielectric loss and low er [12, 13]
and is necessary to ensure good selection frequency char-
acteristics; this parameter is determined from the dielectric
loss factor of the material. Shannon and Rossman [14]
measured the dielectric loss factor and er of single crystal
MgAl2O4 using a two-terminal method. Microwave
dielectric materials with low er can minimize cross cou-
pling with conductors and shorten the time required for
electronic signal transition [9]. According to Narang and
Bahel [15], low er in the range of 4–12 are used for mil-
limeter-wave applications and as microwave substrates.
Thus, a material with low er and high Q is more functional
than a material with high er and low Q. High-performance
microwave dielectric materials with er \ 15 and high Q are
needed for fabricating GPS patch antennas.
Both ZnAl2O4 and MgAl2O4 ceramics have good
dielectric properties and therefore garnered increased
attention as potential microwave dielectric ceramics for
millimeter-wave applications. Surendran et al. reported that
ZnAl2O4 [16] and MgAl2O4 [17] ceramics exhibit interest-
ing dielectric properties of er = 8.5, Qxf = 56,300 GHz
and er = 8.8, Qxf = 68,900 GHz, respectively. Microwave
dielectric ceramics are suitable and effective for creating
smaller devices by improving the er. The effects of substi-
tuting Mg with Zn in the MgAl2O4 framework have been
studied by several authors [18, 19]. Zheng et al. [18]
improved the Q 9 f value up to a maximal value of 106,000
GHz and showed a er that varied from 7.90 to 8.56. How-
ever, information on the preparation of ZnAl2O4 as well as
its modification by Mg doping as microwave dielectric
ceramics is lacking. Doping of the parent lattice with suit-
able cations and methods during synthesis is done to modify
and improve ceramic properties. Mg was selected as a
doping material because of its relatively high Q, high er,
high melting point (2,130 �C), and stability at service tem-
peratures; these properties indicate that Mg is a suitable
candidate for the production of GPS patch antennas.
In this study, the microwave dielectric properties of
ZnAl2O4 spinels were determined. Tailoring of ZnAl2O4
spinel properties was performed by molar mixing with Mg
to form Zn(1-x)MgxAl2O4 and develop an alternate micro-
wave dielectric ceramic for GPS antennas. The sol–gel
method was used to prepare Zn(1-x)MgxAl2O4 microwave
dielectric ceramics and the GPS antenna. The effects of the
sol–gel method on the structural, morphological, optical,
chemical, and dielectric properties of Zn(1-x)MgxAl2O4 thin
films were investigated. Finally, a microstrip patch antenna
for GPS application was fabricated and its performance was
measured.
2 Experimental procedure
2.1 Preparation of Zn(1-x)MgxAl2O4
Zinc acetate dehydrate Zn(O2CCH3)2, aluminum nitrate
nonahydrate Al(NO3)3�9H2O, and magnesium nitrate
Mg(NO3)2�6H2O were dissolved in absolute ethanol
(C2H5OH). Substitution of Zn2? by Mg2? in the framework
of ZnAl2O4 was completed by the sol–gel method with
different concentrations (x) of Mg (x = 0.00, 0.05, 0.10,
0.15, 0.20, 0.25, 0.30). Calculated amounts of
Zn(O2CCH3)2, Al(NO3)3�9H2O, and Mg(NO3)2�6H2O were
dissolved separately. Initially, Al(NO3)3�9H2O was dis-
solved in 60 mL of absolute ethanol (C2H5OH) and then in
0.5 mL of ethylene glycol (chelating agent). Subsequently,
Mg(NO3)2�6H2O and Zn(O2CCH3)2 were added to the
solution. After storing at approximately 75 �C for 1 h,
0.36 mL of nitric acid was used to prepare a homogeneous
solution. The solution was continuously heated at 75 �C
with constant stirring by a magnetic stirrer for another 1 h
until a clear solution was obtained following a chemical
reaction. The solution containing Zn(1-x)MgxAl2O4 was
stirred for 0.5 h at 180 �C to obtain a transparent and stable
sol.
Zn(1-x)MgxAl2O4 thin films were deposited using the
sol–gel spin coating method. The transparent and stable sol
of Zn(1-x)MgxAl2O4 was prepared on a fluorine tin oxide
(FTO) substrate by the spin coating technique at 3,500 rpm/
min for 35 s and then treated at 85 �C for 15 min. The
coating procedure were repeated 10 times to obtain satis-
factory thickness and remove organic residuals. This tech-
nique was conducted in a clean room facility to avoid
contamination of particles and obtain films with good
optical quality. The thin films were annealed at 700 �C for
1 h at 1 �C/min to eliminate the remaining organic matter.
The nanostructure of ZnAl2O4-doped Mg was charac-
terized by X-ray diffraction (XRD, Siemens D-500) using
CuKa radiation of WL1 = 1.541 A, WL2 = 1.544 A, and
WL3 = 1.392 A. The XRD pattern was collected over the
2h range from 20� to 60� with a selected step scan and step
width of 0.025�. The density of the annealed thin films was
measured by the Archimedes method. The structural mor-
phology and chemical bonding of the thin films was
observed by field-emission scanning electron microscopy
(FESEM, Zeisz Supra 15 kV), atomic force microscopy
(AFM, NTEGRA Prima), and Fourier transform infrared
spectroscopy (FTIR). The er was measured using an LCR
spectrometer (HP 4284A) in the frequency range of 20 Hz
430 J Sol-Gel Sci Technol (2014) 69:429–440
123
to 1 MHz at room temperature. Patch antennas were suc-
cessfully fabricated on a glass substrate, and their return
loss was measured by PNA series network analyzer
(E8358A, Agilent).
3 Results and discussion
3.1 X-ray diffraction studies (XRD)
The ceramics were expected to be generated as the solid
solution Zn(1-x)MgxAl2O4 because ZnAl2O4 and MgAl2O4
have the same spinel structure. The XRD patterns of
Zn(1-x)MgxAl2O4 thin films annealed at 700 �C for 1 h as a
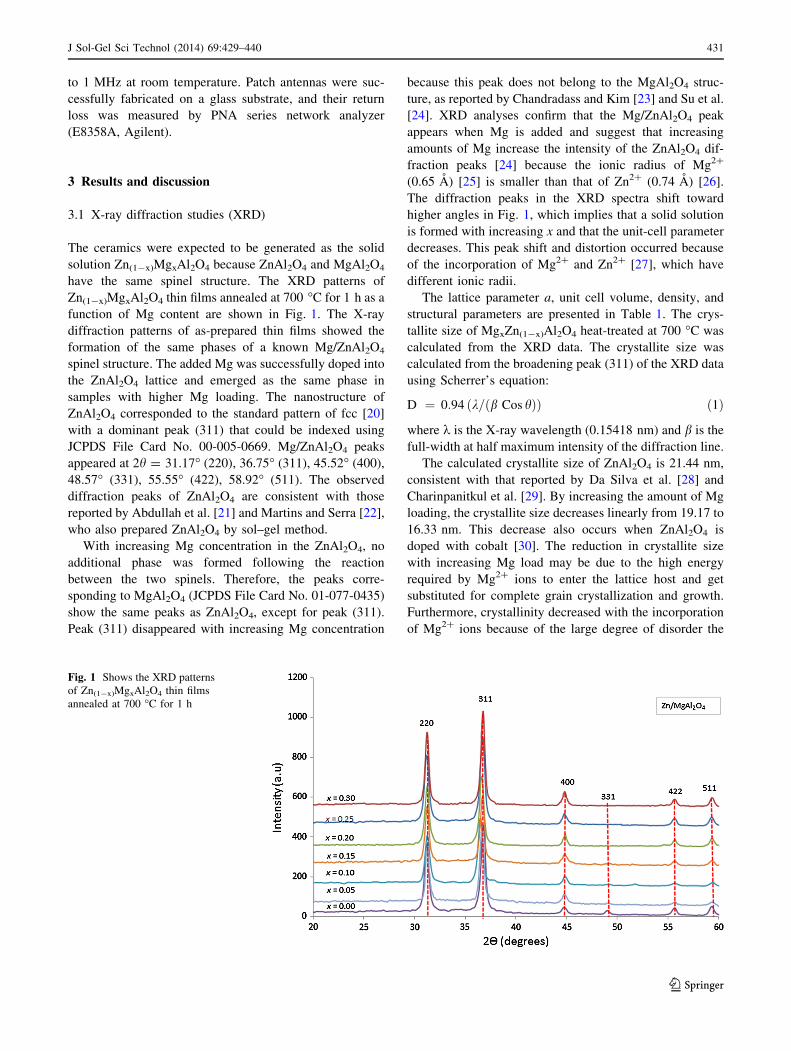
function of Mg content are shown in Fig. 1. The X-ray
diffraction patterns of as-prepared thin films showed the
formation of the same phases of a known Mg/ZnAl2O4
spinel structure. The added Mg was successfully doped into
the ZnAl2O4 lattice and emerged as the same phase in
samples with higher Mg loading. The nanostructure of
ZnAl2O4 corresponded to the standard pattern of fcc [20]
with a dominant peak (311) that could be indexed using
JCPDS File Card No. 00-005-0669. Mg/ZnAl2O4 peaks
appeared at 2h = 31.17� (220), 36.75� (311), 45.52� (400),
48.57� (331), 55.55� (422), 58.92� (511). The observed
diffraction peaks of ZnAl2O4 are consistent with those
reported by Abdullah et al. [21] and Martins and Serra [22],
who also prepared ZnAl2O4 by sol–gel method.
With increasing Mg concentration in the ZnAl2O4, no
additional phase was formed following the reaction
between the two spinels. Therefore, the peaks corre-
sponding to MgAl2O4 (JCPDS File Card No. 01-077-0435)
show the same peaks as ZnAl2O4, except for peak (311).
Peak (311) disappeared with increasing Mg concentration
because this peak does not belong to the MgAl2O4 struc-
ture, as reported by Chandradass and Kim [23] and Su et al.
[24]. XRD analyses confirm that the Mg/ZnAl2O4 peak
appears when Mg is added and suggest that increasing
amounts of Mg increase the intensity of the ZnAl2O4 dif-
fraction peaks [24] because the ionic radius of Mg2?
(0.65 A) [25] is smaller than that of Zn2? (0.74 A) [26].
The diffraction peaks in the XRD spectra shift toward
higher angles in Fig. 1, which implies that a solid solution
is formed with increasing x and that the unit-cell parameter
decreases. This peak shift and distortion occurred because
of the incorporation of Mg2? and Zn2? [27], which have
different ionic radii.
The lattice parameter a, unit cell volume, density, and
structural parameters are presented in Table 1. The crys-
tallite size of MgxZn(1-x)Al2O4 heat-treated at 700 �C was
calculated from the XRD data. The crystallite size was
calculated from the broadening peak (311) of the XRD data
using Scherrer’s equation:
D ¼ 0:94 k= b Cos hð Þð Þ ð1Þ
where k is the X-ray wavelength (0.15418 nm) and b is the
full-width at half maximum intensity of the diffraction line.
The calculated crystallite size of ZnAl2O4 is 21.44 nm,
consistent with that reported by Da Silva et al. [28] and
Charinpanitkul et al. [29]. By increasing the amount of Mg
loading, the crystallite size decreases linearly from 19.17 to
16.33 nm. This decrease also occurs when ZnAl2O4 is
doped with cobalt [30]. The reduction in crystallite size
with increasing Mg load may be due to the high energy
required by Mg2? ions to enter the lattice host and get
substituted for complete grain crystallization and growth.
Furthermore, crystallinity decreased with the incorporation
of Mg2? ions because of the large degree of disorder the
Fig. 1 Shows the XRD patterns
of Zn(1-x)MgxAl2O4 thin films
annealed at 700 �C for 1 h
J Sol-Gel Sci Technol (2014) 69:429–440 431
123

ions produce in the lattice host as a result of ionic radius
mismatches between Mg2?, Zn2?, and Al3? ions [1]. The
crystallite size may be affected by the ionic radius of Mg2?
(0.65 A) [25], which is smaller than that of Zn2? (0.74 A).
The linear relationship between a and the crystallite size
with Mg addition was fairly consistent with Vegard’s law
[31].
The experimental a of the fcc spinel phase of ZnAl2O4
in the films are shown in Table 1. The a of fcc
Zn(1-x)MgxAl2O4 was calculated based on the XRD pat-
terns using the following equation:
a ¼ dhkl h2 þ k2 þ l2� �
ð2Þ
where d is the interplanar distance (A), and h, k, and l are
the Miller indices of the peak (311). The calculated a of
ZnAl2O4 (8.0848 A) was in agreement with the reported
value a = 8.083–8.095 A [16, 32, 33], theoretical value
(8.05 A), and JCPDS File Card No. 00-005-0669. The
a value changed because peak 311 was shifted upon the
substitution of Zn2? by Mg2? in the ZnAl2O4 framework
(Fig. 1). The experimental values of a upon Mg substitu-
tion of Zn decreased from 8.078 A (x = 0.05) to 8.021 A
(x = 0.30). The relationships between crystallite size and
a show a linear relationship with Mg loading, as illustrated
in Fig. 2.
The densities of Zn(1-x)MgxAl2O4 thin films are also
shown in Table 1. The density of annealed pure ZnAl2O4
was measured as 4.61 g/cm3, slightly higher than the theo-
retical density (4.58 g/cm3) [34]. The density of the annealed
thin films was measured by the Archimedes method from the
XRD data. The densities increased with increasing Mg
concentrations (x) until x = 0.10 and then slightly decreased
at x = 0.15 and x = 0.20. The densities increased again
thereafter. This phenomenon is attributed to the increase in
volume ratio of MgAl2O4 and the simultaneous decrease in
volume ratio of ZnAl2O4, which indicates that the particles in
the (Mg/Zn)Al2O4 film are not compact and less uniform.
This behavior can be observed in the FESEM images. This
phenomenon could also occur because of smaller grain sizes
(Fig. 2), ion volatilization, and other defects that appear in
(Mg/Zn)Al2O4 ceramics, which could lead to a decrease in
density. Such behavior can be expected because the density
of MgAl2O4 (3.58 g/cm3) is lower than that of ZnAl2O4
(4.58 g/cm3) [16, 34].
3.2 Morphological observation
AFM images of three-dimensional Zn(1-x)MgxAl2O4
measured at room temperature are shown in Fig. 4. The
scanning size was 1 lm 9 1 lm. The AFM images reveal
the formation of a uniform surface with valleys as the Mg
content increased. The valleys disappeared at x = 0.30
(Fig. 4g). The roughness average (rms) of ZnAl2O4 was
approximately 37.8 nm (Fig. 4a). The rms decreased
from 14.7 to 2.0 nm because of increasing Mg content,
which results in the formation of a solid solution of
0.00 0.05 0.10 0.15 0.20 0.25 0.30
16
18
20
22
Lattice Parameter Crystallite Size
Concentration (x)
Cry
stal
lite
Siz
e (n
m)
8.0108.015
8.0208.025
8.0308.0358.040
8.0458.050
8.0558.0608.065
8.0708.075
8.0808.085
Lattice Param
eter (A)
Fig. 2 Crystallite size and lattice parameter of Zn(1-x)MgxAl2O4
with different Mg-content
0.00 0.05 0.10 0.15 0.20 0.25 0.30
4.660
4.665
4.670
4.675
4.680
4.685
4.690
4.695
4.700
4.705
App
aren
t Den
sity
(g/
cm3 )
Mg Concentration (x)
Fig. 3 The apparent densities of Zn(1-x)MgxAl2O4 thin films
prepared by sol–gel method
Table 1 Structural parameters of Zn(1-x)MgxAl2O4 thin films
Mg-content (x) D (nm) a (A) hkl Apparent
density (g/cm3)
0.00 21.44 8.048 311 4.67
0.05 19.17 8.043 311 4.68
0.10 18.49 8.037 311 4.69
0.15 18.25 8.043 311 4.67
0.20 17.60 8.048 311 4.68
0.25 17.09 8.037 311 4.69
0.30 16.33 8.032 311 4.70
432 J Sol-Gel Sci Technol (2014) 69:429–440
123
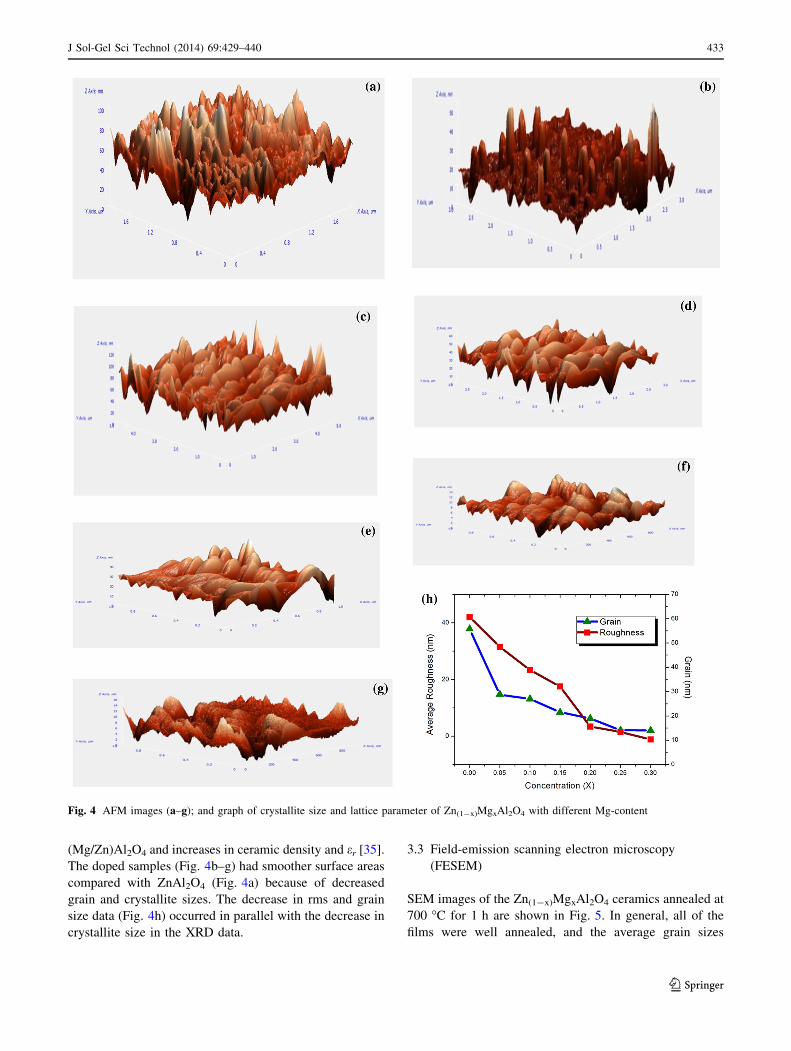
(Mg/Zn)Al2O4 and increases in ceramic density and er [35].
The doped samples (Fig. 4b–g) had smoother surface areas
compared with ZnAl2O4 (Fig. 4a) because of decreased
grain and crystallite sizes. The decrease in rms and grain
size data (Fig. 4h) occurred in parallel with the decrease in
crystallite size in the XRD data.
3.3 Field-emission scanning electron microscopy
(FESEM)
SEM images of the Zn(1-x)MgxAl2O4 ceramics annealed at
700 �C for 1 h are shown in Fig. 5. In general, all of the
films were well annealed, and the average grain sizes
Fig. 4 AFM images (a–g); and graph of crystallite size and lattice parameter of Zn(1-x)MgxAl2O4 with different Mg-content
J Sol-Gel Sci Technol (2014) 69:429–440 433
123
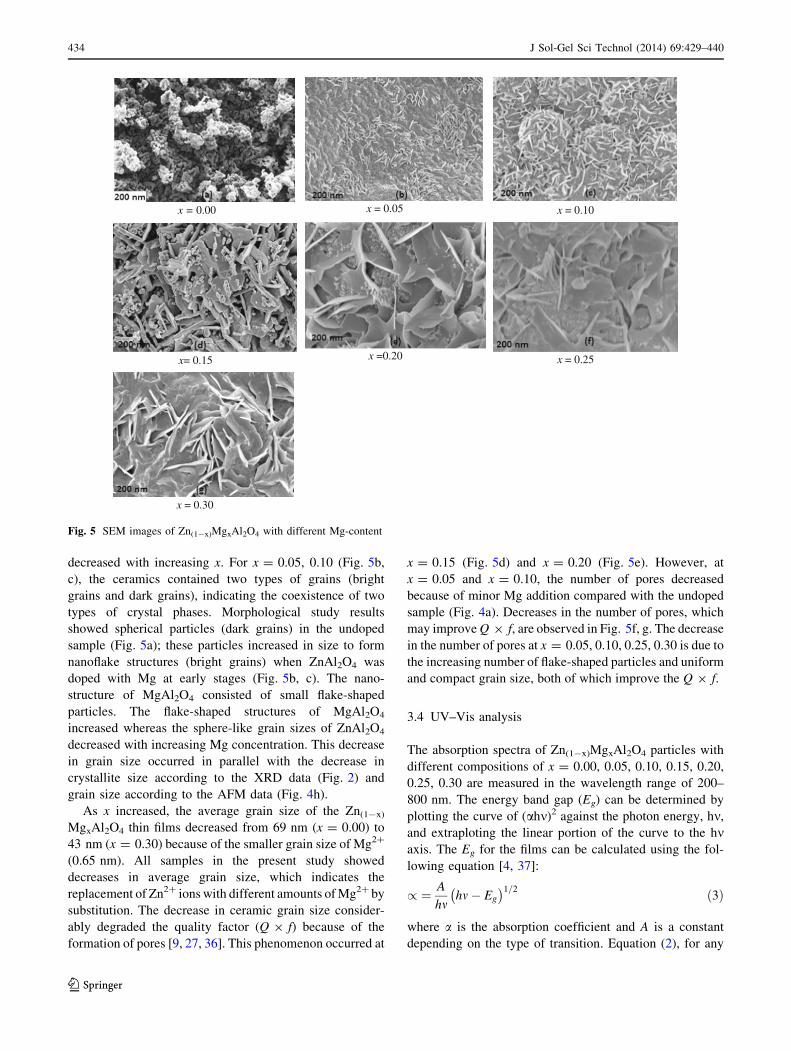
decreased with increasing x. For x = 0.05, 0.10 (Fig. 5b,
c), the ceramics contained two types of grains (bright
grains and dark grains), indicating the coexistence of two
types of crystal phases. Morphological study results
showed spherical particles (dark grains) in the undoped
sample (Fig. 5a); these particles increased in size to form
nanoflake structures (bright grains) when ZnAl2O4 was
doped with Mg at early stages (Fig. 5b, c). The nano-
structure of MgAl2O4 consisted of small flake-shaped
particles. The flake-shaped structures of MgAl2O4
increased whereas the sphere-like grain sizes of ZnAl2O4
decreased with increasing Mg concentration. This decrease
in grain size occurred in parallel with the decrease in
crystallite size according to the XRD data (Fig. 2) and
grain size according to the AFM data (Fig. 4h).
As x increased, the average grain size of the Zn(1-x)
MgxAl2O4 thin films decreased from 69 nm (x = 0.00) to
43 nm (x = 0.30) because of the smaller grain size of Mg2?
(0.65 nm). All samples in the present study showed
decreases in average grain size, which indicates the
replacement of Zn2? ions with different amounts of Mg2? by
substitution. The decrease in ceramic grain size consider-
ably degraded the quality factor (Q 9 f) because of the
formation of pores [9, 27, 36]. This phenomenon occurred at
x = 0.15 (Fig. 5d) and x = 0.20 (Fig. 5e). However, at
x = 0.05 and x = 0.10, the number of pores decreased
because of minor Mg addition compared with the undoped
sample (Fig. 4a). Decreases in the number of pores, which
may improve Q 9 f, are observed in Fig. 5f, g. The decrease
in the number of pores at x = 0.05, 0.10, 0.25, 0.30 is due to
the increasing number of flake-shaped particles and uniform
and compact grain size, both of which improve the Q 9 f.
3.4 UV–Vis analysis
The absorption spectra of Zn(1-x)MgxAl2O4 particles with
different compositions of x = 0.00, 0.05, 0.10, 0.15, 0.20,
0.25, 0.30 are measured in the wavelength range of 200–
800 nm. The energy band gap (Eg) can be determined by
plotting the curve of (ahm)2 against the photon energy, hm,
and extraploting the linear portion of the curve to the hmaxis. The Eg for the films can be calculated using the fol-
lowing equation [4, 37]:
/ ¼ A
hmhm� Eg
� �1=2 ð3Þ
where a is the absorption coefficient and A is a constant
depending on the type of transition. Equation (2), for any
x = 0.00 x = 0.05 x = 0.10
x= 0.15 x =0.20 x = 0.25
x = 0.30
Fig. 5 SEM images of Zn(1-x)MgxAl2O4 with different Mg-content
434 J Sol-Gel Sci Technol (2014) 69:429–440
123
0.00 0.05 0.10 0.15 0.20 0.25 0.30
3.8
4.0
4.2
4.4
4.6
4.8
5.0
5.2
5.4
Ban
d G
ap (
eV)
Mg Concentration (x)
(h) x = 0.30 (g) x = 0.30
(a) x = 0.00 (b) x = 0.05
(c) x = 0.10 (d) x = 0.15
(e) x = 0.20 (f) x = 0.25
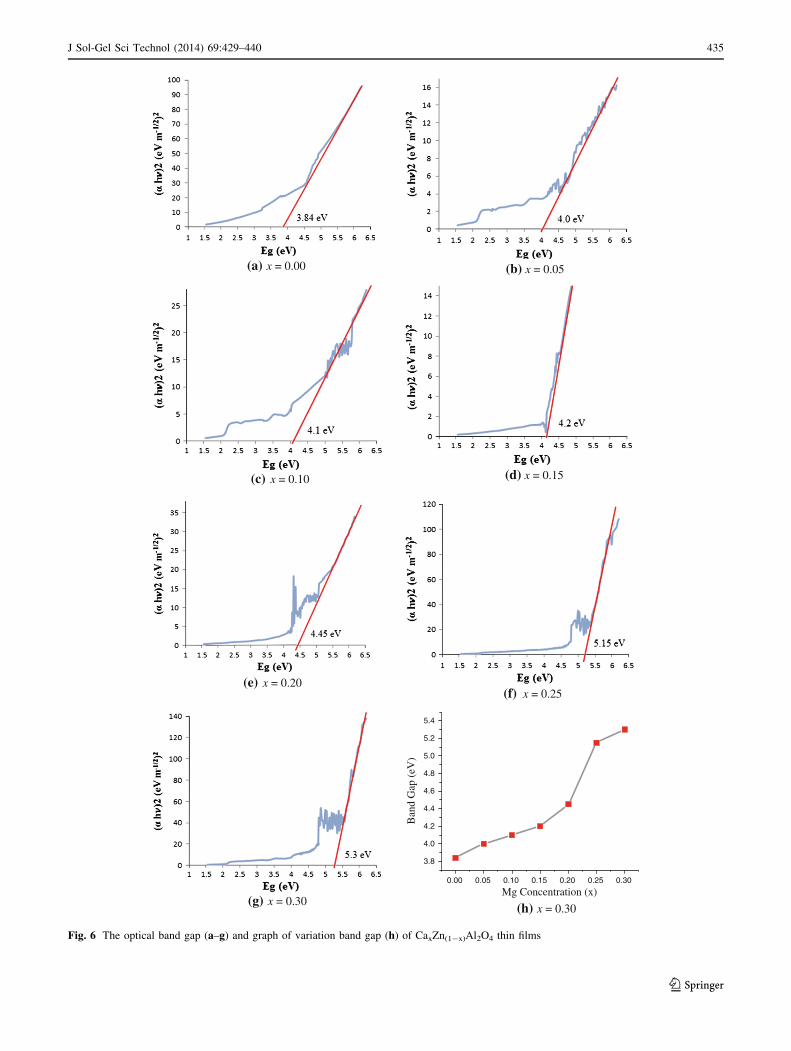
Fig. 6 The optical band gap (a–g) and graph of variation band gap (h) of CaxZn(1-x)Al2O4 thin films
J Sol-Gel Sci Technol (2014) 69:429–440 435
123

energy, can be rearranged and written in the following
form:
/hmð Þ2¼ A2 hm� Eg
� �ð4Þ
The relationship between (ah)2 and hv is presented in
Fig. 6, where the Eg value of ZnAl2O4 is 3.84 eV (Fig. 6a)
and that of Zn(1-x)MgxAl2O4 increases linearly from 4.0 to
5.3 eV (Fig. 6h). The Eg of ZnAl2O4 obtained in this work
is similar to the results of Wan Jalal et al. [3, 4]. This work
further reports the band gap of Zn(1-x)MgxAl2O4 for the
first time. Zn(1-x)MgxAl2O4 Eg values of over 3.84 eV may
have been influenced by the effect of the Mg band gap
(from 5.36 eV [2] to 7.8 eV [6]). The Eg may also increase
because of decreases in intermediary energy levels within
the optical band gap.
The Eg values of ZnAl2O4 thin films doped with Mg are
also related to the form of the solid solution, as discussed
using the XRD data. Samples with a smaller crystallite size
and with the form of a solid solution without any defects
show higher Eg values [38]. Thus, the Eg of films with Mg
content is associated with the contributions of intermediary
energy levels of both ZnAl2O4 and Mg phases (Fig. 6b–g).
We suggest that the ideal Eg of (Mg/Zn)Al2O4 ranges from
3.84 to 5.3 eV. Wan Jalal et al. [4] reported that decreasing
the Eg can improve dielectric properties, which is suitable
for generating patch antennas.
3.5 FTIR analysis
FTIR analysis of the Mg-doped ZnAl2O4 thin films was
performed in the wave number region from 400 to
4,000 cm-1. The absorption spectra of the Zn(1-x)MgxAl2O4
thin films are shown in Fig. 7. The broad absorption band
centered at 3,400–3,852 cm-1 is assigned to the stretching
vibrations of O–H groups brought about by the water content
of the crystallites. The band at 2,332 cm-1 can be attributed
to the presence of oxygen bonds in the fcc crystal lattice of
oxygen atoms. This peak is observed in all spinel compounds
and can be treated as a characteristic feature of spinel-
structured crystallites [4]. The intensity of the peak at
2,332 cm-1 decreased as the amount of Mg increased, which
indicates Mg occupation of tetrahedral (AlO3) sites. The
absorption band at around 1,919 cm-1 corresponds to O–H
bending vibrations attributed to free water molecules [39].
The spectra of all of the samples showed a peak at
1,333 cm-1 attributed to Al–O stretching vibrations [1].
Peaks in the range of 400–900 cm-1 are attributed to
metal–oxygen, aluminum–oxygen, and metal–oxygen–alu-
minum stretching [1, 33]. The band attributed to (Zn/
Mg)Al2O4 spinel appeared at approximately 648 cm-1.
According to Kim et al. [40], band characteristics of the
spinel structure are well observed at approximately
469 cm-1. These bands correspond to the bending modes of
ZnO, MgO, and AlO6, all of which form the (Zn/Mg)Al2O4
spinel thin films [41].
3.6 Dielectric constant
The dielectric constant, eris consists of real permittivity or
relative dielectric constant which is generally called
dielectric constant of the test material and imaginary per-
mittivity or dielectric loss. The er is calculated from the
capacitance value, which can be obtained using the fol-
lowing equation:
er ¼ Cd=eoA ð5Þ
where C is the capacitance of the capacitor formed by
inserting a sample between two metal plates, d is the
Fig. 7 FTIR spectra of
Zn(1-x)MgxAl2O4 thin films.
(a) x = 0.00, (b) x = 0.05,
(c) x = 0.10, (d) x = 0.15,
(e) x = 0.20 and (f) x = 0.30
436 J Sol-Gel Sci Technol (2014) 69:429–440
123
thickness of the sample, eo is the permittivity of free space,
and A is the cross sectional area of the sample.
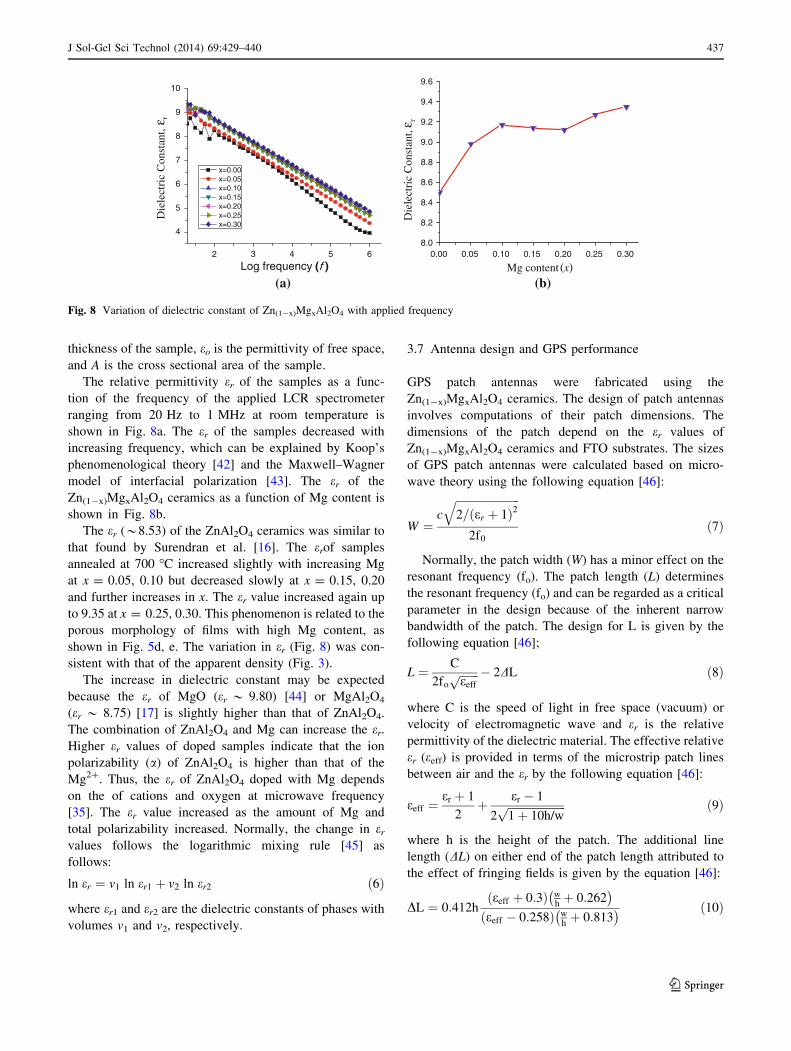
The relative permittivity er of the samples as a func-
tion of the frequency of the applied LCR spectrometer
ranging from 20 Hz to 1 MHz at room temperature is
shown in Fig. 8a. The er of the samples decreased with
increasing frequency, which can be explained by Koop’s
phenomenological theory [42] and the Maxwell–Wagner
model of interfacial polarization [43]. The er of the
Zn(1-x)MgxAl2O4 ceramics as a function of Mg content is
shown in Fig. 8b.
The er (*8.53) of the ZnAl2O4 ceramics was similar to
that found by Surendran et al. [16]. The erof samples
annealed at 700 �C increased slightly with increasing Mg
at x = 0.05, 0.10 but decreased slowly at x = 0.15, 0.20
and further increases in x. The er value increased again up
to 9.35 at x = 0.25, 0.30. This phenomenon is related to the
porous morphology of films with high Mg content, as
shown in Fig. 5d, e. The variation in er (Fig. 8) was con-
sistent with that of the apparent density (Fig. 3).
The increase in dielectric constant may be expected
because the er of MgO (er * 9.80) [44] or MgAl2O4
(er * 8.75) [17] is slightly higher than that of ZnAl2O4.
The combination of ZnAl2O4 and Mg can increase the er.
Higher er values of doped samples indicate that the ion
polarizability (a) of ZnAl2O4 is higher than that of the
Mg2?. Thus, the er of ZnAl2O4 doped with Mg depends
on the of cations and oxygen at microwave frequency
[35]. The er value increased as the amount of Mg and
total polarizability increased. Normally, the change in er
values follows the logarithmic mixing rule [45] as
follows:
ln er ¼ v1 ln er1 þ v2 ln er2 ð6Þ
where er1 and er2 are the dielectric constants of phases with
volumes v1 and v2, respectively.
3.7 Antenna design and GPS performance
GPS patch antennas were fabricated using the
Zn(1-x)MgxAl2O4 ceramics. The design of patch antennas
involves computations of their patch dimensions. The
dimensions of the patch depend on the er values of
Zn(1-x)MgxAl2O4 ceramics and FTO substrates. The sizes
of GPS patch antennas were calculated based on micro-
wave theory using the following equation [46]:
W ¼c
ffiffiffiffiffiffiffiffiffiffiffiffiffiffiffiffiffiffiffiffiffiffiffi2= er þ 1ð Þ2
q
2f0
ð7Þ
Normally, the patch width (W) has a minor effect on the
resonant frequency (fo). The patch length (L) determines
the resonant frequency (fo) and can be regarded as a critical
parameter in the design because of the inherent narrow
bandwidth of the patch. The design for L is given by the
following equation [46];
L ¼ C
2foffiffiffiffiffiffiffieeffp � 2DL ð8Þ
where C is the speed of light in free space (vacuum) or
velocity of electromagnetic wave and er is the relative
permittivity of the dielectric material. The effective relative
er (eeff) is provided in terms of the microstrip patch lines
between air and the er by the following equation [46]:
eeff ¼er þ 1
2þ er � 1
2ffiffiffiffiffiffiffiffiffiffiffiffiffiffiffiffiffiffiffiffiffi1þ 10h/wp ð9Þ
where h is the height of the patch. The additional line
length (DL) on either end of the patch length attributed to
the effect of fringing fields is given by the equation [46]:
DL ¼ 0:412heeff þ 0:3ð Þ w
hþ 0:262
� �
eeff � 0:258ð Þ whþ 0:813
� � ð10Þ
4
5
6
7
8
9
10
Die
lect
ric
Con
stan
t, r
Log frequency (f )
x=0.00 x=0.05 x=0.10 x=0.15 x=0.20 x=0.25 x=0.30
2 3 4 5 6 0.00 0.05 0.10 0.15 0.20 0.25 0.308.0
8.2
8.4
8.6
8.8
9.0
9.2
9.4
9.6
Mg content (x)
Die
lect
ric
Con
stan
t, r
(a) (b)
ε ε
Fig. 8 Variation of dielectric constant of Zn(1-x)MgxAl2O4 with applied frequency
J Sol-Gel Sci Technol (2014) 69:429–440 437
123
The patch length (L) can be calculated as;
L ¼ Leff�2DL ð11Þ
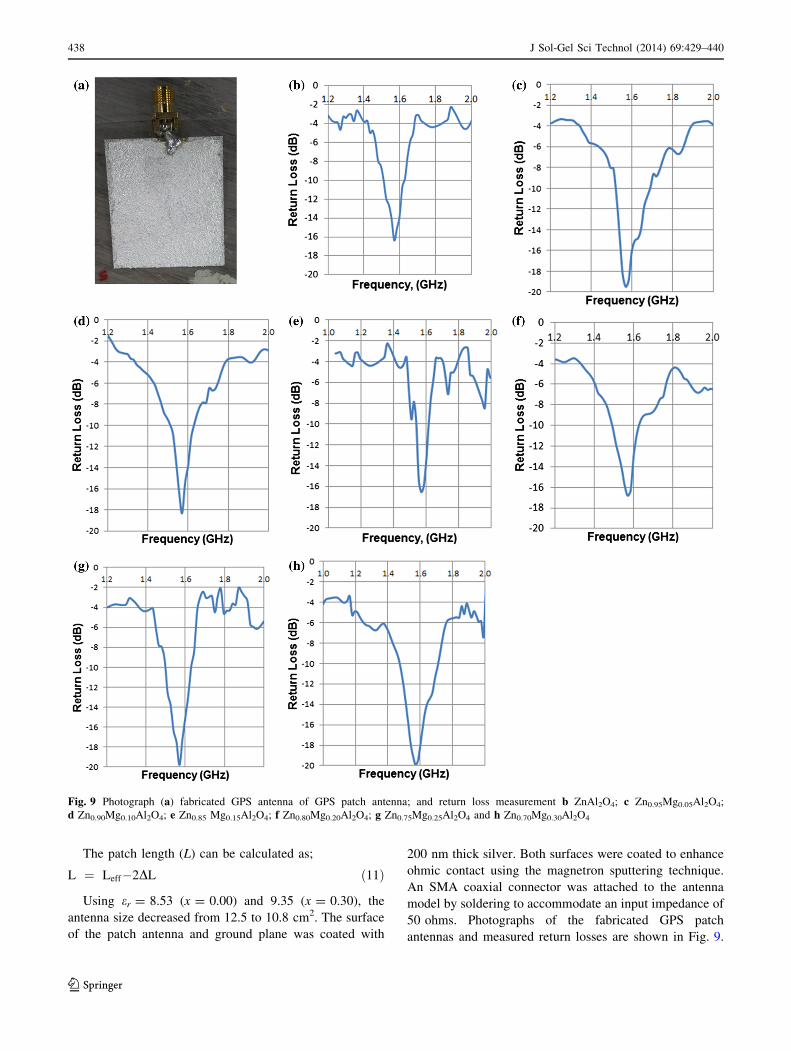
Using er = 8.53 (x = 0.00) and 9.35 (x = 0.30), the
antenna size decreased from 12.5 to 10.8 cm2. The surface
of the patch antenna and ground plane was coated with
200 nm thick silver. Both surfaces were coated to enhance
ohmic contact using the magnetron sputtering technique.
An SMA coaxial connector was attached to the antenna
model by soldering to accommodate an input impedance of
50 ohms. Photographs of the fabricated GPS patch
antennas and measured return losses are shown in Fig. 9.
Fig. 9 Photograph (a) fabricated GPS antenna of GPS patch antenna; and return loss measurement b ZnAl2O4; c Zn0.95Mg0.05Al2O4;
d Zn0.90Mg0.10Al2O4; e Zn0.85 Mg0.15Al2O4; f Zn0.80Mg0.20Al2O4; g Zn0.75Mg0.25Al2O4 and h Zn0.70Mg0.30Al2O4
438 J Sol-Gel Sci Technol (2014) 69:429–440
123

The return loss characteristics of the fabricated antennas
were measured using a PNA series network analyzer
(E8358A, Agilent) at room temperature. Measurements of
all seven antennas were carried out Measurements of all
seven antennas were carried out over the frequency range
of 1.0–2.0 GHz with a frequency step size of 20 MHz to
match the resonant frequency (1.575 GHz); results are
plotted in Fig. 9b–h.
The measured result shows that the all antennas was
achieved the return loss (\-10 dB) and impedance band-
width (90–255 MHz), to accommodate an efficient antenna
feed for GPS application. Among these antennas, the
Zn0.70Mg0.30Al2O4 shows an excellent combination
between return loss (-20.0 dB), small in sizes (10.8 cm2)
and wide bandwidth (255 MHz). Sotoudeh et al. [47]
reported, the antenna with a bandwidth greater than the
minimum GPS specification ([2.046 MHz) ensures full
functionality. Thus, we concluded that the magnesium
(Mg) is an effective dopant material with ZnAl2O4 to
improve the performances of GPS patch antenna.
4 Conclusions
Zn(1-x)MgxAl2O4 microwave dielectric ceramic thin films
were successfully synthesized through the sol–gel method at
low temperature sinterability (700 �C in air for 1 h). This
method was suitable for synthesizing ZnAl2O4:Mg and
yielded a single-phased nanostructure showing high quality
and satisfactory crystallinity of spinel structure. A Zn(1-x)
MgxAl2O4 solid solution with a spinel structure was
observed in the ZnAl2O4 and MgAl2O4 system. Mg was
successfully doped in the ZnAl2O4 lattice and emerged as
the same phase even at higher Mg contents. The nano-
structure of (Mg/Zn)Al2O4 corresponded to the standard
pattern of fcc with a dominant peak of (311). Addition of Mg
decreased the crystallite size, grain size, a, and surface
morphology of the films. Patch antennas with various
dimensions were fabricated to operate at 1.5754 GHz (L1
band). The performance of GPS patch antennas were dem-
onstrated by experimental methods and measured using a
PNA series network analyzer. The return loss of the antennas
improved from -16.6 to -20.0 dB, and the devices oper-
ated at a frequency of 1.570 GHz. Measured bandwidths in
the range of 90–255 MHz were further obtained. The GPS
patch antenna with the best performance was obtained using
the Zn0.70Mg0.30Al2O4 specimen. Addition of Mg improved
the performance of the GPS patch antennas.
Acknowledgments This project was performed in the Photonic
Technology Laboratory, Institute of Microengineering and Nano-
electronics (IMEN), Universiti Kebangsaan Malaysia, Malaysia.
References
1. Kumar RT, Selvam NCS, Ragupathi C, Kennedy LJ, Vijaya JJ
(2012) Powder Technol 224:147–154
2. Sampath SK, Kanhere D, Pandey R (1999) J Phys: Condens
Matter 11:3635
3. Wan Jalal WN, Abdullah H, Zulfakar MS, Bais B, Shaari S, Islam
MT (2013) Trans Ind Ceram Soc 72:215–224
4. Wan Jalal WN, Abdullah H, Zulfakar MS, Shaari S, Islam MT
(2013) Int J Appl Ceram Tec. doi:10.1111/ijac.12193
5. Yousaf M, Saeed MA, Isa ARM, Rahnamaye Aliabad HA, Noor
NA (2012) Int J Mod Phys B 26:1250198
6. Bortz M, French R, Jones D, Kasowski R, Ohuchi F (1990) Phys
Scr 41:537
7. Ye X, Lei W, Lu W-Z (2009) Ceram Int 35:2131–2134
8. Lei W, Lu WZ, Wang XH, Liang F, Wang J (2011) J Am Ceram
Soc 94:20–23
9. Huang C-L, Yang T-J, Huang C–C (2009) J Am Ceram Soc
92:119–124
10. Tsunooka T, Androu M, Higashida Y, Sugiura H, Ohsato H
(2003) J Eur Ceram Soc 23:2573–2578
11. Kim JC, Kim MH, Lim JB, Nahm S, Paik JH, Kim JH (2007) J
Am Ceram Soc 90:641–644
12. Chen YB, Huang CL, Tasi ST (2008) Mater Lett 62:2454–2457
13. Shin HK, Shin H, Bae ST, Lee S, Hong KS (2007) J Am Ceram
Soc 9:132–138
14. Shannon RD, Rossman GR (1991) J Phys Chem Solids
52:1055–1059
15. Narang SB, Bahel S (2010) J Ceram Process Res 11:316–321
16. Surendran KP, Santha N, Mohanan P, Sebastian MT (2004) Eur
Phys J B 41:301–306
17. Surendran K, Bijumon P, Mohanan P, Sebastian M (2005) Appl
Phys A 81:823–826
18. Zheng CW, Wu SY, Chen XM, Song KX (2007) J Am Ceram Soc
90:1483–1486
19. Iqbal MJ, Ismail B, Rentenberger C, Ipser H (2011) Mater Res
Bull 46:2271–2277
20. Barros BS, Melo PS, Kiminami RHGA, Costa ACFM, Sa GF,
Alves S Jr (2006) J Mater Sci 41:4744–4748
21. Abdullah H, Zulfakar MS, Wan Jalal WN, Islam MT, Shaari S
(2013) Synthesis and fabrication of (1-x)ZnAl2O4–xSiO2 thin
films to be applied as patch antennas. J Sol-Gel Sci Technol.
doi:10.1007/s10971-013-3202-7
22. Martins RF, Serra OA (2010) J Braz Chem Soc 21:1395–1398
23. Chandradass J, Kim KH (2010) J Ceram Process Res 11:96–99
24. Su X, Du X, Li S, Li J (2010) J Nanopart Res 12:1813–1819
25. Huang C-L, Tasi C-F, Chen Y-B, Cheng Y-C (2008) J Alloy
Compd 453:337–340
26. Park J-H, Nahm S, Park J-G (2012) J Alloy Compd 537:221–226
27. Lei W, Lu W-Z, Liu D, Zhu J-H (2009) J Am Ceram Soc
92:105–109
28. Da Silva AA, de Souza Goncalves A, Davolos MR (2009) J Sol–
Gel Sci Technol 49:101–105
29. Charinpanitkul T, Poommarin P, Wongkaew A, Kim K-S (2009)
J Ind Eng Chem 15:163–166
30. Visinescu D, Paraschiv C, Ianculescu A, Jurca B, Vasile B, Carp
O (2010) Dyes Pigm 87:125–131
31. de Souza LKC, Zamian JR, da Rooha Filho GN, Soledade LEB,
dos Santos IMG, Souza AG, Scheller T, Angelica RS, da Costa
CEF (2009) Dyes Pigm 81:187–192
32. Zawadzki M, Staszak W, Lopez Suarez FE, Illan Gomez MJ,
Bueno Lopez A (2009) Appl Catal A Gen 371:92–98
33. Ziołkowski J, Maltha AM, Kist H, Grootendorst EJ, de Groot
HJM, Ponec V (1996) J Catal 160:148–154
34. Muller-Buschbaum H (2003) J Alloy Compd 349:49–104
J Sol-Gel Sci Technol (2014) 69:429–440 439
123

35. Zhang H, Fang L, Elsebrock R, Yuan RZ (2005) Mater Chem
Phys 93:450–454
36. Chen YC (2011) IEEE Trans Ultrason Ferroelectr Freq Control
58:2531–2538
37. Huang Y, Li D, Feng J, Li G, Zhang Q (2010) J Sol–Gel Sci
Technol 54:276–281
38. Suwanboon S, Amornpitoksuk P, Sukolrat A (2011) Ceram Int
37:1359–1365
39. All SAE, Fawzy YHA, Radwan RM (2007) J Phys D Appl Phys
40:5707
40. Kim JS, Kim JS, Park HL (2004) Solid State Commun
131:735–738
41. Beier MJ, Hansen TW, Grunwaldt JD (2009) J Catal
266:320–330
42. Koops CG (1951) Phys Rev 83:121–124
43. Wagner KW (1913) Ann Phys 345:817–855
44. Ho I-C, Xu Y, Mackenzie JD (1997) J Sol–Gel Sci Technol
9:295–301
45. Kingery W, Bowen H, Uhlmann D (1976) Introduction to
ceramics. Willey, New York
46. Balanis CA (2005) Antenna theory analysis and design, 3rd edn.
Wiley, Hoboken
47. Sotoudeh H–H, Joseph C, Sooseok O, Ju-Ung J, Noh-Joon P,
Dae-Hee P (2009) J Electr Eng Technol 4:282–286
440 J Sol-Gel Sci Technol (2014) 69:429–440
123


![Magneto-DielectricSubstratesinAntenna Miniaturization: … · 2018-09-30 · arXiv:physics/0603116v1 [physics.class-ph] 15 Mar 2006 Magneto-DielectricSubstratesinAntenna Miniaturization:](https://static.fdocuments.us/doc/165x107/5e966d432d89866f0d4e39f6/magneto-dielectricsubstratesinantenna-miniaturization-2018-09-30-arxivphysics0603116v1.jpg)