minerals - eps.berkeley.edu
35
minerals Article Preferred Orientation of Quartz in Metamorphic Rocks from the Bergell Alps Hans-Rudolf Wenk 1, * , Rong Yu 1,2 , Sven Vogel 3 and Roman Vasin 4 1 Department of Earth and Planetary Science, University of California, Berkeley, CA 94720, USA; [email protected] 2 School of Urban Planning and Municipal Engineering, Xi’an Polytechnic University, Xi’an 710048, China 3 Material Science & Technology Division, Los Alamos National Laboratory, Los Alamos, NM 87545, USA; [email protected] 4 Joint Institute for Nuclear Research, 141980 Dubna, Russia; [email protected] * Correspondence: [email protected] Received: 7 March 2019; Accepted: 1 May 2019; Published: 5 May 2019 Abstract: Crystal preferred orientation of 47 samples of quartzite and eight samples of associated marbles from the Bergell Alps have been analyzed with time-of-flight neutron diffraction and EBSD. The results show a clear distinction of texture types for quartzites transformed from Triassic sandstones and quartz layers in gneiss. Textures of Triassic quartzites areoverall weak and display a maximum of c-axes perpendicular to the foliation or a crossed girdle perpendicular to the lineation. Pole figures for positive rhombs {10 11} show a maximum perpendicular to the foliation and negative rhombs {01 11} generally display a minimum. Based on polycrystal plasticity models this texture type can be attributed to a combination of basal and rhombohedral slip. Asymmetry of the distributions is attributed to simple shear and local strain heterogeneities. The relatively weak texture is partially caused by muscovite limiting dislocation motion and grain growth, as well as adjacent layers of marble that accommodate significant strain. Most quartz layers in gneiss, including mylonites, display a texture with a-axes parallel to the lineation and a c-axis maximum in the intermediate fabric direction. This texture type can be attributed to dominant prismatic slip. Many samples are recrystallized and recrystallization appears to strengthen the deformation texture. The study shows good agreement of neutron diffraction and EBSD. Neutron diffraction data average over larger volumes and maximum pole densities are generally lower and more representative for the bulk material. With EBSD the microstructure and mechanical twinning can be quantified. Keywords: quartzite; preferred crystal orientation/texture; neutron diffraction; EBSD; Central Alps 1. Introduction Preferred orientation in quartzites has been of interest for a long time, beginning with the first fabric diagram by Schmidt (1925) [1] and extensive reviews by Sander (1950) [2]. Quartz is one of the dominant minerals in metamorphic rocks of the Earth’s crust, and fabric patterns have been used to understand tectonic deformation in many regions such as Saxony granulites [3–6], Moine thrust mylonites [7–9], mylonites in Central Australia [10], quartzites in Alpine nappes [11–14], and recently, the Himalayan belt [15–18]. These investigations documented a wide range of quartz fabric types with variations attributed to metamorphic grade, deformation mechanisms, and the strain history. Early studies relied on optical measurements of quartz c-axes with a Universal stage and a petrographic microscope. For trigonal quartz optical methods can only be used to determine c-axes. In 1967, X-ray pole figure measurements were applied to quartz, opening the possibility to obtain crystal orientations for other lattice directions than c-axes [19]. This was used to quantify the Minerals 2019, 9, 277; doi:10.3390/min9050277 www.mdpi.com/journal/minerals
Transcript of minerals - eps.berkeley.edu

minerals
Article
Preferred Orientation of Quartz in MetamorphicRocks from the Bergell Alps
Hans-Rudolf Wenk 1 Rong Yu 12 Sven Vogel 3 and Roman Vasin 4
1 Department of Earth and Planetary Science University of California Berkeley CA 94720 USAyurongberkeleyedu
2 School of Urban Planning and Municipal Engineering Xirsquoan Polytechnic University Xirsquoan 710048 China3 Material Science amp Technology Division Los Alamos National Laboratory Los Alamos NM 87545 USA
svenlanlgov4 Joint Institute for Nuclear Research 141980 Dubna Russia olddragonmailru Correspondence wenkberkeleyedu
Received 7 March 2019 Accepted 1 May 2019 Published 5 May 2019
Abstract Crystal preferred orientation of 47 samples of quartzite and eight samples of associatedmarbles from the Bergell Alps have been analyzed with time-of-flight neutron diffraction and EBSDThe results show a clear distinction of texture types for quartzites transformed from Triassic sandstonesand quartz layers in gneiss Textures of Triassic quartzites are overall weak and display a maximumof c-axes perpendicular to the foliation or a crossed girdle perpendicular to the lineation Pole figuresfor positive rhombs 1011 show a maximum perpendicular to the foliation and negative rhombs0111 generally display a minimum Based on polycrystal plasticity models this texture type canbe attributed to a combination of basal and rhombohedral slip Asymmetry of the distributions isattributed to simple shear and local strain heterogeneities The relatively weak texture is partiallycaused by muscovite limiting dislocation motion and grain growth as well as adjacent layers of marblethat accommodate significant strain Most quartz layers in gneiss including mylonites display atexture with a-axes parallel to the lineation and a c-axis maximum in the intermediate fabric directionThis texture type can be attributed to dominant prismatic slip Many samples are recrystallized andrecrystallization appears to strengthen the deformation texture The study shows good agreement ofneutron diffraction and EBSD Neutron diffraction data average over larger volumes and maximumpole densities are generally lower and more representative for the bulk material With EBSD themicrostructure and mechanical twinning can be quantified
Keywords quartzite preferred crystal orientationtexture neutron diffraction EBSD Central Alps
1 Introduction
Preferred orientation in quartzites has been of interest for a long time beginning with the firstfabric diagram by Schmidt (1925) [1] and extensive reviews by Sander (1950) [2] Quartz is one ofthe dominant minerals in metamorphic rocks of the Earthrsquos crust and fabric patterns have been usedto understand tectonic deformation in many regions such as Saxony granulites [3ndash6] Moine thrustmylonites [7ndash9] mylonites in Central Australia [10] quartzites in Alpine nappes [11ndash14] and recentlythe Himalayan belt [15ndash18] These investigations documented a wide range of quartz fabric types withvariations attributed to metamorphic grade deformation mechanisms and the strain history
Early studies relied on optical measurements of quartz c-axes with a Universal stage and apetrographic microscope For trigonal quartz optical methods can only be used to determine c-axesIn 1967 X-ray pole figure measurements were applied to quartz opening the possibility to obtaincrystal orientations for other lattice directions than c-axes [19] This was used to quantify the
Minerals 2019 9 277 doi103390min9050277 wwwmdpicomjournalminerals
Minerals 2019 9 277 2 of 35
development of mechanical twins in flint deformed in axial compression [20] From a set of polefigures the full orientation distribution function (ODF) for trigonal quartz was obtained with theharmonic method [2122] With advances in electron backscatter diffraction (EBSD) in scanning electronmicroscopes quartz crystal orientations could be determined in small volumes and representedas two-dimensional maps [23] similar to the ldquoAchsenverteilungsanalyserdquo (AVA) of Sander [2] butincluding full crystal orientations An early application to quartz is the study of Kunze et al [24]Another comparably novel toolmdashneutron diffractionmdashbecame available to determine full orientationdistributions on large samples with much better grain statistics than optical measurements or EBSD [25]
The new measurement techniques rely on sophisticated data analysis which was first developedfor cubic metals It became apparent that the harmonic method mentioned above and introducedby Bunge [26] and Roe [27] had limitations because of the omission of odd coefficients in ODFcalculations [28] and new methods were developed such as WIMV [29] ADC [30] and the maximumentropy method [3132] Generalizing analytical methods to include lower than cubic crystal symmetriesintroduces some complications
While many deformation experiments on single crystals to determine deformation mechanismshave been performed on minerals such as calcite dolomite and olivine there is much less informationon quartz [3334] The study of Baeta and Ashbee (1970) [35] is still a landmark Slip systems havebeen identified by TEM observations of dislocations in deformed quartzites or inferred from texturepatterns by comparison with polycrystal plasticity models
Before going into details let us clarify a few terms used in this paper To describe the anisotropicpattern of crystals in deformed rocks drsquoOmalius drsquoHalloy [36] introduced the term ldquotexturerdquo in his1833 textbook Later this was applied more generally to what is known as microstructure Schmidt [1]and Sander [2] introduced the term ldquofabricrdquo (Gefuumlge) which is widely used in structural geology todescribe preferred orientation In materials science ldquotexturerdquo has become synonymous with crystalpreferred orientation (or CPO) and we use all three expressions in this paper since materials scienceand geology have become closely connected
Here we study bulk textures in 47 samples of quartzites from different geologic environments ofthe Bergell region in the Swiss Alps As will become apparent texture patterns are more complex thananticipated yet some significant trends were observed Most studies of preferred orientation in quartzhave focused on a few selected samples In order to address the regional significance and extent of localvariations of quartz textures it was important to investigate many samples With such an approach itwas possible to unravel features that were in many ways unexpected Therefore we present not onlya large number of samples but also for each sample several pole figures not just c-axes and a-axesof quartz
The microstructure of samples was first studied by optical microscopy Preferred orientation wasmeasured with neutron diffraction over many years Selected samples were also investigated withEBSD to explore the role of mechanical Dauphineacute twinning from orientation maps In the discussionwe will try to model observed texture patterns with polycrystal plasticity theory and considerations ofdynamic recrystallization under stress An important factor that was emerging is the significance ofrhombohedral orientations which cannot be inferred from simple c-axis pole figures
2 Samples
The samples were collected in the Bergell Alps (Southern Switzerland and Northern Italy) which isa region of the southeastern Alps extending from the Lake of Como (SW) to the Engadine (NE) Figure 1shows the tectonic units with a sequence of Pennine nappes (Adula Tambo Suretta Avers and Platta)overlain by lower Austrolapine nappes (Margna and Bernina) in the East [37ndash39] These nappes displaya crystalline basement covered by metasedimentary layers Most pronounced are Triassic quartzitesand marbles transformed from sandstones and limestones Into this stack of nappes there was anintrusion of Bergell granite in the South in the Tertiary (~30 My) causing considerable temperaturegradients with metamorphic grade ranging from granulite to greenschist facies
Minerals 2019 9 277 3 of 35
3 of 3
considerable temperature gradients with metamorphic grade ranging from granulite to greenschist facies
Figure 1 Tectonic map of the Bergell Alps based on Montrasio et al [39] Dotted zones are Triassic metasediments where quartzites and marbles were collected Sample locations are indicated If only numbers are given they refer to Brg (Table 1) EL Engadine Line ML Muretto Line TMZ Turba Mylonite Zone FL Forcola Line The coordinate system used in Swiss topographic maps is indicated In the insert an overview is shown with countries (CH Switzerland I Italy A Austria)
Figure 2 Four typical hand specimens of Triassic quartzites They display an excellent foliation and the lineation on the schistosity plane Scale is indicated In samples Brg734 and Brg1241 there is a cylindrical hole from which the neutron diffraction samples were obtained
In conjunction with a tectonic study of this area [40] and an exploration of the metamorphic history [41] samples of quartzite and some associated marbles were collected Of these 39 quartzites eight marbles are displayed and discussed in some detail in the main text Information approximately
Figure 1 Tectonic map of the Bergell Alps based on Montrasio et al [39] Dotted zones are Triassicmetasediments where quartzites and marbles were collected Sample locations are indicated If onlynumbers are given they refer to Brg (Table 1) EL Engadine Line ML Muretto Line TMZ TurbaMylonite Zone FL Forcola Line The coordinate system used in Swiss topographic maps is indicatedIn the insert an overview is shown with countries (CH Switzerland I Italy A Austria)
3 of 3
considerable temperature gradients with metamorphic grade ranging from granulite to greenschist facies
Figure 1 Tectonic map of the Bergell Alps based on Montrasio et al [39] Dotted zones are Triassic metasediments where quartzites and marbles were collected Sample locations are indicated If only numbers are given they refer to Brg (Table 1) EL Engadine Line ML Muretto Line TMZ Turba Mylonite Zone FL Forcola Line The coordinate system used in Swiss topographic maps is indicated In the insert an overview is shown with countries (CH Switzerland I Italy A Austria)
Figure 2 Four typical hand specimens of Triassic quartzites They display an excellent foliation and the lineation on the schistosity plane Scale is indicated In samples Brg734 and Brg1241 there is a cylindrical hole from which the neutron diffraction samples were obtained
In conjunction with a tectonic study of this area [40] and an exploration of the metamorphic history [41] samples of quartzite and some associated marbles were collected Of these 39 quartzites eight marbles are displayed and discussed in some detail in the main text Information approximately
Figure 2 Four typical hand specimens of Triassic quartzites They display an excellent foliation andthe lineation on the schistosity plane Scale is indicated In samples Brg734 and Brg1241 there is acylindrical hole from which the neutron diffraction samples were obtained
In conjunction with a tectonic study of this area [40] and an exploration of the metamorphichistory [41] samples of quartzite and some associated marbles were collected Of these 39 quartziteseight marbles are displayed and discussed in some detail in the main text Information about anothereight quartzite samples is provided in Supplementary Material Quartzite samples can be dividedinto Triassic quartzites (referred to as ldquoTrdquo) transforming during the Tertiary Alpine metamorphismfrom sandstones and quartz layers in crystalline basement (ldquoLrdquo) Sample localities are shown in thetectonic map (Figure 1) and are listed in Table 1 with Swiss coordinates (130ndash150 km SN and 755ndash775km WE) In Table 1 samples in each group are sorted according to sample numbers (first Brg then Sci)This same order will be used for microstructures and pole figures Some hand specimens of Triassicquartzites are shown in Figure 2 They display an excellent foliation and a well-developed lineationwith strong alignment of muscovite platelets Foliation and lineation were used to define a samplecoordinate system to represent crystal preferred orientation
Minerals 2019 9 277 4 of 35
Table 1 List of samples with location Swiss coordinates (in km) and (0001) pole figure maxima(in multiples of a random distribution) as well as texture index J for neutron and EBSD textures The xafter sample number indicates that optical microstructure is displayed in Figures 3 and 4 D indicatesDubna data + in the electron backscatter diffraction (EBSD) column indicates that map is displayed inFigure 11 and that comparison of neutron and EBSD pole figures is shown in Figure 12 Additionalsamples are listed in Table S1
Sample Place CoordNeutron EBSD
0001 J 0001 J
A 24 Triassic quartzites
Brg 568 x Alpascela 77011415 124 55 155 + 103Brg 641 x Val Duana 76331396 24 12 66 + 40Brg 730 Roticcio 769013685 42 18Brg 734 Alpascela 77011411 85 36Brg 752 Bergalga 7629513925 27 14Brg 753 Bergalga 7629513925 20 12
Brg 858 x Cam 7663513755 54 18Brg 980 x Casaccia 77181397 54 20 90 82Brg 981 x Casaccia 77181396 71 32 93 + 53Brg 1102 Casaccia 771813965 69 32Brg 1126 Avers Croet 75731494 36 21 75 + 52
Brg 1127 x Campsut 75611515 34 19 50 + 41Brg 1135 Septimer 76761427 23 12 52 35Brg 1137 Val Turba 76811426 39 19 71 + 42
Brg 1139 x Septimer 76851427 37 19Brg 1235 x Lago di Lei 75591555 51 18Brg 1241 Val Turba 76811431 88 44
Brg 1245 x Plan Vaest 762113515 40 22Brg 1247 Plan Vaest 76211351 29 15Brg 1477 Bugna 760913545 29 10 36 + 19
Brg 1618D x Cavi 76011357 23 15 66 + 32Brg 1643D Duana 764351392 64 27 113 + 55Sci 690 x Innerferrera 75601521 58 27 84 + 51Sci 881 x Pso Turbine 75701360 39 18 39 + 64
B 15 Quartz layers
Brg 407 Tegiola 76251301 211 + 145Brg 412 x Tegiola 762613005 129 45Brg 420 x Caccior 76341349 150 98Brg 603 x Tegiola 762213025 169 119 196 + 221Brg 646 x Tombal 76231353 75 46Brg 767 Caccior 76341351 61 25
Brg 1165 Lavinair Crusc 7725513825 22 12Brg 1167 Lavinair Crusc 7718513825 49 17 93 66
Brg 1520 x Blaunca 77451428 124 53 213 + 221Brg 1524 x Plan di Zoch 773751427 88 44 118 + 85Brg 1527 Orden 77361405 94 60Sci 292 x Tegiola 76341303 292 184 364 269Sci 490 x Albigna 77051363 47 22Sci 514 x V Largh 77121367 43 17Sci 763 Lera drsquoSura 76261320 263 115 517 + 741
C 8 Marbles (do is dolomite)
Brg860 Pass dal Cam 766313755 21 11Brg1101 Casaccia (do) 77171400 16 11Brg1120 Juf 764371463 34 13Brg1143 Alpascela 76971414 22 12Brg1164 Lavinair Crusc 772551382 22 12Brg1166 Lavinair Crusc 771851382 37 17Brg1243 Val Turba 76831428 21 12Brg1244 Val Turba 76831428 31 14
Minerals 2019 9 277 5 of 35
While hand specimens look rather similar there is a wide range of microstructures as illustratedin micrographs of thin sections (Figure 3 for some of the Triassic quartzites and Figure 4 for quartzlayers see also Figures S1 and S2 for a more complete survey) The thin sections were obtained bycutting slabs perpendicular to the foliation and parallel to the lineation The microstructure images areobtained with crossed polarizers and by inserting a ldquogypsum platerdquo to document for many samplesa wide range of crystal orientations (different colors) Figures S1 and S2 show microstructures of allsamples without gypsum plate and simply crossed polars
6 of 6
Figure 3 Optical images of thin sections from selected Triassic quartzites Crossed polarizers gypsum plate inserted to highlight orientation differences Scale indicated at top right For more images with crossed polarizers only see Supplementary Material Figure S1 Order of samples is the same as in Table 1
Figure 3 Optical images of thin sections from selected Triassic quartzites Crossed polarizers gypsumplate inserted to highlight orientation differences Scale indicated at top right For more images withcrossed polarizers only see Supplementary Material Figure S1 Order of samples is the same as inTable 1
Minerals 2019 9 277 6 of 35
Grain size varies from 005 to 1 mm for Triassic quartzites (Figure 3) and 005 to 4 mm for quartzlayers (Figure 4) Grain shapes range from equiaxed (eg Brg980 and Brg1524) to highly flattenedfor mylonitic layers in the vicinity of the granite contact (eg Brg603 Sci490 and Sci514) and alsofor some Triassic quartzites (eg Brg858 Brg1245 and Brg1643) Only a few microstructural imagesdisplay uniform colors (eg Brg412 Brg420 Brg646 and Sci292) indicative of simple c-axis orientationpatterns while most show a wide range of colors suggesting more complex textures
Some higher magnification images without gypsum plate are shown in Figure 5 In many Triassicquartzites quartz contains deformation lamellae (eg Brg1127 and Brg1618) Muscovite plateletsare generally strongly aligned bordering quartz grains (Brg1137 and Brg1139) or quartz includingplatelets (Brg1241) In many samples there is evidence of grain growth during dynamic recrystallizationIn mylonitic quartzites we observe a fine-grained quartz matrix flowing plastically around more rigidfeldspar inclusions (eg Brg412 and Sci292)
The samples described here are available for researchers who want to follow up on our studies toobtain additional information 7 of 7
Figure 4 Optical images of thin sections from selected quartz layers Crossed polarizers gypsum plate inserted to highlight orientation differences Scale indicated at top right For more images with crossed polarizers only see Supplementary Material Figure S2 Order of samples is the same as in Table 1 The large clasts in Brg412 and Sci292 are feldspar
Figure 4 Optical images of thin sections from selected quartz layers Crossed polarizers gypsum plateinserted to highlight orientation differences Scale indicated at top right For more images with crossedpolarizers only see Supplementary Material Figure S2 Order of samples is the same as in Table 1The large clasts in Brg412 and Sci292 are feldspar
Minerals 2019 9 277 7 of 35
8 of 8
Figure 5 Optical images of selected samples at high magnification Crossed polarizers Scale indicated at top right Clasts in Brg412 and Sci292 are plagioclase colored phases are muscovite White arrows in Brg1127 and Brg1618 point to well visible deformation lamellae
3 Experimental Methods
31 Some Remarks on Coordinate Systems and Quartz Crystallography
Most ODF calculations relate a Cartesian right-handed sample coordinate system XYZ to a Cartesian right-handed crystal coordinate system XCYCZC with three rotations defined by Euler angles
In accordance with eg the review of Law (1990) [42] the sample coordinate system XYZ is defined by
Z ǁ pole to the folation s X ǁ lineation l Y ǁ Z x X Quartz in most tectonic environments has trigonal symmetry and is referred to as alpha quartz
The complication is that quartz can exist in a right-handed and left-handed form [4344] According to an extensive comparative study of a large number of quartz single crystals by Frondel [45] both enantiomorphic modifications are equally abundant in nature though local dominance of one enantiomorph may occur Enantiomorphs cannot be resolved with diffraction techniques unless an exeptional experimental setup is used [46] and have not been taken into account in quartz fabric studies Consequently we attributed all investigated quartz to the right-handed spacegroup P3121 (152) while the left-handed spacegroup is P3221(154)
Figure 5 Optical images of selected samples at high magnification Crossed polarizers Scale indicatedat top right Clasts in Brg412 and Sci292 are plagioclase colored phases are muscovite White arrows inBrg1127 and Brg1618 point to well visible deformation lamellae
3 Experimental Methods
31 Some Remarks on Coordinate Systems and Quartz Crystallography
Most ODF calculations relate a Cartesian right-handed sample coordinate system XYZ to aCartesian right-handed crystal coordinate system XCYCZC with three rotations defined by Euler angles
In accordance with eg the review of Law (1990) [42] the sample coordinate system XYZ isdefined by
Z pole to the folation s X lineation l Y Z x XQuartz in most tectonic environments has trigonal symmetry and is referred to as alpha quartz
The complication is that quartz can exist in a right-handed and left-handed form [4344] Accordingto an extensive comparative study of a large number of quartz single crystals by Frondel [45]both enantiomorphic modifications are equally abundant in nature though local dominance of oneenantiomorph may occur Enantiomorphs cannot be resolved with diffraction techniques unless anexeptional experimental setup is used [46] and have not been taken into account in quartz fabric studiesConsequently we attributed all investigated quartz to the right-handed spacegroup P3121 (152) whilethe left-handed spacegroup is P3221(154)
Minerals 2019 9 277 8 of 35
How do we define an orthogonal crystal coordinate system in trigonal quartz Here we followthe definition of Matthies et al [47] which defines the orthogonal crystal coordinate system XCYCZC
relative to trigonal lattice vectors A1 = a = [2110] A3 = c = [0001] asZC A3 YC A3 times A1 XC YC times ZC A1Note that in the literature different conventions are sometimes used for defining XC and YCAnother complication for the texture analysis is that for trigonal quartz pairs of rhombohedral
reflections such as 1011 and 0111 1012 and 0112 or 2021 and 0221 have the same lattice spacings andare completely overlapped in diffraction patterns These reflections are crucial for the determination ofthe trigonal quartz texture The pole figure deconvolution is based on different diffraction intensitiesdue to different structure factors of neutrons or electrons scattered from corresponding crystal latticeplanes [48]
All pole figures (ie Figures 7ndash10) are plotted as equal area projections on the schistosity plane XYwith the X axis NS (lineation l on top) This geometry is different from most studies of quartz preferredorientation It is chosen because it provides least distortion of (0001) pole figures and particularlyin the distinction of positive rhombs 1011 and negative rhombs 0111 relative to the normal tothe schistosity
Pole figures express pole densities in multiples of a uniform distribution (mrd) The texturestrength or sharpness of the ODF of the polycrystalline aggregate can be described with the textureindex J = f2 as defined by Matthies et al 1988 (their Equation (38)) [47]
J = f2equiv
intG
f2(g)dg8π2
integrating squared ODF values f2(g) over the orientation space G
32 Neutron Diffraction
Crystallographic preferred orientation was measured by time-of-flight neutron diffractionSince neutrons have relatively low attenuation by most elements (or isotopes to be more accurate)large samples can be analyzed providing excellent grain statistics compared to more conventionalmethods such as optical measurements with a universal stage petrographic microscope electronbackscatter diffraction (EBSD) with a scanning electron microscope or classical X-ray diffraction with apole figure goniometer Some general aspects of neutron texture measurements will be discussed inSection 58
Most samples were measured with the HIPPO (High Pressure Preferred Orientation) neutrontime-of-flight (TOF) diffractometer at the accelerator-based neutron facility LANSCE Los AlamosNational Laboratory [49] The unique features of HIPPO are high neutron flux (owing to its comparablyshort moderator-to-sample distance of 88 m) and a large array of detectors arranged in several ringsaround the neutron beam direction Cylindrical samples 1 cm in diameter and 1 cm long weremounted on a rod and entered in a sample changer (Figure 6c) A collimated beam of thermal neutrons(wavelengths ~02ndash6 Aring) 1 cm in diameter enters the HIPPO diffractometer and diffraction occurs onthe sample The signal is recorded as TOF spectra by 30 detector panels consisting of 3He detectortubes on 2θ = 40 (19ndash30) 90 (9ndash18) and 150 (1ndash8) banks Figure 6a shows the pole figure coverageby projecting the 30 detectors on a pole figure with the sample cylinder axis in the center It illustratesthat the angular coverage varies considerably between the detector panels (5ndash20) The pole figurecoverage is improved by rotating the sample in four increments about the vertical axis (0 45 675and 90) resulting in 4 times 30 = 120 spectra (Figure 6b) TOF diffraction spectra were recorded for apreset beam monitor count resulting in approximately 40 min Note that in the 15-year period overwhich these samples were measured some details of detectors and coverage scheme have changedThis has been taken into account in data processing and is therefore not described in detail
Minerals 2019 9 277 9 of 35
Figure 6d illustrates a sum of neutron diffraction spectra collected by the 2θ = 90 and 40 detectorsfor Brg981 quartzite Some diffraction peaks are indexed The high angle detector (top) has a muchbetter resolution than the low angle detector (bottom) but the low-angle detector has a much better polefigure coverage and counting statistics (Figure 6a) Figure 6e displays a stack of individual spectra forthe 40 detector bank (bottom are measured spectra) with variations in azimuth expressed from bottomto top Intensity variations as a function of azimuth are indicative of crystal preferred orientation
10 of 10
spectra for the 40deg detector bank (bottom are measured spectra) with variations in azimuth expressed from bottom to top Intensity variations as a function of azimuth are indicative of crystal preferred orientation
Figure 6 Neutron diffraction texture measurements with HIPPO (a) shows the pole figure coverage using 3 detector banks (40deg 90deg and 150deg) The approximate area covered by a single detector is shown on the pole figure in equal area projection (b) Coverage with 4 sample rotations around the vertical axis (0deg 45deg 675deg and 90deg) (c) View of a cylindrical quartzite sample The diameter of the cylinder is 1 cm (d) Diffraction spectrum for the 40deg and 90deg detector banks (dots) and the corresponding Rietveld fit (line) Some diffraction peaks of quartz are indexed (e) Stack of diffraction spectra for one rotation for the 40deg detector Bottom are the experimental data and top is the Rietveld fit Intensity variations correspond to crystal preferred orientation
Samples Brg1618 and Brg1643 were measured on the TOF neutron diffractometer SKAT at beamline 7A2 of the IBR-2 pulsed reactor at the Joint Institute for Nuclear Research (JINR) Dubna Russia [5051] SKAT is characterized by a large beam cross section allowing measurements of samples of ~100 cm3 volume and both samples were spheres of 5 cm diameter resulting in excellent grain statistics The standard setup of the diffractometer including 19 3He detectors with 45rsquo Soller collimators at the same scattering angle 2θ = 90deg has been used The combined thermal and cold moderator for the beamline 7A2 was in operation and this improved neutron counts During measurements samples were rotated in 15deg increments and 24 sample positions were measured to obtain complete experimental pole figures resulting in 24 times 19 = 456 neutron diffraction spectra Measurement time at each sample position was 15 h (36 h total)
Figure 6 Neutron diffraction texture measurements with HIPPO (a) shows the pole figure coverageusing 3 detector banks (40 90 and 150) The approximate area covered by a single detector is shownon the pole figure in equal area projection (b) Coverage with 4 sample rotations around the verticalaxis (0 45 675 and 90) (c) View of a cylindrical quartzite sample The diameter of the cylinder is1 cm (d) Diffraction spectrum for the 40 and 90 detector banks (dots) and the corresponding Rietveldfit (line) Some diffraction peaks of quartz are indexed (e) Stack of diffraction spectra for one rotationfor the 40 detector Bottom are the experimental data and top is the Rietveld fit Intensity variationscorrespond to crystal preferred orientation
Samples Brg1618 and Brg1643 were measured on the TOF neutron diffractometer SKAT at beamline7A2 of the IBR-2 pulsed reactor at the Joint Institute for Nuclear Research (JINR) Dubna Russia [5051]SKAT is characterized by a large beam cross section allowing measurements of samples of ~100 cm3
volume and both samples were spheres of 5 cm diameter resulting in excellent grain statisticsThe standard setup of the diffractometer including 19 3He detectors with 45rsquo Soller collimators at thesame scattering angle 2θ = 90 has been used The combined thermal and cold moderator for thebeamline 7A2 was in operation and this improved neutron counts During measurements samples wererotated in 15 increments and 24 sample positions were measured to obtain complete experimentalpole figures resulting in 24 times 19 = 456 neutron diffraction spectra Measurement time at each sampleposition was 15 h (36 h total)
Minerals 2019 9 277 10 of 35
The 120 neutron TOF diffraction spectra from HIPPO and 456 spectra from SKAT were thenanalyzed with the Rietveld method as implemented in MAUD [52] and described in a tutorial for neutrontime-of-flight texture analysis [25] The refinements rely on the crystal structure of low quartz [53]In the Rietveld procedure instrumental parameters background crystallographic parameters coherentscattering domain sizes and rms microstrains phase fractions where applicable and texture arerefined in consecutive cycles The Rietveld analysis resolved an orientation distribution (OD) with 10
angular resolution in orientation space Figure 6e shows a stack of recorded 40 spectra (bottom) andthe Rietveld fit (top) The good agreement between experimental data and Rietveld fit gives confidencein the refinement The OD was exported from MAUD and further processed in BEARTEX [54] tosmooth (75 Gaussian filter) rotate the sample coordinate system if necessary and to calculate andplot pole figures used as a representation of texture In the case of the two samples measured with thehigher resolution SKAT spectrometer at Dubna lattice parameters were refined for Brg1618 they area = 491005(1) and c = 540041(1) and for Brg1643 a = 491089(1) and c = 540120(1) with standard errorof the last digit in parentheses
Pole figures for Triassic quartzites are shown in Figures 7andashc and S3 for layered quartz inFigure 8ab for muscovite in some samples in Figure 9 and for some adjacent Triassic marbles inFigure 10 Quantitative information about (0001) pole figure maxima and the texture index J aresummarized in Table 1 Note that to refine the texture of monoclinic muscovite the first monoclinicsetting with [001] as 2-fold axis has to be used [55] In this setting the cleavage plane is (100)In Figure 9 labels correspond to the second setting which is more common in mineralogy with (001) ascleavage plane
33 SEM-EBSD
Selected samples were also measured by backscatter electron diffraction (EBSD) with a scanningelectron microscope (SEM) particularly to explore the importance of mechanical Dauphineacute twinningEBSD data were collected at the Department of Earth and Planetary Science at the University ofCalifornia Berkeley using a Zeiss EVO MA10 SEM an EDAX Digiview IV high resolution detectorand TSL Orientation Imaging Microscopy (OIM) software Diffraction images were first reduced andanalyzed with OIM and then orientation data were exported and processed with the routine MAPTEXin BEARTEX [54] Samples were prepared using standard petrographic techniques with a final highpolish achieved with colloidal silica All EBSD samples were uncoated and SEM vacuum was set to10 Pascal variable pressure to reduce charging SEM beam voltages and current varied from 15 to25 kV and 2 to 3 nA respectively but for high resolution data on finely crystalline areas settings of15 kV and 2 nA were most appropriate The 2 times 2 binning with long exposure times of plusmn1 framesecproduced best results Pole figures were derived from large numbers of individual orientation datacollected across the sample (commonly 20000ndash150000 points per scan) For each point the full crystalorientation (decribed by Euler angles) was determined and these individual orientations were thenentered into a 5 times 5 times 5 orientation space in BEARTEX without relying on harmonic functionsData from 3 to 4 scans were combined and orientation distributions were then rotated to agree with theneutron diffraction pole figures
Some characteristic EBSD maps are shown in Figure 11 The third Euler angle (ϕ2 in Bungenotation) which for trigonal quartz is within the 0 to 120 interval is used for color identificationbecause it is sensitive to Dauphineacute twinning Dauphineacute twins are related to the host by a 180
(equivalent to 60 for trigonal quartz) around the c-axis (the c-axis orientation is defined by the firsttwo Euler angles ϕ1 and Φ) Dauphineacute twin boundaries are highlighted with yellow lines in themaps Some information about the scans is summarized in Table 2 (see also Supplementary MaterialTable S2)
Minerals 2019 9 277 11 of 35
12 of 12
Figure 7 Cont
Minerals 2019 9 277 12 of 35
13 of 13
Figure 7 Cont
Minerals 2019 9 277 13 of 35
14 of 14
Figure 7 Neutron pole figures for quartz of Triassic quartzites Equal area projection on the schistosity plane Lineation is l Numbers on top right of pole figures indicate which pole density scale was used (in mrd) The scale in the second column was also applied to Columns 2ndash5 The order of samples is the same as in Table 1 24 Triassic quartzites are divided on three figures (a) (b) (c)
Figure 7 Neutron pole figures for quartz of Triassic quartzites Equal area projection on the schistosityplane Lineation is l Numbers on top right of pole figures indicate which pole density scale was used(in mrd) The scale in the second column was also applied to Columns 2ndash5 The order of samples is thesame as in Table 1 24 Triassic quartzites are divided on three figures (a) (b) (c)
Minerals 2019 9 277 14 of 35
15 of 15
Figure 8 Cont
Minerals 2019 9 277 15 of 3516 of 16
Figure 8 Neutron pole figures for quartz layers Equal area projection on the schistosity plane Lineation is l Numbers on top right of pole figures indicate which pole density scale was used (in mrd) The scale in the second column was also applied to Columns 2ndash5 The order of samples is the same as in Table 1 The 14 samples are divided into two figures (a) and (b)
Figure 8 Neutron pole figures for quartz layers Equal area projection on the schistosity planeLineation is l Numbers on top right of pole figures indicate which pole density scale was used (in mrd)The scale in the second column was also applied to Columns 2ndash5 The order of samples is the same asin Table 1 The 14 samples are divided into two figures (a) and (b)
Minerals 2019 9 277 16 of 35
17 of 17
Figure 9 Neutron pole figures 001 and 010 of muscovite in Triassic quartzites Equal area projection on the schistosity plane Lineation is l Numbers on top left of pole figures indicate the pole density scale that was used (in mrd) Next to the sample numbers are volume and maximum of the 001 texture peak D after sample number indicates Dubna neutron data
Figure 10 Neutron pole figures 0001 of calcite and dolomite in Triassic marbles Equal area projection on the schistosity plane Lineation is l All samples are calcite except Brg1101 which is dolomite
Figure 9 Neutron pole figures 001 and 010 of muscovite in Triassic quartzites Equal area projection onthe schistosity plane Lineation is l Numbers on top left of pole figures indicate the pole density scalethat was used (in mrd) Next to the sample numbers are volume and maximum of the 001 texturepeak D after sample number indicates Dubna neutron data
17 of 17
Figure 9 Neutron pole figures 001 and 010 of muscovite in Triassic quartzites Equal area projection on the schistosity plane Lineation is l Numbers on top left of pole figures indicate the pole density scale that was used (in mrd) Next to the sample numbers are volume and maximum of the 001 texture peak D after sample number indicates Dubna neutron data
Figure 10 Neutron pole figures 0001 of calcite and dolomite in Triassic marbles Equal area projection on the schistosity plane Lineation is l All samples are calcite except Brg1101 which is dolomite
Figure 10 Neutron pole figures 0001 of calcite and dolomite in Triassic marbles Equal area projectionon the schistosity plane Lineation is l All samples are calcite except Brg1101 which is dolomite
Table 2 EBSD twin boundary statistics See also Table S2 The data in the table are obtained from thesum over individual scans Selected data and twin boundaries are in pixels
Sample Area (mm2) Selected Data (K) Twin Boundaries (K) Inverse Ratio 10minus2
A Triassic Quartzites
Brg568 2 586 16 26Brg641 3 844 7 08Brg980 4 629 10 16Brg981 3 730 14 20Brg1126 2 1540 24 16Brg1127 2 1116 11 10Brg1135 3 597 17 28Brg1137 2 407 22 54Brg1477 3 614 9 15
Minerals 2019 9 277 17 of 35
Table 2 Cont
Sample Area (mm2) Selected Data (K) Twin Boundaries (K) Inverse Ratio 10minus2
A Triassic Quartzites
Brg1618 5 1257 31 24Brg1643 4 2628 20 08Sci638 5 756 30 39Sci690 3 583 8 14Sci881 4 1113 37 33
B Quartz Layers
Brg407 1 670 7 10Brg603 2 560 10 19Brg1167 4 1383 16 11Brg1520 3 729 3 04Brg1524 2 818 10 12Sci292 13 550 2 03Sci763 3 827 7 08
C Comparison (see paragraph 57 below)
Br-undef-B 4 331 5 14Br-300-A 4 730 17 24
Br3-A-500MPa 1 114 2 17 19 of 19
Figure 11 Selected EBSD maps with Dauphineacute twin boundaries (yellow) Colors shown on top right are based on Euler angle φ2 that is sensitive to twinning T is for Triassic quartzites and L is for quartz layers White are regions that could not be indexed and correspond mainly to muscovite Scale bars are 100 microm
4 Results
The most simple patterns are pole figures for muscovite in Triassic quartzites with a strong (001) maximum perpendicular to the foliation (265 mrd for Brg1247 and 249 mrd for Brg1477) and a more or less random distribution of (010) poles in the foliation plane for most samples (Figure 9) An exception is Brg1135 with a very weak texture (15 mrd) and also a small volume fraction of muscovite (5)
The pole figures patterns for quartz have been divided into two groups Triassic quartzites (Figure 7andashc) and quartz layers in crystalline basement (Figure 8ab) As will become apparent in the discussion below the large number of samples from a wide area is necessary to assess overall texture patterns and local variations
Figure 11 Selected EBSD maps with Dauphineacute twin boundaries (yellow) Colors shown on top rightare based on Euler angle ϕ2 that is sensitive to twinning T is for Triassic quartzites and L is for quartzlayers White are regions that could not be indexed and correspond mainly to muscovite Scale bars are100 microm
Minerals 2019 9 277 18 of 35
4 Results
The most simple patterns are pole figures for muscovite in Triassic quartzites with a strong (001)maximum perpendicular to the foliation (265 mrd for Brg1247 and 249 mrd for Brg1477) and a more orless random distribution of (010) poles in the foliation plane for most samples (Figure 9) An exceptionis Brg1135 with a very weak texture (15 mrd) and also a small volume fraction of muscovite (5)
The pole figures patterns for quartz have been divided into two groups Triassic quartzites(Figure 7andashc) and quartz layers in crystalline basement (Figure 8ab) As will become apparent in thediscussion below the large number of samples from a wide area is necessary to assess overall texturepatterns and local variations
For Triassic quartzites there is generally a concentration of c-axes at high angles to the foliation Z(center of the pole figure) in a few samples as a single maximum often slightly asymmetric (eg Brg568Brg734 Brg858 Brg1137 Brg1235 and Sci690) In many samples the distribution is more complex witha ZY-girdle developing around the pole to the foliation Z (eg Brg730 Brg1126 Brg1127 and Brg1139)in some cases with a well-defined double maximum (Brg641 Brg753 Brg980 Brg1245 Brg1618 andSci881) In order to better visualize these distortions of the c-axis orientation patterns we chose thisunconventional representation projecting pole figures on the schistosity plane
There is generally a concentration of 1010 poles parallel to the lineation l = X such as Brg641Brg730 Brg858 Brg1126 and Brg1235 A very distinct pattern is observed in 1011 pole figures with amaximum perpendicular to the foliation (center of the pole figures) and two maxima in the foliationplane generally oblique to the lineation 0111 pole figures often have a minimum perpendicular tothe foliation Typical examples are Brg752 Brg753 Brg1139 Brg1245 Brg1477 Brg1618 and Sci881but most samples show a similar trend including samples only presented in Supplementary Material(Table S1 and Figure S3)
Maximum orientation densities vary greatly from sample to sample as summarized in Table 1The highest (0001) pole densities are observed for Brg568 (124 mrd J = 55) Brg734 (85 mrd J = 36)and Brg1241 (88 mrd J = 44) and relatively low ones for Brg753 (20 mrd) Brg1135 (23 mrd) andBrg1618 (23 mrd)
Pole figures from quartz layers are entirely different (Figure 8ab) Most have a strong (0001)maximum in the foliation plane at Y perpendicular to the macroscopic lineation X (eg Brg420 Brg603Brg646 Brg1167 Sci292 and Sci763) Often there is a slight girdle distribution perpendicularto the lineation (eg Brg646 Brg1165 and Brg1167) Pole densities for (0001) are very high(eg Brg603-169 mrd J = 119 Sci292-292 mrd J = 184 and Sci763-263 mrd J = 115) resembling asingle crystal even though these samples are very fine-grained (Figure 4) Correspondingly other polefigures also have single crystal like orientation patterns eg 1010 and 1120 pole figures have sixcharacteristic maxima in the XZ plane (three are plotted on pole figures and three are symmetricallydistributed in the lower hemisphere) There are exceptions such as Sci490 and Sci514 with large grainsize and close to the contact with the Tertiary Bergell granite Here textures are complex asymmetricand quite weak This will be discussed later Also in quartz layer textures there is a prevalence of 1011maxima perpendicular to the schistosity plane and corresponding 0111 minima (Brg412 Brg420Brg1520 and Brg1524)
EBSD analyses were performed on 21 samples and on each sample 3ndash4 areas were scanned(Tables 1 and 2 and Supplementary Material Table S2) Some selected scan maps are shown in Figure 11The different scans for each sample were combined for texture analysis The white regions on the mapsdisplay mainly muscovite that was not taken into account in the EBSD analysis The maps documentconsiderable variation in grain size in accordance with optical images (Figures 3 and 4) Some sampleshave high aspect ratios of the grain shape such as Brg407 Brg603 and Brg1520 but in most samplesgrains are fairly equiaxed On orientation maps Dauphineacute twin boundaries corresponding to a 60
(180) rotation around [0001] were identified with the subroutine MAPTEX in BEARTEX and thetwin boundaries are plotted as yellow lines on the maps Some scans display many twins (such asBrg1137 and Sci881) while other ones are almost free of twins (eg Brg641 Brg1643 Sci292 and Sci763)
Minerals 2019 9 277 19 of 35
The twin boundary frequency has been quantified by dividing the total length of twin boundaries bythe total scanned area This ldquotwin boundary densityrdquo in Table 2 shows a wide range from 49 times 10minus3
(most) to 03 times 10minus3 (least) Overall Triassic quartzites have more twin boundaries than quartz layersCrystal orientation patterns observed by EBSD were rotated to bring them into the same orientation
as pole figures measured by neutron diffraction Figure 12 compares some (0001) and 1011 polefigures obtained with the two methods (see also Supplementary Material Figures S4 and S5 for a morecomplete comparison) There is excellent agreement in texture patterns A comparison of texturemaxima in pole figures reveals that EBSD pole figures have slightly sharper textures than neutron polefigures (Table 1) We will elaborate on differences between the two methods in the discussion
21 of 21
neutron pole figures (Table 1) We will elaborate on differences between the two methods in the discussion
Adjacent to Triassic quartzites (transformed from sandstones) are calcite and dolomite marbles (transformed from Triassic limestones) Figure 10 shows some of the pole figures from marble samples Overall there is a (0001) maximum perpendicular to the foliation but this can be asymmetric (eg Brg860 and Brg1244) relative to the schistosity plane and lineation which can vary over small distances (eg Brg1164 and Brg1166 and Brg1243 and Brg1244) The strength of preferred orientation ranges from 18 mrd to 3 mrd for (0001) maxima (Table 1)
Figure 12 Comparison of selected EBSD and neutron pole figures 0001 and 1011 (for a complete display see Supplementary Material Figures S4 and S5) Equal area projection on the schistosity plane
Figure 12 Comparison of selected EBSD and neutron pole figures 0001 and 1011 (for a completedisplay see Supplementary Material Figures S4 and S5) Equal area projection on the schistosity planeLineation is l Numbers on top right of pole figures indicate which pole density scale was used (in mrd)
Minerals 2019 9 277 20 of 35
Adjacent to Triassic quartzites (transformed from sandstones) are calcite and dolomite marbles(transformed from Triassic limestones) Figure 10 shows some of the pole figures from marblesamples Overall there is a (0001) maximum perpendicular to the foliation but this can be asymmetric(eg Brg860 and Brg1244) relative to the schistosity plane and lineation which can vary over smalldistances (eg Brg1164 and Brg1166 and Brg1243 and Brg1244) The strength of preferred orientationranges from 18 mrd to 3 mrd for (0001) maxima (Table 1)
5 Discussion
51 Quartz Texture Types
The 47 quartzite samples collected over a large area in the Southern Alps display consistentpatterns of preferred orientation In metamorphic sandstones c-axes are oriented at high angles to thefoliation plane 1010 poles with a maximum parallel to the lineation and poles to r = 1011 witha concentration perpendicular to the foliation In quartz layers from the crystalline basement themost common pattern is c-axes in the foliation plane and perpendicular to the lineation Also here1010 poles have a maximum parallel to the lineation but there is more diversity especially in layersclose to the contact with the Bergell granite Given that these samples originate from an area coveringaround 400 km2 it was really surprising that texture patterns could be divided into two distinct groupsTriassic metasedimentary quartzites (Figure 7) and layers of quartz in schists and gneisses (Figure 8)both of comparable metamorphic grade and existing in close proximity
Looking at c-axes alone the patterns described in the literature (first by Sander 1950 [2]) can bedivided into four basic types in a sample coordinate system XYZ with X as lineation and Z normal tothe foliation Type A with a simple maximum sometimes asymmetric at Z (Figure 13A) Type B a ZYgirdle or crossed girdle (Figure 13B) Type C a small circle girdle around Z (Figure 13C) and Type D asimple maximum at Y (Figure 13D) Figure 13a uses the projection geometry applied in this paper andFigure 13b the more common projection geometry used in the literature As was mentioned earlierthe geometry in Figure 13a is optimal to display complexities in distributions for (0001) and 1011pole figures
22 of 22
Lineation is l Numbers on top right of pole figures indicate which pole density scale was used (in mrd)
5 Discussion
51 Quartz Texture Types
The 47 quartzite samples collected over a large area in the Southern Alps display consistent patterns of preferred orientation In metamorphic sandstones c-axes are oriented at high angles to the foliation plane 1010 poles with a maximum parallel to the lineation and poles to r = 1011 with a concentration perpendicular to the foliation In quartz layers from the crystalline basement the most common pattern is c-axes in the foliation plane and perpendicular to the lineation Also here 1010 poles have a maximum parallel to the lineation but there is more diversity especially in layers close to the contact with the Bergell granite Given that these samples originate from an area covering around 400 km2 it was really surprising that texture patterns could be divided into two distinct groups Triassic metasedimentary quartzites (Figure 7) and layers of quartz in schists and gneisses (Figure 8) both of comparable metamorphic grade and existing in close proximity
Looking at c-axes alone the patterns described in the literature (first by Sander 1950 [2]) can be divided into four basic types in a sample coordinate system XYZ with X as lineation and Z normal to the foliation Type A with a simple maximum sometimes asymmetric at Z (Figure 13A) Type B a ZY girdle or crossed girdle (Figure 13B) Type C a small circle girdle around Z (Figure 13C) and Type D a simple maximum at Y (Figure 13D) Figure 13a uses the projection geometry applied in this paper and Figure 13b the more common projection geometry used in the literature As was mentioned earlier the geometry in Figure 13a is optimal to display complexities in distributions for (0001) and 1011 pole figures
Figure 13 Schematic of quartz c-axis texture types relative to sample coordinates X Y and Z (a) Projection on the foliation plane XY used in this paper X is the lineation l A c axes perpendicular to foliation B crossed girdle C c-axis small circle girdle and D c-axis maximum at Y (b) More conventional projection on the plane XZ defined by the normal to the foliation s and the lineation l
In deformation experiments at relatively low temperature Type A was generally observed with a maximum of c-axes in the compression direction This was attributed to dominant basal slip as deformation mechanism [56] At these conditions grains are highly flattened At higher temperature and significant recrystallization this pattern transformed to a small circle of c-axes about the compression direction (Type C) This was confirmed in experiments near the brittle-ductile transition
Figure 13 Schematic of quartz c-axis texture types relative to sample coordinates X Y and Z(a) Projection on the foliation plane XY used in this paper X is the lineation l A c axes perpendicularto foliation B crossed girdle C c-axis small circle girdle and D c-axis maximum at Y (b) Moreconventional projection on the plane XZ defined by the normal to the foliation s and the lineation l
Minerals 2019 9 277 21 of 35
In deformation experiments at relatively low temperature Type A was generally observedwith a maximum of c-axes in the compression direction This was attributed to dominant basal slip asdeformation mechanism [56] At these conditions grains are highly flattened At higher temperatureand significant recrystallization this pattern transformed to a small circle of c-axes about the compressiondirection (Type C) This was confirmed in experiments near the brittle-ductile transition [57] In planestrainpure shear with compression along Z and extension along X the (0001) maximum transformsinto Type B with a YZ girdle [58] In simple shear the c-maximum becomes asymmetric and is centeredagainst the sense of shear [59]
In natural quartz fabrics at low metamorphic grade Type A fabrics were described [6061] as well asgirdle-type B fabrics [12] A transition of a crossed girdle (Type B) transforming with increasingtemperature into a small circle (Type C) was first described by Behr [3ndash5] for the Saxony granuliteterrain and elaborated by Lister and Dornsiepen [6] The Type C small circle girdle was also observedin amphibolite quartzites in the Central Alps [62] A transition from a girdle fabric (Type B) to aY maximum (Type D) with increasing metamorphic grade was described in quartz layers from theSimplon area in the Alps [14] A study of schists in the Annapurna region of Nepal revealed atransition from a c-maximum in Z (Type A) to a cross girdle (Type B) and finally to a Y maximum(Type D) with increasing grade [15] Many samples with D-type fabrics underwent recrystallizationand display equiaxed grain shapes A transition from a Z-maximum (Type A) to a YZ girdle (Type B)was documented in MontaltoItaly quartzites [63] as well as in Mt IsaAustralia gneisses [64]
The conspicuous Y maximum (Type D) appears strongly linked to mylonitic deformation andrecrystallization at high temperature for example in amphibolite facies mylonites from the SwedishCaledonites [64] Galicia and Saxony granulites [65] and in the Pyrenees [66] A transition fromthe small circle fabric (Type C) to the Y maximum type with increasing metamorphic grade andrecrystallization was documented for the Ryoke beltJapan [67] and for ultrahigh pressure gneissin Norway [68] and attributed to a transition from basal to prismatic slip Other reports of type Dfabrics in mylonites are from the Moine thrust in Scotland [6970] the Santa Rosa mylonite zone inCalifornia [48] deformed Adamello tonalities [7172] and sheared quartz layers from the southernSimplon area in the Italian Alps [14] In all these cases quartz textures are very strong and fabricsare recrystallized
The asymmetry of c-axis textures relative to fabric coordinates especially the Type A texturewith a maximum near Z has been attributed to simple shear [76673ndash82] Lister and Williams [83]discussed the relationship between texture asymmetry and sense of shear in detail and there has beenconsiderable ambiguity In most cases the c-maximum near Z is displaced against the sense of shearThis interpretation is based on experiments [588485] and polycrystal plasticity deformation modelsassuming dislocation glide [7886ndash88]
52 Bergell Quartz Textures
After this brief overview of some significant studies of natural quartz textures let us return toBergell quartzites and put them into this context It should be emphasized again that most of olderstudies focus on c-axis distributions with a few exceptions taking the trigonal symmetry of quartz intoaccount [22486588] In most of the Bergell quartzites there is a significant difference between positiverhombs 1011 which are elastically soft directions and negative rhombs 0111 that are approximatelytwice as stiff [89] This difference in rhombohedral distributions is observed in most of the pole figuresin Figures 7 and 8
Of the Bergell quartz layer samples four are true mylonites (Brg407 Brg412 Brg603 Sci292) withhighly flattened fine-grained quartz (~100micromtimes 10microm) warping around feldspar clasts (Figures 4 and 5)The Type D texture resembles a single crystal and is similar to those observed in Santa Rosa [48]In the Bergell Alps these samples are from the deepest tectonic level Gruf migmatites underneaththe Northern limb of the Tertiary Bergell granite and are subjected to amphibolitegranulite faciesmetamorphism Other samples of quartz layers in the vicinity of the Bergell granite contact also
Minerals 2019 9 277 22 of 35
approach a single crystal texture but the orientation is more asymmetric relative to the foliation andlineation Quartz is also highly deformed and partially recrystallized (Brg1165 Sci490 and Sci514)Interestingly the high-grade mylonitic Type D textures (Figure 8ab) are not too different from those inquartz layers in the upper nappes of lower metamorphic grade such as Brg646 (Tambo nappe) andBrg1167 (Suretta nappe) Were these textures inherited from a previous igneous event They are allin the vicinity of older Hercinian granites Three samples from the basement of higher Austroalpinenappes have a more complex pattern that also may be attributed to an older deformation process(Brg1520 Brg1524 and Brg1527)
For a majority of quartz layers textures display a 1010 maximum in the lineation directionExceptions are Sci292 and Sci763 with a 1120 maximum Also often there is a 1011 maximumperpendicular to the foliation
Next we have a closer look at metamorphosed Triassic quartzites They all form coherent layerson top of Paleozoic metamorphic rocks in a stack of nappes from the low Pennine Tambo nappe to thehigh Austroalpine Margna nappe All samples have an excellent foliation (Figure 2) defined by highlyoriented muscovite (Figure 9) On cleavage surfaces a good lineation is generally visible Contrary toquartz layers preferred orientation is much weaker ranging for (0001) from 2 to 12 mrd (Table 1)The microstructure displays fairly equiaxed grains for most samples A few have higher aspect ratiosup to 51 (eg Brg568 Brg1127 Brg1137 Brg1241 and Sci881 see Figure 3) Some samples display arelatively simple c-axis maximum perpendicular to the foliation (Brg568 Brg734 Brg858) (Type A) butfor most this maximum is fairly asymmetric splitting into double maxima and a crossed girdle YZ(Type B) (Figure 7andashc)
Some quartzites display abundant deformation lamellae (eg Brg1127 and Brg1618 highlightedby arrows in Figure 5) Such lamellae have first been mentioned by Sander 1950 (his Figure 41) [2] andlater were investigated in detail [90ndash96] and have been attributed to low temperature deformationassociated with dislocation activity The lamellar structures are particularly abundant during shockdeformation [97ndash101] It is likely that basal slip (0001)lt1120gt has been an active slip system in samplesshowing deformation lamellae [91ndash94]
There is overall an alignment of 1010 and in some cases 1120 parallel to the lineation (Figure 7andashc)While c-axis distributions can be quite variable there is a persistent pattern in 1011 pole figureswith a maximum perpendicular to the foliation (Z) (good examples are Brg752 Brg1102 Brg1139Brg1245 Brg1477 Brg1618 and Sci881) This could be conceivably due to mechanical Dauphineacutetwinning [20102] but EBSD observations show that twin boundaries still exist and these twins didnot propagate through the crystal under an applied stress Note that Dauphineacute twinning would haveno effect on c-axis and a-axis distributions and the accommodated plastic strain is minimal Anotherreason for the difference between (1011) and (0111) pole figures could be deformation on rhombohedralslip systems as explained below
53 Polycrystal Plasticity Modeling
Polycrystal plasticity modeling of quartz was initiated by applying the Taylor theory focusing onbasal and prismatic slip in axial deformation [8687] and in simple shear [83] Later the viscoplasticself-consistent theory VPSC [103104] was applied to quartz [78105] Morales et al [88] conducted asystematic study applying VPSC to model texture patterns of quartz polycrystals deformed in axialcompression and in simple shear for a wide range of slip systems including basal prismatic andrhombohedral For basal (c)ltagt slip a [0001] maximum develops parallel to the compression direction(Type A) For prismatic mltagt slip a c-maximum in Y develops in simple shear at high strain (Type D)
Here we have applied VPSC to explore if observed texture patterns in our natural quartzites canbe explained with deformation by dislocation glide For this we used the Los Alamos VPSC6 code [104]Initially 2000 randomly oriented ellipsoidal grains rotate during deformation by slip in an anisotropicviscous medium representing the average of all grains and being updated at each deformation stepIt is assumed that the stress exponent for the slip systems is 3 corresponding to creep conditions
Minerals 2019 9 277 23 of 35
No work-hardening of slip systems was applied The grain shapes were updated up to a ratio of 51The aggregate was deformed to an equivalent strain of 05 and 10 in 50 and 100 steps correspondingly
In Figure 14 we show results for three conditions Many others were explored Model 1 assumesplane strainpure shear with extension along X and compression along Z Critical shear stress (CRSS)for the (0001)lt1120gt (cltagt) system is 2 for the 1011lt1210gt (rltagt) system is 1 and for 1011lt1123gt
(rltpgt) is 4 Average slip activities after 50 steps are 16 for cltagt 42 for rltagt and 22 forrltpgt The resulting pole figures (Figure 14a) show a split maximumgirdle of (0001) around Z a 1010maximum at X and oblique concentrations for 1011 The pattern is very similar to many Triassicquartzite textures including Brg752 Brg1139 and Brg1245 (Figure 7) Increasing the CRSS for 1011slip increases c-slip and creates a simple maximum in Z Increasing the CRSS for (0001) opens the(0001) girdle with maxima closer to Y as observed in Brg1618 and Brg1643 (Figure 7c)
Model 2 attempts to generate a texture with a (0001) maximum at Y This can be obtained again inpure shear with compression along Z and extension along X and an active slip system 1010lt1210gt
(mltagt) with CRSS equal to 10 (Figure 14b) Only mltagt is active after 50 and 100 steps The patternwith a (0001) maximum at Y and a 1010 maximum at X resembles textures in high grade mylonitessuch as Brg412 Brg603 and Sci292 (Figure 8) Microstructures indicate recrystallization but this maynot change the overall texture pattern greatly as will be discussed below
Model 3 reproduces simple shear conditions described by Morales et al 2014 (their Figure 15atop right) [88] to generate a texture with a maximum in Y The active slip system is again 1010lt1210gt
(mltagt) with CRSS equal to 10 (Figure 14c) Also in simple shear only mltagt slip is activeThe resulting pattern is again a (0001) maximum at Y which compared with pure shear developsonly at high strain The 1010 maximum is rotated relative to the pure shear texture We expect thatin natural mylonites there is generally a dominance of plane strain with a variation in pure shearand simple shear as documented from xenolith geometry in Palm Canyon mylonites [106] Note thatModels 2 and 3 predict very similar orientations of (1011) and (0111) planes which is not surprisingsince rhombohedral slip systems are not significantly active (and were assigned high CRSS values)
Only three model results are shown in Figure 14 and they show good agreement with some ofthe natural quartz textures Similar fits could be obtained for most samples by slightly modifying therelative critical shear stresses of active slip systems (ie the balance between basal rhombohedraland prismatic slip) and the applied strain geometry (such as plane strain versus shortening pureshear versus simple shear in plane strain) It appears that for most quartzites plane strain dominatesexcept for some Triassic quartzites where shortening may dominate ((0001) maximum perpendicularto schistosity) Also for Triassic quartzites the overall strain is moderate (~05) while for myloniticquartzites it is considerably higher
54 Multiphase Issues
In all Triassic quartzite samples with significant mica content muscovite displays a very simplesymmetrical pattern with a (001) maximum perpendicular to the cleavagefoliation plane and noevidence for lineation (Figure 9) Muscovite content ranges from 3 (Brg1643) to 27 (Brg1247) andfor most quartzites (except Brg1135) muscovite textures are very strong (10 mrd to 18 mrd) Generallymuscovite platelets grew during recrystallization with not much evidence for bending or kinking(eg Figure 5) Why are quartz textures with significant muscovite content weak compared with quartzlayers which are almost monomineralic Muscovite locally shields stress and effectively decreases theefficiency of recovery-controlled dislocation motions as documented by experiments [107ndash110] andplasticity models that take local grain interaction into account [111] Also muscovite inhibits grainboundary motion during dynamic recrystallization The texture of Triassic quartzites is similar to thatdocumented in underlying muscovite gneiss from the Tambo nappe that transformed from old granitewith also very strong muscovite texture (100 mrd) and a much weaker quartz texture (17 mrd) [112]
Minerals 2019 9 277 24 of 35
55 Textures of Associated Marble
Triassic quartzites are overlain by marble (metamorphic limestone ldquoMuschelkalkrdquo) that ismechanically much weaker and may absorb much of the strain often with local heterogeneities asexpressed in calcite and dolomite pole figures (Figure 10) Optical microstructures of most marblesamples display intense mechanical twinning and this appears to be a major mechanism at relativelylow temperature [113114] The (0001) maximum at high angles to the foliation plane is consistent withobservations on Yule marble [115] and Carrara marble [116ndash119] both in natural samples and duringdeformation experiments in various geometries Similar textures are also observed in marbles from theAlps [120] and the Pyrenees [121] The asymmetry of the calcite fabric has been investigated in detailin experiments [122123] and by modeling [124] and can be attributed to a simple shear componentOne sample of Triassic dolomite from Casaccia (Brg1101) displays a relatively weak texture and also amaximum perpendicular to the foliation (Figure 10) A similar pattern was observed in other Alpinedolomites [125] and in the deformation experiments [126] The observations suggests that marbleadjacent to Triassic quartzite in the Bergell area is strongly deformed with an often asymmetric pattern
26 of 26
from the Alps [120] and the Pyrenees [121] The asymmetry of the calcite fabric has been investigated in detail in experiments [122123] and by modeling [124] and can be attributed to a simple shear component One sample of Triassic dolomite from Casaccia (Brg1101) displays a relatively weak texture and also a maximum perpendicular to the foliation (Figure 10) A similar pattern was observed in other Alpine dolomites [125] and in the deformation experiments [126] The observations suggests that marble adjacent to Triassic quartzite in the Bergell area is strongly deformed with an often asymmetric pattern
Figure 14 Viscoplastic self-consistent VPSC modeling of quartz textures (a) Pure shear Z compression X extension equivalent strain 05 basal (0001)lt2110gt (cltagt) and rhombohedral slip
1011lt1210gt (rltagt) (b) Pure shear Z compression X extension equivalent strain 10 prismatic slip 1010lt1210gt (mltagt) (c) XZ plane strain simple shear X shear direction equivalent strain 10 and prismatic slip 1010lt1210gt Equal area projection
56 Dynamic Recrystallization
Another aspect of quartz texture formation is dynamic recrystallization for which there is ample evidence in microstructures with grain growth of individual crystals (eg Brg1241) to an ideal mosaic microstructure (eg Brg1524) (Figures 3ndash5) Axial compression experiments with recrystallization observed a transition from a c-axis maximum parallel to the compression (Type A) to a small circle girdle (Type C) [57] and simple shear experiments a transition from Type A to a XY girdle (Type B) and ultimately to a Y maximum [8485] Experiments also established that trace water content has a significant impact on recrystallization [72127ndash132]
Interpretation of grain growth in a stressndashstrain environment is complex [132133] It has been approached with thermodynamics and is fairly straightforward for materials which are elastically highly anisotropic such as mica [134ndash136] For quartz in compression one would expect alignment of the soft direction 1011 parallel to the compression direction with a small circle girdle of c-axes due to the symmetry of elastic properties [89] A weak 1011 maximum perpendicular to the foliation (Z) is actually observed in many Triassic samples (Figure 7)
Figure 14 Viscoplastic self-consistent VPSC modeling of quartz textures (a) Pure shear Z compressionX extension equivalent strain 05 basal (0001)lt2110gt (cltagt) and rhombohedral slip 1011lt1210gt
(rltagt) (b) Pure shear Z compression X extension equivalent strain 10 prismatic slip 1010lt1210gt
(mltagt) (c) XZ plane strain simple shear X shear direction equivalent strain 10 and prismatic slip1010lt1210gt Equal area projection
56 Dynamic Recrystallization
Another aspect of quartz texture formation is dynamic recrystallization for which there is ampleevidence in microstructures with grain growth of individual crystals (eg Brg1241) to an ideal mosaicmicrostructure (eg Brg1524) (Figures 3ndash5) Axial compression experiments with recrystallizationobserved a transition from a c-axis maximum parallel to the compression (Type A) to a small circlegirdle (Type C) [57] and simple shear experiments a transition from Type A to a XY girdle (Type B)
Minerals 2019 9 277 25 of 35
and ultimately to a Y maximum [8485] Experiments also established that trace water content has asignificant impact on recrystallization [72127ndash132]
Interpretation of grain growth in a stressndashstrain environment is complex [132133] It has beenapproached with thermodynamics and is fairly straightforward for materials which are elasticallyhighly anisotropic such as mica [134ndash136] For quartz in compression one would expect alignment ofthe soft direction 1011 parallel to the compression direction with a small circle girdle of c-axes due tothe symmetry of elastic properties [89] A weak 1011 maximum perpendicular to the foliation (Z) isactually observed in many Triassic samples (Figure 7)
Another approach to model the evolution of recrystallization textures is with polycrystal plasticitytheory In metals it is observed that recrystallization is a balance of nucleation and growth Dependingon conditions more highly deformed grains (high strain energy) are consumed by relatively undeformedneighbors (low strain energy) or strain-free nuclei form in highly deformed grains and preferentiallyconsume host grains [137138] Such a model was successfully applied to halite ice quartz [139] andolivine [140] For quartz deformed in plane strainpure shear initially during deformation a Type Atexture develops and expands into a girdle (Type B) [139] The most highly deformed grains are near Yand if they develop nuclei which grow a Y texture (Type D) develops as observed in many mylonitesmentioned earlier
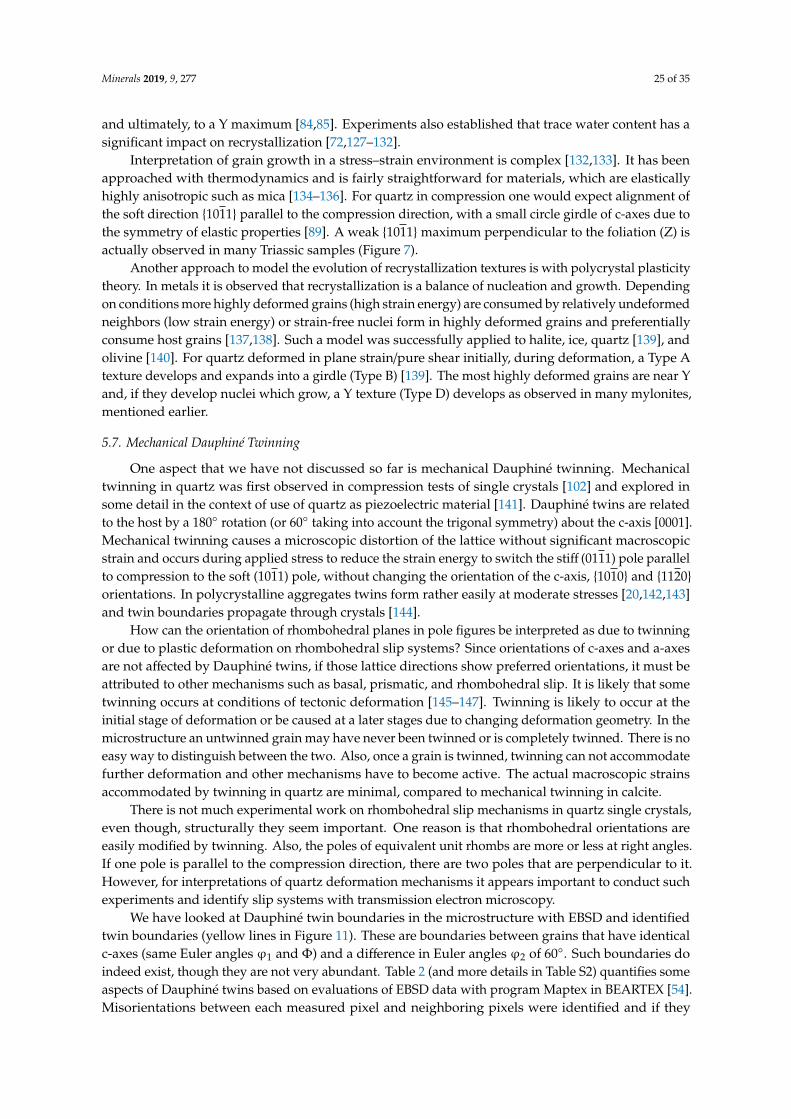
57 Mechanical Dauphineacute Twinning
One aspect that we have not discussed so far is mechanical Dauphineacute twinning Mechanicaltwinning in quartz was first observed in compression tests of single crystals [102] and explored insome detail in the context of use of quartz as piezoelectric material [141] Dauphineacute twins are relatedto the host by a 180 rotation (or 60 taking into account the trigonal symmetry) about the c-axis [0001]Mechanical twinning causes a microscopic distortion of the lattice without significant macroscopicstrain and occurs during applied stress to reduce the strain energy to switch the stiff (0111) pole parallelto compression to the soft (1011) pole without changing the orientation of the c-axis 1010 and 1120orientations In polycrystalline aggregates twins form rather easily at moderate stresses [20142143]and twin boundaries propagate through crystals [144]
How can the orientation of rhombohedral planes in pole figures be interpreted as due to twinningor due to plastic deformation on rhombohedral slip systems Since orientations of c-axes and a-axesare not affected by Dauphineacute twins if those lattice directions show preferred orientations it must beattributed to other mechanisms such as basal prismatic and rhombohedral slip It is likely that sometwinning occurs at conditions of tectonic deformation [145ndash147] Twinning is likely to occur at theinitial stage of deformation or be caused at a later stages due to changing deformation geometry In themicrostructure an untwinned grain may have never been twinned or is completely twinned There is noeasy way to distinguish between the two Also once a grain is twinned twinning can not accommodatefurther deformation and other mechanisms have to become active The actual macroscopic strainsaccommodated by twinning in quartz are minimal compared to mechanical twinning in calcite
There is not much experimental work on rhombohedral slip mechanisms in quartz single crystalseven though structurally they seem important One reason is that rhombohedral orientations areeasily modified by twinning Also the poles of equivalent unit rhombs are more or less at right anglesIf one pole is parallel to the compression direction there are two poles that are perpendicular to itHowever for interpretations of quartz deformation mechanisms it appears important to conduct suchexperiments and identify slip systems with transmission electron microscopy
We have looked at Dauphineacute twin boundaries in the microstructure with EBSD and identifiedtwin boundaries (yellow lines in Figure 11) These are boundaries between grains that have identicalc-axes (same Euler angles ϕ1 and Φ) and a difference in Euler angles ϕ2 of 60 Such boundaries doindeed exist though they are not very abundant Table 2 (and more details in Table S2) quantifies someaspects of Dauphineacute twins based on evaluations of EBSD data with program Maptex in BEARTEX [54]Misorientations between each measured pixel and neighboring pixels were identified and if they
Minerals 2019 9 277 26 of 35
correspond to Dauphineacute twins plotted on the maps and statistically evaluated by comparing thetotal number of pixels with grain boundary pixels These statistics include not only scans plotted inFigure 11 but all scans on the sample Most samples have a low ratio of total twin boundary length tothe probed area ranging from 03 to 15 times 10minus2 A few samples (Brg568 981 1135 1137 and 1618 andSci881) have a ratio gt2 All of these samples are Triassic quartzites Similar high ratios were observedfor experimentally stressed quartzites [143] that we show for comparison as sample Br in Table 2C
58 Comparison of Methods of Texture Measurements
After discussing the geological significance of these observations of quartz preferred orientationlet us look at some methodological aspects As was mentioned earlier a range of methods were used toinvestigate quartz textures ranging from optical methods [148149] conventional X-ray diffraction [1965]synchrotron X-ray diffraction [150151] neutron diffraction (ranging from monochromatic [149152]to time-of-flight [49]) and electron backscatter diffraction (EBSD) [79143144146] Results fromdifferent methods were compared [254963149153154] Optical methods are limited to record c-axisorientations EBSD records textures on surfaces neutron diffraction probes large volumes of samples
For the quartz textures described here we used TOF neutron diffraction and EBSD We werefortunate to have had the opportunity to measure the texture of many quartzite samples with neutrondiffraction at Los Alamos As mentioned earlier we observed very consistent patterns with thistechnique which assesses grain orientations over ~1 cm3 samples Even larger samples (~65 cm3)were measured at Dubna Such volumes provide confidence that the derived texture patterns arerepresentative of the local rock properties at the laboratory scale It does not imply that texture patternsare homogeneous over large areas In fact the samples collected in the same Triassic quartz layer nearCasaccia (Brg980 Brg981 and Brg1102) vary considerably over distances of lt1km indicating that localheterogeneities in a geological sense can be significant It confirms that a large number of samples isimportant to derive a representative interpretation
Figure 12 compares neutron and EBSD pole figures of selected samples (a full comparison is shownin Figures S3 and S4) and Table 1 compares texture strength obtained with the two methods The polefigures after proper rotations of EBSD pole figures show excellent agreement A significant differenceis that the texture strength of EBSD pole figures is consistently larger (Table 1) One explanation couldbe that the number of measured grains is much larger for neutrons than for EBSD introducing statisticalsmoothing Another explanation could be the angular averaging by the large neutron detectors over aconsiderable range (eg Figure 6a) [25] With EBSD diffraction patterns crystal orientations are definedwithin a fraction of a degree
This is highlighted in Figure 15 for Brg1618 from Cavi where samples cut from the same largerhand specimen were measured with neutron diffraction with HIPPO at Los Alamos (1 cm cylinders)(Figure 15a) with SKAT at Dubna (5 cm diameter spheres) (Figure 15b) and SEM-EBSD scanning overa mm-sized surface (Figures 11 and 15c) The texture is relatively weak and the average grain size isabout 02 mm (Figures 3 and 5) The two neutron diffraction measurements show excellent agreementEBSD has a similar pattern but is less quantitative
An advantage of EBSD is that the microstructure including twin boundaries can be quantified(Table 2) Thus it looks like for relatively fine-grained samples which can easily be polished and areanalyzed at ambient conditions texture analysis with EBSD is advantageous especially with advancesin detector technology that allows to collect 1000 diffraction images per second EBSD requires muchless preparation and data processing than neutron TOF texture analysis which relies on convincingproposals with advanced planning and the rather strenuous data analysis to arrive at quantitativetexture information
Minerals 2019 9 277 27 of 3529 of 29
Figure 15 Comparison of neutron and EBSD pole figures for sample Brg1618 (a) Neutron diffraction with HIPPO LAN (b) neutron diffraction with SKAT JINR-Dubna and (c) EBSD with SEM Equal area projection
6 Conclusions
Preferred orientations of 24 Triassic quartzites eight Triassic marbles and 15 quartz layers in metamorphic gneiss from the Bergell Alps in SE Switzerland were analyzed with neutron diffraction and EBSD Texture patterns were reciprocated with polycrystal plasticity modeling to explore likely deformation mechanisms In Triassic quartzites from the Pennine nappes (Tambo Suretta Avers and Platta) and the lower Austroalpne Margna nappe quartz shows a (0001) maximum near the pole to the foliation Z sometimes divided into submaxima or a YZ crossed girdle perpendicular to the lineation X A simple (0001) maximum is particularly common in quartzites of the lowest metamorphic grade (higher nappes Avers and Magna) Also many samples show a submaximum of 1011 poles near Z This is attributed to dominant basal (0001)lt1120gt and rhombohedral 1011lt1210gt slip accompanied by recrystallization The texture patterns are consistent over a wide area and variations can be attributed to local changes in strain geometry Some Triassic quartzites display deformation lamellae and EBSD maps display significant Dauphineacute twin boundaries Overall textures are moderate in strength which may be due to presence of strongly aligned muscovite that shields stress and hinders dislocation and grain boundary movements or it could be caused by adjacent Triassic marbles that may have accommodated a significant portion of strain Textures in quartz layers are generally very strong with a (0001) maximum near Y as has been documented in mylonites from many localities Also here there is a 1011 maximum near Z Polycrystal plasticity models suggest that the Y-maximum texture is due to dominant prismatic 10 1 0lt 1 2 1 0gt slip combined with rhombohedral slip 1011lt1210gt and dynamic recrystallization These Y-maximum textures are particularly pronounced in mylonitic layers close to the Teriary Bergell granite contact in high amphibolitendashgranulite facies metamorphic conditions Most likely is that plane strain
Figure 15 Comparison of neutron and EBSD pole figures for sample Brg1618 (a) Neutron diffraction withHIPPO LAN (b) neutron diffraction with SKAT JINR-Dubna and (c) EBSD with SEM Equal area projection
6 Conclusions
Preferred orientations of 24 Triassic quartzites eight Triassic marbles and 15 quartz layers inmetamorphic gneiss from the Bergell Alps in SE Switzerland were analyzed with neutron diffractionand EBSD Texture patterns were reciprocated with polycrystal plasticity modeling to explore likelydeformation mechanisms In Triassic quartzites from the Pennine nappes (Tambo Suretta Avers andPlatta) and the lower Austroalpne Margna nappe quartz shows a (0001) maximum near the pole to thefoliation Z sometimes divided into submaxima or a YZ crossed girdle perpendicular to the lineation XA simple (0001) maximum is particularly common in quartzites of the lowest metamorphic grade(higher nappes Avers and Magna) Also many samples show a submaximum of 1011 poles near ZThis is attributed to dominant basal (0001)lt1120gt and rhombohedral 1011lt1210gt slip accompaniedby recrystallization The texture patterns are consistent over a wide area and variations can be attributedto local changes in strain geometry Some Triassic quartzites display deformation lamellae and EBSDmaps display significant Dauphineacute twin boundaries Overall textures are moderate in strength whichmay be due to presence of strongly aligned muscovite that shields stress and hinders dislocationand grain boundary movements or it could be caused by adjacent Triassic marbles that may haveaccommodated a significant portion of strain Textures in quartz layers are generally very strong witha (0001) maximum near Y as has been documented in mylonites from many localities Also here there isa 1011 maximum near Z Polycrystal plasticity models suggest that the Y-maximum texture is due todominant prismatic 1010lt1210gt slip combined with rhombohedral slip 1011lt1210gt and dynamicrecrystallization These Y-maximum textures are particularly pronounced in mylonitic layers closeto the Teriary Bergell granite contact in high amphibolitendashgranulite facies metamorphic conditionsMost likely is that plane strain dominates in most samples with different fractions of pure shear
Minerals 2019 9 277 28 of 35
and simple shear There is excellent qualitative agreement between neutron diffraction pole figuresand EBSD pole figures The study suggests that rhombohedral slip may be significant in quartz andthis should be approached with future deformation experiments and electron microscope studies toidentify dislocations
Supplementary Materials The following are available online at httpwwwmdpicom2075-163X95277s1This section contains two tables and four figures that display details and may be of interest to some readers TableS1 List of additional Triassic quartzite samples with location Swiss coordinates and (0001) pole figure maxima(in multiples of a random distribution) These samples are not referred to in the text but pole figures determinedfrom neutron diffraction data are shown in Figure S3 Table S2 EBSD twin boundary statistics with individualscans (Compare with Table 2 in main paper) Figure S1 Optical images of microstructures of Triassic quartziteslisted in Table 1 Crossed polarizers Scale bar is indicated on top right Figure S2 Optical images of quartz layerslisted in Table 1 Crossed polarizers Scale bar is indicated on top right Figure S3 Neutron diffraction pole figuresof samples not included in the main text Approximate localities are indicated under sample numbers Equalarea projection on the schistosity plane Lineation is l Numbers on top right of pole figures indicate which poledensity scale was used (in mrd) Figure S4ab Comparison of (0001) and (1011) pole figures of quartz for Triassicquartzites and EBSD and neutron diffraction Selected cases are also shown in Figure 12 Equal area projection onthe schistosity plane Lineation is l Numbers on top right of pole figures indicate which pole density scale wasused (in mrd) Figure S5 Comparison of (0001) and (1011) pole figures of quartz for quartz layers and EBSD andneutron diffraction Selected cases are also shown in Figure 12 Equal area projection on the schistosity planeLineation is l Numbers on top right of pole figures indicate which pole density scale was used (in mrd)
Author Contributions All authors participated in the preparation of this manuscript H-RW conducted samplecollection collaborated in HIPPO and EBSD experiments data anaslysis and prepared the first version of themanuscript RY worked on EBSD experiments data analysis SV worked on HIPPO experiments and RV onSKAT experiments
Funding H-RW is greatful for support from NSF (EAR 1343908) and DOE-BES (DE-FG02-05ER15637)RY acknowledges support from IKSTP Shaanxi China (No2015GY101)
Acknowledgments We are appreciative for access to the HIPPO neutron diffraction facilities at LANSCE wheremost of the diffraction experiments were conducted The user program at LANSCE was supported by DOE-BESWe also acknowledge the access to the SKAT diffractometer at JINR Dubna Comments from five enthusiasticreviewers were very helpful For such a long manuscript with over 150 references and only numbers in the textit must have been a difficult task We also thank T Teague (Berkeley) for help with sample preparation L Morales(ETH) and C Tomeacute (LANL) for discussions particularly polycrystal plasticity modeling
Conflicts of Interest The authors declare no conflict of interest
References
1 Schmidt W Gefuumlgestatistik Tschermaks Mineral Petrog Mitt 1925 38 392ndash4232 Sander B Einfuumlhrung in die Gefuumlgekunde der geologischen Koumlrper Teil II Die Korngefuumlge Springer Wien Austria
1950 p 412 [CrossRef]3 Behr H-J Beitraumlge zur petrographischen und tektonischen Analyse des saumlchsischen Grundgebirges Freiberger
Forsch 1961 C119 1ndash1184 Behr H-J Die Korngefuumlgefazies der Zweiguumlrteltektonite im kristallinen Grundgebirge Sachsens Abh
Deutsch Akad Wiss Berlin Kl Bergbau 1964 1 1ndash465 Behr H-J Zur Methodik tektonischer Forschung im kristallinen Grundgebirge Ber Geol Ges DDR 1965
102 163ndash1796 Lister GS Dornsiepen UF Fabric transition in the Saxony granulite terrain J Struct Geol 1982 4 81ndash92
[CrossRef]7 Christie JM The Moine thrust zone in the Assynt region northwest Scotland Calif Univ Publ Geol Sci
1963 40 345ndash4408 Law RD Heterogeneous deformation and quartz crystallographic fabric transitions natural examples from
the Moine Thrust zone at the stack of Glencoul northern Assynt J Struct Geol 1987 9 819ndash833 [CrossRef]9 Law RD Schmid SM Wheeler J Simple shear deformation and quartz crystallographic fabrics A possible
natural example from the Torrion area of NW Scotland J Struct Geol 1990 12 29ndash45 [CrossRef]10 Bell TH Etheridge MA The deformation and recrystallization of quartz in a mylonite zone Central
Australia Tectonophysics 1976 32 235ndash267 [CrossRef]
Minerals 2019 9 277 29 of 35
11 Wenk H-R Gefuumlgestudie an Quarzknauern und linsen der Tessiner Kulmination Schweiz Mineral PetrogMitt 1965 45 468ndash516
12 Simpson C Oblique girdle orientation patterns of quartz c-axes from a shear zone in the basement core ofthe Maggia Nappe Ticino Switzerland J Struct Geol 1980 2 243ndash247 [CrossRef]
13 Mancktelow NS Quartz textures form the Simplon Fault Zone southwest Switzerland and north ItalyTectonophysics 1987 135 133ndash153 [CrossRef]
14 Mancktelow NS Atypical textures in quartz from the Simplon fault zone J Struct Geol 1987 98 995ndash1005[CrossRef]
15 Parsons AJ Law RD Lloyd RD Phillips RJ Searle MP Thermo-kinematic evolution of theAnnapurna-Dhaulagiri Himalaya central Nepal The composite orogenic system Geochem GeophysGeosystems 2016 17 1511ndash1539 [CrossRef]
16 Long SP Gordon SM Young JP Soignard E Temperature and strain gradients through Lesser Himalayanrocks and across the Main Central thrust south central Bhutan Implications for transport-parallel stretchingand inverted metamorphism Tectonics 2016 35 1863ndash1891 [CrossRef]
17 Hunter NJR Weinberg RF Wilson CJL Luzin V Misra S Microscopic anatomy of a ldquohot-on-coldrdquoshear zone Insights from quartzites from the Main Central Thrust in the Alaknanda Valley (GarhwalHimalaya) Geol Soc America Bull 2018 130 1519ndash1539 [CrossRef]
18 Larson KP Refining the structural framework of the Khimti Khola region east-central Nepal Himalayausing quartz textures and c-axis fabrics J Struct Geol 2018 107 142ndash152 [CrossRef]
19 Wenk H-R Baker DW Griggs ET X-ray fabric analysis of hot-worked and annealed flint Science 1967157 1447ndash1449 [CrossRef]
20 Tullis J Quartz Preferred orientation in rocks produced by Dauphineacute twinning Science 1970 168 1342ndash1344[CrossRef]
21 Baker DW Wenk H-R Christie JM X-ray analysis of preferred orientation in fine-grained quartzaggregates J Geol 1969 77 144ndash172 [CrossRef]
22 Baker DW Wenk H-R Preferred orientation in a low symmetry quartz mylonite J Geol 1972 80 81ndash105[CrossRef]
23 Dingley DJ A comparison of diffraction techniques for the SEM Scanning Electr Microsc 1981 4 273ndash28624 Kunze K Adams BL Heidelbach F Wenk H-R Local microstructural investigations in recrystallized
quartzite using orientation imaging microscopy Mater Sci Forum 1994 157ndash162 1243ndash1250 [CrossRef]25 Wenk H-R Lutterotti L Vogel SC Rietveld texture analysis from TOF neutron diffraction data Powder
Diffr 2010 25 283ndash296 [CrossRef]26 Bunge H-J Zur Darstellung allgemeiner Texturen Z Metallk 1965 56 872ndash87427 Roe R-J Description of crystallite orientation in polycrystalline materials III general solution to pole figure
inversion J Appl Phys 1965 36 2024ndash2031 [CrossRef]28 Matthies S On the reproducibility of the orientation distribution function of texture samples from pole
figures (ghost phenomena) Phys Status Solidi B 1979 92 K135ndashK138 [CrossRef]29 Matthies S Vinel GW On the reproduction of the orientation distribution function of textured samples
from reduced pole figures using the concept of conditional ghost correction Phys Status Solidi B 1982 112K111ndashK114 [CrossRef]
30 Pawlik K Determination of the orientation distribution function from pole figures in arbitrarily definedcells Phys Status Solidi B 1986 134 477ndash483 [CrossRef]
31 Schaeben H Entropy optimization in texture goniometry Phys Status Solidi B 1988 148 63ndash72 [CrossRef]32 Hielscher R Schaeben H A novel pole figure inversion method specification of the MTEX algorithm
J Appl Cryst 2008 41 1024ndash1037 [CrossRef]33 Christie JM Griggs DT Carter NL Experimental evidence of basal slip in quartz J Geol 1964 72
734ndash756 [CrossRef]34 Hobbs BE McLaren AC Paterson MS Plasticity of single crystals of synthetic quartz Flow Fract Rocks
1972 16 29ndash53 [CrossRef]35 Baeta RD Ashbee KGH Mechanical deformation of quartz I Constant strain-rate compression
experiments Phil Mag 1970 22 601ndash623 [CrossRef]36 DrsquoOmalius drsquoHalloy JJ Introduction a la Geacuteologie Levrault Paris France 1833
Minerals 2019 9 277 30 of 35
37 Kurz W Neubauer F Genser J Dachs E Alpine geodynamic evolution of passive and active continentalmargin sequences in the Tauern Window (eastern Alps Austria Italy) A review Geol Rundschau 1998 87225ndash242 [CrossRef]
38 Schmid SM Scharf A Handy MR Rosenberg CL The Tauern Window (Eastern Alps Austria) A newtectonic map with cross-sections and a tectonometamorphic synthesis Swiss J Geosci 2013 106 1ndash32[CrossRef]
39 Trommsdorff V Montrasio A Hermann J Muumlntener O Spillmann P Giereacute R The geological map ofValmalenco Schweiz Mineral Petrog Mitt 2005 85 1ndash13
40 Wenk H-R The structure of the Bergell Alps Eclogae Geol Helv 1973 66 255ndash29141 Wenk H-R Wenk E Wallace J Metamorphic mineral assemblages in pelitic rocks of the Bergell Alps
Schweiz Mineral Petrog Mitt 1974 54 507ndash55442 Law RD Crystallographic fabrics A selective review of their applications to research in structural geology
Geol Soc London Spec Publ 1990 54 335ndash352 [CrossRef]43 Bishop JR Piezoelectric effects in quartz-rich rocks Tectonophysics 1981 77 97ndash321 [CrossRef]44 Ivankina TI Nikitin AN Voitus W Walther K Texture analysis and investigation of piezoelectric
properties of natural quartz Textures Microstruct 1991 14ndash18 421ndash429 [CrossRef]45 Frondel C Characters of quartz fibers Am Mineral 1978 63 17ndash2746 Tanaka Y Kojima T Takata Y Chainani A Lovesey SW Knight KS Takeuchi T Oura M Senba Y
Ohashi H et al Determination of structural chirality of berlinite and quartz using resonant X-ray diffractionwith circularly polarized X-rays Physic Rev B 2010 81 144104 [CrossRef]
47 Matthies S Wenk H-R Vinel GW Some basic concepts of texture analysis and comparison of threemethods to calculate orientation distributions from pole figures J Appl Crystallogr 1988 21 285ndash304[CrossRef]
48 Pehl J Wenk H-R Evidence for regional Dauphineacute twinning in quartz from the Santa Rosa mylonite zonein Southern California A neutron diffraction study J Struct Geol 2005 27 1741ndash1749 [CrossRef]
49 Wenk H-R Lutterotti L Vogel SC Texture analysis with the new HIPPO TOF diffractometer Nucl InstrMethods A 2003 515 575ndash588 [CrossRef]
50 Ullemeyer K Spalthoff P Heinitz J Isakov NN Nikitin AN Weber K The SKAT texture diffractometerat the pulsed reactor IBR-2 at Dubna Experimental layout and first measurements Nucl Instr Methods A1998 412 80ndash88 [CrossRef]
51 Keppler R Ullemeyer K Behrmann JH Stipp M Potential of full pattern fit methods for the textureanalysis of geological materials Implications from texture measurements at the recently upgraded neutrontime-of-flight diffractometer SKAT J Appl Crystallogr 2014 47 1520ndash1534 [CrossRef]
52 Lutterotti L Matthies S Wenk H-R Schultz AJ Richardson JW Combined texture and structureanalysis of deformed limestone from time-of-flight neutron diffraction spectra J Appl Phys 1997 81594ndash600 [CrossRef]
53 Kihara K An X-ray study of the temperature dependence of the quartz structure Eur J Mineral 1990 2163ndash77 [CrossRef]
54 Wenk H-R Matthies S Donovan J Chateigner D BEARTEX A Windows-based program system forquantitative texture analysis J Appl Crystallogr 1998 31 262ndash269 [CrossRef]
55 Matthies S Wenk H-R Transformations for monoclinic crystal symmetry in texture analysis J Appl Cryst2009 42 564ndash571 [CrossRef]
56 Tullis J Christie JM Griggs DT Microstructures and preferred orientations of experimentally deformedquartzites Geol Soc Am Bull 1973 84 297ndash314 [CrossRef]
57 Stipp M Kunze K Dynamic recrystallization near the brittle-plastic transition in naturally andexperimentally deformed quartz aggregates Tectonophysics 2008 448 77ndash97 [CrossRef]
58 Tullis J Preferred orientation of quartz produced by slip during plane strain Tectonophysics 1977 39 87ndash102[CrossRef]
59 DellrsquoAngelo LN Tullis J Fabric development in experimentally sheared quartzites Tectonophysics 1989169 1ndash21 [CrossRef]
60 Mainprice DH Bouches JL Blumenfeld P Tubiaacute JM Dominant c slip in naturally deformed quartzImplications for dramatic plastic softening at high temperature Geology 1986 14 819ndash822 [CrossRef]
Minerals 2019 9 277 31 of 35
61 Toy VG Prior DJ Norris RJ Quartz fabrics in the Alpine Fault mylonites Influence of pre-existingpreferred orientations on fabric development during progressive uplift J Struct Geol 2008 30 602ndash621[CrossRef]
62 Trommsdorff V Wenk E Diskussion eines Zwillingsgefuumlges durch Achsenverteilungsanalyse an Quarzeines Tessiner Gneisses Schweiz Mineral Petrog Mitt 1963 43 687ndash698
63 Fazio E Punturo R Cirrincione R Kern H Pezzino A Wenk H-R Goswami S Mamtani MA Quartzpreferred orientation in naturally deformed mylonitic rocks (Montalto Shear ZonemdashItaly) A comparisonof results by different techniques their advantages and limitations Int J Earth Sci 2017 106 2259ndash2278[CrossRef]
64 Wilson CJL Preferred orientation in quartz ribbon mylonites Geol Soc Am Bull 1975 86 968ndash974[CrossRef]
65 Schmid SM Casey M Starkey J An illustration of the advantages of a complete texture analysis describedby the orientation distribution function (ODF) using quartz pole figure data Tectonophysics 1981 78 101ndash117[CrossRef]
66 Carreras J Estrada A White S The effects of folding on the c-axis fabrics of a quartz mylonite Tectonophysics1977 39 3ndash24 [CrossRef]
67 Okudaira T Takeshita T Hara I Ando J A new estimate of the conditions for transition from basal ltagt
to prism [c] slip in naturally deformed quartz Tectonophysics 1995 250 31ndash46 [CrossRef]68 Barth NC Hacker BR Seward GGE Walsh EO Young D Johnston S Strain within the
ultrahigh-pressure Western Gneiss region of Norway recorded by quartz CPOs Geol Soc LondonSpec Publ 2010 335 663ndash685 [CrossRef]
69 Knipe RJ Law RD The influence of crystallographic orientation and grain boundary migration onmicrostructural and textural evolution in an S-C mylonite Tectonophysics 1987 135 155ndash169 [CrossRef]
70 Law RD Mainprice D Casey M Lloyd GE Knipe RJ Cook B Thigpen JR Moine thrust zonemylonites at the Stack of Glencoul ImdashMicrostructures strain and influence of recrystallization on quartzcrystal fabric development Geol Soc London Spec Publ 2010 335 543ndash577 [CrossRef]
71 Pennacchioni G Menegon L Leiss B Nestola F Bromiley G Development of crystallographic preferredorientation and microstructure during plastic deformation of natural coarse-grained quartz veins J GeophysRes 2010 115 B12405 [CrossRef]
72 Stipp M Stuumlnitz H Heilbronner R Schmid SM The Eastern Tonale fault zone A ldquonatural laboratoryrdquofor crystal plastic deformation of quartz over a temperature range from 250 C to 700 C J Struct Geol 200224 1861ndash1884 [CrossRef]
73 Hara I Takeda K Kimura T Preferred lattice orientation of quartz in shear deformation J Sci HiroshimaUniv Ser C 1973 7 1ndash11
74 Bouchez JL Pecher A Plasticiteacute du quartz et sens de cisaillement dans les quartzites du grandChevauchement Central Himalayen Bull Soc Geol Fr 1976 6 1377ndash1384 [CrossRef]
75 Lister GS Discussion Cross-girdle c-axis fabrics in quartzites plastically deformed by plane strain andprogressive simple shear Tectonophysics 1977 39 51ndash54 [CrossRef]
76 Brunel M Quartz fabrics in shear-zone mylonites Evidence for a major imprint due to late strain incrementsTectonophysics 1980 64 T33ndashT44 [CrossRef]
77 Lloyd GE Freeman B Dynamic recrystallization of quartz under greenschist conditions J Struct Geol1994 16 867ndash881 [CrossRef]
78 Takeshita T Wenk H-R Lebensohn R Development of preferred orientation and microstructure insheared quartzite Comparison of natural and simulated data Tectonophysics 1999 312 133ndash155 [CrossRef]
79 Heidelbach F Kunze K Wenk H-R Texture nalysis of a recrystallized quartzite using electron diffractionin the scanning electron microscope J Struct Geol 2000 22 91ndash104 [CrossRef]
80 Keller LM Stipp M The single slip hypothesis revisited Crystal-preferred orientations of sheared quartzaggregates with increasing strain in nature and numerical simulation J Struct Geol 2011 33 1491ndash1500[CrossRef]
81 Kilian R Heilbronner R Stuumlnitz H Quartz microstructures and crystallographic preferred orientationWhich shear sense do they indicate J Struct Geol 2011 33 1446ndash1466 [CrossRef]
Minerals 2019 9 277 32 of 35
82 Morales LFG Mainprice D Lloyd GE Law RD Crystal fabric development and slip systems in a quartzmylonite An approach via transmission electron microscopy and viscoplastic self-consistent modellingGeol Soc London Special Publ 2011 360 151ndash174 [CrossRef]
83 Lister GS Williams PF Fabric development in shear zones theoretical controls and observed phenomenaJ Struct Geol 1979 1 283ndash297 [CrossRef]
84 Heilbronner R Tullis J Evolution of c-axis pole figures and grain size during dynamic recrystallizationResults from experimentally sheared quartzite J Geophys Res 2006 111 B10202 [CrossRef]
85 Kilian R Heilbronner R Analysis of crystallographic preferred orientation of experimentally deformedBlack Hills quartzite Solid Earth 2017 8 1095ndash1117 [CrossRef]
86 Lister GS Paterson MS The simulation of fabric development during plastic deformation and itsapplication to quartzite Fabric transitions J Struct Geol 1979 1 99ndash115 [CrossRef]
87 Lister GS Hobbs BE The simulation of fabric development during plastic deformation and its applicationto quartzite The influence of deformation history J Struct Geol 1980 2 355ndash370 [CrossRef]
88 Morales LFG Lloyd GE Mainprice D Fabric transitions in quartz via viscoplastic self-consistentmodeling part I Axial compression and simple shear under constant strain Tectonophysics 2014 636 52ndash69[CrossRef]
89 Heyliger P Ledbetter H Kim S Elastic constants of natural quartz J Acoust Soc Am 2003 114 644ndash650[CrossRef]
90 Carter NL Basal quartz deformation lamellae a criterion for recognition of impactites Am J Sci 1965 263786ndash806 [CrossRef]
91 Christie JM Raleigh CB The origin of deformation lamellae in quartz Am J Sci 1959 257 385ndash407[CrossRef]
92 McLaren AC Turner RG Boland JN Hobbs BE Dislocation structure of the deformation lamellaein synthetic quartz a study by electron and optical microscopy Contrib Mineral Petrol 1970 29 104ndash115[CrossRef]
93 White S Geological significance of recovery and recrystallization processes in quartz Tectonophysics 197739 143ndash170 [CrossRef]
94 Christie JM Ardell AJ Substructures of deformation lamellae in quartz Geology 1974 2 405ndash408[CrossRef]
95 Vernooij MGC Langenhorst F Experimental reproduction of tectonic deformation lamellae in quartzand comparison to shock-induced planar deformation features Meteor Planet Sci 2005 40 1353ndash1361[CrossRef]
96 Trepman CA Spray JG Planar microstructures and Dauphineacute twins in shocked quartz from the Charlevoiximpact structure Canada Geol Soc Amer Special Paper 2005 384 315ndash328 [CrossRef]
97 Gratz AJ Tyburczy J Christie J Ahrens T Pongratz P Shock metamorphism of deformed quartz PhysChem Miner 1988 16 221ndash233 [CrossRef]
98 Gratz AJ Nellis WJ Christie JM Brocious W Swegle J Cordier P Shock metamorphism of quartzwith initial temperatures minus170 to +1000 C Phys Chem Miner 1992 19 267ndash288 [CrossRef]
99 Stoumlffler D Langenhorst F Shock metamorphism of quartz in nature and experiment I Basic observationand theory Meteoritics 1994 29 155ndash181 [CrossRef]
100 French BM Koeberl C The convincing identification of terrestrial meteorite impact structures Whatworks what doesnrsquot and why Earth-Sci Rev 2010 98 123ndash170 [CrossRef]
101 Hamers MF Pennock GM Herwegh M Drury MR Distinction between amorphous and healedplanar deformation features in shocked quartz using composite color scanning electron microscopecathodoluminescence (SEM-CL) imaging Meteorit Planet Sci 2016 51 1914ndash1931 [CrossRef]
102 Schubnikow A Uumlber Schlagfiguren des Quarzes Z Kristallogr 1930 74 103ndash104103 Molinari A Canova G Ahzi S A self consistent approach of the large deformation polycrystal viscoplasticity
Acta Metall 1987 35 2983ndash2994 [CrossRef]104 Lebensohn R Tomeacute CA self-consistent visco-plastic model Prediction of rolling textures of anisotropic
materials Mater Sci Eng A 1994 175 71ndash82 [CrossRef]105 Wenk H-R Canova G Molinari A Kocks UF Viscoplastic modeling of texture development in quartzite
J Geophys Res 1989 94 17895ndash17906 [CrossRef]
Minerals 2019 9 277 33 of 35
106 Wenk HR Deformation of mylonites in Palm Canyon California based on xenolith geometry J StructGeol 1998 20 559ndash571 [CrossRef]
107 Song WJ Ree JH Effect of mica on the grain size of dynamically recrystallized quartz in a quartz-muscovitemylonite J Struct Geol 2007 29 1872ndash1881 [CrossRef]
108 Ebert A Herwegh M Evans B Pfiffner A Austin N Vennemann T Microfabrics in carbonate mylonitesalong a large-scale shear zone (Helvetic Alps) Tectonophysics 2007 444 1ndash26 [CrossRef]
109 Herwegh M Linckens J Ebert A Berger A Brodhag SH The role of second phases for controllingmicrostructural evolution in polymineralic rocks A review J Struct Geol 2011 33 1728ndash1750 [CrossRef]
110 Tullis J Wenk H-R Effect of muscovite on the strength and lattice preferred orientations of experimentallydeformed quartz aggregates Mater Sci Eng A 1994 175 209ndash220 [CrossRef]
111 Canova GR Wenk H-R Molinari A Deformation modeling of multiphase polycrystals Case of aquartz-mica aggregate Acta Metall Mater 1992 40 1519ndash1530 [CrossRef]
112 Vasin R Kern H Lokajicek T Svitek T Lehmann E Mannes DC Chaouche M Wenk H-R Elasticanisotropy of Tambo gneiss from Promontogno Switzerland A comparison of crystal orientation andmicrostructure-based modeling and experimental measurements Geophys J Int 2017 209 1ndash20 [CrossRef]
113 Rutter EH Influence of temperature strain rate and interstitial water in experimental deformation of calciterocks Tectonophysics 1974 22 311ndash334 [CrossRef]
114 De Bresser JHP Spiers CJ Strength characteristics of the r f and c slip systems in calcite Tectonophysics1997 272 1ndash23 [CrossRef]
115 Turner FJ Griggs DT Clark RH Dixon RH Deformation of Yule marble part VII Development oforiented fabrics at 300 Cndash400 C Geol Soc Am Bull 1956 67 1259ndash1294 [CrossRef]
116 Schmid SM Paterson MS Boland JN High temperature flow and dynamic recrystallization in Carraramarble Tectonophysics 1980 65 245ndash280 [CrossRef]
117 De Raadt WS Burlini L Kunze K Spiers CJ Effect of pre-existing crystallographic preferred orientationon the rheology of Carrara marble J Struct Geol 2014 68 44ndash57 [CrossRef]
118 Pieri M Burlini L Kunze K Stretton I Olgaard DL Rheological and microstructural evolution ofCarrara marble with high shear strain Results from high temperature torsion experiments J Struct Geol2001 23 1393ndash1413 [CrossRef]
119 Pieri M Kunze K Burlini L Stretton I Olgaard DL Burg J-P Wenk H-R Texture development ofcalcite by deformation and dynamic recrystallization at 1000 K during torsion experiments of marble to largestrains Tectonophysics 2001 330 119ndash140 [CrossRef]
120 Trommsdorff V Gefuumlgestudien an Calcitmarmor aus Val Prato (Tessin) Schweiz Mineral Petrog Mitt 196444 595ndash611
121 Romeo I Capote R Lunar R Crystallographic preferred orientation and microstructure of a Variscanmarble mylonite in the Ossa-Morena Zone (SW Iberia) J Struct Geol 2007 29 1353ndash1368 [CrossRef]
122 Rutter EH Rusbridge M The effect of non-coaxial strain paths on crystallographic preferred orientationdevelopment in the experimental deformation of a marble Tectonophysics 1977 39 73ndash86 [CrossRef]
123 Schmid SM Panozzo R Bauer S Simple shear experiments on calcite rocks Rheology and microfabricJ Struct Geol 1987 9 747ndash778 [CrossRef]
124 Wenk H-R Takeshita T Bechler E Erskine B Matthies S Pure shear and simple shear calcite texturesComparison of experimental theoretical and natural data J Struct Geol 1987 9 731ndash745 [CrossRef]
125 Trommsdorff V Wenk H-R Die Regelung des Dolomites von Crevola (Simplon) Diskussion und ProblemeSchweiz Mineral Petrog Mitt 1965 45 551ndash569
126 Holyoke III CW Kronenberg AK Newman J Dislocation creep of polycrystalline dolomite Tectonophysics2013 590 72ndash82 [CrossRef]
127 Mainprice DH Paterson MS Experimental studies of the role of water in the plasticity of quartzitesJ Geophys Res 1984 89 4257ndash4296 [CrossRef]
128 Stipp M Tullis J Scherwath M Behrmann JH A new perspective on paleopiezometry Dynamicallyrecrystallized grain size distributions indicate mechanism changes Geology 2010 38 759ndash762 [CrossRef]
129 Cross AJ Prior DJ Stipp M Kidder S The recrystallized grain size piezometer for quartz An EBSD-basedcalibration Geophys Res Lett 2017 44 6667ndash6674 [CrossRef]
Minerals 2019 9 277 34 of 35
130 Gleason GC Tullis J Heidelbach F The role of dynamic recrystallization in the development of latticepreferred orientations in experimentally deformed quartz aggregates J Struct Geol 1993 15 1145ndash1168[CrossRef]
131 Halfpenny A Prior DJ Wheeler J Electron backscatter diffraction analysis to determine the mechanismsthat operated during dynamic recrystallization of quartz-rich rocks J Struct Geol 2012 36 2ndash15 [CrossRef]
132 Hirth G Tullis J Dislocation creep regimes in quartz aggregates J Struct Geol 1992 14 145ndash159[CrossRef]
133 Humphreys FJ Hatherly M Recrystallization and Related Annealing Phenomena Oxford University PressOxford UK 1995
134 Kamb WB Theory of preferred orientation developed by recrystallization under stress J Geol 1959 67153ndash170 [CrossRef]
135 Shimizu I Nonhydrostatic and nonequilibrium thermodynamics of deformable materials J Geophys Res1992 97 4587ndash4597 [CrossRef]
136 Shimizu I Theories and applicability of grain size piezometers The role of dynamic recrystallizationmechanisms J Struct Geol 2008 30 899ndash917 [CrossRef]
137 Jessell MW Simulation of fabric development in recrystallizing aggregates I Description of the modelJ Struct Geol 1988 10 771ndash778 [CrossRef]
138 Jessell MW Simulation of fabric development in recrystallizing aggregates II Example model runs J StructGeol 1988 10 779ndash793 [CrossRef]
139 Wenk H-R Canova G Breacutechet Y Flandin L A deformation-based model for recrystallization ofanisotropic materials Acta Mater 1997 45 3283ndash3296 [CrossRef]
140 Wenk H-R Tomeacute CN Modeling dynamic recrystallization of olivine dynamic in simple shear J GeophysRes 1999 104 25513ndash25527 [CrossRef]
141 Thomas LA Wooster WA PiezocrescencemdashThe growth of Dauphineacute twinning in quartz under stressProc R Soc Lond Math Phys Sci 1951 A 208 43ndash62 [CrossRef]
142 Tullis J Tullis TE Preferred orientation produced by mechanical Dauphineacute twinning Thermodynamicsand axial experiments Am Geophys U Monogr 1972 16 67ndash82 [CrossRef]
143 Minor A Rybacki E Sintubin M Vogel S Wenk H-R Tracking mechanical Dauphineacute twin evolutionwith applied stress in axial compression experiments on a low-grade metamorphic rock J Struct Geol 2018112 81ndash94 [CrossRef]
144 Wenk H-R Barton N Bortolotti M Vogel S Voltolini M Lloyd GE Gonzalez GB Dauphineacute twinningand texture memory in polycrystalline quartz Part 3 Texture memory during phase transformation PhysChem Miner 2009 37 567ndash583 [CrossRef]
145 Menegon L Pennacchioni G Heilbronner R Pittarello L Evolution of quartz microstructure and c-axiscrystallographic preferred orientation within ductilely deformed granitoids (Arolla Unit Western Alps)J Struct Geol 2008 30 1332ndash1347 [CrossRef]
146 Menegon L Piazolo S Pennacchioni G The effect of Dauphineacute twinning on plastic strain in quartzContrib Mineral Petrol 2011 161 635ndash652 [CrossRef]
147 Rahl JM McGrew AJ Fox JA Latham JR Gabrielson T Rhomb-dominated crystallographic preferredorientations in incipiently deformed quartz sandstones A potential paleostress indicator for quartz-richrocks Geology 2018 46 195ndash198 [CrossRef]
148 Heilbronner R Pauli C Integrated spatial and orientation analysis of quartz c-axes by computer-aidedmicroscopy J Struct Geol 1993 15 369ndash382 [CrossRef]
149 Hunter NJR Wilson CJL Luzin V Comparison of quartz crystallographic preferred orientationsidentified with optical fabric analysis electron backscatter and neutron diffraction techniques J Microsc2017 265 169ndash184 [CrossRef]
150 Lutterotti L Vasin R Wenk H-R Rietveld texture analysis from synchrotron diffraction images I Basicanalysis Powder Diffr 2014 29 76ndash84 [CrossRef]
151 Wenk H-R Lutterotti L Kaercher P Kanitpanyacharoen W Miyagi L Vasin R Rietveld texture analysisfrom synchrotron diffraction images II Complex multiphase materials and diamond anvil cell experimentsPowder Diffr 2014 29 220ndash232 [CrossRef]
152 Wenk H-R Standard project for pole figure determination by neutron diffraction J Appl Cryst 1991 24920ndash927 [CrossRef]
Minerals 2019 9 277 35 of 35
153 Ullemeyer K Braun G Dahms M Kruhl JH Olesen NOslash Siegesmund S Texture analysis of amuscovite-bearing quartzite A comparison of some currently used techniques J Struct Geol 2000 221541ndash1557 [CrossRef]
154 Wenk H-R Texture analysis by advanced diffraction methods In Modern Diffraction Methods Mittemeijer EJWelzel U Eds Wiley-VCH Weinheim Germany 2012 pp 173ndash220
copy 2019 by the authors Licensee MDPI Basel Switzerland This article is an open accessarticle distributed under the terms and conditions of the Creative Commons Attribution(CC BY) license (httpcreativecommonsorglicensesby40)
- Introduction
- Samples
- Experimental Methods
-
- Some Remarks on Coordinate Systems and Quartz Crystallography
- Neutron Diffraction
- SEM-EBSD
-
- Results
- Discussion
-
- Quartz Texture Types
- Bergell Quartz Textures
- Polycrystal Plasticity Modeling
- Multiphase Issues
- Textures of Associated Marble
- Dynamic Recrystallization
- Mechanical Dauphineacute Twinning
- Comparison of Methods of Texture Measurements
-
- Conclusions
- References
-

Minerals 2019 9 277 2 of 35
development of mechanical twins in flint deformed in axial compression [20] From a set of polefigures the full orientation distribution function (ODF) for trigonal quartz was obtained with theharmonic method [2122] With advances in electron backscatter diffraction (EBSD) in scanning electronmicroscopes quartz crystal orientations could be determined in small volumes and representedas two-dimensional maps [23] similar to the ldquoAchsenverteilungsanalyserdquo (AVA) of Sander [2] butincluding full crystal orientations An early application to quartz is the study of Kunze et al [24]Another comparably novel toolmdashneutron diffractionmdashbecame available to determine full orientationdistributions on large samples with much better grain statistics than optical measurements or EBSD [25]
The new measurement techniques rely on sophisticated data analysis which was first developedfor cubic metals It became apparent that the harmonic method mentioned above and introducedby Bunge [26] and Roe [27] had limitations because of the omission of odd coefficients in ODFcalculations [28] and new methods were developed such as WIMV [29] ADC [30] and the maximumentropy method [3132] Generalizing analytical methods to include lower than cubic crystal symmetriesintroduces some complications
While many deformation experiments on single crystals to determine deformation mechanismshave been performed on minerals such as calcite dolomite and olivine there is much less informationon quartz [3334] The study of Baeta and Ashbee (1970) [35] is still a landmark Slip systems havebeen identified by TEM observations of dislocations in deformed quartzites or inferred from texturepatterns by comparison with polycrystal plasticity models
Before going into details let us clarify a few terms used in this paper To describe the anisotropicpattern of crystals in deformed rocks drsquoOmalius drsquoHalloy [36] introduced the term ldquotexturerdquo in his1833 textbook Later this was applied more generally to what is known as microstructure Schmidt [1]and Sander [2] introduced the term ldquofabricrdquo (Gefuumlge) which is widely used in structural geology todescribe preferred orientation In materials science ldquotexturerdquo has become synonymous with crystalpreferred orientation (or CPO) and we use all three expressions in this paper since materials scienceand geology have become closely connected
Here we study bulk textures in 47 samples of quartzites from different geologic environments ofthe Bergell region in the Swiss Alps As will become apparent texture patterns are more complex thananticipated yet some significant trends were observed Most studies of preferred orientation in quartzhave focused on a few selected samples In order to address the regional significance and extent of localvariations of quartz textures it was important to investigate many samples With such an approach itwas possible to unravel features that were in many ways unexpected Therefore we present not onlya large number of samples but also for each sample several pole figures not just c-axes and a-axesof quartz
The microstructure of samples was first studied by optical microscopy Preferred orientation wasmeasured with neutron diffraction over many years Selected samples were also investigated withEBSD to explore the role of mechanical Dauphineacute twinning from orientation maps In the discussionwe will try to model observed texture patterns with polycrystal plasticity theory and considerations ofdynamic recrystallization under stress An important factor that was emerging is the significance ofrhombohedral orientations which cannot be inferred from simple c-axis pole figures
2 Samples
The samples were collected in the Bergell Alps (Southern Switzerland and Northern Italy) which isa region of the southeastern Alps extending from the Lake of Como (SW) to the Engadine (NE) Figure 1shows the tectonic units with a sequence of Pennine nappes (Adula Tambo Suretta Avers and Platta)overlain by lower Austrolapine nappes (Margna and Bernina) in the East [37ndash39] These nappes displaya crystalline basement covered by metasedimentary layers Most pronounced are Triassic quartzitesand marbles transformed from sandstones and limestones Into this stack of nappes there was anintrusion of Bergell granite in the South in the Tertiary (~30 My) causing considerable temperaturegradients with metamorphic grade ranging from granulite to greenschist facies
Minerals 2019 9 277 3 of 35
3 of 3
considerable temperature gradients with metamorphic grade ranging from granulite to greenschist facies
Figure 1 Tectonic map of the Bergell Alps based on Montrasio et al [39] Dotted zones are Triassic metasediments where quartzites and marbles were collected Sample locations are indicated If only numbers are given they refer to Brg (Table 1) EL Engadine Line ML Muretto Line TMZ Turba Mylonite Zone FL Forcola Line The coordinate system used in Swiss topographic maps is indicated In the insert an overview is shown with countries (CH Switzerland I Italy A Austria)
Figure 2 Four typical hand specimens of Triassic quartzites They display an excellent foliation and the lineation on the schistosity plane Scale is indicated In samples Brg734 and Brg1241 there is a cylindrical hole from which the neutron diffraction samples were obtained
In conjunction with a tectonic study of this area [40] and an exploration of the metamorphic history [41] samples of quartzite and some associated marbles were collected Of these 39 quartzites eight marbles are displayed and discussed in some detail in the main text Information approximately
Figure 1 Tectonic map of the Bergell Alps based on Montrasio et al [39] Dotted zones are Triassicmetasediments where quartzites and marbles were collected Sample locations are indicated If onlynumbers are given they refer to Brg (Table 1) EL Engadine Line ML Muretto Line TMZ TurbaMylonite Zone FL Forcola Line The coordinate system used in Swiss topographic maps is indicatedIn the insert an overview is shown with countries (CH Switzerland I Italy A Austria)
3 of 3
considerable temperature gradients with metamorphic grade ranging from granulite to greenschist facies
Figure 1 Tectonic map of the Bergell Alps based on Montrasio et al [39] Dotted zones are Triassic metasediments where quartzites and marbles were collected Sample locations are indicated If only numbers are given they refer to Brg (Table 1) EL Engadine Line ML Muretto Line TMZ Turba Mylonite Zone FL Forcola Line The coordinate system used in Swiss topographic maps is indicated In the insert an overview is shown with countries (CH Switzerland I Italy A Austria)
Figure 2 Four typical hand specimens of Triassic quartzites They display an excellent foliation and the lineation on the schistosity plane Scale is indicated In samples Brg734 and Brg1241 there is a cylindrical hole from which the neutron diffraction samples were obtained
In conjunction with a tectonic study of this area [40] and an exploration of the metamorphic history [41] samples of quartzite and some associated marbles were collected Of these 39 quartzites eight marbles are displayed and discussed in some detail in the main text Information approximately
Figure 2 Four typical hand specimens of Triassic quartzites They display an excellent foliation andthe lineation on the schistosity plane Scale is indicated In samples Brg734 and Brg1241 there is acylindrical hole from which the neutron diffraction samples were obtained
In conjunction with a tectonic study of this area [40] and an exploration of the metamorphichistory [41] samples of quartzite and some associated marbles were collected Of these 39 quartziteseight marbles are displayed and discussed in some detail in the main text Information about anothereight quartzite samples is provided in Supplementary Material Quartzite samples can be dividedinto Triassic quartzites (referred to as ldquoTrdquo) transforming during the Tertiary Alpine metamorphismfrom sandstones and quartz layers in crystalline basement (ldquoLrdquo) Sample localities are shown in thetectonic map (Figure 1) and are listed in Table 1 with Swiss coordinates (130ndash150 km SN and 755ndash775km WE) In Table 1 samples in each group are sorted according to sample numbers (first Brg then Sci)This same order will be used for microstructures and pole figures Some hand specimens of Triassicquartzites are shown in Figure 2 They display an excellent foliation and a well-developed lineationwith strong alignment of muscovite platelets Foliation and lineation were used to define a samplecoordinate system to represent crystal preferred orientation
Minerals 2019 9 277 4 of 35
Table 1 List of samples with location Swiss coordinates (in km) and (0001) pole figure maxima(in multiples of a random distribution) as well as texture index J for neutron and EBSD textures The xafter sample number indicates that optical microstructure is displayed in Figures 3 and 4 D indicatesDubna data + in the electron backscatter diffraction (EBSD) column indicates that map is displayed inFigure 11 and that comparison of neutron and EBSD pole figures is shown in Figure 12 Additionalsamples are listed in Table S1
Sample Place CoordNeutron EBSD
0001 J 0001 J
A 24 Triassic quartzites
Brg 568 x Alpascela 77011415 124 55 155 + 103Brg 641 x Val Duana 76331396 24 12 66 + 40Brg 730 Roticcio 769013685 42 18Brg 734 Alpascela 77011411 85 36Brg 752 Bergalga 7629513925 27 14Brg 753 Bergalga 7629513925 20 12
Brg 858 x Cam 7663513755 54 18Brg 980 x Casaccia 77181397 54 20 90 82Brg 981 x Casaccia 77181396 71 32 93 + 53Brg 1102 Casaccia 771813965 69 32Brg 1126 Avers Croet 75731494 36 21 75 + 52
Brg 1127 x Campsut 75611515 34 19 50 + 41Brg 1135 Septimer 76761427 23 12 52 35Brg 1137 Val Turba 76811426 39 19 71 + 42
Brg 1139 x Septimer 76851427 37 19Brg 1235 x Lago di Lei 75591555 51 18Brg 1241 Val Turba 76811431 88 44
Brg 1245 x Plan Vaest 762113515 40 22Brg 1247 Plan Vaest 76211351 29 15Brg 1477 Bugna 760913545 29 10 36 + 19
Brg 1618D x Cavi 76011357 23 15 66 + 32Brg 1643D Duana 764351392 64 27 113 + 55Sci 690 x Innerferrera 75601521 58 27 84 + 51Sci 881 x Pso Turbine 75701360 39 18 39 + 64
B 15 Quartz layers
Brg 407 Tegiola 76251301 211 + 145Brg 412 x Tegiola 762613005 129 45Brg 420 x Caccior 76341349 150 98Brg 603 x Tegiola 762213025 169 119 196 + 221Brg 646 x Tombal 76231353 75 46Brg 767 Caccior 76341351 61 25
Brg 1165 Lavinair Crusc 7725513825 22 12Brg 1167 Lavinair Crusc 7718513825 49 17 93 66
Brg 1520 x Blaunca 77451428 124 53 213 + 221Brg 1524 x Plan di Zoch 773751427 88 44 118 + 85Brg 1527 Orden 77361405 94 60Sci 292 x Tegiola 76341303 292 184 364 269Sci 490 x Albigna 77051363 47 22Sci 514 x V Largh 77121367 43 17Sci 763 Lera drsquoSura 76261320 263 115 517 + 741
C 8 Marbles (do is dolomite)
Brg860 Pass dal Cam 766313755 21 11Brg1101 Casaccia (do) 77171400 16 11Brg1120 Juf 764371463 34 13Brg1143 Alpascela 76971414 22 12Brg1164 Lavinair Crusc 772551382 22 12Brg1166 Lavinair Crusc 771851382 37 17Brg1243 Val Turba 76831428 21 12Brg1244 Val Turba 76831428 31 14
Minerals 2019 9 277 5 of 35
While hand specimens look rather similar there is a wide range of microstructures as illustratedin micrographs of thin sections (Figure 3 for some of the Triassic quartzites and Figure 4 for quartzlayers see also Figures S1 and S2 for a more complete survey) The thin sections were obtained bycutting slabs perpendicular to the foliation and parallel to the lineation The microstructure images areobtained with crossed polarizers and by inserting a ldquogypsum platerdquo to document for many samplesa wide range of crystal orientations (different colors) Figures S1 and S2 show microstructures of allsamples without gypsum plate and simply crossed polars
6 of 6
Figure 3 Optical images of thin sections from selected Triassic quartzites Crossed polarizers gypsum plate inserted to highlight orientation differences Scale indicated at top right For more images with crossed polarizers only see Supplementary Material Figure S1 Order of samples is the same as in Table 1
Figure 3 Optical images of thin sections from selected Triassic quartzites Crossed polarizers gypsumplate inserted to highlight orientation differences Scale indicated at top right For more images withcrossed polarizers only see Supplementary Material Figure S1 Order of samples is the same as inTable 1
Minerals 2019 9 277 6 of 35
Grain size varies from 005 to 1 mm for Triassic quartzites (Figure 3) and 005 to 4 mm for quartzlayers (Figure 4) Grain shapes range from equiaxed (eg Brg980 and Brg1524) to highly flattenedfor mylonitic layers in the vicinity of the granite contact (eg Brg603 Sci490 and Sci514) and alsofor some Triassic quartzites (eg Brg858 Brg1245 and Brg1643) Only a few microstructural imagesdisplay uniform colors (eg Brg412 Brg420 Brg646 and Sci292) indicative of simple c-axis orientationpatterns while most show a wide range of colors suggesting more complex textures
Some higher magnification images without gypsum plate are shown in Figure 5 In many Triassicquartzites quartz contains deformation lamellae (eg Brg1127 and Brg1618) Muscovite plateletsare generally strongly aligned bordering quartz grains (Brg1137 and Brg1139) or quartz includingplatelets (Brg1241) In many samples there is evidence of grain growth during dynamic recrystallizationIn mylonitic quartzites we observe a fine-grained quartz matrix flowing plastically around more rigidfeldspar inclusions (eg Brg412 and Sci292)
The samples described here are available for researchers who want to follow up on our studies toobtain additional information 7 of 7
Figure 4 Optical images of thin sections from selected quartz layers Crossed polarizers gypsum plate inserted to highlight orientation differences Scale indicated at top right For more images with crossed polarizers only see Supplementary Material Figure S2 Order of samples is the same as in Table 1 The large clasts in Brg412 and Sci292 are feldspar
Figure 4 Optical images of thin sections from selected quartz layers Crossed polarizers gypsum plateinserted to highlight orientation differences Scale indicated at top right For more images with crossedpolarizers only see Supplementary Material Figure S2 Order of samples is the same as in Table 1The large clasts in Brg412 and Sci292 are feldspar
Minerals 2019 9 277 7 of 35
8 of 8
Figure 5 Optical images of selected samples at high magnification Crossed polarizers Scale indicated at top right Clasts in Brg412 and Sci292 are plagioclase colored phases are muscovite White arrows in Brg1127 and Brg1618 point to well visible deformation lamellae
3 Experimental Methods
31 Some Remarks on Coordinate Systems and Quartz Crystallography
Most ODF calculations relate a Cartesian right-handed sample coordinate system XYZ to a Cartesian right-handed crystal coordinate system XCYCZC with three rotations defined by Euler angles
In accordance with eg the review of Law (1990) [42] the sample coordinate system XYZ is defined by
Z ǁ pole to the folation s X ǁ lineation l Y ǁ Z x X Quartz in most tectonic environments has trigonal symmetry and is referred to as alpha quartz
The complication is that quartz can exist in a right-handed and left-handed form [4344] According to an extensive comparative study of a large number of quartz single crystals by Frondel [45] both enantiomorphic modifications are equally abundant in nature though local dominance of one enantiomorph may occur Enantiomorphs cannot be resolved with diffraction techniques unless an exeptional experimental setup is used [46] and have not been taken into account in quartz fabric studies Consequently we attributed all investigated quartz to the right-handed spacegroup P3121 (152) while the left-handed spacegroup is P3221(154)
Figure 5 Optical images of selected samples at high magnification Crossed polarizers Scale indicatedat top right Clasts in Brg412 and Sci292 are plagioclase colored phases are muscovite White arrows inBrg1127 and Brg1618 point to well visible deformation lamellae
3 Experimental Methods
31 Some Remarks on Coordinate Systems and Quartz Crystallography
Most ODF calculations relate a Cartesian right-handed sample coordinate system XYZ to aCartesian right-handed crystal coordinate system XCYCZC with three rotations defined by Euler angles
In accordance with eg the review of Law (1990) [42] the sample coordinate system XYZ isdefined by
Z pole to the folation s X lineation l Y Z x XQuartz in most tectonic environments has trigonal symmetry and is referred to as alpha quartz
The complication is that quartz can exist in a right-handed and left-handed form [4344] Accordingto an extensive comparative study of a large number of quartz single crystals by Frondel [45]both enantiomorphic modifications are equally abundant in nature though local dominance of oneenantiomorph may occur Enantiomorphs cannot be resolved with diffraction techniques unless anexeptional experimental setup is used [46] and have not been taken into account in quartz fabric studiesConsequently we attributed all investigated quartz to the right-handed spacegroup P3121 (152) whilethe left-handed spacegroup is P3221(154)
Minerals 2019 9 277 8 of 35
How do we define an orthogonal crystal coordinate system in trigonal quartz Here we followthe definition of Matthies et al [47] which defines the orthogonal crystal coordinate system XCYCZC
relative to trigonal lattice vectors A1 = a = [2110] A3 = c = [0001] asZC A3 YC A3 times A1 XC YC times ZC A1Note that in the literature different conventions are sometimes used for defining XC and YCAnother complication for the texture analysis is that for trigonal quartz pairs of rhombohedral
reflections such as 1011 and 0111 1012 and 0112 or 2021 and 0221 have the same lattice spacings andare completely overlapped in diffraction patterns These reflections are crucial for the determination ofthe trigonal quartz texture The pole figure deconvolution is based on different diffraction intensitiesdue to different structure factors of neutrons or electrons scattered from corresponding crystal latticeplanes [48]
All pole figures (ie Figures 7ndash10) are plotted as equal area projections on the schistosity plane XYwith the X axis NS (lineation l on top) This geometry is different from most studies of quartz preferredorientation It is chosen because it provides least distortion of (0001) pole figures and particularlyin the distinction of positive rhombs 1011 and negative rhombs 0111 relative to the normal tothe schistosity
Pole figures express pole densities in multiples of a uniform distribution (mrd) The texturestrength or sharpness of the ODF of the polycrystalline aggregate can be described with the textureindex J = f2 as defined by Matthies et al 1988 (their Equation (38)) [47]
J = f2equiv
intG
f2(g)dg8π2
integrating squared ODF values f2(g) over the orientation space G
32 Neutron Diffraction
Crystallographic preferred orientation was measured by time-of-flight neutron diffractionSince neutrons have relatively low attenuation by most elements (or isotopes to be more accurate)large samples can be analyzed providing excellent grain statistics compared to more conventionalmethods such as optical measurements with a universal stage petrographic microscope electronbackscatter diffraction (EBSD) with a scanning electron microscope or classical X-ray diffraction with apole figure goniometer Some general aspects of neutron texture measurements will be discussed inSection 58
Most samples were measured with the HIPPO (High Pressure Preferred Orientation) neutrontime-of-flight (TOF) diffractometer at the accelerator-based neutron facility LANSCE Los AlamosNational Laboratory [49] The unique features of HIPPO are high neutron flux (owing to its comparablyshort moderator-to-sample distance of 88 m) and a large array of detectors arranged in several ringsaround the neutron beam direction Cylindrical samples 1 cm in diameter and 1 cm long weremounted on a rod and entered in a sample changer (Figure 6c) A collimated beam of thermal neutrons(wavelengths ~02ndash6 Aring) 1 cm in diameter enters the HIPPO diffractometer and diffraction occurs onthe sample The signal is recorded as TOF spectra by 30 detector panels consisting of 3He detectortubes on 2θ = 40 (19ndash30) 90 (9ndash18) and 150 (1ndash8) banks Figure 6a shows the pole figure coverageby projecting the 30 detectors on a pole figure with the sample cylinder axis in the center It illustratesthat the angular coverage varies considerably between the detector panels (5ndash20) The pole figurecoverage is improved by rotating the sample in four increments about the vertical axis (0 45 675and 90) resulting in 4 times 30 = 120 spectra (Figure 6b) TOF diffraction spectra were recorded for apreset beam monitor count resulting in approximately 40 min Note that in the 15-year period overwhich these samples were measured some details of detectors and coverage scheme have changedThis has been taken into account in data processing and is therefore not described in detail
Minerals 2019 9 277 9 of 35
Figure 6d illustrates a sum of neutron diffraction spectra collected by the 2θ = 90 and 40 detectorsfor Brg981 quartzite Some diffraction peaks are indexed The high angle detector (top) has a muchbetter resolution than the low angle detector (bottom) but the low-angle detector has a much better polefigure coverage and counting statistics (Figure 6a) Figure 6e displays a stack of individual spectra forthe 40 detector bank (bottom are measured spectra) with variations in azimuth expressed from bottomto top Intensity variations as a function of azimuth are indicative of crystal preferred orientation
10 of 10
spectra for the 40deg detector bank (bottom are measured spectra) with variations in azimuth expressed from bottom to top Intensity variations as a function of azimuth are indicative of crystal preferred orientation
Figure 6 Neutron diffraction texture measurements with HIPPO (a) shows the pole figure coverage using 3 detector banks (40deg 90deg and 150deg) The approximate area covered by a single detector is shown on the pole figure in equal area projection (b) Coverage with 4 sample rotations around the vertical axis (0deg 45deg 675deg and 90deg) (c) View of a cylindrical quartzite sample The diameter of the cylinder is 1 cm (d) Diffraction spectrum for the 40deg and 90deg detector banks (dots) and the corresponding Rietveld fit (line) Some diffraction peaks of quartz are indexed (e) Stack of diffraction spectra for one rotation for the 40deg detector Bottom are the experimental data and top is the Rietveld fit Intensity variations correspond to crystal preferred orientation
Samples Brg1618 and Brg1643 were measured on the TOF neutron diffractometer SKAT at beamline 7A2 of the IBR-2 pulsed reactor at the Joint Institute for Nuclear Research (JINR) Dubna Russia [5051] SKAT is characterized by a large beam cross section allowing measurements of samples of ~100 cm3 volume and both samples were spheres of 5 cm diameter resulting in excellent grain statistics The standard setup of the diffractometer including 19 3He detectors with 45rsquo Soller collimators at the same scattering angle 2θ = 90deg has been used The combined thermal and cold moderator for the beamline 7A2 was in operation and this improved neutron counts During measurements samples were rotated in 15deg increments and 24 sample positions were measured to obtain complete experimental pole figures resulting in 24 times 19 = 456 neutron diffraction spectra Measurement time at each sample position was 15 h (36 h total)
Figure 6 Neutron diffraction texture measurements with HIPPO (a) shows the pole figure coverageusing 3 detector banks (40 90 and 150) The approximate area covered by a single detector is shownon the pole figure in equal area projection (b) Coverage with 4 sample rotations around the verticalaxis (0 45 675 and 90) (c) View of a cylindrical quartzite sample The diameter of the cylinder is1 cm (d) Diffraction spectrum for the 40 and 90 detector banks (dots) and the corresponding Rietveldfit (line) Some diffraction peaks of quartz are indexed (e) Stack of diffraction spectra for one rotationfor the 40 detector Bottom are the experimental data and top is the Rietveld fit Intensity variationscorrespond to crystal preferred orientation
Samples Brg1618 and Brg1643 were measured on the TOF neutron diffractometer SKAT at beamline7A2 of the IBR-2 pulsed reactor at the Joint Institute for Nuclear Research (JINR) Dubna Russia [5051]SKAT is characterized by a large beam cross section allowing measurements of samples of ~100 cm3
volume and both samples were spheres of 5 cm diameter resulting in excellent grain statisticsThe standard setup of the diffractometer including 19 3He detectors with 45rsquo Soller collimators at thesame scattering angle 2θ = 90 has been used The combined thermal and cold moderator for thebeamline 7A2 was in operation and this improved neutron counts During measurements samples wererotated in 15 increments and 24 sample positions were measured to obtain complete experimentalpole figures resulting in 24 times 19 = 456 neutron diffraction spectra Measurement time at each sampleposition was 15 h (36 h total)
Minerals 2019 9 277 10 of 35
The 120 neutron TOF diffraction spectra from HIPPO and 456 spectra from SKAT were thenanalyzed with the Rietveld method as implemented in MAUD [52] and described in a tutorial for neutrontime-of-flight texture analysis [25] The refinements rely on the crystal structure of low quartz [53]In the Rietveld procedure instrumental parameters background crystallographic parameters coherentscattering domain sizes and rms microstrains phase fractions where applicable and texture arerefined in consecutive cycles The Rietveld analysis resolved an orientation distribution (OD) with 10
angular resolution in orientation space Figure 6e shows a stack of recorded 40 spectra (bottom) andthe Rietveld fit (top) The good agreement between experimental data and Rietveld fit gives confidencein the refinement The OD was exported from MAUD and further processed in BEARTEX [54] tosmooth (75 Gaussian filter) rotate the sample coordinate system if necessary and to calculate andplot pole figures used as a representation of texture In the case of the two samples measured with thehigher resolution SKAT spectrometer at Dubna lattice parameters were refined for Brg1618 they area = 491005(1) and c = 540041(1) and for Brg1643 a = 491089(1) and c = 540120(1) with standard errorof the last digit in parentheses
Pole figures for Triassic quartzites are shown in Figures 7andashc and S3 for layered quartz inFigure 8ab for muscovite in some samples in Figure 9 and for some adjacent Triassic marbles inFigure 10 Quantitative information about (0001) pole figure maxima and the texture index J aresummarized in Table 1 Note that to refine the texture of monoclinic muscovite the first monoclinicsetting with [001] as 2-fold axis has to be used [55] In this setting the cleavage plane is (100)In Figure 9 labels correspond to the second setting which is more common in mineralogy with (001) ascleavage plane
33 SEM-EBSD
Selected samples were also measured by backscatter electron diffraction (EBSD) with a scanningelectron microscope (SEM) particularly to explore the importance of mechanical Dauphineacute twinningEBSD data were collected at the Department of Earth and Planetary Science at the University ofCalifornia Berkeley using a Zeiss EVO MA10 SEM an EDAX Digiview IV high resolution detectorand TSL Orientation Imaging Microscopy (OIM) software Diffraction images were first reduced andanalyzed with OIM and then orientation data were exported and processed with the routine MAPTEXin BEARTEX [54] Samples were prepared using standard petrographic techniques with a final highpolish achieved with colloidal silica All EBSD samples were uncoated and SEM vacuum was set to10 Pascal variable pressure to reduce charging SEM beam voltages and current varied from 15 to25 kV and 2 to 3 nA respectively but for high resolution data on finely crystalline areas settings of15 kV and 2 nA were most appropriate The 2 times 2 binning with long exposure times of plusmn1 framesecproduced best results Pole figures were derived from large numbers of individual orientation datacollected across the sample (commonly 20000ndash150000 points per scan) For each point the full crystalorientation (decribed by Euler angles) was determined and these individual orientations were thenentered into a 5 times 5 times 5 orientation space in BEARTEX without relying on harmonic functionsData from 3 to 4 scans were combined and orientation distributions were then rotated to agree with theneutron diffraction pole figures
Some characteristic EBSD maps are shown in Figure 11 The third Euler angle (ϕ2 in Bungenotation) which for trigonal quartz is within the 0 to 120 interval is used for color identificationbecause it is sensitive to Dauphineacute twinning Dauphineacute twins are related to the host by a 180
(equivalent to 60 for trigonal quartz) around the c-axis (the c-axis orientation is defined by the firsttwo Euler angles ϕ1 and Φ) Dauphineacute twin boundaries are highlighted with yellow lines in themaps Some information about the scans is summarized in Table 2 (see also Supplementary MaterialTable S2)
Minerals 2019 9 277 11 of 35
12 of 12
Figure 7 Cont
Minerals 2019 9 277 12 of 35
13 of 13
Figure 7 Cont
Minerals 2019 9 277 13 of 35
14 of 14
Figure 7 Neutron pole figures for quartz of Triassic quartzites Equal area projection on the schistosity plane Lineation is l Numbers on top right of pole figures indicate which pole density scale was used (in mrd) The scale in the second column was also applied to Columns 2ndash5 The order of samples is the same as in Table 1 24 Triassic quartzites are divided on three figures (a) (b) (c)
Figure 7 Neutron pole figures for quartz of Triassic quartzites Equal area projection on the schistosityplane Lineation is l Numbers on top right of pole figures indicate which pole density scale was used(in mrd) The scale in the second column was also applied to Columns 2ndash5 The order of samples is thesame as in Table 1 24 Triassic quartzites are divided on three figures (a) (b) (c)
Minerals 2019 9 277 14 of 35
15 of 15
Figure 8 Cont
Minerals 2019 9 277 15 of 3516 of 16
Figure 8 Neutron pole figures for quartz layers Equal area projection on the schistosity plane Lineation is l Numbers on top right of pole figures indicate which pole density scale was used (in mrd) The scale in the second column was also applied to Columns 2ndash5 The order of samples is the same as in Table 1 The 14 samples are divided into two figures (a) and (b)
Figure 8 Neutron pole figures for quartz layers Equal area projection on the schistosity planeLineation is l Numbers on top right of pole figures indicate which pole density scale was used (in mrd)The scale in the second column was also applied to Columns 2ndash5 The order of samples is the same asin Table 1 The 14 samples are divided into two figures (a) and (b)
Minerals 2019 9 277 16 of 35
17 of 17
Figure 9 Neutron pole figures 001 and 010 of muscovite in Triassic quartzites Equal area projection on the schistosity plane Lineation is l Numbers on top left of pole figures indicate the pole density scale that was used (in mrd) Next to the sample numbers are volume and maximum of the 001 texture peak D after sample number indicates Dubna neutron data
Figure 10 Neutron pole figures 0001 of calcite and dolomite in Triassic marbles Equal area projection on the schistosity plane Lineation is l All samples are calcite except Brg1101 which is dolomite
Figure 9 Neutron pole figures 001 and 010 of muscovite in Triassic quartzites Equal area projection onthe schistosity plane Lineation is l Numbers on top left of pole figures indicate the pole density scalethat was used (in mrd) Next to the sample numbers are volume and maximum of the 001 texturepeak D after sample number indicates Dubna neutron data
17 of 17
Figure 9 Neutron pole figures 001 and 010 of muscovite in Triassic quartzites Equal area projection on the schistosity plane Lineation is l Numbers on top left of pole figures indicate the pole density scale that was used (in mrd) Next to the sample numbers are volume and maximum of the 001 texture peak D after sample number indicates Dubna neutron data
Figure 10 Neutron pole figures 0001 of calcite and dolomite in Triassic marbles Equal area projection on the schistosity plane Lineation is l All samples are calcite except Brg1101 which is dolomite
Figure 10 Neutron pole figures 0001 of calcite and dolomite in Triassic marbles Equal area projectionon the schistosity plane Lineation is l All samples are calcite except Brg1101 which is dolomite
Table 2 EBSD twin boundary statistics See also Table S2 The data in the table are obtained from thesum over individual scans Selected data and twin boundaries are in pixels
Sample Area (mm2) Selected Data (K) Twin Boundaries (K) Inverse Ratio 10minus2
A Triassic Quartzites
Brg568 2 586 16 26Brg641 3 844 7 08Brg980 4 629 10 16Brg981 3 730 14 20Brg1126 2 1540 24 16Brg1127 2 1116 11 10Brg1135 3 597 17 28Brg1137 2 407 22 54Brg1477 3 614 9 15
Minerals 2019 9 277 17 of 35
Table 2 Cont
Sample Area (mm2) Selected Data (K) Twin Boundaries (K) Inverse Ratio 10minus2
A Triassic Quartzites
Brg1618 5 1257 31 24Brg1643 4 2628 20 08Sci638 5 756 30 39Sci690 3 583 8 14Sci881 4 1113 37 33
B Quartz Layers
Brg407 1 670 7 10Brg603 2 560 10 19Brg1167 4 1383 16 11Brg1520 3 729 3 04Brg1524 2 818 10 12Sci292 13 550 2 03Sci763 3 827 7 08
C Comparison (see paragraph 57 below)
Br-undef-B 4 331 5 14Br-300-A 4 730 17 24
Br3-A-500MPa 1 114 2 17 19 of 19
Figure 11 Selected EBSD maps with Dauphineacute twin boundaries (yellow) Colors shown on top right are based on Euler angle φ2 that is sensitive to twinning T is for Triassic quartzites and L is for quartz layers White are regions that could not be indexed and correspond mainly to muscovite Scale bars are 100 microm
4 Results
The most simple patterns are pole figures for muscovite in Triassic quartzites with a strong (001) maximum perpendicular to the foliation (265 mrd for Brg1247 and 249 mrd for Brg1477) and a more or less random distribution of (010) poles in the foliation plane for most samples (Figure 9) An exception is Brg1135 with a very weak texture (15 mrd) and also a small volume fraction of muscovite (5)
The pole figures patterns for quartz have been divided into two groups Triassic quartzites (Figure 7andashc) and quartz layers in crystalline basement (Figure 8ab) As will become apparent in the discussion below the large number of samples from a wide area is necessary to assess overall texture patterns and local variations
Figure 11 Selected EBSD maps with Dauphineacute twin boundaries (yellow) Colors shown on top rightare based on Euler angle ϕ2 that is sensitive to twinning T is for Triassic quartzites and L is for quartzlayers White are regions that could not be indexed and correspond mainly to muscovite Scale bars are100 microm
Minerals 2019 9 277 18 of 35
4 Results
The most simple patterns are pole figures for muscovite in Triassic quartzites with a strong (001)maximum perpendicular to the foliation (265 mrd for Brg1247 and 249 mrd for Brg1477) and a more orless random distribution of (010) poles in the foliation plane for most samples (Figure 9) An exceptionis Brg1135 with a very weak texture (15 mrd) and also a small volume fraction of muscovite (5)
The pole figures patterns for quartz have been divided into two groups Triassic quartzites(Figure 7andashc) and quartz layers in crystalline basement (Figure 8ab) As will become apparent in thediscussion below the large number of samples from a wide area is necessary to assess overall texturepatterns and local variations
For Triassic quartzites there is generally a concentration of c-axes at high angles to the foliation Z(center of the pole figure) in a few samples as a single maximum often slightly asymmetric (eg Brg568Brg734 Brg858 Brg1137 Brg1235 and Sci690) In many samples the distribution is more complex witha ZY-girdle developing around the pole to the foliation Z (eg Brg730 Brg1126 Brg1127 and Brg1139)in some cases with a well-defined double maximum (Brg641 Brg753 Brg980 Brg1245 Brg1618 andSci881) In order to better visualize these distortions of the c-axis orientation patterns we chose thisunconventional representation projecting pole figures on the schistosity plane
There is generally a concentration of 1010 poles parallel to the lineation l = X such as Brg641Brg730 Brg858 Brg1126 and Brg1235 A very distinct pattern is observed in 1011 pole figures with amaximum perpendicular to the foliation (center of the pole figures) and two maxima in the foliationplane generally oblique to the lineation 0111 pole figures often have a minimum perpendicular tothe foliation Typical examples are Brg752 Brg753 Brg1139 Brg1245 Brg1477 Brg1618 and Sci881but most samples show a similar trend including samples only presented in Supplementary Material(Table S1 and Figure S3)
Maximum orientation densities vary greatly from sample to sample as summarized in Table 1The highest (0001) pole densities are observed for Brg568 (124 mrd J = 55) Brg734 (85 mrd J = 36)and Brg1241 (88 mrd J = 44) and relatively low ones for Brg753 (20 mrd) Brg1135 (23 mrd) andBrg1618 (23 mrd)
Pole figures from quartz layers are entirely different (Figure 8ab) Most have a strong (0001)maximum in the foliation plane at Y perpendicular to the macroscopic lineation X (eg Brg420 Brg603Brg646 Brg1167 Sci292 and Sci763) Often there is a slight girdle distribution perpendicularto the lineation (eg Brg646 Brg1165 and Brg1167) Pole densities for (0001) are very high(eg Brg603-169 mrd J = 119 Sci292-292 mrd J = 184 and Sci763-263 mrd J = 115) resembling asingle crystal even though these samples are very fine-grained (Figure 4) Correspondingly other polefigures also have single crystal like orientation patterns eg 1010 and 1120 pole figures have sixcharacteristic maxima in the XZ plane (three are plotted on pole figures and three are symmetricallydistributed in the lower hemisphere) There are exceptions such as Sci490 and Sci514 with large grainsize and close to the contact with the Tertiary Bergell granite Here textures are complex asymmetricand quite weak This will be discussed later Also in quartz layer textures there is a prevalence of 1011maxima perpendicular to the schistosity plane and corresponding 0111 minima (Brg412 Brg420Brg1520 and Brg1524)
EBSD analyses were performed on 21 samples and on each sample 3ndash4 areas were scanned(Tables 1 and 2 and Supplementary Material Table S2) Some selected scan maps are shown in Figure 11The different scans for each sample were combined for texture analysis The white regions on the mapsdisplay mainly muscovite that was not taken into account in the EBSD analysis The maps documentconsiderable variation in grain size in accordance with optical images (Figures 3 and 4) Some sampleshave high aspect ratios of the grain shape such as Brg407 Brg603 and Brg1520 but in most samplesgrains are fairly equiaxed On orientation maps Dauphineacute twin boundaries corresponding to a 60
(180) rotation around [0001] were identified with the subroutine MAPTEX in BEARTEX and thetwin boundaries are plotted as yellow lines on the maps Some scans display many twins (such asBrg1137 and Sci881) while other ones are almost free of twins (eg Brg641 Brg1643 Sci292 and Sci763)
Minerals 2019 9 277 19 of 35
The twin boundary frequency has been quantified by dividing the total length of twin boundaries bythe total scanned area This ldquotwin boundary densityrdquo in Table 2 shows a wide range from 49 times 10minus3
(most) to 03 times 10minus3 (least) Overall Triassic quartzites have more twin boundaries than quartz layersCrystal orientation patterns observed by EBSD were rotated to bring them into the same orientation
as pole figures measured by neutron diffraction Figure 12 compares some (0001) and 1011 polefigures obtained with the two methods (see also Supplementary Material Figures S4 and S5 for a morecomplete comparison) There is excellent agreement in texture patterns A comparison of texturemaxima in pole figures reveals that EBSD pole figures have slightly sharper textures than neutron polefigures (Table 1) We will elaborate on differences between the two methods in the discussion
21 of 21
neutron pole figures (Table 1) We will elaborate on differences between the two methods in the discussion
Adjacent to Triassic quartzites (transformed from sandstones) are calcite and dolomite marbles (transformed from Triassic limestones) Figure 10 shows some of the pole figures from marble samples Overall there is a (0001) maximum perpendicular to the foliation but this can be asymmetric (eg Brg860 and Brg1244) relative to the schistosity plane and lineation which can vary over small distances (eg Brg1164 and Brg1166 and Brg1243 and Brg1244) The strength of preferred orientation ranges from 18 mrd to 3 mrd for (0001) maxima (Table 1)
Figure 12 Comparison of selected EBSD and neutron pole figures 0001 and 1011 (for a complete display see Supplementary Material Figures S4 and S5) Equal area projection on the schistosity plane
Figure 12 Comparison of selected EBSD and neutron pole figures 0001 and 1011 (for a completedisplay see Supplementary Material Figures S4 and S5) Equal area projection on the schistosity planeLineation is l Numbers on top right of pole figures indicate which pole density scale was used (in mrd)
Minerals 2019 9 277 20 of 35
Adjacent to Triassic quartzites (transformed from sandstones) are calcite and dolomite marbles(transformed from Triassic limestones) Figure 10 shows some of the pole figures from marblesamples Overall there is a (0001) maximum perpendicular to the foliation but this can be asymmetric(eg Brg860 and Brg1244) relative to the schistosity plane and lineation which can vary over smalldistances (eg Brg1164 and Brg1166 and Brg1243 and Brg1244) The strength of preferred orientationranges from 18 mrd to 3 mrd for (0001) maxima (Table 1)
5 Discussion
51 Quartz Texture Types
The 47 quartzite samples collected over a large area in the Southern Alps display consistentpatterns of preferred orientation In metamorphic sandstones c-axes are oriented at high angles to thefoliation plane 1010 poles with a maximum parallel to the lineation and poles to r = 1011 witha concentration perpendicular to the foliation In quartz layers from the crystalline basement themost common pattern is c-axes in the foliation plane and perpendicular to the lineation Also here1010 poles have a maximum parallel to the lineation but there is more diversity especially in layersclose to the contact with the Bergell granite Given that these samples originate from an area coveringaround 400 km2 it was really surprising that texture patterns could be divided into two distinct groupsTriassic metasedimentary quartzites (Figure 7) and layers of quartz in schists and gneisses (Figure 8)both of comparable metamorphic grade and existing in close proximity
Looking at c-axes alone the patterns described in the literature (first by Sander 1950 [2]) can bedivided into four basic types in a sample coordinate system XYZ with X as lineation and Z normal tothe foliation Type A with a simple maximum sometimes asymmetric at Z (Figure 13A) Type B a ZYgirdle or crossed girdle (Figure 13B) Type C a small circle girdle around Z (Figure 13C) and Type D asimple maximum at Y (Figure 13D) Figure 13a uses the projection geometry applied in this paper andFigure 13b the more common projection geometry used in the literature As was mentioned earlierthe geometry in Figure 13a is optimal to display complexities in distributions for (0001) and 1011pole figures
22 of 22
Lineation is l Numbers on top right of pole figures indicate which pole density scale was used (in mrd)
5 Discussion
51 Quartz Texture Types
The 47 quartzite samples collected over a large area in the Southern Alps display consistent patterns of preferred orientation In metamorphic sandstones c-axes are oriented at high angles to the foliation plane 1010 poles with a maximum parallel to the lineation and poles to r = 1011 with a concentration perpendicular to the foliation In quartz layers from the crystalline basement the most common pattern is c-axes in the foliation plane and perpendicular to the lineation Also here 1010 poles have a maximum parallel to the lineation but there is more diversity especially in layers close to the contact with the Bergell granite Given that these samples originate from an area covering around 400 km2 it was really surprising that texture patterns could be divided into two distinct groups Triassic metasedimentary quartzites (Figure 7) and layers of quartz in schists and gneisses (Figure 8) both of comparable metamorphic grade and existing in close proximity
Looking at c-axes alone the patterns described in the literature (first by Sander 1950 [2]) can be divided into four basic types in a sample coordinate system XYZ with X as lineation and Z normal to the foliation Type A with a simple maximum sometimes asymmetric at Z (Figure 13A) Type B a ZY girdle or crossed girdle (Figure 13B) Type C a small circle girdle around Z (Figure 13C) and Type D a simple maximum at Y (Figure 13D) Figure 13a uses the projection geometry applied in this paper and Figure 13b the more common projection geometry used in the literature As was mentioned earlier the geometry in Figure 13a is optimal to display complexities in distributions for (0001) and 1011 pole figures
Figure 13 Schematic of quartz c-axis texture types relative to sample coordinates X Y and Z (a) Projection on the foliation plane XY used in this paper X is the lineation l A c axes perpendicular to foliation B crossed girdle C c-axis small circle girdle and D c-axis maximum at Y (b) More conventional projection on the plane XZ defined by the normal to the foliation s and the lineation l
In deformation experiments at relatively low temperature Type A was generally observed with a maximum of c-axes in the compression direction This was attributed to dominant basal slip as deformation mechanism [56] At these conditions grains are highly flattened At higher temperature and significant recrystallization this pattern transformed to a small circle of c-axes about the compression direction (Type C) This was confirmed in experiments near the brittle-ductile transition
Figure 13 Schematic of quartz c-axis texture types relative to sample coordinates X Y and Z(a) Projection on the foliation plane XY used in this paper X is the lineation l A c axes perpendicularto foliation B crossed girdle C c-axis small circle girdle and D c-axis maximum at Y (b) Moreconventional projection on the plane XZ defined by the normal to the foliation s and the lineation l
Minerals 2019 9 277 21 of 35
In deformation experiments at relatively low temperature Type A was generally observedwith a maximum of c-axes in the compression direction This was attributed to dominant basal slip asdeformation mechanism [56] At these conditions grains are highly flattened At higher temperatureand significant recrystallization this pattern transformed to a small circle of c-axes about the compressiondirection (Type C) This was confirmed in experiments near the brittle-ductile transition [57] In planestrainpure shear with compression along Z and extension along X the (0001) maximum transformsinto Type B with a YZ girdle [58] In simple shear the c-maximum becomes asymmetric and is centeredagainst the sense of shear [59]
In natural quartz fabrics at low metamorphic grade Type A fabrics were described [6061] as well asgirdle-type B fabrics [12] A transition of a crossed girdle (Type B) transforming with increasingtemperature into a small circle (Type C) was first described by Behr [3ndash5] for the Saxony granuliteterrain and elaborated by Lister and Dornsiepen [6] The Type C small circle girdle was also observedin amphibolite quartzites in the Central Alps [62] A transition from a girdle fabric (Type B) to aY maximum (Type D) with increasing metamorphic grade was described in quartz layers from theSimplon area in the Alps [14] A study of schists in the Annapurna region of Nepal revealed atransition from a c-maximum in Z (Type A) to a cross girdle (Type B) and finally to a Y maximum(Type D) with increasing grade [15] Many samples with D-type fabrics underwent recrystallizationand display equiaxed grain shapes A transition from a Z-maximum (Type A) to a YZ girdle (Type B)was documented in MontaltoItaly quartzites [63] as well as in Mt IsaAustralia gneisses [64]
The conspicuous Y maximum (Type D) appears strongly linked to mylonitic deformation andrecrystallization at high temperature for example in amphibolite facies mylonites from the SwedishCaledonites [64] Galicia and Saxony granulites [65] and in the Pyrenees [66] A transition fromthe small circle fabric (Type C) to the Y maximum type with increasing metamorphic grade andrecrystallization was documented for the Ryoke beltJapan [67] and for ultrahigh pressure gneissin Norway [68] and attributed to a transition from basal to prismatic slip Other reports of type Dfabrics in mylonites are from the Moine thrust in Scotland [6970] the Santa Rosa mylonite zone inCalifornia [48] deformed Adamello tonalities [7172] and sheared quartz layers from the southernSimplon area in the Italian Alps [14] In all these cases quartz textures are very strong and fabricsare recrystallized
The asymmetry of c-axis textures relative to fabric coordinates especially the Type A texturewith a maximum near Z has been attributed to simple shear [76673ndash82] Lister and Williams [83]discussed the relationship between texture asymmetry and sense of shear in detail and there has beenconsiderable ambiguity In most cases the c-maximum near Z is displaced against the sense of shearThis interpretation is based on experiments [588485] and polycrystal plasticity deformation modelsassuming dislocation glide [7886ndash88]
52 Bergell Quartz Textures
After this brief overview of some significant studies of natural quartz textures let us return toBergell quartzites and put them into this context It should be emphasized again that most of olderstudies focus on c-axis distributions with a few exceptions taking the trigonal symmetry of quartz intoaccount [22486588] In most of the Bergell quartzites there is a significant difference between positiverhombs 1011 which are elastically soft directions and negative rhombs 0111 that are approximatelytwice as stiff [89] This difference in rhombohedral distributions is observed in most of the pole figuresin Figures 7 and 8
Of the Bergell quartz layer samples four are true mylonites (Brg407 Brg412 Brg603 Sci292) withhighly flattened fine-grained quartz (~100micromtimes 10microm) warping around feldspar clasts (Figures 4 and 5)The Type D texture resembles a single crystal and is similar to those observed in Santa Rosa [48]In the Bergell Alps these samples are from the deepest tectonic level Gruf migmatites underneaththe Northern limb of the Tertiary Bergell granite and are subjected to amphibolitegranulite faciesmetamorphism Other samples of quartz layers in the vicinity of the Bergell granite contact also
Minerals 2019 9 277 22 of 35
approach a single crystal texture but the orientation is more asymmetric relative to the foliation andlineation Quartz is also highly deformed and partially recrystallized (Brg1165 Sci490 and Sci514)Interestingly the high-grade mylonitic Type D textures (Figure 8ab) are not too different from those inquartz layers in the upper nappes of lower metamorphic grade such as Brg646 (Tambo nappe) andBrg1167 (Suretta nappe) Were these textures inherited from a previous igneous event They are allin the vicinity of older Hercinian granites Three samples from the basement of higher Austroalpinenappes have a more complex pattern that also may be attributed to an older deformation process(Brg1520 Brg1524 and Brg1527)
For a majority of quartz layers textures display a 1010 maximum in the lineation directionExceptions are Sci292 and Sci763 with a 1120 maximum Also often there is a 1011 maximumperpendicular to the foliation
Next we have a closer look at metamorphosed Triassic quartzites They all form coherent layerson top of Paleozoic metamorphic rocks in a stack of nappes from the low Pennine Tambo nappe to thehigh Austroalpine Margna nappe All samples have an excellent foliation (Figure 2) defined by highlyoriented muscovite (Figure 9) On cleavage surfaces a good lineation is generally visible Contrary toquartz layers preferred orientation is much weaker ranging for (0001) from 2 to 12 mrd (Table 1)The microstructure displays fairly equiaxed grains for most samples A few have higher aspect ratiosup to 51 (eg Brg568 Brg1127 Brg1137 Brg1241 and Sci881 see Figure 3) Some samples display arelatively simple c-axis maximum perpendicular to the foliation (Brg568 Brg734 Brg858) (Type A) butfor most this maximum is fairly asymmetric splitting into double maxima and a crossed girdle YZ(Type B) (Figure 7andashc)
Some quartzites display abundant deformation lamellae (eg Brg1127 and Brg1618 highlightedby arrows in Figure 5) Such lamellae have first been mentioned by Sander 1950 (his Figure 41) [2] andlater were investigated in detail [90ndash96] and have been attributed to low temperature deformationassociated with dislocation activity The lamellar structures are particularly abundant during shockdeformation [97ndash101] It is likely that basal slip (0001)lt1120gt has been an active slip system in samplesshowing deformation lamellae [91ndash94]
There is overall an alignment of 1010 and in some cases 1120 parallel to the lineation (Figure 7andashc)While c-axis distributions can be quite variable there is a persistent pattern in 1011 pole figureswith a maximum perpendicular to the foliation (Z) (good examples are Brg752 Brg1102 Brg1139Brg1245 Brg1477 Brg1618 and Sci881) This could be conceivably due to mechanical Dauphineacutetwinning [20102] but EBSD observations show that twin boundaries still exist and these twins didnot propagate through the crystal under an applied stress Note that Dauphineacute twinning would haveno effect on c-axis and a-axis distributions and the accommodated plastic strain is minimal Anotherreason for the difference between (1011) and (0111) pole figures could be deformation on rhombohedralslip systems as explained below
53 Polycrystal Plasticity Modeling
Polycrystal plasticity modeling of quartz was initiated by applying the Taylor theory focusing onbasal and prismatic slip in axial deformation [8687] and in simple shear [83] Later the viscoplasticself-consistent theory VPSC [103104] was applied to quartz [78105] Morales et al [88] conducted asystematic study applying VPSC to model texture patterns of quartz polycrystals deformed in axialcompression and in simple shear for a wide range of slip systems including basal prismatic andrhombohedral For basal (c)ltagt slip a [0001] maximum develops parallel to the compression direction(Type A) For prismatic mltagt slip a c-maximum in Y develops in simple shear at high strain (Type D)
Here we have applied VPSC to explore if observed texture patterns in our natural quartzites canbe explained with deformation by dislocation glide For this we used the Los Alamos VPSC6 code [104]Initially 2000 randomly oriented ellipsoidal grains rotate during deformation by slip in an anisotropicviscous medium representing the average of all grains and being updated at each deformation stepIt is assumed that the stress exponent for the slip systems is 3 corresponding to creep conditions
Minerals 2019 9 277 23 of 35
No work-hardening of slip systems was applied The grain shapes were updated up to a ratio of 51The aggregate was deformed to an equivalent strain of 05 and 10 in 50 and 100 steps correspondingly
In Figure 14 we show results for three conditions Many others were explored Model 1 assumesplane strainpure shear with extension along X and compression along Z Critical shear stress (CRSS)for the (0001)lt1120gt (cltagt) system is 2 for the 1011lt1210gt (rltagt) system is 1 and for 1011lt1123gt
(rltpgt) is 4 Average slip activities after 50 steps are 16 for cltagt 42 for rltagt and 22 forrltpgt The resulting pole figures (Figure 14a) show a split maximumgirdle of (0001) around Z a 1010maximum at X and oblique concentrations for 1011 The pattern is very similar to many Triassicquartzite textures including Brg752 Brg1139 and Brg1245 (Figure 7) Increasing the CRSS for 1011slip increases c-slip and creates a simple maximum in Z Increasing the CRSS for (0001) opens the(0001) girdle with maxima closer to Y as observed in Brg1618 and Brg1643 (Figure 7c)
Model 2 attempts to generate a texture with a (0001) maximum at Y This can be obtained again inpure shear with compression along Z and extension along X and an active slip system 1010lt1210gt
(mltagt) with CRSS equal to 10 (Figure 14b) Only mltagt is active after 50 and 100 steps The patternwith a (0001) maximum at Y and a 1010 maximum at X resembles textures in high grade mylonitessuch as Brg412 Brg603 and Sci292 (Figure 8) Microstructures indicate recrystallization but this maynot change the overall texture pattern greatly as will be discussed below
Model 3 reproduces simple shear conditions described by Morales et al 2014 (their Figure 15atop right) [88] to generate a texture with a maximum in Y The active slip system is again 1010lt1210gt
(mltagt) with CRSS equal to 10 (Figure 14c) Also in simple shear only mltagt slip is activeThe resulting pattern is again a (0001) maximum at Y which compared with pure shear developsonly at high strain The 1010 maximum is rotated relative to the pure shear texture We expect thatin natural mylonites there is generally a dominance of plane strain with a variation in pure shearand simple shear as documented from xenolith geometry in Palm Canyon mylonites [106] Note thatModels 2 and 3 predict very similar orientations of (1011) and (0111) planes which is not surprisingsince rhombohedral slip systems are not significantly active (and were assigned high CRSS values)
Only three model results are shown in Figure 14 and they show good agreement with some ofthe natural quartz textures Similar fits could be obtained for most samples by slightly modifying therelative critical shear stresses of active slip systems (ie the balance between basal rhombohedraland prismatic slip) and the applied strain geometry (such as plane strain versus shortening pureshear versus simple shear in plane strain) It appears that for most quartzites plane strain dominatesexcept for some Triassic quartzites where shortening may dominate ((0001) maximum perpendicularto schistosity) Also for Triassic quartzites the overall strain is moderate (~05) while for myloniticquartzites it is considerably higher
54 Multiphase Issues
In all Triassic quartzite samples with significant mica content muscovite displays a very simplesymmetrical pattern with a (001) maximum perpendicular to the cleavagefoliation plane and noevidence for lineation (Figure 9) Muscovite content ranges from 3 (Brg1643) to 27 (Brg1247) andfor most quartzites (except Brg1135) muscovite textures are very strong (10 mrd to 18 mrd) Generallymuscovite platelets grew during recrystallization with not much evidence for bending or kinking(eg Figure 5) Why are quartz textures with significant muscovite content weak compared with quartzlayers which are almost monomineralic Muscovite locally shields stress and effectively decreases theefficiency of recovery-controlled dislocation motions as documented by experiments [107ndash110] andplasticity models that take local grain interaction into account [111] Also muscovite inhibits grainboundary motion during dynamic recrystallization The texture of Triassic quartzites is similar to thatdocumented in underlying muscovite gneiss from the Tambo nappe that transformed from old granitewith also very strong muscovite texture (100 mrd) and a much weaker quartz texture (17 mrd) [112]
Minerals 2019 9 277 24 of 35
55 Textures of Associated Marble
Triassic quartzites are overlain by marble (metamorphic limestone ldquoMuschelkalkrdquo) that ismechanically much weaker and may absorb much of the strain often with local heterogeneities asexpressed in calcite and dolomite pole figures (Figure 10) Optical microstructures of most marblesamples display intense mechanical twinning and this appears to be a major mechanism at relativelylow temperature [113114] The (0001) maximum at high angles to the foliation plane is consistent withobservations on Yule marble [115] and Carrara marble [116ndash119] both in natural samples and duringdeformation experiments in various geometries Similar textures are also observed in marbles from theAlps [120] and the Pyrenees [121] The asymmetry of the calcite fabric has been investigated in detailin experiments [122123] and by modeling [124] and can be attributed to a simple shear componentOne sample of Triassic dolomite from Casaccia (Brg1101) displays a relatively weak texture and also amaximum perpendicular to the foliation (Figure 10) A similar pattern was observed in other Alpinedolomites [125] and in the deformation experiments [126] The observations suggests that marbleadjacent to Triassic quartzite in the Bergell area is strongly deformed with an often asymmetric pattern
26 of 26
from the Alps [120] and the Pyrenees [121] The asymmetry of the calcite fabric has been investigated in detail in experiments [122123] and by modeling [124] and can be attributed to a simple shear component One sample of Triassic dolomite from Casaccia (Brg1101) displays a relatively weak texture and also a maximum perpendicular to the foliation (Figure 10) A similar pattern was observed in other Alpine dolomites [125] and in the deformation experiments [126] The observations suggests that marble adjacent to Triassic quartzite in the Bergell area is strongly deformed with an often asymmetric pattern
Figure 14 Viscoplastic self-consistent VPSC modeling of quartz textures (a) Pure shear Z compression X extension equivalent strain 05 basal (0001)lt2110gt (cltagt) and rhombohedral slip
1011lt1210gt (rltagt) (b) Pure shear Z compression X extension equivalent strain 10 prismatic slip 1010lt1210gt (mltagt) (c) XZ plane strain simple shear X shear direction equivalent strain 10 and prismatic slip 1010lt1210gt Equal area projection
56 Dynamic Recrystallization
Another aspect of quartz texture formation is dynamic recrystallization for which there is ample evidence in microstructures with grain growth of individual crystals (eg Brg1241) to an ideal mosaic microstructure (eg Brg1524) (Figures 3ndash5) Axial compression experiments with recrystallization observed a transition from a c-axis maximum parallel to the compression (Type A) to a small circle girdle (Type C) [57] and simple shear experiments a transition from Type A to a XY girdle (Type B) and ultimately to a Y maximum [8485] Experiments also established that trace water content has a significant impact on recrystallization [72127ndash132]
Interpretation of grain growth in a stressndashstrain environment is complex [132133] It has been approached with thermodynamics and is fairly straightforward for materials which are elastically highly anisotropic such as mica [134ndash136] For quartz in compression one would expect alignment of the soft direction 1011 parallel to the compression direction with a small circle girdle of c-axes due to the symmetry of elastic properties [89] A weak 1011 maximum perpendicular to the foliation (Z) is actually observed in many Triassic samples (Figure 7)
Figure 14 Viscoplastic self-consistent VPSC modeling of quartz textures (a) Pure shear Z compressionX extension equivalent strain 05 basal (0001)lt2110gt (cltagt) and rhombohedral slip 1011lt1210gt
(rltagt) (b) Pure shear Z compression X extension equivalent strain 10 prismatic slip 1010lt1210gt
(mltagt) (c) XZ plane strain simple shear X shear direction equivalent strain 10 and prismatic slip1010lt1210gt Equal area projection
56 Dynamic Recrystallization
Another aspect of quartz texture formation is dynamic recrystallization for which there is ampleevidence in microstructures with grain growth of individual crystals (eg Brg1241) to an ideal mosaicmicrostructure (eg Brg1524) (Figures 3ndash5) Axial compression experiments with recrystallizationobserved a transition from a c-axis maximum parallel to the compression (Type A) to a small circlegirdle (Type C) [57] and simple shear experiments a transition from Type A to a XY girdle (Type B)
Minerals 2019 9 277 25 of 35
and ultimately to a Y maximum [8485] Experiments also established that trace water content has asignificant impact on recrystallization [72127ndash132]
Interpretation of grain growth in a stressndashstrain environment is complex [132133] It has beenapproached with thermodynamics and is fairly straightforward for materials which are elasticallyhighly anisotropic such as mica [134ndash136] For quartz in compression one would expect alignment ofthe soft direction 1011 parallel to the compression direction with a small circle girdle of c-axes due tothe symmetry of elastic properties [89] A weak 1011 maximum perpendicular to the foliation (Z) isactually observed in many Triassic samples (Figure 7)
Another approach to model the evolution of recrystallization textures is with polycrystal plasticitytheory In metals it is observed that recrystallization is a balance of nucleation and growth Dependingon conditions more highly deformed grains (high strain energy) are consumed by relatively undeformedneighbors (low strain energy) or strain-free nuclei form in highly deformed grains and preferentiallyconsume host grains [137138] Such a model was successfully applied to halite ice quartz [139] andolivine [140] For quartz deformed in plane strainpure shear initially during deformation a Type Atexture develops and expands into a girdle (Type B) [139] The most highly deformed grains are near Yand if they develop nuclei which grow a Y texture (Type D) develops as observed in many mylonitesmentioned earlier
57 Mechanical Dauphineacute Twinning
One aspect that we have not discussed so far is mechanical Dauphineacute twinning Mechanicaltwinning in quartz was first observed in compression tests of single crystals [102] and explored insome detail in the context of use of quartz as piezoelectric material [141] Dauphineacute twins are relatedto the host by a 180 rotation (or 60 taking into account the trigonal symmetry) about the c-axis [0001]Mechanical twinning causes a microscopic distortion of the lattice without significant macroscopicstrain and occurs during applied stress to reduce the strain energy to switch the stiff (0111) pole parallelto compression to the soft (1011) pole without changing the orientation of the c-axis 1010 and 1120orientations In polycrystalline aggregates twins form rather easily at moderate stresses [20142143]and twin boundaries propagate through crystals [144]
How can the orientation of rhombohedral planes in pole figures be interpreted as due to twinningor due to plastic deformation on rhombohedral slip systems Since orientations of c-axes and a-axesare not affected by Dauphineacute twins if those lattice directions show preferred orientations it must beattributed to other mechanisms such as basal prismatic and rhombohedral slip It is likely that sometwinning occurs at conditions of tectonic deformation [145ndash147] Twinning is likely to occur at theinitial stage of deformation or be caused at a later stages due to changing deformation geometry In themicrostructure an untwinned grain may have never been twinned or is completely twinned There is noeasy way to distinguish between the two Also once a grain is twinned twinning can not accommodatefurther deformation and other mechanisms have to become active The actual macroscopic strainsaccommodated by twinning in quartz are minimal compared to mechanical twinning in calcite
There is not much experimental work on rhombohedral slip mechanisms in quartz single crystalseven though structurally they seem important One reason is that rhombohedral orientations areeasily modified by twinning Also the poles of equivalent unit rhombs are more or less at right anglesIf one pole is parallel to the compression direction there are two poles that are perpendicular to itHowever for interpretations of quartz deformation mechanisms it appears important to conduct suchexperiments and identify slip systems with transmission electron microscopy
We have looked at Dauphineacute twin boundaries in the microstructure with EBSD and identifiedtwin boundaries (yellow lines in Figure 11) These are boundaries between grains that have identicalc-axes (same Euler angles ϕ1 and Φ) and a difference in Euler angles ϕ2 of 60 Such boundaries doindeed exist though they are not very abundant Table 2 (and more details in Table S2) quantifies someaspects of Dauphineacute twins based on evaluations of EBSD data with program Maptex in BEARTEX [54]Misorientations between each measured pixel and neighboring pixels were identified and if they
Minerals 2019 9 277 26 of 35
correspond to Dauphineacute twins plotted on the maps and statistically evaluated by comparing thetotal number of pixels with grain boundary pixels These statistics include not only scans plotted inFigure 11 but all scans on the sample Most samples have a low ratio of total twin boundary length tothe probed area ranging from 03 to 15 times 10minus2 A few samples (Brg568 981 1135 1137 and 1618 andSci881) have a ratio gt2 All of these samples are Triassic quartzites Similar high ratios were observedfor experimentally stressed quartzites [143] that we show for comparison as sample Br in Table 2C
58 Comparison of Methods of Texture Measurements
After discussing the geological significance of these observations of quartz preferred orientationlet us look at some methodological aspects As was mentioned earlier a range of methods were used toinvestigate quartz textures ranging from optical methods [148149] conventional X-ray diffraction [1965]synchrotron X-ray diffraction [150151] neutron diffraction (ranging from monochromatic [149152]to time-of-flight [49]) and electron backscatter diffraction (EBSD) [79143144146] Results fromdifferent methods were compared [254963149153154] Optical methods are limited to record c-axisorientations EBSD records textures on surfaces neutron diffraction probes large volumes of samples
For the quartz textures described here we used TOF neutron diffraction and EBSD We werefortunate to have had the opportunity to measure the texture of many quartzite samples with neutrondiffraction at Los Alamos As mentioned earlier we observed very consistent patterns with thistechnique which assesses grain orientations over ~1 cm3 samples Even larger samples (~65 cm3)were measured at Dubna Such volumes provide confidence that the derived texture patterns arerepresentative of the local rock properties at the laboratory scale It does not imply that texture patternsare homogeneous over large areas In fact the samples collected in the same Triassic quartz layer nearCasaccia (Brg980 Brg981 and Brg1102) vary considerably over distances of lt1km indicating that localheterogeneities in a geological sense can be significant It confirms that a large number of samples isimportant to derive a representative interpretation
Figure 12 compares neutron and EBSD pole figures of selected samples (a full comparison is shownin Figures S3 and S4) and Table 1 compares texture strength obtained with the two methods The polefigures after proper rotations of EBSD pole figures show excellent agreement A significant differenceis that the texture strength of EBSD pole figures is consistently larger (Table 1) One explanation couldbe that the number of measured grains is much larger for neutrons than for EBSD introducing statisticalsmoothing Another explanation could be the angular averaging by the large neutron detectors over aconsiderable range (eg Figure 6a) [25] With EBSD diffraction patterns crystal orientations are definedwithin a fraction of a degree
This is highlighted in Figure 15 for Brg1618 from Cavi where samples cut from the same largerhand specimen were measured with neutron diffraction with HIPPO at Los Alamos (1 cm cylinders)(Figure 15a) with SKAT at Dubna (5 cm diameter spheres) (Figure 15b) and SEM-EBSD scanning overa mm-sized surface (Figures 11 and 15c) The texture is relatively weak and the average grain size isabout 02 mm (Figures 3 and 5) The two neutron diffraction measurements show excellent agreementEBSD has a similar pattern but is less quantitative
An advantage of EBSD is that the microstructure including twin boundaries can be quantified(Table 2) Thus it looks like for relatively fine-grained samples which can easily be polished and areanalyzed at ambient conditions texture analysis with EBSD is advantageous especially with advancesin detector technology that allows to collect 1000 diffraction images per second EBSD requires muchless preparation and data processing than neutron TOF texture analysis which relies on convincingproposals with advanced planning and the rather strenuous data analysis to arrive at quantitativetexture information
Minerals 2019 9 277 27 of 3529 of 29
Figure 15 Comparison of neutron and EBSD pole figures for sample Brg1618 (a) Neutron diffraction with HIPPO LAN (b) neutron diffraction with SKAT JINR-Dubna and (c) EBSD with SEM Equal area projection
6 Conclusions
Preferred orientations of 24 Triassic quartzites eight Triassic marbles and 15 quartz layers in metamorphic gneiss from the Bergell Alps in SE Switzerland were analyzed with neutron diffraction and EBSD Texture patterns were reciprocated with polycrystal plasticity modeling to explore likely deformation mechanisms In Triassic quartzites from the Pennine nappes (Tambo Suretta Avers and Platta) and the lower Austroalpne Margna nappe quartz shows a (0001) maximum near the pole to the foliation Z sometimes divided into submaxima or a YZ crossed girdle perpendicular to the lineation X A simple (0001) maximum is particularly common in quartzites of the lowest metamorphic grade (higher nappes Avers and Magna) Also many samples show a submaximum of 1011 poles near Z This is attributed to dominant basal (0001)lt1120gt and rhombohedral 1011lt1210gt slip accompanied by recrystallization The texture patterns are consistent over a wide area and variations can be attributed to local changes in strain geometry Some Triassic quartzites display deformation lamellae and EBSD maps display significant Dauphineacute twin boundaries Overall textures are moderate in strength which may be due to presence of strongly aligned muscovite that shields stress and hinders dislocation and grain boundary movements or it could be caused by adjacent Triassic marbles that may have accommodated a significant portion of strain Textures in quartz layers are generally very strong with a (0001) maximum near Y as has been documented in mylonites from many localities Also here there is a 1011 maximum near Z Polycrystal plasticity models suggest that the Y-maximum texture is due to dominant prismatic 10 1 0lt 1 2 1 0gt slip combined with rhombohedral slip 1011lt1210gt and dynamic recrystallization These Y-maximum textures are particularly pronounced in mylonitic layers close to the Teriary Bergell granite contact in high amphibolitendashgranulite facies metamorphic conditions Most likely is that plane strain
Figure 15 Comparison of neutron and EBSD pole figures for sample Brg1618 (a) Neutron diffraction withHIPPO LAN (b) neutron diffraction with SKAT JINR-Dubna and (c) EBSD with SEM Equal area projection
6 Conclusions
Preferred orientations of 24 Triassic quartzites eight Triassic marbles and 15 quartz layers inmetamorphic gneiss from the Bergell Alps in SE Switzerland were analyzed with neutron diffractionand EBSD Texture patterns were reciprocated with polycrystal plasticity modeling to explore likelydeformation mechanisms In Triassic quartzites from the Pennine nappes (Tambo Suretta Avers andPlatta) and the lower Austroalpne Margna nappe quartz shows a (0001) maximum near the pole to thefoliation Z sometimes divided into submaxima or a YZ crossed girdle perpendicular to the lineation XA simple (0001) maximum is particularly common in quartzites of the lowest metamorphic grade(higher nappes Avers and Magna) Also many samples show a submaximum of 1011 poles near ZThis is attributed to dominant basal (0001)lt1120gt and rhombohedral 1011lt1210gt slip accompaniedby recrystallization The texture patterns are consistent over a wide area and variations can be attributedto local changes in strain geometry Some Triassic quartzites display deformation lamellae and EBSDmaps display significant Dauphineacute twin boundaries Overall textures are moderate in strength whichmay be due to presence of strongly aligned muscovite that shields stress and hinders dislocationand grain boundary movements or it could be caused by adjacent Triassic marbles that may haveaccommodated a significant portion of strain Textures in quartz layers are generally very strong witha (0001) maximum near Y as has been documented in mylonites from many localities Also here there isa 1011 maximum near Z Polycrystal plasticity models suggest that the Y-maximum texture is due todominant prismatic 1010lt1210gt slip combined with rhombohedral slip 1011lt1210gt and dynamicrecrystallization These Y-maximum textures are particularly pronounced in mylonitic layers closeto the Teriary Bergell granite contact in high amphibolitendashgranulite facies metamorphic conditionsMost likely is that plane strain dominates in most samples with different fractions of pure shear
Minerals 2019 9 277 28 of 35
and simple shear There is excellent qualitative agreement between neutron diffraction pole figuresand EBSD pole figures The study suggests that rhombohedral slip may be significant in quartz andthis should be approached with future deformation experiments and electron microscope studies toidentify dislocations
Supplementary Materials The following are available online at httpwwwmdpicom2075-163X95277s1This section contains two tables and four figures that display details and may be of interest to some readers TableS1 List of additional Triassic quartzite samples with location Swiss coordinates and (0001) pole figure maxima(in multiples of a random distribution) These samples are not referred to in the text but pole figures determinedfrom neutron diffraction data are shown in Figure S3 Table S2 EBSD twin boundary statistics with individualscans (Compare with Table 2 in main paper) Figure S1 Optical images of microstructures of Triassic quartziteslisted in Table 1 Crossed polarizers Scale bar is indicated on top right Figure S2 Optical images of quartz layerslisted in Table 1 Crossed polarizers Scale bar is indicated on top right Figure S3 Neutron diffraction pole figuresof samples not included in the main text Approximate localities are indicated under sample numbers Equalarea projection on the schistosity plane Lineation is l Numbers on top right of pole figures indicate which poledensity scale was used (in mrd) Figure S4ab Comparison of (0001) and (1011) pole figures of quartz for Triassicquartzites and EBSD and neutron diffraction Selected cases are also shown in Figure 12 Equal area projection onthe schistosity plane Lineation is l Numbers on top right of pole figures indicate which pole density scale wasused (in mrd) Figure S5 Comparison of (0001) and (1011) pole figures of quartz for quartz layers and EBSD andneutron diffraction Selected cases are also shown in Figure 12 Equal area projection on the schistosity planeLineation is l Numbers on top right of pole figures indicate which pole density scale was used (in mrd)
Author Contributions All authors participated in the preparation of this manuscript H-RW conducted samplecollection collaborated in HIPPO and EBSD experiments data anaslysis and prepared the first version of themanuscript RY worked on EBSD experiments data analysis SV worked on HIPPO experiments and RV onSKAT experiments
Funding H-RW is greatful for support from NSF (EAR 1343908) and DOE-BES (DE-FG02-05ER15637)RY acknowledges support from IKSTP Shaanxi China (No2015GY101)
Acknowledgments We are appreciative for access to the HIPPO neutron diffraction facilities at LANSCE wheremost of the diffraction experiments were conducted The user program at LANSCE was supported by DOE-BESWe also acknowledge the access to the SKAT diffractometer at JINR Dubna Comments from five enthusiasticreviewers were very helpful For such a long manuscript with over 150 references and only numbers in the textit must have been a difficult task We also thank T Teague (Berkeley) for help with sample preparation L Morales(ETH) and C Tomeacute (LANL) for discussions particularly polycrystal plasticity modeling
Conflicts of Interest The authors declare no conflict of interest
References
1 Schmidt W Gefuumlgestatistik Tschermaks Mineral Petrog Mitt 1925 38 392ndash4232 Sander B Einfuumlhrung in die Gefuumlgekunde der geologischen Koumlrper Teil II Die Korngefuumlge Springer Wien Austria
1950 p 412 [CrossRef]3 Behr H-J Beitraumlge zur petrographischen und tektonischen Analyse des saumlchsischen Grundgebirges Freiberger
Forsch 1961 C119 1ndash1184 Behr H-J Die Korngefuumlgefazies der Zweiguumlrteltektonite im kristallinen Grundgebirge Sachsens Abh
Deutsch Akad Wiss Berlin Kl Bergbau 1964 1 1ndash465 Behr H-J Zur Methodik tektonischer Forschung im kristallinen Grundgebirge Ber Geol Ges DDR 1965
102 163ndash1796 Lister GS Dornsiepen UF Fabric transition in the Saxony granulite terrain J Struct Geol 1982 4 81ndash92
[CrossRef]7 Christie JM The Moine thrust zone in the Assynt region northwest Scotland Calif Univ Publ Geol Sci
1963 40 345ndash4408 Law RD Heterogeneous deformation and quartz crystallographic fabric transitions natural examples from
the Moine Thrust zone at the stack of Glencoul northern Assynt J Struct Geol 1987 9 819ndash833 [CrossRef]9 Law RD Schmid SM Wheeler J Simple shear deformation and quartz crystallographic fabrics A possible
natural example from the Torrion area of NW Scotland J Struct Geol 1990 12 29ndash45 [CrossRef]10 Bell TH Etheridge MA The deformation and recrystallization of quartz in a mylonite zone Central
Australia Tectonophysics 1976 32 235ndash267 [CrossRef]
Minerals 2019 9 277 29 of 35
11 Wenk H-R Gefuumlgestudie an Quarzknauern und linsen der Tessiner Kulmination Schweiz Mineral PetrogMitt 1965 45 468ndash516
12 Simpson C Oblique girdle orientation patterns of quartz c-axes from a shear zone in the basement core ofthe Maggia Nappe Ticino Switzerland J Struct Geol 1980 2 243ndash247 [CrossRef]
13 Mancktelow NS Quartz textures form the Simplon Fault Zone southwest Switzerland and north ItalyTectonophysics 1987 135 133ndash153 [CrossRef]
14 Mancktelow NS Atypical textures in quartz from the Simplon fault zone J Struct Geol 1987 98 995ndash1005[CrossRef]
15 Parsons AJ Law RD Lloyd RD Phillips RJ Searle MP Thermo-kinematic evolution of theAnnapurna-Dhaulagiri Himalaya central Nepal The composite orogenic system Geochem GeophysGeosystems 2016 17 1511ndash1539 [CrossRef]
16 Long SP Gordon SM Young JP Soignard E Temperature and strain gradients through Lesser Himalayanrocks and across the Main Central thrust south central Bhutan Implications for transport-parallel stretchingand inverted metamorphism Tectonics 2016 35 1863ndash1891 [CrossRef]
17 Hunter NJR Weinberg RF Wilson CJL Luzin V Misra S Microscopic anatomy of a ldquohot-on-coldrdquoshear zone Insights from quartzites from the Main Central Thrust in the Alaknanda Valley (GarhwalHimalaya) Geol Soc America Bull 2018 130 1519ndash1539 [CrossRef]
18 Larson KP Refining the structural framework of the Khimti Khola region east-central Nepal Himalayausing quartz textures and c-axis fabrics J Struct Geol 2018 107 142ndash152 [CrossRef]
19 Wenk H-R Baker DW Griggs ET X-ray fabric analysis of hot-worked and annealed flint Science 1967157 1447ndash1449 [CrossRef]
20 Tullis J Quartz Preferred orientation in rocks produced by Dauphineacute twinning Science 1970 168 1342ndash1344[CrossRef]
21 Baker DW Wenk H-R Christie JM X-ray analysis of preferred orientation in fine-grained quartzaggregates J Geol 1969 77 144ndash172 [CrossRef]
22 Baker DW Wenk H-R Preferred orientation in a low symmetry quartz mylonite J Geol 1972 80 81ndash105[CrossRef]
23 Dingley DJ A comparison of diffraction techniques for the SEM Scanning Electr Microsc 1981 4 273ndash28624 Kunze K Adams BL Heidelbach F Wenk H-R Local microstructural investigations in recrystallized
quartzite using orientation imaging microscopy Mater Sci Forum 1994 157ndash162 1243ndash1250 [CrossRef]25 Wenk H-R Lutterotti L Vogel SC Rietveld texture analysis from TOF neutron diffraction data Powder
Diffr 2010 25 283ndash296 [CrossRef]26 Bunge H-J Zur Darstellung allgemeiner Texturen Z Metallk 1965 56 872ndash87427 Roe R-J Description of crystallite orientation in polycrystalline materials III general solution to pole figure
inversion J Appl Phys 1965 36 2024ndash2031 [CrossRef]28 Matthies S On the reproducibility of the orientation distribution function of texture samples from pole
figures (ghost phenomena) Phys Status Solidi B 1979 92 K135ndashK138 [CrossRef]29 Matthies S Vinel GW On the reproduction of the orientation distribution function of textured samples
from reduced pole figures using the concept of conditional ghost correction Phys Status Solidi B 1982 112K111ndashK114 [CrossRef]
30 Pawlik K Determination of the orientation distribution function from pole figures in arbitrarily definedcells Phys Status Solidi B 1986 134 477ndash483 [CrossRef]
31 Schaeben H Entropy optimization in texture goniometry Phys Status Solidi B 1988 148 63ndash72 [CrossRef]32 Hielscher R Schaeben H A novel pole figure inversion method specification of the MTEX algorithm
J Appl Cryst 2008 41 1024ndash1037 [CrossRef]33 Christie JM Griggs DT Carter NL Experimental evidence of basal slip in quartz J Geol 1964 72
734ndash756 [CrossRef]34 Hobbs BE McLaren AC Paterson MS Plasticity of single crystals of synthetic quartz Flow Fract Rocks
1972 16 29ndash53 [CrossRef]35 Baeta RD Ashbee KGH Mechanical deformation of quartz I Constant strain-rate compression
experiments Phil Mag 1970 22 601ndash623 [CrossRef]36 DrsquoOmalius drsquoHalloy JJ Introduction a la Geacuteologie Levrault Paris France 1833
Minerals 2019 9 277 30 of 35
37 Kurz W Neubauer F Genser J Dachs E Alpine geodynamic evolution of passive and active continentalmargin sequences in the Tauern Window (eastern Alps Austria Italy) A review Geol Rundschau 1998 87225ndash242 [CrossRef]
38 Schmid SM Scharf A Handy MR Rosenberg CL The Tauern Window (Eastern Alps Austria) A newtectonic map with cross-sections and a tectonometamorphic synthesis Swiss J Geosci 2013 106 1ndash32[CrossRef]
39 Trommsdorff V Montrasio A Hermann J Muumlntener O Spillmann P Giereacute R The geological map ofValmalenco Schweiz Mineral Petrog Mitt 2005 85 1ndash13
40 Wenk H-R The structure of the Bergell Alps Eclogae Geol Helv 1973 66 255ndash29141 Wenk H-R Wenk E Wallace J Metamorphic mineral assemblages in pelitic rocks of the Bergell Alps
Schweiz Mineral Petrog Mitt 1974 54 507ndash55442 Law RD Crystallographic fabrics A selective review of their applications to research in structural geology
Geol Soc London Spec Publ 1990 54 335ndash352 [CrossRef]43 Bishop JR Piezoelectric effects in quartz-rich rocks Tectonophysics 1981 77 97ndash321 [CrossRef]44 Ivankina TI Nikitin AN Voitus W Walther K Texture analysis and investigation of piezoelectric
properties of natural quartz Textures Microstruct 1991 14ndash18 421ndash429 [CrossRef]45 Frondel C Characters of quartz fibers Am Mineral 1978 63 17ndash2746 Tanaka Y Kojima T Takata Y Chainani A Lovesey SW Knight KS Takeuchi T Oura M Senba Y
Ohashi H et al Determination of structural chirality of berlinite and quartz using resonant X-ray diffractionwith circularly polarized X-rays Physic Rev B 2010 81 144104 [CrossRef]
47 Matthies S Wenk H-R Vinel GW Some basic concepts of texture analysis and comparison of threemethods to calculate orientation distributions from pole figures J Appl Crystallogr 1988 21 285ndash304[CrossRef]
48 Pehl J Wenk H-R Evidence for regional Dauphineacute twinning in quartz from the Santa Rosa mylonite zonein Southern California A neutron diffraction study J Struct Geol 2005 27 1741ndash1749 [CrossRef]
49 Wenk H-R Lutterotti L Vogel SC Texture analysis with the new HIPPO TOF diffractometer Nucl InstrMethods A 2003 515 575ndash588 [CrossRef]
50 Ullemeyer K Spalthoff P Heinitz J Isakov NN Nikitin AN Weber K The SKAT texture diffractometerat the pulsed reactor IBR-2 at Dubna Experimental layout and first measurements Nucl Instr Methods A1998 412 80ndash88 [CrossRef]
51 Keppler R Ullemeyer K Behrmann JH Stipp M Potential of full pattern fit methods for the textureanalysis of geological materials Implications from texture measurements at the recently upgraded neutrontime-of-flight diffractometer SKAT J Appl Crystallogr 2014 47 1520ndash1534 [CrossRef]
52 Lutterotti L Matthies S Wenk H-R Schultz AJ Richardson JW Combined texture and structureanalysis of deformed limestone from time-of-flight neutron diffraction spectra J Appl Phys 1997 81594ndash600 [CrossRef]
53 Kihara K An X-ray study of the temperature dependence of the quartz structure Eur J Mineral 1990 2163ndash77 [CrossRef]
54 Wenk H-R Matthies S Donovan J Chateigner D BEARTEX A Windows-based program system forquantitative texture analysis J Appl Crystallogr 1998 31 262ndash269 [CrossRef]
55 Matthies S Wenk H-R Transformations for monoclinic crystal symmetry in texture analysis J Appl Cryst2009 42 564ndash571 [CrossRef]
56 Tullis J Christie JM Griggs DT Microstructures and preferred orientations of experimentally deformedquartzites Geol Soc Am Bull 1973 84 297ndash314 [CrossRef]
57 Stipp M Kunze K Dynamic recrystallization near the brittle-plastic transition in naturally andexperimentally deformed quartz aggregates Tectonophysics 2008 448 77ndash97 [CrossRef]
58 Tullis J Preferred orientation of quartz produced by slip during plane strain Tectonophysics 1977 39 87ndash102[CrossRef]
59 DellrsquoAngelo LN Tullis J Fabric development in experimentally sheared quartzites Tectonophysics 1989169 1ndash21 [CrossRef]
60 Mainprice DH Bouches JL Blumenfeld P Tubiaacute JM Dominant c slip in naturally deformed quartzImplications for dramatic plastic softening at high temperature Geology 1986 14 819ndash822 [CrossRef]
Minerals 2019 9 277 31 of 35
61 Toy VG Prior DJ Norris RJ Quartz fabrics in the Alpine Fault mylonites Influence of pre-existingpreferred orientations on fabric development during progressive uplift J Struct Geol 2008 30 602ndash621[CrossRef]
62 Trommsdorff V Wenk E Diskussion eines Zwillingsgefuumlges durch Achsenverteilungsanalyse an Quarzeines Tessiner Gneisses Schweiz Mineral Petrog Mitt 1963 43 687ndash698
63 Fazio E Punturo R Cirrincione R Kern H Pezzino A Wenk H-R Goswami S Mamtani MA Quartzpreferred orientation in naturally deformed mylonitic rocks (Montalto Shear ZonemdashItaly) A comparisonof results by different techniques their advantages and limitations Int J Earth Sci 2017 106 2259ndash2278[CrossRef]
64 Wilson CJL Preferred orientation in quartz ribbon mylonites Geol Soc Am Bull 1975 86 968ndash974[CrossRef]
65 Schmid SM Casey M Starkey J An illustration of the advantages of a complete texture analysis describedby the orientation distribution function (ODF) using quartz pole figure data Tectonophysics 1981 78 101ndash117[CrossRef]
66 Carreras J Estrada A White S The effects of folding on the c-axis fabrics of a quartz mylonite Tectonophysics1977 39 3ndash24 [CrossRef]
67 Okudaira T Takeshita T Hara I Ando J A new estimate of the conditions for transition from basal ltagt
to prism [c] slip in naturally deformed quartz Tectonophysics 1995 250 31ndash46 [CrossRef]68 Barth NC Hacker BR Seward GGE Walsh EO Young D Johnston S Strain within the
ultrahigh-pressure Western Gneiss region of Norway recorded by quartz CPOs Geol Soc LondonSpec Publ 2010 335 663ndash685 [CrossRef]
69 Knipe RJ Law RD The influence of crystallographic orientation and grain boundary migration onmicrostructural and textural evolution in an S-C mylonite Tectonophysics 1987 135 155ndash169 [CrossRef]
70 Law RD Mainprice D Casey M Lloyd GE Knipe RJ Cook B Thigpen JR Moine thrust zonemylonites at the Stack of Glencoul ImdashMicrostructures strain and influence of recrystallization on quartzcrystal fabric development Geol Soc London Spec Publ 2010 335 543ndash577 [CrossRef]
71 Pennacchioni G Menegon L Leiss B Nestola F Bromiley G Development of crystallographic preferredorientation and microstructure during plastic deformation of natural coarse-grained quartz veins J GeophysRes 2010 115 B12405 [CrossRef]
72 Stipp M Stuumlnitz H Heilbronner R Schmid SM The Eastern Tonale fault zone A ldquonatural laboratoryrdquofor crystal plastic deformation of quartz over a temperature range from 250 C to 700 C J Struct Geol 200224 1861ndash1884 [CrossRef]
73 Hara I Takeda K Kimura T Preferred lattice orientation of quartz in shear deformation J Sci HiroshimaUniv Ser C 1973 7 1ndash11
74 Bouchez JL Pecher A Plasticiteacute du quartz et sens de cisaillement dans les quartzites du grandChevauchement Central Himalayen Bull Soc Geol Fr 1976 6 1377ndash1384 [CrossRef]
75 Lister GS Discussion Cross-girdle c-axis fabrics in quartzites plastically deformed by plane strain andprogressive simple shear Tectonophysics 1977 39 51ndash54 [CrossRef]
76 Brunel M Quartz fabrics in shear-zone mylonites Evidence for a major imprint due to late strain incrementsTectonophysics 1980 64 T33ndashT44 [CrossRef]
77 Lloyd GE Freeman B Dynamic recrystallization of quartz under greenschist conditions J Struct Geol1994 16 867ndash881 [CrossRef]
78 Takeshita T Wenk H-R Lebensohn R Development of preferred orientation and microstructure insheared quartzite Comparison of natural and simulated data Tectonophysics 1999 312 133ndash155 [CrossRef]
79 Heidelbach F Kunze K Wenk H-R Texture nalysis of a recrystallized quartzite using electron diffractionin the scanning electron microscope J Struct Geol 2000 22 91ndash104 [CrossRef]
80 Keller LM Stipp M The single slip hypothesis revisited Crystal-preferred orientations of sheared quartzaggregates with increasing strain in nature and numerical simulation J Struct Geol 2011 33 1491ndash1500[CrossRef]
81 Kilian R Heilbronner R Stuumlnitz H Quartz microstructures and crystallographic preferred orientationWhich shear sense do they indicate J Struct Geol 2011 33 1446ndash1466 [CrossRef]
Minerals 2019 9 277 32 of 35
82 Morales LFG Mainprice D Lloyd GE Law RD Crystal fabric development and slip systems in a quartzmylonite An approach via transmission electron microscopy and viscoplastic self-consistent modellingGeol Soc London Special Publ 2011 360 151ndash174 [CrossRef]
83 Lister GS Williams PF Fabric development in shear zones theoretical controls and observed phenomenaJ Struct Geol 1979 1 283ndash297 [CrossRef]
84 Heilbronner R Tullis J Evolution of c-axis pole figures and grain size during dynamic recrystallizationResults from experimentally sheared quartzite J Geophys Res 2006 111 B10202 [CrossRef]
85 Kilian R Heilbronner R Analysis of crystallographic preferred orientation of experimentally deformedBlack Hills quartzite Solid Earth 2017 8 1095ndash1117 [CrossRef]
86 Lister GS Paterson MS The simulation of fabric development during plastic deformation and itsapplication to quartzite Fabric transitions J Struct Geol 1979 1 99ndash115 [CrossRef]
87 Lister GS Hobbs BE The simulation of fabric development during plastic deformation and its applicationto quartzite The influence of deformation history J Struct Geol 1980 2 355ndash370 [CrossRef]
88 Morales LFG Lloyd GE Mainprice D Fabric transitions in quartz via viscoplastic self-consistentmodeling part I Axial compression and simple shear under constant strain Tectonophysics 2014 636 52ndash69[CrossRef]
89 Heyliger P Ledbetter H Kim S Elastic constants of natural quartz J Acoust Soc Am 2003 114 644ndash650[CrossRef]
90 Carter NL Basal quartz deformation lamellae a criterion for recognition of impactites Am J Sci 1965 263786ndash806 [CrossRef]
91 Christie JM Raleigh CB The origin of deformation lamellae in quartz Am J Sci 1959 257 385ndash407[CrossRef]
92 McLaren AC Turner RG Boland JN Hobbs BE Dislocation structure of the deformation lamellaein synthetic quartz a study by electron and optical microscopy Contrib Mineral Petrol 1970 29 104ndash115[CrossRef]
93 White S Geological significance of recovery and recrystallization processes in quartz Tectonophysics 197739 143ndash170 [CrossRef]
94 Christie JM Ardell AJ Substructures of deformation lamellae in quartz Geology 1974 2 405ndash408[CrossRef]
95 Vernooij MGC Langenhorst F Experimental reproduction of tectonic deformation lamellae in quartzand comparison to shock-induced planar deformation features Meteor Planet Sci 2005 40 1353ndash1361[CrossRef]
96 Trepman CA Spray JG Planar microstructures and Dauphineacute twins in shocked quartz from the Charlevoiximpact structure Canada Geol Soc Amer Special Paper 2005 384 315ndash328 [CrossRef]
97 Gratz AJ Tyburczy J Christie J Ahrens T Pongratz P Shock metamorphism of deformed quartz PhysChem Miner 1988 16 221ndash233 [CrossRef]
98 Gratz AJ Nellis WJ Christie JM Brocious W Swegle J Cordier P Shock metamorphism of quartzwith initial temperatures minus170 to +1000 C Phys Chem Miner 1992 19 267ndash288 [CrossRef]
99 Stoumlffler D Langenhorst F Shock metamorphism of quartz in nature and experiment I Basic observationand theory Meteoritics 1994 29 155ndash181 [CrossRef]
100 French BM Koeberl C The convincing identification of terrestrial meteorite impact structures Whatworks what doesnrsquot and why Earth-Sci Rev 2010 98 123ndash170 [CrossRef]
101 Hamers MF Pennock GM Herwegh M Drury MR Distinction between amorphous and healedplanar deformation features in shocked quartz using composite color scanning electron microscopecathodoluminescence (SEM-CL) imaging Meteorit Planet Sci 2016 51 1914ndash1931 [CrossRef]
102 Schubnikow A Uumlber Schlagfiguren des Quarzes Z Kristallogr 1930 74 103ndash104103 Molinari A Canova G Ahzi S A self consistent approach of the large deformation polycrystal viscoplasticity
Acta Metall 1987 35 2983ndash2994 [CrossRef]104 Lebensohn R Tomeacute CA self-consistent visco-plastic model Prediction of rolling textures of anisotropic
materials Mater Sci Eng A 1994 175 71ndash82 [CrossRef]105 Wenk H-R Canova G Molinari A Kocks UF Viscoplastic modeling of texture development in quartzite
J Geophys Res 1989 94 17895ndash17906 [CrossRef]
Minerals 2019 9 277 33 of 35
106 Wenk HR Deformation of mylonites in Palm Canyon California based on xenolith geometry J StructGeol 1998 20 559ndash571 [CrossRef]
107 Song WJ Ree JH Effect of mica on the grain size of dynamically recrystallized quartz in a quartz-muscovitemylonite J Struct Geol 2007 29 1872ndash1881 [CrossRef]
108 Ebert A Herwegh M Evans B Pfiffner A Austin N Vennemann T Microfabrics in carbonate mylonitesalong a large-scale shear zone (Helvetic Alps) Tectonophysics 2007 444 1ndash26 [CrossRef]
109 Herwegh M Linckens J Ebert A Berger A Brodhag SH The role of second phases for controllingmicrostructural evolution in polymineralic rocks A review J Struct Geol 2011 33 1728ndash1750 [CrossRef]
110 Tullis J Wenk H-R Effect of muscovite on the strength and lattice preferred orientations of experimentallydeformed quartz aggregates Mater Sci Eng A 1994 175 209ndash220 [CrossRef]
111 Canova GR Wenk H-R Molinari A Deformation modeling of multiphase polycrystals Case of aquartz-mica aggregate Acta Metall Mater 1992 40 1519ndash1530 [CrossRef]
112 Vasin R Kern H Lokajicek T Svitek T Lehmann E Mannes DC Chaouche M Wenk H-R Elasticanisotropy of Tambo gneiss from Promontogno Switzerland A comparison of crystal orientation andmicrostructure-based modeling and experimental measurements Geophys J Int 2017 209 1ndash20 [CrossRef]
113 Rutter EH Influence of temperature strain rate and interstitial water in experimental deformation of calciterocks Tectonophysics 1974 22 311ndash334 [CrossRef]
114 De Bresser JHP Spiers CJ Strength characteristics of the r f and c slip systems in calcite Tectonophysics1997 272 1ndash23 [CrossRef]
115 Turner FJ Griggs DT Clark RH Dixon RH Deformation of Yule marble part VII Development oforiented fabrics at 300 Cndash400 C Geol Soc Am Bull 1956 67 1259ndash1294 [CrossRef]
116 Schmid SM Paterson MS Boland JN High temperature flow and dynamic recrystallization in Carraramarble Tectonophysics 1980 65 245ndash280 [CrossRef]
117 De Raadt WS Burlini L Kunze K Spiers CJ Effect of pre-existing crystallographic preferred orientationon the rheology of Carrara marble J Struct Geol 2014 68 44ndash57 [CrossRef]
118 Pieri M Burlini L Kunze K Stretton I Olgaard DL Rheological and microstructural evolution ofCarrara marble with high shear strain Results from high temperature torsion experiments J Struct Geol2001 23 1393ndash1413 [CrossRef]
119 Pieri M Kunze K Burlini L Stretton I Olgaard DL Burg J-P Wenk H-R Texture development ofcalcite by deformation and dynamic recrystallization at 1000 K during torsion experiments of marble to largestrains Tectonophysics 2001 330 119ndash140 [CrossRef]
120 Trommsdorff V Gefuumlgestudien an Calcitmarmor aus Val Prato (Tessin) Schweiz Mineral Petrog Mitt 196444 595ndash611
121 Romeo I Capote R Lunar R Crystallographic preferred orientation and microstructure of a Variscanmarble mylonite in the Ossa-Morena Zone (SW Iberia) J Struct Geol 2007 29 1353ndash1368 [CrossRef]
122 Rutter EH Rusbridge M The effect of non-coaxial strain paths on crystallographic preferred orientationdevelopment in the experimental deformation of a marble Tectonophysics 1977 39 73ndash86 [CrossRef]
123 Schmid SM Panozzo R Bauer S Simple shear experiments on calcite rocks Rheology and microfabricJ Struct Geol 1987 9 747ndash778 [CrossRef]
124 Wenk H-R Takeshita T Bechler E Erskine B Matthies S Pure shear and simple shear calcite texturesComparison of experimental theoretical and natural data J Struct Geol 1987 9 731ndash745 [CrossRef]
125 Trommsdorff V Wenk H-R Die Regelung des Dolomites von Crevola (Simplon) Diskussion und ProblemeSchweiz Mineral Petrog Mitt 1965 45 551ndash569
126 Holyoke III CW Kronenberg AK Newman J Dislocation creep of polycrystalline dolomite Tectonophysics2013 590 72ndash82 [CrossRef]
127 Mainprice DH Paterson MS Experimental studies of the role of water in the plasticity of quartzitesJ Geophys Res 1984 89 4257ndash4296 [CrossRef]
128 Stipp M Tullis J Scherwath M Behrmann JH A new perspective on paleopiezometry Dynamicallyrecrystallized grain size distributions indicate mechanism changes Geology 2010 38 759ndash762 [CrossRef]
129 Cross AJ Prior DJ Stipp M Kidder S The recrystallized grain size piezometer for quartz An EBSD-basedcalibration Geophys Res Lett 2017 44 6667ndash6674 [CrossRef]
Minerals 2019 9 277 34 of 35
130 Gleason GC Tullis J Heidelbach F The role of dynamic recrystallization in the development of latticepreferred orientations in experimentally deformed quartz aggregates J Struct Geol 1993 15 1145ndash1168[CrossRef]
131 Halfpenny A Prior DJ Wheeler J Electron backscatter diffraction analysis to determine the mechanismsthat operated during dynamic recrystallization of quartz-rich rocks J Struct Geol 2012 36 2ndash15 [CrossRef]
132 Hirth G Tullis J Dislocation creep regimes in quartz aggregates J Struct Geol 1992 14 145ndash159[CrossRef]
133 Humphreys FJ Hatherly M Recrystallization and Related Annealing Phenomena Oxford University PressOxford UK 1995
134 Kamb WB Theory of preferred orientation developed by recrystallization under stress J Geol 1959 67153ndash170 [CrossRef]
135 Shimizu I Nonhydrostatic and nonequilibrium thermodynamics of deformable materials J Geophys Res1992 97 4587ndash4597 [CrossRef]
136 Shimizu I Theories and applicability of grain size piezometers The role of dynamic recrystallizationmechanisms J Struct Geol 2008 30 899ndash917 [CrossRef]
137 Jessell MW Simulation of fabric development in recrystallizing aggregates I Description of the modelJ Struct Geol 1988 10 771ndash778 [CrossRef]
138 Jessell MW Simulation of fabric development in recrystallizing aggregates II Example model runs J StructGeol 1988 10 779ndash793 [CrossRef]
139 Wenk H-R Canova G Breacutechet Y Flandin L A deformation-based model for recrystallization ofanisotropic materials Acta Mater 1997 45 3283ndash3296 [CrossRef]
140 Wenk H-R Tomeacute CN Modeling dynamic recrystallization of olivine dynamic in simple shear J GeophysRes 1999 104 25513ndash25527 [CrossRef]
141 Thomas LA Wooster WA PiezocrescencemdashThe growth of Dauphineacute twinning in quartz under stressProc R Soc Lond Math Phys Sci 1951 A 208 43ndash62 [CrossRef]
142 Tullis J Tullis TE Preferred orientation produced by mechanical Dauphineacute twinning Thermodynamicsand axial experiments Am Geophys U Monogr 1972 16 67ndash82 [CrossRef]
143 Minor A Rybacki E Sintubin M Vogel S Wenk H-R Tracking mechanical Dauphineacute twin evolutionwith applied stress in axial compression experiments on a low-grade metamorphic rock J Struct Geol 2018112 81ndash94 [CrossRef]
144 Wenk H-R Barton N Bortolotti M Vogel S Voltolini M Lloyd GE Gonzalez GB Dauphineacute twinningand texture memory in polycrystalline quartz Part 3 Texture memory during phase transformation PhysChem Miner 2009 37 567ndash583 [CrossRef]
145 Menegon L Pennacchioni G Heilbronner R Pittarello L Evolution of quartz microstructure and c-axiscrystallographic preferred orientation within ductilely deformed granitoids (Arolla Unit Western Alps)J Struct Geol 2008 30 1332ndash1347 [CrossRef]
146 Menegon L Piazolo S Pennacchioni G The effect of Dauphineacute twinning on plastic strain in quartzContrib Mineral Petrol 2011 161 635ndash652 [CrossRef]
147 Rahl JM McGrew AJ Fox JA Latham JR Gabrielson T Rhomb-dominated crystallographic preferredorientations in incipiently deformed quartz sandstones A potential paleostress indicator for quartz-richrocks Geology 2018 46 195ndash198 [CrossRef]
148 Heilbronner R Pauli C Integrated spatial and orientation analysis of quartz c-axes by computer-aidedmicroscopy J Struct Geol 1993 15 369ndash382 [CrossRef]
149 Hunter NJR Wilson CJL Luzin V Comparison of quartz crystallographic preferred orientationsidentified with optical fabric analysis electron backscatter and neutron diffraction techniques J Microsc2017 265 169ndash184 [CrossRef]
150 Lutterotti L Vasin R Wenk H-R Rietveld texture analysis from synchrotron diffraction images I Basicanalysis Powder Diffr 2014 29 76ndash84 [CrossRef]
151 Wenk H-R Lutterotti L Kaercher P Kanitpanyacharoen W Miyagi L Vasin R Rietveld texture analysisfrom synchrotron diffraction images II Complex multiphase materials and diamond anvil cell experimentsPowder Diffr 2014 29 220ndash232 [CrossRef]
152 Wenk H-R Standard project for pole figure determination by neutron diffraction J Appl Cryst 1991 24920ndash927 [CrossRef]
Minerals 2019 9 277 35 of 35
153 Ullemeyer K Braun G Dahms M Kruhl JH Olesen NOslash Siegesmund S Texture analysis of amuscovite-bearing quartzite A comparison of some currently used techniques J Struct Geol 2000 221541ndash1557 [CrossRef]
154 Wenk H-R Texture analysis by advanced diffraction methods In Modern Diffraction Methods Mittemeijer EJWelzel U Eds Wiley-VCH Weinheim Germany 2012 pp 173ndash220
copy 2019 by the authors Licensee MDPI Basel Switzerland This article is an open accessarticle distributed under the terms and conditions of the Creative Commons Attribution(CC BY) license (httpcreativecommonsorglicensesby40)
- Introduction
- Samples
- Experimental Methods
-
- Some Remarks on Coordinate Systems and Quartz Crystallography
- Neutron Diffraction
- SEM-EBSD
-
- Results
- Discussion
-
- Quartz Texture Types
- Bergell Quartz Textures
- Polycrystal Plasticity Modeling
- Multiphase Issues
- Textures of Associated Marble
- Dynamic Recrystallization
- Mechanical Dauphineacute Twinning
- Comparison of Methods of Texture Measurements
-
- Conclusions
- References
-
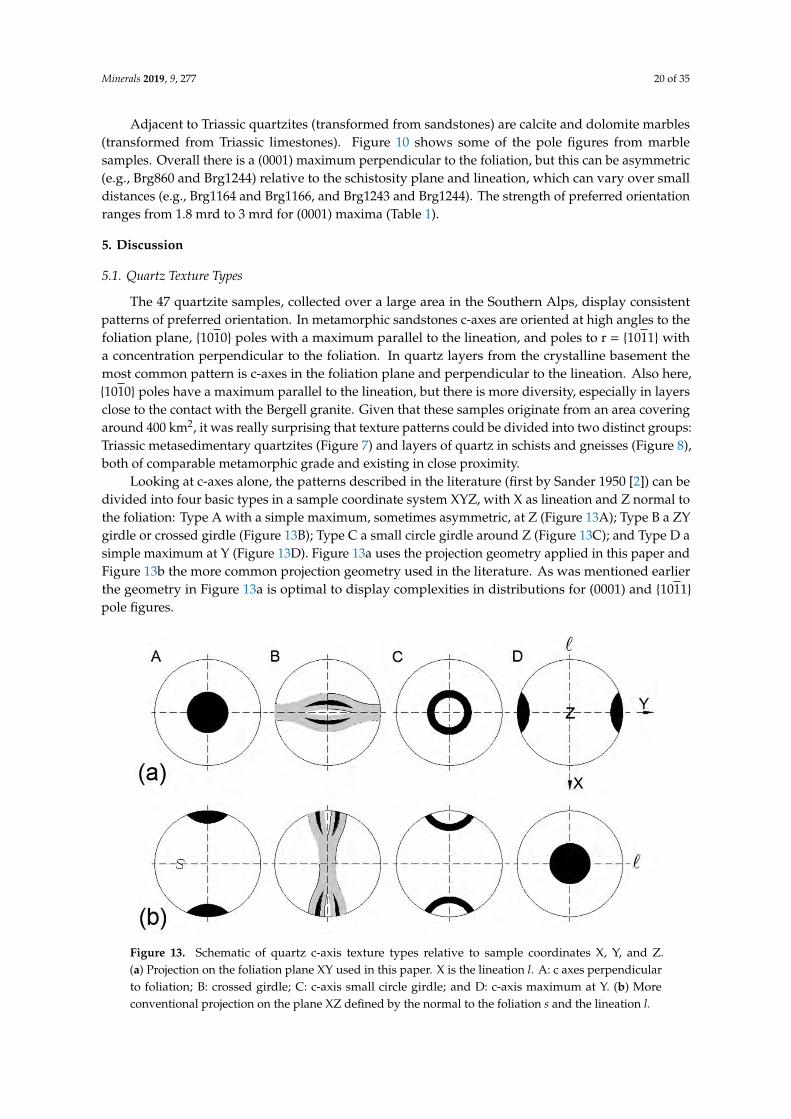