Mineral Commodity Profile--Nitrogen - USGS · Figure that shows ammonia supply-demand...
49
U.S. DEPARTMENT OF THE INTERIOR EY pen-File Report 2004-1290 ineral Commodity Profiles itrogen 2004 Any use of trade names is for descriptive purposes only and does not imply endorsement by the U.S. Government. U.S. GEOLOGICAL SURV O M N By Deborah A. Kramer
Transcript of Mineral Commodity Profile--Nitrogen - USGS · Figure that shows ammonia supply-demand...

U.S. DEPARTMENT OF THE INTERIOR EY
pen-File Report 2004-1290
ineral Commodity Profiles
itrogen
2004
Any use of trade names is for descriptive purposes only and does not imply endorsement by the U.S. Government.
U.S. GEOLOGICAL SURV
O
M N By Deborah A. Kramer

2
CONTENTS Overview .............................................................................................................................................................................................. 4 History .................................................................................................................................................................................................. 4 Description............................................................................................................................................................................................ 5 Uses....................................................................................................................................................................................................... 6 Ammonia........................................................................................................................................................................................... 6 Urea................................................................................................................................................................................................... 8 Ammonium nitrate ............................................................................................................................................................................ 8 Ammonium sulfate............................................................................................................................................................................ 8 Nitric acid.......................................................................................................................................................................................... 8 Environmental impact ....................................................................................................................................................................... 8 Sources of nitrogen ............................................................................................................................................................................... 9 Mining and processing.......................................................................................................................................................................... 9 Chilean nitrate deposits ..................................................................................................................................................................... 9 Ammonia...........................................................................................................................................................................................10 Urea...................................................................................................................................................................................................11 Ammonium nitrate ............................................................................................................................................................................12 Ammonium sulfate............................................................................................................................................................................12 Nitric acid..........................................................................................................................................................................................12 The industry ..........................................................................................................................................................................................12 The market ............................................................................................................................................................................................12 Prices.................................................................................................................................................................................................16 Supply, demand, sustainable development ...........................................................................................................................................16 U.S. supply and demand....................................................................................................................................................................16 World production, consumption, trade..............................................................................................................................................16 Sustainable development...................................................................................................................................................................19 Nitrogen soil inputs .....................................................................................................................................................................31 Nitrogen soil outputs ...................................................................................................................................................................31 Nitrogen air emissions .................................................................................................................................................................32 Economic factors ..................................................................................................................................................................................33 Costs..................................................................................................................................................................................................36 Transportation ...................................................................................................................................................................................37 Outlook .................................................................................................................................................................................................38 References cited....................................................................................................................................................................................40 Appendix. Selected nitrogen data, 1970–2002.....................................................................................................................................42
FIGURES 1. Flow diagram that shows nitrogen fertilizer production routes.................................................................................................. 6 2. Flow diagram that shows principal downstream products of ammonia and their uses .............................................................. 7 3. Flow diagram that shows basic ammonia steam reforming production process ........................................................................10 4. Pie chart that shows world ammonia production capacity, by region ........................................................................................15 5. Graph that shows U.S. ammonia production capacity and natural gas prices ............................................................................16 6. Pie chart that shows U.S. ammonia production capacity, by State.............................................................................................17 7. Graph that shows average ammonia prices, 1970–2002 ............................................................................................................18 8. Graph that shows ammonia and natural gas prices ....................................................................................................................18 9. Figure that shows ammonia supply-demand relationships, 2002...............................................................................................19 10. Graph that shows U.S. production and consumption of ammonia, 1970–2002..........................................................................25 11. Map that shows U.S. fertilizer nitrogen consumption, by State, crop year 2001–02 .................................................................25 12. Pie chart that shows U.S. nitrogen use and crop plantings, crop year 2000–01 .........................................................................26 13. Graph that shows world nitrogen fertilizer nutrient consumption, in crop years .......................................................................26 14. Map that shows ammonia world trade, by region, 2002 ............................................................................................................27 15. Map that shows urea world trade, by region, 2002 ....................................................................................................................28 16. Map that shows ammonium nitrate world trade, by region, 2002 ..............................................................................................29 17. Map that shows ammonium sulfate world trade, by region, 2002..............................................................................................30 18. Figure that shows the nitrogen cycle..........................................................................................................................................31 19. Pie chart that shows nitrous oxide emissions, by source, in the United States, 2001.................................................................33 20. Graph that shows nitrous oxide emissions in developed countries ............................................................................................34 21. Graph that shows nitrous oxide emissions in developed countries, by region ...........................................................................34 22. Figure that shows the projection of nitrous oxide emissions based on various model scenarios ...............................................35

3
23. Graph that shows estimated average ammonia production costs of North American producers at various levels of natural gas prices ...........................................................................................................................................................36
24. Pie chart that shows projected world ammonia capacity, by region, 2008.................................................................................38 25. Graph that shows world ammonia trade.....................................................................................................................................39
TABLES 1. Ranges of nutrient contents in multinutrient fertilizers .............................................................................................................. 6 2. World production in 2002 and production capacity in 1992, 1997, and 2002............................................................................13 3. World ammonia production, by country ....................................................................................................................................20 4. Global sources of atmospheric NOx, NH3, and N2O, 1990........................................................................................................37 A-1. Salient ammonia statistics ..........................................................................................................................................................43 A-2. Major downstream nitrogen compounds produced in the United States ....................................................................................44 A-3. U.S. imports of major nitrogen compounds ...............................................................................................................................45 A-4. U.S. exports of major nitrogen compounds................................................................................................................................47 A-5. Price quotations for major nitrogen compounds at yearend .......................................................................................................49

4
OVERVIEW Nitrogen (N) is an essential element of life and a part of all animal and plant proteins. As a part of the DNA and RNA molecules, nitrogen is an essential constituent of each individual’s genetic blueprint. As an essential element in the chlorophyll molecule, nitrogen is vital to a plant’s ability to photosynthesize. Some crop plants, such as alfalfa, peas, peanuts, and soybeans, can convert atmospheric nitrogen into a usable form by a process referred to as “fixation.” Most of the nitrogen that is available for crop production, however, comes from decomposing animal and plant waste or from commercially produced fertilizers. Commercial fertilizers contain nitrogen in the form of ammonium and/or nitrate or in a form that is quickly converted to the ammonium or nitrate form once the fertilizer is applied to the soil. Ammonia is generally the source of nitrogen in fertilizers. Anhydrous ammonia is commercially produced by reacting nitrogen with hydrogen under high temperatures and pressures. The source of nitrogen is the atmosphere, which is almost 80 percent nitrogen. Hydrogen is derived from a variety of raw materials, which include water, and crude oil, coal, and natural gas hydrocarbons. Nitrogen-based fertilizers are produced from ammonia feedstocks through a variety of chemical processes. Small quantities of nitrates are produced from mineral resources principally in Chile. In 2002, anhydrous ammonia and other nitrogen materials were produced in more than 70 countries. Global ammonia production was 108 million metric tons (Mt) of contained nitrogen. With 28 percent of this total, China was the largest producer of ammonia. Asia contributed 46 percent of total world ammonia production, and countries of the former U.S.S.R. represented 13 percent. North America also produced 13 percent of the total; Western Europe, 9 percent; the Middle East, 7 percent; Central America and South America, 5 percent; Eastern Europe, 3 percent; and Africa and Oceania contributed the remaining 4 percent (International Fertilizer Industry Association, 2003b, p. 1–4). In 2002, world ammonia exports were 13.1 Mt of contained nitrogen. Trinidad and Tobago (22 percent), Russia (18 percent), Ukraine (10 percent), and Indonesia (7 percent) accounted for 57 percent of the world total. The largest importing regions were North America with 36 percent of the total followed by Western Europe with 23 percent and Asia with 22 percent (International Fertilizer Industry Association, 2003b, p. 5L–11). In 2002, world urea production was 51.4 Mt of contained nitrogen, and exports were 12.0 Mt of contained nitrogen. China and India, which were the two largest producing countries, accounted for 48 percent of world production. The United States and Canada produced about 10 percent of the total. Russia and Ukraine together accounted for 28 percent of total urea exports; Central America and South America, 27 percent; and Asia, North America, and Western Europe, 10 percent each. North America accounted for 36 percent of the total urea imports; Western Europe, 23 percent; and Asia, 22 percent (International Fertilizer Industry Association, 2003f, p. 1–15). Ammonia production capacity in North America and Western Europe is projected to decline through 2004, and capacity in other world regions is projected to increase. Fluctuating natural gas prices are mainly responsible for the capacity decline in North America. Ammonia production capacity is continuing to shift to world regions that have abundant sources of natural gas, and away from those where costs (raw material, labor, environmental compliance) are higher.
HISTORY Natural fertilizers, such as manures and ground animal bones, have been used since ancient times. The ideas of rotating crops, letting soil lie fallow, and planting certain crops to enrich the soil are also very old. The modern study of plants, soils, and the chemical requirements for growth was not established until the 1840s in Europe. The first production of fertilizers from inorganic chemical sources also began at this time. Scientific study established the following elements as being necessary in large quantities for plant growth: nitrogen, phosphorous and potassium. From the 1840s to the present, various deposits of phosphate rock and potash have been found to provide adequate sources of the elements phosphorus and potassium. For nitrogen, however, one source, Chilean saltpeter (NaNO3), accounted for more than 60 percent of the world’s supply for most of the 19th century. Other sources of nitrogen, such as guano, usually were depleted within a few years. Ammonia and nitrates were produced from the distillation of coal and as industrial byproducts of other chemical processes. Prior to the 20th century, sources of fixed nitrogen compounds were limited to natural organic materials, natural nitrates, and coke-oven byproducts. Two techniques for nitrogen fixation—the cyanamide process and the electric-arc process—were commercially established by 1910, but both required significant quantities of energy. During the first decade of the 20th century, the worldwide demand for nitrogen-based fertilizers exceeded the existing supply. The largest source of the chemicals necessary for fertilizer production was the nitrate deposits along the coast of Chile. Sodium nitrate mined from natural deposits in Chile was imported into Europe and North America beginning in about 1830. During the 1920s, sodium nitrate imports from Chile were still a very important source of nitrogen in the United States with consumption of about 550,000 metric tons per year (t/yr). Byproduct ammonium sulfate from coke-oven gases became the most important nitrogen fertilizer from the 1920s until 1944 when it was overtaken by ammonium nitrate. Ammonium nitrate, which was imported from Germany, first was used in the United States in 1926. Significant quantities of this nitrogen source were not available to American farmers until 1943, when supplies exceeded the need for munitions. Additional surplus quantities of this material were released for fertilizer use in 1944 and 1945. With the commercialization of the Haber-Bosch process for producing ammonia in the 1950s, ammonia became the principal source of nitrogen in fertilizer in the United States and accounted for about 70 percent of the total (Beaton, undated).

5
Fritz Haber developed a commercial-scale ammonia production process. Haber invented a large-scale catalytic synthesis of ammonia from elemental hydrogen and nitrogen gas, which are abundant and inexpensive reactants. In the presence of an iron catalyst, Haber forced relatively unreactive gaseous nitrogen (N2) and hydrogen (H2) to combine into ammonia at a temperature of about 500E C and a pressure of approximately 204 atmospheres (atm) [3,000 pounds per square inch (psi)]. To improve the process and produce greater quantities of ammonia, Haber substituted osmium and uranium catalysts. Carl Bosch commercialized this process on a large industrial scale by developing an apparatus that safely operated at high pressure and high temperature. Haber’s original catalysts, osmium and uranium, had to be replaced by materials that would be cheaper and more easily available. Bosch and his collaborators found the solution by using pure iron with certain additives. Further problems that had to be solved were the construction of safe high-pressure blast furnaces and an inexpensive way of producing and cleaning the gases necessary for the synthesis of ammonia. Bosch went on to use increasingly larger manufacturing units and thus created the industry that produces synthetic ammonia. The resulting industrial-scale process was termed the Haber-Bosch process. The original laboratory-scale process was first demonstrated in 1909 and patented by Haber in 1910. Haber received the Nobel Prize in Chemistry in 1918 for his ammonia production process and, Bosch received the Nobel Prize for Chemistry, jointly with Friedrich Bergius, for their contributions to the invention and development of chemical high-pressure methods in 1931 (Nobel Foundation, undateda, b). Although the Haber-Bosch process has been modified since its development, mostly to improve processing efficiencies, it remains the basis of ammonia production facilities. Introduction of single-train ammonia units in the mid-1960s led to economies of scale, which lowered production costs. Urea was the first organic compound to be synthesized from inorganic starting materials. It was first discovered in human urine by H.M. Rouelle in 1773. It was synthesized in 1828 by Friedrich Wohler when he attempted to synthesize ammonium cyanate. When treating silver cyanate with an ammonium chloride solution, he obtained a white crystalline material that proved identical to urea obtained from urine. In 1870, urea was produced by heating ammonium carbamate in a sealed vessel, providing the basis for the current [2002] industrial production process. Johann R. Glauber first synthesized ammonium nitrate in 1659 when he combined ammonium carbonate and nitric acid. The principal use for this material was as a replacement for dynamite and other high explosives. After World War II, ammonium nitrate’s use as a fertilizer increased.
DESCRIPTION Ammonia (NH3) has a molecular weight of 17.03 and contains 82.2 percent nitrogen and 17.8 percent hydrogen. At standard temperature and pressure, ammonia is a colorless gas with a pungent, readily identifiable odor when it is present in concentrations of greater than 50 parts per million (ppm). Its boiling point is –33.35E C, and its melting point is –77.7E C. Urea (NH2CONH2 or CH4N2O) has a molecular weight of 60.06 and typically contains 45.9 percent nitrogen. At room temperature, urea is colorless, odorless, and tasteless. When it is dissolved in water, it hydrolyzes very slowly to ammonium carbamate and eventually decomposes to ammonia and carbon dioxide (CO2). This reaction is the basis for the use of urea as fertilizer. Commercially available urea-ammonium nitrate (UAN) solutions typically contain from 28 to 32 percent nitrogen. Ammonium nitrate (NH4NO3) has a molecular weight of 80.04 and contains 33.9 percent nitrogen. It is a white, crystalline salt that is highly soluble in water. The solid salt picks up water from the air when the vapor pressure of water exceeds that of a saturated aqueous ammonium nitrate solution; solid ammonium nitrate does not occur in nature. Ammonium sulfate [(NH4)2SO4] is a white, soluble, crystalline salt that has a molecular weight of 132.14, and contains about 21.2 percent nitrogen. The salt begins to decompose at 100E C, and forms ammonia and ammonium bisulfate. Above 300E C, ammonium sulfate decomposition becomes more extensive and forms nitrogen, sulfur dioxide, sulfur trioxide, and water in addition to ammonia. Nitric acid (HNO3), which has a molecular weight of 63.01, is a strong acid, a powerful oxidizing compound, and a nitrating agent that contains about 22.2 percent nitrogen. Crystals of pure nitric acid are colorless and stable. Above its melting point of –41.6E C, nitric acid is a colorless liquid that fumes in moist air and has a tendency to decompose and forms oxides of nitrogen. The rate of decomposition is accelerated by exposure to light and increases in temperature. It is miscible with water in all proportions. It forms an azeotrope (constant-boiling mixture) with a composition of 68 percent nitric acid and 32 percent water that boils at 120.5E C. Nitric acid is typically sold as a solution of from 52 to 68 percent nitric acid in water. Any natural or manufactured material, which contains at least 5% of one or more of the three primary nutrients [nitrogen, phosphate (P2O5), potassium oxide (K2O)], can be called fertilizer. Industrially manufactured fertilizers are called mineral fertilizers. Fertilizers that contain only one primary nutrient are called straight fertilizers. Those that contain two or three primary nutrients are called multinutrient fertilizers, sometimes they are also called binary (two-nutrient) or ternary (three-nutrient) fertilizers. Some of the most important (as well as the regionally important) straight fertilizers that contain nitrogen are as follows:
• Urea is the world’s major source of nitrogen because of its high concentration and its usually attractive price per unit of nitrogen. Its application, however, requires exceptionally good agricultural practices to avoid evaporation losses of ammonia to the air. Urea should be applied only when it is possible to incorporate it into the soil either immediately after spreading or when rain is expected within the few hours following the application.
• Ammonium sulfate is not as concentrated as urea. In addition to nitrogen, however, it contains 23 percent sulfur, which is a plant nutrient that is of growing importance. It is used by preference on irrigated crops and where sulfur has to be applied. The same holds true for ammonium sulfate nitrate with 26 percent nitrogen (about ⅔ in the form of ammonia and ⅓ in the form of nitrate) and from 13 to 15 percent sulfur.

• Calcium ammonium nitrate with up to 27 percent nitrogen (equal parts of ammonia and nitrate nitrogen) is the preferred fertilizer on crops in semiarid regions of the subtropics.
In general, the three distinct types of multinutrient fertilizers are as follows:
• Complex fertilizers—manufactured through processes that involve a chemical reaction between the constituents that contain the primary plant nutrients (each granule contains the declared ratio of nutrients);
• Compound fertilizers—granulated straight fertilizers or intermediates; the granules containing the nutrients in varying ratios; and
• Mixed fertilizers or blends—simple mechanical mixtures of straight fertilizers (Food and Agriculture Organization of the United Nations and International Fertilizer Industry Association, 2000, p. 32–35).
Table 1 lists the ranges of nutrients in nitrogen multinutrient fertilizers.
Table 1. Ranges of nutrient contents in multinutrient fertilizers. [Food and Agriculture Organization of the United Nations and International Fertilizer Industry Association, 2000, p. 44. —, Zero.] Percentage
Fertilizer type Nitrogen PhosphatePotassium
oxide Nitrogen-phosphorous-potassium.......... 5-26 5-35 5-26 Ammonium phosphates:
Diammonium phosphate..................... 16-18 42-48 — Monoammonium phosphate ............... 11 52 —
Nitrophosphates..................................... 20-26 6-34 —
USES Most nitrogen is used in the form of a nitrogen compound, most of which is derived from ammonia. Elemental nitrogen is used extensively by the aerospace, electronics, food, and metals industries because of its cryogenic and inert properties. Nitrogen can be used to prevent fires and explosions, as a purging agent for cleaning and processing equipment, and as a controlling atmosphere for annealing and heat treating and other metal preparation processes in which oxygenation is a concern.
Ammonia plant
Nitric acid plant
Nitrophosphate plant
Phosphoric acid plant
Sulfuric acid plant
Urea plant
Ammonium nitrate plant
Calcium nitrate plant
NPK fertilizer plant
Ammonium phosphate plant
Natural gasWater
Air
WaterAir
Phosphaterock
Phosphaterock
Sulfur
AmmoniaCarbon dioxide
Potash
Nitric acidAmmonium nitrate
Sulfuric acid
More than 85 to the field as a fUAN solution, orelationships am
Figure 1. Nitrogen fertilizer production routes. (Food and Agriculture Organization of theUnited Nations and International Fertilizer Industry Association, 2000.)
AMMONIA
percent of the ammonia used in the United States is used for fertilizer applications. Ammonia can be directly applied ertilizer, or more often, it is converted into another compound, such as ammonium nitrate, diammonium phosphate, r urea and then used as a fertilizer (figure 1). Figure 2 lists some of the uses for ammonia and the complex ong some ammonia-derived products.
6

An average corn crop in North America will remove more than 2.7 billion kilograms (Gg) (6 billion pounds) of nitrogen from the soils every year. Each year, hay, which is grown to feed livestock, removes 3.4 Gg (7.4 billion pounds) of nitrogen from the fields, alfalfa hay, 2.2 Gg (4.9 billion pounds); and wheat, which is the most commonly used grain for human foods, 1.1 Gg (2.4 billion pounds). Fruits and vegetables are also big users of nitrogen. Bell peppers, grapes, snap beans, and sweet corn all take up about 112 kilograms per hectare (kg/ha) (100 pounds per acre) of nitrogen. Onions, peas, pineapple, and tomatoes take up from 168 to 224 kg/ha (150–200 pounds per acre) of nitrogen, and potatoes remove more than 280 kg/ha (250 pounds per acre) of nitrogen (Potash Corp. of Saskatchewan, 2001).
ExplosivesExplosives
Animal feedAnimal feed
FertilizerFertilizer
Plastics, fibers, and resins
Plastics, fibers, and resins
Ammonium phosphates
Nitric acid[HNO3]
Urea[NH2CONH2]
Ammonia[NH3]
Adipic acid
Toluene-diisocyanate
Methylene diphenyl
diisocyanate
Melamine
Hydrogen cyanide[HCN]
Caprolactam
Ammonium nitrate
[NH3NO3]
Ammonium sulfate[(NH4)2SO4]
Acrylonitrile
Figure 2. Principal downstream products of ammonia and their uses.
Fiber production is the principal nonagricultural use of ammonia. By means of the production of nitric acid, ammonia is used in the production of adipic acid, which is a key intermediate in nylon production. Ammonia also is used to produce caprolactam, which also is used for nylon production, by reaction with cyclohexanone. The caprolactam production process serves as the main source of the world’s ammonium sulfate, which is a byproduct. Nitrogen & Methanol (2000) estimated that about 4.5 million metric tons per year (Mt/yr) of caprolactam is produced worldwide, which accounts for about 6.0 Mt/yr of ammonia consumption. Acrylonitrile is another ammonia-based product that is used in fiber production and is manufactured primarily through a catalytic reaction of ammonia with propylene. Global acrylonitrile production, which uses about 2.5 Mt/yr of ammonia, was estimated to be about 5.5 Mt/yr. Hydrogen cyanide, which is manufactured by catalytic synthesis from ammonia and hydrocarbons, is used in the manufacture of adiponitrile, which is used in the production of nylon. Plastics production is another large nonagricultural use for ammonia. In addition to its use in fiber production, acrylonitrile also is used in the production of acrylonitrile-butadiene-styrene plastics and of synthetic rubber and other elastomers. Hexamethylenetetramine, which is produced from ammonia and formaldehyde, is used in the manufacture of phenolic thermosetting resins. Through urea production, ammonia also is a component of melamine, which is used in adhesives, laminates, paper and textiles, and surface coatings. Global melamine production was estimated to be 450,000 t/yr. Ammonia can be converted, by means of nitric acid, to toluene diisocyanate, which is used in polyurethane production. Ammonia is also converted to nitrobenzene, which is used to make aniline dyes. In addition to its use as a dye, aniline is an intermediate in the formation of methylene diisocyanate, which, in turn, is a component of urethane foams. Acetone cyanohydrin, which is used in acrylic plastics, is manufactured from hydrogen cyanide. Nitrogen & Methanol (2000) estimated that about 10 percent of nonagricultural ammonia, or about 2 Mt/yr, is used as a refrigerant gas, mainly in large commercial or industrial refrigeration systems. As a refrigerant gas, ammonia is highly energy efficient, relatively inexpensive, noncorrosive, and tolerant of impurities. Also, because of its distinctive odor, small leaks can be identified and repaired before they become serious. Although a significant portion of ammonia has been replaced by halogenated hydrocarbons in this use, the ozone-damaging potential of the hydrocarbons has resulted, in some cases, in a switch back to ammonia. Because ammonia refrigeration systems operate at elevated pressures, these systems must be maintained and operated to prevent releases; ammonia is considered to be a significant health hazard because it is corrosive to the eyes, lungs, and skin.
7
Ammonia can be a component in the synthesis of methamphetamine, which is of particular concern to drug and law enforcement agencies. Methamphetamines are synthetic amphetamines, or stimulants, that are produced and sold illegally in capsule, chunk, pill,

8
and powder forms. Methamphetamines stimulate the central nervous system, and the effects may last anywhere from 8 to 24 hours depending on the dosage and concentration of the drug. Methamphetamines can be manufactured in small laboratories by using common ingredients. In one common manufacturing technique referred to as the “Nazi method,” lithium that has been extracted from batteries and anhydrous ammonia are used to convert ephedrine from over-the-counter cold remedies to make methamphetamine. As a result, theft of anhydrous ammonia fertilizer from farms, retail outlets, and even ammonia pipelines for production of methamphetamines has escalated.
UREA Solid urea, which contains from 0.8 to 2.0 weight percent biuret (NH2CONHCONH2), is primarily used for direct application to the soil as a nitrogen-release fertilizer; biuret is an undesirable component produced by heating urea at a high temperature, which causes the condensation of two urea molecules. Weak aqueous solutions of low biuret urea (0.3 weight percent maximum) are used as plant food applied to foliage spray. Mixed with additives, urea is used in solid fertilizers of various formulations, which include urea-ammonium phosphate, urea-ammonium sulfate, and urea-phosphate (urea plus phosphoric acid). Concentrated solutions of UAN (80–85 weight percent) have a high nitrogen content but a low crystallization point, and are suitable for easy transportation, pipeline distribution, and direct spray application. Urea is used as a feed supplement for ruminants because it assists in the digestion of protein. Urea also is one of the raw materials used to manufacture urea-formaldehyde resins. At high temperature and pressure, urea (with ammonia) pyrolyzes to form melamine plastics. Urea is used in the preparation of lysine, which is an amino acid widely used in poultry feed. It also is used in some pesticides. Partially polymerized resins of urea are used by the textile industry to impart permanent-press properties to fabrics.
AMMONIUM NITRATE Before World War II, most ammonium nitrate was used as an ingredient in high explosives. After World War II, its use as a fertilizer grew rapidly to reach about 90% of production in 1975. Most ammonium nitrate manufactured for the explosives market is used in blasting agents prepared by adding a fuel component, such as diesel oil, to the prilled product. This mixture is commonly referred to as “ANFO” (ammonium nitrate-fuel oil). More than 65 percent of the ammonium nitrate-based explosives is used in coal mining; the remainder is used in, in declining order, metal mining, nonmetal mining and quarrying, and highway construction. When used in blasting, ammonium nitrate is mixed with fuel oil and sometimes sensitizers such as powdered aluminum. Lower density ammonium nitrate is preferred for explosive formulation because it absorbs the oil more effectively. A small but important use of ammonium nitrate is in the production of nitrous oxide gas; during the 1980s, consumption for this purpose averaged about 30,000 t/yr. The gas is generated by controlled heating ammonium nitrate to above 200E C. Nitrous oxide is used primarily as an anesthetic and an aerosol propellant for food products.
AMMONIUM SULFATE Ammonium sulfate is used mainly as a nitrogenous fertilizer and accounts for about 4 percent of the world’s nitrogen fertilizer market (Nitrogen & Methanol, 2002). Ammonium sulfate has been replaced in some fertilizer applications because of its lower nitrogen content (about 21 percent compared with 34 percent for ammonium nitrate and 46 percent for urea). Ammonium sulfate, however, has about 45 percent sulfur by weight; this is a desirable attribute in areas where soils are deficient in sulfur. Nonfertilizer uses for ammonium sulfate, which account for about 5 percent of world ammonium sulfate consumption, include cattle feed, fire control, food processing, and tanning.
NITRIC ACID The largest use of nitric acid, which accounts for about 75 percent of total U.S. production, is for the manufacture of ammonium nitrate. The next three largest uses for nitric acid are in the manufacture of cyclohexanone (about 8–9 percent), dinitrotoluene (about 4 percent), and nitrobenzene (about 3–4 percent). Cyclohexanone is a raw material that is used to manufacture adipic acid, which reacts with hexamethylenediamine to make nylon-6,6. Dinitrotoluene is hydrogenated to toluenediamine, which is used to make toluene diisocyanate. Nitrobenzene is hydrogenated to make aniline, which is a raw material that is used to manufacture methylene diphenyl diisocyanate. Toluene diisocyanate is used to make coatings, elastomers, and flexible polyurethane foams, and methylene diphenyl diisocyanate is used for rigid foams. Other uses of nitric acid are in the production of explosives; metal nitrates; metal treatments, such as the pickling of stainless steels and metal etching; nitrocellulose; nitrochlorobenzene; nuclear fuel processing; and rocket propellants (Innovation Group, The, 2002).
ENVIRONMENTAL IMPACT The production of ammonia generates substantial quantities of CO2, which contributes to global warming. If natural gas is used as the feedstock in a modern steam reforming plant, then about 2.7 metric tons (t) of CO2 per metric ton of nitrogen is produced. If coal or fuel oil is used, then this figure is about 25 percent higher. The production of urea, however, requires an input of about 1.6 t of CO2 per ton of nitrogen. The fertilizer industry’s share of the annual net addition of CO2 to the atmosphere that results from human

9
activities is estimated to be 2 percent; and human activities account for only 7 percent of the quantity released annually by biological processes. Consequently, the share of fertilizer production in the total annual release of CO2 to the atmosphere is very small (approximately 0.1–0.2 percent). Nevertheless, projected growth of fertilizer use makes it important that the industry keep CO2 emissions as low as possible. Although ammonia plants continue to try to reduce CO2 emissions through process improvements, future reductions of CO2 emissions most likely will be from the replacement of old inefficient plants. The production of nitric acid used for ammonium nitrate and nitrophosphate fertilizers leads to the emission of nitrous oxide (N2O), which is a much more potent global warming agent than carbon dioxide. The U.S. Environmental Protection Agency (EPA) (2003, p. ES-10) estimated that N2O is 310 times more effective at trapping heat in the atmosphere than carbon dioxide during a 100-year time period. It also is considered to be detrimental to the ozone layer. The rate of N2O emission varies widely from 1 to more than 10 kilograms per metric ton (kg/t) of 100 percent nitric acid. Abatement techniques can reduce N2O emissions significantly but are costly. The International Fertilizer Industry Association (1998, p. 43–44) estimated that fertilizer production accounts for about 6 percent of human-generated N2O emissions compared with nearly 50 percent from motor vehicles. Most N2O recycles to land and water, and as with CO2, larger quantities are emitted through natural biological processes. N2O is estimated to be responsible for 7.5 percent of the calculated global warming effect of human activities. Fertilizer production is estimated to be responsible for less than 0.5 percent of this effect. Nitrogen oxides (NOx) also are emitted from ammonia and nitric acid plants. Nitric oxide (NO) is oxidized over a few days to nitrogen dioxide (NO2), which has an atmospheric residence time of about a week and is deposited in air, rain, or as nitrate particulates. This contributes to acid rain and smog. In the case of ammonia, NOx emissions are about 1 to 2 kg/t of converted nitrogen. For nitric acid, however, NOx emissions amount to 6 to 9 kg/t of converted nitrogen. Selective catalytic reduction, which uses ammonia to convert NOx to nitrogen, can be an effective means of abatement, and more than 0.5 Mt of ammonia is used annually for this purpose (International Fertilizer Industry Association, 1998, p. 43–44).
SOURCES OF NITROGEN The Atacama Desert in South America contains the largest nitrate deposits in the world. Until the 1920s, this was the most important resource for nitrogen fertilizers in the world. Because of these rich nitrate deposits, Bolivia, Chile, and Peru fought to claim the area. Much of the area originally belonged to Bolivia and Peru, but the mining industry was controlled by Chile. Chile emerged victorious in the War of the Pacific, which was fought among the three countries from 1879 to 1883. The Treaty of Ancón gave Chile permanent ownership of the nitrate-containing land. Chile acquired Atacama, which was Bolivia’s only coastal territory, now known as Antofagasta. Peru ceded Tarapacá to Chile and surrendered control of Arica and Tacna. The origin of this unique deposit has been the subject of many theories. Ericksen (1981, p. 1–2) attributed these deposits primarily to the long-term aridity of the environment rather than to an unusual source of saline materials. According to Erickson, saline material came from the spray and evaporation from the Pacific Ocean, from volcanic emissions from the nearby Andes Mountains, and from the nutrient-rich Humboldt Current. The material accumulated slowly on land surfaces that had had little or no modification since the Miocene. It also accumulated on hillsides and at breaks in slopes as the result of redeposition by rainwater and in saltpan and saline ponds. Because the nitrate ores show great local and regional variations in chemical composition, an average composition cannot be determined. The nitrate minerals that are contained in the deposit are soda niter (NaNO3), niter (KNO3), darapskite [Na3(SO4)(NO3)•H2O], and humberstonite [K3Na7Mg2(SO4)6(NO3)2•6H2O] (Ericksen, 1981, p. 21). Other theories that have been proposed for the origin of these deposits are decay of seaweed and other marine vegetation in waters and marshes of partially cut-off inland arms of the sea, nitrification and leaching of seabird guano at the margins of saline lakes, bacterial decay of plant and animal remains during the time of a less arid climate, nitrification and fixation of atmospheric nitrogen from soil bacteria, reaction of feldspathic igneous rocks with atmospheric nitric acid, accumulation of nitrogen compounds of volcanic origin, and nitrate accumulation from diverse sources (Ericksen, 1981, p. 21–23). The mining right of Sociedad Quimica y Minera de Chile S.A.’s (SQM) cover an area in excess of 2.2 million hectares, which amounts to more than 75% of the caliche ore in the world. Caliche mainly is rich in sodium nitrate and iodine, with contents of 6 to 9 percent and 350 to 600 ppm, respectively. Crushing and leaching processes are the starting points for the recovery of the salts contained in the ore. SQM’s proven sodium nitrate reserves are estimated to be 55 Mt, which is equivalent to 55 years of production. Probable reserves amount to almost another 80 years of nitrate and iodine extraction at current output levels (Sociedad Quimica y Minera de Chile S.A., undated a).
MINING AND PROCESSING
CHILEAN NITRATE DEPOSITS The only mined nitrogen material is that from the above-mentioned nitrate deposits in Chile. SQM uses bulldozers to remove the overburden from the deposit and then uses explosives to break up the caliche ore. The broken ore pieces then are loaded into trucks by front-end loaders. Depending on the mine from which the mineral is obtained, it is processed by different methods. The trucks unload the mineral from the Maria Elena Mine over a mobile primary crusher located at the mine site, and then the crushed mineral is transported to the Maria Elena plant by a belt. Ore from the Pedro de Valdivia Mine is stockpiled near temporary train stations where it is loaded onto railroad cars and sent to the Pedro Valdivia production plant. In the Maria Elena and Pedro Valdivia plants, the caliche is mechanically ground to about 12.5 millimeters. The ground mineral is then transferred in containers or cylinders to a

leaching plant where iodine, nitrates, and sulfates are extracted. In the Pampa Blanca Mine, which is located in the Sierra Gorda, the mineral is heap leached to obtain solutions for iodine production. These solutions are transported to solar evaporation pits where the high nitrate salts are crystallized. These salts are transported by truck to the Coya Sur plants where they are used to produce potassium nitrate (Sociedad Quimica y Minera de Chile S.A., undated b).
Natural gas
Desulfurization
Primary reforming
Steam
AirSecondary reforming
Shiftconversion
Carbon dioxide removal
Carbon dioxide
Methanation Methane
Synthesis gas compressor
Synthesis gas converter
Separator
Nitrogen and hydrogen gases
Ammonia storage
Ammonia
The raw materials used inhydrogen in most commercthe steam reforming procesprimary and secondary refoThe overall process for prod
where CH4 is methane. In the first step (desulfuricarbon that ranges in tempecompounds remain in the nsulfur compounds are remonatural gas into H2, CO2, an
Figure 3. Basic ammonia steam reforming production process.
AMMONIA
most ammonia plants are coal, natural gas, and petroleum fractions. Natural gas is the principal source of ial plants in the United States. About 75 to 80 percent of the ammonia produced worldwide is produced by s. This process, which is shown in figure 3, consists basically of the following steps: desulfurization, rming, shift conversion, CO2 removal, synthesis gas purification, and ammonia synthesis and recovery. ucing ammonia from air, natural gas, and water is
3CH4 + 6H2O +4N2 º 8NH3 + 3CO2,
zation), sulfur compounds in the natural gas are removed most commonly by adsorption with activated rature from 15E to 50E C or by reaction with a zinc oxide catalyst at from 350E to 400E C. If sulfur atural gas stream, then they can poison the catalysts that are used in the remaining process steps. After the ved, the feedstock goes through two reforming steps. These steps are designed to break down CH4 in the d carbon monoxide (CO). The reactions that occur during the two reforming stages are
CH4 + H2O º CO + 3H2 and
CO + H2O º CO2 + H2.
10

11
The water (H2O) component of the above reactions is in the form of steam. The natural gas-steam mixture flows through tubes that contain a nickel catalyst bed. The exit gas is heated to a temperature that ranges from 750E to 850E C and a pressure that ranges from about 28 to 35 atm (415–515 psi). The design of the primary reformer catalyst tubes varies slightly depending on the manufacturing process. A precious metal catalyst can be substituted for the nickel catalyst; precious metals catalysts are used in the Kellogg Advanced Ammonia Process. Undesirable reactions can occur in reforming that generate elemental carbon. Operating conditions must be controlled to minimize these reactions, otherwise the carbon can physically break down the nickel catalyst. In the secondary reformer, air, which is the source of nitrogen, is introduced. The secondary reformer is a refractory-lined vessel that also contains a nickel catalyst. Combustion of oxygen from the air is used to produce the heat needed to carry out the second reaction, which generates CO2. The product of the second reforming stage is a mixture of carbon oxides, H2, N2, and other gases. Before ammonia is produced, the CO and CO2 must be removed from the gas mixture. This is accomplished in a two-step shift conversion, which converts the CO to CO2, followed by a CO2 removal step. (The shift conversion is so named because the change in temperature and addition of a catalyst shifts the reaction equilibrium and allows the CO to be converted to CO2.) The hot effluent gases from the secondary reformer are cooled to at temperature of about 30E C above their dew point and fed to a high-temperature shift converter that operates at temperatures that range from 350E to 450E C. Water vapor in the gas mixture reacts with some of the CO to produce more H2 and CO2. An iron oxide-chromium oxide catalyst is used to aid in the reaction. The gas mixture then is fed to a low-temperature shift converter that operates at temperatures that range from 200E to 250E C. Here, most of the remaining CO is converted to CO2 with the aid of a copper oxide-zinc oxide catalyst. The CO2 removal operation also is done in two steps—a bulk CO2 removal in which the CO2 concentration is reduced to a few parts per million and a final purification step. The most common bulk CO2 removal operation is performed by scrubbing the gas with a methyldiethanolamine or monoethanolamine solution, although other chemical or physical absorption methods have been used, such as washing with a potassium carbonate liquid stream. If the ammonia plant is associated with a nearby urea plant, then the CO2 that is removed may be recovered and used for urea production. Any residual CO2 and CO then must be removed from the gas stream. This is normally done by converting the CO2 and CO back to CH4 by introducing H2 gas with a nickel catalyst (the reverse of the reforming reactions). After methanation, cryogenic purification is used to remove the methane from the gas stream. In cryogenic purification, the gas is dried to a very low dew point, and then cooled and expanded in a turbine to liquefy a portion of the stream. The vapor from the partially liquefied stream is scrubbed in a rectifying column to remove almost all the CH4 and about one-half of any unreacted CO2. At this point the gas is compressed to between 136 and 340 atm (2,000 and 5,000 psi) and then passed over an iron catalyst where the nitrogen and hydrogen react to form ammonia by the following reaction:
N2 + 3H2 º 2NH3. The design of the ammonia synthesis section varies from plant to plant and is dependent upon such factors as the pressure chosen for synthesis, the capacity of the plant, and the thermal requirements for process operation. During the ammonia synthesis, not all the N2 and H2 are converted to ammonia. Unreacted gases are separated from the ammonia and recycled to the compressor. The ammonia then is chilled to –33E C to liquefy it and stored in tanks at atmospheric pressure. After production, ammonia may then be used to produce a variety of downstream products, which include ammonium nitrate, ammonium sulfate, nitric acid, and urea (Czuppon, Knez, and Rovner, 1992, p. 645–673).
UREA Urea is produced from liquid NH3 and gaseous CO2 at high pressure and temperature. Both reactants often are obtained from an ammonia synthesis plant; because of this, many urea plants are colocated with ammonia plants. The CO2 is a byproduct stream, which is vented from the CO2 removal section of the ammonia-synthesis plant. The two feed components are delivered to the high-pressure urea reactor usually at a molar ratio of greater than 2.5 to 1. Urea forms by the following reactions:
2NH3 + CO2 º NH2COONH4 and
NH2COONH4 º NH2CONH2 + H2O, where NH2COONH4 is ammonium carbamate. The formation of NH2COONH4 and the dehydration to urea take place simultaneously for all practical purposes. Urea production yields an aqueous solution that contains from 70 to 87 percent urea. This solution can be used directly for nitrogen-fertilizer suspensions or solutions such as urea-ammonium nitrate solution, or it can be concentrated by evaporation or crystallization for the preparation of granular compound fertilizers and other products. Concentrated urea is solidified in essentially pure form as crystals, flakes, granules, or prills. Solid urea can be shipped, stored, distributed, and used more economically than in solution. In addition, in the solid form, urea is more stable, and biuret formation is less likely. The manufacture of prills, however, is decreasing rapidly owing to environmental problems and product quality compared with granules.

12
AMMONIUM NITRATE Historically, ammonium nitrate was manufactured by a double decomposition method that used sodium nitrate and either ammonium sulfate or ammonium chloride. Modern commercial processes, however, rely almost exclusively on the neutralization of nitric acid with ammonia. Manufacturers commonly use on-site ammonia, although some ammonium nitrate is made from purchased ammonia. Solid product used as fertilizer has been the predominant form produced. Sale of ammonium nitrate as a component in urea-ammonium nitrate liquid fertilizer, however, has grown to where about one-half of the ammonium nitrate produced is actually marketed as a solution. The following steps are essential to ammonium nitrate manufacture: neutralization of nitric acid with ammonia to produce a concentrated solution, evaporation to give a melt, and processing by granulation or prilling to produce the commercial solid product (Weston, 1992, p. 698–705).
AMMONIUM SULFATE Ammonium sulfate is produced—by synthesis from coke-oven byproduct gases, as a byproduct of either caprolactam production or methyl methacrylate production, by direct synthesis from ammonia and sulfuric acid, and from sulfur oxide-rich tail gas that is treated with ammonia. Because of its increasing availability as a byproduct, it is not normally produced by direct synthesis. Ammonium sulfate has been produced for centuries from coke-oven gases that are generated when converting coal to coke. Coke-oven gas is mainly H2 and CH4 with small quantities of ammonia, carbon oxides, hydrogen sulfide and other heavier fractions. To produce ammonium sulfate, either ammonia that has been recovered by scrubbing the gas stream with water is then neutralized with sulfuric acid, or the gas stream is scrubbed directly with sulfuric acid. Byproduct production from caprolactam is the principal source of ammonium sulfate throughout the world. Caprolactam is generally produced by the Beckman rearrangement of cyclohexanone oxime. This process, which requires strong sulfuric acid as a catalyst, initially produces caprolactam sulfate. This sulfate is hydrolyzed with ammonia to produce caprolactam and byproduct ammonium sulfate. The caprolactam production process generates as much as 5 t of byproduct ammonium sulfate for every metric ton of caprolactam produced (Nitrogen & Methanol, 2002).
NITRIC ACID Almost all commercial quantities of nitric acid are manufactured by the oxidation of ammonia with air to form nitrogen oxides that are absorbed in water to form nitric acid. Because nitric acid has a maximum boiling azeotrope at 69 weight percent, the processes are usually categorized as either weak (subazeotropic) or direct strong (superazeotropic). Typically, weak processes make from 50 to 65 weight percent acid, and direct strong processes make up to 99 weight percent acid. To produce nitric acid, ammonia and air are mixed so that there is an excess of oxygen. This mixture is then passed over a platinum catalyst to produce NO, water vapor, and a significant quantity of heat. The resulting gases are cooled, thus generating steam that can be exported or used internally. As the process gases cool, NO is further oxidized to form NO2 in equilibrium with dinitrogen tetroxide (N2O4). Because hot liquid nitric acid is corrosive, the extent to which heat can be usefully recovered from the hot process gas is limited by a need to remain above the dew point for HNO3. The process gases are further cooled, and condensate is removed in a cooler-condenser, which is constructed of materials that are resistant to corrosion by hot acid. The process gases then enter a column where the equilibrium mix of NO2 and N2O4 is absorbed into water to produce nitric acid. Nitric oxide, which is released by formation of the nitric acid, must be oxidized to complete the conversion of nitrogen oxides to nitric acid. Spent gases from absorption contain residual levels of NOx, which, for environmental reasons, have to be removed before discharge to the atmosphere (Clarke and Mazzafro, 1997, p. 84–96).
THE INDUSTRY Because of its importance as a fertilizer, nitrogen is used in virtually every country in the world, and as a result, many countries have the facilities for producing ammonia. In 2002, ammonia was produced in 71 countries, and urea was produced in 55. The countries with the largest ammonia production capacity, in descending order, were China, the United States, India, and Russia. Together, these countries accounted for about 50 percent of the total world ammonia production capacity. Countries with the largest urea production capacities were, in descending order, China, India, the United States, and Indonesia. Together, these countries accounted for nearly 55 percent of the total world urea production capacity. Production capacity by country for ammonia and urea is listed in table 2. Figure 4 shows the percentage of ammonia production capacity by world region for 1992, 1997, and 2002; China is separated because of its importance in the world nitrogen industry and it has seen the greatest changes. The most significant gains in production capacity during these years were in Asia. China increased its share of the world total to 23 percent from 17 percent. Some of this increase, however, may not actually be an increase; it may have resulted from additional knowledge gained during this time period about the number and size of the ammonia plants in China. In the rest of Asia, the percentage of total world capacity has increased to 19 from 15 during the same period. Significant contributors to the increase were India and Indonesia. Europe’s ammonia production capacity dropped during this period to 14 percent from 19 percent of the world total. Significant declines occurred in Eastern Europe after the dissolution of the U.S.S.R. in 1991. After 1991, Eastern European countries struggled to change from centrally planned economies to market economies. As a result, some of the least

13
efficient plants were closed, and some plants did not have enough financial support to operate. Production capacity in Western Europe declined as well—to 8 percent from 11 percent of the world total. Ammonia production capacity in the United States has increased to 16,700 Mt/yr in 2002 from 15,200 Mt/yr in 1970, although it fluctuated quite a bit during this time. Figure 5 shows the total U.S. ammonia production capacity from 1970 to 2002 relative to natural gas prices. In general, production capacity increased throughout the 1970s, then fell dramatically in the 1980s, and recovered in the 1990s. Part of the reason for the decline in the 1980s was the result of the energy crisis of the late 1970s and the recession in the early 1980s. Natural gas prices also had a significant effect on ammonia production capacity. Notwithstanding the influences mentioned above, as natural gas prices increased, U.S. ammonia production capacity decreased and as natural gas prices decreased, U.S. ammonia production capacity increased, although there is a time lag between the two events.
Table 2. World production of ammonia and urea in 2002 and production capacity in 1992, 1997, and 2002. [Thousand metric tons of contained nitrogen. International Fertilizer Industry Association 1991a, b, 2003d, e; International Fertilizer Development Center, 1996, 1999. NA, Not available. XX, Not applicable. —, Zero. Data are rounded to three significant digits; because of independent rounding, components may not add to totals shown] Ammonia Urea Production, Capacity Production, Capacity
Country 2002 1992 1997 2002 2002 1992 1997 2002Afghanistan ...................... 20 58 58 58 18 47 47 47Albania ............................. 10 72 147 NA — 36 83 —Algeria.............................. 563 816 816 816 — 67 — —Argentina.......................... 617 88 110 676 517 60 92 584Australia ........................... 686 545 490 855 92 113 113 113Austria .............................. 440 410 380 380 110 138 175 175Bahrain ............................. 377 396 360 326 290 — — 258Bangladesh ....................... 1,290 1,100 1,580 1,550 1,070 1,070 1,320 1,370Belarus ............................. 760 XX 700 740 459 XX 471 362Belgium ........................... 842 805 799 839 — — — —Bosnia and Herzegovina... 1 XX — — — XX — —Brazil ............................... 1,020 952 1,160 1,240 594 558 694 794Bulgaria ........................... 328 1,130 1,070 959 10 498 359 359Burma .............................. 21 200 213 200 20 191 — 191Canada.............................. 3,590 3,320 4,120 4,520 1,850 1,410 1,940 1,940China ................................ 30,100 19,700 23,800 30,000 16,000 6,760 12,800 16,300Colombia .......................... 108 136 136 106 4 — 5 5Croatia ............................. 235 XX 370 369 122 XX 207 228Cuba ................................. 135 321 NA 190 — 108 17 83Czech Republic ............... 215 XX 847 300 61 XX 92 100Czechoslovakia ................ XX 876 XX XX XX 270 XX XXEgypt ................................ 1,840 1,220 1,270 1,910 1,080 493 452 1,120Estonia.............................. 39 XX 164 164 24 XX 92 83Finland ............................ 6 65 NA NA — — — —France............................... 1,050 1,840 1,570 1,480 120 332 337 262Germany........................... 2,560 2,860 2,670 2,790 430 905 809 1,070Georgia............................. 90 XX 328 328 — XX — —Greece ............................. 66 338 99 262 — — — —Hungary............................ 238 791 316 328 76 232 91 91Iceland ............................. — 8 9 — — — — —India ................................. 9,830 8,660 11,000 11,500 8,580 7,050 8,060 9,810Indonesia ......................... 4,200 2,870 3,700 4,670 2,820 2,290 2,950 3,380Iran ................................... 1,120 905 1,300 1,170 733 587 812 812Iraq ................................... 200 272 900 816 220 — 202 795Ireland ............................ 400 366 452 407 100 144 175 175Israel................................. — 66 68 — — 18 — —Italy .................................. 391 1,120 411 502 165 541 385 290Japan................................. 1,190 1,640 1,640 1,610 225 534 437 259Kazakhstan ....................... — XX 362 357 — XX — —Korea, North..................... 100 867 923 867 65 586 508 786

14
Table 2. World production of ammonia and urea in 2002 and production capacity in 1992, 1997, and 2002—Continued.[Thousand metric tons of contained nitrogen. International Fertilizer Industry Association 1991a, b, 2003d, e; International Fertilizer Development Center, 1996, 1999. NA, Not available. XX, Not applicable. —, Zero. Data are rounded to three significant digits; because of independent rounding, components may not add to totals shown] Ammonia Urea Production, Capacity Production, Capacity
Country 2002 1992 1997 2002 2002 1992 1997 2002Korea, Republic of .......... 153 688 670 674 161 409 454 152Kuwait .............................. 414 — 534 609 255 — 364 466Libya ............................... 533 598 598 543 390 412 418 418Lithuania .......................... 467 XX 370 370 168 XX 125 125Malaysia .......................... 848 326 685 1,050 567 276 275 591Mexico ............................. 537 2,380 2,070 2,260 — 595 766 859Netherlands ..................... 1,970 3,090 2,570 2,070 480 704 587 520New Zealand ................... 109 74 76 107 108 74 106 106Nigeria.............................. — 272 300 272 — 228 228 228Norway............................. 330 440 354 395 — — — —Pakistan ........................... 1,960 1,490 1,920 2,290 1,720 1,160 1,290 1,930Peru .................................. 5 128 22 47 — 77 — —Poland............................... 1,310 2,190 1,990 2,280 394 644 407 671Portugal ........................... 190 244 234 234 36 38 40 40Qatar................................. 1,170 488 1,020 895 799 304 744 642Romania ........................... 930 3,710 3,080 2,740 444 1,250 1,170 1,170Russia ............................... 8,600 XX 11,800 10,900 2,110 XX 2,360 2,470Saudi Arabia..................... 1,740 862 1,300 1,820 1,240 731 941 1,200Serbia and Montenegro .... 115 XX 293 247 21 XX 39 39Slovakia ........................... 226 XX 354 214 56 XX 138 58South Africa ..................... 492 602 771 440 — 120 151 —Spain ................................ 415 717 487 495 164 289 204 177Sweden ............................. — — — — — — — —Switzerland....................... 33 40 33 41 — — — —Syria ................................. 143 272 272 256 89 156 145 137Taiwan.............................. — 247 249 — — 146 85 —Tajikistan.......................... 15 XX 101 102 12 XX 87 97Trinidad and Tobago ........ 3,300 1,440 2,210 3,260 310 246 270 270Turkey .............................. 301 577 710 572 255 258 258 258Turkmenistan .................. 75 XX 328 328 — XX — —Ukraine............................. 3,700 XX 5,000 4,090 1,490 XX 1,660 1,550U.S.S.R.1 .......................... XX 22,900 XX XX XX 5,180 XX XXUnited Arab Emirates....... 364 272 271 272 285 227 252 227United Kingdom............... 837 1,100 1,180 1,130 — — — —United States .................... 10,100 13,200 14,400 13,700 3,360 3,220 3,720 3,880Uzbekistan........................ 740 XX 1,290 1,600 118 XX 276 276Venezuela......................... 884 651 657 1,410 497 477 477 786Vietnam ........................... 58 54 54 80 49 51 55 55Yugoslavia1 ...................... XX 1,150 XX XX XX 419 XX XXZambia ............................ — 69 69 69 — — — —Zimbabwe......................... 61 49 66 64 — — — —
Total............................. 108,000 115,000 123,000 131,000 51,400 42,700 51,900 61,2001 Although the U.S.S.R. was dissolved in December 1991and Yugoslavia was dissolved in April 1992, individual country data for 1992 were not available.

1992
1997
2002
North America19%
Western Europe11%
Central Europe8%
Former U.S.S.R.21%
Middle East3%
China17%
Africa3%
Central America and South America
3%
Asia (excluding China)15%
North America17%
Western Europe9%
Central Europe7%
Former U.S.S.R.17%
Middle East6%
China19%
Africa3%
Asia (excluding China)18%
Central America and South America
4%
Asia (excluding China)19%
Central America and South America
5%
North America16%
Africa3%
China23%
Western Europe8%
Central Europe6%
Middle East5%
Former U.S.S.R.15%
Figure 4. World ammonia production capacity, by region.
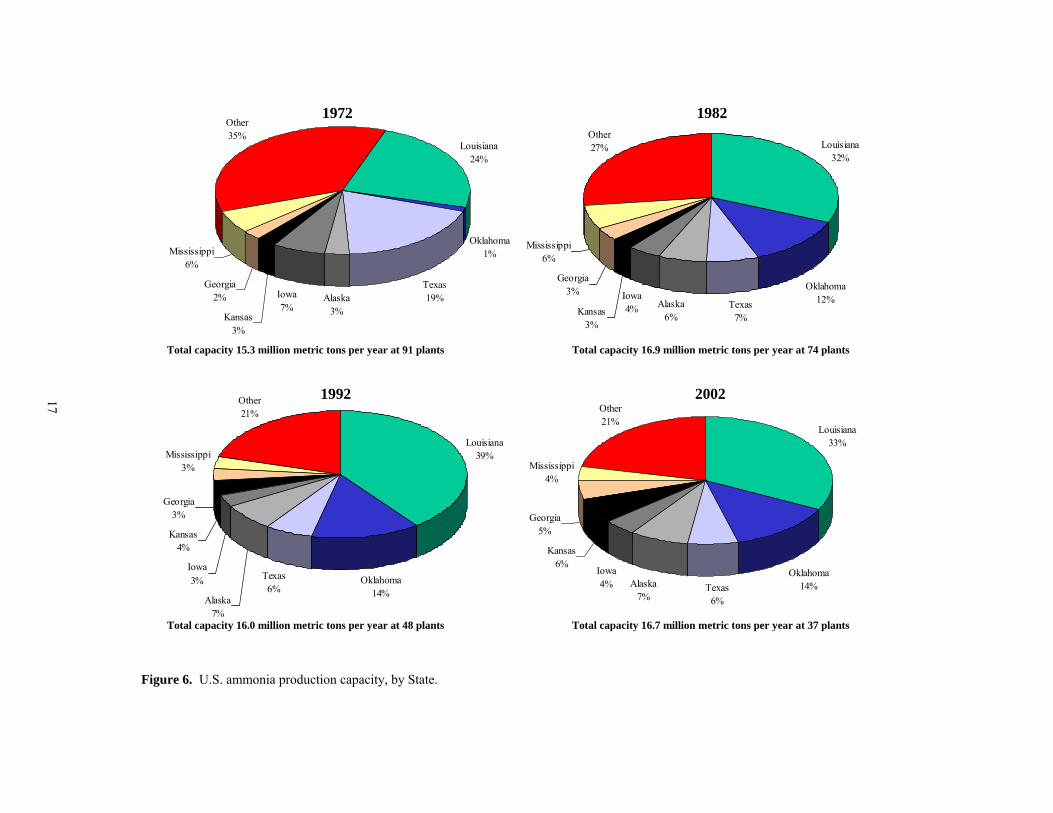
Although U.S. production capacity increased since 1970, the number of firms involved in ammonia production and the total number of plants in the United States decreased. In 1972, 61 companies operated 91 plants; the average plant size was slightly less than
15

170,000 t/yr. By 2002, only 28 companies operated 37 plants; the average plant size was 450,000 t/yr. Figure 6 shows the changes in the U.S. ammonia production capacity in 10-year increments from 1972 to 2002. Of the plants that operated in 2002, 52 percent of total U.S. ammonia production capacity was concentrated in Louisiana (32 percent), Oklahoma (14 percent), and Texas (6 percent) because of large reserves of feedstock natural gas. The following companies, in descending order, accounted for 78 percent of total U.S. ammonia capacity: Farmland Industries Inc., Terra Industries Inc., PCS Nitrogen Inc., CF Industries Inc., Agrium Inc., and Mississippi Chemical Corp.
14,000
15,000
16,000
17,000
18,000
19,000
20,00019
70
1972
1974
1976
1978
1980
1982
1984
1986
1988
1990
1992
1994
1996
1998
2000
2002
0
0.5
1
1.5
2
2.5
3
3.5
4
4.5Capacity Natural gas, wellhead price
AM
MO
NIA
CA
PAC
ITY
, IN
TH
OU
SAN
D M
ETR
IC T
ON
S
NA
TUR
AL G
AS PR
ICE, IN
DO
LLAR
S PER
MILLIO
N B
RITISH
THER
MA
L UN
ITS
Figure 5. U.S. ammonia production capacity and natural gas prices. Prices were converted from dollars per thousand cubic feet using by using an average heat content of 1,027 British thermal units percubic foot.
THE MARKET Fertilizer products are diverse, and each product usually has a range of possible distribution processes. In addition, the structure of the industry varies widely. Fertilizer producers include many large multinational companies, which may be integrated from ammonia production through fertilizer blending and retail sales. At the other extreme, many small companies purchase primary fertilizer materials to make blends, compounds, and mixtures. Adding to this complicated scene, ammonia, mineral phosphate, potassium salts, and sulfur may all be applied to the soil directly so that one company’s raw material may be another’s finished fertilizer.
PRICES Ammonia prices from 1970 to 2002 are shown in figure 7. In 1973, rising energy costs were reflected in the cost of ammonia. Because natural gas costs are such a high percentage of the cost of ammonia production, ammonia prices readily respond to changes in natural gas prices. Figure 8 shows in more detail the similar changes that take place in natural gas and ammonia prices and that the change in ammonia pricing tends to lag behind natural gas price changes.
SUPPLY, DEMAND, SUSTAINABLE DEVELOPMENT
U.S. SUPPLY AND DEMAND The U.S. supply-demand relationships for ammonia in 2002 are shown in figure 9. Although the United States produced much of its nitrogen needs, a significant portion of its ammonia requirements were imported. In 2002, more than one-half of the total ammonia imported was from Trinidad and Tobago; significant quantities also were imported from Canada and Russia. New ammonia production capacity, which totaled about 1.2 Mt/yr, was completed in Trinidad and Tobago in 1998; most of its output was targeted to the U.S. market; additional capacity was planned in the future. The trend of locating ammonia production capacity near natural gasfields and then shipping the product to the consumer increases the probability of additional production capacity installed in regions such as Central America, the Middle East, and South America. As a result, the United States is likely to become more import dependent in the future.
16
Louisiana33%
Oklahoma14%Texas
6%
Alaska7%
Iowa4%
Kansas6%
Georgia5%
Mississippi4%
Other21%
Louisiana39%
Oklahoma14%
Texas6%
Alaska7%
Iowa3%
Kansas4%
Georgia3%
Mississippi3%
Other21%
Louisiana32%
Oklahoma12%Texas
7%Alaska
6%
Iowa4%Kansas
3%
Georgia3%
Mississippi6%
Other27%Louisiana
24%
Oklahoma1%
Texas19%Alaska
3%
Iowa7%
Kansas3%
Georgia2%
Mississippi6%
Other35%
Total capacity 15.3 million metric tons per year at 91 plants Total capacity 16.9 million metric tons per year at 74 plants
Total capacity 16.0 million metric tons per year at 48 plants Total capacity 16.7 million metric tons per year at 37 plants
1972 1982
1992 2002
Figure 6. U.S. ammonia production capacity, by State.
17

Figure 10 shows the trends in U.S. production, net imports, and apparent consumption from 1970 to 2002. Although apparent consumption of nitrogen varies from year to year in the United States, it has historically trended upward. Fertilizers, which remain the most important use for nitrogen, accounted for more than 85 percent of the total in 2002. The United States continues to supply its domestic crop needs and to provide food for export; increased crop production generally leads to increased use of fertilizer. In addition, as the land available for farming diminishes, farmers increase the density of the crops they grow to maintain or increase production. This intensive cropping removes nutrients from the soil at a faster rate, and as a result, a greater quantity of nutrients, which include nitrogen, needs to be replenished. With proper nitrogen application practices and other factors, such as crop rotation, pest management, and soil conservation, however, the quantity of nitrogen that needs to be added to the soil can be minimized.
$0
$100
$200
$300
$400
$500
$600
1970 1975 1980 1985 1990 1995 2000
Average price per short tonAverage price per short ton, constant 2000 dollars
Figure 7. Average ammonia prices, 1970-2002.
Figure 11 shows the fertilizer nitrogen consumption by State for crop year 2001–02. More than 40 percent of the nitrogen consumed in the United States was used to fertilize corn, yet corn accounted for only 21 percent of the total plantings (figure 12). Not surprisingly, most of the nitrogen was consumed in the Corn Belt States of Illinois, Iowa, Kansas, and Nebraska.
0
50
100
150
200
250
300
350
Janu
ary
1999
July
199
9
Janu
ary
2000
July
200
0
Janu
ary
2001
July
200
1
Janu
ary
2002
July
200
2 0
2
4
6
8
10
12Anhydrous ammonia, f.o.b.Gulf Coast Henry Hub spot natural gasprice
AN
HY
DR
OU
S A
MM
ON
IA, I
N D
OLL
AR
S PE
R S
HO
RT
TON
HEN
RY
HU
B SPO
T NA
TUR
AL G
AS PR
ICE, IN
DO
LLAR
S PERM
ILLION
BR
ITISH TH
ERM
AL U
NITS
Figure 8. Ammonia and natural gas prices. (Green Markets and U.S. Department ofEnergy, Natural Gas Weekly).
18

WORLD PRODUCTION, CONSUMPTION, TRADE
World ammonia production has increased steadily from 56.9 Mt of contained nitrogen in 1976 (the earliest year for which data are available by country) to 108 Mt of contained nitrogen in 2002 (table 3). In 1976, the leading producing regions were North America (26 percent), Western Europe (22 percent), Asia (18 percent), and the U.S.S.R. (18 percent). By 2002, Asia (46 percent) had become the largest producing region and was followed by countries from the former U.S.S.R and North America, each with 13 percent. Some of this increase may have been the result of having more reliable information about China, which was the largest producer in the world in 2002. Closure of high-cost, inefficient, or poorly located plants during this time period was partially responsible for the shift in production. In addition, when new plants were constructed, they were constructed in areas that had an abundance of low-cost natural gas, which accounts for some of the decline in production in North America and Western Europe. World consumption of ammonia also increased from 1970 to 2002. According to data from the International Fertilizer Industry Association (2002), consumption of nitrogen has increased from 31.8 Mt of contained nitrogen in crop year 1970–71 to 82.8 Mt of contained nitrogen in crop year 2001–02 (figure 13). With 53 percent of the total, Asia was the largest consuming region and was followed by North America with 15 percent and Western Europe with 11 percent. Generally, the leading ammonia-producing countries also are the largest consumers. Most ammonia is consumed within the producing country in direct agricultural application or in the manufacture of other nitrogen compounds, mainly fertilizer materials. These compounds are, in turn, consumed within the country or exported. World ammonia trade, by region, in 2002 is shown in figure 14. In 2002, world ammonia exports were 13.1 Mt of contained nitrogen, or about 12 percent of total world production. Trinidad and Tobago (22 percent), Russia (18 percent), Ukraine (10 percent), and Indonesia (7 percent) accounted for 57 percent of the world total. The United States imported 35 percent of global ammonia trade and was followed by Western Europe (23 percent) and Asia (22 percent). These figures include intraregional trade; for example, ammonia shipped from Canada to the United States. Trade in urea, ammonium nitrate, and ammonium sulfate is shown in figures 15 to 17. In general, the former U.S.S.R. is the leading exporter, and North America and Western Europe are the leading importers.
United States10,100
Trinidad and Tobago3,300
Canada3,590
Russia8,600
China30,100
India9,830
Ukraine3,700
Indonesia4,200
Mexico537
Egypt1,840
Poland1,310
Japan1,190
Netherlands1,970
Germany2,560
Pakistan1,960
Saudi Arabia1,740
Other20,400
2,420
880
704
60
Venezuela884
Imports4,670
146
Industry stocks, 1/1/02
916
U.S. supply15,700
Exports437
Industry stocks, 12/31/02
771
Apparent consumption
14,500
Fertilizers12,800
Plastics and synthetics
540
Explosives1,100
Other84
Total 108,000
World production
11
1
96
344
Figure 9. Ammonia supply-demand relationships, 2002. Totals are in thousand metric tons of contained nitrogen. Data are rounded to no more than three significant digits.
19
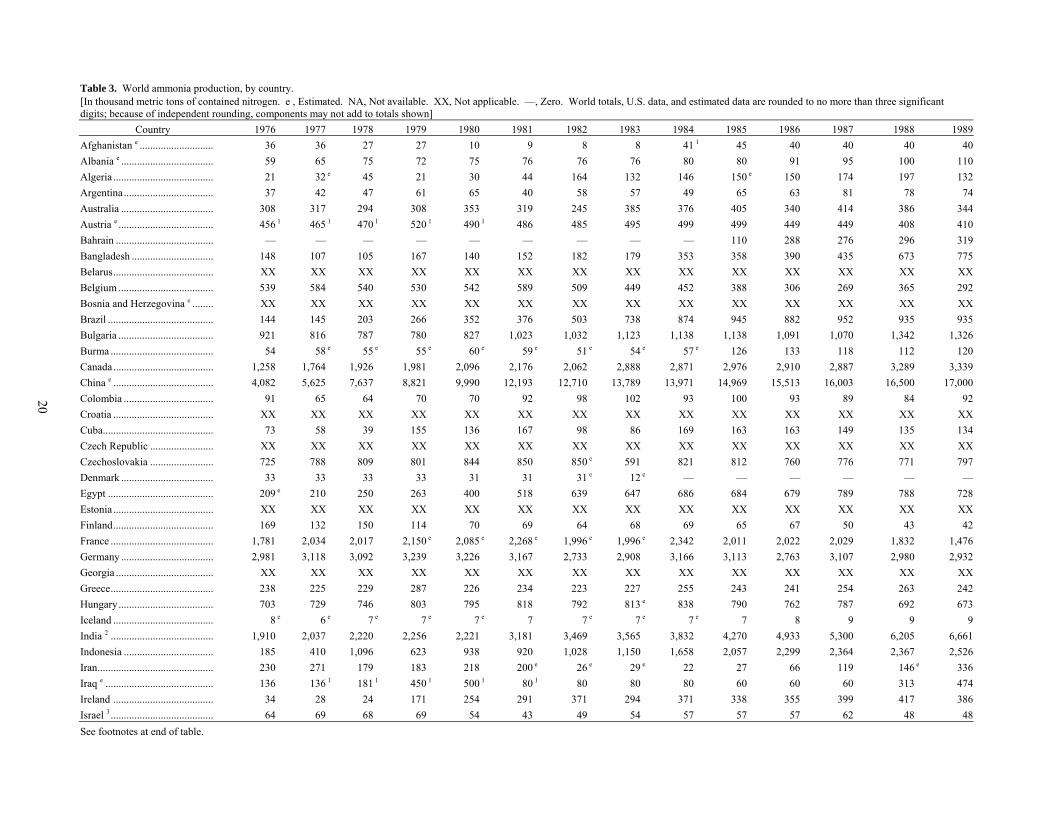
Table 3. World ammonia production, by country. [In thousand metric tons of contained nitrogen. e , Estimated. NA, Not available. XX, Not applicable. —, Zero. World totals, U.S. data, and estimated data are rounded to no more than three significant digits; because of independent rounding, components may not add to totals shown]
Country 1976 1977 1978 1979 1980 1981 1982 1983 1984 1985 1986 1987 1988 1989Afghanistan e ............................ 36 36 27 27 10 9 8 8 41 1 45 40 40 40 40Albania e ...................................
59 65 75 72 75 76 76 76 80 80 91 95 100 110Algeria ...................................... 21 32 e 45 21 30 44 164 132 146 150 e 150 174 197 132Argentina.................................. 37 42 47 61 65 40 58 57 49 65 63 81 78 74Australia ................................... 308 317 294 308 353 319 245 385 376 405 340 414 386 344Austria e .................................... 456 1 465 1 470 1 520 1 490 1 486 485 495 499 499 449 449 408 410Bahrain ..................................... — — — — — — — — — 110 288 276 296 319Bangladesh ............................... 148 107 105 167 140 152 182 179 353 358 390 435 673 775Belarus...................................... XX XX XX XX XX XX XX XX XX XX XX XX XX XXBelgium .................................... 539 584 540 530 542 589 509 449 452 388 306 269 365 292Bosnia and Herzegovina e ........ XX XX XX XX XX XX XX XX XX XX XX XX XX XXBrazil ........................................ 144 145 203 266 352 376 503 738 874 945 882 952 935 935Bulgaria .................................... 921 816 787 780 827 1,023 1,032 1,123 1,138 1,138 1,091 1,070 1,342 1,326Burma ....................................... 54 58 e 55 e 55 e 60 e 59 e 51 e 54 e 57 e 126 133 118 112 120Canada...................................... 1,258 1,764 1,926 1,981 2,096 2,176 2,062 2,888 2,871 2,976 2,910 2,887 3,289 3,339China e ...................................... 4,082 5,625 7,637 8,821 9,990 12,193 12,710 13,789 13,971 14,969 15,513 16,003 16,500 17,000Colombia .................................. 91 65 64 70 70 92 98 102 93 100 93 89 84 92Croatia ...................................... XX XX XX XX XX XX XX XX XX XX XX XX XX XXCuba.......................................... 73 58 39 155 136 167 98 86 169 163 163 149 135 134Czech Republic ........................ XX XX XX XX XX XX XX XX XX XX XX XX XX XXCzechoslovakia ........................ 725 788 809 801 844 850 850 e 591 821 812 760 776 771 797Denmark ................................... 33 33 33 33 31 31 31 e 12 e — — — — — —Egypt ........................................ 209 e 210 250 263 400 518 639 647 686 684 679 789 788 728Estonia ...................................... XX XX XX XX XX XX XX XX XX XX XX XX XX XXFinland...................................... 169 132 150 114 70 69 64 68 69 65 67 50 43 42France ....................................... 1,781 2,034 2,017 2,150 e 2,085 e 2,268 e 1,996 e 1,996 e 2,342 2,011 2,022 2,029 1,832 1,476Germany ................................... 2,981 3,118 3,092 3,239 3,226 3,167 2,733 2,908 3,166 3,113 2,763 3,107 2,980 2,932Georgia ..................................... XX XX XX XX XX XX XX XX XX XX XX XX XX XXGreece....................................... 238 225 229 287 226 234 223 227 255 243 241 254 263 242Hungary.................................... 703 729 746 803 795 818 792 813 e 838 790 762 787 692 673Iceland ...................................... 8 e 6 e 7 e 7 e 7 e 7 7 e 7 e 7 e 7 8 9 9 9India 2 ....................................... 1,910 2,037 2,220 2,256 2,221 3,181 3,469 3,565 3,832 4,270 4,933 5,300 6,205 6,661Indonesia .................................. 185 410 1,096 623 938 920 1,028 1,150 1,658 2,057 2,299 2,364 2,367 2,526Iran............................................ 230 271 179 183 218 200 e 26 e 29 e 22 27 66 119 146 e 336Iraq e ......................................... 136 136 1 181 1 450 1 500 1 80 1 80 80 80 60 60 60 313 474Ireland ...................................... 34 28 24 171 254 291 371 294 371 338 355 399 417 386Israel 3 ....................................... 64 69 68 69 54 43 49 54 57 57 57 62 48 48See footnotes at end of table.
20
Table 3. World ammonia production, by country—Continued.
[In thousand metric tons of contained nitrogen. e , Estimated. NA, Not available. XX, Not applicable. —, Zero. World totals, U.S. data, and estimated data are rounded to no more than three significant digits; because of independent rounding, components may not add to totals shown.]
Country 1976 1977 1978 1979 1980 1981 1982 1983 1984 1985 1986 1987 1988 1989Italy........................................... 1,219 1,168 1,514 1,430 1,397 1,207 1,046 1,061 1,460 1,215 1,553 1,435 1,561 1,446Japan.........................................
2,236 2,292 2,368 2,328 2,110 1,833 1,652 1,545 1,675 1,646 1,508 1,556 1,524 1,539Kazakhstan ............................... XX XX XX XX XX XX XX XX XX XX XX XX XX XXKorea, North e........................... 272 408 450 450 450 450 450 450 450 450 450 450 500 500Korea, Republic of .................. 602 725 897 961 848 747 543 430 464 442 426 474 506 480Kuwait ...................................... 422 402 431 435 e 214 213 183 313 289 323 451 578 498 665Libya......................................... — — 80 e 133 e 150 e 150 e 244 445 494 411 352 350 217 212Lithuania................................... XX XX XX XX XX XX XX XX XX XX XX XX XX XXMalaysia ................................... 43 34 40 52 41 37 28 29 39 54 250 321 301 279Mexico...................................... 716 780 1,304 1,359 1,548 1,795 2,029 1,936 1,773 1,859 1,602 1,744 2,067 2,100Netherlands............................... 1,980 2,140 2,148 1,916 1,874 1,814 1,655 1,744 2,382 2,516 2,185 2,287 2,695 2,901Netherlands Antilles................. 84 34 — — — — — — — — — — — —New Zealand ............................ — — — — — — — 44 58 73 73 73 73 70Nigeria e .................................... — — — — — — — — — — — 129 310 1 364Norway ..................................... 474 504 526 544 515 545 525 513 637 458 299 347 424 382Pakistan .................................... 327 316 309 386 430 706 937 1,099 1,128 1,107 1,155 1,179 1,173 e 1,175Peru........................................... 75 e 83 e 81 e 80 e 62 e 97 e 84 e 85 e 85 e 85 e 100 e 80 e 95 e 91Philippines................................ 41 e 41 e 41 e 40 39 33 15 20 16 17 e — — — —Poland....................................... 1,726 1,665 1,611 1,525 1,478 1,389 1,380 1,425 1,822 1,812 2,124 2,177 2,338 2,360Portugal .................................... 159 185 252 222 200 133 132 e 111 160 154 118 155 191 151Qatar ......................................... 91 e 105 166 303 418 367 434 482 519 524 544 561 598 587Romania ................................... 1,659 1,792 2,257 2,335 2,248 2,381 2,587 2,727 2,861 2,880 3,041 2,788 2,795 2,736Russia ....................................... XX XX XX XX XX XX XX XX XX XX XX XX XX XXSaudi Arabia............................. 102 e 125 140 155 167 170 208 293 415 436 466 637 867 863Serbia and Montenegro ............ XX XX XX XX XX XX XX XX XX XX XX XX XX XXSlovakia.................................... XX XX XX XX XX XX XX XX XX XX XX XX XX XXSomalia..................................... — — — — — — — — 24 26 e 15 e 7 e — —South Africa ............................. 470 508 563 563 549 552 571 575 580 581 e 581 e 547 472 455Spain......................................... 1,051 965 880 826 742 743 538 506 670 602 464 449 476 552Sri Lanka .................................. — — — — — 44 103 63 71 5 — — — —Sweden ..................................... 108 102 96 89 86 79 77 49 49 18 46 34 — —Switzerland e............................. 45 45 45 45 45 33 33 33 33 31 30 39 32 32Syria.......................................... 23 e 23 19 76 39 30 65 113 112 132 137 93 79 123Taiwan ...................................... 319 326 438 391 415 406 318 310 269 207 265 244 279 203Tajikistan e................................ XX XX XX XX XX XX XX XX XX XX XX XX XX XXTanzania ................................... — — — — — — — — 6 — — — — —Thailand.................................... 7 e 7 e 9 e — — — — — — — — — — —Trinidad and Tobago................ 163 177 401 388 459 397 701 993 1,080 1,080 1,141 1,128 1,388 e 1,550See footnotes at end of table.
21

Table 3. World ammonia production, by country—Continued.
[In thousand metric tons of contained nitrogen. e , Estimated. NA, Not available. XX, Not applicable. —, Zero. World totals, U.S. data, and estimated data are rounded to no more than three significant digits; because of independent rounding, components may not add to totals shown]
Country 1976 1977 1978 1979 1980 1981 1982 1983 1984 1985 1986 1987 1988 1989Turkey ...................................... 91 e 107 217 205 184 284 255 279 290 217 191 330 309 380Turkmenistan............................ XX XX XX XX XX
XX XX XX XX XX XX XX XX XXUkraine ..................................... XX XX XX XX XX XX XX XX XX XX XX XX XX XXU.S.S.R. 4.................................. 10,090
10,744
11,300
12,200 12,610 12,900 13,971 e 16,900 17,699 18,300 19,600 20,003 20,200 19,400
United Arab Emirates............... — — — — — — — — 226 282 291 311 297 324United Kingdom....................... 1,347 1,631 1,600 1,666 1,633 1,780 1,716 1,720 1,836 1,767 1,388 1,415 1,105 1,037United States 5 .......................... 12,600 13,300 12,900 14,000 14,700 14,300 11,800 10,200 12,500 12,900 10,800 12,000 12,500 12,300Uzbekistan................................ XX XX XX XX XX XX XX XX XX XX XX XX XX XXVenezuela ................................. 254 271 271 259 360 415 440 379 470 410 e 518 524 563 532Vietnam .................................... — 9 e NA NA NA NA NA NA 36 36 e 36 36 36 e 36Yugoslavia 4 ............................. 387 417 416 418 404 421 422 410 497 766 814 937 858 680Zambia...................................... 18 e 18 e 20 e 20 e 20 18 27 28 28 17 24 34 16 12Zimbabwe e............................... 73 73 60 60 57 52 84 1 71 1 69 1 69 1 49 1 54 1 64 1 62
Total...................................... 56,900 62,000 67,200 71,100 73,600 77,000 77,900 82,400 90,600 93,000 93,100 97,099 101,000 101,000
Country 1990 1991 1992 1993 1994 1995 1996 1997 1998 1999 2000 2001 2002 Afghanistan e ........................ 40 40 40 15 15 10 5 5 5 5 20 20 20 Albania e ............................... 100
80 15 15 15 15 15 10 10 10 10 10 10Algeria .................................. 288 269 438 380 243 176 150 379 350 455 458 469 563Argentina .............................. 70 75 72 72 73 79 80 107 86 88 199 597 617Australia................................ 385 414 392 398 413 433 446 432 435 431 576 762 686Austria e ................................ 410 400 410 400 400 400 450 450 450 450 450 440 440Bahrain.................................. 325 320 323 348 338 358 323 356 336 370 350 372 377Bangladesh............................ 701 3 667 3 937 3 991 3 1,027 3 1,271 3 1,233 1,080 1,129 1,240 1,255 1,273 1,289
Belarus .................................. XX XX 916 619 650 e 668 678 590 e 685 765 730 725 760
Belgium ................................ 274 272 514 535 633 720 750 760 756 840 863 788 842
Bosnia and Herzegovina e..... XX XX 5 2 1 1 1 1 1 1 1 1 1
Brazil .................................... 938 940 e 940 e 914 939 993 977 1,019 949 1,084 925 769 1,021
Bulgaria ................................ 1,310 1,093 905 885 995 e 1,203 1,194 808 448 315 533 477 328
Burma ................................... 77 111 110 e 79 e 70 66 57 62 52 66 78 28 21
Canada .................................. 3,050 3,016 3,104 3,410 3,470 3,773 3,840 4,081 3,900 4,135 4,130 3,439 3,594
China e................................... 17,500 18,000 18,000 19,000 20,100 22,600 25,200 24,800 25,800 28,300 27,700 28,200 30,100 e
Colombia .............................. 90 92 e 86 e 99 e 112 99 102 81 100 75 93 95 108
Croatia .................................. XX XX 426 345 311 310 307 331 248 318 325 259 235
Cuba...................................... 140 e 140 e 135 e 135 e 130 e 135 e 135 e 135 e 135 e 135 e 135 e 135 e 135 e
Czech Republic..................... XX XX XX 149 284 254 304 251 258 223 246 206 215
Czechoslovakia..................... 793 551 385 e XX XX XX XX XX XX XX XX XX XX
Denmark ............................... — — 2 e 2 2 e 2 e 2 e 2 e 2 e 2 e 2 e 2 2
See footnotes at end of table.
22

Table 3. World ammonia production, by country—Continued.
[In thousand metric tons of contained nitrogen. e , Estimated. NA, Not available. XX, Not applicable. —, Zero. World totals, U.S. data, and estimated data are rounded to no more than three significant digits; because of independent rounding, components may not add to totals shown]
Country 1990 1991 1992 1993 1994 1995 1996 1997 1998 1999 2000 2001 2002 Egypt..................................... 735 863 943 941 1,021 1,096 1,126 1,061 1,141 1,407 1,511 1,801 1,839
Estonia .................................. XX XX 115 150 e 170 e 170
292 — 140 317 389 493 200 200 358 407 534 546 537 545 552 552
2,203 1,758 2,030 1,992 2,054 1,448 1,449 1,003
2,580 2,652 2,478 2,350 2,540 1,940 1,970 — — — — —
117 109 405 367 337 350 200 431 384 343 315 270 289 295
1,446 1,505 1,493 1,606 1,549 1,797 18 15 15 1,222 1,311
198 198 100 91 58 155 569 622 627 646 653 1,
1,182 1,487 1,513 781 378 686 1,016 949
137 153 175 164 145 151 39
Finland ................................. 23 24 10 10 e 12 6 5 e 6 e 6 e 6 e 6 e 6 6
France ................................... 1,590 1,604 1,848 1,871 1,480 1,470 1,570 e 1,757 1,570 e 1,580 e 1,620 e 1,380 1,050
Germany ............................... 2,690 2,123 2,113 2,100 2,170 2,518 2,485 2,471 2,512 2,406 2,599 2,522 2,560
Georgia ................................. XX XX 96 58 35 e 52 77 84 64 104 135 60 90
Greece ................................... 257 210 140 57 45 65 90 83 e 178 160 121 57 66
Hungary ................................ 443 261 152 237 302 307 347 339 288 261 352 324 238
Iceland .................................. 8 8 9 9 e 9 7 7 7 6 7 e 7 e 3 —
India 2.................................... 7,010 7,132 7,452 7,176 7,503 8,287 8,549 9,328 10,240 10,376 10,148 10,081 9,827
Indonesia............................... 2,790 2,706 2,688 2,888 3,012 3,336 3,647 3,769 3,600 3,450 3,620 3,655 4,200
Iran........................................ 420 468 664 723 696 715 882 880 1,034 865 965 1,087 1,119
Iraq e...................................... 240 40 200 220 220 220 220 220 220 220 200 200 200
Ireland................................... 395 e 429 384 367 451 408 377 465 458 405 410 443 400 e
Israel 3 ................................... 42 35 37 39 46 70 65 57 1 — — — —
Italy ....................................... 1,200 1,147 1,100 e 729 504 487 397 446 409 367 408 434 391
Japan ..................................... 1,530 1,553 1,545 1,471 1,483 1,584 1,490 1,509 1,389 1,385 1,410 1,318 1,188
Kazakhstan............................ XX XX 220 231 100 e 49 75 75 e — e — e — — —Korea, North e ....................... 500 550 550 600 600 600 600 600 100 100 100 100 100
153
Korea, Republic of................ 411 407 442 386 574 616 611 526 496 489 369 368
Kuwait .................................. 412 432 452 397 410 400 414
Libya ..................................... 200 e e e 495 533Lithuania............................... XX
229 XX 275 275 e 277
313 442
333 461
329 467 407 401 420 440 467
Malaysia................................ 286 331 334 243 351 432 605 726 848
Mexico .................................. 2,160 2,221 701 548 537
Netherlands........................... 3,190 3,033 2,588 2,472 2,479 e 2,430 e e
Netherlands Antilles ............. —70
—70
— — — — — —
New Zealand......................... e e 68 78 81 79 68 80 94 110 105Nigeria e ................................ 1 1 170 164 134 168 148 — — —
Norway ................................. 279 245 122 334 323 330
Pakistan................................. 1,210 1,154 1,144 1,999 1,884
— — 1,966
51,958
5
Peru ....................................... 90 e 95 e 90 e 15 15 e 24 e e e e
Philippines ............................ — — — — — — — — — — — — —Poland ................................... 1,960 1,531 1,163 1,230 1,726 1,713 1,824 1,683 1,474 1,862 1,735
Portugal................................. 198635
196943
204127
223 246 202 190
Qatar ..................................... 584 1,130 1,097 1,159 1,166
Romania................................ 1,790 1,128 1,421 1,328 930
See footnotes at end of table.
23

Table 3. World ammonia production, by country—Continued.
1990 1991 1992 1993 1994 1996
[In thousand metric tons of contained nitrogen. e , Estimated. NA, Not available. XX, Not applicable. —, Zero. World totals, U.S. data, and estimated data are rounded to no more than three significant digits; because of independent rounding, components may not add to totals shown]
Country 1995 1997 1998 1999 2000 2001 2002 Russia.................................... 8,786 8,138 7,300 7,900 7,900 7,150 6,500 7,633 XX XX 8,735 8,690 8,600 e
Saudi Arabia ......................... 942 827 904 1,097 1,340 1,327 1,386 1,405 1,418 1,402 1,743 1,774 1,737172 57 60 66 115
XX 226 — — — — —
456 457 541 683 754 759 770 752 Spain ..................................... 354 452 453 466 497 460 437 442 Sri Lanka...............................
— 30 32 32 31 33
104 17 81 67 93 64 80 84
13,300
423 808 884
52 54 54 54 54 33 42 XX XX XX XX XX XX XX
4 1 2 1 — — — — 63 66 67 70 43 61 64 57 58 58 61
99,500 93,800 93,400 91,600 93,500 100,000 105,000 103,000 104,000 108,000 105,000 108,000
Serbia and Montenegro ........ XX XX
XX 148 100 159 135 235 235 e
Slovakia ................................ XX 263 255 178 197 229 234 247 271 215Somalia ................................. — — — — — — — —South Africa.......................... 723 785 560 506 492
466 557 479 436 415— — — — — — — — — — — — —
Sweden.................................. — — — — — — — — — — — —Switzerland e ......................... 32 3 33 3 31 3 28 3 30 32 31 33 Syria...................................... 129 112 91 138 143Taiwan .................................. 216 243 224 220 215 226 252 289 231 146 11 — —Tajikistan e ............................ XX XX 50 40 20 15 10 10 10 10 15 5 15 Tanzania................................ — — — — — — — — — — — — —Thailand ................................ — — — — — — — — — — — — —Trinidad and Tobago ............ 1,520 1,595 1,568 1,462 1,649 1,696 1,801 1,772 2,271 2,720 2,680 3,036 3,300 e
Turkey................................... 373 357 344 326 350 e 366 519 558 560 82 53 67 301
Turkmenistan ........................ XX XX 50 50 50 e 52 e 70 61 75 e 75 e 75 e 75 75
Ukraine ................................. XX XX 3,908 3,242 3,000 e 3,100 3,300 3,400 e 3,300 3,711 3,577 3,700 3,700
U.S.S.R. 4 .............................. 18,200 17,100 XX XX XX XX XX XX XX XX XX XX XXUnited Arab Emirates ........... 295 286 275 306 287 363 331 373 331 380 348 358 364
United Kingdom ................... 1,150 1,011 869 873 1,006 799 850 642 871 902 814 850 837
United States 5 ...................... 12,700 12,800 13,400 12,600 13,300 13,000 13,400 13,800875
12,900 11,800 9,120 10,140
Uzbekistan ............................ XX XX 1,309 1,105 900 e 906 950 950 790 810 670 740
Venezuela ............................. 557 450 404 535 505 600 605 612 526 522
Vietnam ................................ 36 e 30 e 45 e 33 e 53 58
Yugoslavia 4.......................... 802 700 5
e XX7
XX10
XX XXZambia .................................. 4 e e e e — e e
Zimbabwe e ........................... 70 61 Total ............................... 107,000
1 Reported figure. 2 Data are for years beginning April 1 of that stated.
5 Synthetic anhydrous ammonia; excludes coke oven byproduct ammonia.
3 May include nitrogen content of urea.4 The U.S.S.R. was dissolved in December 1991, and Yugoslavia was dissolved in April 1992.
24
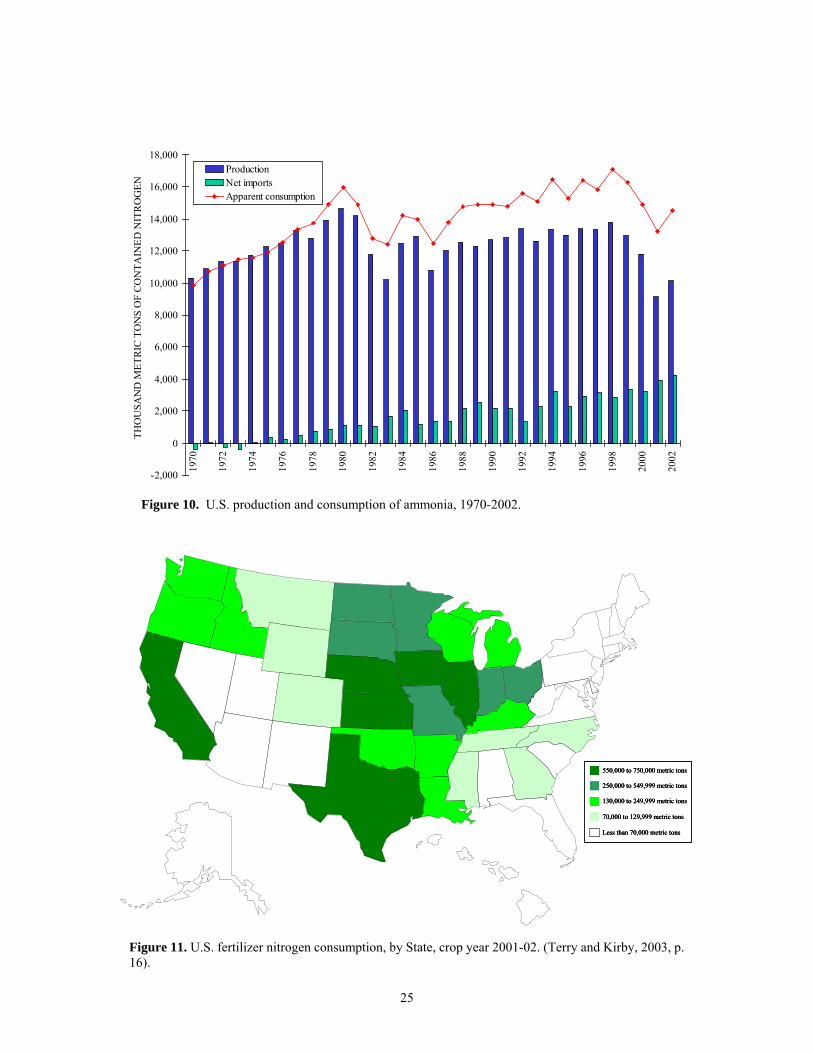
550,000 to 750,000 metric tons
250,000 to 549,999 metric tons
130,000 to 249,999 metric tons
70,000 to 129,999 metric tons
Less than 70,000 metric tons
550,000 to 750,000 metric tons
250,000 to 549,999 metric tons
130,000 to 249,999 metric tons
70,000 to 129,999 metric tons
Less than 70,000 metric tons
550,000 to 750,000 metric tons
250,000 to 549,999 metric tons
130,000 to 249,999 metric tons
70,000 to 129,999 metric tons
Less than 70,000 metric tons
Figure 10. U.S. production and consumption of ammonia, 1970-2002.
-2,000
0
2,000
4,000
6,000
8,000
10,000
12,000
14,000
16,000
18,000
1970
1972
1974
1976
1978
1980
1982
1984
1986
1988
1990
1992
1994
1996
1998
2000
2002
ProductionNet importsApparent consumption
THO
USA
ND
MET
RIC
TO
NS
OF
CO
NTA
INED
NIT
RO
GEN
Figure 11. U.S. fertilizer nitrogen consumption, by State, crop year 2001-02. (Terry and Kirby, 2003, p.16).
25

26
Figure 13. World nitrogen fertilizer nutrient consumption, in crop years. (International Fertilizer Industry Association, 2002).
Figure 12. U.S. nitrogen use and crop plantings, crop year 2000-01. (IMC Global Inc., 2001, p. 19; U.S. Department of Agriculture, 2001).
0
10
20
30
40
50
60
70
80
90
1970
-71
1972
-73
1974
-75
1976
-77
1978
-79
1980
-81
1982
-83
1984
-85
1986
-87
1988
-89
1990
-91
1992
/93
1994
-95
1996
-97
1998
-99
2000
-01
AsiaMiddle EastAfricaOceaniaCentral America and South AmericaNorth AmericaFormer U.S.S.R.Central EuropeWestern Europe
MIL
LIO
N M
ETR
IC T
ON
S O
F C
ON
TAIN
ED N
ITR
OG
EN
Corn42%
Cotton5%
Wheat16%
Soybeans1%
Other36%
Corn21%
Cotton5%
Wheat18%
Soybeans22%
Other34%
Nitrogen use Crop plantings

Exporting region:Western Europe Central America and South AmericaCentral Europe AfricaFormer U.S.S.R. Middle EastNorth America Asia
Exporting region:Western Europe Central America and South AmericaCentral Europe AfricaFormer U.S.S.R. Middle EastNorth America Asia
768
1,20290
415
1,310
124
48
113
997
166
2,99116
514
38
30
37
464
16
11
107864
566
1,071
72884
Total trade: 13.1 million metric tons
84
39
Figure 14. Ammonia world trade, by region, 2002. Totals are in thousand metric tons of contained nitrogen. (International Fertilizer Industry Association, 2003b).
27
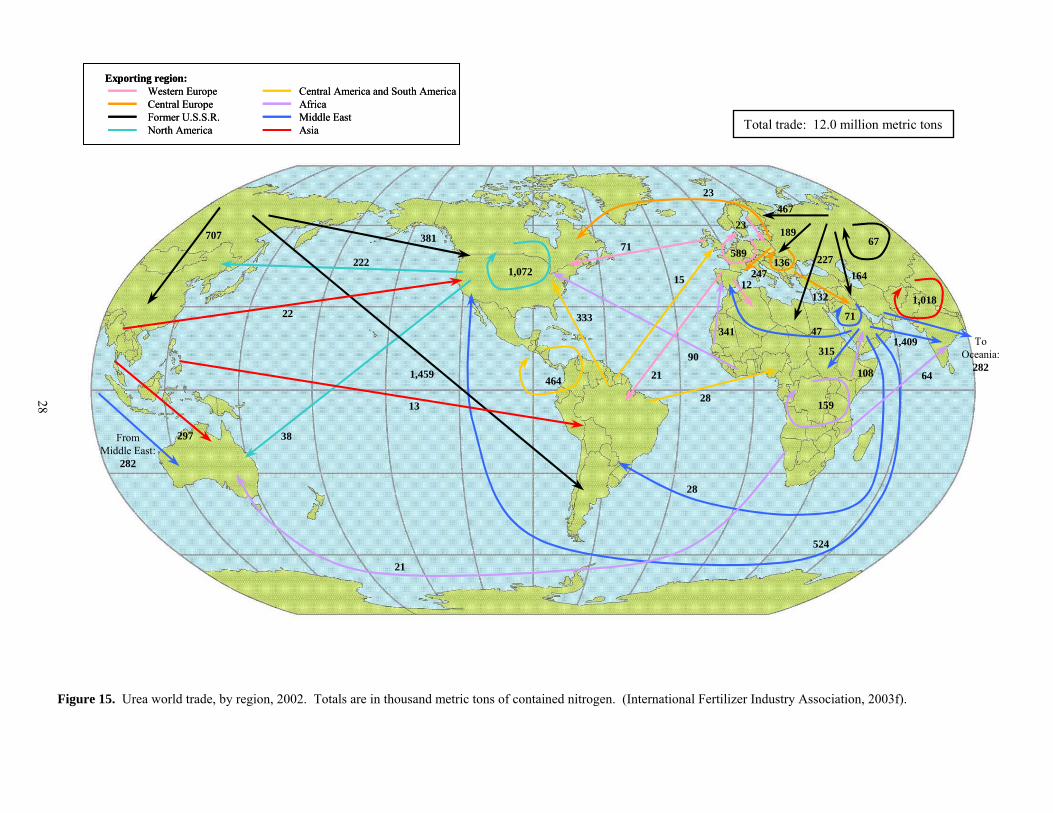
Exporting region:
Western Europe Central America and South AmericaCentral Europe AfricaFormer U.S.S.R. Middle EastNorth America Asia
Exporting region:Western Europe Central America and South AmericaCentral Europe AfricaFormer U.S.S.R. Middle EastNorth America Asia
1,072
589136
67
711,018
Total trade: 12.0 million metric tons
71
21
12247
132
222
38
464
33347
315
524
1,409
28
159
108
341
90
381
467
189
164227
707
1,459
22
297
23
23
15
28
21
64
13
ToOceania:
282
FromMiddle East:
282
Figure 15. Urea world trade, by region, 2002. Totals are in thousand metric tons of contained nitrogen. (International Fertilizer Industry Association, 2003f).
28

Total trade: 3.29 million metric tons
182
99
224
423
229267
253
30
30
4381
84
20
40
320
98
79
2915
32
Exporting region:Western Europe Central America and South America Central Europe North AmericaFormer U.S.S.R. Africa
Asia
Exporting region:Western Europe Central America and South America Central Europe North AmericaFormer U.S.S.R. Africa
Asia
485
Figure 16. Ammonium nitrate world trade, by region, 2002. Totals are in thousand metric tons of contained nitrogen. (International Fertilizer Industry Association, 2003a).
29

Total trade: 1.53 million metric tons
71
167
13
296
19293
62
3248 53
44
17
61
142
94
37
Exporting region:Western Europe North AmericaCentral Europe AsiaFormer U.S.S.R. Oceania
Exporting region:Western Europe North AmericaCentral Europe AsiaFormer U.S.S.R. Oceania
11
Figure 17. Ammonium sulfate world trade, by region, 2002. Totals are in thousand metric tons of contained nitrogen. (International Fertilizer Industry Association, 2003c).
30

31
With nitrogen, the outputs to the biosphere have become a controversial issue. N2O is considered to be a greenhouse gas and is emitted from such anthropogenic processes as, agriculture, biomass burning, industrial activities, and livestock management. Excess nitrogen in water can cause hypoxic zones along the world’s coastlines; hypoxia means “low oxygen” and is referred to as a “dead zone.” Because of these factors, scientists have been attempting to identify the sources of nitrogen and to mitigate its effects from these sources. Because nitrogen is under such scrutiny, a wide range of data, much of which is specific to certain geographic areas or to specific emissions, such as N2O, NOx, from specific sources, has been published. Some data represent a time series, and other data present a “snapshot” of a particular time period. In addition, data are reported in a variety of units that are not easily related to a common value. Therefore, finding a common basis with which to compare these available data sets is difficult. As scientists continue to study the effects of nitrogen in the biosphere, the complexity of the relationships between it and other chemicals that affect the biosphere is just beginning to be understood. The following discussion presents some of the available data on nitrogen inputs and outputs to the biosphere.
SUSTAINABLE DEVELOPMENT
One of the generally accepted definitions of sustainable development was first proposed in 1987—development that meets the needs of the present without compromising the ability of future generations to meet their own needs (SD Gateway, undated). No firm definition of the concept has been written, however, and, perhaps, one is not needed. This is because sustainable development concerns a process of change and is heavily reliant upon local contexts, needs, and interests.
NITROGEN SOIL INPUTS The nitrogen cycle shows the sources and releases of nitrogen in the environment (figure 18). The five sources of nitrogen to the soil are atmospheric fixation and deposition, biological fixation by legume plants, plant residues, animal manures and biosolids, and industrial fixation (commercial fertilizers). Atmospheric fixation takes place when lightning transforms atmospheric nitrogen into nitrates. According to Vitousek and others, (1997), worldwide, lightning is estimated to contribute from 5 to 10 Mt of nitrogen to the total nitrogen fixed per year. In addition, a small number of algae and bacteria can convert gaseous nitrogen from the atmosphere directly into plant-usable forms of nitrogen, thus providing an additional source of nitrogen to the earth. Bacterial fixation is estimated to contribute between 90 and 140 Mt of nitrogen annually. Certain leguminous plants, including alfalfa, peanuts, peas, and soybeans can fix nitrogen; this process is carried out by certain groups of soil bacteria and takes place in nodules that develop on legume roots. Vitousek and others (1997) estimated that nitrogen-fixing crops contribute an average of 40 Mt/yr of nitrogen to the soil. Decaying plants also are sources of nitrogen to the soil.
Atmosphericnitrogen
Atmosphericfixation
and deposition
Animalmanures
and biosolids
Industrial fixation(commercial fertilizers)
Crop harvest
Volatilization
Denitrification
Runoff anderosion
Leaching
Organicnitrogen
Ammonium(NH4)
Nitrate(NO3)
Plant residues
Biologicalfixation by
legume plants Plantuptake
Immobilization
ImmobilizationMineralization
Mineralization
-+
Input to soilComponent Loss from soilInput to soilComponent Loss from soil
Figure 18. Nitrogen cycle. (Agerton, 2000).

32
NITROGEN SOIL OUTPUTS
Soil nitrogen can be taken up and used by plants, tied up in decaying plant residues, immobilized by reactions with some types of soil clays, or lost in any of a number of ways. Tremendous quantities of nitrogen are removed in the harvested portion of crops. A significant portion of these crops are eaten by animals, and some of the nitrogen is returned in the form of animal wastes. Large quantities are lost each year from soils as a result of erosion. Most soil nitrogen is present in organic matter in the surface layers, which is the first part of the soil to be lost in water and wind erosion. Losses of soil nitrogen are controlled by soil texture, the amount of rainfall or irrigation, quantities and types of plant residues returned to the soil, and other conditions, such as soil temperature. Regardless of how the nitrogen was originally added to the soil, bacterial actions eventually convert it to ammonium nitrogen and nitrate nitrogen. If nitrate leaches below the soil levels where plant roots are using nutrients, then the nitrate may eventually undergo nitrification or find its way into ground water. Nitrate occurs naturally in ground water, but high concentrations can become a potential health hazard.
One particular area that has received significant study is the Gulf of Mexico. Each year during the summer, a hypoxic area develops in the Gulf. In 2001, an action plan for controlling hypoxia in the Gulf of Mexico was prepared by members of the Mississippi River/Gulf of Mexico Watershed Nutrient Task Force and submitted as a report to Congress. A major goal of the action plan is to reduce the size of the hypoxic zone to less than 5,000 square kilometers, which is a reduction of about one-half of the average, by 2015. States, tribes, and relevant Federal agencies with jurisdiction in the Mississippi and Atchafalaya River Basins and the Gulf agreed to the actions in the plan, which included preparing watershed strategies to reduce the amount of nutrients, particularly nitrogen, that enter their waters. These groups would have the flexibility to develop the most effective and practical strategies to reduce discharges of excess nutrients to their waters. The strategies were expected to rely heavily on voluntary and incentive-based approaches for dealing with agricultural and urban runoff, restoring wetlands, and creating vegetative or forested buffers along rivers and streams within priority watersheds. The best current [2002] scientific understanding of the hypoxic zone indicated that these strategies should aim at achieving a 30% reduction in nitrogen discharges to the Gulf by 2015 (U.S. Environmental Protection Agency, 2001a).
Animal manures and biosolids represent a significant source of nitrogen to the soils. Although highly variable in nitrogen content, manure is a good source of plant food and can improve the physical condition of the soil when properly applied. A study by the U.S. Department of Agriculture (Gollehon and others, 2001, p. 20) estimated the quantity of manure nutrients produced in the United States and the cropland and pasture available to receive it. In 1997, total recoverable nitrogen was estimated to be 1.23 Mt, and of this, 0.74 Mt, or nearly 60 percent, was considered to be excess. The principal reason for this accumulation is because much livestock production is away from crop-producing areas. Where livestock are confined in large numbers, such as dairies, feedlots, and poultry buildings, the accumulation of manure is often significant. Transportation of manure for any but short distances is prohibitively expensive. The largest anthropogenic source of nitrogen to the soil is commercial fertilizers. Vitousek and others (1997) estimated that about 80 Mt of nitrogen in the form of various fertilizers is applied to the land each year.
Nitrogen runoff from overfertilization has become a controversial issue among environmental organizations and fertilizer producers. Fertilizer applications are inherently uneven, and overfertilization may result in the runoff of fertilizer into lakes, rivers, and streams. Excess nitrogen from the fertilizer may lead to hypoxia. In estuaries, lakes, and coastal waters, low oxygen usually means a concentration of less than 2 ppm. Two conditions are necessary for the formation of hypoxia—stratification of the water and the presence of organic matter to consume oxygen. Increased algae growth in the surface water, whether from excess nutrients or other factors, leads to algal blooms. Organic material from the algae and other organisms settles into the bottom water where it is decomposed by bacteria, which consume oxygen in the process. Stratification blocks the replenishment of oxygen from the surface, and hypoxia develops.
The Gulf of Mexico is not the only area in which hypoxic zones have developed. Areas along the Atlantic and Pacific coastlines have shown some damage from agricultural runoff. A report prepared by the National Research Council of the National Academy of Sciences stated that the Federal Government and State and local agencies should develop a comprehensive regulatory solution to combat nitrogen and phosphorous runoff from agricultural fields, which was causing serious environmental damage along the Atlantic and Pacific coastlines. According to the report, a national strategy should strive to reduce the number of severely damaged coastal areas by 25 percent by 2020 and to ensure that no other areas become affected. Initiatives that were identified by the report to address the problem included expanding monitoring and assessment programs, exerting Federal leadership on issues spanning multiple jurisdictions or threatening federally protected natural resources, eliminating overlap and gaps among existing and proposed Federal legislation, providing data and technical assistance to local coastal authorities, and developing a classification scheme to provide better information on the likelihood that excess nutrients will damage coastal areas (Green Markets, 2000). Potential methods for fertilizer producers and fertilizer consumers to combat some of the environmental problems associated with nitrogen runoff include improvements in manure management, cropping system management, prediction of seasonal soil nitrogen mineralization, and timing of nitrogen applications; and site-specific precision agriculture, biotechnology, and advanced fertilizer products. Another way nitrogen is lost from the soil is through the conversion of nitrate into inert elemental nitrogen and other gases. Soil bacteria perform denitrification when soil pores are saturated with water. Soil bacteria that decompose plant residues require oxygen. In the absence of adequate oxygen, which has been forced out of the soil by the excess water, the oxygen in nitrate is used by some

Figure 19 provides EPA estimates of N2O emissions, by source, in the United States for 2001. Agriculture was the largest emitting source with 71 percent of the total. Figures 20 and 21 show the changes in N2O emissions from 1990–2000 and project emissions to 2010 by world region and by emitting sector, although not all countries were included. These data were compiled from publicly available country-submitted estimates that were consistent with the Revised 1996 Intergovernmental Panel on Climate Change (IPCC) Guidelines for National Greenhouse Gas Inventories (U.S. Environmental Protection Agency 2001b, p. 3-1–3-7). Regionally, North America and Western Europe were the largest N2O emitters with 48 percent and 31 percent, respectively, of the 2000 total. In 2000, agricultural soils were the largest emitter, with 60 percent of the total and was followed by mobile sources (mostly automobiles) with 11 percent.
The Intergovernme(in terms of radiativeestimates of the IPCC(46 parts per billion)
bacteria, which releases nitrogen to the atmosphere. This is a significant mechanism of nitrogen loss from warm, wet soils and takes place regardless of the original nitrogen source.
NITROGEN AIR EMISSIONS Nitrogen generated by burning fossil fuels is a significant source of nitrogen to the air. Powerplants and manufacturing facilities that burn fuels, such as coal and oil, release NOx into the atmosphere. Automobile engine combustion also generates NOx. In the United States, motor vehicles were estimated to generate 49 percent; electric utilities (powerplants), 27 percent; industrial, commercial, and residential combustion, 19 percent; and a variety of other sources, 5 percent (U.S. Environmental Protection Agency, 2002b). Nitrogen oxides are regulated in the United States by the Clean Air Act; the Clean Air Act Amendments of 1990 directed the EPA to set standards for all major sources of air toxics, which included NOx. The Clean Air Act Amendments of 1990 set a goal of reducing NOx by 2 million short tons (1.8 Mt) from 1980 levels. Several programs are being implemented to reduce the total quantity of NOx; each is focused on a different segment that generates the compounds. An example is the acid rain program, which targets NOx emissions from coal-fired electric utility boilers. Various State-specific NOx trading programs have been developed to reduce the transport of ground-level ozone across long distances (U.S. Environmental Protection Agency, 2002a).
For N2O, emissionLarge agricultural coreductions in other cindustrial processes temissions dropped dremain essentially le
Mobile combustion sources
13%
Agricultural soil management
71%
Nitric acid production
4%
Stationary combustion sources
3%Adipic acid production
1%
Human sewage4%Manure management
4%
Note: N2O emissions from agricultural residue burning and waste combustion, which were calculated by the U.S. Environmental Protection Agency, each contributed less than 1 percent to the total in 2001.
Total: 424.6 million metric tons of carbon dioxide equivalent
Figure 19. Nitrous oxide (N2O) emissions, by source, in the United States, 2001. (U.S.Environmental Protection Agency, 2003).33
ntal Panel on Climate Change (2002) estimated the emissions of N2O and NOx, their effects on climate change effects), and projections of future emissions, which were modeled from 35 varying scenarios. According to , the atmospheric concentration of N2O has steadily increased during the Industrial Era and is now 16 percent
greater than that of 1750. The present N2O concentration has not been exceeded during at least the past 1,000
s decreased only slightly between 1990 and 1995 in spite of the economic restructuring in several countries. untries with growing economies, such as the United States and the European Union, offset the emission ountries. A significant change began in 2000, however, as the second largest source of emissions shifted from o mobile sources. In 1990, industrial processes accounted for about 15 percent of total emissions, but these ramatically from 1990 to 2000 and are expected to stay near 2000 levels through 2010. Total N2O emissions vel because of the dramatic increase in mobile source emissions.

34
0
200
400
600
800
1,000
1,200
1,400
1990 1995 2000 2005 2010
Mobile sources
Stationary sources
Electric utilities
Manufacturing andconstructionIndustrial processes
Manure management
Agricultural soils
MIL
LIO
N M
ETR
IC T
ON
S O
F C
AR
BO
N D
IOX
IDE
EQU
IVA
LEN
T
Figure 20. Nitrous oxide emissions in developed countries. (U.S. Environmental Protection Agency, 2001b).
0
200
400
600
800
1,000
1,200
1990 1995 2000 2005 2010
Oceania
Asia (Japan only)
North America
Former U.S.S.R.
Central Europe
Western Europe
MIL
LIO
N M
ETR
IC T
ON
S O
F C
AR
BO
N D
IOX
IDE
EQU
IVA
LEN
T
Figure 21. Nitrous oxide emissions in developed countries, by region. (U.S. Environmental Protection Agency, 2001b).

years. Nitrous oxide is another greenhouse gas that has natural and anthropogenic sources, and it is removed from the atmosphere by chemical reactions. Atmospheric concentrations of N2O continued to increase at a rate of 0.25 percent per year from 1980 to 1998; significant interannual variations in the upward trend of N2O concentrations, however, were observed, for example, a 50-percent reduction in the annual growth rate from 1991 to 1993. Suggested causes were a decrease in the use of nitrogen-based fertilizer, lower biogenic emissions, and larger stratospheric losses because of volcanic-induced circulation changes. Since 1993, the growth rate of N2O concentrations has returned to a rate closer to those observed during the 1980s. Although this observed multiyear variance has provided some potential insight into what processes control the behavior of atmospheric N2O, the multiyear trends of this greenhouse gas remain largely unexplained.
The Acentury and deconvergence aregional differof technologicintensive (A1Ftoo heavily on
The Aidentities. Ferdevelopment islower than ot
The Bdeclines thereareductions in msolutions to ec
The environmentallevels of econothe scenario is
The I(Intergovernm
The IPCC (20was from soils, aapproximately 7assessment comsignificantly, holived and global
1A change in tIPCC. Positive them.
Figure 22. Projection of nitrous oxide emissions based on various model scenarios. (Intergovernmental Panel on Climate Change, 2002). N2O is nitrous oxide, Tg N is teragrams ofnitrogen content, and ppb is parts per billion.
35
1 scenario family describes a future world of very rapid economic growth, global population that peaks in mid-clines thereafter, and the rapid introduction of new and more efficient technologies. Major underlying themes are mong regions, capacity building, and increased cultural and social interactions, with a substantial reduction in ences in per-capita income. The A1 scenario family develops into three groups that describe alternative directions al change in the energy system. The three A1 groups are distinguished by their technological emphasis—fossil I), nonfossil energy sources (A1T), or a balance across all sources (A1B), where balanced is defined as not relying
one particular energy source. 2 scenario family describes a heterogeneous world. The underlying theme is self reliance and preservation of local
tility patterns across regions converge very slowly, which results in continuously increasing population. Economic s primarily regionally oriented, and per-capita economic growth and technological change are more fragmented and her scenarios. 1 scenario family describes a convergent world with the same global population, that peaks in mid-century and fter, as in the A1 scenario with rapid change in economic structures toward a service and information economy, aterial intensity, and the introduction of clean and resource efficient technologies. The emphasis is on global
onomic, social, and environmental sustainability, but without additional climate initiatives. B2 scenario family describes a world in which the emphasis is on local solutions to economic, social, and sustainability. It is a world with continuously increasing global population, at a rate lower than A2, intermediate mic development, and less rapid and more diverse technological change than in the A1 and B1 scenarios. While
also oriented towards environmental protection and social equity, it focuses on local and regional levels. S92a scenario, shown by the Intergovernmental Panel on Climate Change in a 1996 report, is shown for comparison ental Panel on Climate Change, 2002).
02) estimated that emissions of N2O from natural sources were approximately 10 Mt/yr of nitrogen; about 65 percent nd about 30 percent, from the oceans. New higher estimates of the emissions from anthropogenic sources of
Mt/yr of nitrogen have brought the source-sink estimates closer in balance compared with the IPCC’s previous pleted in 1996. The predictive understanding associated with this long-lived greenhouse gas has not improved wever, since the 1996 assessment. The radiative forcing1 is estimated to be 6 percent of the total from all the long-ly mixed greenhouse gases. Figure 22 shows data from some of the modeling scenarios that the IPCC used to predict
he net radiative energy available to the global Earth-atmosphere system is referred to as “radiative forcing” by the radiative forcings tend to warm the Earth’s surface and lower atmosphere. Negative radiative forcings tend to cool

COSTS
the quantity of N2O emissions to 2100. The important feature of these graphs is that N2O emissions are projected to increase, but the total quantity will vary widely depending on the assumptions used in the model. According to the IPCC (2002), the reactive nitrogen species in NOx, which are NO and NO2, are key compounds in the chemistry of the troposphere, but their overall radiative impact remains difficult to quantify. Reactive nitrogen in NOx controls, in part, the oxidizing capacity of the troposphere and the abundance of ozone. It acts as an indirect greenhouse gas through its influence on ozone and the lifetimes of methane and other greenhouse gases. Deposition of the reaction products of NOx fertilizes the biosphere, thereby decreasing atmospheric CO2. Although difficult to quantify, the increases in NOx that are projected to 2100 would cause significant changes in greenhouse gases. The Food and Agriculture Organization of the United Nations and the International Fertilizer Industry Association (2001, p. 63–65) estimated the quantity of nitrogen emitted from the world’s agricultural lands and grasslands. By using models, they generated global annual estimates of 3.5 Mt of nitrogen content of N2O emission and 2.0 Mt of nitrogen content of NO emission from croplands and grasslands. Of these total estimates, the emissions induced by fertilizers were estimated to be 0.9 Mt of nitrogen content and 0.5 Mt of nitrogen content, respectively, or approximately 0.8 percent and 0.5 percent, respectively, of the nitrogen input from fertilizer. An average ammonia loss of 14 percent of mineral fertilizer nitrogen use was estimated; this percentage was higher in developing countries. The ammonia loss from animal manure was estimated to be 22 percent, of which 60 percent was from developed countries. The results for ammonia volatilization agree with other inventories, although ammonia volatilization from some fertilizers appeared to be higher than previously thought. Table 4 lists the total nitrogen emitted as N2O, NOx, and ammonia from natural and anthropogenic sources.
ECONOMIC FACTORS
Natural gas cost is the largest component in the total cost of producing ammonia and accounts for from 70 to 90 percent of the total production cost. According to The Fertilizer Institute’s 1999 production cost survey, the production of 1 short ton of ammonia required an average of 33.5 million British thermal units (Btu) of natural gas (36.9 million Btu per metric ton). By using U.S. Department of Commerce production data of about 17.3 million short tons of ammonia production in calendar year 1999, an estimated 580 trillion Btu of natural gas was used for ammonia manufacturing, which consumed about 3 percent of the total U.S. natural gas production. This estimate does not include the natural gas used as a fuel in processing ammonia into other fertilizer products, and some observers believe the fertilizer industry’s total use could represent up to 4 percent of U.S. natural gas production (Fertilizer Institute, The, 2001). Figure 23 shows the effect of the cost of natural gas on the production cost of ammonia. Each increase in the price of natural gas has a direct effect on the production cost of ammonia with gas making up 70 percent of the cost at $2 per million Btu and 85 percent at $5 per million Btu. The conversion costs shown are the average for the U.S. ammonia industry.
$0
$50
$100
$150
$200
$250
$300
$350
$400
$2.00 $3.00 $4.00 $5.00 $6.00 $7.00 $8.00 $9.00 $10.00
NATURAL GAS PRICE PER MILLION BRITISH THERMAL UNITS
PRO
DU
CTI
ON
CO
ST P
ER S
HO
RT
TON
Conversion costNatural gas cost
Construction of a nadditional support faconstruction costs foplant is estimated to lower for ammonia p
Figure 23. Estimated average ammonia production costs of North American producers atvarious levels of natural gas prices (Potash Corp. of Saskatchewan, 2003, p. 48).
36
ew ammonia plant normally takes about 3 years from inception to production. Depending on the location, cilities, such as transportation equipment, may need to be included. On the basis of public announcements of r new ammonia plants in developed countries since 1998, the average capital cost for a stand-alone ammonia range from about $480 to $500 per metric ton of annual capacity. Costs per metric ton of capacity are likely to be lants that are constructed as part of a urea-ammonia complex. Because urea and urea derivatives have become

37
Table 4. Global sources of atmospheric NOx1, NH3
2 and N2O3, 1990.
NOx NH3
more commonly used than ammonia as a fertilizer source of nitrogen, many newly constructed ammonia plants are part of an ammonia-urea complex.
[Million metric tons of contained nitrogen per year. Food and Agriculture Organization of the United Nations and International Fertilizer Industry Association, 2001, p. 5. n.d., Not determined. —, Zero. ~, Approximately.
Source N2O Anthropogenic sources:
Fossil fuel combustion including aircraft ...................................................... 21.9 0.1 0.2 Industrial processes ....................................................................................... 1.5 0.2 0.3 Animal manure application, direct emission ................................................. 0.7 ~8 0.4 Animal manure, emission from other animal waste management systems 4 — ~13.6
0.5
5.9
0.2— —0.3 — 0.6
— 8.2 0.1
—
— —
2.1 Animal manure application, indirect emission .............................................. — — 0.9 Mineral fertilizer use, direct emission ........................................................... 0.4 9 1.1 Mineral fertilizer use, indirect emission ........................................................ — — Leguminous crops ......................................................................................... n.d. n.d. 0.1 Cultivated histosols ....................................................................................... n.d. n.d. 0.1 Biomass burning, including biofuel combustion ........................................... 7.7 0.7 Crops and decomposition of crops ................................................................ — 3.6 0.4 Human excreta............................................................................................... — 2.6 Coastal water ................................................................................................. 5 1.9 Atmospheric deposition.................................................................................
Natural sources: Soils under natural vegetation ....................................................................... 13 2.4 6.6 Oceans ........................................................................................................... 3.6 Excreta of wild animals ................................................................................. — Lightning ....................................................................................................... 12.2 — Tropospheric chemistry ................................................................................. 0.9 — 0.6 Stratospheric chemistry ................................................................................. 0.7 Total.......................................................................................................... 59 54 20 6
1 Nitrogen oxides. 2 Ammonia. 3 Nitrous oxide. 4Other animal waste management systems include storage, grazing, and so forth. 5NH3 emissions from coastal water are included in the estimate for oceans. 6This total is based on mass balance calculations of atmospheric N2O. The sum of the individual source estimates exceeds the global source by about 30%.
TRANSPORTATION
In 2002, 13.1 Mt of ammonia was exported; this represents about 12 percent of the total ammonia produced. This is a significant portion of production, and much of it is moved internationally by sea. International ocean-going shipments of ammonia are transported by refrigerated vessels whose capacities range from 3 to 38,000 t; most range from 12,000 to 75,000 cubic meters (m3) in volume. The ammonia trade uses from about 40 to 60 percent of the 16,000- to 38,000-t ammonia (25,000- to 58,000-m3)-capacity tankers depending on market conditions. The balance is used for liquefied petroleum gas and occasionally naphtha or other light clean products (Dietlin, 2001). Principal export points are Russia and Ukraine (exports total from about 3.8 to 4.0 Mt/yr), Trinidad and Tobago and Venezuela (exports total about 3.6 Mt/yr), the Arabian Gulf and Bangladesh (exports total about 1.6 Mt/yr), Indonesia and Malaysia (exports total about 1.1 Mt/yr), northern Africa and the United States (Alaska) (exports total about 0.7 Mt/yr each). In addition, the quantity of intra-European trade, which is located mostly in the northwestern Europe-Baltic Sea area, is significant. In the United States, ammonia was transported by refrigerated barge, rail, pipeline, and truck. In 2002, three companies served 11 States with 4,900 kilometers (km) of pipelines. Ammonia also was transported by barge along 4,800 km of river and by rail and truck primarily for interstate or local delivery. Kaneb Pipe Line Partners L.P. operated the Gulf Central ammonia pipeline. The 3,070-km pipeline originates in the Louisiana delta area where it has access to three marine terminals. It moves north through Louisiana and Arkansas into Missouri, where at Hermann, it splits—one branches east into Illinois and Indiana and the other branch continues north into Iowa and then turns west into Nebraska. The capacity of this pipeline is about 2 Mt/yr; storage capacity is more than 1 Mt. The ammonia pipeline connects with 3 third-party-

owned deepwater import terminals, 11 third-party-owned production and fertilizer-upgrading facilities, 23 third-party-owned delivery terminals, and to another fertilizer pipeline in the Midwest. Ammonia is supplied primarily to the pipeline from plants in Louisiana and from foreign-source product through the marine terminals. CF Industries and Cargill Fertilizer Inc. jointly operate the 135-km long Tampa Bay Pipeline (TBP) system. TBP moves nitrogen compounds and ammonium phosphate for fertilizer producers in Hillsborough and Polk Counties, Fla. The Williams Companies Inc. pipeline and that of its subsidiary Mid-America Pipeline System covers 1,700 km from Borger in northern Texas to Mankato in southern Minnesota. The pipeline has a capacity of more than 1 Mt/yr and about 0.5 Mt of ammonia storage capacity. Capacities for trucks and railcars are usually 20 t and 100 t, respectively. Depending on the product loaded and the volume of the container, barges can accommodate from 400 to 2,000 t. According to a study conducted by The Fertilizer Institute, the rail cost of shipping ammonia in the United States in 1997 was approximately $22.30 per short ton, the average distance shipped was 559 miles, and the cost of shipment was about $3.35 per ton-mile. The cost of shipping urea by rail was $21.63 per short ton, the average shipping distance was 671 miles, and the cost was $3.22 per ton-mile (Klindworth, 2001). Inland barges, however, were the most important means for shipping ammonia. This was because most of the ammonia plants were located on the Gulf Coast, and the largest fertilizer-consuming States were up the Mississippi River in the Corn Belt. Ammonium nitrate is transported by rail, road, and water, but its transportation on U.S. navigable waterways is restricted because of its use in explosives. Urea is shipped either in bulk or as bagged material. The development of fertilizer blends is due partly to the location of fertilizer production and consumption, which favors handling in bulk. In the United States, the principal production points of the primary fertilizer materials are located far from each other—phosphates in Florida and the Southeast, potash in Canada or New Mexico, and nitrogen on the Gulf Coast. These materials need to be brought together in yet another location—the major consuming area of the Corn Belt. These fertilizer ingredients are transported to the area of consumption and mixed there. The river transport to the Corn Belt and, in the case of fluid fertilizers, a well-developed pipeline system have facilitated these developments.
OUTLOOK Because nitrogen is essential to plant and animal health and nitrogen has no substitute, its use will continue to increase as the world’s population continues to grow. Data that project the world nitrogen supply-demand balance, which was prepared by the Food and Agriculture Organization of the United Nations (2001), indicated that nitrogen demand will increase, on average, by 1.7 percent per year through the 2005–06 crop year, and the potential supply was projected to increase by 1.3 percent per year during the same period. Because the nitrogen supply has been in a surplus, the projected increase in demand, which is greater than that for supply, was expected to reduce the surplus somewhat. The gains will not be equivalent in all the world regions. Such regions as Asia, North America, and Western Europe were projected to have an internal deficit in supply, whereas countries from the former U.S.S.R. and Central America and South America would have an internal surplus of supply. This regional supply imbalance will continue the trend of exports from these two regions to provide a significant share of the North American demand.
North America14%
Central America and South America
6%
Western Europe7%
Former U.S.S.R.14%
Middle East9%
Asia (excluding China)18%
China22%
Central Europe5%
Africa3%
Oceania2%
Figure 24. Projected world ammonia capacity, by region, 2008. (International FertilizerIndustry Association, 2003d).38

39
Corn will remain the principal crop use for nitrogen in fertilizer. In addition to corn planted for human consumption, ethanol production in the United States is expected to continue to expand at a rapid rate as the United States phases out the use of methyl-tert-butyl-ether (MTBE) as an oxygenate in gasoline and replaces it with ethanol. This expansion in ethanol production will encourage farmers to plant corn because it is the principal feedstock for ethanol production. In the 2002–03 crop year, corn consumption for ethanol production rose by 15 percent compared with that of 2002, and additional growth is expected during the next 5 years (Baker, Allen, and Chambers, 2004). Increased meat consumption also is expected to lead to an increase in corn production. This increased consumption will produce an immediate multiplier effect on grain consumption. It takes approximately 7 kg of feed grain to produce 1 kg of beef, 4 kg of grain per 1 kg of pork, and 2 kg of grain per 1 kg of poultry. The International Fertilizer Industry Association (2003d) projects that the total world ammonia production capacity will increase by about 8 percent between 2002 and 2008; most of this increase will be in Asia and the Middle East. Production capacity in Europe and North America is expected to decline. Figure 24 shows the percentage of projected world capacity by region in 2008. On the basis of these projections, Asia will have about 40 percent of the total world capacity in 2008; about one-half of that capacity will be in China.
0
2,000
4,000
6,000
8,000
10,000
12,000
14,000
1984 1986 1988 1990 1992 1994 1996 1998 2000 2002
WorldUnited States
THO
USA
ND
MET
RIC
TO
NS
OF
CO
NTA
INED
NIT
RO
GEN
Figure 25. World ammonia trade.
Fluctuating natural gas prices and financial difficulties at some of the largest U.S. nitrogen producers continue to fuel the trend of moving ammonia production from the United States to such areas as Central America and South America and the Middle East, where resources of natural gas are large. Within the past 5 years, total ammonia production capacity in the United States has fallen by 10%, production has generally trended downward, and imports of ammonia have increased. In addition, the gap between production and production capacity has widened, reflecting extended capacity closures. These trends are expected to continue and, perhaps, accelerate depending mainly on the direction of the U.S. economy and the stability of natural gas prices. Many countries produce natural gas for less than $1.50 per million Btu and can produce ammonia for substantially less than U.S. producers. As natural gas prices climb in the United States, ammonia imports through the U.S. Gulf Coast likely will become more economical than domestically produced material. This may cause the higher cost U.S. producers in the Gulf region to curtail production permanently. World ammonia trade has increased significantly to 13.1 Mt of contained nitrogen. The United States, which is the largest ammonia importer in the world, accounts for 35 percent of world trade and has shown the largest increase in ammonia imports over the past 5 years (figure 25). Western Europe accounts for an additional one-quarter of world ammonia imports, but this region’s total has been declining because of closures of plants that produce finished fertilizer products. U.S. ammonia imports have increased significantly during the last 5 years to 4.7 Mt of contained nitrogen. Imports from Trinidad and Tobago have doubled since 1997 and accounted for more than one-half of total U.S. ammonia imports by 2002; this increase resulted from the addition of more than 2 Mt/yr of production capacity in Trinidad and Tobago since 1997. The former U.S.S.R. remains a large supplier, as does Canada. Imports from Venezuela also have increased during the last 2 years because of a new plant coming onstream in that country. U.S. ammonia imports are expected to continue to increase over the next several years.

40
Clarke, S.I., and Mazzafro, W.J., 1997, Nitric acid, in Kirk-Othmer encyclopedia of chemical technology (4th ed.): New York, N.Y., John Wiley & Sons, v. 17, p. 80-107.
Dietlin, Michael, 2001, The present and future ammonia trade logistics, in IFA Production and International Trade Conference, Quebec City, Quebec, Canada, September 13-14, 2001: Paris, France, International Fertilizer Industry Association, 15 p.
International Fertilizer Industry Association, 1991b, Survey of urea capacities summary report 1991: Paris, France, International Fertilizer Industry Association A/91/89, 4 p.
International Fertilizer Industry Association, 2002, Nitrogen fertilizer nutrient consumption—Million tonnes N, web site at http://www.fertilizer.org/ifa/statistics/indicators/tablen.asp. Accessed January 20, 2004.
REFERENCES CITED Agerton, Bill (Potash & Phosphate Institute), 2000, The nitrogen cycle, web site at http://www.ppi-far.org/ppiweb/ppibase.nsf/
$webindex/article=C2452786852569B5005AB164B438D5E8. Accessed January 21, 2004. Baker, Allen, Allen, Edward, and Chambers, William, 2004, Feed outlook—U.S. Department of Agriculture, web site at
http://usda.mannlib.cornell.edu/reports/erssor/field/fds-bb/2004/fds04a.pdf. Accessed March 3, 2004. Beaton, James, [undated], Fertilizer use—A historical perspective, Efficient Fertilizer Use Manual, web site at http://www.back-to-
basics.net/efu/efu.html. Accessed January 21, 2004.
Czuppon, T.A., Knez, S.A., and Rovner, J.M., 1992, Ammonia, in Kirk-Othmer encyclopedia of chemical technology (4th ed.): New York, N.Y., John Wiley & Sons, v. 2, p. 638-690.
Ericksen, G.E., 1981, Geology and origin of the Chilean nitrate deposits: U.S. Geological Survey Professional Paper 1188, 39 p. Fertilizer Institute, The, 2001, Fertilizer and natural gas, web site at http://www.fertilizerworks.com/html/market/naturalgasfeb.pdf.
Accessed January 21, 2004. Food and Agriculture Organization of the United Nations, 2001, Current world fertilizer trend and outlook to 2005/2006: Rome, Italy,
Food and Agriculture Organization of the United Nations, 6 p. (Also available online at ftp://ftp.fao.org/agl/agll/ docs/cwfto05.pdf.)
Food and Agriculture Organization of the United Nations and International Fertilizer Industry Association, 2000, Fertilizers and their use (4th ed.): Rome, Italy, Food and Agriculture Organization of the United Nations and International Fertilizer Industry Association, 70 p. (Also available online at http://www.fertilizer.org/ifa/publicat/pdf/fertuse.pdf.)
Food and Agriculture Organization of the United Nations and International Fertilizer Industry Association, 2001, Global estimates of gaseous emissions of NH3, NO and N2O from agricultural land: Rome, Italy, Food and Agriculture Organization of the United Nations and International Fertilizer Industry Association, 108 p. (Also available online at http://www.fertilizer.org/ifa/publicat/ pdf/2001_fao_nh3.pdf.)
Gollehon, Noel, Caswell, Margriet, Ribaudo, Marc, Kellogg, Robert, and Letson, David, 2001, Confined animal production and manure nutrients: U.S. Department of Agriculture Agriculture Information Bulletin 771, 34 p. (Also available online at http://www.ers.usda.gov/publications/aib771/aib771.pdf.)
Green Markets, 2000, National Research Council report proposes a reduction in N and P levels: Green Markets, v. 24, no. 15, p. 1, 12. IMC Global Inc., 2001, 2001 world agriculture and fertilizer situation: Lake Forest, Ill., IMC Global Inc., 65 p. Innovation Group, The, 2002, Chemical profile—Nitric acid, web site at http://www.the-innovation-group.com/ChemProfiles/
Nitric%20Acid.htm. Accessed January 21, 2004. Intergovermental Panel on Climate Change, 2002, Technical summary of the working group I report, web site at http://www.ipcc.ch/
pub/wg1TARtechsum.pdf. Accessed January 21, 2004. International Fertilizer Development Center, 1996, Worldwide ammonia capacity listing by plant: Muscle Shoals, Ala., International
Fertilizer Development Center, 80 p. International Fertilizer Development Center, 1999, Worldwide urea capacity listing by plant: Muscle Shoals, Ala., International
Fertilizer Development Center, 98 p. International Fertilizer Industry Association, 1991a, Survey of ammonia capacities summary report 1991: Paris, France, International
Fertilizer Industry Association A/91/88, 15 p.
International Fertilizer Industry Association, 1998, The fertilizer industry, food supplies and the environment: Paris, France, International Fertilizer Industry Association, 66 p. (Also available online at http://www.fertilizer.org/ifa/publicat/pdf/food.pdf.)
International Fertilizer Industry Association, 2003a, A.N./C.A.N. statistics 2002: Paris, France, International Fertilizer Industry Association A/03/111, 22 p.
International Fertilizer Industry Association, 2003b, Ammonia statistics 2002: Paris, France, International Fertilizer Industry Association A/03/75, 15 p.
International Fertilizer Industry Association, 2003c, Ammonium sulphate statistics 2002: Paris, France, International Fertilizer Industry Association A/03/95, 15 p.
International Fertilizer Industry Association, 2003d, Survey of ammonia capacities summary report 2003: Paris, France, International Fertilizer Industry Association A/03/101 16 p.
International Fertilizer Industry Association, 2003e, Survey of urea capacities summary report 2003: Paris, France, International Fertilizer Industry Association A/03/102, 6 p.
International Fertilizer Industry Association, 2003f, Urea statistics 2002: Paris, France, International Fertilizer Industry Association A/03/76, 21 p.
41
Klindworth, Keith, 2001, Transportation issues for the fertilizer industry: The Fertilizer Institute Outlook Conference, Arlington, Va.,
November 15-16, 2001, Presentation, unpaginated. Nitrogen & Methanol, 2000, Non-fertilizer uses of ammonia: Nitrogen & Methanol, no. 244, p. 15-18. Nitrogen & Methanol, 2002, The unwanted fertilizer: Nitrogen & Methanol, no. 258, p. 25-30. Nobel Foundation, The, [undated]a, Nobel e-museum, web site at http://www.nobel.se/chemistry/laureates/1918/haber-bio.html.
Accessed January 21, 2004. Nobel Foundation, The, [undated]b, Nobel e-museum, web site at http://www.nobel.se/chemistry/laureates/1931/bosch-bio.html.
Accessed January 21, 2004. Potash Corp. of Saskatchewan, 2001, About NPK, web site at http://www.potashcorp.com/npk_science/about/nitrogen/index.zsp.
Accessed January 21, 2004. Potash Corp. of Saskatchewan, 2003, An overview of PotashCorp and its industry 2003: Saskatoon, Saskatchewan, Canada, Potash
Corp. of Saskatchewan, 68 p. (Also available online at http://www.potashcorp.com/media/pdf/npk_markets/industry_overview/ 2003_overview.pdf.)
SD Gateway, [undated], Introduction to sustainable development, web site at http://www.sdgateway.net/introsd/definitions.htm. Accessed January 21, 2004.
Sociedad Quimica y Minera de Chile S.A., [undated]a, Caliche ore, web site via http://www.sqm.com/ingles/index.htm. Accessed January 21, 2004.
Sociedad Quimica y Minera de Chile S.A., [undated]b, Productive processes, web site via http://www.sqm.com/ingles/index.htm. Accessed January 21, 2004.
Terry, D.L., and Kirby, B.J., 2003, Commercial fertilizers 2002: Lexington, Ky., Association of American Plant Food Control Officials and The Fertilizer Institute, 41 p.
U.S. Department of Agriculture, 2001, Acreage, web site at http://usda.mannlib.cornell.edu/reports/nassr/field/pcp-bba/acrg2001.pdf. Accessed February 6, 2004.
U.S. Department of Energy, Energy Information Administration, 2004, Natural gas wellhead price, web site at http://tonto.eia.doe.gov/ dnav/ng/hist/n9190us3A.htm. Accessed January 21, 2004.
U.S. Environmental Protection Agency, 2001a, Action plan for reducing, mitigating, and controlling hypoxia in the northern Gulf of Mexico, web site at http://www.epa.gov/msbasin/actionplan.htm. Accessed January 21, 2004.
U.S. Environmental Protection Agency, 2001b, Non-CO2 greenhouse gas emissions from developed countries—1990–2010: U.S. Environmental Protection Agency EPA-430-R-01-007, 132 p. (Also available online at http://www.epa.gov/ghginfo/pdfs/ r1_new/fulldocument.pdf.)
U.S. Environmental Protection Agency, 2002a, Nitrogen oxides (NOx), web site at http://www.epa.gov/ebtpages/ airairponitrogenoxidesnox.html. Accessed January 21, 2004.
U.S. Environmental Protection Agency, 2002b, NOx—What is it? Where does it come from?, web site at http://www.epa.gov/ air/urbanair/nox/what.html. Accessed January 21, 2004.
U.S. Environmental Protection Agency, 2003, Inventory of U.S. greenhouse gas emissions and sinks—1990–2001: U.S. Environmental Protection Agency, EPA 430-R-03-004, various pagination. (Also available online at http://yosemite.epa.gov/ oar/globalwarming.nsf/content/ResourceCenterPublicationsGHGEmissionsUSEmissionsInventory2003.html.)
Vitousek, P.M., Aber, John, Howarth, R.W., Likens, G.E., Matson, P.A., Schindler, D.W., Schlesinger, W.H., and Tilman, G.D., 1997, Human alteration of the global nitrogen cycle—Causes and consequence, web site at http://www.sdsc.edu/ESA/tilman.htm. Accessed January 21, 2004.
Weston, C.W., 1992, Ammonium compounds, in Kirk-Othmer encyclopedia of chemical technology (4th ed.): New York, N.Y., John Wiley & Sons, v. 2., p. 692-708.

42
APPENDIX. SELECTED NITROGEN DATA, 1970–2002

Table A-1. Salient ammonia statistics 1. [In thousand metric tons of contained nitrogen unless otherwise specified. E, Net exporter. NA, Not available. Data are rounded to three significant digits, except prices] 1970 1971 1972 1973 1974 1975 1976 1977 1978 1979 1980 1981 1982 1983 1984 1985 1986 United States:
Production:
Synthetic plants.......................................... 10,300 10,900
11,300 11,300 11,700 12,200 12,500 13,200 12,800
13,900 14,700 14,200 11,800 10,200 12,500 12,900 10,800 Ammonia liquor, coking plants ................. 11 11 10 5 5 5 4 6 6 6 6 2 5 5 5 NA NA
Production capacity (thousand metric tons of ammonia) ................................................... 15,200 15,300 15,300 15,200 15,800 16,300 16,500 19,100 19,500 18,600 19,000 17,900 16,900 16,000 16,200 16,300 16,100
Exports ............................................................ 727 369 530 672 296 262 327 314 394 587 607 459 553 270 397 916 482Imports for consumption................................. 361 379 288 246 338 601 543 802 1,130 1,450 1,740 1,560 1,580 1,970 2,450 2,090 1,860Consumption, apparent 2 ................................. 9,880 10,700 11,100 11,500 11,600 11,900 12,500 13,400 13,800 14,900 16,000 14,900 12,800 12,400 14,300 14,000 12,400 Stocks, December 31, producers'.................... 1,070 1,240 1,190 640 849 1,540 1,680 2,060 1,800 1,630 1,460 1,900 1,910 1,410 1,550 1,630 1,370Average annual price per short ton product,
f.o.b. Gulf Coast 3 ...................................... $57 $56 $60 $85 $200 $185 $185 $130 $82 $130 $122 $132 $118 $178 $147 $108 $75Net import reliance 4 as a percentage of
apparent consumption................................ E E E 1 E E 5 1 7 7 8 4 8 18 13 8 13Natural gas price, wellhead 6 .......................... $0.17 $0.18 $0.19 $0.22 $0.30 $0.44 $0.58 $0.79 $0.91 $1.18 $1.59 $1.98 $2.46 $2.59 $2.66 $2.51 $1.94
World: Production ....................................................... 38,800 41,100 43,000 46,700 48,400 49,500 56,900 62,000 67,200 71,100 73,600 77,000 75,900 80,400 88,600 91,000 91,100 Trade 7 ............................................................. NA NA NA NA NA NA NA NA NA NA NA NA NA NA 7,650 8,200 7,190
1987 1988 1989 1990 1991 1992 1993 1994 1995 1996 1997 1998 1999 2000 2001 2002 United States:
Production:
rld:
Synthetic plants................................ 12,000 12,500 12,300 12,700 12,800 13,400 12,600 13,300 13,000 13,400 13,300 13,800 12,900 11,800 9,120 10,100 Ammonia liquor, coking plants ....... NA NA NA NA NA NA NA NA NA NA NA NA NA NA NA NA
Production capacity (thousand metric tons of ammonia) ............................. 14,300 15,300 15,800 15,700 16,100 16,000 15,900 16,100 16,600 16,700 17,500 17,900 17,900 17,700 17,500 16,700
Exports .................................................. 769 582 346 482 580 354 378 215 319 435 395 614 562 662 647 437Imports for consumption ...................... 2,140 2,750 2,860 2,670 2,740 1,690 2,660 3,450 2,630 3,390 3,530 3,460 3,890 3,880 4,550 4,670 Consumption, apparent 2....................... 13,800 14,700
14,900 14,900 14,800 15,600 15,100 16,500 15,300 16,400 15,800 17,100 16,300 14,900 13,200 14,500
Stocks, December 31, producers'.......... 955 925 849 797 936 1,060 852 956 959 881 1,530 1,050 996 1,120 916 771 Average annual price per short ton
product, f.o.b. Gulf Coast 3 .............. $95 $109 $104 $106 $117 $106 $121 $211 $191 $190 $173 $121 $109 $169 $183 $137
Net import reliance 4 as a percentage of apparent consumption ................. 13 14 17 15 14 14 17 19 15 19 16 19 21 20 31 30
Natural gas price, wellhead 6 ................ $1.67 $1.69 $1.69 $1.71 $1.64 $1.74 $2.04 $1.85 $1.55 $2.17 $2.32 $1.96 $2.17 $3.69 $4.12 $2.95Wo
Production............................................. 95,100 99,300 99,300 97,500 93,800 93,400 91,600 93,800 100,000 103,000 104,000 104,000 107,000 108,000 105,000 109,000 Trade 7 ................................................... 8,240 9,450 9,820 10,000 9,590 9,270
9,060 10,000
10,800
10,900
11,300
11,300
12,000
12,700
12,600
13,100
1 Synthetic anhydrous ammonia, calendar year data, U.S. Census Bureau; excludes coke oven byproduct.2 Calculated from production, plus imports minus exports, and industry stock changes.
3 Source: Green Markets.
nit.
4 Defined as imports minus exports, adjusted for industry stock changes.5 Less than 1⁄2 u
43

Table A-1. Salient ammonia statistics 1—Continued. 6 Monthly Energy Review, U.S. Department of Energy. Average annual cost at wellhead in dollars per thousand cubic feet. 7 Source: International Fertilizer Industry Association Statistics, World Anhydrous Ammonia Trade.
.
Note: Prior to 1984, yearend Gulf Coast price for ammonia; before 1978, delivered east of Rocky Mountains, except East coast. Prior to 1973, exports include aqua ammonia.
Table A-2. Major downstream nitrogen compounds produced in the United States 1
[In thousand metric tons. Current Industrial Reports (MA28B, MQ28B, MQ325A, and MQ325B); U.S. Census Bureau. NA, Not available. Data are rounded to three significant digits] Compound 1970 1971 1972 1973 1974 1975 1976 1977 1978 1979 1980 1981 1982 1983 1984 1985 1986
Urea: Gross weight ................
2,830 2,790 3,150 3,210 3,440 3,230 3,560 4,030 5,690 6,350 7,100 7,310 5,910 5,240 7,030 6,330 5,680Nitrogen content ..........
1,300
1,280
1,440
1,480
1,580
1,480
1,640
1,850
2,610
2,920
3,260
3,360
2,710
2,400
3,230
2,900
2,610
Ammonium nitrate:Gross weight ................ 5,870 5,990 6,240 6,490 6,840 6,430 6,520 6,510 6,540 7,520 8,280 8,040 6,430 6,010 6,500 6,490 5,530Nitrogen content .......... 1,990 2,030 2,120 2,200 2,320 2,180 2,210 2,210 2,220 2,550 2,810 2,730 2,180 2,040 2,200 2,200 1,870
Ammonium phosphates: 2
Gross weight ................ 4,730 5,340 5,900 6,140 6,180 6,910 8,150 9,260 10,400 11,000 12,100 10,900 9,350 11,600 13,400 12,500 9,980Nitrogen content .......... NA NA NA NA NA NA NA NA NA NA NA NA NA NA 2,230 2,100 1,690
Ammonium sulfate: 3
Gross weight ................ 2,300 2,140 1,800 1,980 1,870 2,370 2,300 2,490 2,630 2,250 2,030 1,980 1,600 1,780 1,880 1,900 1,890Nitrogen content ..........
acid: 487 454 382 419 396 503 487 529 558 477 430 420 340 378 398 403 400
Nitric Gross weight 4 .............. 6,070 6,120 7,240 7,660 7,370 6,830 7,070 7,250 7,200 8,090 8,370 8,250 6,700 6,680 1,960 1,830 1,760Nitrogen content .......... 1,330 1,350 1,590 1,690 1,620 1,500 1,560 1,590 1,580 1,780 1,840 1,820 1,480 1,470 430 402 387
Compound 1987 1988 1989 1990 1991 1992 1993 1994 1995 1996 1997 1998 1999 2000 2001 2002
Urea: Gross weight ...........................
6,740 7,180 7,260 7,450 7,380 7,950 7,520 7,230 7,370 7,740 7,430 8,140 8,080 6,910 6,080 7,040Nitrogen content ..................... 3,100 3,300 3,340 3,430 3,390 3,660 3,460 3,330 3,440 3,550 3,410 3,740 3,710 3,170 2,790 3,230
Ammonium nitrate:Gross weight ........................... 12,100 13,700 7,140 7,000 7,090 7,240 7,490 7,740 7,700 8,190 7,810 8,240 7,230 6,800 5,830 6,330Nitrogen content ..................... 4,110 2,350
2,500
2,450
2,480
2,530
2,620
2,710
2,700
2,780
2,650
2,790
2,450
2,310
1,980
2,140
Ammonium phosphates: 2
Gross weight ........................... 5,940 6,810 14,900 15,900 16,400 17,200 15,900 15,600 16,500 16,900 17,500 16,200 16,700 15,900 14,500 15,500Nitrogen content ..................... 2,080 2,380
2,520
2,670
2,710
2,920
2,680
2,660
2,850
2,820
2,980
2,790
2,820
2,550
2,320
2,490
Ammonium sulfate: 3
Gross weight ........................... 1,990 2,120 2,160 2,290 2,040 2,170 2,200 2,350 2,400 2,420 2,460 2,560 2,610 2,600 2,350 2,580Nitrogen content ..................... 421 445 459 485 432 460 466 495 509 512 521 542 533 552 498 547
Nitric acid:Gross weight 4 ......................... 1,880 1,890 1,950 1,680 1,610 1,680 1,840 1,710 1,770 8,350 8,560 8,420 8,120 7,690 6,420 6,940Nitrogen content ..................... 413 420 434 374 357 373 408 381 407 1,840 1,880 1,850 1,790 1,690 1,410 1,530
1 Ranked in relative order of importance by nitrogen content. 2 Diammonium phosphate, monoammonium phosphate, and other ammonium phosphates. 3 Excludes coke plant ammonium sulfate (1981–2002). 4 Before 1996, gross nitric acid production netted for use in production of ammonium nitrate.
44

Table A-3. U.S. imports of major nitrogen compounds. [In thousand metric tons and thousand dollars. U.S. Census Bureau. NA, Not available. Data are rounded to three significant digits; because of independent rounding, components may not add to totals shown.] 1970 1971 1972 1973 1974 Gross Nitrogen Gross Nitrogen Gross Nitrogen Gross Nitrogen Gross Nitrogen
Compound
weight content Value weight1 content Value 1 weight content Value 1 weight content Value 1 weight content Value 1
Ammonium nitrate 2 ......................... 297 101 $15,200 342 116 $16,300 347 118 $16,800 310 105 $15,600 342 116 $26,000Ammonium sulfate 2.........................
198 42 6,500 208 44 5,060 239 51 7,310 271 58 10,600 234 50 20,200Anhydrous ammonia 3...................... 440 362 20,700 419 345 20,400 350 288 17,000
299 246 16,200 413 339 52,200
Diammonium phosphate ..................
NA NA NA NA NA NA NA NA NA NA NA NA NA NA NAMonoammonium phosphate............. NA NA NA NA NA NA NA NA NA NA NA NA NA NA NANitrogen solutions ............................ 112 34 5,200 152 46 5,520 135 40 4,760 175 52 7,380 79 24 7,190Urea .................................................. 394 181 22,400 298 137 16,100 504 232 $25,600 611 281 38,900 650 299 87,900
Total ............................................ 1,440 719 $70,000 1,420 687 $63,400 1,580 728 71,500 1,670 742 $88,700 1,720 827 $194,000 1975 1976 1977 1978 1979 Gross Nitrogen Gross Nitrogen Gross Nitrogen Gross Nitrogen Gross Nitrogen
Compound
weight content Value weight1 content Value 1 weight content Value 1 weight content Value 1 weight content Value 1
Ammonium nitrate 2 ......................... 225 76 $25,300 286 97 $24,500 355 120 $35,100 435 148 $39,900 346 117 $33,200Ammonium sulfate 2.........................
199 42 21,400 513 109 23,500 297 63 16,400 296 63 19,800 222 47 16,900Anhydrous ammonia 3...................... 732 602 124,000 662 544 70,800 978 804 103,000 1,360 1,120 133,000 1,770 1,460 166,000Diammonium phosphate .................. 83 15 14,100 129 23 18,600 155 28 19,300
108 19 14,300 132 24 17,900
Monoammonium phosphate............. NA NA NA NA NA NA NA NA NA NA NA NA NA NA NANitrogen solutions ............................ 106 32 11,700 274 82 21,800 449 134 40,300 300 90 33,000 109 33 12,400Urea .................................................. 593 272 87,900 764 351 84,700 1,280 589 154,000 1,290 594 169,000 1,020 470 137,000
Total ............................................ 1,940 1,040 $284,000 2,630 1,210 $244,000 3,520 1,740 $368,000 3,800 2,030 $409,000 3,600 2,150 $383,000
1980 1981 1982 1983 1984 Gross Nitrogen Gross Nitrogen Gross Nitrogen Gross Nitrogen Gross Nitrogen
Compound
weight content Value weight1 content Value 1 weight content Value 1 weight content Value 1 weight content Value 1
Ammonium nitrate 2 ......................... 367 124 $41,400 419 142 $51,100 396 134 $54,800 463 157 $60,900 596 202 $71,600Ammonium sulfate 2.........................
262 56 22,300 297 63 28,600 289 61 28,100 259 55 24,100 514 109 28,900Anhydrous ammonia 3...................... 2,120 1,740 234,000 1,900 1,560 245,000 1,920 1,580 293,000 2,390 1,970 344,000 2,980 2,450 474,000Diammonium phosphate .................. 134 24 23,900 106 19 20,100 63 11 12,200
47 8 9,330 48 9 9,980
Monoammonium phosphate............. NA NA NA NA NA NA NA NA NA NA NA NA NA NA NANitrogen solutions ............................ 161 48 23,600 133 40 18,000 116 35 15,400 210 63 23,900 231 69 26,600Urea .................................................. 923 423 140,000 774 355 131,000 1,920 880 173,000 1,740 799 236,000 2,000 916 270,000
Total ............................................ 3,970 2,420 $486,000 3,630 2,180 $494,000 4,700 2,700 $577,000 5,110 3,050 $699,000 6,360 3,750 $880,000See footnotes at end of table.
45

Table A-3. U.S. imports of major nitrogen compounds—Continued. [In thousand metric tons and thousand dollars. U.S. Census Bureau. NA, Not available. Data are rounded to three significant digits; because of independent rounding, components may not add to totals shown.] 1985 1986 1987 1988 1989 NitrogenGross NitrogenGross NitrogenGross Gross Nitrogen NitrogenGross
Compound
weight content Value weight1 content Value 1 weight content Value 1 weight content Value 1 weight content Value 1 Ammonium nitrate 2......................... 598 203 $68,000 556 189 $54,200 344 117 $30,300 358 121 $33,000 411 139 $48,400Ammonium sulfate 2 ........................ 904 192 34,000
264 56 20,600 259 55 18,400 337 71 27,300 305 65 27,800Anhydrous ammonia 3...................... 2,550 2,090 380,000 2,260 1,860 273,000 2,570 2,110 228,000 3,310 2,720 351,000 3,480 2,860 388,000Diammonium phosphate .................. 45 8 8,240 32 6 5,510 26 5 5,040 10 2 2,430 15 3 3,900Monoammonium phosphate ............ NA NA NA NA NA NA NA NA NA 27 3 6,920 30 3 10,500Nitrogen solutions............................ 171 51 20,900 303 91 26,100 467 140 27,600 532 159 46,600 595 178 60,100Urea .................................................. 1,960 902 262,000 3,160 1,450 306,000 2,270 1,040 205,000 2,020 926 230,000 1,970 905 262,000
Total ............................................ 6,230 3,450 $774,000 6,570 3,650 $686,000 5,930 3,470 $515,000 6,590 4,000 $697,000 6,810 4,150 $801,000 1990 1991 1992 1993 1994 NitrogenGross NitrogenGross NitrogenGross Gross Nitrogen NitrogenGross
Compound 138
weight content Value weight
1 content Value 1 weight content Value 1 weight
content Value 1 weight
content Value 1 Ammonium nitrate 2......................... 406 $49,000 421 143 $52,800 444 151 $55,500 485 164 $58,500 612 207 $74,000Ammonium sulfate 2 ........................ 361 77 34,400
311 66 29,100 336 71 30,200 367 78 32,000 455 96 38,000Anhydrous ammonia 3...................... 3,250 2,670 357,000 3,340 2,740 391,000 3,270 2,690 366,000 3,230 2,660 415,000 4,200 3,450 725,000Diammonium phosphate .................. 11 2 3,270 7 1 2,200 23 4 4,910 38 7 7,100 15 3 4,270Monoammonium phosphate ............ 51 6 13,500 91 10 20,200 162 18 28,800 157 17 26,000 203 22 41,400Nitrogen solutions............................ 402 120 31,400 218 65 21,000 108 32 10,900 391 117 38,200 312 93 31,500Urea .................................................. 1,860 854 251,000 1,620 743 209,000 1,560 716 205,000 2,960 1,360 396,000 3,160 1,450 436,000
Total ............................................ 6,340 3,870 $739,000 6,000 3,770 $726,000 5,900 3,680 $701,000 7,630 4,400 $973,000 8,960 5,320 $1,350,000 1995 1996 1997 1998 1999 NitrogenGross Gross Nitrogen Gross Nitrogen Gross Nitrogen Gross Nitrogen
Compound
weight content Value weight1 content Value 1 weight content Value 1 weight content Value 1 weight content Value 1 Ammonium nitrate 2......................... 721 245 $103,000 718 251 $110,000 708 240 $104,000 759 257 $99,900 935 198 $111,000Ammonium sulfate 2 ........................ 434 91 40,700
373 79 38,300 478 101 47,000 319 68 29,800 342 58 34,500Anhydrous ammonia 3...................... 3,200 2,630 877,000 4,130 3,390 793,000 4,300 3,530 722,000 4,210 3,460 565,000 4,730 3,890 548,000Diammonium phosphate .................. 21 4 6,010 77 16 18,300 57 10 14,500 44 8 11,100 36 11 8,360Monoammonium phosphate ............ 219 24 52,500 181 22 52,400 115 13 33,500 126 14 35,600 47 7 18,800Nitrogen solutions............................ 628 189 83,000 877 264 119,000 780 233 89,900 633 189 60,700 614 92 54,600Urea .................................................. 2,940 1,350 487,000 2,520 1,170 447,000 2,530 1,160 425,000 3,320 1,530 520,000 3,260 1,500 486,000
Total ............................................ 8,160 4,530 $1,650,000 8,870 5,200 $1,580,000 8,970 5,290 $1,440,000 9,420 5,520 $1,320,000 9,970 5,750 $1,260,000See footnotes at end of table.
46

Table A-3. U.S. imports of major nitrogen compounds—Continued. [In thousand metric tons and thousand dollars. U.S. Census Bureau. NA, Not available. Data are rounded to three significant digits; because of independent rounding, components may not add to totals shown.] 2000 2001 2002 Gross Nitrogen Gross Nitrogen Gross Nitrogen
Compound
weight content Value weight1 content Value 1 weight content Value 1
Ammonium nitrate 2 ......................... 818 277 $93,700 953 323 $127,000 990 336 $115,000Ammonium sulfate 2.........................
347 74 32,400 335 71 28,700 347 74 27,400Anhydrous ammonia 3...................... 4,720 3,880 768,000 5,540 4,550 992,000 5,680 4,670 763,000Diammonium phosphate .................. 123 22 21,900 133 24 22,300 156 28 32,800Monoammonium phosphate............. 188 21 40,700 262 29 48,600 229 25 46,700Nitrogen solutions ............................ 1,310 390 129,000 2,000 597 235,000 997 298 98,400Urea .................................................. 3,900 1,790 621,000 4,800 2,200 773,000 3,840 1,760 556,000
Total ............................................ 11,400 6,460 $1,710,000 14,000 7,800 $2,230,000 12,200 7,190 $1,640,0001 Cost, insurance, and freight (c.i.f.) value. 2 Includes industrial chemical products. 3 Includes industrial ammonia.
Table A-4. U.S. exports of major nitrogen compounds 1. [In thousand metric tons. U.S. Census Bureau. NA, Not available. Data are rounded to three significant digits; because of independent rounding, components may not add to totals shown.] 1970 1971 1972 1973 1974 1975 1976 NitrogenGross Gross Nitrogen NitrogenGross NitrogenGross Gross Nitrogen NitrogenGross NitrogenGross
Compound weight content
weight content weight content weight content
weight content weight
content weight
content
Ammonium nitrate 2 .......................... 61 21 35 12 20 7 37 13 16 6 42 14 11 4Ammonium sulfate 2 ..........................
474 128 468 126 472 127 479 129 481 130 659 178 584 158Anhydrous ammonia 3 ....................... 886 729 450 370 646 531 820 674 361 297 320 263 399 328Diammonium phosphate.................... NA NA NA NA NA NA NA NA NA NA NA NA NA NAMonoammonium phosphate .............. NA NA NA NA NA NA NA NA NA NA NA NA NA NAUrea.................................................... 422 194 356 163 454 208 387 178 287 132 505 232 483 222 Total .............................................. 1,840 1,070 1,310 671 1,590 873 1,720 994 1,150 564 1,530 687 1,480 711 1977 1978 1979 1980 1981 1982 1983 NitrogenGross Gross Nitrogen NitrogenGross NitrogenGross Gross Nitrogen NitrogenGross NitrogenGross
Compound
weight content weight content weight content weight content weight content weight content weight contentAmmonium nitrate 2 .......................... 14 5 42 14 98 33 92 31 67 23 68 23 44 15Ammonium sulfate 2 ..........................
454 122 748 202 946 255 743 201 670 181 508 137 662 179Anhydrous ammonia 3 ....................... 383 315 476 391 715 588 751 617 559 459 673 553 329 271Diammonium phosphate.................... NA NA 3,930 707 4,030 725 5,000 899 3,940 710 3,710 667 4,270 769Monoammonium phosphate .............. NA NA NA NA NA NA NA NA NA NA NA NA NA NAUrea.................................................... 524 241 1,370 630 1,360 626 1,760 809 1,430 657 1,500 687 997 458 Total .............................................. 1,370 682 6,570 1,950 7,150 2,230 8,340 2,560 6,670 2,030 6,450 2,070 6,300 1,690 See footnotes at end of table.
47
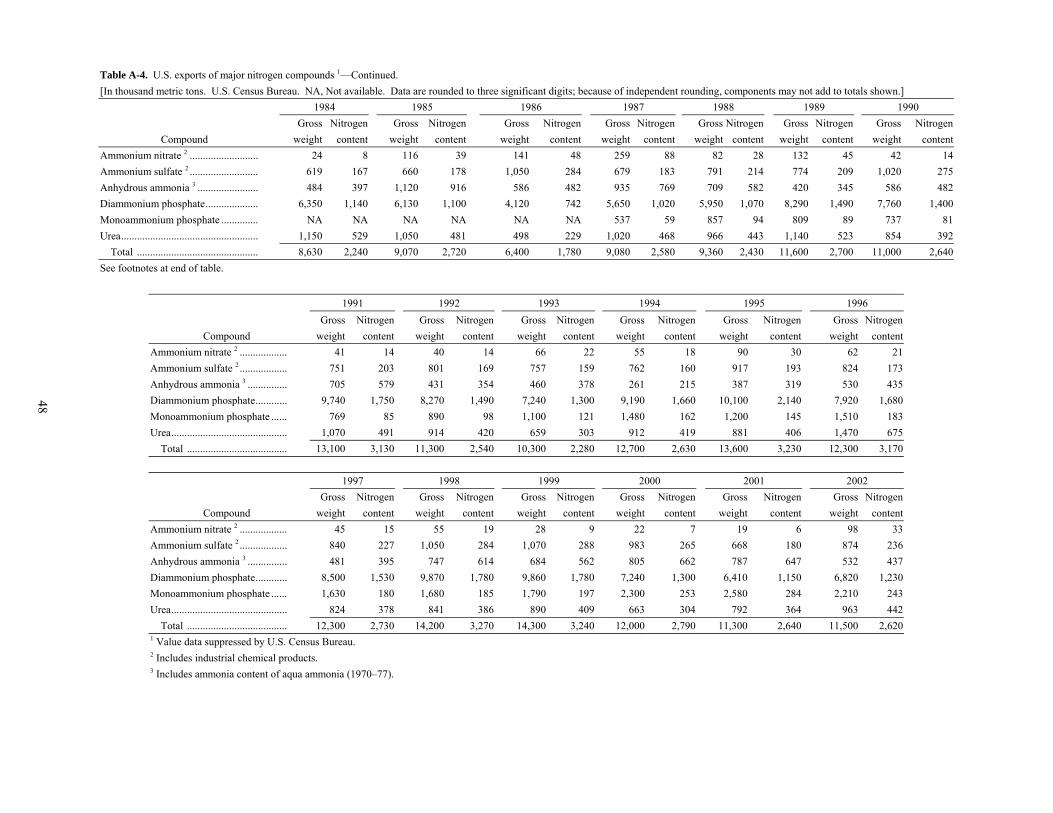
Table A-4. U.S. exports of major nitrogen compounds 1—Continued. [In thousand metric tons. U.S. Census Bureau. NA, Not available. Data are rounded to three significant digits; because of independent rounding, components may not add to totals shown.] 1984 1985 1986 1987 1988 1989 1990 NitrogenGross Gross Nitrogen NitrogenGross NitrogenGross Gross Nitrogen NitrogenGross NitrogenGross
Compound
weight content weight content weight content weight content weight content weight content weight contentAmmonium nitrate 2 .......................... 24 8 116 39 141 48 259 88 82 28 132 45 42 14Ammonium sulfate 2 ..........................
619 167 660 178 1,050 284 679 183 791 214 774 209 1,020 275Anhydrous ammonia 3 ....................... 484 397 1,120 916 586 482 935 769 709 582 420 345 586 482Diammonium phosphate.................... 6,350 1,140 6,130 1,100 4,120 742 5,650 1,020 5,950 1,070 8,290 1,490 7,760 1,400Monoammonium phosphate .............. NA NA NA NA NA NA 537 59 857 94 809 89 737 81Urea.................................................... 1,150 529 1,050 481 498 229 1,020 468 966 443 1,140 523 854 392 Total .............................................. 8,630 2,240 9,070 2,720 6,400 1,780 9,080 2,580 9,360 2,430 11,600 2,700 11,000 2,640See footnotes at end of table.
1991 1992 1993 1994 1995 1996 NitrogenGross NitrogenGross NitrogenGross NitrogenGross Gross Nitrogen NitrogenGross
Compound
weight content weight content weight content weight content weight content weight contentAmmonium nitrate 2 .................. 41 14 40 14 66 22 55 18 90 30 62 21Ammonium sulfate 2 .................. 751 203
801 169 757 159 762 160 917 193 824 173Anhydrous ammonia 3 ............... 705 579 431 354 460 378 261 215 387 319 530 435Diammonium phosphate............ 9,740 1,750 8,270 1,490 7,240 1,300 9,190 1,660 10,100 2,140 7,920 1,680Monoammonium phosphate ...... 769 85 890 98 1,100 121 1,480 162 1,200 145 1,510 183Urea............................................ 1,070 491 914 420 659 303 912 419 881 406 1,470 675 Total ...................................... 13,100 3,130 11,300 2,540 10,300 2,280 12,700 2,630 13,600 3,230 12,300 3,170 1997 1998 1999 2000 2001 2002 NitrogenGross Gross Nitrogen Gross Nitrogen Gross GrossNitrogen Nitrogen Gross Nitrogen
Compound
weight content weight content weight content weight content weight content weight contentAmmonium nitrate 2 .................. 45 15 55 19 28 9 22 7 19 6 98 33Ammonium sulfate 2 .................. 840 227
1,050 284 1,070 288 983 265 668 180 874 236Anhydrous ammonia 3 ............... 481 395 747 614 684 562 805 662 787 647 532 437Diammonium phosphate............ 8,500 1,530 9,870 1,780 9,860 1,780 7,240 1,300 6,410 1,150 6,820 1,230Monoammonium phosphate ...... 1,630 180 1,680 185 1,790 197 2,300 253 2,580 284 2,210 243Urea............................................ 824 378 841 386 890 409 663 304 792 364 963 442 Total ...................................... 12,300 2,730 14,200 3,270 14,300 3,240 12,000 2,790 11,300 2,640 11,500 2,6201 Value data suppressed by U.S. Census Bureau. 2 Includes industrial chemical products. 3 Includes ammonia content of aqua ammonia (1970–77).
48

Table A-5. Price quotations for major nitrogen compounds at yearend. [Per short ton product. Chemical Marketing Reporter, 1970-77; Green Markets, 1978-2000. NA, Not available.]
Compound 1970 1971 1972 1973 1974 1975 1976 1977 1978 1979 1980 Ammonium nitrate; free on board (f.o.b.) Corn Belt 1... $41- $45 $40- $46.50 $47- $49 $47- $48 $91- $115 $91- $115 $91- $115 $91- $115 $86- $90 $118- $120 $110- $115Ammonium sulfate; f.o.b. Corn Belt 1 ...........................
23- 31 12- 22 15- 27 15- 25 89 60 60 60 60- 65 75- 80 85Anhydrous ammonia:
F.o.b. Corn Belt .......................................................... 55- 59 55- 55-57 55- 65 60- 110 190- 210 180- 190 180- 190 120- 140 104- 115 148- 155 150- 160F.o.b. Gulf Coast 2 ...................................................... 80- 84 128- 132 120- 124
Diammonium phosphate; f.o.b. central Florida ............. 65 55- 62 55- 66 75- 110 145- 165 135 110- 125 110- 125 116- 120 212- 215 190- 195Urea:
F.o.b. Corn Belt, prilled and granular ........................ 61- 65 53- 60 60- 63 72- 107 160- 175 160- 175 120- 140 120- 140 125- 135 165- 170 155- 170F.o.b. Gulf Coast, granular 2 ...................................... NA NA NA NA NA NA NA NA NA NA NAF.o.b. Gulf Coast, prilled 2 ......................................... NA NA NA NA NA NA NA NA 106- 110 145- 150 170- 175
Compound 1981 1982 1983 1984 1985 1986 1987 1988 1989 1990 1991
Ammonium nitrate; free on board (f.o.b.) Corn Belt 1... $138- $150 $125- $145 $135- $145 $135- $150 $112- $133 $100- $120 $100- $120 $128- $135 $105- $115 $120- $125 $98- $118Ammonium sulfate; f.o.b. Corn Belt 1 ...........................
86-
70- 86 89- 91 99- 113 112- 123 88- 119 88- 119 100- 102 95- 105 100- 120 120- 130 107- 113 Anhydrous ammonia:
F.o.b. Corn Belt .......................................................... 190- 195 155- 165 175- 85 175- 195 160- 170 100- 115 130- 140 143- 150 110- 115 140- 145 125- 140F.o.b. Gulf Coast 2 ...................................................... 131- 133 115- 120 175- 180 142- 147 107- 110 71- 73 103- 106 126- 129 88 115- 118 105- 107
Diammonium phosphate; f.o.b. central Florida .............
168- 172 145- 148 176-
181 150- 152 139- 147 120 170- 173
165- 173 125- 126 145- 148 131- 135 Urea:
F.o.b. Corn Belt, prilled and granular ........................ 170-
180 135- 145 160- 167 168- 200 110- 137 90- 110 125- 135 150- 155 110- 120 155- 165 132- 145F.o.b. Gulf Coast, granular 2 ...................................... NA NA NA 157- 160 98- 101 76- 80 118- 122 153- 155 115- 117 155- 156 129- 130 F.o.b. Gulf Coast, prilled 2 .........................................
130-
135
122-
125
135-
140
147-
149
82-
95 75-
78 114-
117
139-
145
98-
105
142-
145
121-
122
Compound 1992 1993 1994 1995 1996 1997 1998 1999 2000 2001 2002 Ammonium nitrate; free on board (f.o.b.) Corn Belt 1... $125- $135 $125- $135 $150- $160 $162- $170 $160- $170 $122- $125 $110- $115 $110- $115 $140- $150 $120- $130 $120- $130Ammonium sulfate; f.o.b. Corn Belt 1 ...........................
110- 120 121- 133 113- 135 124- 136 119- 130 124- 130 118- 128 109- 112 130- 135 124- 129 120- 130 Anhydrous ammonia:
F.o.b. Corn Belt .......................................................... 133- 145 142- 155 230- 240 205- 220 233- 245 181- 195 131- 141 157- 165 280- 300 170- 180 233- 245F.o.b. Gulf Coast 2 ...................................................... 117- 118 130- 132 218- 230 185- 195 225 130 98 109 230 125 170- 175
Diammonium phosphate; f.o.b. central Florida .............
111- 115 138- 140 167-
172 212- 215 177- 180 174- 175 172- 175
138- 140 137- 142 133- 140 134- 138 Urea:
F.o.b. Corn Belt, prilled and granular ........................ 135- 145 128- 150 185- 195 220- 235 197- 210 125- 135 110- 125 115- 125 175- 180 130- 135 150- 160F.o.b. Gulf Coast, granular 2 ...................................... 129- 132 126- 128 199- 205 217- 222 188- 190 102- 103 82- 85 107- 110 158- 161 104- 108 128- 132 F.o.b. Gulf Coast, prilled 2 ......................................... 126- 128 116- 118 185- 193 217- 220 181- 184 102- 103 75- 80 102 150- 155 103- 105 125
1 Illinois, Indiana, Iowa, Missouri, Nebraska, and Ohio. 2 Barge, New Orleans, Louisiana. Note: Prior to 1988, prices shown for ammonium nitrate; anhydrous ammonia, corn belt; and urea, corn belt are delivered prices. Prior to 1978, anhydrous ammonia prices are delivered, east of the Rocky Mountains; urea prices are delivered, east of the Rockies.
49