MINE REAL TIME DPM AMBIENT MONITORING - GWMT
14
1 MINE REAL TIME DPM AMBIENT MONITORING A. D. S. Gillies 1 and H. W. Wu 2 , 1. Union Pacific Rocky Mountains Energy Mining Professor, Missouri University of Science and Technology, Rolla, Missouri 2. Director, Gillies Wu Mining Technology Pty Ltd, Brisbane, Queensland ABSTRACT: A real time Diesel Particulate Matter (DPM) monitor has been developed on the base of the successful NIOSH Personal Dust Monitor (PDM) unit. The objectives of a recently completed Australian Coal Association Research Program (ACARP) study has been to finalize the design of a DPM unit, to undertake comprehensive and internationally recognized laboratory testing to evaluate the new design and to undertake an underground series of tests to establish the robustness and reliability of the new approach. Under the project Thermo Fisher Scientific has undertaken structural changes to the PDM to convert it to a DPM real time monitoring underground instrument, the D-PDM. The Pittsburgh Research Laboratories of the National Institute of Occupational Health and Safety (NIOSH) has undertaken laboratory “calibration or verification” testing. A phase of Australian mine robustness and engineering testing has been undertaken to ensure the instrument can effectively assist mine management to handle this health issue. This paper discusses tests that have been undertaken during Longwall face moves. The paper discusses how the monitors have performed within the underground mine environment in evaluating DPM during the various phases of the face shield moves. They have closely examined the influence of aspects of the mine ventilation system. INTRODUCTION Mine ventilation is a critical aspect of all underground mines. Mining technological developments and mining environment challenges are necessitating new approaches. This paper in particular examines an area of new development. Diesel Particulate Matter (DPM) issues are very high profile currently in Australian coal mines and Australian states are generally moving to acknowledge and to broadly follow US 2008 final metal/non metal mine regulation limits of 0.2 mg/m 3 submicron particulate matter, 0.16 mg/m 3 total carbon particulate and 0.1 mg/m 3 elemental carbon particulate. The real time DPM monitor has been developed on the base of the successful Personal Dust Monitor (PDM) unit for respirable dust monitoring. The objectives of recently completed Australian Coal Association Research Program (ACARP) study has been to finalise the design of a DPM unit, to undertake comprehensive and internationally recognised laboratory testing to evaluate the new design and to undertake an underground series of tests to establish the robustness and reliability of the new approach. The PDM gives realtime readings and is mounted within the miner’s cap lamp battery and internally measures the true particle mass of dust collected on its filter. Samples are available for later mineralogical analysis and results do not exhibit the same sensitivity to water spray as optically based measurement approaches. The technique achieves microgram-level mass resolution even in the hostile mine environment and reports dust loading data on a continuous basis. The monitor had previously been evaluated under an earlier ACARP grant. It has
Transcript of MINE REAL TIME DPM AMBIENT MONITORING - GWMT
1
MINE REAL TIME DPM AMBIENT MONITORING
A. D. S. Gillies1 and H. W. Wu2,
1. Union Pacific Rocky Mountains Energy Mining Professor, Missouri University of Science and Technology, Rolla, Missouri 2. Director, Gillies Wu Mining Technology Pty Ltd, Brisbane, Queensland ABSTRACT: A real time Diesel Particulate Matter (DPM) monitor has been developed on the base of the successful NIOSH Personal Dust Monitor (PDM) unit. The objectives of a recently completed Australian Coal Association Research Program (ACARP) study has been to finalize the design of a DPM unit, to undertake comprehensive and internationally recognized laboratory testing to evaluate the new design and to undertake an underground series of tests to establish the robustness and reliability of the new approach. Under the project Thermo Fisher Scientific has undertaken structural changes to the PDM to convert it to a DPM real time monitoring underground instrument, the D-PDM. The Pittsburgh Research Laboratories of the National Institute of Occupational Health and Safety (NIOSH) has undertaken laboratory “calibration or verification” testing. A phase of Australian mine robustness and engineering testing has been undertaken to ensure the instrument can effectively assist mine management to handle this health issue. This paper discusses tests that have been undertaken during Longwall face moves. The paper discusses how the monitors have performed within the underground mine environment in evaluating DPM during the various phases of the face shield moves. They have closely examined the influence of aspects of the mine ventilation system.
INTRODUCTION Mine ventilation is a critical aspect of all underground mines. Mining technological developments and mining environment challenges are necessitating new approaches. This paper in particular examines an area of new development. Diesel Particulate Matter (DPM) issues are very high profile currently in Australian coal mines and Australian states are generally moving to acknowledge and to broadly follow US 2008 final metal/non metal mine regulation limits of 0.2 mg/m3 submicron particulate matter, 0.16 mg/m3 total carbon particulate and 0.1 mg/m3 elemental carbon particulate. The real time DPM monitor has been developed on the base of the successful Personal Dust Monitor (PDM) unit for respirable dust monitoring. The objectives of recently completed Australian Coal Association Research Program (ACARP) study has been to finalise the design of a DPM unit, to undertake comprehensive and internationally recognised laboratory testing to evaluate the new design and to undertake an underground series of tests to establish the robustness and reliability of the new approach. The PDM gives realtime readings and is mounted within the miner’s cap lamp battery and internally measures the true particle mass of dust collected on its filter. Samples are available for later mineralogical analysis and results do not exhibit the same sensitivity to water spray as optically based measurement approaches. The technique achieves microgram-level mass resolution even in the hostile mine environment and reports dust loading data on a continuous basis. The monitor had previously been evaluated under an earlier ACARP grant. It has

2
particular application for determining high dust source locations and efficiency of engineering means of suppression and other approaches to handling the problem. It has been recognised that the PDM’s unique measurement approach has application to allow real time atmospheric Diesel Particulate Matter (DPM) monitoring. The industry has no practical real time atmospheric DPM monitor at present. Under the project Thermo Fisher Scientific has undertaken structural changes to the PDM to convert it to a DPM real time monitoring underground instrument, the D-PDM. The Pittsburgh Research Laboratories of NIOSH (the group that originally contracted for the PDM development) has undertaken laboratory “calibration or verification” testing. A phase of Australian mine robustness and engineering testing has been undertaken to ensure the instrument can effectively assist mine management to handle this health issue. Tests have been undertaken at points of expected high atmospheric DPM such as during Longwall face moves, Development RAM car, Eimco and PJB usages. The project is a story of practical application that has received considerable additional industry financial support, mine site testing and evaluation assistance. The paper discusses how the monitors have performed within the underground mine environment in evaluating DPM during the various phases of the production cycle. They have closely examined the influence of aspects of the mine ventilation system. Results have been compared to alternative industry pollutant measuring approaches. The outcome of the project gives the industry access to an enhanced tool for understanding the atmosphere in the presence of DPM. Real time DPM monitoring allows the industry to pin-point high exposure zones such as those encountered in coal longwall face moves where various vehicles work or in areas of constrained or difficult ventilation. Pinpointing of high DPM concentration zones allows efficient modification of work practices to reduce underground miners’ exposure. Some outcomes of the ACARP project in this area will be discussed. The new development discussed within this paper has been supported by ACARP with substantial input from the United States agency, the National Institute of Occupational Health and Safety (NIOSH). It has received considerable additional industry financial support, mine site testing and evaluation assistance.
DEVELOPMENT OF PERSONAL DUST MONITOR A new PDM for respirable dust developed by the company Rupprecht and Patashnick (now Thermo Fisher Scientific), under a project funded by NIOSH, has generated promising results in underground coal mine testing performed in the US (Volkwein et al, 2004a and 2004b). Results from an ACARP funded study undertaken to evaluate this new realtime dust monitor for personal respirable dust evaluation particularly in engineering studies have been described by Gillies, 2005 and Gillies and Wu, 2006. The instrument has potential to be used as an engineering tool to evaluate the effectiveness of dust control strategies. Being a personal dust monitor, the instrument measures the airborne dust from the breathing zone region and so has many advantages over instruments that measure from a fixed-point location. It can quickly highlight high dust situations and allow the situation to be corrected. The underground workplace has varying respirable dust conditions due to aspects such
3
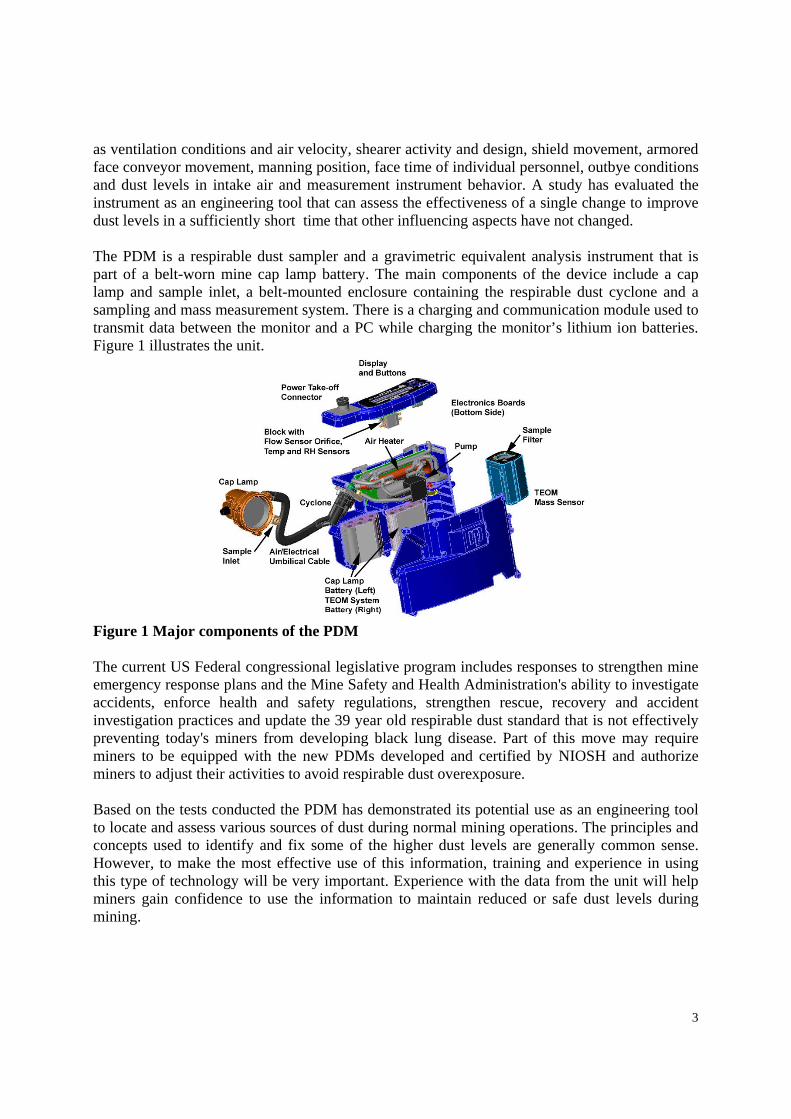
as ventilation conditions and air velocity, shearer activity and design, shield movement, armored face conveyor movement, manning position, face time of individual personnel, outbye conditions and dust levels in intake air and measurement instrument behavior. A study has evaluated the instrument as an engineering tool that can assess the effectiveness of a single change to improve dust levels in a sufficiently short time that other influencing aspects have not changed. The PDM is a respirable dust sampler and a gravimetric equivalent analysis instrument that is part of a belt-worn mine cap lamp battery. The main components of the device include a cap lamp and sample inlet, a belt-mounted enclosure containing the respirable dust cyclone and a sampling and mass measurement system. There is a charging and communication module used to transmit data between the monitor and a PC while charging the monitor’s lithium ion batteries. Figure 1 illustrates the unit.
Figure 1 Major components of the PDM
The current US Federal congressional legislative program includes responses to strengthen mine emergency response plans and the Mine Safety and Health Administration's ability to investigate accidents, enforce health and safety regulations, strengthen rescue, recovery and accident investigation practices and update the 39 year old respirable dust standard that is not effectively preventing today's miners from developing black lung disease. Part of this move may require miners to be equipped with the new PDMs developed and certified by NIOSH and authorize miners to adjust their activities to avoid respirable dust overexposure. Based on the tests conducted the PDM has demonstrated its potential use as an engineering tool to locate and assess various sources of dust during normal mining operations. The principles and concepts used to identify and fix some of the higher dust levels are generally common sense. However, to make the most effective use of this information, training and experience in using this type of technology will be very important. Experience with the data from the unit will help miners gain confidence to use the information to maintain reduced or safe dust levels during mining.

4
DEVELOPMENT OF REAL TIME PERSONAL DIESEL PARTICULATE MONITOR DPM issues are very high profile currently in both Australian coal and metalliferous mines. Mine atmosphere measurements of DPM in Australian mines have only been measured systematically since the mid 2000s. Early atmospheric readings have been taken on a shift average basis using SKC sampling units. The SKC is derived from a US NIOSH design and gives readings in the surrogate Total Carbon (TC) or Elemental Carbon (EC) units after laboratory analysis procedures have been completed. DPM = TC + inorganics = EC + organic carbon (OC) + inorganics TC in mine testing is consistently over 80% of DPM (Volkwein 2006).
Some DPM regulatory guidelines are starting to emerge in Australia and the individual states are generally moving to acknowledge DPM limits of 0.2 mg/m3 submicron particulate matter, 0.16 mg/m3 total carbon particulate and 0.1 mg/m3 elemental carbon particulate. A few prescriptive mining regulations are in force internationally such as those applying to the US metalliferous mining industry from May 2008 based on a DPM limit of 0.16 mg/m3 total carbon particulate. The real time DPM monitor is being developed on the base of the successful PDM unit. A description is given of an underground series of tests undertaken to establish the robustness and reliability of the new approach. Thermo Fisher Scientific has undertaken structural changes to the PDM to convert it to a DPM real time monitoring underground instrument, the D-PDM. The Pennsylvania Pittsburgh Research Laboratories of NIOSH (the group that originally contracted for the PDM development) has undertaken laboratory “calibration or verification” testing. They have an accredited diesel exhaust laboratory and international expertise in this area. The D-PDM directly reports levels of mine atmosphere DPM in mg/m3 from real time readings. It can be placed in the working place or in a mine vehicle and when design is finalized will be able to be worn by a person. Two types of sub-micrometer size-selective inlets were tested initially to effectively reduce the loading on the 0.8 µm cut point impactor collection plates to prevent overloading. The final size of mass to be measured is determined by the 0.8 µm cut point impactor with the cyclone inlets serving to collect the bulk of the mass greater than 1 µm in size, thus extending the loading capacity of the impactor plates. As a potential field instrument, the individual BGI 1-µm sharp-cut cyclone model SCC0.732 at a flow rate of 1.7 lpm in Figure 2 would be the size selective inlet of choice. The D-PDM instrument is currently at a prototype stage and as with all new technologies will need industry acceptance and support to reach its full potential. Figure 2 Schematic of prototype D-PDM Sampling Inlet.
DPM and mine dust are pulled into the BGI Cyclone Inlet.
BOM, 0.8 um impactor BGI cyclone
5
MONITORING OF DIESEL PARTICULATE MATTER
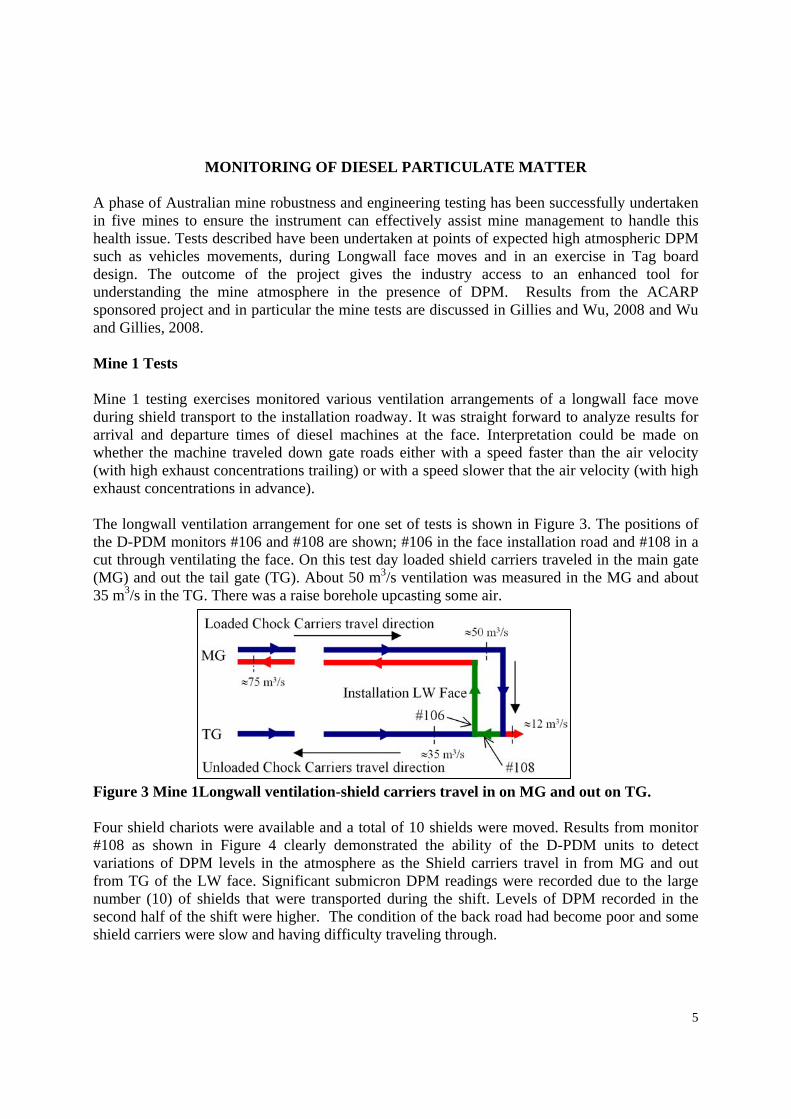
A phase of Australian mine robustness and engineering testing has been successfully undertaken in five mines to ensure the instrument can effectively assist mine management to handle this health issue. Tests described have been undertaken at points of expected high atmospheric DPM such as vehicles movements, during Longwall face moves and in an exercise in Tag board design. The outcome of the project gives the industry access to an enhanced tool for understanding the mine atmosphere in the presence of DPM. Results from the ACARP sponsored project and in particular the mine tests are discussed in Gillies and Wu, 2008 and Wu and Gillies, 2008. Mine 1 Tests Mine 1 testing exercises monitored various ventilation arrangements of a longwall face move during shield transport to the installation roadway. It was straight forward to analyze results for arrival and departure times of diesel machines at the face. Interpretation could be made on whether the machine traveled down gate roads either with a speed faster than the air velocity (with high exhaust concentrations trailing) or with a speed slower that the air velocity (with high exhaust concentrations in advance). The longwall ventilation arrangement for one set of tests is shown in Figure 3. The positions of the D-PDM monitors #106 and #108 are shown; #106 in the face installation road and #108 in a cut through ventilating the face. On this test day loaded shield carriers traveled in the main gate (MG) and out the tail gate (TG). About 50 m3/s ventilation was measured in the MG and about 35 m3/s in the TG. There was a raise borehole upcasting some air.
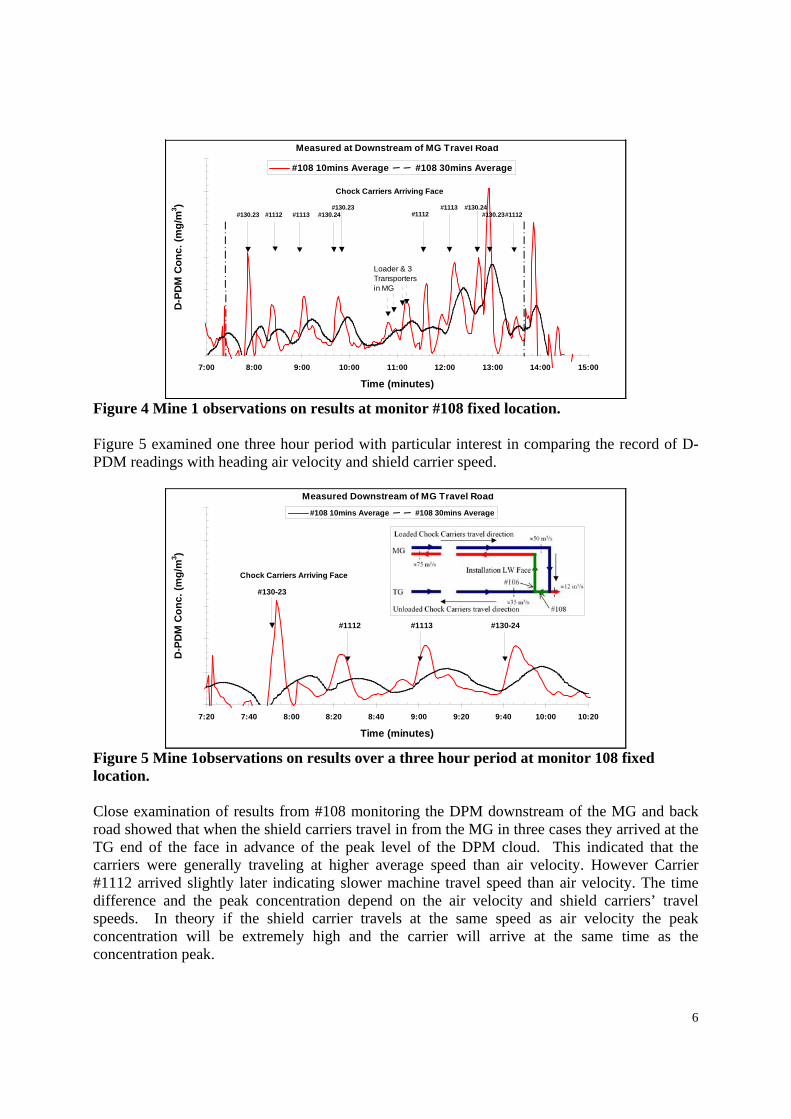
Figure 3 Mine 1Longwall ventilation-shield carriers travel in on MG and out on TG. Four shield chariots were available and a total of 10 shields were moved. Results from monitor #108 as shown in Figure 4 clearly demonstrated the ability of the D-PDM units to detect variations of DPM levels in the atmosphere as the Shield carriers travel in from MG and out from TG of the LW face. Significant submicron DPM readings were recorded due to the large number (10) of shields that were transported during the shift. Levels of DPM recorded in the second half of the shift were higher. The condition of the back road had become poor and some shield carriers were slow and having difficulty traveling through.
6
y yMeasured at Downstream of MG Travel Road
0
0.5
1
1.5
2
2.5
3
7:00 8:00 9:00 10:00 11:00 12:00 13:00 14:00 15:00
Time (minutes)
D-P
DM
Co
nc
. (m
g/m
3)
#108 10mins Average #108 30mins Average
Chock Carriers Arriving Face
Loader & 3 Transportersin MG
#130.23 #1112 #1113#130.23
#1112#1113
#130.24#130.24
#1112#130.23
#108 D-PDM = 0.457 mg/m3
Figure 4 Mine 1 observations on results at monitor #108 fixed location. Figure 5 examined one three hour period with particular interest in comparing the record of D-PDM readings with heading air velocity and shield carrier speed. y y
Measured Downstream of MG Travel Road
0
0.5
1
1.5
2
2.5
3
7:20 7:40 8:00 8:20 8:40 9:00 9:20 9:40 10:00 10:20
Time (minutes)
D-P
DM
Co
nc
. (m
g/m
3)
#108 10mins Average #108 30mins Average
Chock Carriers Arriving Face
#130-23
#1112 #1113 #130-24
#108 D-PDM = 0.457 mg/m3
y yMeasured Downstream of MG Travel Road
0
0.5
1
1.5
2
2.5
3
7:20 7:40 8:00 8:20 8:40 9:00 9:20 9:40 10:00 10:20
Time (minutes)
D-P
DM
Co
nc
. (m
g/m
3)
#108 10mins Average #108 30mins Average
Chock Carriers Arriving Face
#130-23
#1112 #1113 #130-24
#108 D-PDM = 0.457 mg/m3
y yMeasured Downstream of MG Travel Road
0
0.5
1
1.5
2
2.5
3
7:20 7:40 8:00 8:20 8:40 9:00 9:20 9:40 10:00 10:20
Time (minutes)
D-P
DM
Co
nc
. (m
g/m
3)
#108 10mins Average #108 30mins Average
Chock Carriers Arriving Face
#130-23
#1112 #1113 #130-24
#108 D-PDM = 0.457 mg/m3
y yMeasured Downstream of MG Travel Road
0
0.5
1
1.5
2
2.5
3
7:20 7:40 8:00 8:20 8:40 9:00 9:20 9:40 10:00 10:20
Time (minutes)
D-P
DM
Co
nc
. (m
g/m
3)
#108 10mins Average #108 30mins Average
Chock Carriers Arriving Face
#130-23
#1112 #1113 #130-24
#108 D-PDM = 0.457 mg/m3
Figure 5 Mine 1observations on results over a three hour period at monitor 108 fixed location. Close examination of results from #108 monitoring the DPM downstream of the MG and back road showed that when the shield carriers travel in from the MG in three cases they arrived at the TG end of the face in advance of the peak level of the DPM cloud. This indicated that the carriers were generally traveling at higher average speed than air velocity. However Carrier #1112 arrived slightly later indicating slower machine travel speed than air velocity. The time difference and the peak concentration depend on the air velocity and shield carriers’ travel speeds. In theory if the shield carrier travels at the same speed as air velocity the peak concentration will be extremely high and the carrier will arrive at the same time as the concentration peak.

7
Mine 2 Tests Mine 2 exercises monitored various ventilation arrangements of longwall face move during shield transport to the installation roadway. Figure 6 shows Longwall ventilation arrangement for tests and the positions of the D-PDM monitors #106 and #110 during test periods. On this test day loaded shield carriers traveled in and out through the TG. About 28 m3/s ventilation was measured in the MG and about 39 m3/s in the TG. There was a raise borehole downcasting about 11 m3/s. Three shield carriers were available and a total of four shield chocks were moved.
Figure 6 Longwall face ventilation for Mine 2 - shield carriers travel in and out on TG. Readings were taken from a fixed location for monitoring of shield movements in the face area and nearby (D-PDM monitor #110) and for monitoring all air that had passed through the longwall panel (D-PDM monitor #106). Results were analyzed to identify sources and levels of DPM within the panel by strategically placing the real time DPM monitors within the longwall panel as shown in Table 1. The DPM sources (g/s) in the table are calculated by knowing the air quantity (m3/s) and the DPM concentration (g/m3) at various locations within the panel ventilation circuit. There were significant DPM levels in MG Heading D due to outbye traffic and in particular the passage of shield carriers in the Mains’ intake air stream as they passed to the panel TG. There were also significant DPM levels added along the Longwall face due to the installation activities of shields by “shunting mules” or LHDs. The largest source was from shield carriers that carried individual shields along the length of the TG to reach the face. Table 1 Sources of DPM identified in the installation LW panel.
Location Sources g/s
% Comments
MG C & D Hdgs 3.03 18.6 Mains air at MG entrance Borehole 0.00 0.0 back of LW panel, fresh air LW Face 4.77 29.2 Shunting Mule or LHDs TG D Hdg 6.96 42.6 Shield carriers travel way TG C Hdg 0.00 0.0 No diesel activity Leakages 1.57 9.6 Mains air; coffin seal and double doors
Measured Total 16.32 100.0 As discussed by Dabill (2005) exposure of drivers of diesel vehicle to DPM can be limited by the direction of travel and the ventilation system. For vehicles traveling against the ventilation the

8
driver should always try to ensure the engine is trailing. Under these conditions driver exposure to DPM will be low if there are no other vehicles inbye. However, traveling against the ventilation flow with the engine forward can lead to very high driver exposure and where possible this should be avoided or at the very least reduced to as short a time as possible. It is more difficult to minimize exposure when traveling with the airflow as no matter what speed the vehicle travels the driver is likely to be exposed. It is important for the vehicle not to travel at the same speed as the ventilation air velocity as the vehicle driver will be operating in an ever increasing concentration of diesel exhaust emissions and consequently exposure could be very high. If the vehicle is likely to be traveling faster than the ventilation airflow, have the engine trailing; and if the vehicle is slower than the ventilation have it orientated with the engine forward of the driver. By observing these rules exposure to DPM will be kept to a minimum but will not be eliminated altogether. Table 2 demonstrates vehicle speed and ventilation air velocity over a single travel route, Mine 3 TG Heading D, for face shield delivery. Points that can be established from this data are: In these specific tests shield carriers travel at higher average speed than air velocity. However on poor roads there could be slower machine travel speed than air velocity. The time difference and the peak concentration will depend on the air route, whether the air
is traveling with or against the carrier direction, the air velocity as a function of the air quantity and shield carriers’ travel speeds.
In theory if the shield carrier travels with the air at the same speed as air velocity the peak concentration around the vehicle could be extremely high.
Table 2 Data on shield chock carriers’ vehicle speeds and heading air velocities.
A possible reduction in DPM driver exposure could have been achieved by consideration of the following. TG travel route panel air quantity could be increased. Alternatively TG air could be re-routed, for instance air panel up D Heading and return down
C Heading. Increase in air velocity may result in air velocity and vehicle speed being very similar. This is
to be avoided if vehicle travels with air as would have happened if vehicles came into the panel up D Heading.
Time Location In/Out Distance m
Time mins Speed, m/s
Air Vel m/s Air Travel Time mins
9:53 TG26 2ct In 3,400 34 1.66 1.29 43.910:27 Face
10:31 Face Out 3,400 26 2.18 1.29 43.910:57 TG26 2ct
10:12 TG26 2ct In 3,250 28 1.93 1.29 41.910:04 TG26 36ct
10:05 TG26 36ct Out 3,250 17 3.18 1.29 41.911:07 TG26 2ct
Chock Carrier APS 1306
Machine/Air Rel Velocity, m/s = 1.89
Machine/Air Rel Velocity, m/s = 3.22
Machine/Air Rel Velocity, m/s = 0.89
Machine/Air Rel Velocity, m/s = 2.95
Chock Carrier CC 1112
Machine Against Air
Machine With Air
Machine Against Air
Machine With Air
9
Best if vehicle travels against airflow direction. Best conditions would be achieved if air came into panel up D Heading and returned
clockwise down C Heading and traffic was in the opposite and drove up C and counter clockwise down D Headings. In this configuration vehicles would always travel against air. If the vehicle exhaust outlet trails the driver then it will pass away from the driver in both directions of travel.
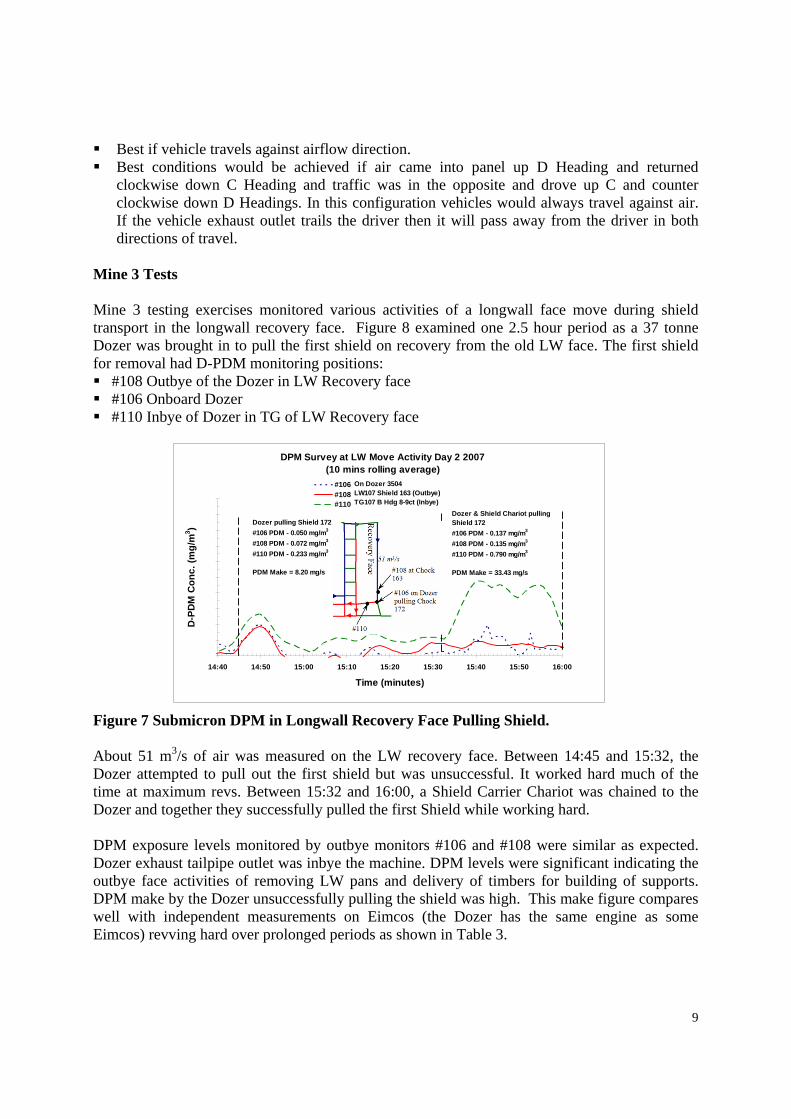
Mine 3 Tests Mine 3 testing exercises monitored various activities of a longwall face move during shield transport in the longwall recovery face. Figure 8 examined one 2.5 hour period as a 37 tonne Dozer was brought in to pull the first shield on recovery from the old LW face. The first shield for removal had D-PDM monitoring positions: #108 Outbye of the Dozer in LW Recovery face #106 Onboard Dozer #110 Inbye of Dozer in TG of LW Recovery face Figure 7 Submicron DPM in Longwall Recovery Face Pulling Shield. About 51 m3/s of air was measured on the LW recovery face. Between 14:45 and 15:32, the Dozer attempted to pull out the first shield but was unsuccessful. It worked hard much of the time at maximum revs. Between 15:32 and 16:00, a Shield Carrier Chariot was chained to the Dozer and together they successfully pulled the first Shield while working hard. DPM exposure levels monitored by outbye monitors #106 and #108 were similar as expected. Dozer exhaust tailpipe outlet was inbye the machine. DPM levels were significant indicating the outbye face activities of removing LW pans and delivery of timbers for building of supports. DPM make by the Dozer unsuccessfully pulling the shield was high. This make figure compares well with independent measurements on Eimcos (the Dozer has the same engine as some Eimcos) revving hard over prolonged periods as shown in Table 3.
DPM Survey at LW Move Activity Day 2 2007 (10 mins rolling average)
0
0.2
0.4
0.6
0.8
1
1.2
1.4
1.6
1.8
2
14:40 14:50 15:00 15:10 15:20 15:30 15:40 15:50 16:00
Time (minutes)
D-P
DM
Co
nc
. (m
g/m
3)
#106#108#110
On Dozer 3504LW107 Shield 163 (Outbye)TG107 B Hdg 8-9ct (Inbye)
Dozer pulling Shield 172
#106 PDM - 0.050 mg/m3
#108 PDM - 0.072 mg/m3
#110 PDM - 0.233 mg/m3
PDM Make = 8.20 mg/s
Dozer & Shield Chariot pulling Shield 172
#106 PDM - 0.137 mg/m3
#108 PDM - 0.135 mg/m3
#110 PDM - 0.790 mg/m3
PDM Make = 33.43 mg/s

10
DPM make inbye the Shield Carrier Chariot chained to the Dozer was four times that of the Dozer alone as they together successfully pulled the Shield. Both worked at maximum revs and so a high make is to be expected. This DPM make emphasizes that men should not be positioned inbye (downstream) of large machinery working very hard for even short periods. Mine 4 Tests Mine 4 testing exercises monitored various activities of a longwall face move during shield transport along the longwall recovery face. Figure 8 examines the panel situation when the shields were being carried to the MG end of the Longwall by carriers and then taken along the face by the same carriers to the TG end where installation was occurring. A Dozer drove to the TG as soon as a new Shield had been delivered and spent time positioning to the exact location. Monitoring positions were: #106 at the TG with the installation crew and inbye the Dozer #110 at the MG end of the face and outbye the Dozer #108 in MG belt heading outbye face
Figure 8 Longwall face ventilation on Mine 4 – Chock Shield carriers travel in and out on right hand MG, belt on left hand. Figure 9 Submicron DPM in Mine 4 Longwall Installation Face outbye and inbye the face working dozer
#108
Installation LW Face
MG
TG
50 m3/s
30 m3/s
20 m3/s #110
Loaded & Unloaded Chock Carriers travel direction
#106
DPM Survey of LW Move 09/07/08 (10 mins rolling average)
0
0.2
0.4
0.6
0.8
1
12:30 13:00 13:30 14:00 14:30 15:00 15:30 16:00 16:30 17:00
Time (minutes)
D-P
DM
Co
nc.
(m
g/m
3 )
#110 at LW MG end #108 at LW TG inbye installation
Showing when Dozer working inbye of MG monitoring point
Time TG MG Difference Dozer DPM Comments
mg/m3 mg/m3 mg/m3 mg/s 12:35-13:08 0.179 0.074 0.105 5.24 Full cycle 13:40-14:02 0.132 0.034 0.098 4.89 Full cycle 14:34-15:13 0.181 0.086 0.095 4.78 Full cycle 16:45-17:00 0.219 0.059 0.160 8.01 Half cycle
Monitors left face

11
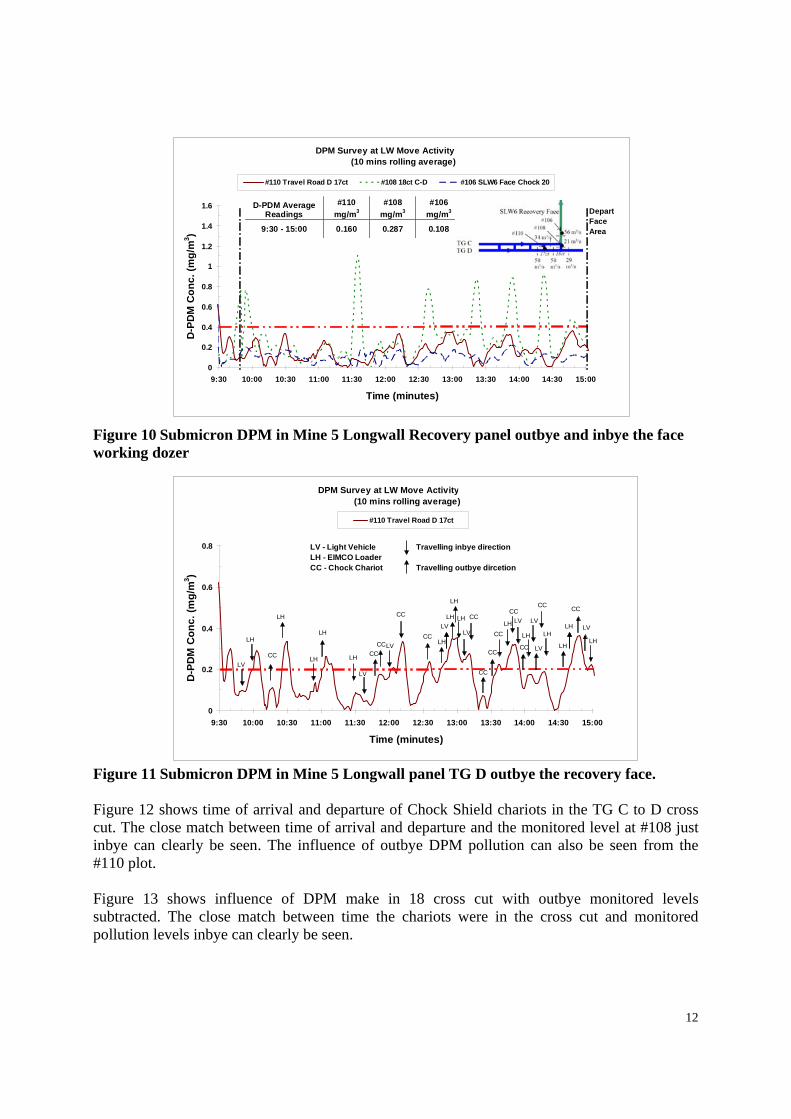
The DPM plots in figure 9 show variability during this afternoon period with the Dozer working as four shields were installed. The difference between LW MG and TG plots clearly shows contribution of Dozer working on face. DPM make values account for DPM monitored value in air mg/m3) and air quantity diluting the exhaust (m3/s). These values (mg/s) give a value that can be compared for different equipment under varying ventilation and other mine conditions. Some outbye movement activity of chariots and light vehicles was also reflected in MG and TG DPM plots. It should be noted that some time periods when the Dozer was not at the face often gave high TG DPM readings due to light venicles or Chariots being on the face. DPM makes were reasonably consistent across the range 4 to 8 mg/s. The highest make occurred during the shortest Dozer period at the TG when the Dozer worked intensively to complete tts task. DPM make varies with time on the face; short installation times means work effort was intense. The results show variability across the morning and afternoon installation periods. DPM make also varies with the effort required to complete the job; some chocks needed greater effort to position correctly depending on where the chock had been placed and ground conditions. Mine 4 is a Longwall “Punch Mine”. As such it has no Mains and there was no DPM interference from surface activities, Mains or other panels. Over three test days the DPM concentration levels monitored at the Longwall TG end varied due to ventilation levels and the various activities (particularly Shield transporting chariots and the Dozer working) in the ventilation circuit outbye this point. However the relative percentage of DPM levels measured at the LW MG end was consistent across all days at 62 percent of that at the TG end; that is 38 percent of DPM emitted on LW face and 62 percent from outbye activities. Mine 5 Tests Mine 5 testing exercises monitored activities of a longwall face move during shield transport from the longwall recovery face. Figure 10 examines the panel situation when the shields were being carried off the face to the MG by an electric tractor transporter. They were then picked up in MG C to D 18 cross cut and carried by diesel shield carriers inbye to the adjacent Longwall face where installation was occurring. TG C Heading carried the belt while all transport outbye occurred in Heading D. Monitors were placed with #106 at the Longwall face with the installation crew at the point of Shield recovery #108 in MG C to D 18 cross cut just inbye the point where diesel carriers loaded Shields #110 on the Longwall face with the recovery crew.
The air quantity of 56 m3/s on the face consisted of about 22 m3/s in 18 cross cut that was polluted by DPM from the carriers loading shields at that point and 34 m3/s intake air delivered by the belt Heading that was effectively clean and gave effective dilution to the contaminants entering the face. Figure 10 shows the recovery face, monitor location and DPM measurements across a 5.5 hour period as seven shields were moved inbye from the face. Average DPM monitored levels are also shown. Figure 11 shows outbye activity in TG D heading and monitored DPM levels at 17 cut through. A close match between a Chock or Shield Carrier, an EIMCO Loader or a Personnel light vehicle passing the monitoring point and an increase in DPM level in the airway is clearly seen.
12
Figure 10 Submicron DPM in Mine 5 Longwall Recovery panel outbye and inbye the face working dozer Figure 11 Submicron DPM in Mine 5 Longwall panel TG D outbye the recovery face. Figure 12 shows time of arrival and departure of Chock Shield chariots in the TG C to D cross cut. The close match between time of arrival and departure and the monitored level at #108 just inbye can clearly be seen. The influence of outbye DPM pollution can also be seen from the #110 plot. Figure 13 shows influence of DPM make in 18 cross cut with outbye monitored levels subtracted. The close match between time the chariots were in the cross cut and monitored pollution levels inbye can clearly be seen.
DPM Survey at LW Move Activity 29/08/08 (10 mins rolling average)
0
0.2
0.4
0.6
0.8
1
1.2
1.4
1.6
9:30 10:00 10:30 11:00 11:30 12:00 12:30 13:00 13:30 14:00 14:30 15:00
Time (minutes)
D-P
DM
Co
nc
. (m
g/m
3)
#110 Travel Road D 17ct #108 18ct C-D #106 SLW6 Face Chock 20
Depart Face Area
#110 #108 #106 D-PDM Average Readings mg/m3 mg/m3 mg/m3
9:30 - 15:00 0.160 0.287 0.108
DPM Survey at LW Move Activity 29/08/08 (10 mins rolling average)
0
0.2
0.4
0.6
0.8
9:30 10:00 10:30 11:00 11:30 12:00 12:30 13:00 13:30 14:00 14:30 15:00
Time (minutes)
D-P
DM
Co
nc
. (m
g/m
3)
#110 Travel Road D 17ct
LV
LH
CC
LH
CC
LH
LH
LH
LH
LV
LV
LH
CC
CC
CC
CC
LVLV
LH
LH
CC
CC
CC
LH
CC
CC
LV
LH
LV
LV
CCCC
LH
LH
LH LV
LH
Travelling inbye direction
Travelling outbye dircetion
LV - Light VehicleLH - EIMCO LoaderCC - Chock Chariot

13
Figure 12 Submicron DPM in Mine 5 Longwall Installation Face outbye and inbye the face working dozer
Figure 13 Submicron DPM in Mine 5 Longwall Installation Face outbye and inbye the face working dozer
CONCLUSIONS
A project on diesel particulate matter real time monitoring development supported by ACARP grants in recent years has been discussed. The project received substantial NIOSH support and is an example of practical application that has received considerable additional industry financial support, mine site testing and evaluation assistance. The paper has discussed how the monitor has performed within the underground mine environment in evaluations of the various phases of longwall structure moves. It has closely examined the influence of aspects of the mine
DPM Survey at LW Move Activity 29/08/08 (10 mins rolling average)
0
0.2
0.4
0.6
0.8
1
1.2
1.4
9:30 10:00 10:30 11:00 11:30 12:00 12:30 13:00 13:30 14:00 14:30 15:00
Time (minutes)
D-P
DM
Co
nc
. (m
g/m
3)
#108 at 18ct C-D outbye SLW6 Face #110 Travel Road D 17ct
CC 1307
CC 1325
CC 1307
CC 1307
CC 1307
CC 1307
CC 1307
CC 1307
Chock Chariot arrived at 18ct C-D Chock Chariot loaded chock & departed
DPM Survey at LW Move Activity 29/08/08 (10 mins rolling average)
0
0.2
0.4
0.6
0.8
1
1.2
1.4
9:30 10:00 10:30 11:00 11:30 12:00 12:30 13:00 13:30 14:00 14:30 15:00
Time (minutes)
D-P
DM
Co
nc
. (m
g/m
3)
CC 1307
CC 1325
CC 1307
CC 1307
CC 1307
CC 1307
CC 1307
showing Chock Chariot arrived, loaded chock and departed at 18ct C-D outbye of the SLW6 face
Difference in DPM readings between #108 and #110
14
ventilation system. The monitor is demonstrating the potential to improve understanding of the mine environment and to empower and educate operators in the control of their environment.
ACKNOWLEDGEMENTS The authors acknowledge the support of ACARP and NIOSH in supporting initial projects that form the basis of this paper. They extend thanks to the various mine site managers, engineers and ventilation officers who supported the projects and the evaluation efforts undertaken across a diversity of mine conditions. Their efforts ensured that the principal aims of the project were accomplished and a significant contribution made to future mine health and safety.
REFERENCES Dabill, D. W., 2005. Controlling and monitoring exposure to diesel engine exhaust emissions in
coal mines, Report HSL/2005/55, Health and Safety Laboratory, Buxton, England Gillies, A. D. S., 2005. Evaluation of a new real time personal dust meter for engineering studies
on mine faces. ACARP Grant C14010 Report, Sept 2005. Gillies, A.D.S and Wu, H.W. 2006. Evaluation of a new real time personal dust monitor for
engineering studies. Proceedings of the 11th U.S./North American Mine Ventilation Symposium 2006, pp 29-34 (Taylor and Francis Group plc.)
Gillies, A.D.S and Wu, H.W. 2008. Evaluation of a first mine real time diesel particulate matter (DPM) monitor, Australian Coal Association Research Program Grant C15028, Final Report, April.
Volkwein, J.C., 2005. Personal communication. Volkwein, J.C., 2006. Technology Transfer Workshop - Better Use of Diesels Underground,
Mackay 22 September and Belmont 26 September 2006. Volkwein, J.C., Thimons, E., Yanak, C., Dunham, D., Patashnick, H. and Rupprecht, E. 2004a.
Implementing a new personal dust monitor as an engineering tool, Proc 10th US Mine Vent Symp, Balkeima.
Volkwein, J.C., Vinson, R.P., McWilliams, L.J., Tuchman, D.P. and Mischler, S.E, 2004b. Performance of a new personal respirable dust monitor for mine use, RI 9663, NIOSH, Pittsburgh.
Wu, H.W. and Gillies, A.D.S. 2008. Developments in real time personal diesel particulate monitoring in mines, Proceedings, 12th US Mine Ventilation Symposium, June, pp.629-636.