Milwaukee Parental Choice Program: Descriptive … · The School Choice Demonstration Project...
32
Michael Q. McShane University of Arkansas Brian Kisida University of Arkansas Laura I. Jensen University of Arkansas Patrick J. Wolf University of Arkansas SCDP Milwaukee Evaluation Report #33 February 2012 Milwaukee Parental Choice Program: Descriptive Report on Participating Schools 2010–11
Transcript of Milwaukee Parental Choice Program: Descriptive … · The School Choice Demonstration Project...

Michael Q. McShane University of Arkansas
Brian Kisida University of Arkansas
Laura I. Jensen University of Arkansas
Patrick J. Wolf University of Arkansas
SCDP Milwaukee Evaluation Report #33
February 2012
Milwaukee Parental Choice Program: Descriptive Report on Participating Schools
2010–11
The University of Arkansas was founded in 1871 as the flagship institution of higher education for the state of Arkansas. Established as a
land grant university, its mandate was threefold: to teach students, conduct research, and perform service and outreach.
The College of Education and Health Professions established the Department of Education Reform in 2005. The department’s mission is to advance education and economic development by focusing on the improvement of academic achievement in elementary and secondary schools. It conducts research and demonstration projects in five primary areas of reform: teacher quality, leadership, policy, accountability, and school choice.
The School Choice Demonstration Project (SCDP), based within the Department of Education Reform, is an education research center devoted to the non-partisan study of the effects of school choice policy and is staffed by leading school choice researchers and scholars. Led by Dr. Patrick J. Wolf, Professor of Education Reform and Endowed 21st Century Chair in School Choice, SCDP’s national team of researchers, institutional research partners and staff are devoted to the rigorous evaluation of school choice programs and other school improvement efforts across the country. The SCDP is committed to raising and advancing the public’s understanding of the strengths and limitations of school choice policies and programs by conducting comprehensive research on what happens to students, families, schools and communities when more parents are allowed to choose their child’s school.

Milwaukee Parental Choice Program: Descriptive Report on Participating Schools
2010–11
Michael Q. McShane University of Arkansas
Brian Kisida University of Arkansas
Laura I. Jensen University of Arkansas
Patrick J. Wolf University of Arkansas
SCDP Milwaukee Evaluation Report #33 February 2012
School Choice Demonstration Project Department of Education Reform
University of Arkansas 201 Graduate Education Building
Fayetteville, AR 72701
479-575-6345
http://www.uark.edu/ua/der/SCDP/Research.html

Milwaukee Parental Choice Program: Descriptive Report on Participating Schools
i
EXECUTIVE SUMMARYThis report is the fifth in a series of annual reports produced by the School Choice Demonstration Project (SCDP) that will provide descriptive information about the schools participating in the Milwaukee Parental Choice Program (MPCP).
MPCP Participating Schools – Basic CharacteristicsA total of 107 schools participated in the MPCP for the entire 2010-11 academic year, with 20,996 students enrolled in private schools using MPCP vouchers. Generally speaking, MPCP students made up a large part of participating schools’ total enrollment—the average school-level percentage of MPCP students in these schools was 83 percent. Seventy-three percent of participating schools had student enrollments that were greater than 80 percent MPCP students, while 58 percent had MPCP enrollment percentages above 90 percent. Collectively, private schools participating in the MPCP in 2010-11 offered the full range of grade options, from Kindergarten to 12th grade. Eighty-nine percent of schools served elementary students, while 79 percent served middle school students. Twenty-five percent offered high school.
The average per pupil cost at participating schools in 2008-09, the most recent year for which data were available, was $7,692, while the maximum scholarship amount that year was $6,607. Eighty-two percent of the schools reported per-pupil operating costs higher than the maximum scholarship amount.1 For the 2010-2011 school year, the maximum scholarship amount was lowered to $6,442. When adjusted for inflation, this amounts to the lowest maximum scholarship amount since the 1997-98 school year.
MPCP Participating Schools – Religious StatusParticipants include schools representing at least 10 distinct religious affiliations, non-religious schools that follow a religious tradition, and purely secular schools. Eighty-six percent of the schools identified themselves as religious, seven percent were classified as non-religious with a religious tradition, and eight percent of the participating schools identified themselves as non-religious.
MPCP Participating Schools – Programs OfferedPrivate schools participating in the MPCP offer an array of programs typically found in traditional public schools. High percentages of schools offer art programs (74%), music programs (76%), programs for students with learning problems (72%), or afterschool programs (65%). Over half of the schools incorporate AP classes, student government, programs with special instructional approaches, summer
1 Under the Wisconsin Code that authorized the program through academic year 2010-11, an MPCP voucher must be accepted as full tuition at a participating private school, even if tuition exceeds the voucher amount.

Milwaukee Parental Choice Program: Descriptive Report on Participating Schools
ii
school, and foreign language programs. Fewer schools offer before school programs, special programs for advanced learners, gifted and talented programs, and programs for non-English speakers.
MPCP Participating Schools – Accountability TestingWith the passage of the 2005 Wisconsin Act 125, private schools participating in the MPCP were required annually to administer a nationally normed standardized test or the Wisconsin Knowledge and Concepts Examinations (WKCE) in reading, mathematics, and science to their MPCP students enrolled in the 4th, 8th, and 10th grades. The law further directs MPCP schools to submit copies of the scores from those tests to the SCDP. For the 2010-2011 school year, all schools were required to give the WKCE to all voucher students and submit those scores to the Wisconsin Department of Public Instruction (DPI). DPI then sent the students’ scores from 102 schools to the SCDP for analysis. Five MPCP schools were not required to test their students as they did not have any students in grades 4, 8, or 10.
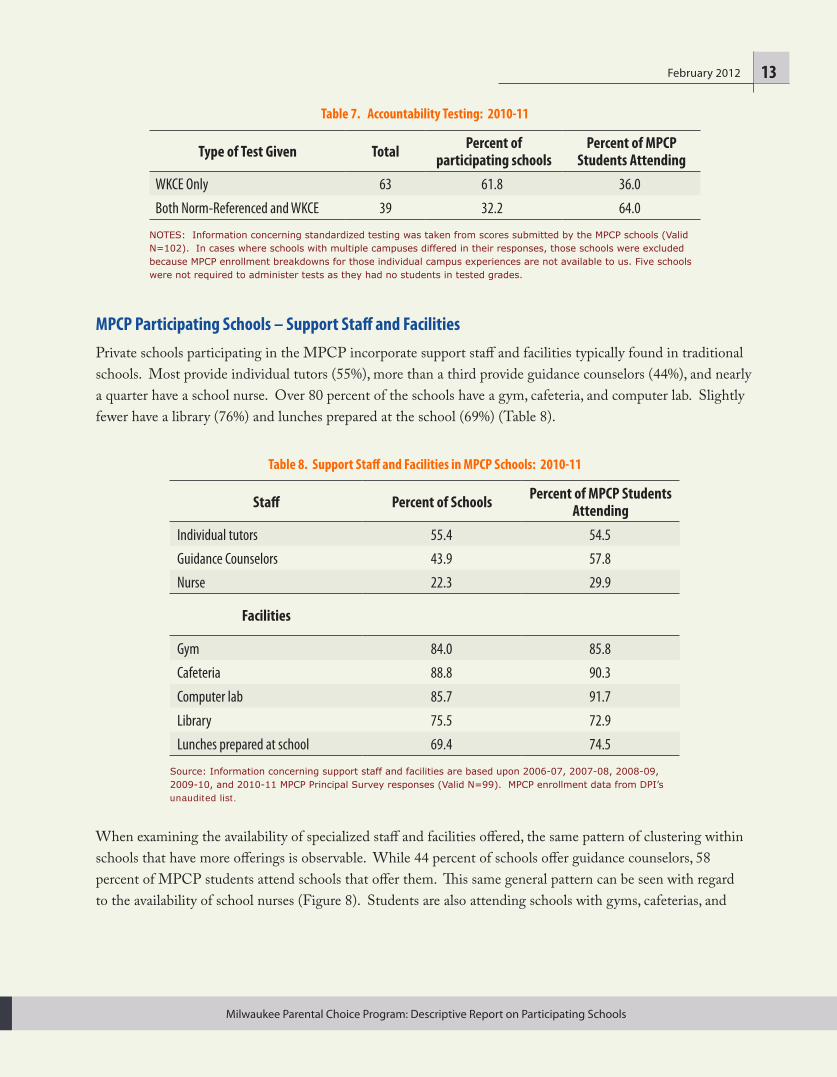
MPCP Participating Schools – Support Staff and FacilitiesPrivate schools participating in the MPCP incorporate support staff and facilities typically found in traditional schools. Most provide individual tutors (56%), more than a third provide guidance counselors (44%), and nearly a quarter (22%) have a school nurse. Over 80 percent of the schools have a gym (84%), cafeteria (89%), and computer lab (86%). Slightly fewer have a library (76%) and lunches prepared at the school (69%).
MPCP and MPS Schools Compared—Racial/Ethnic Enrollment Both MPCP and MPS schools enroll a high percentage of minorities. However, the MPCP schools exhibit slightly lower school-level percentages of minorities—an average of 81 percent compared to 86 percent in MPS in 2010-11. On the whole, this five percent difference is not statistically significant.
MPCP and MPS Schools Compared— Teacher Qualifications and School Size Compared to MPS reported data in 2010-2011, the teachers at MPCP schools exhibit different attributes when it comes to measurable teacher characteristics. On average, 34 percent of the teachers at MPS schools have a master’s degree, while only 28 percent of the teachers at MPCP schools that responded to the SCDP survey do. Ninety-four percent of MPS teachers are certified by the State of Wisconsin, compared to 68 percent of the teachers at MPCP schools. Lastly, 78 percent of the teachers at MPS schools have at least five years of teaching experience while 66 percent of MPCP teachers have this same characteristic.
Compared to MPS schools, MPCP schools are smaller and have a lower average student-teacher ratio. The average school participating in the MPCP has 266 students, while the average MPS school (in

Milwaukee Parental Choice Program: Descriptive Report on Participating Schools
iii
2009-2010) has nearly twice that amount. The average student-teacher ratio in MPCP schools is 15.8, compared to 16.3 in MPS schools (in 2009-2010).
Creative DestructionIn a series of preliminary analyses, evidence suggests that during the time of the SCDP evaluation lower performing schools closed in both the private and public sector in Milwaukee.
AcknowledgmentsThis report and its companion reports are the fifth and final set in a series of annual reports on the Milwaukee Parental Choice Program (MPCP) conducted by the School Choice Demonstration Project according to Wisconsin state law. This research project has been funded by a diverse set of philanthropies including the Annie E. Casey, Joyce, Kern Family, Robertson, and Walton Family foundations. We thank them for their generous support and acknowledge that the actual content of this report is solely the responsibility of the authors and does not necessarily reflect any official positions of the various funding organizations or the University of Arkansas. We would also like to thank Rick Hess, Laura Hamilton, and the participants at the SCDP Research Advisory Board meetings in Fayetteville, Arkansas in November of 2011 who reviewed drafts of this report.
Milwaukee Parental Choice Program: Descriptive Report on Participating Schools
February 2012 1
Milwaukee Parental Choice Program: Descriptive Report on Participating Schools
This report is the fifth in a series of annual reports produced by the School Choice Demonstration Project (SCDP) providing descriptive information about the schools participating in the Milwaukee Parental Choice Program (MPCP). Following a brief history of the MPCP, this year’s report contains descriptive statistics about schools participating in the MPCP and provides comparisons to Milwaukee Public Schools (MPS) when possible.
Overview of School Choice in MilwaukeeFamilies in Milwaukee have an array of government-funded educational options. In addition to being able to choose any traditional school within MPS, families can also choose from the following educational options regardless of where they live in Milwaukee:1
• MPS Specialty Schools
• Contracted Agency Schools
• Partnership Schools
• MPS Small High Schools
• Charter Schools
• MPS Instrumentality Charter Schools (MPS employs staff )
• MPS Non-Instrumentality Charter Schools (staff non-MPS employees)
• Charter Schools Authorized by the University of Wisconsin – Milwaukee
• Charter Schools Authorized by the City of Milwaukee Common Council
• Chapter 220 Program
• Statewide Inter-district Open Enrollment
• Milwaukee Parental Choice Program
Milwaukee Parental Choice ProgramThe Milwaukee Parental Choice Program is the nation’s oldest and largest urban school voucher program. The vouchers it provides enable low-income students in the City of Milwaukee to attend any participating private school in the state of Wisconsin. Having started in 1990 with seven nonsectarian schools enrolling 341
1 For more detail about these choice options, please visit the Milwaukee Public Schools website, at http://mpsportal.milwaukee.k12.wi.us/portal/server.pt/comm/schools/315/school_types/38281

Milwaukee Parental Choice Program: Descriptive Report on Participating Schools
February 20122
students, it has grown to include 107 schools—both religious and non-religious—and enrolled 20,996 students during the 2010-11 academic year.
To be eligible for the program in 1990, families were required to live in Milwaukee and have a household income equal to 175 percent of the poverty line or lower. In addition to the family’s residency and income qualifications, a student’s grade and enrollment status the previous school year had to meet at least one of the following criteria:
1. the child was enrolled in MPS;
2. the child was enrolled in the MPCP the previous year;
3. the child was enrolled in kindergarten through grade 3 in a non-MPCP participating private school; or
4. the child was not enrolled in any school.
The prior-year enrollment qualifications were eliminated via the 2005 WI Act 125. Act 125 also modified the income guidelines. While the 175 percent benchmark was maintained for entry into the program, a household’s income could subsequently rise as high as 220 percent of the poverty line without children in the household becoming ineligible for the program. The family income ceiling to qualify for the program was raised to 300 percent of the poverty line in 2011.
Initially the MPCP was capped at one percent (900 students) of the total Milwaukee Public Schools enrollment (approximately 90,000 students at that time), with the additional limit that no more than 49 percent of an individual school’s students can be eligible for the MPCP. The cap was raised to a 1.5 percent/65 percent limit (WI Act 16) in 1993 and to a 15 percent/no limit in 1995 (WI Act 27). Act 27 also made religious schools eligible for participation in the MPCP, although that eligibility was delayed while the constitutional questions surrounding religious-school participation were being determined by the courts.
The MPCP’s first major enrollment surge occurred during the 1998-99 school year following the Wisconsin Supreme Court’s ruling that religious schools could participate in the program. Close to 6,000 students attended one of 83 schools participating in the MPCP during the 1998-99 academic year—a 400% increase from the preceding year. Over the next seven years, enrollment in the MPCP steadily increased until a predetermined cap of 16,500 students was reached in 2005. In March of 2006, Governor Jim Doyle signed SB 618 which lifted the cap to 22,500. The enrollment cap was eliminated in 2011.
During the 2010-11 school year 107 private schools participated in the MPCP, with 20,996 students enrolled in the schools using MPCP vouchers. Figure 1 shows the number of students enrolled and the number of schools participating in the MPCP since its establishment in 1990.2
2 For Figure 1, the available historical data from DPI includes the total number of MPCP schools that participated in each year, which 1) includes schools that closed during the academic year and 2) counts some schools with multiple campuses as single schools. Throughout the remainder of this report, however, we only include information on schools that remain open for the full academic year, and we break down schools into individual campuses when possible. For this reason the total number of schools described elsewhere in this report do not perfectly match the total number of schools listed in Figure 1.

Milwaukee Parental Choice Program: Descriptive Report on Participating Schools
February 2012 3
Figure 1: Historical MPCP Schools and Student Enrollment
0
10
20
30
40
50
60
70
80
90
100
110
120
130
140
-
2,500
5,000
7,500
10,000
12,500
15,000
17,500
20,000
22,500
1991
-92
1993
-94
1995
-96
1997
-98
1999
-00
2001
-02
2003
-04
2005
-06
2007
-08
2009
-10
1990
-91
1992
-93
1994
-95
1996
-97
1998
-99
2000
-01
2002
-03
2004
-05
2006
-07
2008
-09
2010
-11
Num
ber of Participating S
chools
Tota
l MP
CP
Stu
dent
Enr
ollm
ent
Total MPCP Pupil Count Participating Schools
Source: Data obtained from the Wisconsin Department of Public Instruction.
In July of 2009, the Wisconsin State legislature passed 2009 Wisconsin Act 28 which mandated a series of changes pertaining to MPCP schools. As a result, MPCP schools must:
1. Administer the Wisconsin Knowledge and Concepts Examinations (WKCE) in reading, math, and science to all of their MPCP pupils in 3rd-8th and 10th grade.
2. Adopt a written policy specifying criteria for promoting a pupil from 4th to 5th grade and from 8th to 9th grade and for granting a high school diploma.
3. Adopt pupil standards in mathematics, science, reading and writing, geography, and history.
4. Ensure that all MPCP administrators have at least a bachelor’s degree from an accredited institution of higher education.
5. Ensure that all MPCP teachers have a bachelor’s degree from an accredited institution of higher education.
6. Provide the Wisconsin Department of Public Instruction with pupil scores on all standardized tests administered under s. 119.23(7)(e)1 (a.k.a. 2005 Act 125) for the previous 5 years.
Data and MethodologyDuring the period of February-September of 2011 the SCDP administered a survey to the principals of the 107 private schools that participated in the MPCP for the full academic year. The initial set of surveys were mailed to participating schools on February 7th, 2011. In order to increase the response rate, a second wave of surveys was mailed to non-responding schools in May 2011. A final reminder letter with an additional copy of the survey was mailed to non-responding schools in July 2011. At completion, the SCDP received 88 completed surveys from the MPCP schools, which equates to a final response rate of 82 percent. Where appropriate, baseline data that are considered constant (e.g. historical information and religious affiliation) from earlier versions of the principals’ survey are used in this report to reduce the amount of missing data. Known characteristics of non-respondents are detailed in Appendix A. Additional data were provided by the Wisconsin Department of Public Instruction (DPI). Data for MPS were gathered from the Wisconsin DPI, Wisconsin’s Information Network for Successful Schools (WINNS) database, and the U.S. Department of Education’s National Center for Education Statistics (NCES).
Milwaukee Parental Choice Program: Descriptive Report on Participating Schools
February 20124
All of the data presented below were collected prior to the 2011 changes to the program. These data describe the schools in the MPCP when it was a targeted, means-tested urban voucher program during the 2010-11 school year. Although the program is now open to middle-income families and schools outside of Milwaukee, those changes took effect after the content of this report was finalized. As such, this report describes the MPCP during its final year as a private school choice program limited only to low-income students and Milwaukee-based schools.
MPCP Participating Schools – Basic Characteristics
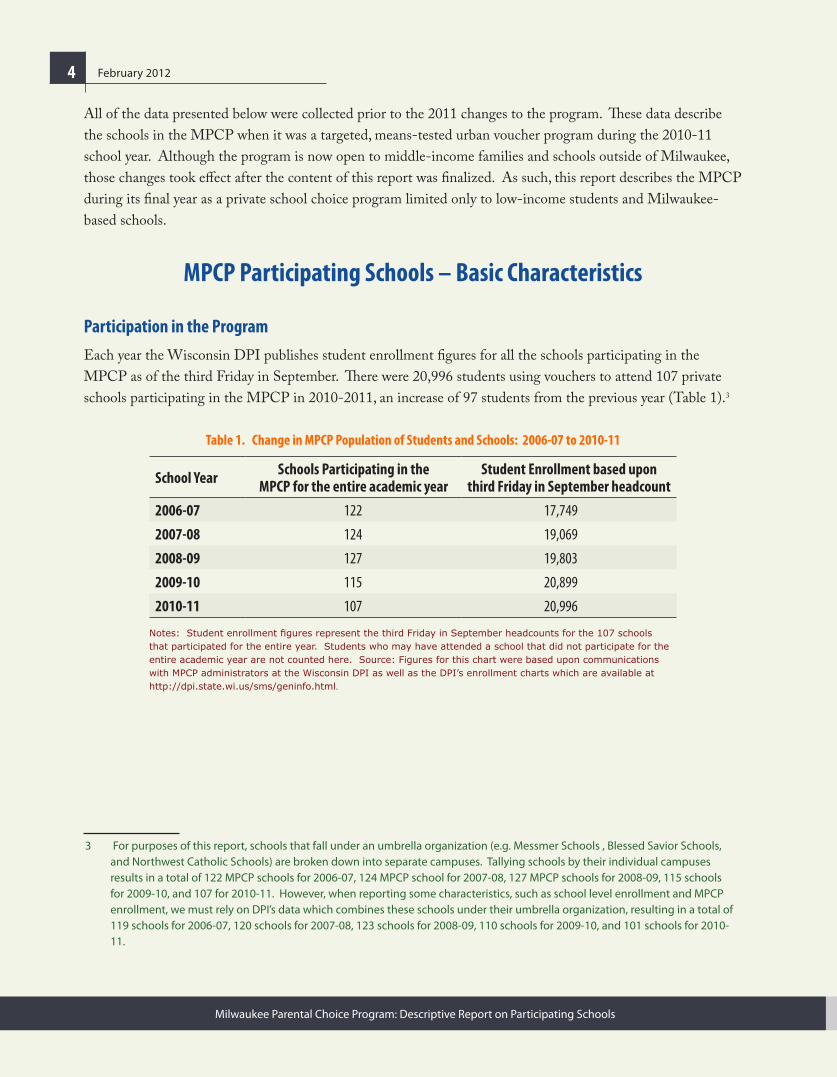
Participation in the ProgramEach year the Wisconsin DPI publishes student enrollment figures for all the schools participating in the MPCP as of the third Friday in September. There were 20,996 students using vouchers to attend 107 private schools participating in the MPCP in 2010-2011, an increase of 97 students from the previous year (Table 1).3
Table 1. Change in MPCP Population of Students and Schools: 2006-07 to 2010-11
School Year Schools Participating in the MPCP for the entire academic year
Student Enrollment based upon third Friday in September headcount
2006-07 122 17,749
2007-08 124 19,069
2008-09 127 19,803
2009-10 115 20,899
2010-11 107 20,996
Notes: Student enrollment figures represent the third Friday in September headcounts for the 107 schools that participated for the entire year. Students who may have attended a school that did not participate for the entire academic year are not counted here. Source: Figures for this chart were based upon communications with MPCP administrators at the Wisconsin DPI as well as the DPI’s enrollment charts which are available at http://dpi.state.wi.us/sms/geninfo.html.
3 For purposes of this report, schools that fall under an umbrella organization (e.g. Messmer Schools , Blessed Savior Schools, and Northwest Catholic Schools) are broken down into separate campuses. Tallying schools by their individual campuses results in a total of 122 MPCP schools for 2006-07, 124 MPCP school for 2007-08, 127 MPCP schools for 2008-09, 115 schools for 2009-10, and 107 for 2010-11. However, when reporting some characteristics, such as school level enrollment and MPCP enrollment, we must rely on DPI’s data which combines these schools under their umbrella organization, resulting in a total of 119 schools for 2006-07, 120 schools for 2007-08, 123 schools for 2008-09, 110 schools for 2009-10, and 101 schools for 2010-11.

Milwaukee Parental Choice Program: Descriptive Report on Participating Schools
February 2012 5
Figure 2. Number of Participating MPCP Schools, 2006-07 through 2010-11
2006-07 2007-08 2008-09 2009-10 2010-11
10 132
4
10 132
4
-20
0
20
40
60
80
100
120
140
122114 114 113
103
122114 114 113
103
-8 -10 -14 -12-8 -10 -14 -12
Continuing Participants
Additions
Departures
Source: Data obtained from the Wisconsin Department of Public Instruction.
The number of schools participating in the MPCP decreased from 115 in 2009-10 to 107 in 2010-11. Four schools joined the MPCP for the first time during the 2010-11 school year, while 12 schools that participated in 2009-10 left the Program in 2010-11 (Figure 2).
According to SCDP survey responses, most schools that participated in 2010-2011 existed prior to the establishment of the program in 1991 (Table 2). However, 38 percent of the participating schools indicated that they were created after the program began. Of that 38 percent, roughly half (46%) indicated that the MPCP was a major factor in their decision to open a school, while an additional 11 percent said that it was a minor factor.
Table 2. School Participation in the MPCP
Did school exist prior to the establishment of MPCP? Total Percent
Yes 60 61.9
No 37 38.1
Was the MPCP a factor in your decision to open a school? Total Percent
Not a factor in our decision 14 37.8
A minor factor in our decision 4 10.8
A major factor in our decision 17 45.9
Don’t know 2 5.4
NOTES: Valid N=97. Source: Figures are based upon 2006-07, 2007-08, 2008-09, 2009-10, and 2010-11 MPCP Principal Survey responses.
Milwaukee Parental Choice Program: Descriptive Report on Participating Schools
February 20126
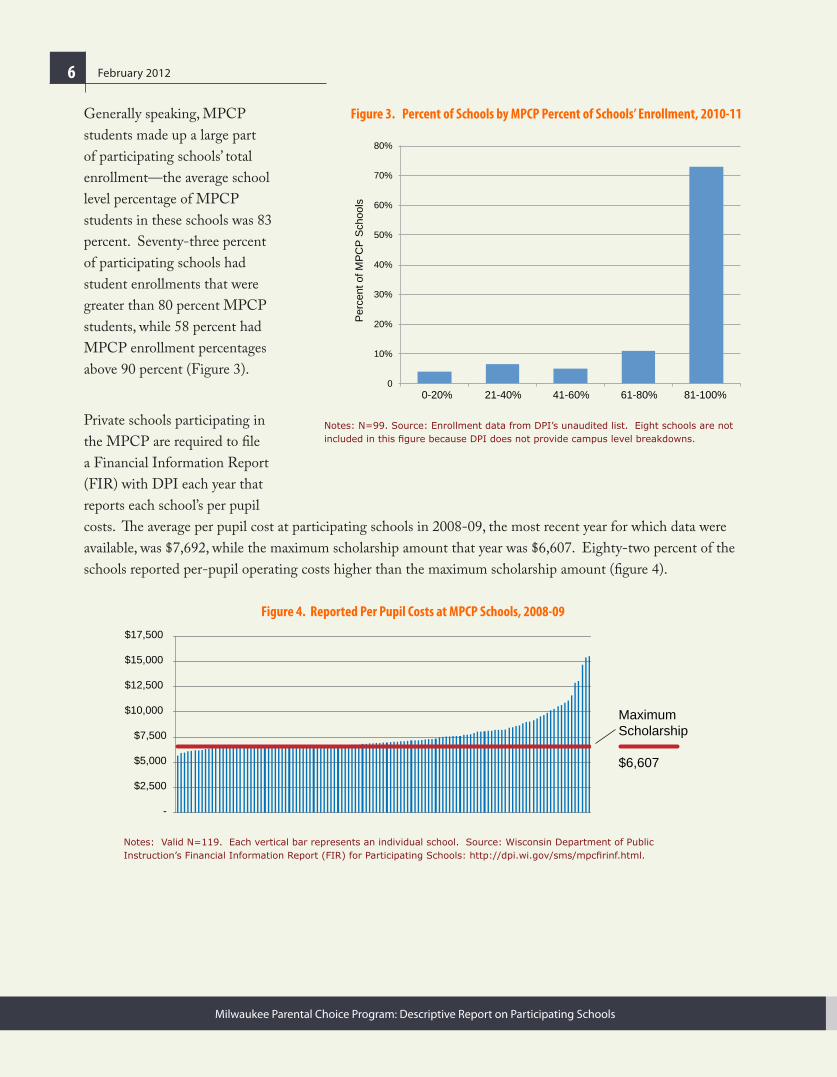
Generally speaking, MPCP students made up a large part of participating schools’ total enrollment—the average school level percentage of MPCP students in these schools was 83 percent. Seventy-three percent of participating schools had student enrollments that were greater than 80 percent MPCP students, while 58 percent had MPCP enrollment percentages above 90 percent (Figure 3).
Figure 3. Percent of Schools by MPCP Percent of Schools’ Enrollment, 2010-11
0
10%
20%
30%
40%
50%
60%
70%
80%
0-20% 21-40% 41-60% 61-80% 81-100%
Per
cent
of M
PC
P S
choo
ls
Percent of Schools’ Total Enrollment Participating in the MPCPNotes: N=99. Source: Enrollment data from DPI’s unaudited list. Eight schools are not included in this figure because DPI does not provide campus level breakdowns.
Private schools participating in the MPCP are required to file a Financial Information Report (FIR) with DPI each year that reports each school’s per pupil costs. The average per pupil cost at participating schools in 2008-09, the most recent year for which data were available, was $7,692, while the maximum scholarship amount that year was $6,607. Eighty-two percent of the schools reported per-pupil operating costs higher than the maximum scholarship amount (figure 4).
Figure 4. Reported Per Pupil Costs at MPCP Schools, 2008-09
-
$2,500
$5,000
$7,500
$10,000
$12,500
$15,000
$17,500
Maximum Scholarship
$6,607
Notes: Valid N=119. Each vertical bar represents an individual school. Source: Wisconsin Department of Public Instruction’s Financial Information Report (FIR) for Participating Schools: http://dpi.wi.gov/sms/mpcfirinf.html.
Milwaukee Parental Choice Program: Descriptive Report on Participating Schools
February 2012 7
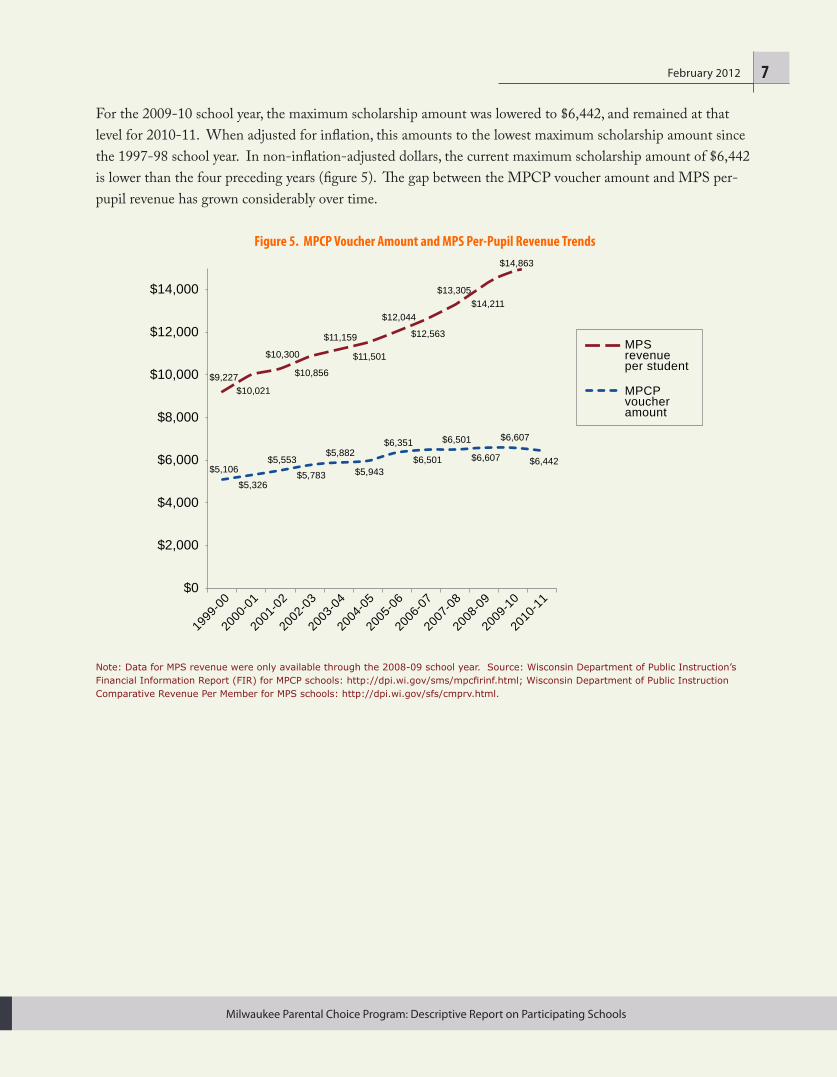
For the 2009-10 school year, the maximum scholarship amount was lowered to $6,442, and remained at that level for 2010-11. When adjusted for inflation, this amounts to the lowest maximum scholarship amount since the 1997-98 school year. In non-inflation-adjusted dollars, the current maximum scholarship amount of $6,442 is lower than the four preceding years (figure 5). The gap between the MPCP voucher amount and MPS per-pupil revenue has grown considerably over time.
Figure 5. MPCP Voucher Amount and MPS Per-Pupil Revenue Trends
MPCP voucher amount
MPS revenue per student
$5,106$5,553
$5,882$6,351 $6,501 $6,607
$5,326$5,783 $5,943
$6,501 $6,607 $6,442
$9,227$10,021
$10,300
$10,856
$11,159
$11,501
$12,044
$12,563
$13,305$14,211
$14,863
$0
$2,000
$4,000
$6,000
$8,000
$10,000
$12,000
$14,000
2009
-10
1999
-00
2000
-01
2001
-02
2002
-03
2003
-04
2004
-05
2005
-06
2006
-07
2007
-08
2008
-09
2010
-11
Note: Data for MPS revenue were only available through the 2008-09 school year. Source: Wisconsin Department of Public Instruction’s Financial Information Report (FIR) for MPCP schools: http://dpi.wi.gov/sms/mpcfirinf.html; Wisconsin Department of Public Instruction Comparative Revenue Per Member for MPS schools: http://dpi.wi.gov/sfs/cmprv.html.

Milwaukee Parental Choice Program: Descriptive Report on Participating Schools
February 20128
MPCP Participating Schools – Grade-Levels ServedCollectively, private schools participating in the MPCP in 2010-2011 offered the full range of grade options, from Kindergarten to 12th grade (Table 3). Eighty-nine percent of schools served elementary students, while 79 percent served middle school students. Twenty-five percent offered high school.
Table 3. Types of MPCP Schools by Levels Served
School Type Total Percent of all MPCP SchoolsMPCP offering elementary school 95 88.8
MPCP offering middle school 85 79.4
MPCP offering high school 27 25.2
Notes: Valid N=107. Source: Data taken from the Wisconsin DPI’s Directory of 2010-11 MPCP and MPS schools. School classified as offering elementary if they offered any grade within the K-5 range; middle school if they offered any grade within the 6-8 range, and high school if they offered any grade within the 9-12 range.
MPCP Participating Schools – Religious StatusSince the 1998 Wisconsin Supreme Court decision, private school options for the MPCP have included both religious and secular schools. While most MPCP schools have a religious character, as a group they are religiously diverse. In 2010-11 no single religious affiliation enrolled more than 45 percent of all MPCP students.
Participants include schools representing at least ten distinct religious affiliations, non-religious schools that follow a religious tradition, and purely secular schools (Table 4).
• Ninety schools identified themselves as religious (86%),
• Seven were classified as non-religious with a religious tradition (7%), and
• Eight of the participating schools identified themselves as non-religious (8%).
Table 4. Religious Identification of MPCP Schools
Religious Identification of Schools Total Percent of participating schools
Percent of MPCP students attending
Religious 90 85.7 84.2
Non-Religious (with a religious tradition) 7 6.7 6.7
Non-religious (secular) 8 7.6 9.2
Notes: Valid N=105. Source: Information concerning religious identification and affiliation was taken from the 2006-07, 2007-08, 2008-09, 2009-10, and 2010-2011 SCDP principal survey responses. Subsequent missing data came from the Public Policy Forum. Total MPCP enrollment for the 90 schools that had religiosity identified is 17,484. MPCP enrollment data from DPI’s unaudited list.

Milwaukee Parental Choice Program: Descriptive Report on Participating Schools
February 2012 9
Of the 90 schools (86%) that identified themselves as religious, 34 (38%) were Catholic, 26 (29%) were Lutheran, and 17 (19%) were non-denominational Christian. Other options include schools that were Church of God in Christ, Apostolic/Pentecostal, Islamic, Seventh-Day Adventist, Jewish, and Baptist.
Table 5. Affiliations of Religious MPCP Schools
Affiliation of Religious Schools Total Percent of participating schools
Percent of MPCP students attending
Catholic 34 37.8 44.7
Christian, non-denominational 17 18.9 14.1
Lutheran (WELS) 15 16.7 16.6
Lutheran (LCMS) 11 12.2 10.6
Church of God in Christ 5 5.6 5.9
Apostolic/Pentecostal 2 2.2 2.3
Islamic 2 2.2 4.4
Seventh-Day Adventist 2 2.2 0.6
Jewish 1 1.1 0.8
Baptist 1 1.1 0.5
Notes: Valid N=90. Source: Information concerning religious identification and affiliation is based upon 2006-07, 2007-08, 2008-09, 2009-10, and 2010-11 MPCP Principal Survey responses. Subsequent missing data came from the Public Policy Forum. Total MPCP enrollment for the 90 schools that had religiosity identified is 17,484. MPCP enrollment data from DPI’s unaudited list. Lutheran (ELCA) was also included as a category on the survey, but generated no cases.
When observed inside the context of MPCP enrollment levels (column 3 compared to column 4 in Table 5), students cluster more heavily within certain types of schools. Explicitly, clustering is evident when the percentage of MPCP students attending a school with a particular characteristic exceeds the percentage of schools offering that same characteristic. This is a noteworthy trend, though it is important to keep in mind that multiple explanations can be inferred from this clustering. While it hints at the preferences for particular characteristics among choice families, many other factors can influence enrollment rates. For example, either the size of a school and available seats or its location could influence enrollment levels independently, regardless of other school characteristics. Thus, while student clustering is an important description of the types of school experiences students are receiving, readers are cautioned against drawing casual inferences as to the exact forces behind it.
While there is some evidence of clustering within schools of certain religious affiliations, the general levels of clustering are relatively small. For example, 38 percent of all MPCP schools are Catholic, and they enroll 45 percent of MPCP students. Additionally, although 19 percent of schools are Christian, non-denominational,

Milwaukee Parental Choice Program: Descriptive Report on Participating Schools
February 201210
they enroll only 14 percent of MPCP students. Figure 6 shows the differences between the percentage of students attending schools of each religious affiliation and the percentage of participating schools that identify with a particular religious affiliation.
Figure 6. Religious Affiliations: Share of Enrollment in Schools Compared to Share of Schools
-5 -3 -1 1 3 5 7
Least Clustering
Most Clustering
Christian, non-denominational
7th Day Adventist
Lutheran (LCMS)
Baptist
Jewish
Lutheran (WELS)
Apostolic/Pentecostal
Church of God in Christ
Islamic
Catholic
Notes: Valid N=90. Source: Information concerning religious identification and affiliation are based upon 2006-07, 2007-08, 2008-09, 2009-10, and 2010-11 MPCP Principal Survey responses. Additional data came from the Public Policy Forum. Total MPCP enrollment for the 90 schools that had religiosity identified is 17,484. MPCP enrollment data from DPI’s unaudited list. Lutheran (ELCA) was also included as a category on the survey, but generated no cases.
MPCP Participating Schools – Programs OfferedPrivate schools participating in the MPCP offer an array of programs typically found in traditional public schools (Table 6). High percentages of schools offer art programs (74%), music programs (76%), programs for students with learning problems (72%), and after school programs (65%). Over half of the schools incorporate student government, programs with special instructional approaches, summer school, foreign language programs, and Advanced Placement. Fewer schools offer before school programs, special programs for advanced learners, gifted and talented programs, and programs for non-English speakers.

Milwaukee Parental Choice Program: Descriptive Report on Participating Schools
February 2012 11
Table 6. School Programs in MPCP Schools
Programs Percent of Schools Percent of MPCP Students Attending
Arts program 73.5 75.5
Music program 75.5 76.5
Programs for students with learning problems 71.7 71.8
After school program 64.5 69.0
Programs with special instructional approaches* 59.6 64.5
Student government 56.7 69.7
Summer school 56.7 66.7
Foreign language program 51.0 66.9
Advanced placement (AP) (high school only) 54.5 59.2
Before school program 43.6 45.6
Special programs for advanced learners 29.4 28.2
Talented/Gifted program 14.6 9.9
Programs for non-English speakers 15.3 28.8
* E.g., Success for All, Reading Recovery, Direct Instruction etc.
Notes: In cases where DPI collapsed enrollment figures for multiple campuses, schools are included in this figure if all of the campuses shared the same responses regarding programs offered. In cases where multiple campuses differed in their responses, those schools were excluded because MPCP enrollment breakdowns for those individual campus experiences are not available to us. Source: Information concerning school programs was taken from the 2006-07, 2007-08, 2008-09, 2009-2010, and 2010-11 MPCP Principal Survey responses (Valid N=99). MPCP enrollment data were taken from DPI’s unaudited list. International Baccalaureate programs were also included in the survey but generated no affirmative responses.
Enrollment levels suggest that students are clustered within schools that have particular programs to a greater extent than the student clustering observed by religious affiliation (Figure 7). In all but three instances, the percentage of students attending a school with a particular program is larger than the percentage of all schools that offer the program. As previously mentioned, this is a noteworthy finding, yet the cause of this clustering is somewhat difficult to interpret. Clustering might result from parents favoring schools with some features over others. Or it might result from the fact that large schools have a critical mass of students and thus are more likely to have summer school, foreign language programs, and programs for non-English speakers.

Milwaukee Parental Choice Program: Descriptive Report on Participating Schools
February 201212
Figure 7. School Programs: Share of Enrollment in Schools Compared to Share of Schools
Most Clustering
-5 0 5 10 15
Talented/Gifted program
Special programs for advanced learners
Programs for students with learning problems
Music program
Arts program
Before school program
After school program
Advanced placement (AP) (high school only)
Programs with special instructional approaches
Summer school
Student government
Programs for non-English speakers
Foreign language program
Least Clustering
Notes: Bars represent the difference between the percent of MPCP students attending each type of school and the percent of participating schools that offer a particular program. Source: Information concerning school programs was taken from the 2006-07, 2007-08, 2008-09, 2009-10, and 2010-11 MPCP Principal Survey responses. MPCP enrollment data from DPI’s unaudited list.
MPCP Participating Schools – Accountability Testing: 2010-11With the passage of the 2005 Wisconsin Act 125, private schools participating in the MPCP are now required to annually administer a nationally normed standardized test or the WKCE in reading, mathematics, and science to their MPCP students enrolled in the 4th, 8th, and 10th grades. The law further directs MPCP schools to submit copies of the scores from those tests to the SCDP. An important change became effective starting in the 2010-11 school year. 2009 Wisconsin Act 28 requires MPCP schools to administer the state test, the WKCE in reading, mathematics and science to all participating pupils in grades 3 through 8 and 10. Schools were given the option to continue to administer additional nationally normed tests if they wished. During the 2010-11 school year, the SCDP received student test scores from 102 schools. Five MPCP schools were not required to test their students as they did not have any students in tested grades.4
4 Additional details regarding the accountability testing can be found in Anna M. Jacob and Patrick J. Wolf, Milwaukee Longitudinal School Choice Evaluation: Annual School Testing Summary Report 2010-11. School Choice Demonstration Project, University of Arkansas, Fayetteville, AR, SCDP Milwaukee Evaluation Report #32, March 2012, available at http://www.uark.edu/ua/der/SCDP/Milwaukee_Research.html.
Milwaukee Parental Choice Program: Descriptive Report on Participating Schools
February 2012 13
Table 7. Accountability Testing: 2010-11
Type of Test Given Total Percent of participating schools
Percent of MPCP Students Attending
WKCE Only 63 61.8 36.0
Both Norm-Referenced and WKCE 39 32.2 64.0
NOTES: Information concerning standardized testing was taken from scores submitted by the MPCP schools (Valid N=102). In cases where schools with multiple campuses differed in their responses, those schools were excluded because MPCP enrollment breakdowns for those individual campus experiences are not available to us. Five schools were not required to administer tests as they had no students in tested grades.
MPCP Participating Schools – Support Staff and FacilitiesPrivate schools participating in the MPCP incorporate support staff and facilities typically found in traditional schools. Most provide individual tutors (55%), more than a third provide guidance counselors (44%), and nearly a quarter have a school nurse. Over 80 percent of the schools have a gym, cafeteria, and computer lab. Slightly fewer have a library (76%) and lunches prepared at the school (69%) (Table 8).
Table 8. Support Staff and Facilities in MPCP Schools: 2010-11
Staff Percent of Schools Percent of MPCP Students Attending
Individual tutors 55.4 54.5
Guidance Counselors 43.9 57.8
Nurse 22.3 29.9
Facilities
Gym 84.0 85.8
Cafeteria 88.8 90.3
Computer lab 85.7 91.7
Library 75.5 72.9
Lunches prepared at school 69.4 74.5
Source: Information concerning support staff and facilities are based upon 2006-07, 2007-08, 2008-09, 2009-10, and 2010-11 MPCP Principal Survey responses (Valid N=99). MPCP enrollment data from DPI’s unaudited list.
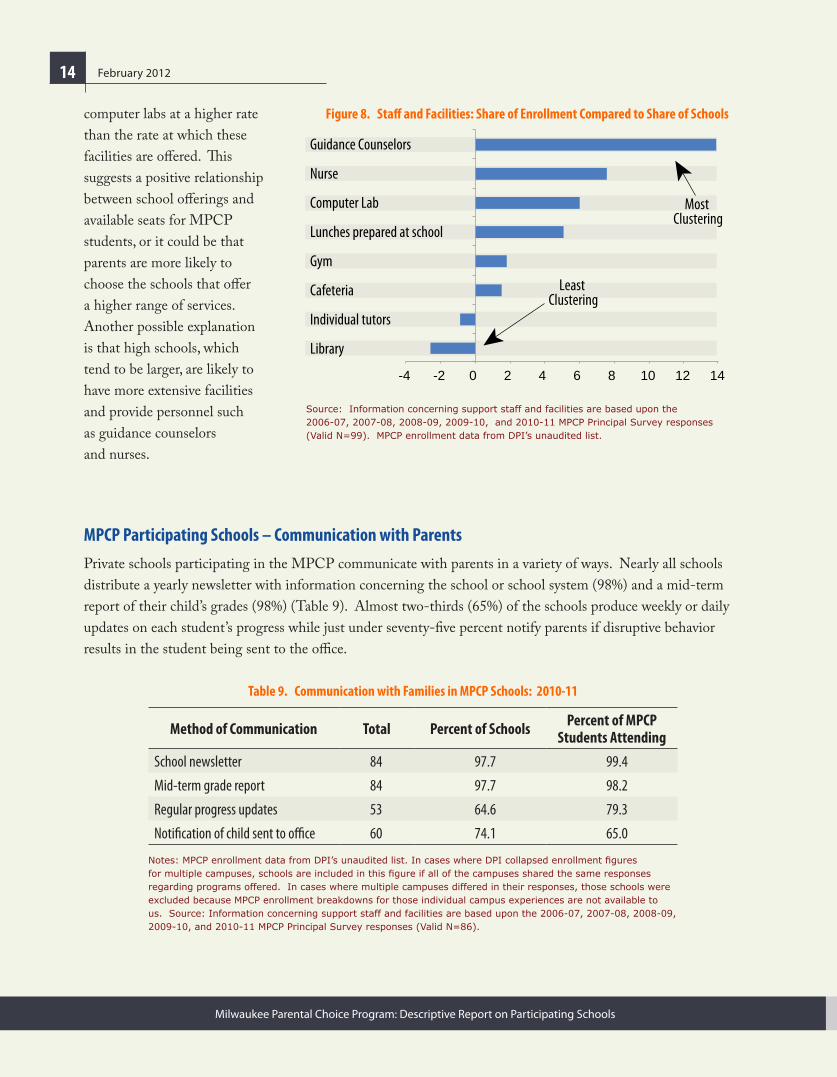
When examining the availability of specialized staff and facilities offered, the same pattern of clustering within schools that have more offerings is observable. While 44 percent of schools offer guidance counselors, 58 percent of MPCP students attend schools that offer them. This same general pattern can be seen with regard to the availability of school nurses (Figure 8). Students are also attending schools with gyms, cafeterias, and
Milwaukee Parental Choice Program: Descriptive Report on Participating Schools
February 201214
computer labs at a higher rate than the rate at which these facilities are offered. This suggests a positive relationship between school offerings and available seats for MPCP students, or it could be that parents are more likely to choose the schools that offer a higher range of services. Another possible explanation is that high schools, which tend to be larger, are likely to have more extensive facilities and provide personnel such as guidance counselors and nurses.
Figure 8. Staff and Facilities: Share of Enrollment Compared to Share of Schools
-4 -2 0 2 4 6 8 10 12 14
Library
Individual tutors
Cafeteria
Gym
Lunches prepared at school
Computer Lab
Nurse
Guidance Counselors
Least Clustering
Most Clustering
Source: Information concerning support staff and facilities are based upon the 2006-07, 2007-08, 2008-09, 2009-10, and 2010-11 MPCP Principal Survey responses (Valid N=99). MPCP enrollment data from DPI’s unaudited list.
MPCP Participating Schools – Communication with ParentsPrivate schools participating in the MPCP communicate with parents in a variety of ways. Nearly all schools distribute a yearly newsletter with information concerning the school or school system (98%) and a mid-term report of their child’s grades (98%) (Table 9). Almost two-thirds (65%) of the schools produce weekly or daily updates on each student’s progress while just under seventy-five percent notify parents if disruptive behavior results in the student being sent to the office.
Table 9. Communication with Families in MPCP Schools: 2010-11
Method of Communication Total Percent of Schools Percent of MPCP Students Attending
School newsletter 84 97.7 99.4
Mid-term grade report 84 97.7 98.2
Regular progress updates 53 64.6 79.3
Notification of child sent to office 60 74.1 65.0
Notes: MPCP enrollment data from DPI’s unaudited list. In cases where DPI collapsed enrollment figures for multiple campuses, schools are included in this figure if all of the campuses shared the same responses regarding programs offered. In cases where multiple campuses differed in their responses, those schools were excluded because MPCP enrollment breakdowns for those individual campus experiences are not available to us. Source: Information concerning support staff and facilities are based upon the 2006-07, 2007-08, 2008-09, 2009-10, and 2010-11 MPCP Principal Survey responses (Valid N=86).
Milwaukee Parental Choice Program: Descriptive Report on Participating Schools
February 2012 15
MPCP and MPS Schools Compared
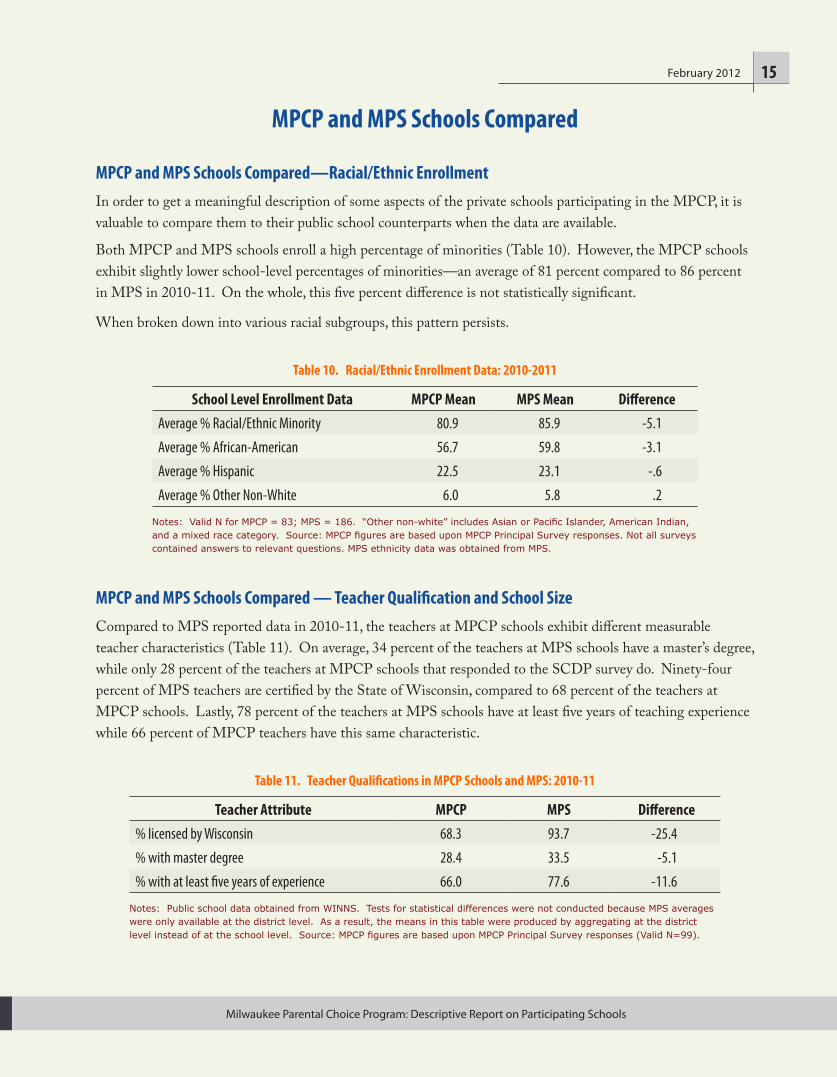
MPCP and MPS Schools Compared—Racial/Ethnic Enrollment In order to get a meaningful description of some aspects of the private schools participating in the MPCP, it is valuable to compare them to their public school counterparts when the data are available.
Both MPCP and MPS schools enroll a high percentage of minorities (Table 10). However, the MPCP schools exhibit slightly lower school-level percentages of minorities—an average of 81 percent compared to 86 percent in MPS in 2010-11. On the whole, this five percent difference is not statistically significant.
When broken down into various racial subgroups, this pattern persists.
Table 10. Racial/Ethnic Enrollment Data: 2010-2011
School Level Enrollment Data MPCP Mean MPS Mean DifferenceAverage % Racial/Ethnic Minority 80.9 85.9 -5.1
Average % African-American 56.7 59.8 -3.1
Average % Hispanic 22.5 23.1 -.6
Average % Other Non-White 6.0 5.8 .2
Notes: Valid N for MPCP = 83; MPS = 186. “Other non-white” includes Asian or Pacific Islander, American Indian, and a mixed race category. Source: MPCP figures are based upon MPCP Principal Survey responses. Not all surveys contained answers to relevant questions. MPS ethnicity data was obtained from MPS.
MPCP and MPS Schools Compared — Teacher Qualification and School SizeCompared to MPS reported data in 2010-11, the teachers at MPCP schools exhibit different measurable teacher characteristics (Table 11). On average, 34 percent of the teachers at MPS schools have a master’s degree, while only 28 percent of the teachers at MPCP schools that responded to the SCDP survey do. Ninety-four percent of MPS teachers are certified by the State of Wisconsin, compared to 68 percent of the teachers at MPCP schools. Lastly, 78 percent of the teachers at MPS schools have at least five years of teaching experience while 66 percent of MPCP teachers have this same characteristic.
Table 11. Teacher Qualifications in MPCP Schools and MPS: 2010-11
Teacher Attribute MPCP MPS Difference% licensed by Wisconsin 68.3 93.7 -25.4
% with master degree 28.4 33.5 -5.1
% with at least five years of experience 66.0 77.6 -11.6
Notes: Public school data obtained from WINNS. Tests for statistical differences were not conducted because MPS averages were only available at the district level. As a result, the means in this table were produced by aggregating at the district level instead of at the school level. Source: MPCP figures are based upon MPCP Principal Survey responses (Valid N=99).

Milwaukee Parental Choice Program: Descriptive Report on Participating Schools
February 201216
Compared to MPS schools, MPCP schools are smaller (Table 12). The average school participating in the MPCP has 267 students, while the average school in MPS has significantly more. This average difference of 173 students is statistically significant.
Table 12. School Enrollment: 2010-2011
MPCP MPS Difference
Average enrollment 266.5 439.8 -173.3**
**Statistically different at the 99% confidence level.
Notes: Valid N for MPCP = 107; MPS = 186. Source: MPCP enrollment data from DPI’s unaudited list, MPS enrollment data was obtained from MPS. In cases with large discrepancies DPI enrollment data was supplanted with SCDP survey data.
The average student/teacher ratios are also smaller within the MPCP schools (Table 13). Readers should note that the most recent data available for student/teacher ratios in MPS was from the NCES’ Common Core of Data for the year 2008-09.
Table 13. Student/Teacher Ratios: MPCP 2010-2011, MPS 2008-2009
MPCP MPS Difference
Student/teacher ratio 15.8 16.3 -.5
Notes: MPCP student/teacher ratios were computed from SCDP survey data by dividing total teachers by school reported student enrollment (Valid N=107). Schools were omitted from the MPS student/teacher ratio as outliers if they had student/teacher ratios over 60. All types of MPS public schools were used as observations, including MPS magnet schools and charter schools. Source: MPS data for student/teacher ratio obtained from NCES’ Common Core of Data, for which 2008-09 is the most recent year available (Valid N=202). MPCP data obtained from the SCDP 2010-2011 principals’ survey.
Creative Destruction in a Mature Choice EnvironmentIn a section of the landmark work Capitalism, Socialism and Democracy (1942), Joseph Schumpeter expounded upon the role of “Creative Destruction” in the evolution of organizations. Schumpeter’s hypothesis, that competition not only creates better enterprises but also destroys worse enterprises, is central to the economic theory behind school choice. Since the SCDP evaluation of the MPCP began, 36 schools have left the program outright, with an additional 7 leaving to become charter schools. The following two analyses attempt to determine whether they were “creatively” destroyed, that is, that the lowest performing schools were more likely to close.
First, rates of growth can be compared across sectors for students that attended schools that closed. Forty-nine MPS schools closed during the time period of our evaluation, so we can follow students that were in both our

Milwaukee Parental Choice Program: Descriptive Report on Participating Schools
February 2012 17
random sample of MPCP students and the matched comparison group5 and can calculate the differences in student growth after receiving the “treatment” of creative destruction.
Table 14: Across Sector Comparisons of Student Achievement Growth in Closing Schools
MPCP Mean N MPS Mean N Difference P-ValueAverage one year growth for students attending a school that closed after that school year
Math 0.135 84 -0.446 173 0.581 0.16
Reading 0.025 85 0.142 175 -0.117 0.33
Average one year growth for students who ever attended a school that closedMath 0.059 359 0.024 1175 0.035 0.49
Reading 0.028 360 0.048 1185 -0.020 0.70
Average one year growth for students who never attended a school that closedMath 0.012 2678 0.036 8601 -0.024 0.12
Reading 0.022 2692 0.040 8544 -0.018 0.23
Average one year growth for schools that closed after that school yearMath 0.138 17 0.099 25 0.039 0.84
Reading 0.039 17 0.037 24 0.002 0.99
Average one year growth for schools that closedMath 0.061 40 -0.063 63 0.124 0.37
Reading -0.029 40 -0.065 62 0.036 0.78
Average one year growth for schools that never closedMath 0.019 320 0.028 627 -0.009 0.74
Reading 0.030 320 0.035 629 -0.006 0.82
Note: Mean scores are in standard deviation units. The sample of MPCP students and the matched panel of MPS students were designed to be representative at the student but not school level, introducing potential bias into any school-level estimates.
As table 14 shows, comparing rates of growth from students in schools in the year that they closed to the next year as they attended a new school has no significant difference across schools sectors, either aggregated individually or at the school level. Similarly, there appear to be no cross-sector differences in average one year growth between students that ever or never attended a school that closed or school-level averages of growth in schools that ever or never closed.
5 Additional details regarding the sampling and matching procedure can be found in John F. Witte et al., MPCP Longitudinal Educational Growth Study. School Choice Demonstration Project, University of Arkansas, Fayetteville, AR, SCDP Milwaukee Evaluation Report #29, March 2012, available at http://www.uark.edu/ua/der/SCDP/Milwaukee_Research.html.

Milwaukee Parental Choice Program: Descriptive Report on Participating Schools
February 201218
Broken down by sector, average changes tell a slightly different story. In Tables 15 and 16, we follow students who attended a school that closed (in the year that it closed) into the school they attended the next year. By comparing the average achievement level before and after, we can determine if students moved into schools that were higher performing. In Table 15, we see that MPCP students moved into schools that performed, on average, .004 to .268 standard deviations higher than their previous school. In Table 16, we see that MPS students, on average, moved into schools that performed .200 to .645 standard deviations higher than their school that closed.
Table 15: Average Difference in School Achievement Scores for School Switchers, MPCP
MPCP N Mean Difference (WKCE Scaled Score)
Mean Difference (Standard Deviation)
4th Grade Reading 31 0.19 0.004
4th Grade Math 43 12.59 0.268
8th Grade Reading 36 12.50 0.245
8th Grade Math 54 12.97 0.224
10th Grade Reading 66 13.91 0.253
10th Grade Math 84 8.75 0.199
Table 16: Average Difference in School Achievement Scores for School Switchers, MPS
MPS N Mean Difference (WKCE Scaled Score)
Mean Difference (Standard Deviation)
4th Grade Reading 10 28.03 0.572
4th Grade Math 18 30.96 0.645
8th Grade Reading 25 21.68 0.401
8th Grade Math 47 27.59 0.484
10th Grade Reading 61 13.72 0.233
10th Grade Math 81 8.79 0.200
While this is a relatively simplistic and small-sample look into this question, the preliminary evidence would appear to show that in both sectors, worse schools are being closed and students are moving into better schools as a result. The improvement appears to be especially pronounced in the public sector.

Milwaukee Parental Choice Program: Descriptive Report on Participating Schools
February 2012 19
CaveatsThere are some issues related to our analysis that must be pointed out. In choosing the switching students to follow, we were restricted to the panel students selected for the Longitudinal Educational Growth Study (LEGS), a sample of 2,727 random MPCP students and 2,727 MPS students matched to have similar baseline characteristics. Only a small subset of students within that subset of Milwaukee students attended a school in the last year that it participated in the program. In future research we hope to expand the number of switchers followed to all students in our testing panel samples (each with 10,000+ students in them) to increase the power and accuracy of our estimations.
Similarly, because of Wisconsin Act 125, MPCP schools were free to give any nationally normed tests or the Wisconsin state exam, the WKCE, until school year 2010-11, when all schools were required to administer the WKCE. In order to equate the scores on these different tests, we used students that took both tests, regressing their scores on the nationally normed test on their WKCE score to develop a conversion algorithm. Similar to the restriction of the panel sample above, a very small number of students took both tests (269 in 2008-2009 and 229 in 2009-20106). Thus, variation in test scores may be as much a function of an imperfect conversion algorithm as a real variance in the population. In future research we hope to expand the sample and refine the conversion procedure.
6 Starting in 2010-2011, all students were required to take the WKCE.

Milwaukee Parental Choice Program: Descriptive Report on Participating Schools
February 201220
Appendix A:Details of Non-Respondents
Of the 107 schools that participated in the MPCP during the 2010-2011 school year, 19 did not return principal surveys. This section briefly describes the characteristics of non-respondents in cases where data were available from the Wisconsin Department of Public Instruction, NCES’ Common Core of Data, and other additional sources.
On average, the schools that did not respond to data collection had lower levels of enrollment. Sixty-eight percent of non-respondents identified themselves as religious schools, whereas 90 percent of schools that completed the survey classified themselves as religious. While non-responding schools were much less likely to offer high school grades, responding and non-responding schools offered elementary and middle grades at similar rates. Lastly, the non-responding schools had a smaller percentage of their enrolled students using MPCP vouchers. The differences for percent religious and percent offering high school between respondents and non-respondents were found to be statistically significant.
Table A1: Characteristics of Respondents and Non-respondents
Characteristic: Non-Respondents Respondents DifferenceAverage enrollment 238.4 274.6 36.2
% religious 68.4 89.5 21.1*
% of students that are in MPCP 83.7 82.4 -1.3
% Offering elementary school 78.9 90.1 11.2
% Offering middle school 63.2 83.0 19.8
% Offering high school 47.4 20.5 -26.9*
NOTES: Characteristics of non-respondents based upon N=19 for grade levels offered, N=19 for religious status, N=19 for percent of school’s students that participate in MPCP. Source: SCDP principal survey responses data, MPS, and Wisconsin DPI’s directory of schools

Milwaukee Parental Choice Program: Descriptive Report on Participating Schools
February 2012 21
Appendix B:List of Schools that Participated in the MPCP for the Entire 2010-11 School Year
Alston’s Preparatory Academy
Atlas Preparatory Academy
Atonement Lutheran School
Believers in Christ Christian Academy
Blessed Sacrament School
Blessed Savior - East Campus
Blessed Savior - North Campus
Blessed Savior - South Campus
Blessed Savior - West Campus
Calvary’s Christian Academy, Inc
Carter School of Excellence
Carter’s Christian Academy
Catholic East Elementary School
CEO Leadership Academy
Ceria M. Travis Academy, Inc.
Child Development Center of St. Joseph
Christ Memorial Lutheran School
Christ St. Peter Lutheran School
Christian Faith Academy of Higher Learning
Clara Mohammed School
Concordia University School
CrossTrainers Academy
Daughters of the Father Christian Academy
Destiny High School
Divine Savior Holy Angels High School
Dr. Brenda Noach Choice School
Early View Academy of Excellence
Eastbrook Academy
Emmaus Lutheran School
Family Montessori School
Garden Homes Lutheran School
Greater Holy Temple Christian Center
Hickman Academy Preparatory School
Holy Redeemer Christian Academy
Holy Wisdom Academy
Hope Christian School-Fortis (was Hope Middle School)
Hope Christian School: Prima
Hope School
Institute of Technology and Academics
Jared C. Bruce Academy
Kindergarten Plus
Learning Bridges Kingdom Academy Inc.
LifeSkills Academy
Lutheran Special School & Education Services
Malaika Early Learning Center
Marquette University High School
Messmer High School
Messmer Prep Catholic School
Mills Christian Academy
Milwaukee Lutheran High School
Milwaukee Montessori School
Milwaukee Seventh Day Adventist School
Montessori School of Garden Homes
Mother of Good Counsel School
Mount Calvary Lutheran School
Mount Lebanon Lutheran
Mustard Seed International School
New Testament Christian Academy
Northwest Catholic - East Campus & West Campus
Northwest Catholic - West Campus / Saint Bernadette School
Northwest Lutheran School
Notre Dame Middle School
Oklahoma Avenue Lutheran School
Our Lady Queen of Peace Parish
Parklawn Christian Leadership Academy
Pius XI High School
Prince of Peace
Right Step, Inc.
Risen Savior Lutheran School
Saint Adalbert School
Saint Anthony School
Saint Catherine School
Saint Charles Borromeo School
Saint Coletta Day School of Milwaukee
Saint Gregory the Great Parish School
Saint Joan Antida High School
Saint John Kanty School
Saint John’s Evangelical Lutheran
Saint Josaphat Parish School
Saint Lucas Lutheran School
Saint Marcus Lutheran School
Saint Margaret Mary School
Saint Martini Lutheran School
Saint Peter-Immanuel Lutheran School
Saint Philip’s Lutheran School
Saint Rafael the Archangel School
Saint Roman Parish School
Saint Rose and St. Leo Catholic School
Saint Sebastian School
Saint Thomas Aquinas Academy
Saint Vincent Pallotti School
Salam School
Sharon Junior Academy
Sherman Park Lutheran School/Preschool
Siloah Lutheran School
Tamarack Waldorf School
Texas Bufkin Academy
The AppleCrest Preparatory Leadership Academy
The Margaret Howard Christian Leadership Inst
Travis Technology High School
Victory Christian Academy
Washington DuBois Christian Leadership Academy
Whole Village Institute
Wisconsin Lutheran High School
Word of Life Evangelical Lutheran School
Yeshiva Elementary School
Young Minds Preparatory School

Milwaukee Parental Choice Program: Descriptive Report on Participating Schools
February 201222
Appendix C:MPCP Participating Schools No Longer Receiving Public Funds, 2006-07 through 2010-11
School Name First Year in the MPCP Last Year in the MPCP
Keal Preparatory School, Inc. 1998-99 2006-07
Nzingha Institute of Creative Learning for Living 2005-06 2006-07
Agape Center of Academic Excellence, Inc. 1996-97 2007-08
Blyden Delany Academy 1998-99 2007-08
Grace Preparatory Schoool 2000-01 2007-08
Institute for Career Empowerment 2004-05 2007-08
Jesus Academy of Learning 2007-08 2007-08
Noah’s Ark Preparatory School 2000-01 2007-08
Paige II University School, Inc. 2005-06 2007-08
SMI Early College Preparatory High School 2007-08 2007-08
Bessie M. Gray Prep Academy 2000-01 2008-09
Collins Christian Academy 2008-09 2008-09
Community Vision Academy 1998-99 2008-09
Excel Learning Academy 2004-05 2008-09
Fairview Lutheran School 2004-05 2008-09
Family Academy 2005-06 2008-09
Gilchrist Christian Academy 2007-08 2008-09
Grisby’s Academy for the Gifted and Talented 2008-09 2008-09
Johnson Christian Academy, Inc. 2006-07 2008-09
KidPreneur / Teenpreneur #2 2006-07 2008-09
LaBrew Troopers Military University School 2003-04 2008-09
New Holy Ghost Tabernacle Pre-School Academy 2007-08 2008-09
St. Catherine (76th Pl.) School 1998-99 2008-09
The Way and the Truth Christian Academy 2008-09 2008-09
The Young Women’s Institute for Global Studies 2008-09 2008-09

Milwaukee Parental Choice Program: Descriptive Report on Participating Schools
February 2012 23
Trinity Christian Academy for Nonviolence 2006-07 2008-09
Victory Preparatory Academy 1999-00 2008-09
Excel Academy 2004-05 2009-10
Garden Homes Community Montessori School 2007-08 2009-10
Gospel Lutheran School 1998-99 2009-10
Harambee School 1990-91 2009-10
Jackson Preschool Learning Academy 2008-09 2009-10
Life 101 “THINK” Academy 2008-09 2009-10
Outlook University Independent School Network 2008-09 2009-10
Resurrection Christian Academy 1998-99 2009-10
Tuskegee Aviation Academy 2008-09 2009-10
Mills Christian Academy 2008-09 2010-11
Montessori School of Garden Homes 2010-11 2010-11
Mustard Seed International School 2007-08 2010-11
Oklahoma Avenue Lutheran School 1998-99 2010-11
Whole Village 2010-11 2010-11

Milwaukee Parental Choice Program: Descriptive Report on Participating Schools
February 201224

Milwaukee Parental Choice Program: Descriptive Report on Participating Schools
MPCP Longitudinal Educational Growth Study Fifth Year Report
About the Authors
Brian Kisida is a Research Associate for the School Choice Demonstration Project in the Department of Education Reform at the University of Arkansas. His current research projects include the experimental evaluation of the D.C. Opportunity Scholarship Program. Previously he has served as an instructor in the Department of Political Science at the University of Arkansas and as a Research Assistant for the Arkansas Poll. Kisida received his B.A. (Phi Beta Kappa) and M.A. in Political Science from the University of Arkansas.
Laura I. Jensen is a Research Associate in the Department of Education Reform at the University of Arkansas. She coordinates the logistics of the Milwaukee evaluation being conducted by the School Choice Demonstration Project. A former special education teacher, Ms. Jensen previously served as a Project Associate at the National Institute on Out-of-School Time at Wellesley College’s Center for Research on Women. She has a B.A. in Psychology from Westminster College and an M.A. in Child Development from Tufts University.
Michael Q. McShane is a Distinguished Doctoral Fellow in the Department of Education Reform at the University of Arkansas. He began his career as an inner city high school teacher in Montgomery, Alabama with the University of Notre Dame’s Alliance for Catholic Education program. He graduated summa cum laude with a B.A. in English from St. Louis University in 2007.
Patrick J. Wolf is Professor of Education Reform and 21st Century Endowed Chair in School Choice at the University of Arkansas in Fayetteville. He also is principal investigator of the School Choice Demonstration Project. Wolf has authored, co-authored, or co-edited three books and more than 30 articles and book chapters on school choice, special education, and public management. A 1987 summa cum laude graduate of the University of St. Thomas (St. Paul, MN), he received his Ph.D. in Political Science from Harvard University in 1995.

School Choice Demonstration ProjectDepartment of Education Reform
University of Arkansas201 Graduate Education Building
Fayetteville, AR 72701479-575-6345
http://www.uark.edu/ua/der/SCDP/Milwaukee_Research.html