MILLISECOND OSCILLATIONS IN X-R BINARIES
45
UvA-DARE is a service provided by the library of the University of Amsterdam (http://dare.uva.nl) UvA-DARE (Digital Academic Repository) Millisecond Oscillations in X-ray Binaries van der Klis, M.B.M. Published in: Annual Review of Astronomy and Astrophysics DOI: 10.1146/annurev.astro.38.1.717 Link to publication Citation for published version (APA): van der Klis, M. (2000). Millisecond Oscillations in X-ray Binaries. Annual Review of Astronomy and Astrophysics, 38, 717-760. https://doi.org/10.1146/annurev.astro.38.1.717 General rights It is not permitted to download or to forward/distribute the text or part of it without the consent of the author(s) and/or copyright holder(s), other than for strictly personal, individual use, unless the work is under an open content license (like Creative Commons). Disclaimer/Complaints regulations If you believe that digital publication of certain material infringes any of your rights or (privacy) interests, please let the Library know, stating your reasons. In case of a legitimate complaint, the Library will make the material inaccessible and/or remove it from the website. Please Ask the Library: http://uba.uva.nl/en/contact, or a letter to: Library of the University of Amsterdam, Secretariat, Singel 425, 1012 WP Amsterdam, The Netherlands. You will be contacted as soon as possible. Download date: 10 Apr 2019
Transcript of MILLISECOND OSCILLATIONS IN X-R BINARIES
UvA-DARE is a service provided by the library of the University of Amsterdam (http://dare.uva.nl)
UvA-DARE (Digital Academic Repository)
Millisecond Oscillations in X-ray Binariesvan der Klis, M.B.M.
Published in:Annual Review of Astronomy and Astrophysics
DOI:10.1146/annurev.astro.38.1.717
Link to publication
Citation for published version (APA):van der Klis, M. (2000). Millisecond Oscillations in X-ray Binaries. Annual Review of Astronomy andAstrophysics, 38, 717-760. https://doi.org/10.1146/annurev.astro.38.1.717
General rightsIt is not permitted to download or to forward/distribute the text or part of it without the consent of the author(s) and/or copyright holder(s),other than for strictly personal, individual use, unless the work is under an open content license (like Creative Commons).
Disclaimer/Complaints regulationsIf you believe that digital publication of certain material infringes any of your rights or (privacy) interests, please let the Library know, statingyour reasons. In case of a legitimate complaint, the Library will make the material inaccessible and/or remove it from the website. Please Askthe Library: http://uba.uva.nl/en/contact, or a letter to: Library of the University of Amsterdam, Secretariat, Singel 425, 1012 WP Amsterdam,The Netherlands. You will be contacted as soon as possible.
Download date: 10 Apr 2019
P1: FRD
August 24, 2000 19:41 Annual Reviews AR108-17
Annu. Rev. Astron. Astrophys. 2000. 38:717–60Copyright c© 2000 by Annual Reviews. All rights reserved.
MILLISECOND OSCILLATIONS IN
X-RAY BINARIES
M. van der KlisAstronomical Institute “Anton Pannekoek,” University of Amsterdam, Kruislaan 403,1098 SJ Amsterdam, The Netherlands; e-mail: [email protected]
Key Words neutron stars, black holes, relativity, X-ray binaries, pulsars,quasi-periodic oscillations
■ Abstract The first millisecond X-ray variability phenomena from accreting com-pact objects have recently been discovered with the Rossi X-ray Timing Explorer.Three new phenomena are observed from low-mass X-ray binaries containing low-magnetic-field neutron stars: millisecond pulsations, burst oscillations, and kilohertzquasi-periodic oscillations. Models for these new phenomena involve the neutron starspin and orbital motion close around the neutron star, and rely explicitly on our un-derstanding of strong gravity and dense matter. I review the observations of these newneutron-star phenomena and some possibly related phenomena in black-hole candi-dates, and describe the attempts to use these observations to perform measurements offundamental physical interest in these systems.
1. INTRODUCTION
The principal motivation for studying accreting neutron stars and black holes is thatthese objects provide a unique window on the physics of strong gravity and densematter. One of the most basic expressions of the compactness of these compactobjects is the short (0.1–1 msec) dynamical time scale characterizing the motionof matter under the influence of gravity near them. Millisecond variability willnaturally occur in the process of accretion of matter onto a stellar-mass compactobject—an insight that dates back at least to Shvartsman (1971). For example, hotclumps orbiting in an accretion disk around black holes and neutron stars will causequasi-periodic variability on timescales of about a millisecond (Sunyaev 1973).Accreting, low-magnetic-field neutron stars will reach millisecond spin periods,which can be detected when asymmetric emission patterns form on the star’ssurface during X-ray bursts (Radhakrishnan & Srinivasan 1984, Alpar et al 1982,Shara 1982, Livio & Bath 1982; see also Joss 1978). These early expectations werefinally verified in a series of discoveries with NASA’s Rossi X-Ray Timing Explorer(RXTE; Bradt et al 1993) within 2.5 years after its launch on 30 December 1995.
0066-4146/00/0915-0717$14.00 717
P1: FRD
August 24, 2000 19:41 Annual Reviews AR108-17
718 VAN DER KLIS
In this review, I discuss these newly discovered phenomena and the attempts touse them to perform measurements of fundamental physical interest. I concentrateon millisecond oscillations—periodic and quasi-periodic variations in X-ray fluxwith frequencies exceeding 102.5 Hz—but I also discuss their relations to slowervariability and X-ray spectral properties. So far, millisecond oscillations have beenseen nearly exclusively from low-magnetic-field neutron stars, so these will be thefocus of this review; I will also compare their phenomenology to that of the black-hole candidates (Sections 6 and 7).
Accreting neutron stars and black holes occur in X-ray binaries (e.g. Lewinet al 1995a). In these systems matter is transferred from a normal (donor) star toa compact object. Thermal X-rays powered by the gravitational potential energyreleased are emitted by the inner regions of the accretion flow and, if present, theneutron star surface. For a compact object with a size of order 101 km, 90% ofthe energy is released in the inner∼102 km. It is with this inner emitting regionthat we are mostly concerned here. Because accreting low-magnetic-field neutronstars are mainly found in low-mass X-ray binaries (in which the donor star has amass of<1 M�), these are the systems I focus on.
The mass transfer usually occurs by way of an accretion disk around the compactobject. In the disk the matter moves in near-Keplerian orbits, i.e. with an azimuthalvelocity that is approximately Keplerian and a radial velocity much smaller thanthis. The disk has a radius of 105–7 km, depending on the binary separation. Thegeometry of the flow in the inner emitting regions is uncertain. In most models foraccretion onto low-magnetic-field neutron stars (e.g. Miller et al 1998a), at leastpart of the flow extends down into the emitting region in the form of a Kepleriandisk. It is terminated either at the radiusR of the star itself or at a radiusrin
somewhat larger thanR, by (for example) the interaction with a weak neutron-starmagnetic field, radiation drag, or relativistic effects. Withinrin the flow is no longerKeplerian and may or may not be disk-like. Both inside and outsiderin matter mayleave the disk and either flow in more radially or be expelled. Particularly forblack holes, advective flow solutions are discussed where the disk terminates andthe flow becomes more spherical at a much larger radius (e.g. Narayan 1997).
Whatever the geometry, it is clear that as the characteristic velocities nearthe compact object are of order (GM/R)1/2 ∼ 0.5c, the dynamical timescale—the timescale for the motion of matter through the emitting region—is short:τ dyn≡ (r3/GM )1/2 ∼ 0.1 ms forr = 10 km and∼2 ms forr = 100 km, near a1.4 M� neutron star, and∼1 ms at 100 km from a 10 M� black hole. Therefore, thesignificance of millisecond X-ray variability from X-ray binaries is clear: millisec-onds is the natural timescale for the accretion process in the X-ray emitting regions,and hence strong X-ray variability on such timescales is almost certainly causedby the motion of matter in these regions. Orbital motion, neutron-star spin, anddisk- and neutron-star oscillations are all expected to happen on these timescales.
The inner flow is located in regions of space-time where strong-field generalrelativity is required to describe the motion of matter. For that reason, one ex-pects to detect strong-field general-relativistic effects in these flows—such as, for
P1: FRD
August 24, 2000 19:41 Annual Reviews AR108-17
MILLISECOND OSCILLATIONS 719
example, the existence of a region where no stable orbits are possible. The preciseinteractions between the elementary particles in the interior of a neutron star that de-termine the equation of state (EOS) of supra-nuclear-density matter are not known.Therefore we cannot confidently predict the radius of a neutron star of given mass,or the maximum spin rate or mass of neutron stars (e.g. Cook et al 1994). So,by measuring these macroscopic quantities one constrains the EOS and tests basicideas about the properties of elementary particles. In summary, the main motiva-tion for studying millisecond variations in X-ray binaries is that their propertiesdepend on untested, or even unknown, properties of space-time and matter.
Three different millisecond phenomena have now been observed in X-ray bina-ries. Historically, the first to be discovered were the twin kilohertz quasi-periodicoscillations (kHz QPOs), widely interpreted now as resulting from orbital motionin the inner accretion flow. Then came the burst oscillations, probably a result ofthe spin of a layer in the neutron star’s atmosphere in near-corotation with the neu-tron star itself. Finally, RXTE detected the first true spin frequency of an accretinglow-magnetic field neutron star, the long-anticipated accreting millisecond pulsar.
In this review, I first examine the millisecond pulsar (Section 3), then the burstoscillations (Section 4), and finally the kHz QPOs (Section 5). We will thus venturefrom the (relatively) well-understood accreting pulsars via the less secure regionsof what happens in detail on a neutron star’s surface during the thermonuclear run-away that is an X-ray burst, into the mostly uncharted territory of the innermostaccretion flows around neutron stars and black holes—which obviously is “wherethe monsters are,” but also where the greatest rewards wait. The possibly relatedphenomena found in black-hole candidates (Section 6.1) and at lower frequen-cies (Section 6.3) are then discussed, and the kHz QPO models (Section 7) aresummarized.
2. TECHNIQUES
Most of the variability measurements discussed here rely on Fourier analysis ofX-ray count-rate time series with sub-millisecond time resolution (van der Klis1989b). A quasi-periodic oscillation (QPO) in the time series stands out in thepower spectrum (the square of the Fourier transform) as a broad, usually Lorentzianpeak (in Figure 1 several peaks of this type can be seen), characterized by its fre-quencyν (‘centroid frequency’), widthλ (inversely proportional to the coherencetime of the oscillation), and strength (the peak’s area is proportional to the vari-ance of the QPO signal). The variance is nearly always reported in terms of theroot-mean-square of the signal expressed as a fraction of the count rate, the frac-tional rms amplituder; the coherence is often reported in terms of a quality factorQ= ν/λ. Conventionally, to call a local maximum in a power spectrum a QPOpeak, one requiresQ> 2. Time delays between signals simultaneously detectedin different energy bands are usually measured using cross-spectra (the frequency-domain equivalent of the cross-correlation function; van der Klis et al 1987,
P1: FRD
August 24, 2000 19:41 Annual Reviews AR108-17
720 VAN DER KLIS
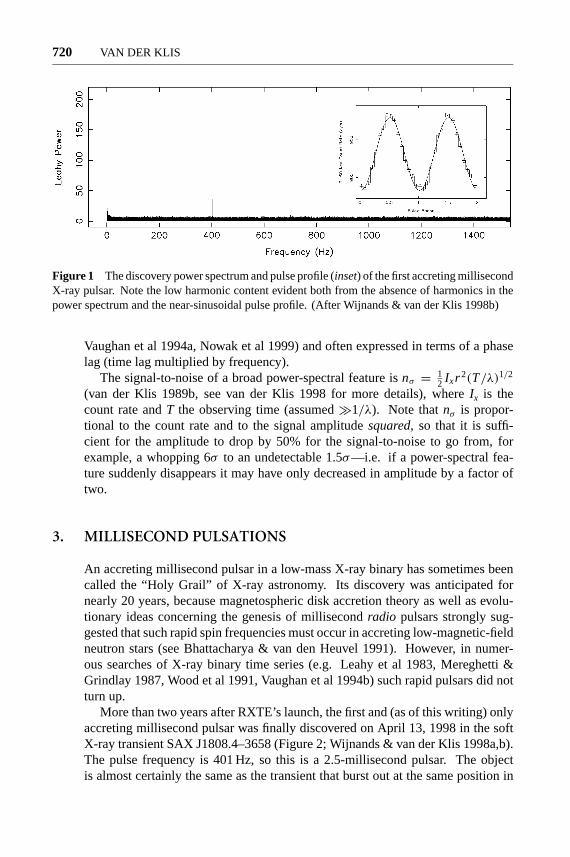
Figure 1 The discovery power spectrum and pulse profile (inset) of the first accreting millisecondX-ray pulsar. Note the low harmonic content evident both from the absence of harmonics in thepower spectrum and the near-sinusoidal pulse profile. (After Wijnands & van der Klis 1998b)
Vaughan et al 1994a, Nowak et al 1999) and often expressed in terms of a phaselag (time lag multiplied by frequency).
The signal-to-noise of a broad power-spectral feature isnσ = 12 Ixr 2(T/λ)1/2
(van der Klis 1989b, see van der Klis 1998 for more details), whereIx is thecount rate andT the observing time (assumed�1/λ). Note thatnσ is propor-tional to the count rate and to the signal amplitudesquared, so that it is suffi-cient for the amplitude to drop by 50% for the signal-to-noise to go from, forexample, a whopping 6σ to an undetectable 1.5σ—i.e. if a power-spectral fea-ture suddenly disappears it may have only decreased in amplitude by a factor oftwo.
3. MILLISECOND PULSATIONS
An accreting millisecond pulsar in a low-mass X-ray binary has sometimes beencalled the “Holy Grail” of X-ray astronomy. Its discovery was anticipated fornearly 20 years, because magnetospheric disk accretion theory as well as evolu-tionary ideas concerning the genesis of millisecondradio pulsars strongly sug-gested that such rapid spin frequencies must occur in accreting low-magnetic-fieldneutron stars (see Bhattacharya & van den Heuvel 1991). However, in numer-ous searches of X-ray binary time series (e.g. Leahy et al 1983, Mereghetti &Grindlay 1987, Wood et al 1991, Vaughan et al 1994b) such rapid pulsars did notturn up.
More than two years after RXTE’s launch, the first and (as of this writing) onlyaccreting millisecond pulsar was finally discovered on April 13, 1998 in the softX-ray transient SAX J1808.4–3658 (Figure 2; Wijnands & van der Klis 1998a,b).The pulse frequency is 401 Hz, so this is a 2.5-millisecond pulsar. The objectis almost certainly the same as the transient that burst out at the same position in
P1: FRD
August 24, 2000 19:41 Annual Reviews AR108-17
MILLISECOND OSCILLATIONS 721
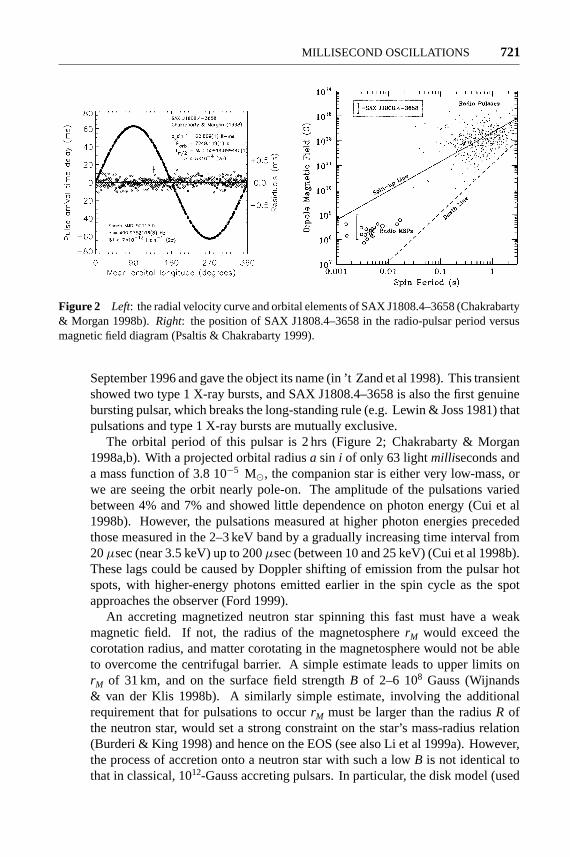
Figure 2 Left: the radial velocity curve and orbital elements of SAX J1808.4–3658 (Chakrabarty& Morgan 1998b).Right: the position of SAX J1808.4–3658 in the radio-pulsar period versusmagnetic field diagram (Psaltis & Chakrabarty 1999).
September 1996 and gave the object its name (in ’t Zand et al 1998). This transientshowed two type 1 X-ray bursts, and SAX J1808.4–3658 is also the first genuinebursting pulsar, which breaks the long-standing rule (e.g. Lewin & Joss 1981) thatpulsations and type 1 X-ray bursts are mutually exclusive.
The orbital period of this pulsar is 2 hrs (Figure 2; Chakrabarty & Morgan1998a,b). With a projected orbital radiusa sin i of only 63 lightmilliseconds anda mass function of 3.8 10−5 M�, the companion star is either very low-mass, orwe are seeing the orbit nearly pole-on. The amplitude of the pulsations variedbetween 4% and 7% and showed little dependence on photon energy (Cui et al1998b). However, the pulsations measured at higher photon energies precededthose measured in the 2–3 keV band by a gradually increasing time interval from20µsec (near 3.5 keV) up to 200µsec (between 10 and 25 keV) (Cui et al 1998b).These lags could be caused by Doppler shifting of emission from the pulsar hotspots, with higher-energy photons emitted earlier in the spin cycle as the spotapproaches the observer (Ford 1999).
An accreting magnetized neutron star spinning this fast must have a weakmagnetic field. If not, the radius of the magnetosphererM would exceed thecorotation radius, and matter corotating in the magnetosphere would not be ableto overcome the centrifugal barrier. A simple estimate leads to upper limits onrM of 31 km, and on the surface field strengthB of 2–6 108 Gauss (Wijnands& van der Klis 1998b). A similarly simple estimate, involving the additionalrequirement that for pulsations to occurrM must be larger than the radiusR ofthe neutron star, would set a strong constraint on the star’s mass-radius relation(Burderi & King 1998) and hence on the EOS (see also Li et al 1999a). However,the process of accretion onto a neutron star with such a lowB is not identical tothat in classical, 1012-Gauss accreting pulsars. In particular, the disk model (used
P1: FRD
August 24, 2000 19:41 Annual Reviews AR108-17
722 VAN DER KLIS
in calculatingrM) is different this close to the neutron star, the disk-star boundarylayer may be different, and multipole components in the magnetic field becomeimportant. Conceivably, a classical magnetosphere does not even form and the4–7% amplitude pulsation occurs as a result of milder effects of the magneticfield on either the flow or the emission. Psaltis & Chakrabarty (1999) discussthese issues and conclude thatB is (1–10) 108 Gauss, which puts the source rightamong the other rotation-powered, millisecond pulsars (the msec radio pulsars;Figure 2). When the accretion shuts off sufficiently for the radio pulsar mechanismto operate, the system will likely show up as a radio pulsar. This should happenat the end of the system’s life as an X-ray binary—i.e. SAX J1808.4–3658 isindeed the long-sought millisecond radio-pulsar progenitor, but might also occurbetween the transient outbursts (Wijnands & van der Klis 1998b). So far, radioobservations have not detected the source in X-ray quiescence (Gaensler et al1999).
It is not clear what makes the neutron star spin detectable in SAX J1808.4–3658and not (so far) in other low-mass X-ray binaries of similar and often much higherflux. Perhaps a peculiar viewing geometry (e.g. a very low inclination of the binaryorbit) allows us to see the pulsations only in this system, although possible X-rayand optical modulations with binary phase make an inclination of zero unlikely(Chakrabarty & Morgan 1998b, Giles et al 1999).
With a neutron star spin frequency that is certain and good estimates ofrM
and B, SAX J1808.4–3658 can serve as a touchstone in studies of low-massX-ray binaries (LMXBs). Although no burst oscillations (Section 4) or kHz QPOs(Section 5) have been detected from the source, their absence is consistent withwhat would be expected from a standard LMXB in the same situation (Wijnands& van der Klis 1998c); in more intensive observations during a subsequent tran-sient outburst, such phenomena could be detected. This would strongly test themain assumptions underlying the models for these phenomena. The X-ray spec-tral properties (Heindl & Smith 1998, Gilfanov et al 1998) and the slower types ofvariability (Wijnands & van der Klis 1998c) of the source are very similar to thoseof other LMXBs at low accretion rate, which suggests that either the neutron starsin those systems have similarB, or the presence of a small magnetosphere doesnot affect spectral and slow-variability characteristics.
4. BURST OSCILLATIONS
Type 1 X-ray bursts are thermonuclear runaways in the accreted matter on aneutron-star surface (see Lewin et al 1995b for a review). When density and tem-perature in the accumulated nuclear fuel approach the ignition point, the matterignites at one particular spot, from which a nuclear burning front then propagatesaround the star (see Bildsten 1998b for a review). This leads to a burst of X-rayemission with a rise time of typically<1 s, and a 101–102 s exponential decayresulting from cooling of the neutron-star atmosphere. The total amount of energy
P1: FRD
August 24, 2000 19:41 Annual Reviews AR108-17
MILLISECOND OSCILLATIONS 723
emitted is 1039–40erg. In some bursts the Eddington critical luminosity is exceededand atmospheric layers are lifted off the star’s surface, leading to an increase inphotospheric radius of∼101–102 km, followed by a gradual recontraction. Thesebursts are called radius expansion bursts.
In the initial phase, when the burning front is spreading, the energy generation isinherently very anisotropic. The occasional occurrence of multiple bursts closelyspaced in time indicates that not all available fuel is burned up in each burst, whichsuggests that in some bursts only part of the surface participates. Magnetic fieldsand patchy burning (Bildsten 1995) could also lead to anisotropic emission duringX-ray bursts. Anisotropic emission from a spinning neutron star leads to periodicor quasi-periodic observable phenomena, because the stellar rotation causes theviewing geometry of the brighter regions to vary periodically (unless the pattern issymmetric around the rotation axis). Searches for such periodic phenomena duringX-ray bursts were performed by various groups (Mason et al 1980; Skinner et al1982; Sadeh et al 1982; Sadeh & Livio 1982a,b; Murakami et al 1987; Schoelkopf& Kelley 1991; Jongert & van der Klis 1996), but claims of detections remainedunconfirmed.
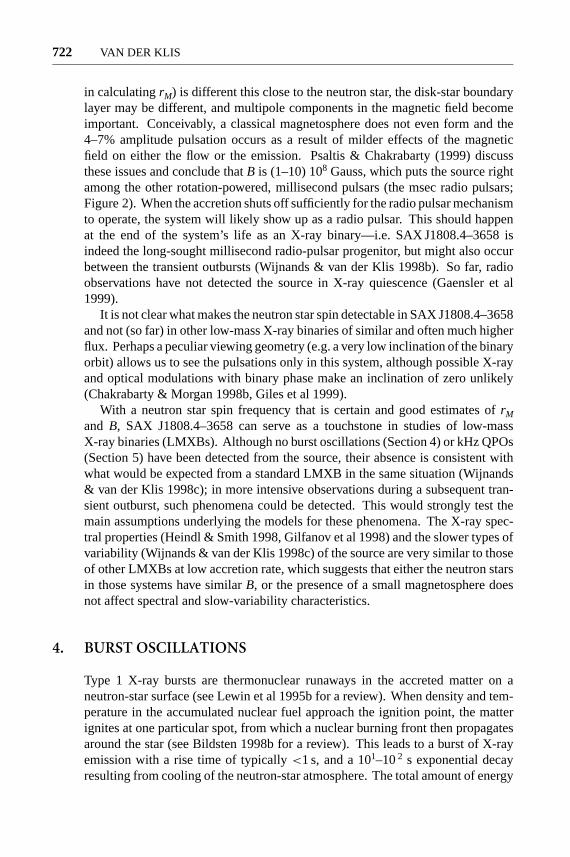
The first incontestable type 1 burst oscillation was discovered with RXTE in aburst that occurred on February 16, 1996, in the reliable burst source 4U 1728–34.An oscillation with a slightly drifting frequency near 363 Hz was evident in a powerspectrum of 32 s of data starting just before the onset of the burst (Strohmayer et al1996a,b,c; Figure 3). The oscillation frequency increased from 362.5 to 363.9 Hzin the course of∼10 s.
Burst oscillations have now been detected in six (perhaps seven) differentsources (Table 1). They do not occur in each burst, and some burst sources have not
Figure 3 Left: A burst profile and its power spectrum (inset) showing a drifting burst oscillationin 4U 1728–34 (Strohmayer et al 1996c).Right: Dynamic power spectra of burst oscillationsin two bursts separated by 1.6 yr in 4U 1728–34 showing near-identical asymptotic frequencies(Strohmayer et al 1998b).
P1: FRD
August 24, 2000 19:41 Annual Reviews AR108-17
724 VAN DER KLIS
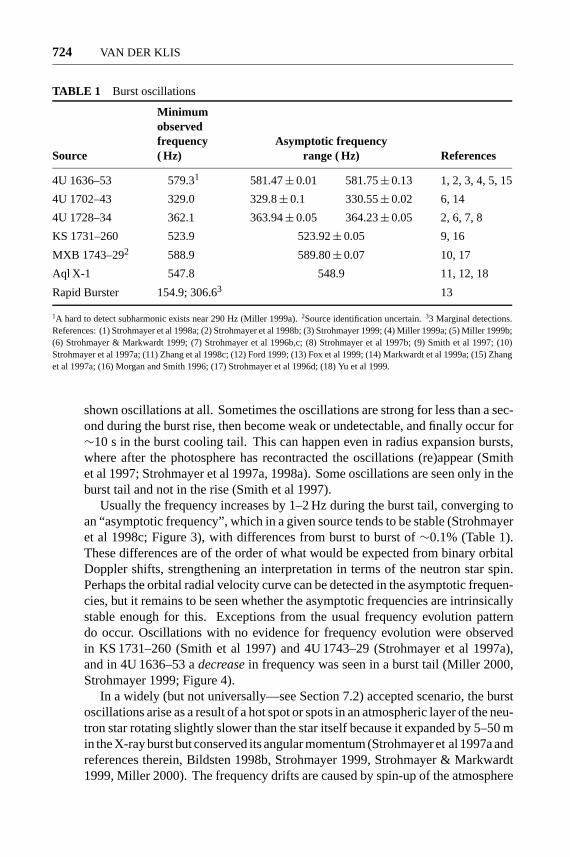
TABLE 1 Burst oscillations
Minimumobservedfrequency Asymptotic frequency
Source ( Hz) range ( Hz) References
4U 1636–53 579.31 581.47± 0.01 581.75± 0.13 1, 2, 3, 4, 5, 15
4U 1702–43 329.0 329.8± 0.1 330.55± 0.02 6, 14
4U 1728–34 362.1 363.94± 0.05 364.23± 0.05 2, 6, 7, 8
KS 1731–260 523.9 523.92± 0.05 9, 16
MXB 1743–292 588.9 589.80± 0.07 10, 17
Aql X-1 547.8 548.9 11, 12, 18
Rapid Burster 154.9; 306.63 13
1A hard to detect subharmonic exists near 290 Hz (Miller 1999a).2Source identification uncertain.33 Marginal detections.References: (1) Strohmayer et al 1998a; (2) Strohmayer et al 1998b; (3) Strohmayer 1999; (4) Miller 1999a; (5) Miller 1999b;(6) Strohmayer & Markwardt 1999; (7) Strohmayer et al 1996b,c; (8) Strohmayer et al 1997b; (9) Smith et al 1997; (10)Strohmayer et al 1997a; (11) Zhang et al 1998c; (12) Ford 1999; (13) Fox et al 1999; (14) Markwardt et al 1999a; (15) Zhanget al 1997a; (16) Morgan and Smith 1996; (17) Strohmayer et al 1996d; (18) Yu et al 1999.
shown oscillations at all. Sometimes the oscillations are strong for less than a sec-ond during the burst rise, then become weak or undetectable, and finally occur for∼10 s in the burst cooling tail. This can happen even in radius expansion bursts,where after the photosphere has recontracted the oscillations (re)appear (Smithet al 1997; Strohmayer et al 1997a, 1998a). Some oscillations are seen only in theburst tail and not in the rise (Smith et al 1997).
Usually the frequency increases by 1–2 Hz during the burst tail, converging toan “asymptotic frequency”, which in a given source tends to be stable (Strohmayeret al 1998c; Figure 3), with differences from burst to burst of∼0.1% (Table 1).These differences are of the order of what would be expected from binary orbitalDoppler shifts, strengthening an interpretation in terms of the neutron star spin.Perhaps the orbital radial velocity curve can be detected in the asymptotic frequen-cies, but it remains to be seen whether the asymptotic frequencies are intrinsicallystable enough for this. Exceptions from the usual frequency evolution patterndo occur. Oscillations with no evidence for frequency evolution were observedin KS 1731–260 (Smith et al 1997) and 4U 1743–29 (Strohmayer et al 1997a),and in 4U 1636–53 adecreasein frequency was seen in a burst tail (Miller 2000,Strohmayer 1999; Figure 4).
In a widely (but not universally—see Section 7.2) accepted scenario, the burstoscillations arise as a result of a hot spot or spots in an atmospheric layer of the neu-tron star rotating slightly slower than the star itself because it expanded by 5–50 min the X-ray burst but conserved its angular momentum (Strohmayer et al 1997a andreferences therein, Bildsten 1998b, Strohmayer 1999, Strohmayer & Markwardt1999, Miller 2000). The frequency drifts are caused by spin-up of the atmosphere
P1: FRD
August 24, 2000 19:41 Annual Reviews AR108-17
MILLISECOND OSCILLATIONS 725
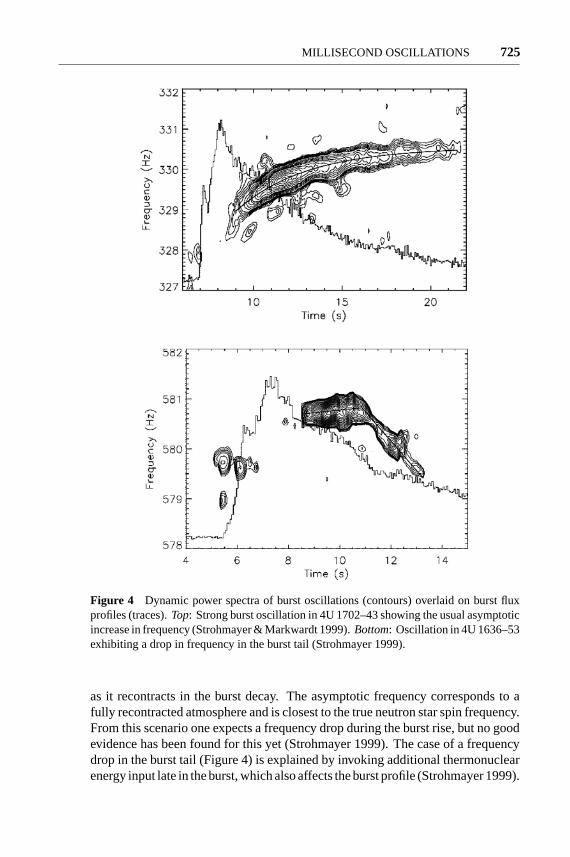
Figure 4 Dynamic power spectra of burst oscillations (contours) overlaid on burst fluxprofiles (traces).Top: Strong burst oscillation in 4U 1702–43 showing the usual asymptoticincrease in frequency (Strohmayer & Markwardt 1999).Bottom: Oscillation in 4U 1636–53exhibiting a drop in frequency in the burst tail (Strohmayer 1999).
as it recontracts in the burst decay. The asymptotic frequency corresponds to afully recontracted atmosphere and is closest to the true neutron star spin frequency.From this scenario one expects a frequency drop during the burst rise, but no goodevidence has been found for this yet (Strohmayer 1999). The case of a frequencydrop in the burst tail (Figure 4) is explained by invoking additional thermonuclearenergy input late in the burst, which also affects the burst profile (Strohmayer 1999).
P1: FRD
August 24, 2000 19:41 Annual Reviews AR108-17
726 VAN DER KLIS
If the oscillations result from a stable pattern in the spinning layer, then it shouldbe possible to describe them as a frequency-modulated, strictly coherent signal.By applying a simple exponential model to the frequency drifts, it is possible toestablish coherences of up to Q∼ 4000 (Strohmayer & Markwardt 1999, see alsoZhang et al 1998c, Smith et al 1997, Miller 1999a, 2000). However, this is still∼20% less than a fully coherent signal of this frequency and duration—i.e. it isnot possible to count the exact number of cycles in the way this can be done ina pulsar. It is possible that exact coherence recovery is feasible for these signals,but current signal-to-noise limits prevent us from accomplishing this because theexact frequency drift ephemeris cannot be found.
The harmonic content of the oscillations is low. In 4U 1636–53 it is just pos-sible, by combining data from the early stages of several bursts, to detect a fre-quency near 290 Hz, which is half the dominant frequency (Miller 1999a, 2000);this suggests that∼290 Hz, not∼580 Hz, is the true spin frequency, and thattwo antipodal hot spots produce the burst oscillation in this source (its kHz peakseparation is∼250 Hz; see Section 5). No harmonics or subharmonics have beenseen in other sources, or in the burst tails of any source (Strohmayer & Markwardt1999), with the possible exception of the marginal detections in the Rapid Burster(Fox et al 1999).
The oscillation amplitudes range from∼50% (rms) of the burst flux early insome bursts to between 2% and 20% (rms) in the tail (for references see Table 1).(Note that sometimes sinusoidal amplitudes—which are a factor
√2 larger than
rms amplitudes—are reported, and that amplitudes are expressed as a fraction ofburst flux, defined as total flux minus the persistent flux before the burst. Earlyin the rise, when burst flux is low compared to total flux, the measured amplitudeis multiplied by a large factor to convert it to burst flux fraction.) In KS 1731–260 (Smith et al 1997) and 4U 1743–29 (Strohmayer et al 1997a) the photonenergy dependence of the oscillations was measured. Above 7 or 8 keV the am-plitude was 9–18%, whereas below that energy it was undetectable at<2–4%.4U 1636–53 shows a slight variation in spectral hardness as a function of oscilla-tion phase (Strohmayer et al 1998c). In Aql X-1 photons below 5.7 keV lag thoseat higher energies by roughly 0.3 msec, which may be caused by Doppler shifts(Ford 1999).
If the burst oscillations result from hot spots on the surface, then their ampli-tude constrains the “compactness” of the neutron star, defined asRG/R, whereR is the star’s radius andRG = GM/c2 is its gravitational radius (Strohmayeret al 1997b, 1998a; Miller & Lamb 1998). The more compact the star, the lowerthe oscillation amplitude, since gravitational light bending increasingly blurs thebeam. In particular, when the oscillations are caused by two antipodal hot spots(cf 4U 1636–53, above, and possibly other sources; see Section 5.5), and the am-plitudes are high, the constraints are strong. The exact bounds on the compactnessdepend on the emission characteristics of the spots; no final conclusions on thecompactness of these stars have been reached yet.
P1: FRD
August 24, 2000 19:41 Annual Reviews AR108-17
MILLISECOND OSCILLATIONS 727
Modeling of the spectral and amplitude evolution of the oscillations through theburst in terms of an expanding, cooling hot spot has been successful (Strohmayeret al 1997b). However, several issues with respect to this attractively simpleinterpretation have yet to be resolved. The presence oftwo burning sites as re-quired by the description in terms of two antipodal hot spots could be related to fuelaccumulation at the magnetic poles (Miller 1999a), but their simultaneous ignitionseems difficult to accomplish, and obviously, in view of the frequency drifts, thesesites must decouple from the magnetic field after ignition. The hot spots mustsurvive the strong shear in layers that, from the observed phase drifts, must re-volve around the star several times during the lifetime of the spots; they must evensurvive during radius-expansion bursts, through episodes where the photospherebecomes at least several times as large as the neutron star (which probably impliesthe roots of the hot spots are below the photospheric layers).
The resolution of these issues ties in with questions such as why only someburst sources show the oscillations, and why only some bursts exhibit them. Thisis hard to explain in a magnetic-pole accumulation scheme because the viewinggeometry of the poles remains the same from burst to burst. Studies of the relationbetween the characteristics of the bursts and the surrounding persistent emissionand presence and character of the burst oscillations could help to shed light onthese various questions.
5. KILOHERTZ QUASI-PERIODIC OSCILLATIONS
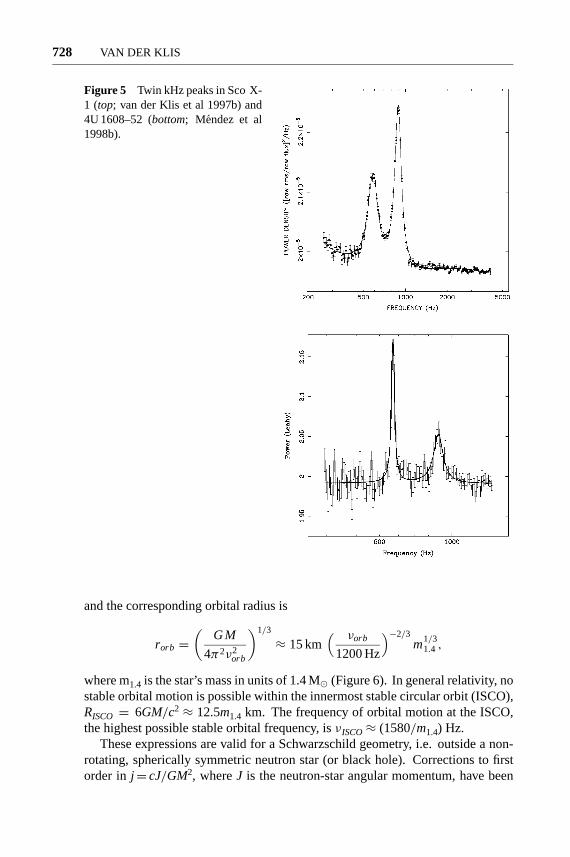
The kilohertz quasi-periodic oscillations (kHz QPOs) were discovered at NASA’sGoddard Space Flight Center in February 1996, just two months after RXTE waslaunched (in Sco X-1: van der Klis et al 1996a,b,c; and 4U 1728–34: Strohmayeret al 1996a,b,c; see van der Klis 1998 for a historical account). Two simultaneousquasi-periodic oscillation peaks (“twin peaks”) in the 300–1300 Hz range androughly 300 Hz apart (Figure 5) occur in the power spectra of low-mass X-raybinaries containing low-magnetic-field neutron stars of widely different X-rayluminosity Lx. The frequency of both peaks usually increases with X-ray flux(Section 5.4). In 4U 1728–34 the separation frequency of the two kHz peaks isclose toνburst (Section 4; Strohmayer et al 1996b,c). This commensurabilityof frequencies provides a powerful argument for a beat-frequency interpretation(Sections 5.1, 5.5, 7.1).
5.1 Orbital and Beat Frequencies
Orbital motion around a neutron star occurs at a frequency of
νorb =(
GM
4π2r 3orb
)1/2
≈ 1200 Hz( rorb
15 km
)−3/2m1/2
1.4 ,
P1: FRD
August 24, 2000 19:41 Annual Reviews AR108-17
728 VAN DER KLIS
Figure 5 Twin kHz peaks in Sco X-1 (top; van der Klis et al 1997b) and4U 1608–52 (bottom; Mendez et al1998b).
and the corresponding orbital radius is
rorb =(
GM
4π2ν2orb
)1/3
≈ 15 km( νorb
1200 Hz
)−2/3m1/3
1.4 ,
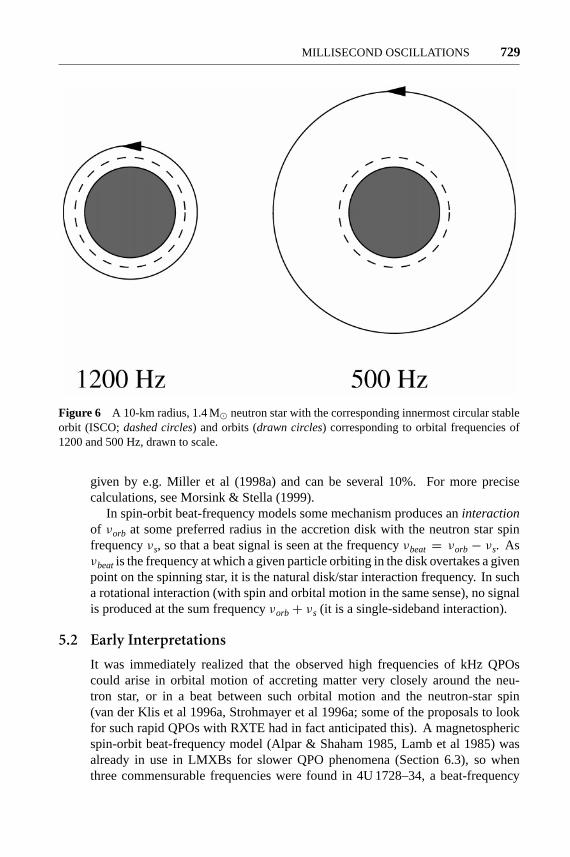
where m1.4 is the star’s mass in units of 1.4 M� (Figure 6). In general relativity, nostable orbital motion is possible within the innermost stable circular orbit (ISCO),RISCO = 6GM/c2 ≈ 12.5m1.4 km. The frequency of orbital motion at the ISCO,the highest possible stable orbital frequency, isν ISCO≈ (1580/m1.4) Hz.
These expressions are valid for a Schwarzschild geometry, i.e. outside a non-rotating, spherically symmetric neutron star (or black hole). Corrections to firstorder in j= cJ/GM2, whereJ is the neutron-star angular momentum, have been
P1: FRD
August 24, 2000 19:41 Annual Reviews AR108-17
MILLISECOND OSCILLATIONS 729
Figure 6 A 10-km radius, 1.4 M� neutron star with the corresponding innermost circular stableorbit (ISCO;dashed circles) and orbits (drawn circles) corresponding to orbital frequencies of1200 and 500 Hz, drawn to scale.
given by e.g. Miller et al (1998a) and can be several 10%. For more precisecalculations, see Morsink & Stella (1999).
In spin-orbit beat-frequency models some mechanism produces aninteractionof νorb at some preferred radius in the accretion disk with the neutron star spinfrequencyνs, so that a beat signal is seen at the frequencyνbeat = νorb− νs. Asνbeatis the frequency at which a given particle orbiting in the disk overtakes a givenpoint on the spinning star, it is the natural disk/star interaction frequency. In sucha rotational interaction (with spin and orbital motion in the same sense), no signalis produced at the sum frequencyνorb+ νs (it is a single-sideband interaction).
5.2 Early Interpretations
It was immediately realized that the observed high frequencies of kHz QPOscould arise in orbital motion of accreting matter very closely around the neu-tron star, or in a beat between such orbital motion and the neutron-star spin(van der Klis et al 1996a, Strohmayer et al 1996a; some of the proposals to lookfor such rapid QPOs with RXTE had in fact anticipated this). A magnetosphericspin-orbit beat-frequency model (Alpar & Shaham 1985, Lamb et al 1985) wasalready in use in LMXBs for slower QPO phenomena (Section 6.3), so whenthree commensurable frequencies were found in 4U 1728–34, a beat-frequency
P1: FRD
August 24, 2000 19:41 Annual Reviews AR108-17
730 VAN DER KLIS
interpretation was immediately proposed (Strohmayer et al 1996c). Let us callν2 the frequency of the higher-frequency peak (the “upper” peak) andν1 thatof the lower-frequency kHz peak (the “lower peak”). Then the beat-frequencyinterpretation asserts thatν2 is νorb at some preferred radius in the disk, andν1 isthe beat frequency betweenν2 andνs, soν1 = νbeat = νorb − νs≈ ν2 − νburst,where the approximate equality follows fromνburst≈ νs (Section 4). The fact thatonly a single sideband is observed is a strong argument for a rotational interac-tion (Section 5.1). Later this was worked out in detail in the form of the “sonicpoint beat-frequency model” by Miller et al (1996, 1998a; Section 7.1), where thepreferred radius is the sonic radius (essentially, the inner edge of the Kepleriandisk).
The beat-frequency interpretation implies that the observed kHz QPO peakseparation1ν = ν2 − ν1 should be equal to the neutron star spin frequencyνs,and should therefore be constant and nearly equal toνburst. As we will see inSection 5.5, it turned out that1ν is not actually exactly constant nor preciselyequal toνburst (in Section 7 we examine how a beat-frequency interpretation coulddeal with this), and this triggered the development of other models for the kHzQPOs. Stella & Vietri (1998) noted that the frequencyνLF of low-frequency QPOs(Section 6.3) in the 15–60 Hz range that had been known in the Z sources since the1980s (cf van der Klis 1995a), and that were being discovered with RXTE in theatoll sources as well, is approximately proportional toν2
2. This triggered a seriesof papers (Stella & Vietri 1998, 1999; Stella et al 1999) describing what is nowcalled the “relativistic precession model”, whereν2 is the orbital frequency at someradius in the disk, andν1 andνLF are frequencies of general-relativistic precessionmodes of a free particle orbit at that radius (Section 7.2). For further discussion ofkHz QPO models see Section 7. With the exception of the photon bubble model(Klein et al 1996b; Section 7.3), all models are based on the interpretation that oneof the kHz QPO frequencies is an orbital frequency in the disk.
5.3 Dependence on Source State and Type
Twenty sources have now1 shown kHz QPOs. Sometimes only one peak is de-tectable, but 18 of these sources have shown two simultaneous kHz peaks; theexceptions with only a single peak are the little-studied XTE J1723–376 andEXO 0748–676. Tables 2 and 3 summarize the results. There is a remarkable sim-ilarity in QPO frequencies and peak separations across a great variety of sources.
At a more detailed level, however, some differences are evident between thedifferent source types. The two main types are the Z sources and the atoll sources(Hasinger & van der Klis 1989; see van der Klis 1989a, 1995a,b for reviews).Z sources are named after the roughly Z-shaped tracks they trace out inX-ray color-color and hardness-intensity diagrams on a timescale of hours to days(Figure 7). They are the most luminous LMXBs, with X-ray luminosity Lx near
11999 October 15.
P1: FRD
August 24, 2000 19:41 Annual Reviews AR108-17
MILLISECOND OSCILLATIONS 731
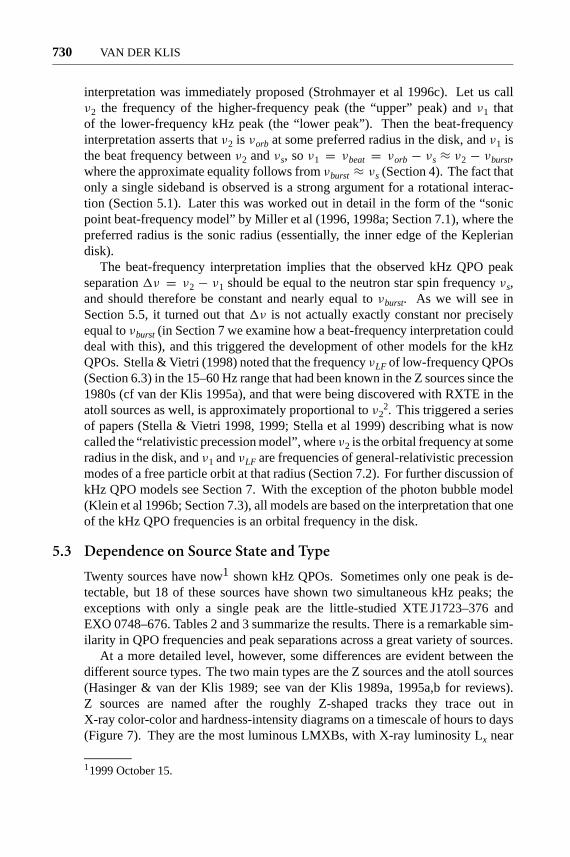
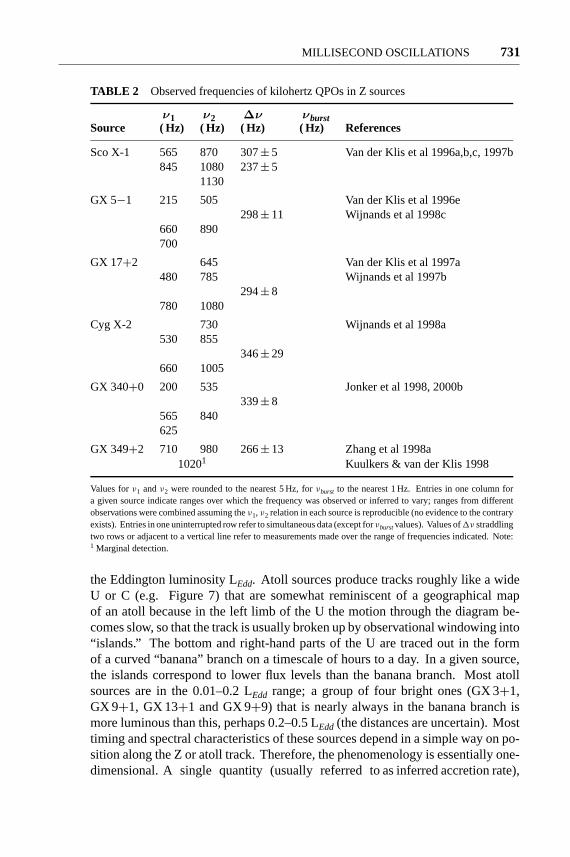
TABLE 2 Observed frequencies of kilohertz QPOs in Z sources
ν1 ν2 ∆ν νburstSource ( Hz) ( Hz) ( Hz) ( Hz) References
Sco X-1 565 870 307± 5 Van der Klis et al 1996a,b,c, 1997b845 1080 237± 5
1130
GX 5−1 215 505 Van der Klis et al 1996e298± 11 Wijnands et al 1998c
660 890700
GX 17+2 645 Van der Klis et al 1997a480 785 Wijnands et al 1997b
294± 8780 1080
Cyg X-2 730 Wijnands et al 1998a530 855
346± 29660 1005
GX 340+0 200 535 Jonker et al 1998, 2000b339± 8
565 840625
GX 349+2 710 980 266± 13 Zhang et al 1998a10201 Kuulkers & van der Klis 1998
Values forν1 andν2 were rounded to the nearest 5 Hz, forνburst to the nearest 1 Hz. Entries in one column fora given source indicate ranges over which the frequency was observed or inferred to vary; ranges from differentobservations were combined assuming theν1, ν2 relation in each source is reproducible (no evidence to the contraryexists). Entries in one uninterrupted row refer to simultaneous data (except forνburstvalues). Values of1ν straddlingtwo rows or adjacent to a vertical line refer to measurements made over the range of frequencies indicated. Note:1 Marginal detection.
the Eddington luminosity LEdd. Atoll sources produce tracks roughly like a wideU or C (e.g. Figure 7) that are somewhat reminiscent of a geographical mapof an atoll because in the left limb of the U the motion through the diagram be-comes slow, so that the track is usually broken up by observational windowing into“islands.” The bottom and right-hand parts of the U are traced out in the formof a curved “banana” branch on a timescale of hours to a day. In a given source,the islands correspond to lower flux levels than the banana branch. Most atollsources are in the 0.01–0.2 LEdd range; a group of four bright ones (GX 3+1,GX 9+1, GX 13+1 and GX 9+9) that is nearly always in the banana branch ismore luminous than this, perhaps 0.2–0.5 LEdd (the distances are uncertain). Mosttiming and spectral characteristics of these sources depend in a simple way on po-sition along the Z or atoll track. Therefore, the phenomenology is essentially one-dimensional. A single quantity (usually referred to as inferred accretion rate),
P1: FRD
August 24, 2000 19:41 Annual Reviews AR108-17
732 VAN DER KLIS
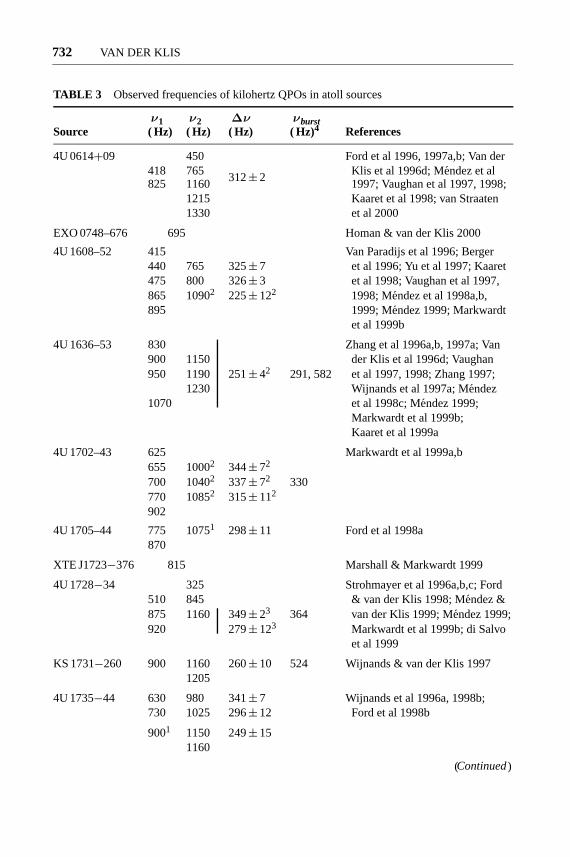
TABLE 3 Observed frequencies of kilohertz QPOs in atoll sources
ν1 ν2 ∆ν νburstSource ( Hz) ( Hz) ( Hz) ( Hz)4 References
4U 0614+09 450 Ford et al 1996, 1997a,b; Van der418 765 Klis et al 1996d; Mendez et al312 ± 2825 1160 1997; Vaughan et al 1997, 1998;
1215 Kaaret et al 1998; van Straaten1330 et al 2000
EXO 0748–676 695 Homan & van der Klis 2000
4U 1608–52 415 Van Paradijs et al 1996; Berger440 765 325 ± 7 et al 1996; Yu et al 1997; Kaaret475 800 326 ± 3 et al 1998; Vaughan et al 1997,865 10902 225 ± 122 1998; Mendez et al 1998a,b,895 1999; Mendez 1999; Markwardt
et al 1999b
4U 1636–53 830 Zhang et al 1996a,b, 1997a; Van900 1150 der Klis et al 1996d; Vaughan950 1190 251 ± 42 291, 582 et al 1997, 1998; Zhang 1997;
1230 Wijnands et al 1997a; Mendez1070 et al 1998c; Mendez 1999;
Markwardt et al 1999b;Kaaret et al 1999a
4U 1702–43 625 Markwardt et al 1999a,b655 10002 344 ± 72
700 10402 337 ± 72 330770 10852 315 ± 112
902
4U 1705–44 775 10751 298 ± 11 Ford et al 1998a870
XTE J1723−376 815 Marshall & Markwardt 1999
4U 1728−34 325 Strohmayer et al 1996a,b,c; Ford510 845 & van der Klis 1998; Mendez &875 1160 349 ± 23 364 van der Klis 1999; Mendez 1999;920 279 ± 123 Markwardt et al 1999b; di Salvo
et al 1999
KS 1731−260 900 1160 260 ± 10 524 Wijnands & van der Klis 19971205
4U 1735−44 630 980 341 ± 7 Wijnands et al 1996a, 1998b;730 1025 296 ± 12 Ford et al 1998b
9001 1150 249 ± 151160
(Continued)
P1: FRD
August 24, 2000 19:41 Annual Reviews AR108-17
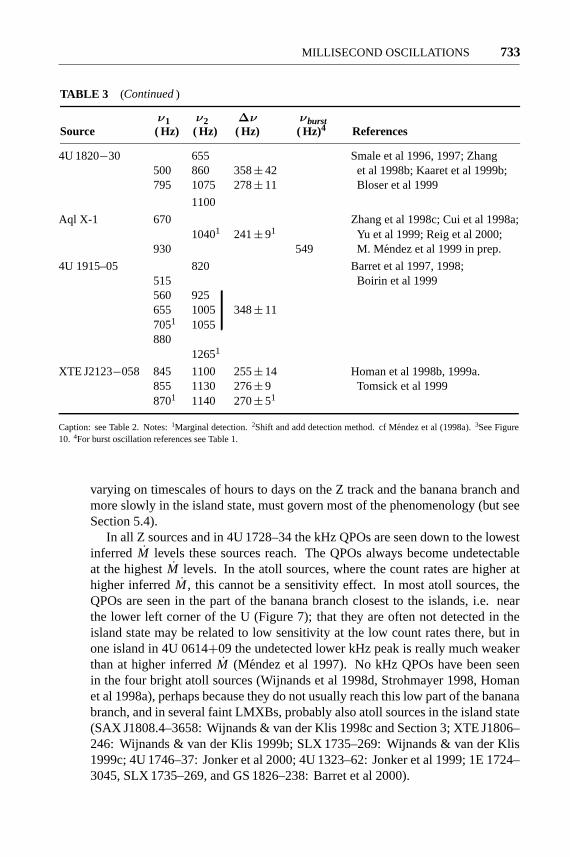
MILLISECOND OSCILLATIONS 733
4U 1820−30 655 Smale et al 1996, 1997; Zhang500 860 358 ± 42 et al 1998b; Kaaret et al 1999b;795 1075 278 ± 11 Bloser et al 1999
1100
Aql X-1 670 Zhang et al 1998c; Cui et al 1998a;10401 241 ± 91 Yu et al 1999; Reig et al 2000;
930 549 M. Mendez et al 1999 in prep.
4U 1915–05 820 Barret et al 1997, 1998;515 Boirin et al 1999560 925655 1005 348 ± 117051 1055880
12651
XTE J2123−058 845 1100 255 ± 14 Homan et al 1998b, 1999a.855 1130 276 ± 9 Tomsick et al 19998701 1140 270 ± 51
Caption: see Table 2. Notes: 1Marginal detection. 2Shift and add detection method. cf Mendez et al (1998a). 3See Figure10. 4For burst oscillation references see Table 1.
TABLE 3 ( )Continued
ν1 ν2 ∆ν νburstSource ( Hz) ( Hz) ( Hz) ( Hz)4 References
varying on timescales of hours to days on the Z track and the banana branch andmore slowly in the island state, must govern most of the phenomenology (but seeSection 5.4).
In all Z sources and in 4U 1728–34 the kHz QPOs are seen down to the lowestinferred M levels these sources reach. The QPOs always become undetectableat the highestM levels. In the atoll sources, where the count rates are higher athigher inferredM , this cannot be a sensitivity effect. In most atoll sources, theQPOs are seen in the part of the banana branch closest to the islands, i.e. nearthe lower left corner of the U (Figure 7); that they are often not detected in theisland state may be related to low sensitivity at the low count rates there, but inone island in 4U 0614+09 the undetected lower kHz peak is really much weakerthan at higher inferredM (Mendez et al 1997). No kHz QPOs have been seenin the four bright atoll sources (Wijnands et al 1998d, Strohmayer 1998, Homanet al 1998a), perhaps because they do not usually reach this low part of the bananabranch, and in several faint LMXBs, probably also atoll sources in the island state(SAX J1808.4–3658: Wijnands & van der Klis 1998c and Section 3; XTE J1806–246: Wijnands & van der Klis 1999b; SLX 1735–269: Wijnands & van der Klis1999c; 4U 1746–37: Jonker et al 2000; 4U 1323–62: Jonker et al 1999; 1E 1724–3045, SLX 1735–269, and GS 1826–238: Barret et al 2000).
P1: FRD
August 24, 2000 19:41 Annual Reviews AR108-17
734 VAN DER KLIS
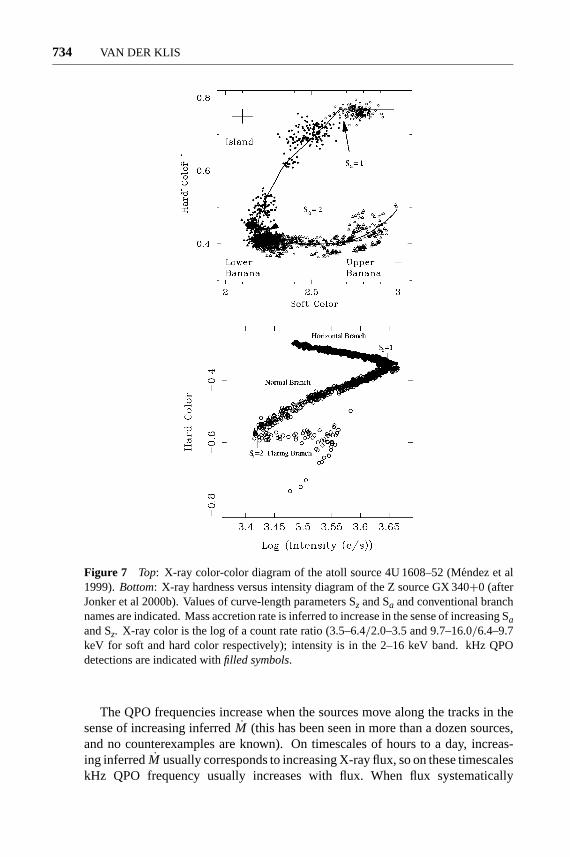
Figure 7 Top: X-ray color-color diagram of the atoll source 4U 1608–52 (M´endez et al1999).Bottom: X-ray hardness versus intensity diagram of the Z source GX 340+0 (afterJonker et al 2000b). Values of curve-length parameters Sz and Sa and conventional branchnames are indicated. Mass accretion rate is inferred to increase in the sense of increasing Saand Sz. X-ray color is the log of a count rate ratio (3.5–6.4/2.0–3.5 and 9.7–16.0/6.4–9.7keV for soft and hard color respectively); intensity is in the 2–16 keV band. kHz QPOdetections are indicated withfilled symbols.
The QPO frequencies increase when the sources move along the tracks in thesense of increasing inferredM (this has been seen in more than a dozen sources,and no counterexamples are known). On timescales of hours to a day, increas-ing inferredM usually corresponds to increasing X-ray flux, so on these timescaleskHz QPO frequency usually increases with flux. When flux systematically
P1: FRD
August 24, 2000 19:41 Annual Reviews AR108-17
MILLISECOND OSCILLATIONS 735
decreases with inferredM , as is the case in some parts of these tracks, the fre-quency is expected to maintain its positive correlation with inferredM and hencebecome anticorrelated to flux, and indeed this has been observed in the Z sourceGX 17+2 (Wijnands et al 1997b).
So, the kHz QPOs fit well within the preexisting Z/atoll description of LMXBphenomenology in terms of source types and states, including the fact that positionon the tracks in X-ray color-color or hardness-intensity diagrams (inferredM ;see Section 5.4), and not X-ray flux, drives the phenomenology.
5.4 Dependence of QPO Frequency on Luminosityand Spectrum
Kilohertz QPOs occur at similar frequency in sources that differ in X-ray luminos-ity Lx by more than 2 orders of magnitude, and the kHz QPO frequencyν seemsto be determined more by the difference between average and instantaneousLx ofa source than byLx itself (van der Klis 1997, 1998, see also Zhang et al 1997b).In a plot ofν versus Lx (defined as 4πd2 fx with fx the X-ray flux andd the dis-tance; Ford et al 2000; Figure 8) a series of roughly parallel lines is seen, to firstorder one line per source (but see later in this section). In each source there is adefinite relation between Lx andν, but the same relation does not apply in anothersource with a different average Lx. Instead, that source covers the sameν-rangearoundits particular average Lx. This is unexplained, and must mean that in ad-dition to instantaneous Lx, another parameter, related to average Lx, affects theQPO frequency (van der Klis 1997, 1998). Perhaps this parameter is the neutronstar magnetic field strength, which previously, on other grounds, was hypothe-sized to correlate to average Lx (Hasinger & van der Klis 1989, Psaltis & Lamb1998, Konar & Bhattacharya 1999; see also Lai 1998), but other possibilities exist(van der Klis 1998, Ford et al 2000).
A similar pattern of parallel lines, but on a much smaller scale, occurs in someindividual sources. When observed at different epochs, a source produces differentfrequency versus flux tracks that are approximately parallel (GX 5–1: Wijnandset al 1998c; GX 340+0: Jonker et al 1998; 4U 0614+09: Ford et al 1997a,b,Mendez et al 1997, van Straaten et al 2000; 4U 1608–52: Yu et al 1997, M´endezet al 1998a, 1999; 4U 1636–53: M´endez 1999; 4U 1728–34: M´endez & van derKlis 1999; 4U 1820–30: Kaaret et al 1999b; Aql X-1: Zhang et al 1998c, Reiget al 2000; Figures 8 and 9). This is most likely another aspect of the well-known fact (e.g. van der Klis et al 1990; Hasinger et al 1990; Kuulker et al1994, 1996; van der Klis 1994a, 1995a) that while the properties of timing phe-nomena such as QPOs are well correlated with one another and with X-ray spec-tral shapeas diagnosed by X-ray colors (and hence with position in tracks incolor-color diagrams), theflux correlates well to these diagnostics only on short(hours to days) timescales and much less well on longer timescales. This iswhy color-color diagrams, independent of flux, are popular for parameterizingspectral variability in these sources. Like other timing parameters, kHz QPO
P1: FRD
August 24, 2000 19:41 Annual Reviews AR108-17
736 VAN DER KLIS
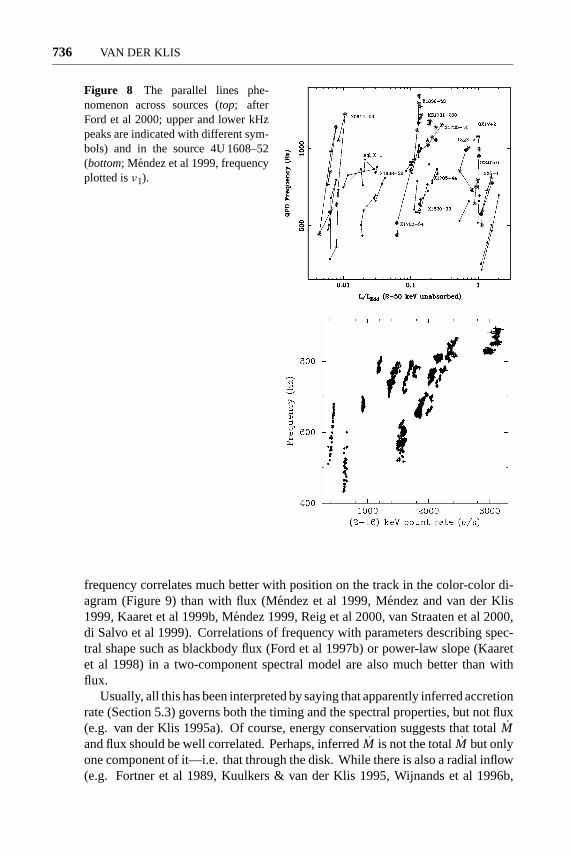
Figure 8 The parallel lines phe-nomenon across sources (top; afterFord et al 2000; upper and lower kHzpeaks are indicated with different sym-bols) and in the source 4U 1608–52(bottom; Mendez et al 1999, frequencyplotted isν1).
frequency correlates much better with position on the track in the color-color di-agram (Figure 9) than with flux (M´endez et al 1999, M´endez and van der Klis1999, Kaaret et al 1999b, M´endez 1999, Reig et al 2000, van Straaten et al 2000,di Salvo et al 1999). Correlations of frequency with parameters describing spec-tral shape such as blackbody flux (Ford et al 1997b) or power-law slope (Kaaretet al 1998) in a two-component spectral model are also much better than withflux.
Usually, all this has been interpreted by saying that apparently inferred accretionrate (Section 5.3) governs both the timing and the spectral properties, but not flux(e.g. van der Klis 1995a). Of course, energy conservation suggests that totalMand flux should be well correlated. Perhaps, inferredM is not the totalM but onlyone component of it—i.e. that through the disk. While there is also a radial inflow(e.g. Fortner et al 1989, Kuulkers & van der Klis 1995, Wijnands et al 1996b,
P1: FRD
August 24, 2000 19:41 Annual Reviews AR108-17
MILLISECOND OSCILLATIONS 737
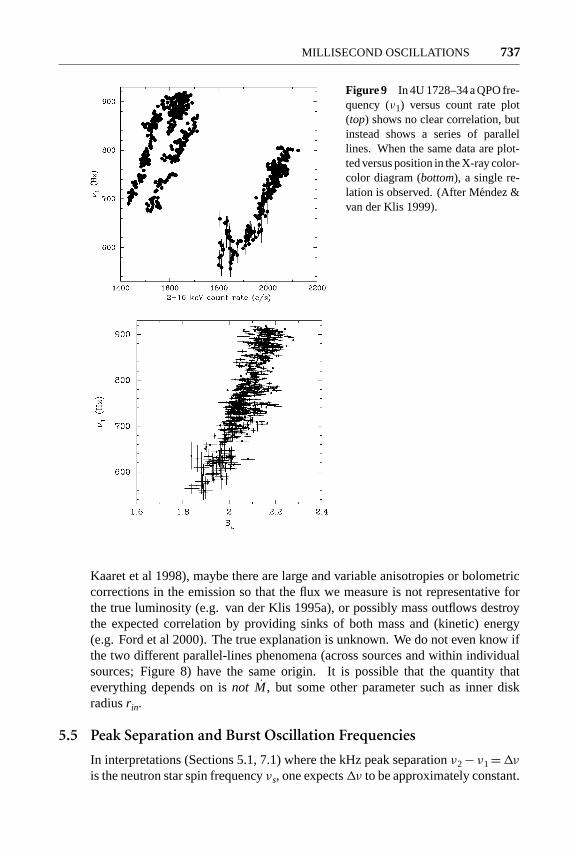
Figure 9 In 4U 1728–34 a QPO fre-quency (ν1) versus count rate plot(top) shows no clear correlation, butinstead shows a series of parallellines. When the same data are plot-ted versus position in the X-ray color-color diagram (bottom), a single re-lation is observed. (After M´endez &van der Klis 1999).
Kaaret et al 1998), maybe there are large and variable anisotropies or bolometriccorrections in the emission so that the flux we measure is not representative forthe true luminosity (e.g. van der Klis 1995a), or possibly mass outflows destroythe expected correlation by providing sinks of both mass and (kinetic) energy(e.g. Ford et al 2000). The true explanation is unknown. We do not even know ifthe two different parallel-lines phenomena (across sources and within individualsources; Figure 8) have the same origin. It is possible that the quantity thateverything depends on isnot M , but some other parameter such as inner diskradiusrin.
5.5 Peak Separation and Burst Oscillation Frequencies
In interpretations (Sections 5.1, 7.1) where the kHz peak separationν2− ν1=1νis the neutron star spin frequencyνs, one expects1ν to be approximately constant.
P1: FRD
August 24, 2000 19:41 Annual Reviews AR108-17
738 VAN DER KLIS
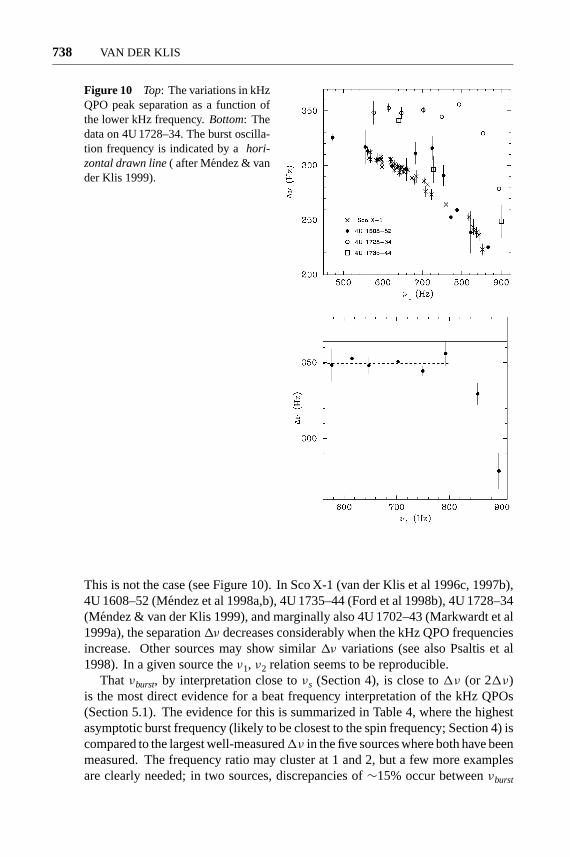
Figure 10 Top: The variations in kHzQPO peak separation as a function ofthe lower kHz frequency.Bottom: Thedata on 4U 1728–34. The burst oscilla-tion frequency is indicated by ahori-zontal drawn line( after Mendez & vander Klis 1999).
This is not the case (see Figure 10). In Sco X-1 (van der Klis et al 1996c, 1997b),4U 1608–52 (Mendez et al 1998a,b), 4U 1735–44 (Ford et al 1998b), 4U 1728–34(Mendez & van der Klis 1999), and marginally also 4U 1702–43 (Markwardt et al1999a), the separation1ν decreases considerably when the kHz QPO frequenciesincrease. Other sources may show similar1ν variations (see also Psaltis et al1998). In a given source theν1, ν2 relation seems to be reproducible.
That νburst, by interpretation close toνs (Section 4), is close to1ν (or 21ν)is the most direct evidence for a beat frequency interpretation of the kHz QPOs(Section 5.1). The evidence for this is summarized in Table 4, where the highestasymptotic burst frequency (likely to be closest to the spin frequency; Section 4) iscompared to the largest well-measured1ν in the five sources where both have beenmeasured. The frequency ratio may cluster at 1 and 2, but a few more examplesare clearly needed; in two sources, discrepancies of∼15% occur betweenνburst
P1: FRD
August 24, 2000 19:41 Annual Reviews AR108-17
MILLISECOND OSCILLATIONS 739
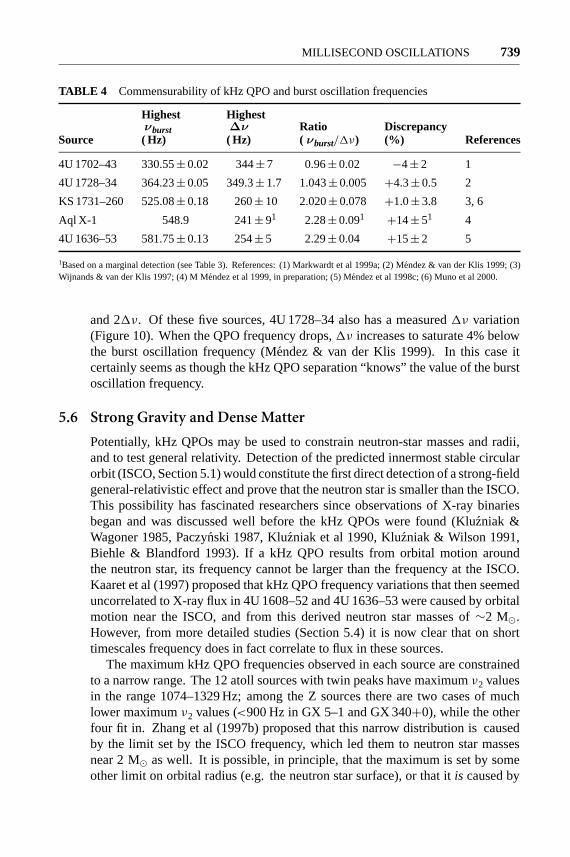
TABLE 4 Commensurability of kHz QPO and burst oscillation frequencies
Highest Highestνburst ∆ν Ratio Discrepancy
Source ( Hz) ( Hz) (νburst/1ν) (%) References
4U 1702–43 330.55± 0.02 344± 7 0.96± 0.02 −4± 2 1
4U 1728–34 364.23± 0.05 349.3± 1.7 1.043± 0.005 +4.3± 0.5 2
KS 1731–260 525.08± 0.18 260± 10 2.020± 0.078 +1.0± 3.8 3, 6
Aql X-1 548.9 241± 91 2.28± 0.091 +14± 51 4
4U 1636–53 581.75± 0.13 254± 5 2.29± 0.04 +15± 2 5
1Based on a marginal detection (see Table 3). References: (1) Markwardt et al 1999a; (2) M´endez & van der Klis 1999; (3)Wijnands & van der Klis 1997; (4) M M´endez et al 1999, in preparation; (5) M´endez et al 1998c; (6) Muno et al 2000.
and 21ν. Of these five sources, 4U 1728–34 also has a measured1ν variation(Figure 10). When the QPO frequency drops,1ν increases to saturate 4% belowthe burst oscillation frequency (M´endez & van der Klis 1999). In this case itcertainly seems as though the kHz QPO separation “knows” the value of the burstoscillation frequency.
5.6 Strong Gravity and Dense Matter
Potentially, kHz QPOs may be used to constrain neutron-star masses and radii,and to test general relativity. Detection of the predicted innermost stable circularorbit (ISCO, Section 5.1) would constitute the first direct detection of a strong-fieldgeneral-relativistic effect and prove that the neutron star is smaller than the ISCO.This possibility has fascinated researchers since observations of X-ray binariesbegan and was discussed well before the kHz QPOs were found (Klu´zniak &Wagoner 1985, Paczy´nski 1987, Kluzniak et al 1990, Klu´zniak & Wilson 1991,Biehle & Blandford 1993). If a kHz QPO results from orbital motion aroundthe neutron star, its frequency cannot be larger than the frequency at the ISCO.Kaaret et al (1997) proposed that kHz QPO frequency variations that then seemeduncorrelated to X-ray flux in 4U 1608–52 and 4U 1636–53 were caused by orbitalmotion near the ISCO, and from this derived neutron star masses of∼2 M�.However, from more detailed studies (Section 5.4) it is now clear that on shorttimescales frequency does in fact correlate to flux in these sources.
The maximum kHz QPO frequencies observed in each source are constrainedto a narrow range. The 12 atoll sources with twin peaks have maximumν2 valuesin the range 1074–1329 Hz; among the Z sources there are two cases of muchlower maximumν2 values (<900 Hz in GX 5–1 and GX 340+0), while the otherfour fit in. Zhang et al (1997b) proposed that this narrow distribution is causedby the limit set by the ISCO frequency, which led them to neutron star massesnear 2 M� as well. It is possible, in principle, that the maximum is set by someother limit on orbital radius (e.g. the neutron star surface), or that itis caused by
P1: FRD
August 24, 2000 19:41 Annual Reviews AR108-17
740 VAN DER KLIS
the ISCO but that the frequency we observe is not orbital, in which cases no massestimate can be made.
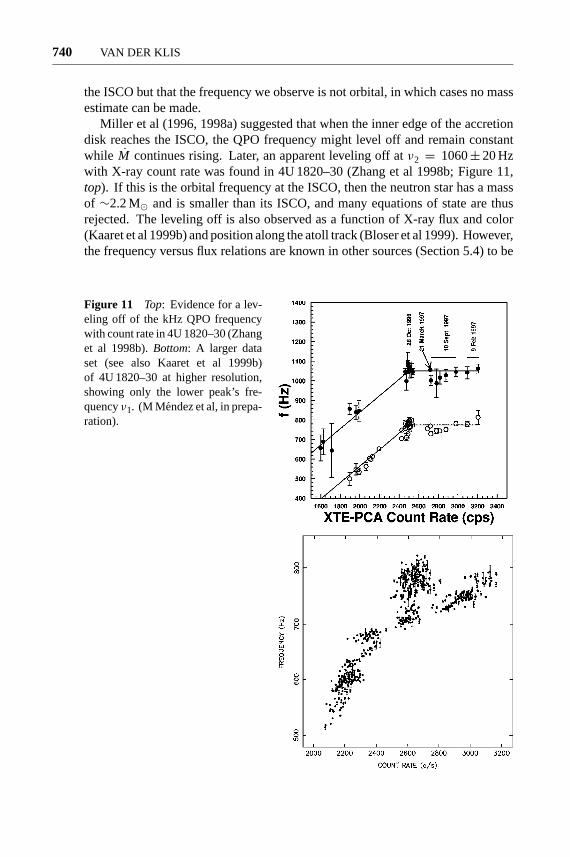
Miller et al (1996, 1998a) suggested that when the inner edge of the accretiondisk reaches the ISCO, the QPO frequency might level off and remain constantwhile M continues rising. Later, an apparent leveling off atν2 = 1060± 20 Hzwith X-ray count rate was found in 4U 1820–30 (Zhang et al 1998b; Figure 11,top). If this is the orbital frequency at the ISCO, then the neutron star has a massof ∼2.2 M� and is smaller than its ISCO, and many equations of state are thusrejected. The leveling off is also observed as a function of X-ray flux and color(Kaaret et al 1999b) and position along the atoll track (Bloser et al 1999). However,the frequency versus flux relations are known in other sources (Section 5.4) to be
Figure 11 Top: Evidence for a lev-eling off of the kHz QPO frequencywith count rate in 4U 1820–30 (Zhanget al 1998b).Bottom: A larger dataset (see also Kaaret et al 1999b)of 4U 1820–30 at higher resolution,showing only the lower peak’s fre-quencyν1. (M Mendez et al, in prepa-ration).
P1: FRD
August 24, 2000 19:41 Annual Reviews AR108-17
MILLISECOND OSCILLATIONS 741
variable, and in 4U 1820–30 the leveling off seems not to be reproduced in thesame way in all data sets (M M´endez et al, in preparation; Figure 11,bottom). Itmay also be more gradual in nature than was originally suggested. No evidence fora similar saturation in frequency was seen in other sources, and most reach higherfrequencies. It is possible that the unique aspects of the 4U 1820–30 system arerelated to this (it is an 11-min binary in a globular cluster with probably a pure Hecompanion star; Stella et al 1987a).
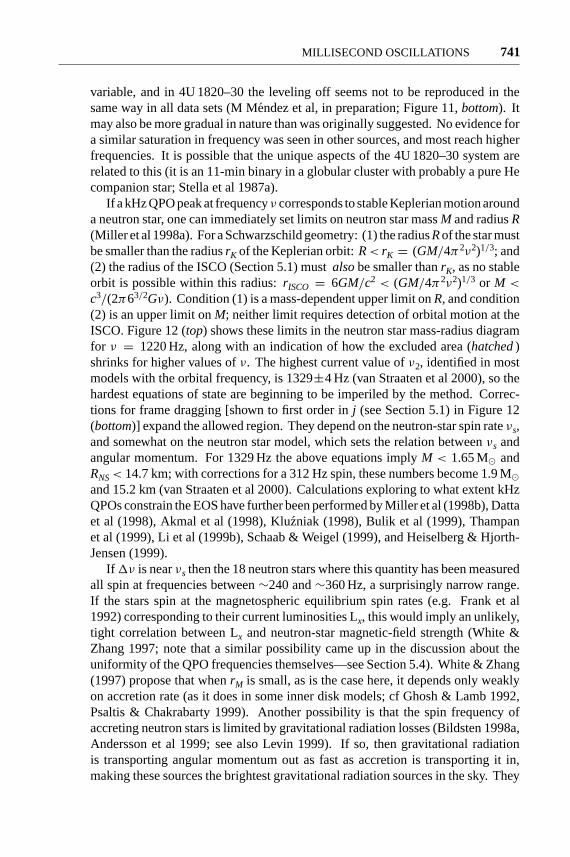
If a kHz QPO peak at frequencyν corresponds to stable Keplerian motion arounda neutron star, one can immediately set limits on neutron star massM and radiusR(Miller et al 1998a). For a Schwarzschild geometry: (1) the radiusRof the star mustbe smaller than the radiusrK of the Keplerian orbit:R< rK = (GM/4π2ν2)1/3; and(2) the radius of the ISCO (Section 5.1) mustalsobe smaller thanrK, as no stableorbit is possible within this radius:rISCO = 6GM/c2 < (GM/4π2ν2)1/3 or M <
c3/(2π63/2Gν). Condition (1) is a mass-dependent upper limit onR, and condition(2) is an upper limit onM; neither limit requires detection of orbital motion at theISCO. Figure 12 (top) shows these limits in the neutron star mass-radius diagramfor ν = 1220 Hz, along with an indication of how the excluded area (hatched)shrinks for higher values ofν. The highest current value ofν2, identified in mostmodels with the orbital frequency, is 1329±4 Hz (van Straaten et al 2000), so thehardest equations of state are beginning to be imperiled by the method. Correc-tions for frame dragging [shown to first order inj (see Section 5.1) in Figure 12(bottom)] expand the allowed region. They depend on the neutron-star spin rateνs,and somewhat on the neutron star model, which sets the relation betweenνs andangular momentum. For 1329 Hz the above equations implyM < 1.65 M� andRNS< 14.7 km; with corrections for a 312 Hz spin, these numbers become 1.9 M�and 15.2 km (van Straaten et al 2000). Calculations exploring to what extent kHzQPOs constrain the EOS have further been performed by Miller et al (1998b), Dattaet al (1998), Akmal et al (1998), Klu´zniak (1998), Bulik et al (1999), Thampanet al (1999), Li et al (1999b), Schaab & Weigel (1999), and Heiselberg & Hjorth-Jensen (1999).
If 1ν is nearνs then the 18 neutron stars where this quantity has been measuredall spin at frequencies between∼240 and∼360 Hz, a surprisingly narrow range.If the stars spin at the magnetospheric equilibrium spin rates (e.g. Frank et al1992) corresponding to their current luminosities Lx, this would imply an unlikely,tight correlation between Lx and neutron-star magnetic-field strength (White &Zhang 1997; note that a similar possibility came up in the discussion about theuniformity of the QPO frequencies themselves—see Section 5.4). White & Zhang(1997) propose that whenrM is small, as is the case here, it depends only weaklyon accretion rate (as it does in some inner disk models; cf Ghosh & Lamb 1992,Psaltis & Chakrabarty 1999). Another possibility is that the spin frequency ofaccreting neutron stars is limited by gravitational radiation losses (Bildsten 1998a,Andersson et al 1999; see also Levin 1999). If so, then gravitational radiationis transporting angular momentum out as fast as accretion is transporting it in,making these sources the brightest gravitational radiation sources in the sky. They
P1: FRD
August 24, 2000 19:41 Annual Reviews AR108-17
742 VAN DER KLIS
Figure 12 Constraints on the massand radius of neutron stars from thedetection of orbital motion with thefrequencies indicated. Graphs are fornegligible neutron star angular mo-mentum (top) and for the values ofj= cJ/GM2 (see Section 5) indicated(bottom). Mass-radius relations forsome representative EOSs are shown(Miller et al 1998a).
would produce a periodic signature at the neutron star spin frequency, which wouldfacilitate their detection.
5.7 Other Kilohertz QPO Properties
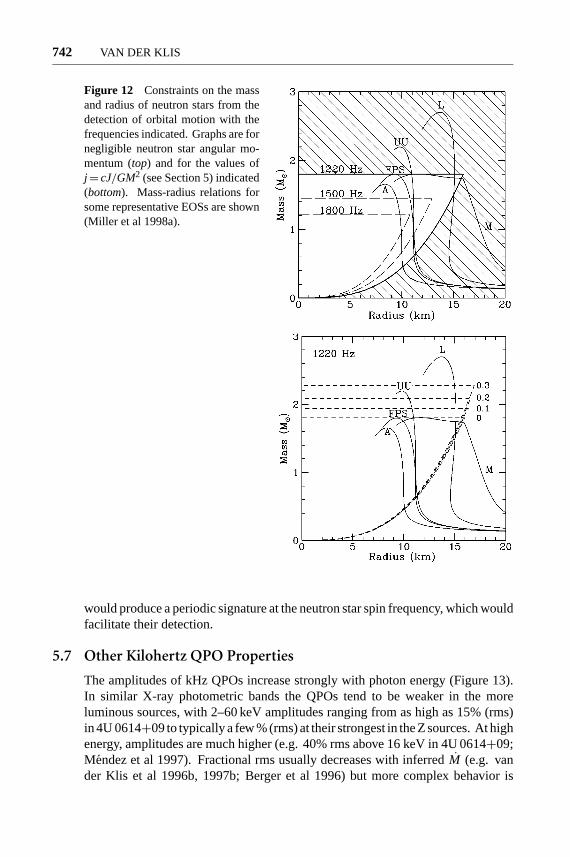
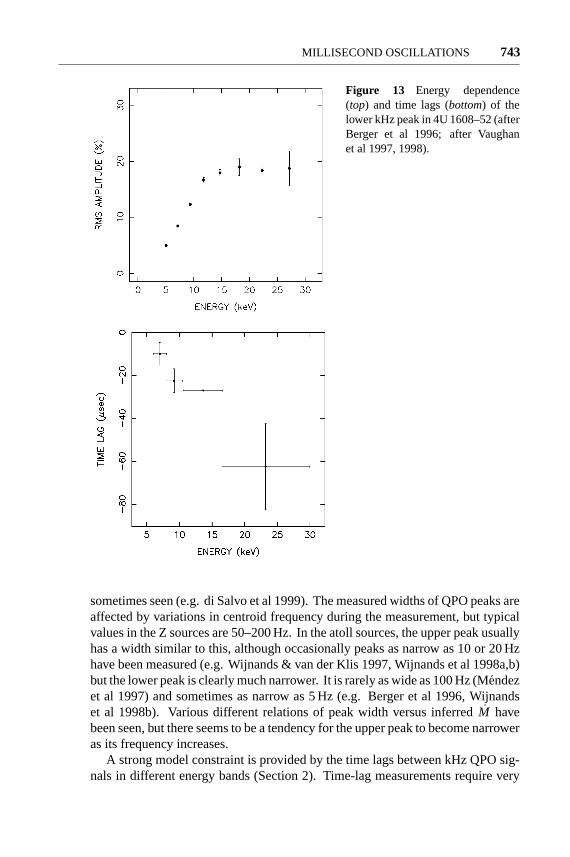
The amplitudes of kHz QPOs increase strongly with photon energy (Figure 13).In similar X-ray photometric bands the QPOs tend to be weaker in the moreluminous sources, with 2–60 keV amplitudes ranging from as high as 15% (rms)in 4U 0614+09 to typically a few % (rms) at their strongest in the Z sources. At highenergy, amplitudes are much higher (e.g. 40% rms above 16 keV in 4U 0614+09;Mendez et al 1997). Fractional rms usually decreases with inferredM (e.g. vander Klis et al 1996b, 1997b; Berger et al 1996) but more complex behavior is
P1: FRD
August 24, 2000 19:41 Annual Reviews AR108-17
MILLISECOND OSCILLATIONS 743
Figure 13 Energy dependence(top) and time lags (bottom) of thelower kHz peak in 4U 1608–52 (afterBerger et al 1996; after Vaughanet al 1997, 1998).
sometimes seen (e.g. di Salvo et al 1999). The measured widths of QPO peaks areaffected by variations in centroid frequency during the measurement, but typicalvalues in the Z sources are 50–200 Hz. In the atoll sources, the upper peak usuallyhas a width similar to this, although occasionally peaks as narrow as 10 or 20 Hzhave been measured (e.g. Wijnands & van der Klis 1997, Wijnands et al 1998a,b)but the lower peak is clearly much narrower. It is rarely as wide as 100 Hz (M´endezet al 1997) and sometimes as narrow as 5 Hz (e.g. Berger et al 1996, Wijnandset al 1998b). Various different relations of peak width versus inferredM havebeen seen, but there seems to be a tendency for the upper peak to become narroweras its frequency increases.
A strong model constraint is provided by the time lags between kHz QPO sig-nals in different energy bands (Section 2). Time-lag measurements require very
P1: FRD
August 24, 2000 19:41 Annual Reviews AR108-17
744 VAN DER KLIS
high signal-to-noise ratios (Vaughan et al 1997), and have mostly been made inthe very significant lower peaks observed in some atoll sources. Finite lags of10–60µsec occur in these peaks (Vaugan et al 1997, 1998; Kaaret et al 1999a;Markwardt et al 1999b; see Lee & Miller 1998 for a calculation of Comptoniza-tion lags relevant to kHz QPOs). Contrary to the initial report, the low-energyphotons lag the high-energy ones (these are soft lags) by increasing amountsas the photon energy increases (Figure 13). The lags are of opposite sign tothose expected from the inverse Compton scattering thought to produce the hardspectral tails of these sources (e.g. Barret & Vedrenne 1994), and correspondto light travel distances of only 3–20 km. From this it seems more likely thatthe lags originate in the QPO production mechanism than in propagation delays.Markwardt et al (1999b) reported a possible hard lag in an atoll-source upperpeak.
6. CORRELATIONS WITH LOW-FREQUENCY TIMINGPHENOMENA AND WITH OTHER SOURCES
6.1 Black-Hole Candidates
The only oscillations with frequencies exceeding 102.5Hz (Section 1) known inblack-hole candidates (BHCs) are, marginally, the 100–300 Hz oscillations inGRO J1655–40 and XTE J1550–564, and those reported very recently in Cyg X-1and 4U 1630–47. An oscillation near 67 Hz observed in GRS 1915+105 is usu-ally discussed together with these QPOs, although it is not clear that it is related.Usually, the phenomenology accompanying these high-frequency QPOs (spectralvariations, lower-frequency variations) is complex.
The 67 Hz QPO in GRS 1915+105 (Morgan et al 1997, Remillard & Morgan1998) varies by only a few percent in frequency when the X-ray flux varies by afactor of several. It is relatively coherent, with Q usually around 20 (but sometimesdropping to 6; Remillard et al 1999a); it has an rms amplitude of about 1%, andthe signal at high photon energy lags that at lower energy by up to 2.3 radians(Cui 1999). The 300 Hz QPO in GRO J1655–40 (Remillard et al 1999b) was seenonly when the X-ray spectrum was dominated by a hard power-law component.This feature was relatively broad (Q∼ 4) and weak (0.8% rms), and did not varyin frequency by more than∼30 Hz. The 185–285 Hz QPO in XTE J1550–564(Remillard et al 1999c) shows considerable variations in frequency (Homan et al1999b, Remillard et al 1999c). It is seen in X-ray spectral conditions similar tothose in which the 300 Hz QPO is observed in GRO J1655–40, and has similarlylow amplitudes and 3< Q < 10. Recent reports indicate that QPOs in thisfrequency range may also occur in Cyg X-1 and 4U 1630–47 (Remillard 1999,Remillard & Morgan 1999).
The fact that the 300 Hz and 67 Hz oscillations were constant in frequency(which is different from anything then known to occur in neutron stars) triggered
P1: FRD
August 24, 2000 19:41 Annual Reviews AR108-17
MILLISECOND OSCILLATIONS 745
interpretations in which these frequencies depend mostly on black-hole mass andangular momentum and only weakly on luminosity—for example, orbital motionat the ISCO (Morgan et al 1997), Lense-Thirring precession there (Cui et al 1998c;see also Merloni et al 1999) or trapped-mode disk oscillations (Nowak et al 1997).However, the variations in frequency of the QPO in XTE J1550–564 have castsome doubt on the applicability of such models.
As is well known, strong similarities exist with respect to many spectral andtiming phenomena between low-magnetic-field neutron stars and BHCs (e.g. vander Klis 1994a,b; Section 6.3). While the 100–300 Hz oscillations may be relatedto the kHz QPOs observed in neutron stars (Psaltis et al 1999a; see Section 6.3),there could also be a relation with the recently reported relatively stable QPOpeaks near 100 Hz in 4U 0614+09 and 4U 1728–34 (van Straaten et al 2000, diSalvo et al 1999), which are clearly distinct from kHz QPOs. More work towardclearing up the exact phenomenology, along with more observations of black-holetransients leading to more examples of high frequency QPOs, are clearly needed.
6.2 Cen X-3
The detection of QPO features near 330 Hz and 760 Hz in the 4.8 s accreting pulsarCen X-3 was recently reported by Jernigan et al (2000). This is the first report ofmillisecond oscillations from a high-magnetic-field (∼1012 Gauss) neutron star.The QPO features are quite weak. Jernigan et al (2000) carefully discuss theinstrumental effects, which are a concern at these low power levels, and interprettheir results in terms of the photon bubble model (Section 7.3).
6.3 Low-Frequency Phenomena
Low-frequency (<100 Hz) QPOs have been studied in accreting neutron starsand black hole candidates since the 1980s, mostly with the EXOSAT and Gingasatellites (see van der Klis 1995a). Two different ones were known in the Z sources:the 6–20 Hz so-called normal and flaring-branch oscillation (NBO; Middleditch &Priedhorsky 1986) and the 15–60 Hz so-called horizontal branch oscillation (HBO;van der Klis et al 1985). The frequency of the HBO turned out to correlate well withthose of the kHz QPOs (Figure 15; van der Klis et al 1997b; Wijnands et al 1997b,1998a,c; Jonker et al 1998, 2000b), and the same is true for the NBO in Sco X-1(van der Klis et al 1996b). Broad power-spectral bumps and, rarely, low-frequencyQPOs were known in atoll sources as well (Lewin et al 1987, Stella et al 1987b,Hasinger & van der Klis 1989, Dotani et al 1989, Makishima et al 1989, Yoshidaet al 1993). With RXTE, QPOs similar to HBO are often seen (Strohmayer et al1996b, Wijnands & van der Klis 1997, Wijnands et al 1998b, Homan et al 1998a)and their frequencies also correlate well to kHz QPO frequency (Figure 15; Stella& Vietri 1998, Ford & van der Klis 1998, Markwardt et al 1999a, van Straatenet al 2000, di Salvo et al 1999, Boirin et al 1999). It is not certain yet whetherthese atoll QPOs are physically the same, as HBO in Z sources, but this seemslikely.
P1: FRD
August 24, 2000 19:41 Annual Reviews AR108-17
746 VAN DER KLIS
It is possible that these correlations arise just because all QPO phenomenadepend on a common parameter (e.g. inferredM , Section 5.4), but Stella &Vietri (1998) proposed that their origin is a physical dependence of the frequen-cies on one another (Section 7.2). In their relativistic precession model the HBOand the similar-frequency QPOs in the atoll sourcesare the same phenomenon,and their frequencyνLF is predicted to be proportional toν2
2. This is indeed ap-proximately true in all Z sources except Sco X-1 (Psaltis et al 1999b), as well as inthe atoll sources (references above). Psaltis et al (1999b) argue that a combinationof the sonic-point and magnetospheric beat-frequency models can explain thesecorrelations as well (Section 7.1).
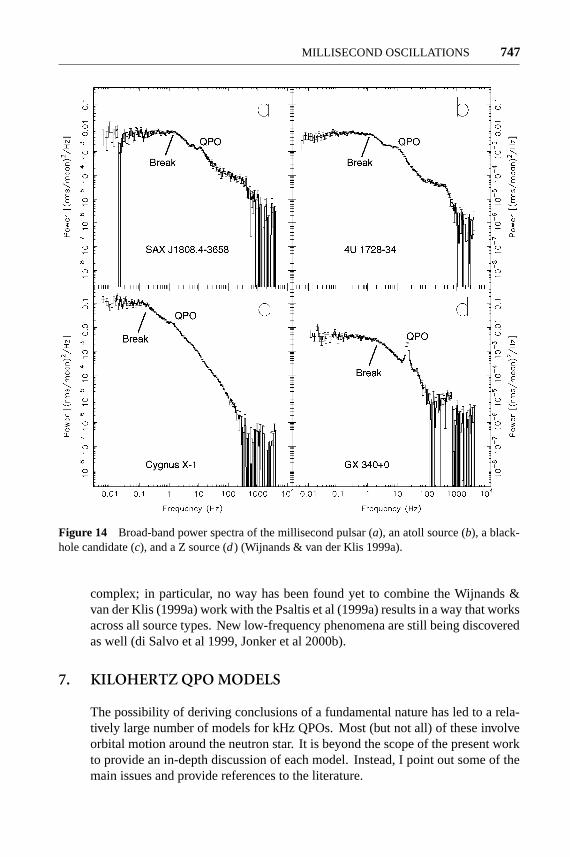
Additional intriguing correlations exist between kHz QPOs and low-frequencyphenomena that may link neutron stars and BHCs. It is useful to first exam-ine a correlation between two low-frequency phenomena. At lowM , BHCs andatoll sources (van der Klis 1994a and references therein), the millisecond pulsarSAX J1808.4-3658 (Section 3; Wijnands & van der Klis 1998c), and perhapseven Z sources have very similar power spectra (Figure 14; Wijnands & van derKlis 1999a), with a broad-noise component that shows a break at low frequencyand often a QPO-like feature above the break. Break and QPO frequency bothvary in excellent correlation (Figure 15,top), and in a similar way in neutronstars and BHCs. This suggests that (with the possible exception of the Z sources,which are slightly off the main relation) these two phenomena are the same inneutron stars and black holes. This would exclude spin-orbit beat-frequencymodels and any other models requiring a material surface, an event horizon, amagnetic field, or their absence, and would essentially imply that the phenom-ena are generated in the accretion disk aroundany low-magnetic field compactobject.
In combination with these low-frequency correlations, the good correlationsbetween kHz QPOs and low-frequency phenomena in Z and atoll sources thensuggest that kHz QPOs might also fit in with schemes linking neutron stars andBHCs (Section 6.1). However, no twin kHz QPOs have been reported from BHCs.Psaltis et al (1999a) pointed out that many Z and atoll sources, the peculiar sourceCir X-1, and a few low-luminosity neutron stars and BHCs sometimes show twoQPO or broad-noise phenomena whose centroid frequencies, when plotted ver-sus each other, seem to line up (Figure 15,bottom). This suggests that perhaps“kHz QPOs”dooccur in BHCs, but as features at frequencies below 50 Hz. Thesefeatures have very low Q, and although the data are suggestive, they are not con-clusive. The implication would be that the lower kHz QPO peak (whose frequencyis the one that lines up with those seen in the BHCs) is not unique to neutron stars,but a feature of disk accretion not related to neutron star spin. The coincidence ofkHz QPO frequencies with burst oscillation frequencies (Sections 4 and 5.1) wouldthen require some other explanation. Orbital motion in the disk would remain anattractive interpretation for some of the observed frequencies. Stella et al (1999)showed that for particular choices of neutron star and black hole angular momenta,their relativistic precession model can fit these data. The phenomenology is quite
P1: FRD
August 24, 2000 19:41 Annual Reviews AR108-17
MILLISECOND OSCILLATIONS 747
Figure 14 Broad-band power spectra of the millisecond pulsar (a), an atoll source (b), a black-hole candidate (c), and a Z source (d) (Wijnands & van der Klis 1999a).
complex; in particular, no way has been found yet to combine the Wijnands &van der Klis (1999a) work with the Psaltis et al (1999a) results in a way that worksacross all source types. New low-frequency phenomena are still being discoveredas well (di Salvo et al 1999, Jonker et al 2000b).
7. KILOHERTZ QPO MODELS
The possibility of deriving conclusions of a fundamental nature has led to a rela-tively large number of models for kHz QPOs. Most (but not all) of these involveorbital motion around the neutron star. It is beyond the scope of the present workto provide an in-depth discussion of each model. Instead, I point out some of themain issues and provide references to the literature.
P1: FRD
August 24, 2000 19:41 Annual Reviews AR108-17
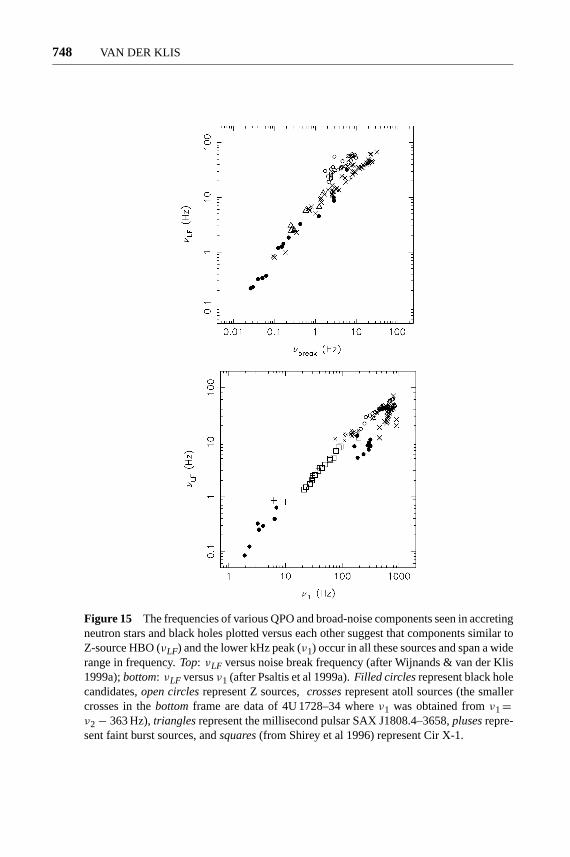
748 VAN DER KLIS
Figure 15 The frequencies of various QPO and broad-noise components seen in accretingneutron stars and black holes plotted versus each other suggest that components similar toZ-source HBO (νLF) and the lower kHz peak (ν1) occur in all these sources and span a widerange in frequency.Top: νLF versus noise break frequency (after Wijnands & van der Klis1999a);bottom: νLF versusν1 (after Psaltis et al 1999a).Filled circlesrepresent black holecandidates,open circlesrepresent Z sources,crossesrepresent atoll sources (the smallercrosses in thebottomframe are data of 4U 1728–34 whereν1 was obtained fromν1=ν2− 363 Hz),trianglesrepresent the millisecond pulsar SAX J1808.4–3658,plusesrepre-sent faint burst sources, andsquares(from Shirey et al 1996) represent Cir X-1.
P1: FRD
August 24, 2000 19:41 Annual Reviews AR108-17
MILLISECOND OSCILLATIONS 749
In early works, the magnetospheric beat-frequency model was implied whenbeat-frequency models were mentioned (e.g. van der Klis et al 1996b, Strohmayeret al 1996c), and this model has continued to be applied to kHz QPOs (Ford et al1997b, Cui et al 1998a, Cui 2000, Campana 2000). Most prominent recently havebeen the sonic point beat-frequency model of Miller et al (1996, 1998a) and therelativistic precession model of Stella & Vietri (1998, 1999); however, the photonbubble model (Klein et al 1996b) and the disk transition layer models (Titarchuket al 1998, 1999) have also been strongly argued for. Additional disk modelshave been proposed as well (Section 7.4). Neutron star oscillations have beenconsidered (Strohmayer et al 1996c, Bildsten et al 1998, Bildsten & Cumming1998), but probably cannot produce the required combination of high frequenciesand rapid changes in frequency.
Most models have evolved in response to new observational results. The sonicpoint model was modified to accommodate the observed deviations from a purebeat-frequency model (Section 5.5; Lamb & Miller 1999, Miller 1999c); the rela-tivistic precession model initially explained the lower kHz peak as a spin-orbit beatfrequency (Stella & Vietri 1998) and only later by apsidal motion (Stella & Vietri1999); the photon bubble model is based on numerical simulations that in timehave become more similar to what is observed (R Klein, private communication);also, the disk transition layer models have experienced considerable evolution(e.g. Osherovich & Titarchuk 1999a).
The relativistic precession model makes the strongest predictions with respectto observable quantities, and hence allows the most direct tests, but the near-commensurability of kHz QPO and burst oscillation frequencies (Section 5.5) isunexplained in that model. The sonic-point model provides specific mechanismsto modulate the X-rays and to make the frequency vary with mass-accretion rate.Other models usually discuss at least one of these issues only generically (usuallyin terms of self-luminous and/or obscuring blobs, and arbitrary preferred radii inthe accretion disk).
7.1 The Sonic-Point Beat-Frequency Model
Beat-frequency models involve orbital motion at some preferred radius in the disk(Section 5.1). A beat-frequency model that uses the magnetospheric radiusrM wasproposed by Alpar & Shaham (1985) to explain the HBO in Z sources (Section 6.3;see also Lamb et al 1985). In the Z sources HBO and kHz QPOs have been seensimultaneously, so at least one additional model is required.
Miller et al (1996, 1998a) suggest continued use of the magnetospheric modelfor the HBO (see also Psaltis et al 1999b), and for the kHz QPOs they propose thesonic-point beat-frequency model. In this model the preferred radius is the sonicradiusrsonic, where the radial inflow velocity becomes supersonic. This radiustends to be nearrISCO (Section 5.1) but radiative stresses change its location, asrequired by the observation that the kHz QPO frequencies vary. Comparing theHBO and kHz QPO frequencies, clearlyrsonic� rM, so part of the accreting mattermust remain in near-Keplerian orbits well withinrM.
P1: FRD
August 24, 2000 19:41 Annual Reviews AR108-17
750 VAN DER KLIS
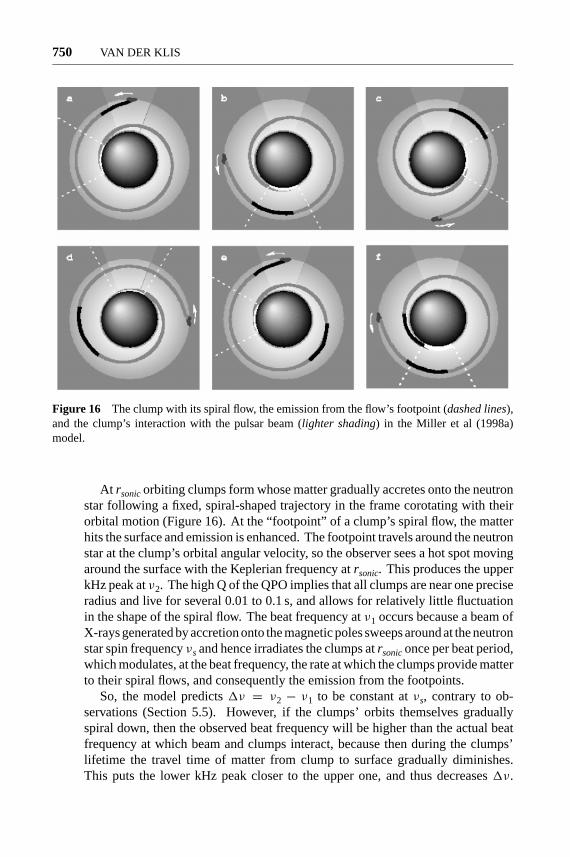
Figure 16 The clump with its spiral flow, the emission from the flow’s footpoint (dashed lines),and the clump’s interaction with the pulsar beam (lighter shading) in the Miller et al (1998a)model.
At rsonicorbiting clumps form whose matter gradually accretes onto the neutronstar following a fixed, spiral-shaped trajectory in the frame corotating with theirorbital motion (Figure 16). At the “footpoint” of a clump’s spiral flow, the matterhits the surface and emission is enhanced. The footpoint travels around the neutronstar at the clump’s orbital angular velocity, so the observer sees a hot spot movingaround the surface with the Keplerian frequency atrsonic. This produces the upperkHz peak atν2. The high Q of the QPO implies that all clumps are near one preciseradius and live for several 0.01 to 0.1 s, and allows for relatively little fluctuationin the shape of the spiral flow. The beat frequency atν1 occurs because a beam ofX-rays generated by accretion onto the magnetic poles sweeps around at the neutronstar spin frequencyνsand hence irradiates the clumps atrsoniconce per beat period,which modulates, at the beat frequency, the rate at which the clumps provide matterto their spiral flows, and consequently the emission from the footpoints.
So, the model predicts1ν = ν2 − ν1 to be constant atνs, contrary to ob-servations (Section 5.5). However, if the clumps’ orbits themselves graduallyspiral down, then the observed beat frequency will be higher than the actual beatfrequency at which beam and clumps interact, because then during the clumps’lifetime the travel time of matter from clump to surface gradually diminishes.This puts the lower kHz peak closer to the upper one, and thus decreases1ν.
P1: FRD
August 24, 2000 19:41 Annual Reviews AR108-17
MILLISECOND OSCILLATIONS 751
This decrease will be larger when at higherLx due to stronger radiation drag, thespiraling-down becomes more pronounced, as observed (Lamb & Miller 1999,Miller 1999c). Because the exact way in which this process affects the relationbetween the frequencies is hard to predict, this complication makes testing themodel more difficult. A remaining test is that a number of specific additional fre-quencies is predicted to arise from the beat-frequency interaction (Milleret al 1998a); these are different from additional frequencies in, for example, therelativistic precession model.
7.2 The Relativistic Precession Model
Inclined eccentric free-particle orbits around a spinning neutron star show bothnodal precession (a wobble of the orbital plane) caused by relativistic frame drag-ging (Thirring & Lense 1918) and relativistic periastron precession similar toMercury’s (Einstein 1915). The relativistic precession model (Stella & Vietri 1998,1999) identifiesν2 with the frequency of an orbit in the disk, and identifiesν1 andthe frequencyνLF of one of the observed low-frequency (10–100 Hz) QPO peaks(Section 6.3) with, respectively, periastron precession and nodal precession of thisorbit.
To lowest order, the relativistic nodal precession isνnod = 8π2Iν22νs/c
2M, andthe relativistic periastron precession causes the kHz peak separation to vary as1ν = ν2(1− 6GM/rc2 )1/2, whereI is the star’s moment of inertia andr theorbital radius (Stella & Vietri 1998, 1999; see also Markovi´c & Lamb 1998).Stellar oblateness affects both precession rates and must be corrected for (Morsink& Stella 1999, Stella et al 1999). For acceptable neutron star parameters, there isan approximate match (e.g. Figure 17) with the observedν1, ν2 andνLF relationsif νLF is twice(or perhaps occasionally four times) the nodal precession frequency,which could in principle arise from a warped disk geometry (Morsink & Stella1999). In this model the neutron-star spin frequencies do not cluster in the 240–360 Hz range (Section 5.6), and1ν and νburst are not expected to be equal asin beat-frequency interpretations. A clear prediction is that1ν should decreasenot only whenν2 increases (as observed) but also when it sufficiently decreases(Figure 17).
For a precise match between model and observations, additional free param-eters are required. Stella & Vietri (1999) propose that the orbital eccentricityesystematically varies with orbital frequency. A critical discussion of the degreeto which the precession model and the beat-frequency model can each fit the datacan be found in Psaltis et al (1999b). Vietri & Stella (1998) and Armitage &Natarajan (1999) have performed calculations relevant to the problem of sustain-ing the tilted orbits required for Lense-Thirring precession in a viscous disk, wherethe Bardeen-Petterson effect (1975) drives the matter to the orbital plane. Karas(1999a,b) calculated frequencies and light curves produced by clumps orbiting theneutron star in orbits similar to those discussed here. Miller (1999d) calculated theeffects of radiation forces on Lense-Thirring precession. Kalogera & Psaltis (2000)
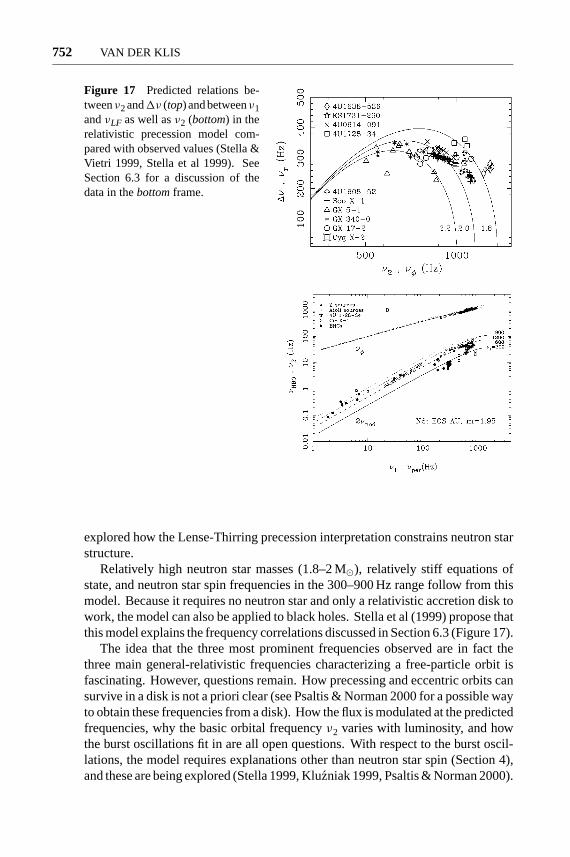
P1: FRD
August 24, 2000 19:41 Annual Reviews AR108-17
752 VAN DER KLIS
Figure 17 Predicted relations be-tweenν2and1ν (top) and betweenν1andνLF as well asν2 (bottom) in therelativistic precession model com-pared with observed values (Stella &Vietri 1999, Stella et al 1999). SeeSection 6.3 for a discussion of thedata in thebottomframe.
explored how the Lense-Thirring precession interpretation constrains neutron starstructure.
Relatively high neutron star masses (1.8–2 M�), relatively stiff equations ofstate, and neutron star spin frequencies in the 300–900 Hz range follow from thismodel. Because it requires no neutron star and only a relativistic accretion disk towork, the model can also be applied to black holes. Stella et al (1999) propose thatthis model explains the frequency correlations discussed in Section 6.3 (Figure 17).
The idea that the three most prominent frequencies observed are in fact thethree main general-relativistic frequencies characterizing a free-particle orbit isfascinating. However, questions remain. How precessing and eccentric orbits cansurvive in a disk is not a priori clear (see Psaltis & Norman 2000 for a possible wayto obtain these frequencies from a disk). How the flux is modulated at the predictedfrequencies, why the basic orbital frequencyν2 varies with luminosity, and howthe burst oscillations fit in are all open questions. With respect to the burst oscil-lations, the model requires explanations other than neutron star spin (Section 4),and these are being explored (Stella 1999, Klu´zniak 1999, Psaltis & Norman 2000).
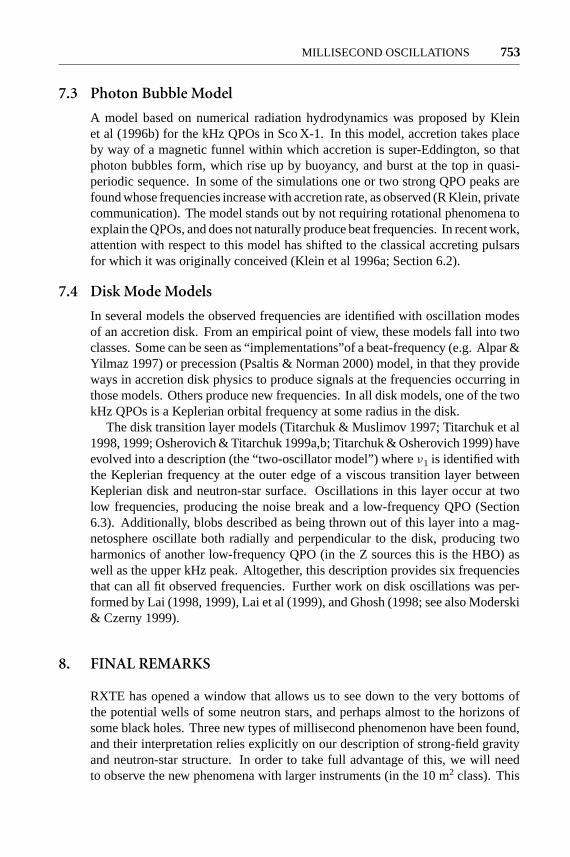
P1: FRD
August 24, 2000 19:41 Annual Reviews AR108-17
MILLISECOND OSCILLATIONS 753
7.3 Photon Bubble Model
A model based on numerical radiation hydrodynamics was proposed by Kleinet al (1996b) for the kHz QPOs in Sco X-1. In this model, accretion takes placeby way of a magnetic funnel within which accretion is super-Eddington, so thatphoton bubbles form, which rise up by buoyancy, and burst at the top in quasi-periodic sequence. In some of the simulations one or two strong QPO peaks arefound whose frequencies increase with accretion rate, as observed (R Klein, privatecommunication). The model stands out by not requiring rotational phenomena toexplain the QPOs, and does not naturally produce beat frequencies. In recent work,attention with respect to this model has shifted to the classical accreting pulsarsfor which it was originally conceived (Klein et al 1996a; Section 6.2).
7.4 Disk Mode Models
In several models the observed frequencies are identified with oscillation modesof an accretion disk. From an empirical point of view, these models fall into twoclasses. Some can be seen as “implementations”of a beat-frequency (e.g. Alpar &Yilmaz 1997) or precession (Psaltis & Norman 2000) model, in that they provideways in accretion disk physics to produce signals at the frequencies occurring inthose models. Others produce new frequencies. In all disk models, one of the twokHz QPOs is a Keplerian orbital frequency at some radius in the disk.
The disk transition layer models (Titarchuk & Muslimov 1997; Titarchuk et al1998, 1999; Osherovich & Titarchuk 1999a,b; Titarchuk & Osherovich 1999) haveevolved into a description (the “two-oscillator model”) whereν1 is identified withthe Keplerian frequency at the outer edge of a viscous transition layer betweenKeplerian disk and neutron-star surface. Oscillations in this layer occur at twolow frequencies, producing the noise break and a low-frequency QPO (Section6.3). Additionally, blobs described as being thrown out of this layer into a mag-netosphere oscillate both radially and perpendicular to the disk, producing twoharmonics of another low-frequency QPO (in the Z sources this is the HBO) aswell as the upper kHz peak. Altogether, this description provides six frequenciesthat can all fit observed frequencies. Further work on disk oscillations was per-formed by Lai (1998, 1999), Lai et al (1999), and Ghosh (1998; see also Moderski& Czerny 1999).
8. FINAL REMARKS
RXTE has opened a window that allows us to see down to the very bottoms ofthe potential wells of some neutron stars, and perhaps almost to the horizons ofsome black holes. Three new types of millisecond phenomenon have been found,and their interpretation relies explicitly on our description of strong-field gravityand neutron-star structure. In order to take full advantage of this, we will needto observe the new phenomena with larger instruments (in the 10 m2 class). This
P1: FRD
August 24, 2000 19:41 Annual Reviews AR108-17
754 VAN DER KLIS
will allow us to follow directly the motion of clumps of matter orbiting in stronggravity and of hot spots corotating on neutron star surfaces, and thereby to mapout curved space-time near accreting compact objects, and directly measure thecompactness of neutron stars and the spin of black holes.
ACKNOWLEDGMENTS
It is a pleasure to acknowledge the help of many colleagues who either madedata available before publication, sent originals of figures, read versions of themanuscript, or provided insightful discussion: Didier Barret, Lars Bildsten, DeeptoChakrabarty, Wei Cui, Eric Ford, Jeroen Homan, Peter Jonker, Richard Klein,Fred Lamb, Phil Kaaret, Craig Markwardt, Mariano M´endez, Cole Miller, MikeNowak, Dimitrios Psaltis, Luigi Stella, Steve van Straaten, Tod Strohmayer, RudyWijnands and Will Zhang. This work was supported in part by the NetherlandsOrganization for Scientific Research (NWO) and the Netherlands Research Schoolfor Astronomy (NOVA).
Visit the Annual Reviews home page at www.AnnualReviews.org
LITERATURE CITED
Akmal A, Pandharipande VR, Ravenhall DG.1998.Phys. Rev. C58:1804–28
Alpar MA, Cheng AF, Ruderman MA, ShahamJ. 1982.Nature300:728–30
Alpar MA, Shaham J. 1985.Nature316:239–41Alpar MA, Yilmaz A. 1997.New Astron.2:225–
38Andersson N, Kokkotas KD, Stergioulas N.
1999.Ap. J.516:307–14Armitage PJ, Natarajan P. 1999.Ap. J.525:909–
14Bardeen JM, Petterson JA. 1975.Ap. J.
195:L65–67Barret D, Olive JF, Boirin L, Done C, Skin-
ner GK, Grindlay JE. 2000.Ap. J.533:329–51
Barret D, Boirin L, Olive JF, Grindlay JE,Bloser PF, 1998. Proc. 3d Integral Work-shop.Astrophys. Lett. And Communications.In press astro-ph/9811236
Barret D, Olive JF, Boirin L, Grindlay JE,Bloser PF, et al. 1997.IAU Circ. No.6793
Barret D, Vedrenne G. 1994.Ap. J. Suppl.92:505–10
Berger M, van der Klis M, van Paradijs J,
Lewin WHG, Lamb F, et al. 1996.Ap. J. Lett.469:L13–16
Bhattacharya D, van den Heuvel EPJ. 1991.Phys. Rep.203:1–124
Biehle GT, Blandford RD. 1993.Ap. J.411:302–12
Bildsten L. 1995.Ap. J.438:852–75Bildsten L. 1998a.Ap. J. Lett.501:L89–93Bildsten L. 1998b.The many faces of neutron
stars. NATO ASI, Lipari,C515:419–49. Dor-drecht: Kluwer pp. 608
Bildsten L, Cumming A. 1998.Ap. J.506:842–62
Bildsten L, Cumming A, Ushomirsky G, CutlerC. 1998.ASP Conf. Proc.135:437–41
Bloser PF, Grindlay JE, Kaaret P, Smale AP,Barret D. 1999.Ap. J.Submitted
Boirin L, Barret D, Olive JF, Grindlay JE,Bloser PF. 1999.Astron. Astrophys.Submit-ted
Bradt HV, Rothschild RE, Swank JH. 1993.As-tron. Astrophys. Suppl.97:355
Bulik T, Godek-Rosi´nska D, Kluzniak W. 1999.Astron. Astrophys.344:L71–74
Burderi L, King AR. 1998.Ap. J.505:L135–37

P1: FRD
August 24, 2000 19:41 Annual Reviews AR108-17
MILLISECOND OSCILLATIONS 755
Campana S. 2000.Ap. J. in press. astro-ph/0003210
Chakrabarty D, Morgan EH. 1998a.IAU Circ.No.6877
Chakrabarty D, Morgan EH. 1998b.Nature394:346–48
Cook GB, Shapiro SL, Teukolsky SA. 1994.Ap.J. 424:823–45
Cui W. 1999.Ap. J. Lett.524:L59–62Cui W. 2000. Ap. J. submitted. astro-
ph/0003243Cui W, Barret D, Zhang SN, Chen W, Boirin L,
Swank J. 1998a.Ap. J. Lett.502:L49–53Cui W, Morgan EH, Titarchuk LG. 1998b.Ap.
J. Lett.504:L27–30Cui W, Zhang SN, Chen W. 1998c.Ap. J.
492:L53–57Datta B, Thampan AV, Bombaci I. 1998.Astron.
Astrophys.334:943–52di Salvo T, Mendez M, van der Klis M, Ford E,
Robba NR. 1999.Ap. J.SubmittedDotani T, Mitsuda K, Makishima K, Jones MH.
1989.Publ. ASJ41:577–89Einstein A. 1915.Preuss. Akad. Wiss. Berlin,
Sitzber.47:831–39Ford EC. 1999.Ap. J. Lett.519:L73–75Ford EC, Kaaret P, Chen K, Tavani M, Barret
D, et al. 1997b.Ap. J. Lett.486:L47–50Ford E, Kaaret P, Tavani M, Barret D, Bloser P,
et al. 1997a.Ap. J. Lett.475:L123–26Ford E, Kaaret P, Tavani M, Harmon BA, Zhang
SN, et al. 1996.IAU Circ. No.6426Ford EC, van der Klis M. 1998.Ap. J. Lett.
506:L39–42Ford EC, van der Klis M, Kaaret P. 1998a.Ap.
J. Lett.498:L41–44Ford EC, van der Klis M, M´endez M, Wijnands
R, Homan J, et al. 2000.Ap. J.in press. astro-ph/0002074
Ford EC, van der Klis M, van Paradijs J, M´endezM, Wijnands R, Kaaret P. 1998b.Ap. J. Lett.508:L155–58
Fortner B, Lamb FK, Miller GS. 1989.Nature342:775–77
Fox DW, Lewin WHG, et al. 1999.IAU Circ.No.7081
Frank J, King A, Raine D. 1992.Accretion
Power in Astrophysicspp. 294, Cambridge,UK: Cambridge Univ. Press.
Gaensler BM, Stappers BW, Getts TJ. 1999.Ap.J. 522:L117–19
Ghosh P. 1998.Ap. J.506:L109–12Ghosh P, Lamb FK. 1992.X-ray binaries and
recycled pulsars, NATO ASI, Santa Barbara.C377:487–510. Dordrecht: Kluwer. pp. 566
Giles AB, Hill KM, Greenhill JG. 1999.MN-RAS304:47–51
Gilfanov M, Revnivtsev M, Sunyaev R, Chu-razov E. 1998.Astron. Astrophys.338:L83–86
Hasinger G, van der Klis M. 1989.Astron. As-trophys.225:79–96
Hasinger G, van der Klis M, Ebisawa K,Dotani T, Mitsuda K. 1990.Astron. Astro-phys.235:131–46
Heindl WA, Smith DM. 1998.Ap. J.506:L35–38
Heiselberg H, Hjorth-Jensen M. 1999.Ap. J.Lett.525:L45–48
Homan J, van der Klis M. 2000.Ap. J.in press.astro-ph/0003241
Homan J, Mendez M, Wijnands R, van derKlis M, van Paradijs J. 1999a.Ap. J. Lett.513:L119–20
Homan J, van der Klis M, van Paradijs J,Mendez M. 1998b.IAU Circ. No.6971
Homan J, van der Klis M, Wijnands R, VaughanB, Kuulkers K. 1998a.Ap. J. Lett.499:L41–44
Homan J, Wijnands R, van der Klis M. 1999b.IAU Circ. No.7121
in ’t Zand JJM, Heise J, Muller JM, BazzanoA, Cocchi M, et al. 1998.Astron. Astrophys.331:L25–28
Jernigan JG, Klein RI, Arons J. 2000.Ap. J.530:875–89
Jongert HC, van der Klis M. 1996.Astron. As-trophys.310:474–76
Jonker PG, van der Klis M, Homan J, vanParadijs J, M´endez M, et al. 2000a.Ap. J.531:453–57
Jonker PG, van der Klis M, Wijnands R. 1999.Ap. J. Lett.511:L41–44
Jonker PG, van der Klis M, Wijnands R, Homan
P1: FRD
August 24, 2000 19:41 Annual Reviews AR108-17
756 VAN DER KLIS
J, van Paradijs J, M´endez M, et al. 2000b.Ap.J. in press. astro-ph/0002022
Jonker PG, Wijnands R, van der Klis M, PsaltisD, Kuulkers E, Lamb FK. 1998.Ap. J.499:L191–94
Joss PC. 1978.Ap. J. Lett.225:L123–27Kaaret P, Ford E, Chen K. 1997.Ap. J. Lett.
480:L27–29Kaaret P, Piraino S, Bloser PF, Ford EC, Grind-
lay JE, et al. 1999b.Ap. J. Lett.520:L37–40
Kaaret P, Piraino S, Ford EC, Santangelo A.1999a.Ap. J. Lett.514:L31–33
Kaaret P, Yu W, Ford EC, Zhang SN. 1998.Ap.J. Lett.497:L93–96
Kalogera V, Psaltis D. 2000.Phys. Rev. D61:024009
Karas V. 1999a.Publ. ASJ51:317–20Karas V. 1999b.Ap. J.526:953–56Klein RI, Arons J, Jernigan JG, Hsu JJL. 1996a.
Ap. J. Lett.457:L85–89Klein RI, Jernigan JG, Arons J, Morgan EH,
Zhang W. 1996b.Ap. J. Lett.469:L119–23Kluzniak W. 1998.Ap. J. Lett.509:L37–40Kluzniak W. 1999. Presented at X-Ray Probes
of Relativistic Effects near Neutron Stars andBlack Holes, Summer Workshop, Aspen
Kluzniak W, Michelson P, Wagoner RV. 1990.Ap. J.358:538–44
Kluzniak W, Wagoner RV. 1985.Ap. J.297:548–54
Kluzniak W, Wilson JR. 1991.Ap. J. Lett.372:L87–90
Konar S, Bhattacharya D. 1999.MNRAS303:588–94
Kuulkers E, van der Klis M. 1995.Astron. As-trophys.303:801–6
Kuulkers E, van der Klis M. 1996.Astron. As-trophys.314:567–75
Kuulkers E, van der Klis M. 1998.Astron. As-trophys.332:845–48
Kuulkers E, van der Klis M, Vaughan BA. 1996.Astron. Astrophys.311:197–210
Lai D. 1998.Ap. J.502:721–29Lai D. 1999.Ap. J.524:1030–47Lai D, Lovelace R, Wasserman I. 1999.Ap. J.
Submitted. astro-ph/9904111
Lamb FK, Miller MC. 1999.Ap. J.In prepara-tion
Lamb FK, Shibazaki N, Alpar MA, Shaham J.1985.Nature317:681–87
Leahy DA, Elsner RF, Weisskopf MC. 1983.Ap. J.272:256–58
Lee HC, Miller GS. 1998.MNRAS299:479–87Levin Y. 1999.Ap. J.517:328–33Lewin WHG, Joss PC. 1981.Space Sci. Rev.
28:3–87Lewin WHG, van Paradijs J, Hasinger G, Pen-
ninx WH, Langmeier A, et al. 1987.MNRAS226:383–94
Lewin WHG, van Paradijs J, Taam RE. 1995b.See Lewin et al 1995a, pp. 175–232
Lewin WHG, van Paradijs J, van den HeuvelEPJ. 1995a.X-Ray Binaries.Cambridge,UK: Cambridge Univ. Press. 662 pp.
Li XD, Bombaci I, Dey M, Dey J, van denHeuvel EPJ. 1999a. astro-ph/9905356Phys.Rev. Lett.83:3776–79
Li XD, Ray S, Dey J, Dey M, Bombaci I. 1999b.Ap. J.527:L51–54. astro-ph/9908274
Livio M, Bath GT. 1982.Astron. Astrophys.116:286–92
Makishima K, Ishida M, Ohashi T, Dotani T,Inoue H, et al. 1989.Publ. ASJ41:531–55
Markovic D, Lamb FK. 1998.Ap. J.507:316–26
Markwardt CB, Lee HC, Swank JH. 1999b.AASHEAD31:15.01 (Abstr.)
Markwardt CB, Strohmayer TE, Swank JH.1999a.Ap. J. Lett.512:L125–29
Marshall FE, Markwardt CB. 1999.IAU Circ.No.7103
Mason KO, Middleditch J, Nelson JE, WhiteNE. 1980.Nature287:516–18
Mendez M. 1999. Relativistic astrophysics andcosmology. Texas Symp., 19th, Paris.Inpress. astro-ph/9903469
Mendez M, van der Klis M. 1999.Ap. J. Lett.517:L51–54
Mendez M, van der Klis M, Ford EC, WijnandsR, van Paradijs J. 1999.Ap. J. Lett.511:L49–52
Mendez M, van der Klis M, van Paradijs J.1998c.Ap. J. Lett.506:L117–19
P1: FRD
August 24, 2000 19:41 Annual Reviews AR108-17
MILLISECOND OSCILLATIONS 757
Mendez M, van der Klis M, van Paradijs J,Lewin WHG, Lamb FK, et al. 1997.Ap. J.Lett.485:L37–40
Mendez M, van der Klis M, van Paradijs J,Lewin WHG, Vaughan BA, et al. 1998a.Ap.J. Lett.494:L65–69
Mendez M, van der Klis M, Wijnands R, FordEC, van Paradijs J, Vaughan BA. 1998b.Ap.J. Lett.505:L23–26
Mereghetti S, Grindlay JE. 1987.Ap. J.312:727–31
Merloni A, Vietri M, Stella L, Bini D. 1999.MNRAS304:155–59
Middleditch J, Priedhorsky WC. 1996.Ap. J.306:230–37
Miller MC. 1999a.Ap. J. Lett.515:L77–80Miller MC. 2000.Ap. J.531:458–66Miller MC. 1999c. Stellar endpoints.Bologna
’99 Conf.In pressMiller MC. 1999d.Ap. J.520:256–61Miller MC, Lamb FK. 1998. Ap. J. Lett.
499:L37–40Miller MC, Lamb FK, Cook GB. 1998b.Ap. J.
509:793–801Miller MC, Lamb FK, Psaltis D. 1996. astro-
ph/9609157v1Miller MC, Lamb FK, Psaltis D. 1998a.Ap. J.
508:791–830Moderski R, Czerny B. 1999.Ap. J.513:L123–
25Morgan EH, Remillard RA, Greiner J. 1997.
Ap. J.482:993–1010Morgan EH, Smith DA. 1996.IAU Circ. No.
6437Morsink SM, Stella L. 1999.Ap. J.513:827–
44Muno MP, Fox DW, Morgan EH, Bildsten L.
2000.Ap. J.in press. astro-ph/0003229Murakami T, Inoue H, Makishima K, Hoshi R.
1987.Publ. ASJ39:879–86Narayan R. 1997. Accretion phenomena and
related outflows,IAU Coll. 163, ASP Conf.Series121:75–89
Nowak MA, Vaughan BA, Wilms J, Dove JB,Begelman MC. 1999.Ap. J.510:874–91
Nowak MA, Wagoner RV, Begelman MC, LehrDE. 1997.Ap. J. Lett.477:L91–94
Osherovich V, Titarchuk L. 1999a.Ap. J.522:L113–16
Osherovich V, Titarchuk L. 1999b.Ap. J.523:L73–76
Paczynski B. 1987.Nature327:303–4Psaltis D, Belloni T, van der Klis M. 1999a.Ap.
J. Lett.520:262–70Psaltis D, Chakrabarty D. 1999.Ap. J.521:332–
40Psaltis D, Lamb FK. 1998.Joint European and
National Astron. Meet., 4th, Astrophys. As-tron. Trans.18N3:447–54
Psaltis D, Mendez M, Wijnands R, Homan J,Jonker PG, et al. 1998.Ap. J. Lett.501:L95–99
Psaltis D, Norman C. 2000.Ap. J. submittedastro-ph/0001391
Psaltis D, Wijnands R, Homan J, Jonker PG, vander Klis M, et al. 1999b.Ap. J.520:763–75
Radhakrishnan V, Srinivasan G. 1984. Asia-Pacific Regional Meeting of the IAU, 2nd,Jakarta, 1981. p. 423
Reig P, Mendez M, van der Klis M, Ford EC.2000.Ap. J.530:916–22
Remillard R. 1999. See Miller 1999c, in pressRemillard RA, Morgan EH. 1999.AAS 195,
37.02Remillard R, McClintock JE, Sobczak G, Bai-
lyn C, Orosz JA, et al. 1999c.Ap. J. Lett.517:L127–30
Remillard RA, Morgan EH. 1998.Nucl. Phys.B 69/1-3:316–23
Remillard R, Morgan E, Levine A, Muno M,McClintock J, et al. 1999a.AAS HEAD31:28.08 (Abstr.)
Remillard R, Morgan EH, McClintock JE, Bai-lyn CD, Orosz JA. 1999b.Ap. J. 522:397–412
Sadeh D, Byram ET, Chubb TA, Friedman H,Hedler RL, et al. 1982.Ap. J.257:214–22
Sadeh D, Livio M. 1982a.Ap. J.258:770–75Sadeh D, Livio M. 1982b.Ap. J.263:823–27Schaab C, Weigel MK. 1999.MNRAS308:718–
30Schoelkopf RJ, Kelley RL. 1991.Ap. J.
375:696–700Shara MM. 1982.Ap. J.261:649–60
P1: FRD
August 24, 2000 19:41 Annual Reviews AR108-17
758 VAN DER KLIS
Shirey RE, Bradt HV, Levine AM, Morgan EH.1996.Ap. J.469:L21–24
Shvartsman VF. 1971. Soviet Astron.15(3):377–84
Skinner GK, Bedford DK, Elsner RF, LeahyD, Weisskopf MC, Grindlay J. 1982.Nature297:568–70
Smale AP, Zhang W, White NE. 1996.IAU Circ.No.6507
Smale AP, Zhang W, White NE. 1997.Ap. J.Lett.483:L119–22
Smith DA, Morgan EH, Bradt H. 1997.Ap. J.Lett.479:L137–40
Stella L. 1999. See Klu´zniak 1999Stella L, Priedhorsky W, White NE. 1987a.Ap.
J. Lett.312:L17–21Stella L, Vietri M. 1998.Ap. J. Lett.492:L59–
62Stella L, Vietri M. 1999.Phys. Rev. Lett.82:17–
20Stella L, Vietri M, Morskink SM. 1999.Ap. J.
524:L63–66Stella L, White NE, Priedhorsky W. 1987b.Ap.
J. Lett.315:L49–53Strohmayer T. 1998.Some Like It Hot, AIP
Conf. Proc.431:397–400Strohmayer T, Smale A, Day C, Swank J,
Titarchuk L, Lee U. 1996b.IAU Circ. No.6387
Strohmayer T, Zhang W, Swank J. 1996a.IAUCirc. No.6320
Strohmayer T, Zhang W, Swank JH. 1997b.Ap.J. 487:L77–80
Strohmayer TE. 1999.Ap. J.523:L51–55Strohmayer TE, Jahoda K, Giles AB, Lee U.
1997a.Ap. J.486:355–62Strohmayer TE, Lee U, Jahoda K. 1996d.IAU
Circ. No.6484Strohmayer TE, Markwardt CB. 1999.Ap. J.
Lett.516:L81–85Strohmayer TE, Swank JH, Zhang W. 1998c.
Nucl. Phys.B 69/1-3:129–34Strohmayer TE, Zhang W, Swank JH, Lapidus
I. 1998b.Ap. J.503:L147–50Strohmayer TE, Zhang W, Swank JH, Smale
A, Titarchuk L, Day C. 1996c.Ap. J. Lett.469:L9–12
Strohmayer TE, Zhang W, Swank JH, WhiteNE, Lapidus I. 1998a.Ap. J. 498:L135–39
Sunyaev RA. 1973.Soviet Astron.16(6):941–44
Thampan AV, Bhattacharya D, Datta B. 1999.MNRAS302:L69–73
Thirring H, Lense J. 1918.Phys. Z.19:156–63Titarchuk L, Lapidus I, Muslimov A. 1998.Ap.
J. 499:315–28Titarchuk L, Muslimov A. 1997.Astron. Astro-
phys.323:L5–8Titarchuk L, Osherovich V. 1999.Ap. J. Lett.
518:L95–98Titarchuk L, Osherovich V, Kuznetsov S. 1999.
Ap. J.525:L129–32Tomsick JA, Halpern JP, Kemp J, Kaaret P.
1999.Ap. J.521:341–50van der Klis M. 1989a.Annu. Rev. Astron. As-
trophys.27:517–53van der Klis M. 1989b. Timing neutron stars,
NATO ASI, Cesme.C262:27–69. Dordrecht:Kluwer
van der Klis M. 1994a.Ap. J. Suppl.92:511–19van der Klis M. 1994b.Astron. Astrophys.
283:469–74van der Klis M. 1995a. See Lewin et al 1995a,
pp. 252–307van der Klis M. 1995b. The lives of the neu-
tron stars,NATO ASI, Kemer. C450:301–30.Dordrecht: Kluwer
van der Klis M. 1997. Astronomical time se-ries.Wise Obs. Anniv. Symp., 25th, Tel Aviv,Kluwer Astrophys. Space Sci. Libr.218:121–32. Dordrecht: Kluwer
van der Klis M. 1998. See Bildsten 1998b,C515:33768. Dordrecht: Kluwer
van der Klis M, Hasinger G, Damen E, PenninxW, van Paradijs J, Lewin WHG. 1990.Ap. J.360:L19–22
van der Klis M, Hasinger G, Stella L, Lang-meier A, van Paradijs J, Lewin WHG. 1987.Ap. J.319:L13–18
van der Klis M, Homan J, Wijnands R, Kuulk-ers E, Lamb FK, et al. 1997a.IAU Circ. No.6565
van der Klis M, Jansen F, van Paradijs J, Lewin
P1: FRD
August 24, 2000 19:41 Annual Reviews AR108-17
MILLISECOND OSCILLATIONS 759
WHG, van den Heuvel EPJ. 1985.Nature316:225–30
van der Klis M, Swank J, Zhang W, JahodaK, Morgan E, et al. 1996a.IAU Circ. No.6319
van der Klis M, Swank JH, Zhang W, Jahoda K,Morgan EH, et al. 1996b.Ap. J. Lett.469:L1–4
van der Klis M, van Paradijs J, Lewin WHG,Lamb FK, Vaughan B, et al. 1996d.IAU Circ.No.6428
van der Klis M, Wijnands R, Chen W, LambFK, Psaltis D, et al. 1996c.IAU Circ. No.6424
van der Klis M, Wijnands RAD, Horne K, ChenW. 1997b.Ap. J. Lett.481:L97–100
van der Klis M, Wijnands R, Kuulkers E, LambFK, Psaltis D, et al. 1996e.IAU Circ. No.6511
van Paradijs J, Zhang W, Marshall F, Swank JH,Augusteijn T, et al. 1996.IAU Circ. No.6336
van Straaten S, Ford EC, van der Klis M,Mendez M, Kaaret P. 2000.Ap. J. in press.astro-ph/0001480
Vaughan B, van der Klis M, Lewin WHG, Wi-jers RAMJ, van Paradijs J, et al. 1994a.Ap.J. 421:738–52
Vaughan BA, van der Klis M, M´endez M, vanParadijs J, Wijnands RAD, et al. 1997.Ap. J.Lett.483:L115–18
Vaughan BA, van der Klis M, M´endez M, vanParadijs J, Wijnands RAD, et al. 1998.Ap. J.Lett.509:L145–45
Vaughan BA, van der Klis M, Wood KS, NorrisJP, Hertz P, et al. 1994b.Ap. J.435:362–69
Vietri M, Stella L. 1998.Ap. J.503:350–60White NE, Zhang W. 1997.Ap. J. Lett.
490:L87–90Wijnands R, Homan J, van der Klis M, Kuulk-
ers E, van Paradijs J, et al. 1998a.Ap. J. Lett.493:L87–90
Wijnands R, Homan J, van der Klis M, M´endezM, Kuulkers E, et al. 1997b.Ap. J. Lett.490:L157–60
Wijnands R, Mendez M, van der Klis M, PsaltisD, Kuulkers E, Lamb FK. 1998c.Ap. J. Lett.504:L35–38
Wijnands R, van der Klis M. 1998a.IAU Circ.No.6876
Wijnands R, van der Klis M. 1998b.Nature394:344–46
Wijnands R, van der Klis M. 1998c.Ap. J. Lett.507:L63–66
Wijnands R, van der Klis M. 1999a.Ap. J. Lett.514:939–44
Wijnands R, van der Klis M. 1999b.Ap. J.522:965–72
Wijnands R, van der Klis M. 1999c.Astron. As-trophys.345:L35–38
Wijnands R, van der Klis M, van Paradijs J.1998d. The hot universe,IAU Symp.188,pp.370–71
Wijnands RAD, van der Klis M. 1997.Ap. J.Lett.482:L65–68
Wijnands RAD, van der Klis M, M´endez M, vanParadijs J, Lewin WHG, et al. 1998b.Ap. J.Lett.495:L39–42
Wijnands RAD, van der Klis M, Psaltis D, LambFK, Kuulkers E, et al. 1996b.Ap. J. Lett.469:L5–8
Wijnands RAD, van der Klis M, van ParadijsJ, Lewin WHG, Lamb FK, et al. 1996a.IAUCirc. No.6447
Wijnands RAD, van der Klis M, van Paradijs J,Lewin WHG, Lamb FK, et al. 1997a.Ap. J.Lett.479:L141–44
Wood KS, Hertz P, Norris JP, Vaughan BA,Michelson PF, et al. 1991.Ap. J.379:295–309
Yoshida K, Mitsuda K, Ebisawa K, Ueda Y,Fujimoto R, et al. 1993.Publ. ASJ45:605–16
Yu W, Li TP, Zhang W, Zhang SN. 1999.Ap. J.Lett.512:L35–38
Yu W, Zhang SN, Harmon BA, Paciesas WS,Robinson CR, et al. 1997.Ap. J.490:L153–56
Zhang, W. 1997. Presented at AAS Meeting,190th, Winston-Salem
Zhang W, Jahoda K, Kelley RL, Strohmayer TE,Swank JH, Zhang SN. 1998c.Ap. J.495:L9–12
Zhang W, Lapidus I, Swank JH, White NE,Titarchuk L. 1997a.IAU Circ. No.6541
P1: FRD
August 24, 2000 19:41 Annual Reviews AR108-17
760 VAN DER KLIS
Zhang W, Lapidus I, White NE, Titarchuk L.1996a.Ap. J. Lett.469:L17–19
Zhang W, Lapidus I, White NE, Titarchuk L.1996b.Ap. J. Lett.473:L135
Zhang W, Smale AP, Strohmayer TE,
Swank JH. 1998b.Ap. J.500:L171–74Zhang W, Strohmayer TE, Swank JH. 1997b.
Ap. J. Lett.482:L167–70Zhang W, Strohmayer TE, Swank JH. 1998a.
Ap. J.500:L167–69