
Millimeter-Wave Backscattering Measurements with ...
7
HAL Id: cea-01559437 https://hal-cea.archives-ouvertes.fr/cea-01559437 Submitted on 10 Jul 2017 HAL is a multi-disciplinary open access archive for the deposit and dissemination of sci- entific research documents, whether they are pub- lished or not. The documents may come from teaching and research institutions in France or abroad, or from public or private research centers. L’archive ouverte pluridisciplinaire HAL, est destinée au dépôt et à la diffusion de documents scientifiques de niveau recherche, publiés ou non, émanant des établissements d’enseignement et de recherche français ou étrangers, des laboratoires publics ou privés. Millimeter-Wave Backscattering Measurements with Transmitarrays for Personal Radar Applications Anna Guerra, Francesco Guidi, Antonio Clemente, Raffaele d’Errico, Laurent Dussopt, Davide Dardari To cite this version: Anna Guerra, Francesco Guidi, Antonio Clemente, Raffaele d’Errico, Laurent Dussopt, et al.. Millimeter-Wave Backscattering Measurements with Transmitarrays for Personal Radar Applications. 2015 IEEE Globecom Workshops (GC Wkshps), Dec 2015, San Diego, United States. 10.1109/GLO- COMW.2015.7414160. cea-01559437
Transcript of Millimeter-Wave Backscattering Measurements with ...

HAL Id: cea-01559437https://hal-cea.archives-ouvertes.fr/cea-01559437
Submitted on 10 Jul 2017
HAL is a multi-disciplinary open accessarchive for the deposit and dissemination of sci-entific research documents, whether they are pub-lished or not. The documents may come fromteaching and research institutions in France orabroad, or from public or private research centers.
L’archive ouverte pluridisciplinaire HAL, estdestinée au dépôt et à la diffusion de documentsscientifiques de niveau recherche, publiés ou non,émanant des établissements d’enseignement et derecherche français ou étrangers, des laboratoirespublics ou privés.
Millimeter-Wave Backscattering Measurements withTransmitarrays for Personal Radar Applications
Anna Guerra, Francesco Guidi, Antonio Clemente, Raffaele d’Errico, LaurentDussopt, Davide Dardari
To cite this version:Anna Guerra, Francesco Guidi, Antonio Clemente, Raffaele d’Errico, Laurent Dussopt, et al..Millimeter-Wave Backscattering Measurements with Transmitarrays for Personal Radar Applications.2015 IEEE Globecom Workshops (GC Wkshps), Dec 2015, San Diego, United States. �10.1109/GLO-COMW.2015.7414160�. �cea-01559437�

Millimeter-wave Backscattering Measurements with
Transmitarrays for Personal Radar Applications
Anna Guerra∗, Francesco Guidi†‡, Antonio Clemente†‡, Raffaele D’Errico†‡, Laurent Dussopt†‡, and Davide Dardari∗
∗DEI, University of Bologna, via Venezia 52, I-47521 Cesena (FC), Italy
{anna.guerra3, davide.dardari}@unibo.it†Univ. Grenoble-Alpes, 38000 Grenoble, France
‡CEA, LETI, MINATEC Campus, 38054 Grenoble, France
{francesco.guidi, antonio.clemente, raffaele.derrico, laurent.dussopt}@cea.fr
Abstract—The concept of personal radar has recently emergedas an interesting solution for next 5G applications. In factthe high portability of massive antenna arrays at millimeter-waves enables the integration of a radar system in pocket-sizedevices (i.e. tablets or smartphones) and enhances the possibilityto map the surrounding environment by guaranteeing accuratelocalization together with high-speed communication capabilities.In this paper we investigate for the first time the capability ofsuch personal radar solution using real measured data collectedat millimeter-waves as input for the mapping algorithm.
Index Terms—Millimeter-wave propagation measurements,massive antenna arrays, indoor mapping, personal radar.
I. INTRODUCTION
In the new era of device-to-device (D2D) communications,
claimed by the fifth generation (5G) wireless mobile networks,
people and objects will share their information in real time,
as data transfer could be enabled at an unprecedented scale.
At the moment, 5G is still at its infancy, as its practical
adoption is expected in the next decade [1], with a consequent
explosion of research studies and projects for its assessment.
To put forth on the need to achieve high data rates and D2D
communication, massive arrays and millimeter-wave (mmW)
technology have become a matter of investigation [2], [3]. It
is expected that their joint adoption will play a key role in
future 5G communications scenarios [4]. Indeed, the reduced
wavelength at mmW paves the way for packing a large number
of antenna elements into a small area and for adopting massive
arrays systems at base station (BS) or access points (APs) as
well as at mobile end [2], [5].
In this context, transmitarrays (TAs) are a recent cutting-
edge antenna array technology. Thanks to their spatial feeding
techniques, TAs are extremely attractive compared to tradi-
tional phased arrays that suffer from large insertion losses
due to their beamforming network and do not experience any
feed blockage effects if compared to reflector and reflectarray
antennas [6]–[8]. Studies concerning the adoption of mmW
TAs can be found in [6]. Note that such reduced dimensions
open new interesting scenarios for the integration of arrays on
smartphones and for the development of new applications.
In this perspective, the concept of a smart personal radar
has been recently proposed in [9]–[11] as well as the adop-
tion of TAs for this kind of application [12]. The personal
Fig. 1. Smartphone centric solution for next crowd-sensing applications (left)and personal radar concept (right).
radar is based on the idea of a massive array operating at
mmW frequencies able to electronically scan the surrounding
environment and to reconstruct a map of it (see Fig. 1). As a
consequence, a high-definition distance estimate (ranging) and
very narrow steering beams (angle resolution) are essential re-
quirements to achieve a high level of mapping reconstruction.
Differently from previous works in the field of mapping and
localization [13], such needs are met by the combination of
the mmW technology and massive arrays.
Moreover, the possibility to share data within the incoming
crowd-sensing technology [14] opens unprecedented scenarios
where continuously up-to-date maps could be obtained with
zero-efforts exploiting not participatory users. In fact, to avoid
invasive and costly ad-hoc systems to support people (e.g.,
visually impaired people) and perform self-localization, the
adoption of personal radars in next generation smartphones
represents an appealing idea [15].
In this paper we aim at characterizing real mapping perfor-
mance by exploiting, for the first time, measurements collected
in the V-band in a typical office environment. Stimulated by
the preliminary simulation results presented in [9], [12], we
have conducted a mmW measurements campaign with the
purpose of assessing the actual system performance and the
feasibility of the personal radar idea. We first describe the
measurements campaign and then we include the collected
data in the mapping algorithm in order to reconstruct the
environment and to test the feasibility of the proposed ap-

VNA
y
xSpatial grid
00
1
1
1
2
2
2
3
3
3
4
4
4
5
p1 p2 p3 p4 p5 p6 p7 p8
p9
p10
p11
p12Transmitarrays
mmW converters
Cables
Fig. 2. Plan of the indoor corridor environment (top-left) and measurementset-up (right).
proach. Measurement mapping results are finally compared
with simulation ones.
The rest of the paper is organized as follows. Sec. II
describes the measurement set-up and the considered TAs.
Sec. III presents the mapping algorithm and finally, Sec. IV
describes the case study and discuss the obtained measurement
and simulations results. Sec. V concludes the work.
II. MILLIMETER-WAVE INDOOR
MEASUREMENT CAMPAIGN
A. Measurements Set-Up
In order to validate the personal radar concept, a measure-
ments campaign has been conducted at CEA-Grenoble indoor
premises (the map of the building floor is reported in Fig. 2-
(top-left)).
In particular, we exploited the measurement set-up repre-
sented in Fig. 2-(right) which consists of:
• A 4-ports Vector Network Analyzer (VNA) operating in
the frequency range 10MHz-24GHz;
• 2 mmW converters operating in the frequency range
50GHz-75GHz;
• 2 Linearly polarized TAs (size 20×20, 1 bit, F/D = 0.5)
[16];
• X-Y-Azimuth positioner.
A bistatic configuration has been considered with the TAs
spaced apart of 0.16m in order to mitigate the antenna cou-
pling and to separate the transmitting and receiving channels.
As the objective application is to facilitate the navigation
inside buildings (as for example blind-aid applications), the
corridor has appeared as a natural choice. Specifically, as
we can see from Fig. 2-(top-left) where the office plan is
reported, measurements have been collected in 12 different
positions spaced of 0.405m 1 in the frequency range between
55 − 70GHz with a step of 5MHz. For each measurement
position, the X-Y-Azimuth positioner rotates the radar in the
semi-plane from −90◦ to 90◦ with a step of 5◦ in accordance
1This step has been chosen in accordance to the value of the fully automatedmovement along the y-axis achievable with the positioner.
Fig. 3. Photos of measurements campaign in the corridor.
to the TA half power beamwidth (HPBW) to emulate the
beamforming operation. Such mechanical steering reproduces
an electronical steering since the adopted TAs are not re-
configurable. Technological solutions to perform electronically
beamsteering at V-band can be found in [17] where a multiple-
source system is proposed. Fig. 3 shows two photos taken
during the measurements campaign.
B. Transmitarray antenna
The TAs used for measurements are fully described in [16]
and here we report the most important information useful for
the reader to appreciate how TAs radiation properties impact
the mapping performance. As can be seen in Fig. 4, the TA is
composed of a focal source illuminating a planar array whose
building blocks are called unit-cells. In the considered TA
structure, 20 × 20 unit-cells are adopted each with size of
2.5 × 2.5 mm2 (i.e. the spacing between antennas is set to
λ0/2 = 2.5mm where λ0 is the wavelength at f0 = 60GHz).
Each unit-cell is composed of two patch antennas (receiver and
transmission one) printed on two identical substrates separated
by a ground plane and connected by a metallized via hole. The
transmission phase can be controlled by rotating the patch
on the transmission side. As previously introduced, this TA
is non-reconfigurable because the patches rotation is fixed
once the array is realized. The considered TA presents 1-bit
of phase compensation corresponding to two possible phase
values (0◦ and 180◦). Finally, the focal source is a linearly-
polarized pyramidal horn antenna with a gain equal to 10.2 dBi
at 60GHz and a full HPBW of 72◦ × 57◦.
Given this array structure, in [16] simulations and measure-
ments results report a maximum gain of 23.3 dBi, a directivity,
spill-over loss and power efficiency equal to 26 dBi, 2.24 dB,
and 53.6%, respectively.
In Fig. 5-(top) we report the maximum gain of the TA as a
function of the frequency range used for measurements. The
dashed lines correspond to the gain at 3 dB and intercept the
continuous curve in correspondence of two frequency values,
fL = 55GHz and fH = 69GHz, which define the extremes of
the 3 dB bandwidth. In Fig. 5-(bottom) the phase distribution
and the realized gain are shown. Note that we have reported the

(a) (b)
Focal SourceAnt.
1
Ant.
2
Unit-cell
Phase shifter
D
F
Fig. 4. TA structure: (a) TA configuration and (b) unit-cell.
realized gain for fL, fH and for the frequency fc = 60GHz
at which the TA has been optimized.
C. Measurement Results
For each position and each TA steering direction, the S-
matrix was measured in the frequency domain from 55 to
70GHz. In particular, the measured S21(f) has been translated
in time-domain through the inverse Fourier transform, and
time gating was performed in order to suppress the coupling
between the two arrays.
Successively, the round-trip channel impulse response
(CIR), representative of the two-hop backscattering link, has
been convoluted with a root raised cosine (RRC) pulse, with
the effective radiated isotropic power (EIRP) compliant with
the Federal Communications Commission (FCC).
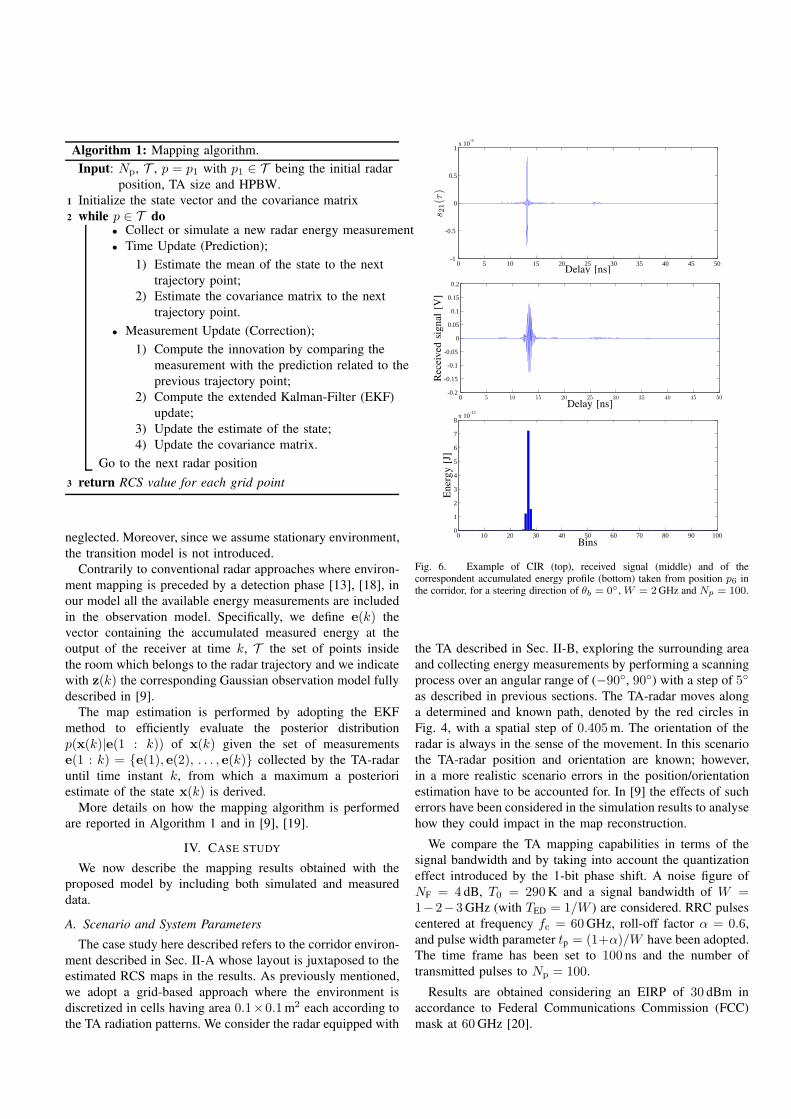
In Figs. 6, 7 the CIR s21(τ), the received signal and the
energy profile collected from position p6 for two different
steering angles (θb = 0◦ and θb = −45◦, respectively) are
shown. The energy profile has been obtained by considering
Nbin time bins of duration TED. A signal bandwidth of
W = 2GHz (TED = 0.5 ns), a time frame Tf = 100 ns
(Nbin = 200) and Np = 100 transmitted pulses have been
taken into account. As we can see, when the steering angle
is fixed to θb = 0◦, the received signal presents a peak
in correspondence to 13 ns approximately. This refers to the
time-of-arrival (TOA) related to the reflection of the wall in
front of the radar at the end of the corridor. Thanks to the
high directivity and gain of the adopted TAs, all the other
reflections are filtered out or strongly mitigated. Contrarily,
when θb = −45◦, a first peak in the received signal can be
detected at 5 ns related to the left-hand wall side while the
highest peak is at approximately 18 ns probably corresponding
to the wall in the direction of the main beam.
III. MAPPING ALGORITHM
As previously anticipated, the goal of this paper is to
provide the feasibility of the mapping approach by exploiting
measurement data, and compare them with simulations. Thus,
the grid-based state-space model for probabilistic mapping
6
8
10
12
14
16
18
20
22
24
50 55 60 65 70
Gai
n[d
Bi]
Frequency [GHz]
−90 −60 −30 0 30 60 90−20
−15
−10
−5
0
5
10
15
20
25
theta
data1111111
data2
data3
f = 69 GHz
f = 60 GHz
f = 55 GHz
5
10
15
20
25
-5
-10
-15
-20
-90 -60 -30 30 60 90
0
0
0◦
180◦
θb
Gai
n[d
Bi]
Fig. 5. Computed maximum gain of the TA used for measurements forθb = 0
◦ as a function of frequencies (top), phase distribution and realizedgain for fL, fH and fc (bottom) [6].
we proposed in [11] has been considered, by including al-
ternatively both simulated and real measured data. Since we
suppose that the personal radar trajectory and orientation are
obtained using a dedicated positioning infrastructure, here we
focus only on mapping and not on simultaneous localization
and mapping (SLAM).
As reported in Fig. 1, the personal radar explores an
unknown environment by performing a beamsteering operation
during which its main beam is oriented in different spatial
directions. For each position and each steering direction, the
radar emits a train of Np pulses and then it collects the
respective backscattered response. Energies are evaluated by
subdividing the time frame into Nbin = ⌊Tf/TED⌋ time
slots (bins) of duration TED ≈ 1/W , which are successively
accumulated for Np times [11].
The environment has been discretized in NL = XgridYgrid
cells, where each cell is associated with a radar cross section
(RCS) value to be inferred by the estimation process. The cell
size is set in accordance to the minimum footprint area, as
detailed in Sec. IV.
The state vector of the system here considered is given by
x(k) = m(k) = [m1(k), . . . , mi(k), . . . , mNL(k)]
T(1)
where k is the discrete time instant and mi(k) indicates
the root radar cross section (RRCS) (with sign) of the ithcell of the grid, where the frequency dependency has been
Algorithm 1: Mapping algorithm.
Input: Np, T , p = p1 with p1 ∈ T being the initial radar
position, TA size and HPBW.
1 Initialize the state vector and the covariance matrix
2 while p ∈ T do• Collect or simulate a new radar energy measurement ;
• Time Update (Prediction);
1) Estimate the mean of the state to the next
trajectory point;
2) Estimate the covariance matrix to the next
trajectory point.
• Measurement Update (Correction);
1) Compute the innovation by comparing the
measurement with the prediction related to the
previous trajectory point;
2) Compute the extended Kalman-Filter (EKF)
update;
3) Update the estimate of the state;
4) Update the covariance matrix.
Go to the next radar position
3 return RCS value for each grid point
neglected. Moreover, since we assume stationary environment,
the transition model is not introduced.
Contrarily to conventional radar approaches where environ-
ment mapping is preceded by a detection phase [13], [18], in
our model all the available energy measurements are included
in the observation model. Specifically, we define e(k) the
vector containing the accumulated measured energy at the
output of the receiver at time k, T the set of points inside
the room which belongs to the radar trajectory and we indicate
with z(k) the corresponding Gaussian observation model fully
described in [9].
The map estimation is performed by adopting the EKF
method to efficiently evaluate the posterior distribution
p(x(k)|e(1 : k)) of x(k) given the set of measurements
e(1 : k) = {e(1), e(2), . . . , e(k)} collected by the TA-radar
until time instant k, from which a maximum a posteriori
estimate of the state x(k) is derived.
More details on how the mapping algorithm is performed
are reported in Algorithm 1 and in [9], [19].
IV. CASE STUDY
We now describe the mapping results obtained with the
proposed model by including both simulated and measured
data.
A. Scenario and System Parameters
The case study here described refers to the corridor environ-
ment described in Sec. II-A whose layout is juxtaposed to the
estimated RCS maps in the results. As previously mentioned,
we adopt a grid-based approach where the environment is
discretized in cells having area 0.1×0.1m2 each according to
the TA radiation patterns. We consider the radar equipped with
0 5 10 15 20 25 30 35 40 45 50-1
-0.5
0
0.5
1x 10
-3
s 21(τ)
Delay [ns]
0-0.2
-0.15
-0.1
-0.05
0
0.05
0.1
0.15
0.2
Rec
eived
sig
nal
[V]
Delay [ns]5 15 25 35 4510 20 30 40 50
0 10 20 30 40 50 60 70 80 90 1000
1
2
3
4
5
6
7
8x 10
-12
En
erg
y[J
]
Bins
Fig. 6. Example of CIR (top), received signal (middle) and of thecorrespondent accumulated energy profile (bottom) taken from position p6 inthe corridor, for a steering direction of θb = 0
◦ , W = 2GHz and Np = 100.
the TA described in Sec. II-B, exploring the surrounding area
and collecting energy measurements by performing a scanning
process over an angular range of (−90◦, 90◦) with a step of 5◦
as described in previous sections. The TA-radar moves along
a determined and known path, denoted by the red circles in
Fig. 4, with a spatial step of 0.405m. The orientation of the
radar is always in the sense of the movement. In this scenario
the TA-radar position and orientation are known; however,
in a more realistic scenario errors in the position/orientation
estimation have to be accounted for. In [9] the effects of such
errors have been considered in the simulation results to analyse
how they could impact in the map reconstruction.
We compare the TA mapping capabilities in terms of the
signal bandwidth and by taking into account the quantization
effect introduced by the 1-bit phase shift. A noise figure of
NF = 4 dB, T0 = 290K and a signal bandwidth of W =1−2−3GHz (with TED = 1/W ) are considered. RRC pulses
centered at frequency fc = 60GHz, roll-off factor α = 0.6,
and pulse width parameter tp = (1+α)/W have been adopted.
The time frame has been set to 100 ns and the number of
transmitted pulses to Np = 100.
Results are obtained considering an EIRP of 30 dBm in
accordance to Federal Communications Commission (FCC)
mask at 60GHz [20].

0 5 10 15 20 25 30 35 40 45 50-8
-6
-4
-2
0
2
4
6
8x 10
-5
s 21(τ)
Delay [ns]
0-0.01
-0.005
0
0.005
0.01
Rec
eived
sig
nal
[V]
Delay [ns]5 15 25 35 4510 20 30 40 50
0 10 20 30 40 50 60 70 80 90 1000
0.5
1
1.5
2
2.5
3
3.5
x 10-14
En
erg
y[J
]
Bins
Fig. 7. Example of CIR (top), received signal (middle) and of thecorrespondent accumulated energy profile (bottom) taken from position p6in the corridor, for a steering direction of θb = −45
◦, W = 2GHz andNp = 100.
B. Mapping Results with Measured Energy Vectors
In this case, the measurement vector e(k) is given by data
collected in Sec. II, where the energy profiles are directly
included.
In Fig. 8 the mapping results exploiting the accumulated
energy measurements are reported as a function of the signal
bandwidth. Specifically, from the left to the right the RCS
estimated map obtained with W = 1GHz (i.e. TED = 1 ns),
W = 2GHz (i.e. TED = 0.5 ns) and W = 3GHz (i.e.
TED = 0.34 ns) are shown. As expected, when increasing
the bandwidth the mapping performance improves due to the
increased temporal resolution.
Results obtained with W = 3GHz are quite satisfactory
as there is a nice match between the real maps and those
estimated.
C. Mapping Results with Simulated Energy Vectors
We then simulate the measurements step taking into account
the RCS scattering model described in [21] with a wall
made of aerate concrete (i.e. relative permittivity equal to
ǫr = 2.26 and its loss tangent to 0.0491) and by exploiting
the mapping model proposed in [19]. In this scenario, we have
considered the radar moving with a speed of 1m/s and taking
measurements every 0.4 s. The radiation characteristics of the
x [m]
y
[m]
00
0.5
1
1
1.5
2
2
2.5
3
3
3.5
4
4 5 x [m]
y
[m]
00
0.5
1
1
1.5
2
2
2.5
3
3
3.5
4
4 5
RCS
0.002[
m2]
x [m]
y
[m]
00
0
0.5
1
1
1.5
2
2
2.5
3
3
3.5
4
4 5
Fig. 8. Mapping results using 1-bit 20 × 20 transmitarrays, W = 1− 2−3GHz (top-left, top-right and bottom, respectively), Np = 100 and exploitingreal measured data.
1-bit 20× 20 TAs used for measurements have been included
in the simulator. As before, in Fig. 9 the simulation results are
reported as a function of the signal bandwidth. Discrepancies
between the previous results are due to different phenomena.
First of all in the simulations a simple scattering model has
been assumed. As a consequence, when considering collected
measurements as an input for the mapping simulator a mis-
match between the model and the real scattering behaviour
can cause a performance degradation. Secondly, in simulations
we have assumed a free space propagation condition for
each interrogated cell supposing that the multipath effects is
implicitly taken into account when including all the array
pattern information in the grid-based approach. Obviously a
more realistic channel model might help to fill the gap between
simulations and measurements. Finally, in the simulation re-
sults the far-field assumption has been made. Thanks to this
hypothesis, it is possible to exploit the far-field TA radiation
pattern both in the prediction and the measurement phases
when evaluating the mapping performance. Contrarily, in the
real scenario where the measurements have been collected in
a corridor (1.6m width) the far-field condition is not always
satisfied due to the high TA directivity with the consequence
that the expected TA main beam could be not perfectly formed.
This fact could cause a mismatch between the prediction and
the measurement step of the mapping algorithm. Future works
will be addressed in improving the mapping algorithm by
properly accounting for such phenomena.
V. CONCLUSIONS
In this paper we present an indoor backscattering measure-
ment campaign at millimeter-wave for personal radar mapping
applications. Two 1-bit 20 × 20 linearly polarized TAs have

x [m]
y
[m]
00
0.5
1
1
1.5
2
2
2.5
3
3
3.5
4
4 5 x [m]
y
[m]
00
0.5
1
1
1.5
2
2
2.5
3
3
3.5
4
4 5
RCS
0.002[
m2]
x [m]
y
[m]
000
0.5
1
1
1.5
2
2
2.5
3
3
3.5
4
4
5
Fig. 9. Mapping results using 1-bit 20× 20 transmitarrays, W = 1− 2−3GHz (top-left, top-right and bottom, respectively), Np = 100 and exploitingsimulated data.
been used in a bistatic radar configuration to scan a real
office environment. The data collected have been exploited
for map reconstruction using a grid-based Bayesian state-
space approach. Results have demonstrated the feasibility of
the mmW personal radar, previously proved only through
simulations, and that a good quality of map reconstruction
can be achieved even when a limited set of phase values, i.e.
only two in our case, are available.
ACKNOWLEDGMENT
This work has been supported by the Italian Ministerial
PRIN project GRETA (Grant 2010WHY5PR), H2020 project
XCycle and in part by the H2020-EU.1.3.2 IF-EF Marie-Curie
project MAPS (Grant 659067).
REFERENCES
[1] http://www.huawei.com/5gwhitepaper/.
[2] F. Rusek et al., “Scaling up MIMO: Opportunities and challenges withvery large arrays,” IEEE Signal Processing Mag., vol. 30, no. 1, pp.40–60, 2013.
[3] T. Rappaport et al., “Millimeter wave wireless communications.” Pren-tice Hall, 2014.
[4] F. Boccardi et al., “Five disruptive technology directions for 5G,” IEEE
Commun. Mag., vol. 52, no. 2, pp. 74–80, February 2014.
[5] W. Hong et al., “Study and prototyping of practically large-scalemmwave antenna systems for 5G cellular devices,” IEEE Commun.
Mag., vol. 52, no. 9, pp. 63–69, September 2014.
[6] H. Kaouach et al., “Wideband low-loss linear and circular polarizationtransmit-arrays in V-band,” IEEE Trans. Antennas Propag., vol. 59,no. 7, pp. 2513–2523, July 2011.
[7] A. Clemente et al., “Multiple feed transmit-array antennas with reducedfocal distance,” in Proc. 42nd European Microwave Conf. (EuMC), Oct2012, pp. 826–829.
[8] L. Di Palma et al., “Circularly polarized transmit-array with sequentiallyrotated elements in Ka band,” in Proc. 8th European Conf. on Antennas
and Propag. (EuCAP), April 2014, pp. 1418–1422.
[9] F. Guidi, A. Guerra, and D. Dardari, “Personal mobile radars withmillimeter-wave massive arrays for indoor mapping,” IEEE Trans. on
Mobile Comp., vol. 14, no. 99, 2015.[10] ——, “Millimeter-wave massive arrays for indoor SLAM,” in Proc.
IEEE Int. Conf. on Commun. (ICC), June 2014, pp. 114–120.[11] A. Guerra, F. Guidi, and D. Dardari, “Millimeter-wave personal radars
for 3D environment mapping,” in Proc. IEEE Asilomar Conf. on Signals,
Systems, and Computers, Pacific Grove, USA, Nov. 2014.[12] A. Guerra et al., “Application of transmitarray antennas for indoor map-
ping at millimeter-waves,” in Proc. IEEE European Conf. on Networks
and Commun. (EUCNC), 2015.[13] E. Jose and M. Adams, “An augmented state SLAM formulation for
multiple line-of-sight features with millimetre wave radar,” in Proc.
IEEE/RSJ Int. Conf. Intelligent Robots and Syst., Aug. 2005, pp. 3087–3092.
[14] C. Wu, Z. Yang, and Y. Liu, “Smartphones based crowdsourcing forindoor localization,” IEEE Trans. Mobile Comp., vol. PP, no. 99, pp.1–1, 2014.
[15] D. Dardari et al., “A combined GP-state space method for efficient crowdmapping,” in Proc. IEEE Int. Conf. on Commun. (ICC), June 2015.
[16] H. Kaouach et al., “Wideband low-loss linear and circular polarizationtransmit-arrays in v-band,” IEEE Trans. on Antennas and Propag.,vol. 59, no. 7, pp. 2513–2523, July 2011.
[17] J. A. Zevallos Luna and L. Dussopt, “A V-band switched-beam transmit-array antenna,” International Journal of Microwave and Wireless Tech-
nologies, vol. 6, pp. 51–56, 2 2014.[18] E. Jose et al., “Predicting Millimeter Wave Radar Spectra for Au-
tonomous Navigation,” IEEE Sensors J., vol. 10, no. 5, pp. 960–971,May 2010.
[19] A. Guerra, F. Guidi, and D. Dardari, “Position and orientation errorbound for wideband massive antenna arrays,” in Proc. IEEE Int. Conf.
on Commun. (ICC), ANLN Workshop, 2015.[20] “Revision of Part 15 of the Commissions Rules Regarding Operation
in the 57-64 GHz Band,” Federal Communications Commission (FCC),Aug. 2013.
[21] L. Correia and P. Frances, “Estimation of materials characteristics frompower measurements at 60 GHz,” in Proc. IEEE 5th Int. Symp. on
Personal, Indoor and Mobile Radio Commun. (PIRMC), 1994, pp. 510–513 vol.2.


![[Chu] Backscattering Spectrometry](https://static.fdocuments.us/doc/165x107/553e2752550346b9308b4919/chu-backscattering-spectrometry.jpg)