Millennium Cohort Study: Age 17 Sweep (MCS7)
97
Millennium Cohort Study: Age 17 Sweep (MCS7) User guide 1 st edition, August 2020
Transcript of Millennium Cohort Study: Age 17 Sweep (MCS7)
Millennium Cohort Study:
Age 17 Sweep (MCS7)
User guide
1st edition, August 2020

Contact
Questions and feedback about this user guide should be sent to
How to cite this guide
Fitzsimons, E., Haselden, L., Smith, K., Gilbert, E., Calderwood, L., Agalioti-
Sgompou, V., Veeravalli, S., Silverwood, R., Ploubidis, G. (2020) Millennium Cohort
Study Age 17 Sweep (MCS7): User Guide. London: UCL Centre for Longitudinal
Studies.
This guide was first published in August 2020 by the UCL Centre for Longitudinal Studies.
UCL Institute of Education
University College London
20 Bedford Way
London WC1H 0AL
www.cls.ucl.ac.uk
The UCL Centre for Longitudinal Studies (CLS) is an Economic and Social Research
Council (ESRC) Resource Centre based at the UCL Institution of Education (IOE), University
College London. It manages four internationally-renowned cohort studies: the 1958 National
Child Development Study, the 1970 British Cohort Study, Next Steps, and the Millennium
Cohort Study. For more information, visit www.cls.ucl.ac.uk.
This document is available in alternative formats. Please contact the
Centre for Longitudinal Studies.
tel: +44 (0)20 7612 6875
email: [email protected]

1
Contents
Contact ................................................................................................... 1
How to cite this guide .............................................................................. 1
1. Background ......................................................................................... 8
1.1 The Millennium Cohort Study ............................................................................ 8
1.2 Overview of MCS7 .......................................................................................... 10
2. The sample ....................................................................................... 11
2.1 Birth dates ....................................................................................................... 11
2.2 Stratification .................................................................................................... 11
2.3 Clustering ........................................................................................................ 12
2.4 Drawing the sample ........................................................................................ 13
2.5 The original sample size ................................................................................. 13
2.6 MCS sample Sweeps 2 to 6 ............................................................................ 14
2.7 The MCS 7 sample and response ................................................................... 16
2.8 MCS7 response .............................................................................................. 16
3. Survey development and contents .................................................... 18
3.1 Development and piloting of MCS7 ................................................................. 18
3.2 Content ........................................................................................................... 21
4. Fieldwork .......................................................................................... 23
4.1 Briefings .......................................................................................................... 23
4.2 Fieldwork timetable ......................................................................................... 23
4.3 Languages ...................................................................................................... 24
2
5. Dataset Information and Handling ..................................................... 26
5.1 Data structures and key identifiers .................................................................. 26
5.2 Dataset conventions ....................................................................................... 27
5.2.1 Variable names ................................................................................................... 27
5.2.2 Variable labels .................................................................................................... 29
5.3 Notes on specific datasets .............................................................................. 30
5.3.1 Household grid (mcs7_hhgrid) and outcome variables ........................................ 30
5.3.2 Sample and distribution of information in datasets .............................................. 34
5.3.3 CM interview dataset ........................................................................................... 35
5.3.4 Parent interview dataset ...................................................................................... 36
5.3.5 Cognitive assessment dataset............................................................................. 37
5.3.6 Paradata ............................................................................................................. 37
5.3.7 Derived variables ................................................................................................ 37
6. The household grid and the household questionnaire ....................... 38
6.1 Background and introduction .......................................................................... 38
6.1.1 What is the household grid? ................................................................................ 38
6.1.2 How is the household grid information collected? ................................................ 38
6.2 Contents of the household grid and household questionnaire ........................ 39
6.2.1 What information is collected in the household grid? ........................................... 39
6.2.2 What other information was collected in the household questionnaire and where is
it stored? ...................................................................................................................... 40
7. Overview of cohort member questionnaires ...................................... 41
7.1 Background and introduction .......................................................................... 41
7.2 Baseline numbers ........................................................................................... 41
7.3 The cohort member interview (CAPI) .............................................................. 41
7.3.1 Content of the Young Person Interview ............................................................... 41
7.4 The cohort member questionnaire (CASI) ....................................................... 44
3
7.4.1 Content of the Young Person self-completion questionnaire ............................... 44
7.4.2 Young person self-completion questionnaire scales ............................................ 47
7.5 The cohort member online questionnaire (CAWI) ........................................... 55
7.5.1 Content of the Young Person online questionnaire .............................................. 55
7.5.2 Young person online questionnaire scales .......................................................... 58
7.6 Overview of the online follow-up with cohort members (Boost sample) (CAWI
Boost) ................................................................................................................... 61
7.6.1 Background and introduction ............................................................................... 61
7.6.2 Baseline numbers ............................................................................................... 61
7.6.3 Contents of the online follow-up questionnaire .................................................... 61
7.6.4 Scales ................................................................................................................. 62
8. Young Person Cognitive Assessment ............................................... 63
8.1 Background and introduction .......................................................................... 63
8.2 Baseline numbers ........................................................................................... 63
9. Physical measurements .................................................................... 64
9.1 Background to physical measurements on MCS ............................................ 64
9.2 Height.............................................................................................................. 64
9.3 Weight and body fat ........................................................................................ 65
9.4 Weight only ..................................................................................................... 65
9.5 Consent ........................................................................................................... 65
9.6 Cohort Members aged 18 ............................................................................... 66
9.7 Baseline numbers ........................................................................................... 66
9.8 Data format ..................................................................................................... 66
9.9 Derived variables ............................................................................................ 67
9.10 Reference cut-offs ......................................................................................... 67
10. Overview of the parent questionnaires ............................................ 68

4
10.1 Background and introduction ........................................................................ 68
10.1.1 What are the parent questionnaires ................................................................... 68
10.1.2 How were parents identified at MCS7? ............................................................. 68
10.1.3 Are the parent respondents the same people in all sweeps? ............................. 68
10.2 Baseline numbers ......................................................................................... 69
10.3 Contents of the parent questionnaires .......................................................... 69
10.3.1 Income .............................................................................................................. 70
10.3.2 Total income data .............................................................................................. 70
10.3.3 Missing income data (item non-response) ......................................................... 71
10.4 Scales ........................................................................................................... 71
10.4.1 Kessler 6 Scale ................................................................................................. 71
10.4.2 Strengths and Difficulties Questionnaire (SDQ) ................................................. 72
10.5 Feed forward data ......................................................................................... 74
11. Data linkage .................................................................................... 75
11.1 Asking for administrative data linkage consent ............................................. 75
11.2 Consent process ........................................................................................... 76
11.3 Achieved consent rates ................................................................................. 76
11.4 Linked data deposit and documentation........................................................ 77
12. Non-Response and Weights ........................................................... 78
12.1 Response in MCS ......................................................................................... 78
12.2 Predicting response at MCS7 ....................................................................... 84
12.2.1 Method .............................................................................................................. 84
12.2.2 Results .............................................................................................................. 87
12.2.3 Effectiveness of the weights .............................................................................. 91
12.3 Supporting documents .................................................................................. 93
12.4 References .................................................................................................... 94

5
6
About the Millennium Cohort Study
The Millennium Cohort Study (MCS) is a longitudinal birth cohort study,
following a nationally representative sample of approximately 19,000 people born in
the UK at the turn of the century.
Through the study, we have captured rich information about the different aspects of
cohort members’ lives, from birth to childhood and adolescence, and we are
continuing to keep up with them now they are adults.
As a multidisciplinary study, MCS is used by researchers working in a wide range of
fields. Findings from MCS have influenced policy at the highest level, and today
the study remains a vital source of evidence on the major issues affecting young
people’s lives.
Related documents
“Millennium Cohort Study Seventh Sweep (MCS7) Technical Report. Prepared for
the Centre for Longitudinal Studies, UCL Institute for Education” - Ipsos Mori
MCS7 Questionnaires
MCS Longitudinal Data Dictionary (spreadsheet)
“MCS7 Derived Variables User Guide” - Sunil Veeravalli
“MCS Data Handling Guide” - Vilma Agalioti-Sgompou & Jon Johnson

7
Important note about figures in this
document
Figures that are presented in this document vary compared to the totals of the
datasets. This happens due to various reasons: resolution of duplicate cases or
whether the data are available under End User Licence (for example, the cases that
include triplets are available under Secure Access). The DATA_AVAILABILITY
variable of the mcs_longitudinal_family_file marks which cases have available data
under End User Licence and helps users to estimate the final sample size that can
be used for research purposes under End User Licence.
The data under Secure Access Licence can be requested by applying for Data
Access : https://cls.ucl.ac.uk/data-access-training/data-enhancements/ or by
contacting [email protected] . The mcs_longitudinal_family_file is available
here: https://beta.ukdataservice.ac.uk/datacatalogue/studies/study?id=8172 .
8
1. Background
1.1 The Millennium Cohort Study
The Millennium Cohort Study (MCS) is a multi-disciplinary research project following
the lives of an original 18,818 children born in the UK in 2000-02. The sample was
augmented in early childhood with a further 701 children born in the same period
who had been missed previously, taking the total sample to 19,519 (note, there is no
sample refreshment by immigrants). At the time of writing, it is the most recent of
Britain’s world-renowned national longitudinal birth cohort studies. The study has
been tracking the Millennium children through their childhood years and plans to
follow them through adulthood. It collects information directly from the cohort
members, their resident parents and, in two of its sweeps, older siblings. The MCS
covers such diverse topics as parenting; childcare; schooling and education; daily
activities and behaviour; cognitive development; child and parent mental and
physical health; employment and education; income and poverty; housing,
neighbourhood and residential mobility; and social capital, ethnicity and identity.
The seven surveys of MCS cohort members carried out so far have built up a
uniquely detailed portrait of the children of the new century. The seventh, Age 17,
survey, which is the subject of this User Guide, marked an important transitional time
in the cohort members’ lives, where educational and occupational paths can diverge
significantly. It is also an important age in data collection terms since it may be the
last sweep at which parents are interviewed and it is an age when direct
engagement with the cohort members themselves rather than their families is crucial
to the long term viability of the study. To reflect this, we conducted face to face
interviews with the cohort members for the first time. Cohort members were also
asked to do a range of other activities including filling in a self-completion
questionnaire on the interviewer’s tablet, completing a cognitive assessment
(number activity) and having their height weight and body fat measurements taken.
In addition, they were asked to complete a short online questionnaire after the visit.
Parental involvement at MCS7 was as follows; resident parents were asked to
complete a household interview and a short online questionnaire, and one parent
was asked to complete a Strengths and Difficulties Questionnaire (SDQ) about the
9
cohort member. Cohort members who were either unable or unwilling to complete
the main survey were asked to complete a short follow up questionnaire online after
the fieldwork finished. This contained some key questions and was designed to
boost response and maintain engagement.
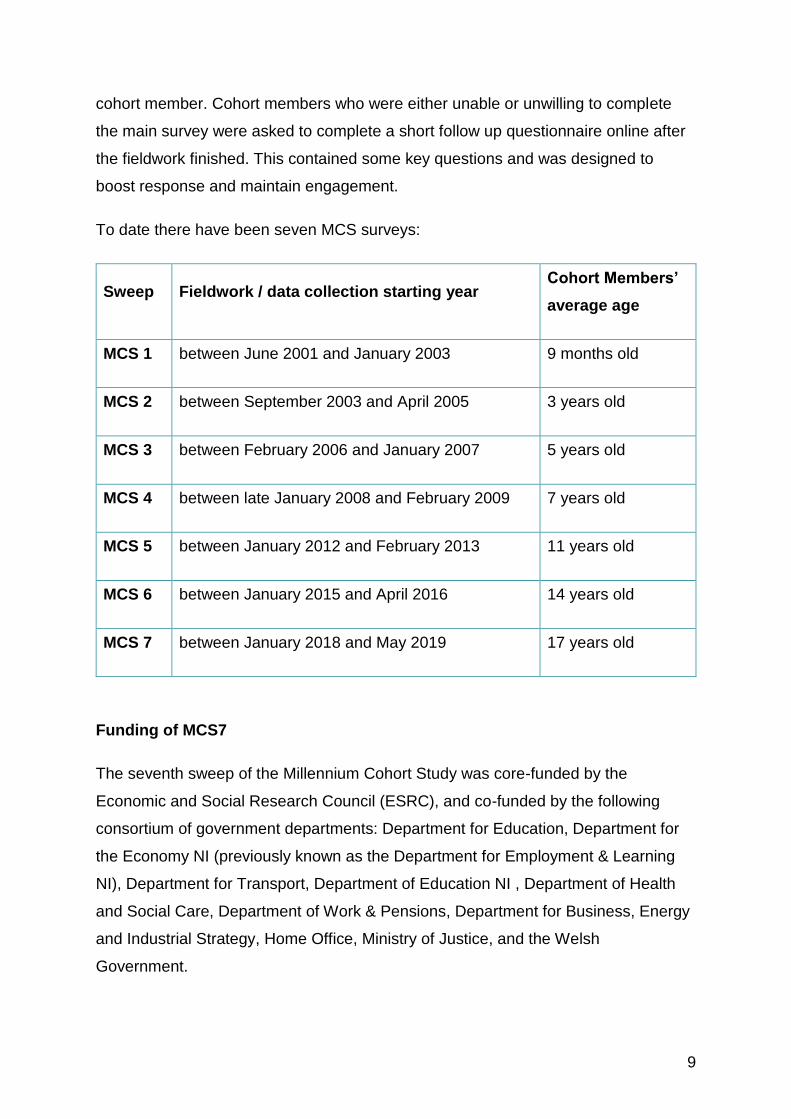
To date there have been seven MCS surveys:
Sweep Fieldwork / data collection starting year Cohort Members’
average age
MCS 1 between June 2001 and January 2003 9 months old
MCS 2 between September 2003 and April 2005 3 years old
MCS 3 between February 2006 and January 2007 5 years old
MCS 4 between late January 2008 and February 2009 7 years old
MCS 5 between January 2012 and February 2013 11 years old
MCS 6 between January 2015 and April 2016 14 years old
MCS 7 between January 2018 and May 2019 17 years old
Funding of MCS7
The seventh sweep of the Millennium Cohort Study was core-funded by the
Economic and Social Research Council (ESRC), and co-funded by the following
consortium of government departments: Department for Education, Department for
the Economy NI (previously known as the Department for Employment & Learning
NI), Department for Transport, Department of Education NI , Department of Health
and Social Care, Department of Work & Pensions, Department for Business, Energy
and Industrial Strategy, Home Office, Ministry of Justice, and the Welsh
Government.

10
1.2 Overview of MCS7
The seventh sweep of the Millennium Cohort Study was carried out when the cohort
members were 17 years old. As 17 is a key transitional age, the sweep purposefully
focussed on engaging with the cohort members themselves (rather than their
parents) It included:
A household interview (conducted with a resident parent if they were
willing and able to do so, or with the cohort member themselves if no such
parent was available)
interview CAPI (computer-assisted personal interview) with the cohort
member, including a section asking for permission to carry out various
administrative data linkages
a self-completion (CASI) interview with the cohort members conducted in
the household
cognitive assessment (number activity) for cohort member
completion of a paper Strengths and Difficulties questionnaire (SDQ) by
one parent
Completion of the SDQ by the cohort member for the first time (done in
CASI)
physical measurements of the cohort member
an online questionnaire for each of the parents
an online questionnaire for the young person (completed after the main
interview).
11
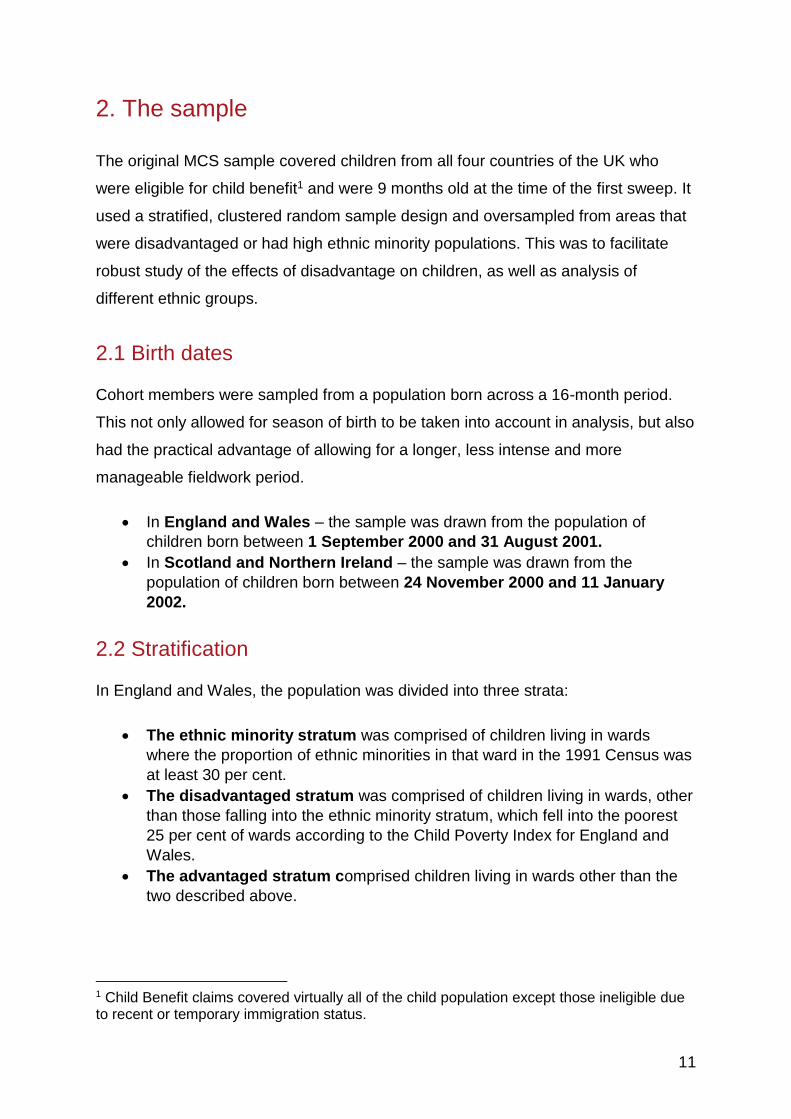
2. The sample
The original MCS sample covered children from all four countries of the UK who
were eligible for child benefit1 and were 9 months old at the time of the first sweep. It
used a stratified, clustered random sample design and oversampled from areas that
were disadvantaged or had high ethnic minority populations. This was to facilitate
robust study of the effects of disadvantage on children, as well as analysis of
different ethnic groups.
2.1 Birth dates
Cohort members were sampled from a population born across a 16-month period.
This not only allowed for season of birth to be taken into account in analysis, but also
had the practical advantage of allowing for a longer, less intense and more
manageable fieldwork period.
In England and Wales – the sample was drawn from the population of
children born between 1 September 2000 and 31 August 2001.
In Scotland and Northern Ireland – the sample was drawn from the
population of children born between 24 November 2000 and 11 January
2002.
2.2 Stratification
In England and Wales, the population was divided into three strata:
The ethnic minority stratum was comprised of children living in wards
where the proportion of ethnic minorities in that ward in the 1991 Census was
at least 30 per cent.
The disadvantaged stratum was comprised of children living in wards, other
than those falling into the ethnic minority stratum, which fell into the poorest
25 per cent of wards according to the Child Poverty Index for England and
Wales.
The advantaged stratum comprised children living in wards other than the
two described above.
1 Child Benefit claims covered virtually all of the child population except those ineligible due to recent or temporary immigration status.
12
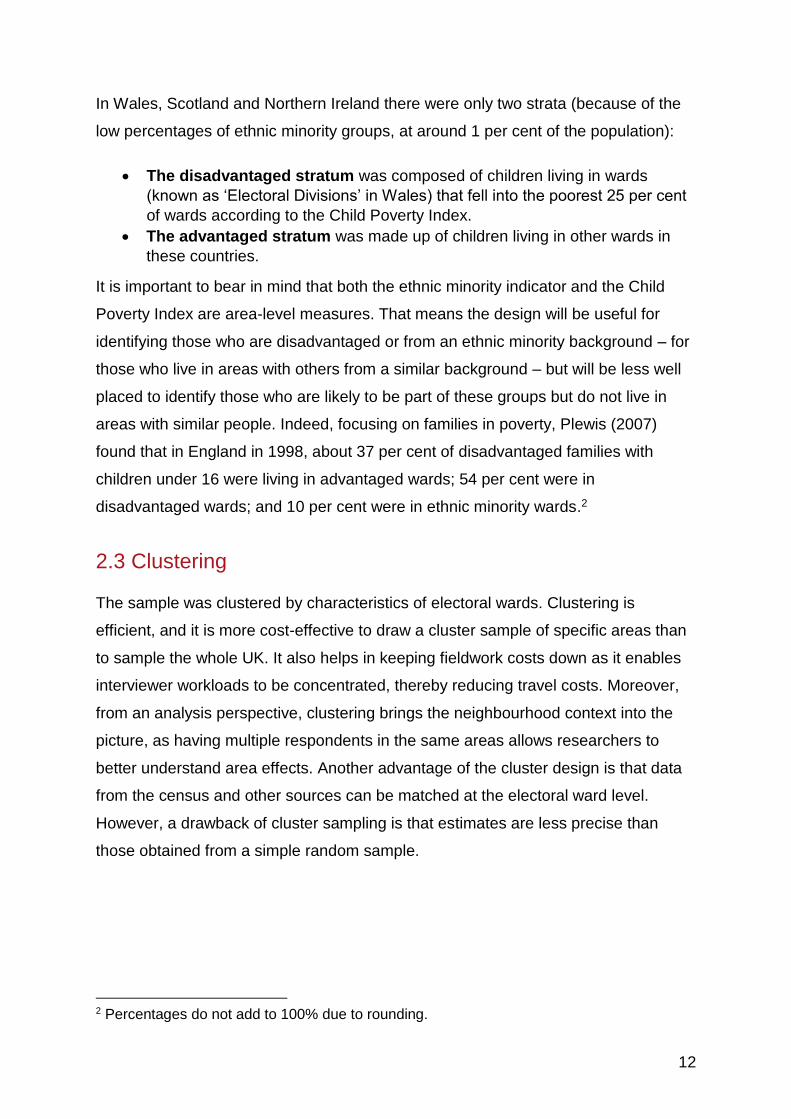
In Wales, Scotland and Northern Ireland there were only two strata (because of the
low percentages of ethnic minority groups, at around 1 per cent of the population):
The disadvantaged stratum was composed of children living in wards
(known as ‘Electoral Divisions’ in Wales) that fell into the poorest 25 per cent
of wards according to the Child Poverty Index.
The advantaged stratum was made up of children living in other wards in
these countries.
It is important to bear in mind that both the ethnic minority indicator and the Child
Poverty Index are area-level measures. That means the design will be useful for
identifying those who are disadvantaged or from an ethnic minority background – for
those who live in areas with others from a similar background – but will be less well
placed to identify those who are likely to be part of these groups but do not live in
areas with similar people. Indeed, focusing on families in poverty, Plewis (2007)
found that in England in 1998, about 37 per cent of disadvantaged families with
children under 16 were living in advantaged wards; 54 per cent were in
disadvantaged wards; and 10 per cent were in ethnic minority wards.2
2.3 Clustering
The sample was clustered by characteristics of electoral wards. Clustering is
efficient, and it is more cost-effective to draw a cluster sample of specific areas than
to sample the whole UK. It also helps in keeping fieldwork costs down as it enables
interviewer workloads to be concentrated, thereby reducing travel costs. Moreover,
from an analysis perspective, clustering brings the neighbourhood context into the
picture, as having multiple respondents in the same areas allows researchers to
better understand area effects. Another advantage of the cluster design is that data
from the census and other sources can be matched at the electoral ward level.
However, a drawback of cluster sampling is that estimates are less precise than
those obtained from a simple random sample.
2 Percentages do not add to 100% due to rounding.

13
2.4 Drawing the sample
The sample was randomly selected within each of three strata in each country,
producing a disproportionately stratified cluster sample. This means that the sample
is not self-weighting, and so weighted estimates of means, variance etc. are required
(Plewis 2007).
Once the sample wards were selected, a list of all children turning 9 months old
during the 16-month survey window and living in those wards was generated from
the Child Benefit (CB) register provided by the then Department for Social Security
(DSS), now the Department for Work and Pensions (DWP). At that time, CB was a
universal provision, payable (usually to the mother) from birth. The DWP wrote to all
eligible families asking the CB recipient to opt out if they did not want to be included
in the survey. An opt-out procedure tends to be more inclusive of marginal and low
literacy respondents than an opt-in procedure, and also results in higher response
rates. The DWP withdrew sensitive cases from the issued sample. These included
families where children had died or had been taken into local authority care by that
point, or where there was an investigation into benefit fraud within the family. In
addition, if families had already taken part in the DWP’s Families and Children
Survey (FACS), they were excluded from the sample.3
Because the CB records did not include all families who had moved into the sample
wards as the child approached 9 months, an additional sample was drawn using
health visitors to find eligible families who had moved into the selected areas and
who had eligible children. Fifty-six families were found in this way.
2.5 The original sample size
The MCS1 survey reached 18,552 families which, after allowing for 256 sets of twins
and 10 sets of triplets, amounted to 18,818 cohort children. Six families have two
singletons in the sample. The table below shows how these respondents are
distributed across the four countries of the UK. Further details by stratum appear in
the Technical Report on Sampling (4th edition) (Plewis 2007).
3 This affected only 40 cases.
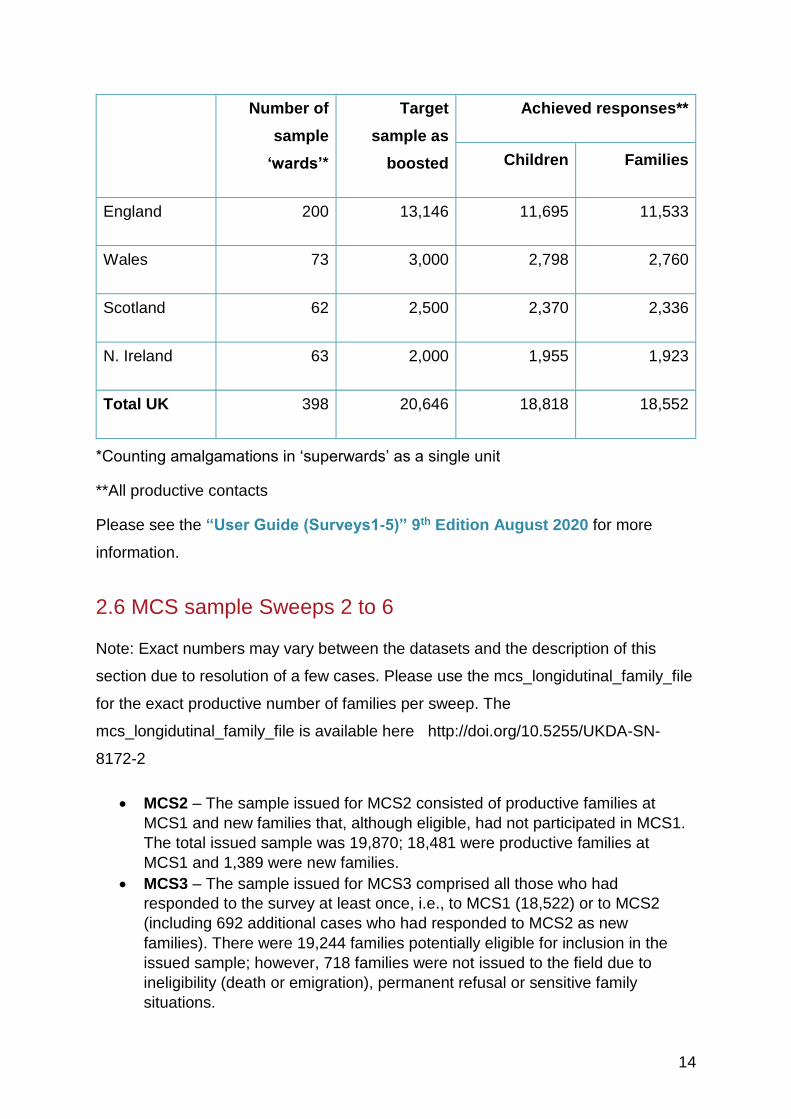
14
Number of
sample
‘wards’*
Target
sample as
boosted
Achieved responses**
Children Families
England 200 13,146 11,695 11,533
Wales 73 3,000 2,798 2,760
Scotland 62 2,500 2,370 2,336
N. Ireland 63 2,000 1,955 1,923
Total UK 398 20,646 18,818 18,552
*Counting amalgamations in ‘superwards’ as a single unit
**All productive contacts
Please see the “User Guide (Surveys1-5)” 9th Edition August 2020 for more
information.
2.6 MCS sample Sweeps 2 to 6
Note: Exact numbers may vary between the datasets and the description of this
section due to resolution of a few cases. Please use the mcs_longidutinal_family_file
for the exact productive number of families per sweep. The
mcs_longidutinal_family_file is available here http://doi.org/10.5255/UKDA-SN-
8172-2
MCS2 – The sample issued for MCS2 consisted of productive families at
MCS1 and new families that, although eligible, had not participated in MCS1.
The total issued sample was 19,870; 18,481 were productive families at
MCS1 and 1,389 were new families.
MCS3 – The sample issued for MCS3 comprised all those who had
responded to the survey at least once, i.e., to MCS1 (18,522) or to MCS2
(including 692 additional cases who had responded to MCS2 as new
families). There were 19,244 families potentially eligible for inclusion in the
issued sample; however, 718 families were not issued to the field due to
ineligibility (death or emigration), permanent refusal or sensitive family
situations.
15
MCS4 – The sample for MCS4 was the same as for MCS3 (i.e., those who
had responded at least once to MCS1 and MCS2). There were 19,244
families potentially eligible for the survey. However 2,213 cases were not
issued to the field due to ineligibility from death or emigration, permanent
refusal or sensitive family situations.
MCS5 – The sample for MCS5 was the same as for MCS3 and MCS4 (i.e.,
those who had responded at least once to MCS1 and MCS2). There were
19,244 families potentially eligible for the survey. However, 2,581 were not
issued to the field due to ineligibility from death or emigration, permanent
refusal or sensitive family situations.
MCS6 – The sample for MCS6 was the same as for MCS3, MCS4 and MCS5
(ie those who had responded at least once to MCS1 and MCS2). There were
19, 243 families potentially eligible (one less than the previous waves as one
family was identified as having had duplicate records in previous waves).
However, 3,828 families were not issued into the field due to ineligibility from
death or emigration, permanent refusal or sensitive family situations.
Full details on the samples and responses for each of these sweeps can be found in
their respective user guides.
16
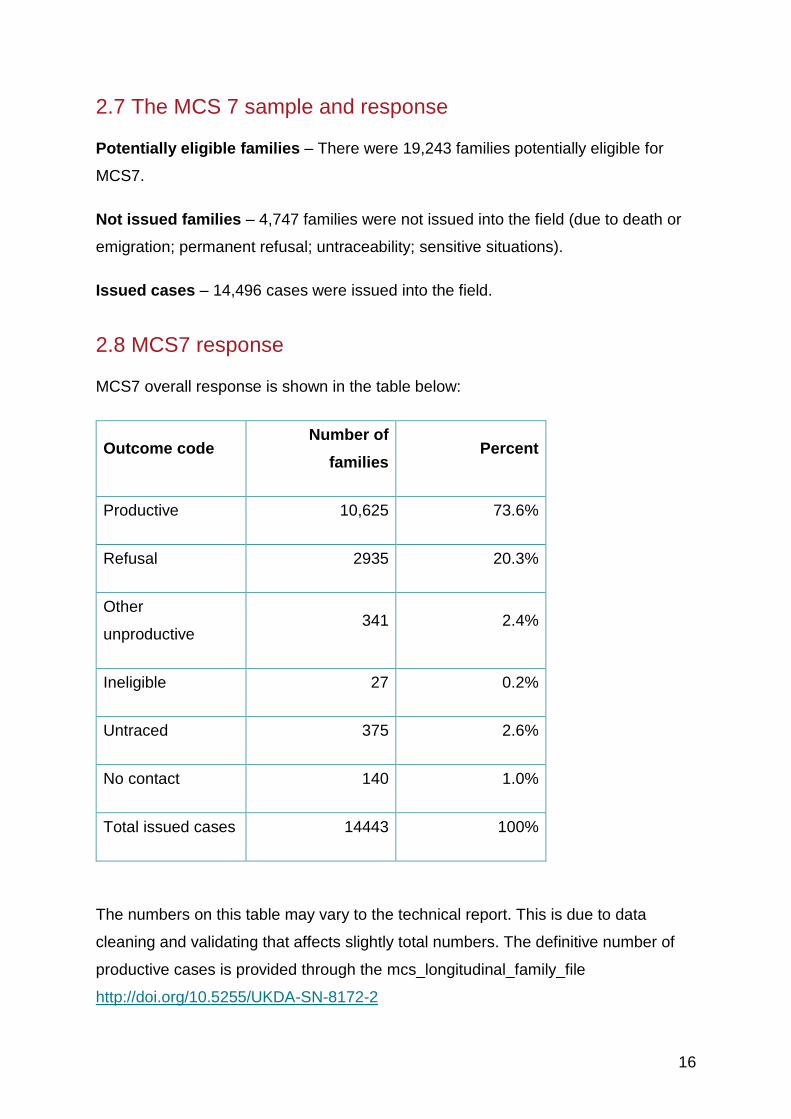
2.7 The MCS 7 sample and response
Potentially eligible families – There were 19,243 families potentially eligible for
MCS7.
Not issued families – 4,747 families were not issued into the field (due to death or
emigration; permanent refusal; untraceability; sensitive situations).
Issued cases – 14,496 cases were issued into the field.
2.8 MCS7 response
MCS7 overall response is shown in the table below:
Outcome code Number of
families Percent
Productive 10,625 73.6%
Refusal 2935 20.3%
Other
unproductive 341 2.4%
Ineligible 27 0.2%
Untraced 375 2.6%
No contact 140 1.0%
Total issued cases 14443 100%
The numbers on this table may vary to the technical report. This is due to data
cleaning and validating that affects slightly total numbers. The definitive number of
productive cases is provided through the mcs_longitudinal_family_file
http://doi.org/10.5255/UKDA-SN-8172-2

17
More information on number of cohort members or parents that have participated in
sweep 7 is available in the mcs7_hhgrid.
18
3. Survey development and contents
3.1 Development and piloting of MCS7
Development work on MCS7 was particularly important as considerably more
questionnaire data was being collected from cohort members than at other
sweeps and there were new challenges in terms of engaging them. The
development work covered the elaboration of survey content, instruments and
materials as well as study engagement and branding. Usability testing was
also conducted for the young person online questionnaire. The development
phase work preceded the pilot and dress rehearsal which tested all aspects of
the survey. Details of all the development phases are provided below, further
information about this can be found in the MCS7 technical report and related
published material.
Qualitative pre-testing workshops: a qualitative workshop was carried out
with non-cohort 16-17 year olds in February 2017 in Watford. The purpose
was to inform the final survey processes and procedures, communications
strategies, interviewer training and developing a strategy for reluctant
respondents. Five work stations were set up covering: contact and reminder
procedures, data collection modes, cognitive assessments, data linkage and
questionnaire design. The participants spent 20 minutes at each table with a
moderator and note taker. A table with low cost gifts was also provided and
young people were asked to vote for their favourite.
Cognitive testing: selected sections of the young person questionnaires
(CASI and CAWI) were cognitively tested in face to face interviews with
young people who were not cohort members in February to March 2017 in
three locations in England and one in Scotland. Specific objectives were to
test question wording to ensure comprehension by 17-year olds, particularly
where questions had previously been asked of parents. The focus of the
cognitive testing was to understand how young people comprehended the
questions, recalled the information being sought, decided how to answer the
questions, and to explore how they formatted and (possibly) edited their
response, in relation to the answer categories provided. The concept of data

19
linkage and an introduction to the Age 17 Survey were also explored during
this round of the testing.
Usability testing of young person online questionnaire: During April to
May 2017, usability testing was conducted to check the functionality of the
young person online questionnaire, with a focus on understanding how easy
the questionnaire was to complete by 17-year olds. Eleven face to face
interviews were complete using ‘Mr Tappy’ a purpose-built HD camera for a
filming participant’s interactions with a mobile, laptop or tablet device,
allowing observation of access and navigation through the survey.
Interviewers could see if there were any difficulties with access, navigation or
completion of the survey.
Brand testing: a brand ‘refresh’ was carried out in spring 2017 following
focus group testing, to ensure that the survey materials were relevant,
appropriate and appealing to 17-year olds.
Pilot 1: The first pilot survey took place between 13 April and 5 May 2017 in five
locations across England, Scotland and Wales using a quota sample to ensure that a
representative cross-section of young people and families was included. Two
external agencies recruited families with a 16/17 year old. Fifty two families were
interviewed. The overall objective of the first pilot was to test all data collection
elements in the field, along with fieldwork materials, consent procedures and
interviewer training.
Dress rehearsal pilot: The second, dress rehearsal, pilot took place between 4
August and 3 September 2017 in 13 locations across England, Scotland, Wales and
Northern Ireland. The Dress Rehearsal contained a mix of longitudinal sample
(cases who had participated in the Dress Rehearsal at previous sweeps of the study)
and a ‘fresh’ top up sample, which was included to test survey procedures and
protocols with as wide a range of households and interview scenarios as possible.
The ‘top up’ sample was selected to mirror the characteristics of the MCS7 cohort.
As with the first pilot, the dress rehearsal aimed to test how the data collection
elements performed in the field. In addition to evaluating the materials, consent
procedures and training, the dress rehearsal also tested the content and quality of

20
the sample and feed forward information and sample management procedures and
systems.
Further details of the first and dress rehearsal pilots can be found in the technical
report.

21
3.2 Content
The Age 17 Survey contained the following key elements:
Household interview (which established who the household members
were): 5 minutes
Cohort member:
Interviewer administered questionnaire (CAPI): 20 minutes
Self-completion questionnaire (CASI): 15 minutes
Online questionnaire (CAWI): 15 minutes
Physical measurements (height, weight and body fat): 10 minutes
Cognitive assessment (one number activity): 10 minutes
Consent to data linkage: 10 minutes
Parents:
Parent 1 and parent 2 online questionnaire (CAWI): 15 minutes
ONE PARENT: Strengths and Difficulties questionnaire (SDQ) on
paper: 5 minutes4.
Both parents received the same questionnaire, so there is no
distinction between Main and Partner respondent unlike in sweeps 1-6.
Information on data handling is in Chapter 5.
The diagram below provides an overview of the survey elements. It also indicates
average timings for each element, mode of administration, which consents were
required (and when), and whether the element was completed during or outside of
the household visit. This chart was used in the interviewer briefings to help
interviewers to understand how each of the different household elements fitted
together and to ensure that the visit was conducted as efficiently as possible.
4 Note that the cohort member also completed the SDQ in CASI.

22
Further details of each of the elements can be found in the respective sections of the
User Guide, and also in the Technical Report.
YP
questionnaire
CAWI
(15 mins)
YP CAWI
placement
(2 mins)
YP
questionnaire
CASI
(15 mins)
YP consent to
data linkage
CAPI
(10 mins)
Contact and appointment
making
Up
da
tin
g E
lectr
on
ic C
on
tact
Sh
ee
t
Eth
ica
l A
pp
roa
ch
SURVEY OVERVIEW
Key: Completed out of HHConsent
CAI element Non-CAI element,
completed out of HH
Non-CAI element, can be completed
during HH visit or out of HH
Parent CAWI
placement
(5 mins)
YP physical
measurements
CAPI
(10 mins)
YP cognitive
assessment
CAPI
(10 mins)
Final element
Parent
questionnaire
CAWI
(15 mins)
Parent
questionnaire
SDQ
(5 mins)
YP
questionnaire
CAPI
(20 mins)
Household interview
CAPI (10 mins)
Non- CAI element
Tracing movers
16-060822-01/ F09

23
4. Fieldwork
Following a competitive tender process, Ipsos MORI (IM) was appointed to carry out
the fieldwork for MCS7. Some interviewing work was subcontracted by IM to NatCen
in order to increase the field force available to work on MCS7. The first wave of the
mainstage fieldwork began in England and Wales in January 2018. Fieldwork in
Scotland and Northern Ireland started in February 2018.
4.1 Briefings
All interviewers attended a two-day briefing before working on the survey. The
briefings were run by researchers from Ipsos MORI and CLS, members of the Ipsos
MORI internal field team and region managers or region co-ordinators from Ipsos
MORI’s field force. In total, 311 interviewers (237 from Ipsos MORI and 74 from
NatCen) completed both days of the briefing. The size of the briefings varied
between regions and attendance ranged between 7 and 21 interviewers per briefing.
4.2 Fieldwork timetable
Fieldwork was conducted between 8 January 2018 and 8 April 2019. The fieldwork
timetable for MCS7 was driven by the requirement to interview the family during Year
12 in England/Wales (Year S6 in Scotland and Year 13 in Northern Ireland). As at
previous sweeps, the fieldwork was compressed into school years. In England and
Wales, the cohort birth dates span a single school year. However, in Scotland and
Northern Ireland the birthdates are spread over more than one school year. In
England, Wales and Northern Ireland, school year is normally determined by date of
birth. In Scotland, school year is determined by parental choice in addition to date of
birth. It is worth noting that because of fieldwork overrunning for this sweep of MCS,
1178 families (11 per cent of those interviewed) were interviewed when the cohort
members were in a different school year.
In order to manage the fieldwork effectively, it was divided into two phases. Phase 1
(January 2018 – July 2018) included all cohort members who were due to start Year
12 (England and Wales)/S6 (Scotland)/Sixth Form (Northern Ireland) in Autumn
2017, and phase 2 (August 2018- April 2019) included those who would start in
24
Autumn 2018. A number of interviews did not take place within their allotted phase
(e.g. because cohort members were uncontactable at the time or were unwilling to
participate at that time). Details of this are contained within the technical report.
4.3 Languages
Families in Wales were provided with all main communication materials in both
English and Welsh, and were also able to choose which language they participated
in: at the appointment-making stage, families living in Wales were asked if they
would like any of the parent or young person elements to be administered in Welsh.
If the family requested the interview to be conducted in Welsh, the address was
reallocated to a Welsh-speaking interviewer. The cohort member interview (CAPI)
could be verbally translated into Welsh (by a Welsh speaking interviewer). If
requested, a paper self-completion questionnaire in Welsh was available (instead of
the CASI). None of the cohort members who completed the interview in Wales
requested the Welsh language format. Cognitive assessment and physical
measurement instruction sheets, as well as the SDQ and online (CAWI)
questionnaire placements were also available in Welsh. Provision was made for the
online questionnaire scripts to be translated by a Welsh-speaking interviewer over
the telephone but no parents or cohort members requested this.
To support participation of parents with limited English, other language materials
were available upon request (they were not provided or required for cohort members,
all of whom were born and grew up in the UK and therefore have good spoken
English). Parents’ materials were available in the four languages most commonly
required at previous sweeps of the study: Bengali (2 requested), Gujarati (none
requested), Punjabi (Urdu script) (1 requested) and Urdu (7 requested). Occasionally
the main and partner respondents were unable to speak English or were
uncomfortable with completing the interview in that language. In such cases,
interviewers were instructed to find a ‘household interpreter’ or other informal
interpreter to translate the paper SDQ. Interpreters had to be 16 or over, and not a
child of the parent (due to the sensitive nature of the questions). Interviewers
indicated that 140 parent SDQs were translated in this way. Similarly, parents who
consented to fill in the online questionnaire but whose first language was not English

25
could ask for a friend or family member to translate the questionnaire for them. 185
parents indicated that they had done this.
26
5. Dataset Information and Handling
5.1 Data structures and key identifiers
The data of MCS7 is in a long format, namely, there is one row per respondent. The
key identifiers are:
MCSID is a family / household identifier
GPNUM00 is a person identifier for Parents / Carers or other individuals in the
household excluding the Cohort Member
GCNUM00 is a Cohort Member number that provides the number of the
Cohort Member within an MCS family.
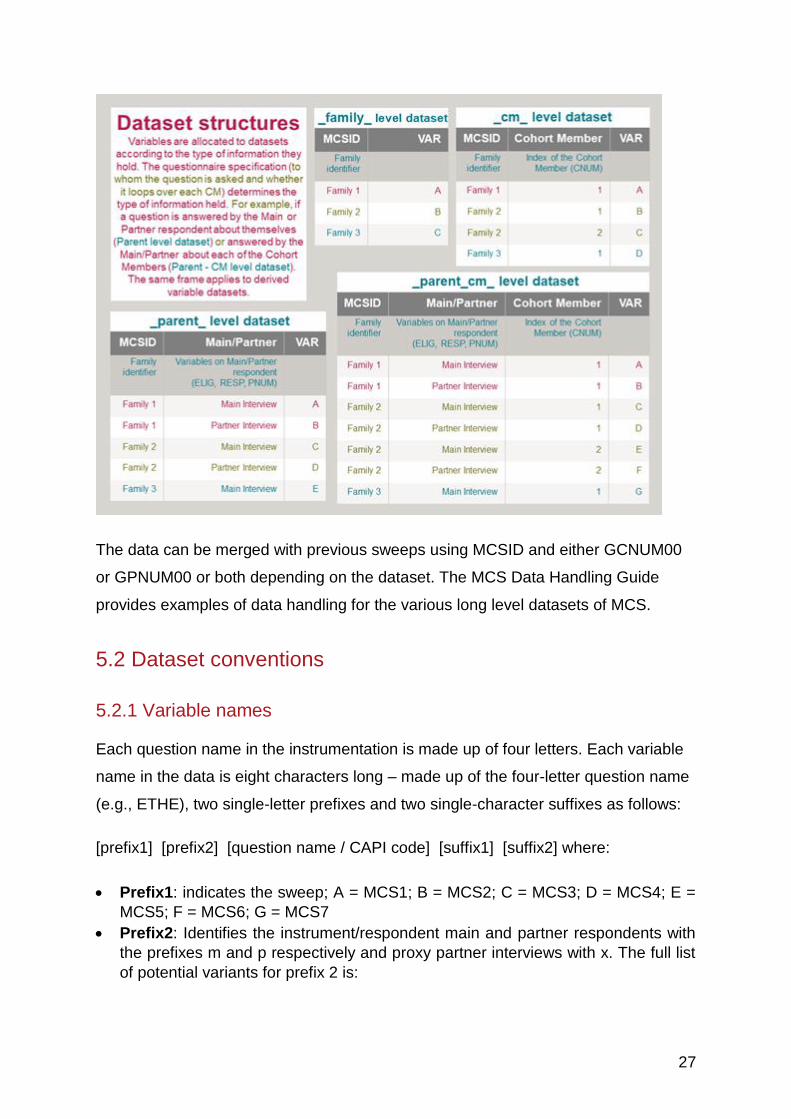
The datasets of MCS vary in levels. For example:
The _family_ level dataset has one row per family,
The _cm_ level dataset has one row per Cohort Member per family and has
two identifiers (MCSID and *CNUM*),
The _parent_ level dataset has one row per Parent / Carer that responded to
the Parent Questionnaire (MCSID and *PNUM*),
The _parent_cm_ level dataset has one row per Parent per Cohort Member
(MCSID, *CNUM* and *PNUM*). This dataset contains information of
questions the parents answer about each of the Cohort Members.
27
The data can be merged with previous sweeps using MCSID and either GCNUM00
or GPNUM00 or both depending on the dataset. The MCS Data Handling Guide
provides examples of data handling for the various long level datasets of MCS.
5.2 Dataset conventions
5.2.1 Variable names
Each question name in the instrumentation is made up of four letters. Each variable
name in the data is eight characters long – made up of the four-letter question name
(e.g., ETHE), two single-letter prefixes and two single-character suffixes as follows:
[prefix1] [prefix2] [question name / CAPI code] [suffix1] [suffix2] where:
Prefix1: indicates the sweep; A = MCS1; B = MCS2; C = MCS3; D = MCS4; E =
MCS5; F = MCS6; G = MCS7
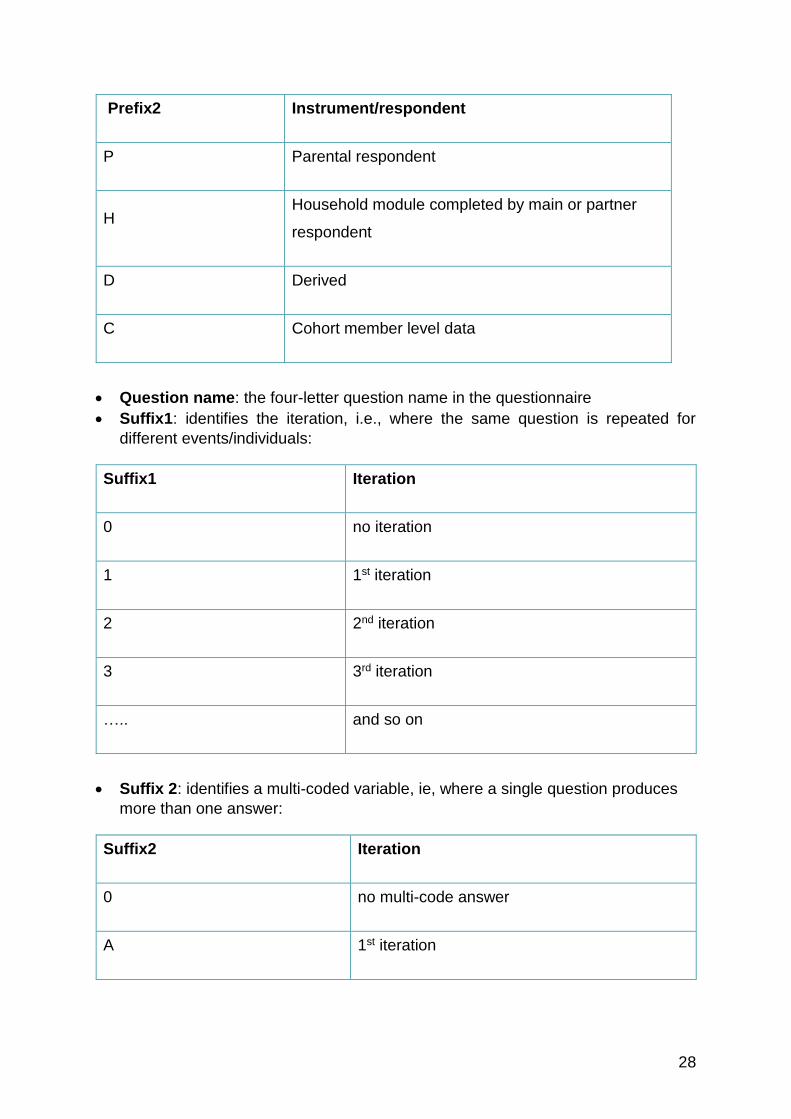
Prefix2: Identifies the instrument/respondent main and partner respondents with
the prefixes m and p respectively and proxy partner interviews with x. The full list
of potential variants for prefix 2 is:
28
Prefix2 Instrument/respondent
P Parental respondent
H Household module completed by main or partner
respondent
D Derived
C Cohort member level data
Question name: the four-letter question name in the questionnaire
Suffix1: identifies the iteration, i.e., where the same question is repeated for
different events/individuals:
Suffix1 Iteration
0 no iteration
1 1st iteration
2 2nd iteration
3 3rd iteration
….. and so on
Suffix 2: identifies a multi-coded variable, ie, where a single question produces
more than one answer:
Suffix2 Iteration
0 no multi-code answer
A 1st iteration

29
Suffix2 Iteration
B 2nd iteration
C 3rd iteration
….. and so on
Additional suffixes that may appear in the variable names are:
The suffix _T stands for total score.
The suffix _R* stands for recoded. This means that some of the values had
low counts and were recoded to a larger group. If the variable appears with
_R* in the data you can find the available variables on EUL and Secure
Access through the MCS Longitudinal Data Dictionary. The original variable
‘VARNAM’ with the complete information is shared with researchers under
Secure Access. The variable name with the suffix, for example,
‘VARNAM_R30’ is available under EUL.
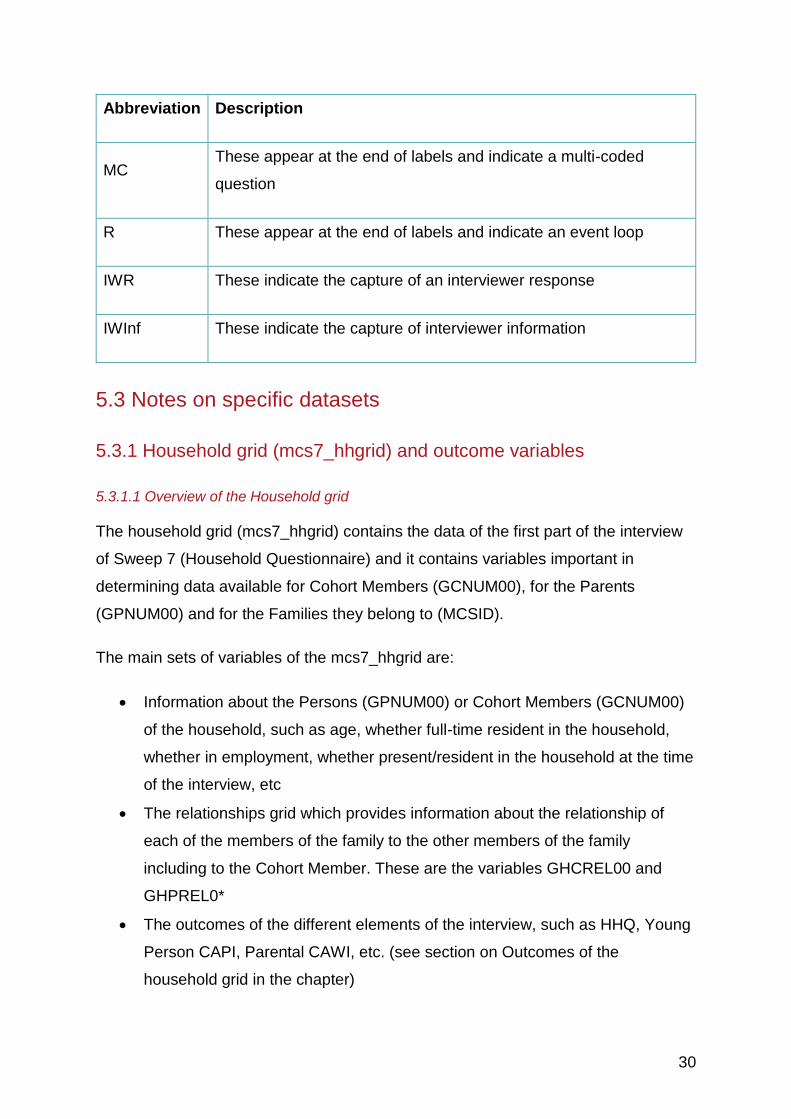
5.2.2 Variable labels
Variables are labelled in a consistent manner to aid navigation within the datasets.
Labels have abbreviated descriptions to indicate sweep, instrument and position in
loops, as follows:
Abbreviation Description
S7 Sweep 7 (NB similar abbreviations are used for Sweeps 1-6)
DV derived variable
COG cognitive assessment
PHYS physical measurements, e.g., height and weight
30
Abbreviation Description
MC These appear at the end of labels and indicate a multi-coded
question
R These appear at the end of labels and indicate an event loop
IWR These indicate the capture of an interviewer response
IWInf These indicate the capture of interviewer information
5.3 Notes on specific datasets
5.3.1 Household grid (mcs7_hhgrid) and outcome variables
5.3.1.1 Overview of the Household grid
The household grid (mcs7_hhgrid) contains the data of the first part of the interview
of Sweep 7 (Household Questionnaire) and it contains variables important in
determining data available for Cohort Members (GCNUM00), for the Parents
(GPNUM00) and for the Families they belong to (MCSID).
The main sets of variables of the mcs7_hhgrid are:
Information about the Persons (GPNUM00) or Cohort Members (GCNUM00)
of the household, such as age, whether full-time resident in the household,
whether in employment, whether present/resident in the household at the time
of the interview, etc
The relationships grid which provides information about the relationship of
each of the members of the family to the other members of the family
including to the Cohort Member. These are the variables GHCREL00 and
GHPREL0*
The outcomes of the different elements of the interview, such as HHQ, Young
Person CAPI, Parental CAWI, etc. (see section on Outcomes of the
household grid in the chapter)
31
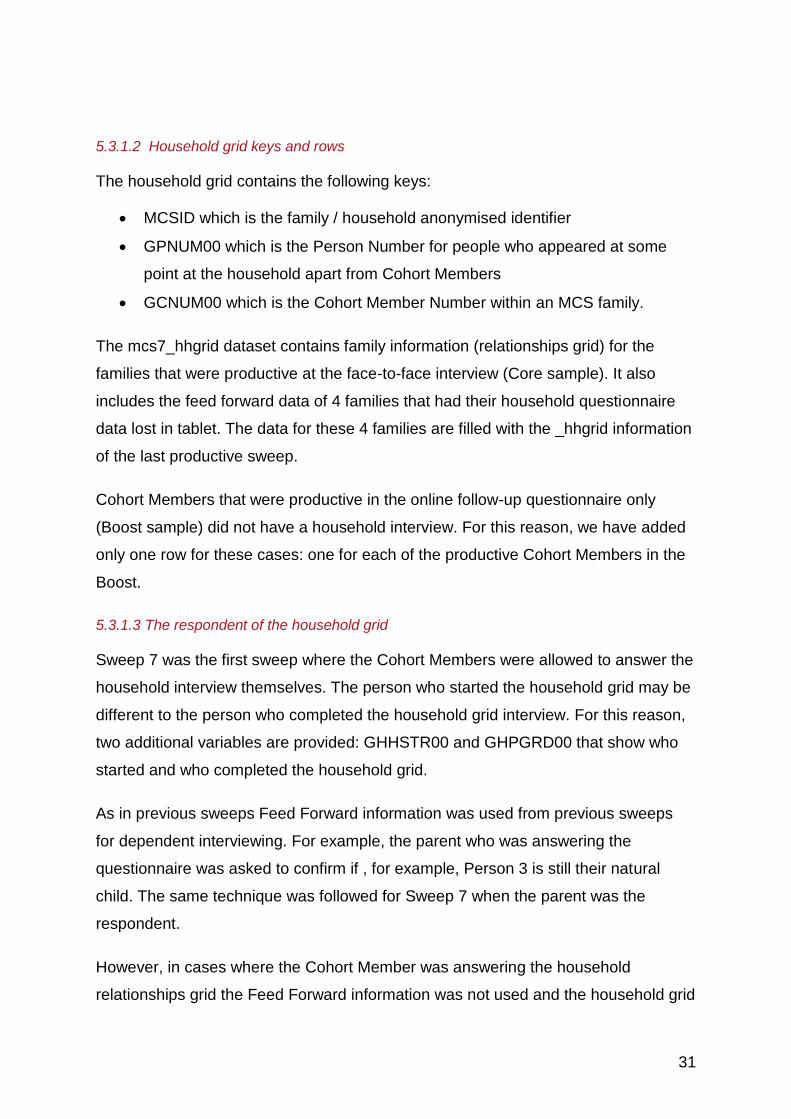
5.3.1.2 Household grid keys and rows
The household grid contains the following keys:
MCSID which is the family / household anonymised identifier
GPNUM00 which is the Person Number for people who appeared at some
point at the household apart from Cohort Members
GCNUM00 which is the Cohort Member Number within an MCS family.
The mcs7_hhgrid dataset contains family information (relationships grid) for the
families that were productive at the face-to-face interview (Core sample). It also
includes the feed forward data of 4 families that had their household questionnaire
data lost in tablet. The data for these 4 families are filled with the _hhgrid information
of the last productive sweep.
Cohort Members that were productive in the online follow-up questionnaire only
(Boost sample) did not have a household interview. For this reason, we have added
only one row for these cases: one for each of the productive Cohort Members in the
Boost.
5.3.1.3 The respondent of the household grid
Sweep 7 was the first sweep where the Cohort Members were allowed to answer the
household interview themselves. The person who started the household grid may be
different to the person who completed the household grid interview. For this reason,
two additional variables are provided: GHHSTR00 and GHPGRD00 that show who
started and who completed the household grid.
As in previous sweeps Feed Forward information was used from previous sweeps
for dependent interviewing. For example, the parent who was answering the
questionnaire was asked to confirm if , for example, Person 3 is still their natural
child. The same technique was followed for Sweep 7 when the parent was the
respondent.
However, in cases where the Cohort Member was answering the household
relationships grid the Feed Forward information was not used and the household grid
32
was answered by the Cohort Member. This means that there may be data variation
when the Cohort Member was the respondent between the data of Sweep 7 and
previous sweeps.
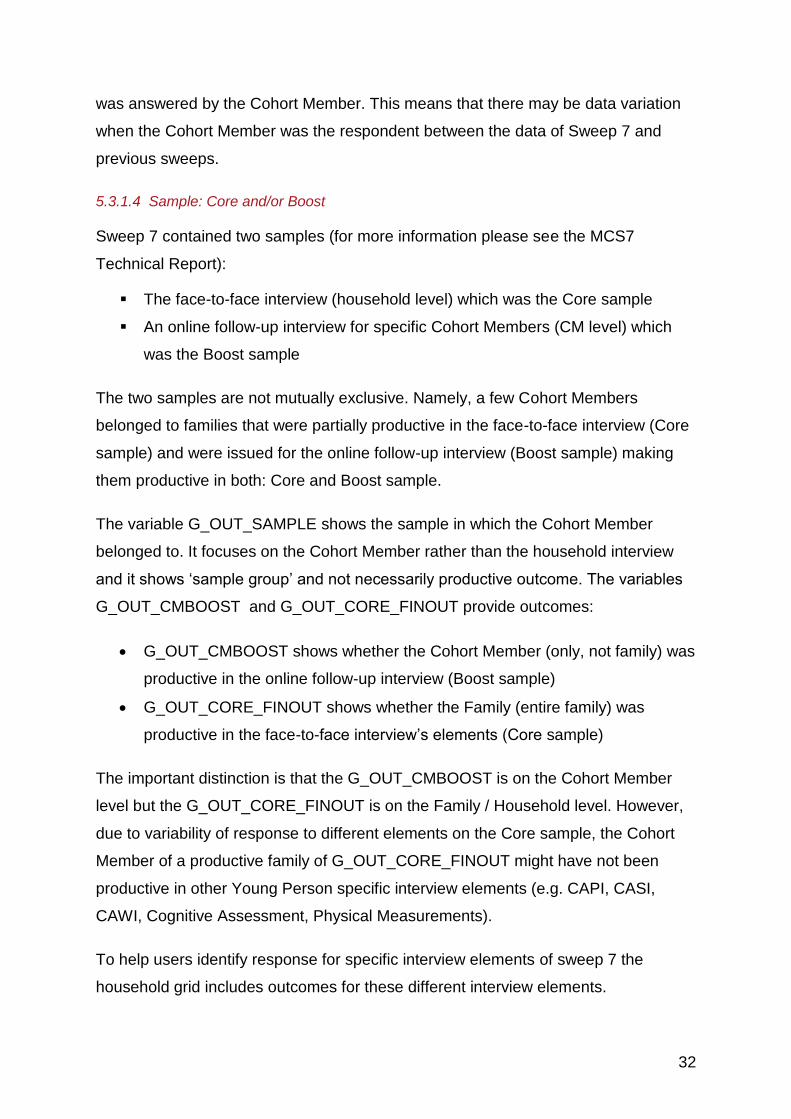
5.3.1.4 Sample: Core and/or Boost
Sweep 7 contained two samples (for more information please see the MCS7
Technical Report):
The face-to-face interview (household level) which was the Core sample
An online follow-up interview for specific Cohort Members (CM level) which
was the Boost sample
The two samples are not mutually exclusive. Namely, a few Cohort Members
belonged to families that were partially productive in the face-to-face interview (Core
sample) and were issued for the online follow-up interview (Boost sample) making
them productive in both: Core and Boost sample.
The variable G_OUT_SAMPLE shows the sample in which the Cohort Member
belonged to. It focuses on the Cohort Member rather than the household interview
and it shows ‘sample group’ and not necessarily productive outcome. The variables
G_OUT_CMBOOST and G_OUT_CORE_FINOUT provide outcomes:
G_OUT_CMBOOST shows whether the Cohort Member (only, not family) was
productive in the online follow-up interview (Boost sample)
G_OUT_CORE_FINOUT shows whether the Family (entire family) was
productive in the face-to-face interview’s elements (Core sample)
The important distinction is that the G_OUT_CMBOOST is on the Cohort Member
level but the G_OUT_CORE_FINOUT is on the Family / Household level. However,
due to variability of response to different elements on the Core sample, the Cohort
Member of a productive family of G_OUT_CORE_FINOUT might have not been
productive in other Young Person specific interview elements (e.g. CAPI, CASI,
CAWI, Cognitive Assessment, Physical Measurements).
To help users identify response for specific interview elements of sweep 7 the
household grid includes outcomes for these different interview elements.

33
5.3.1.5 Outcome variables (G_*)
A family is considered productive if the minimum (Household Questionnaire) was
completed. However, individual response would vary in each family. For example,
the parent might have refused the parent questionnaire while the Cohort Member
consented to the Young Person Interview. Another frequent scenario is for the
Cohort Members to consent only to some of the interview elements. This means that
for productive families and the availability of survey data for those rows varies. For
this reason, we provide users with the outcomes for different interview elements (e.g.
CAPI, CASI, CAWI, Cognitive Assessment, etc).
The outcome variables are useful to determine the total sample for a specific
research project.
Variable name Description Sample
G_OUT_CMCAPI Face-to-face interview with the Young
Person Core
G_OUT_CMCASI
Self-completion questionnaire during
the interviewer visit using interviewers’
electronic device
Core
G_OUT_CMCAWI Self-completion online questionnaire
during or after the interviewer visit Core
G_OUT_COGASS Cognitive Assessment for the Cohort
Member Core
G_OUT_PHYSMEAS Physical Measurements for the Cohort
Member Core
G_OUT_CMBOOST Online follow-up interview with the
Cohort Member Boost
34
Variable name Description Sample
G_OUT_PARCAWI Self-completion online questionnaire
during or after the interviewer visit Core
Households / Families that were productive in the face-to-face survey (Core:
G_OUT_CORE_FINOUT) have data in all of the datasets depending on the outcome
of each element. For example, the Parent / Carer CAWI questionnaire produced the
mcs7_parent_interview and the mcs7_parent_cm_interview datasets. If the parent is
not productive in the Parent questionnaire, namely G_OUT_PARCAWI is
unproductive, then there will not be data in those datasets.
5.3.2 Sample and distribution of information in datasets
The variable G_OUT_SAMPLE which is available in the mcs7_hhgrid dataset shows
whether the Cohort Member participated in the online follow-up survey (Boost).
Cohort Members that belonged to the Boost sample (and were productive in that:
G_OUT_CMBOOST) will have a row in the mcs7_cm_interview dataset. However,
there will not be a row in the other datasets of mcs7_.
The graph below visualises the three possible categories of G_OUT_SAMPLE: 1)
face-to-face Core sample, 2) online follow-up Boost sample and 3) respondents that
were productive in both: Core and Boost. The Core sample and the sample that was
productive in both: Core and Boost may contain rows in all the datasets of mcs7_
(depending on the response outcome in G_OUT_* of each element).

35
5.3.3 CM interview dataset
The information of the different interview elements with the Cohort Members are
provided in the mcs7_cm_interview file. The file is in a long format (one row per
Cohort Member) and it contains MCSID and GCNUM00 as row identifiers.
The file combines the different interview elements (CAPI, CASI, CAWI) for both of
the samples (Core and Boost sample).
The table below shows how the questionnaire sections are arranged in the dataset.
The CAPI, CASI and CAWI data of the Core sample were merged in one file while
the information coming from the Boost sample was appended to the file. For Cohort
Members that belong to both samples (Core and Boost) the data were combined into
one row keeping the information of the variable where it was available. The variable
G_OUT_SAMPLE is in the mcs7_hhgrid and in the mcs7_cm_interview to help users
identify which rows are expected to have data from the Boost interview and which
are not.

36
SAMPLE Questionnaire section as it appears in the dataset
Face-to-face
sample (Core
sample)
CAPI questionnaire
(face-to-face)
CASI questionnaire
(self-completion
during the
interview)
CAWI
questionnaire
(web-survey
usually after the
face-to-face
interview)
Online follow up
sample (Boost
sample)
Online follow-up interview (web)
The MCS_Longitudinal_Data_Dictionary provides information on which questions
were only asked in the face-to-face interview elements (Core sample) or only in the
online follow-up interview (Boost sample) or in both.
A few variables have been anonymised before sharing under EUL. For example,
school's URN and interviewer's ID in the mcs7_cm_interview. The values provided
are 4-character randomised IDs. In the schools' URN the value BAPT corresponds to
missing or not provided school, whereas in the interviewer's ID the value HLYN
corresponds to missing.
5.3.4 Parent interview dataset
The parent interview is divided in the questions that are about:
the parents themselves ( mcs7_parent_interview : one row per parent)
the parents providing information about the Cohort Member (
mcs7_parent_cm_interview: 1 row per parent per Cohort Member)
Information on how to handle files with _parent_ and _parent_cm_ structure is
provided at the MCS Data Handling Guide.
A new development of Sweep 7 compared to previous sweeps is the lack of
distinction of the parents / carers of the Cohort Members between Main and Partner
37
respondent. Both of the parents received the same questionnaire and answered the
same questions. In previous sweeps the Main respondent would answer most of the
questions about the household and the Cohort Member. However, both parents /
carers (in 2-parent households) received the same CAWI (PARCAWI) questionnaire
with the exception of the paper parent-reported SDQ that was answered only by one
parent.
The variable G_OUT_PARQUEST in the mcs7_parent_cm_interview flags what data
is available for that parent respondent. For example, a parent may have answered to
the PARCAWI or filled in the paper version of the Parent-SDQ or both.
The parent datasets contain the MCSID and GPNUM00 which is the person number
from the household grid. The mcs7_hhgrid dataset contains GELIG00 which shows
the parent’s eligibility for Main or Partner interview.
The mcs7_parent_cm_interview contains additional GCNUM00 to refer to the Cohort
Member of the family.
5.3.5 Cognitive assessment dataset
The mcs7_cm_cognitive_assessment dataset is provided on the CM level, namely,
one row per Cohort Member per family. The row identifiers for this dataset are the
MCSID and the GCNUM00. The correct answer is provided in the variable label.
5.3.6 Paradata
Further information is collected that relates to process of data collection such as call
level information, issue level information, interviewer-participant interaction, interview
section timings (timestamps), device information (for web completed interviews), etc.
This information may become available on request (subject to DAC decision). More
information is available here https://cls.ucl.ac.uk/data-access-training/access-cls-
dac/ . Please email [email protected] with a query on paradata collected.
5.3.7 Derived variables
CLS has derived variables per cohort member, per parent and per family and these
are available through separate datasets. More information is in the MCS7 Derived
Variables User Guide.
38
6. The household grid and the household questionnaire
6.1 Background and introduction
6.1.1 What is the household grid?
The household grid is part of an initial household module which is administered
before any other module in the interview. It contains information about every person
in the household and includes two types of information: individual identifiers and
identifying characteristics (number, sex and date of birth), and cross-sectional
variables (e.g., relationships between household members).
The household grid contains one record for each person who has ever appeared in
the household, for each family who participated in that sweep. Each household has a
unique number (MSCID).
There is a variable which indicates for each person whether or not they were present
at any particular sweep: AHCPRS00, BHCPRS00, CHCPRS00, DHCPRS00,
EHCPRS00, FHCPRS00, GHCPRS00 for cohort members in MCS1, MCS2, MCS3,
MCS4, MCS5, MCS6 and MCS7 respectively, and AHPRES00, BHPRES00,
CHPRES00, DHPRES00, EHPRES00, FHPRES00 and GHPRES00 respectively for
other people in the household. These can be used to identify people moving into, out
of or back into the household by merging the household grid files from each sweep.
Details about the household grid for previous sweeps can also be found in the
respective user guides.
6.1.2 How is the household grid information collected?
At MCS7 the household grid was collected as part of the household module. It could
be completed by anyone aged 16 or over in the household, but ideally by a parent. If
a parent was resident in the household and willing and able to do the household
interview, interviewers were asked to conduct the interview with them. If no such
parent was resident or if they were unwilling or unable to complete the household
interview, the interviewers could conduct the interview with the cohort member
themselves or any other resident adult. It was collected at the start of the household
visit, as its contents determined who was eligible for the parent online questionnaires
39
and the parent-report Strength and Difficulties questionnaire (SDQ). The household
grid used data fed forward from previous sweeps. In this way, it was possible to
check whether each person identified as being present at Sweep 7 had been present
at any of the previous sweeps: the person completing the grid was asked to list all of
the people currently present in the household and, for each person, was asked if that
person was someone whom we had listed as living in the household previously so
that they could be assigned the same person number. If they had never been listed
as living in the household before, they were assigned a new person number.
6.2 Contents of the household grid and household
questionnaire
6.2.1 What information is collected in the household grid?
The household grid collected (or confirmed) the following information for each person
in the household:
who is living in the household currently, preserving the person number of those
who have listed previously
what happened to people who were household members at the last sweep
interviewed but who are not currently present in the house (e.g. left household,
long term absence or deceased)
name, sex and date of birth of new people in the household (and confirmation
of these details for previously listed people)
whether each household member is a full-time or a part-time member of the
household
the working status of adults (aged 16 and over)
relationship of each household member to the cohort member and to each other
– NB there was a slight difference in the methodology for collecting this
information at MCS7. At earlier sweeps, relationships between pre-existing
members of the household were simply confirmed (e.g. “Is Jenny Tom’s
adoptive mother?”). However, in order to maintain confidentiality (particularly
regarding potentially sensitive relationships), this information was asked afresh
if the cohort member, rather than their parents, was answering the section.

40
This data is stored in the file mcs7_hhgrid.
6.2.2 What other information was collected in the household
questionnaire and where is it stored?
The household questionnaire covers a number of other topics. As this information
covers the household, it appears in the parent interview file:
Type of residence (institution or private residence);
Country in which the interview is taking place;
Change of address since last interview;
Details about accommodation;
Household composition;
Relationships between each of the household members;
Employment status of all adults aged 16 or over (including the cohort
member);
Selection of individuals eligible to complete the parent questionnaires;
Relationship history of parents;
Collection of household contact information.
The household questionnaire is in the file mcs7_family_interview.

41
7. Overview of cohort member questionnaires
7.1 Background and introduction
Age 17 marked a key point in cohort members’ developmental and educational lives,
a time when their educational and occupational paths start to diverge in more salient
ways through their different aspirations and choices. In terms of data collection, it is
an age when direct engagement with the cohort members themselves was
particularly important to their engagement and the long-term viability of the study. To
reflect this, the relative balance between parental and cohort member involvement in
the survey shifted considerably, with cohort members providing more information
than they had done at any of the previous sweeps, and considerably more than
parents at this sweep. A 20 minute face-to-face interview was conducted with the
cohort member for the first time (including collecting contact information and data
linkage consents), they were also asked to fill in a self-completion questionnaire (30
minutes) on the interviewer’s tablet in the home, and to complete an online
questionnaire after the visit (15 minutes).
7.2 Baseline numbers
The total number is 11,872 of Cohort Members. Information on sample available for
analysis under End User Licence is provided in the mcs_longitudinal_family_file and
the variable DATA_AVAILABILITY.
7.3 The cohort member interview (CAPI)
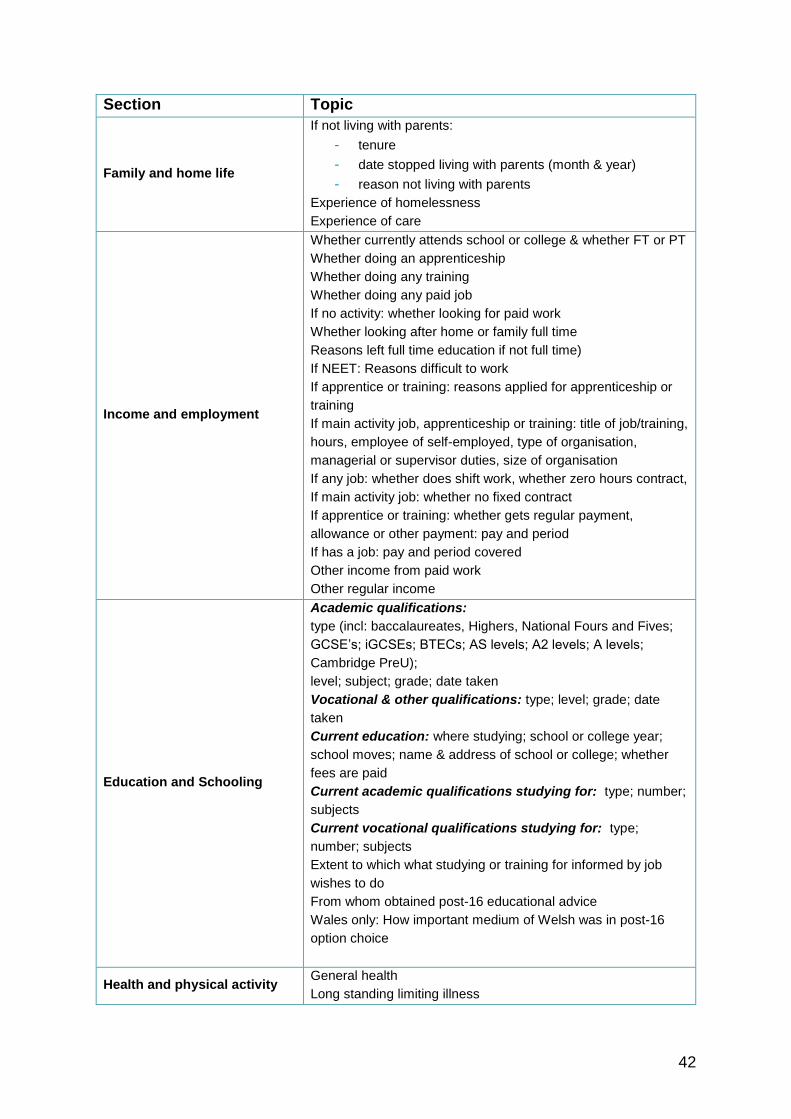
7.3.1 Content of the Young Person Interview
The 20 minute interview covered a range of topics to understand the lives of cohort
members – their circumstances, behaviours, views and development. Before starting
the face to face interview, interviewers asked the cohort members to provide their
verbal consent to complete it and recorded their response in the CAI programme.
Topics covered included:
42
Section Topic
Family and home life
If not living with parents:
- tenure
- date stopped living with parents (month & year)
- reason not living with parents
Experience of homelessness
Experience of care
Income and employment
Whether currently attends school or college & whether FT or PT
Whether doing an apprenticeship
Whether doing any training
Whether doing any paid job
If no activity: whether looking for paid work
Whether looking after home or family full time
Reasons left full time education if not full time)
If NEET: Reasons difficult to work
If apprentice or training: reasons applied for apprenticeship or
training
If main activity job, apprenticeship or training: title of job/training,
hours, employee of self-employed, type of organisation,
managerial or supervisor duties, size of organisation
If any job: whether does shift work, whether zero hours contract,
If main activity job: whether no fixed contract
If apprentice or training: whether gets regular payment,
allowance or other payment: pay and period
If has a job: pay and period covered
Other income from paid work
Other regular income
Education and Schooling
Academic qualifications:
type (incl: baccalaureates, Highers, National Fours and Fives;
GCSE’s; iGCSEs; BTECs; AS levels; A2 levels; A levels;
Cambridge PreU);
level; subject; grade; date taken
Vocational & other qualifications: type; level; grade; date
taken
Current education: where studying; school or college year;
school moves; name & address of school or college; whether
fees are paid
Current academic qualifications studying for: type; number;
subjects
Current vocational qualifications studying for: type;
number; subjects
Extent to which what studying or training for informed by job
wishes to do
From whom obtained post-16 educational advice
Wales only: How important medium of Welsh was in post-16
option choice
Health and physical activity General health
Long standing limiting illness

43
Section Topic
Accidents
Hospital admissions other than accidents
Physical activity
Identity (Wales only) Frequency speaks Welsh with friends
Language used on social media
Contact information
Telephone, email, intention to move and new address if known.
Details used to keep in contact with the young people about the
study and for reminders to be sent for the online (CAWI)
questionnaire
Consent to data linkage
Cohort members were asked to give their written consent to
linking their administrative records to survey data: education,
health, economic and crime.
Interviewers were briefed, where possible, to conduct the interview with just the
cohort member in the room. Where this was not possible, interviewers were required
to record, at the end, whether anyone else was present while the cohort member
answered the questions. Information on identifying who was the respondent of the
household questionnaire is available at the mcs7_hhgrid dataset and at section
5.3.1.
It was possible for someone else to answer the interview on behalf of the young
person if (s)he was unable to understand or answer the questions by him/herself. On
the rare occasions this happened, the reason why and who helped were recorded.
The interview could also be translated into Welsh by a Welsh-speaking interviewer if
requested.
7.3.1.1 Income
Cohort members were asked about their current economic activities in some detail.
They were all asked about whether they were currently attending school or college
(even if on holiday) as well as about any training or apprenticeships they were doing,
any other paid work. Sometimes, cohort members were engaged in more than one
activity and, if this was the case, they were asked which was their main activity, as
well as some questions about activity/educational motivations.
If a cohort member considered their main activity was working, training or an
apprenticeship, they were asked a series of detailed employment questions covering
employment conditions and pay. All cohort members were also asked about income
44
that was not from their main activity – including jobs, benefits and parental
contributions.
7.3.1.2 Education qualifications grid
Cohort members were asked about any academic or vocational qualifications they
had gained. There is a wide range of qualifications available across the UK and the
data collection was designed to capture these in a way which reflected the different
nature of the courses and grading structures. This included collecting:
the type, subjects covered (with levels) and overall and individual subject
grades for baccalaureates (e.g. International Baccalaureate, Scottish
Baccalaureate)
the subjects and grades for school/sixth form type exams (e.g. GCSE, A level,
BTEC, Scottish Higher Grade exams, Extended Project Qualification and
Cambridge Pre U). For each of these qualifications, details were collected
about the subjects covered, the final grade and, where appropriate, the level.
whether they had obtained any of a range of vocational qualifications (e.g.
Essential Skills, City and Guilds and SQA certificate). Where appropriate, they
were also asked about the grade and/or level.
Cohort members who were still in school or college were then asked details about
where they were studying and the qualifications they were studying for.
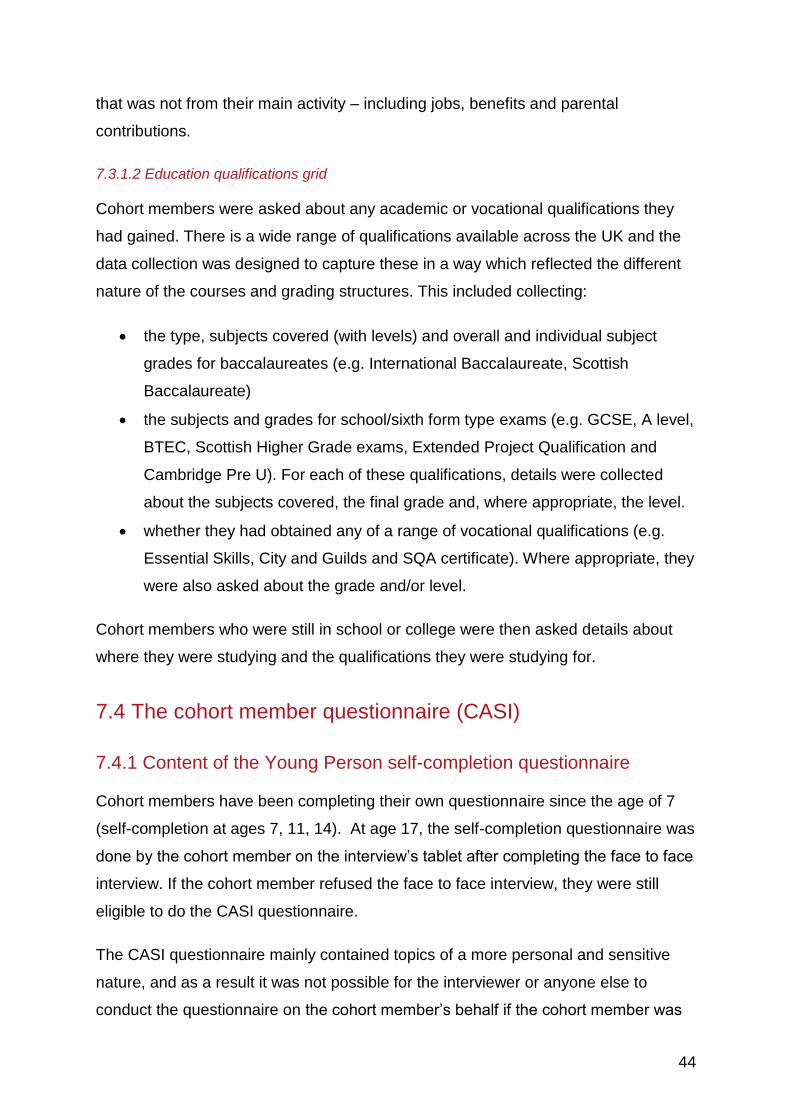
7.4 The cohort member questionnaire (CASI)
7.4.1 Content of the Young Person self-completion questionnaire
Cohort members have been completing their own questionnaire since the age of 7
(self-completion at ages 7, 11, 14). At age 17, the self-completion questionnaire was
done by the cohort member on the interview’s tablet after completing the face to face
interview. If the cohort member refused the face to face interview, they were still
eligible to do the CASI questionnaire.
The CASI questionnaire mainly contained topics of a more personal and sensitive
nature, and as a result it was not possible for the interviewer or anyone else to
conduct the questionnaire on the cohort member’s behalf if the cohort member was

45
unable to complete it themselves. The CASI took approximately 15 minutes to
complete.
Before the cohort member started the self-completion questionnaire, the interviewer
asked for their verbal consent to complete it and recorded the cohort member’s
response in the CAI programme. Interviewers then read out an introduction to
reassure the cohort member that it was not a test, that there were no right or wrong
answers, that none of their answers would be seen by anyone in their family or by
the interviewer themselves, and that they could skip any question they did not wish
to answer. Text was included in the questionnaire to highlight the sensitive nature of
some of the questions and to encourage honesty. The interviewer detached the
keyboard and handed their tablet screen over to the cohort member. The cohort
member was encouraged to complete the questionnaire in private due to the
sensitive nature of many of the topics.
The CASI questionnaire was available as a paper Welsh version if the cohort
member requested it.
Topics covered included:
Section Topic
Relationships with
family
If CM not living with either/both natural parents:
Contact with non-resident parent (incl. seeing &
phone, text, email, social media)
If CM co-resident with either/both parents:
Closeness to parent; frequency talks to parent about
important things
Strengths and
Difficulties
Questionnaire
25 items on psychological attributes (see further
details below in relevant section)
46
Section Topic
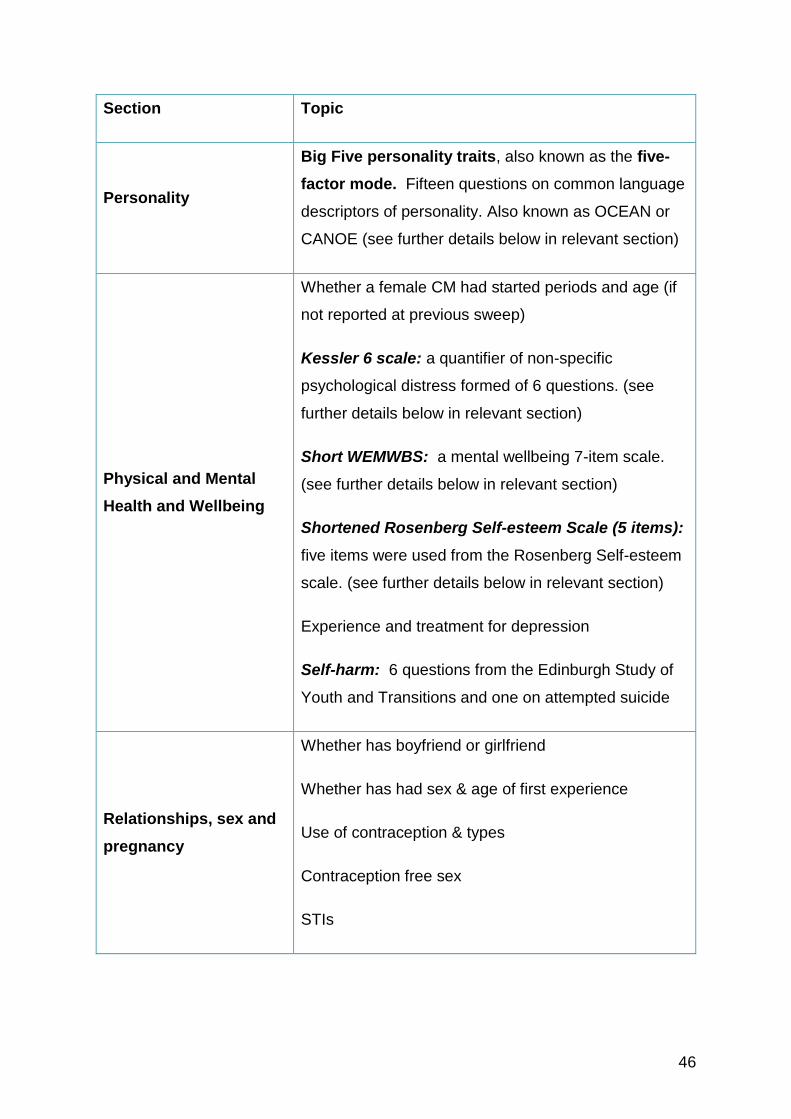
Personality
Big Five personality traits, also known as the five-
factor mode. Fifteen questions on common language
descriptors of personality. Also known as OCEAN or
CANOE (see further details below in relevant section)
Physical and Mental
Health and Wellbeing
Whether a female CM had started periods and age (if
not reported at previous sweep)
Kessler 6 scale: a quantifier of non-specific
psychological distress formed of 6 questions. (see
further details below in relevant section)
Short WEMWBS: a mental wellbeing 7-item scale.
(see further details below in relevant section)
Shortened Rosenberg Self-esteem Scale (5 items):
five items were used from the Rosenberg Self-esteem
scale. (see further details below in relevant section)
Experience and treatment for depression
Self-harm: 6 questions from the Edinburgh Study of
Youth and Transitions and one on attempted suicide
Relationships, sex and
pregnancy
Whether has boyfriend or girlfriend
Whether has had sex & age of first experience
Use of contraception & types
Contraception free sex
STIs

47
Section Topic
Pregnancy grid: whether has ever become or made
someone pregnant; outcome; date of end of
pregnancy or birth
Risky Behaviours
Smoking and e-cigarettes
Alcohol consumption & binge drinking
Drug use
Experience as a victim
Risky & anti-social behaviour
Acts against other people
Identity
Sexual & gender identity
Sexual attraction
7.4.2 Young person self-completion questionnaire scales
7.4.2.1 Young Person Strengths and Difficulties Questionnaire (SDQ)
Goodman (1997): https://www.sdqinfo.com/a0.html
Age 17 was the first time the cohort members were asked to complete their own
version. The parent version has been used since age 3 at sweeps 2, 3 4, 5 and 6.
For further details see Johnson et al. (2015). The SDQ is a behavioural screening
questionnaire for 4 to 17-year-olds. It measures 25 items on psychological attributes.
At MCS7, the one-sided self-rated SDQ for 11 to 17-year olds without impact
statement version was completed by the cohort members as part of the in-home self-
completion questionnaire (CASI). A paper parent version was also completed by one
resident parent which is part of the parent response.

48
The cohort member was asked the following statements about their behaviour over
the past 6 months with response options: Not true, Somewhat true or Certainly true.
Question
name Question Variables
Equivalent on
SDQ
SDQA I try to be nice to other people. I care
about their feelings SDQ item 1
SDQB I am restless, I cannot stay still for long SDQ item 2
SDQC I get a lot of headaches, stomach-aches
or sickness SDQ item 3
SDQD I usually share with others (food, games,
pens etc.) SDQ item 4
SDQE I get very angry and often lose my
temper SDQ item 5
SDQF I am usually on my own. I generally play
alone or keep to myself SDQ item 6
SDQG I usually do as I am told SDQ item 7
SDQH I worry a lot SDQ item 8
SDQI I am helpful if someone is hurt, upset or
feeling ill SDQ item 9
SDQJ I am constantly fidgeting or squirming SDQ item 10
SDQK I have one good friend or more SDQ item 11
SDQL I fight a lot. I can make other people do
what I want SDQ item 12
SDQM I am often unhappy, down-hearted or
tearful SDQ item 13
SDQN Other people my age generally like me SDQ item 14
SDQO I am easily distracted, I find it difficult to
concentrate SDQ item 15

49
Question
name Question Variables
Equivalent on
SDQ
SDQP I am nervous in new situations. I easily
lose confidence SDQ item 16
SDQQ I am kind to younger children SDQ item 17
SDQR I am often accused of lying or cheating SDQ item 18
SDQS Other children or young people pick on
me or bully me SDQ item 19
SDQT I often volunteer to help others (parents,
teachers, children) SDQ item 20
SDQU I think before I do things SDQ item 21
SDQV I take things that are not mine from
home, school or elsewhere SDQ item 22
SDQW I get on better with adults than with
people my own age SDQ item 23
SDQX I have many fears, I am easily scared SDQ item 24
SDQY I finish the work I'm doing. My attention
is good SDQ item 25
The above 25 items are divided between 5 scales:
1. Emotional symptoms
a. Complains of headaches/stomach aches/sickness
b. Often seems worried
c. Often unhappy
d. Nervous or clingy in new situations
e. Many fears, easily scared.
2. Conduct problems
a. Often has temper tantrums
b. Generally obedient*
c. Fights with or bullies other children
d. Steals from home, school or elsewhere (In MCS2: Can be
spiteful to others)
e. Often lies or cheats (in MCS2: Often argumentative with
adults).
3. Hyperactivity/inattention

50
a. Restless, overactive, cannot stay still for long
b. Constantly fidgeting
c. Easily distracted
d. Can stop and think before acting*
e. Sees tasks through to the end*.
4. Peer relationship problems
a. I am usually on my own. I generally play alone or keep to
myself
b. I have one good friend or more *
c. Other people my age generally like me *
d. Other children or young people pick on me or bully me
e. I get on better with adults than with people my own age.
5. Prosocial behaviour
a. I try to be nice to other people. I care about their feelings
b. Shares readily with others
c. Helpful if someone is hurt, upset or ill
d. Kind to younger children
e. Often volunteers to help others.
*Denotes items that are reversed when generating sub-scales on behaviour.
Each of the five scales can be used alone or together to create:
1-4 when taken together generate a total difficulties score
1 and 4 create an internalising problems score
2 and 3 create an externalising conduct score
5 alone measures prosocial behaviour
See: https://sdqinfo.org/py/sdqinfo/b3.py?language=Englishqz(UK
7.4.2.2 Young Person Big Five personality traits
NEO PI/FFI manual supplement for use with the NEO Personality Inventory and the
NEO Five-Factor Inventory Paul T. Costa, Jr. & Robert R. McCrea. Published 1989
by Psychological Assessment Resources in Odessa, Fla. (P.O. Box 998, Odessa
33556) (available online from http://www.openlibrary.org) .
Age 17 was the first time that cohort members were asked the Big Five. The OCEAN
was also asked of the main and partner parent respondents at Age 14 (MCS6).
The Big Five personality traits, also known as the five-factor model (FFM), is a
model based on common language descriptors of personality. The five factors have
been defined as openness to experience, conscientiousness, extraversion,
agreeableness and neuroticism, often listed under the acronyms OCEAN or CANOE.
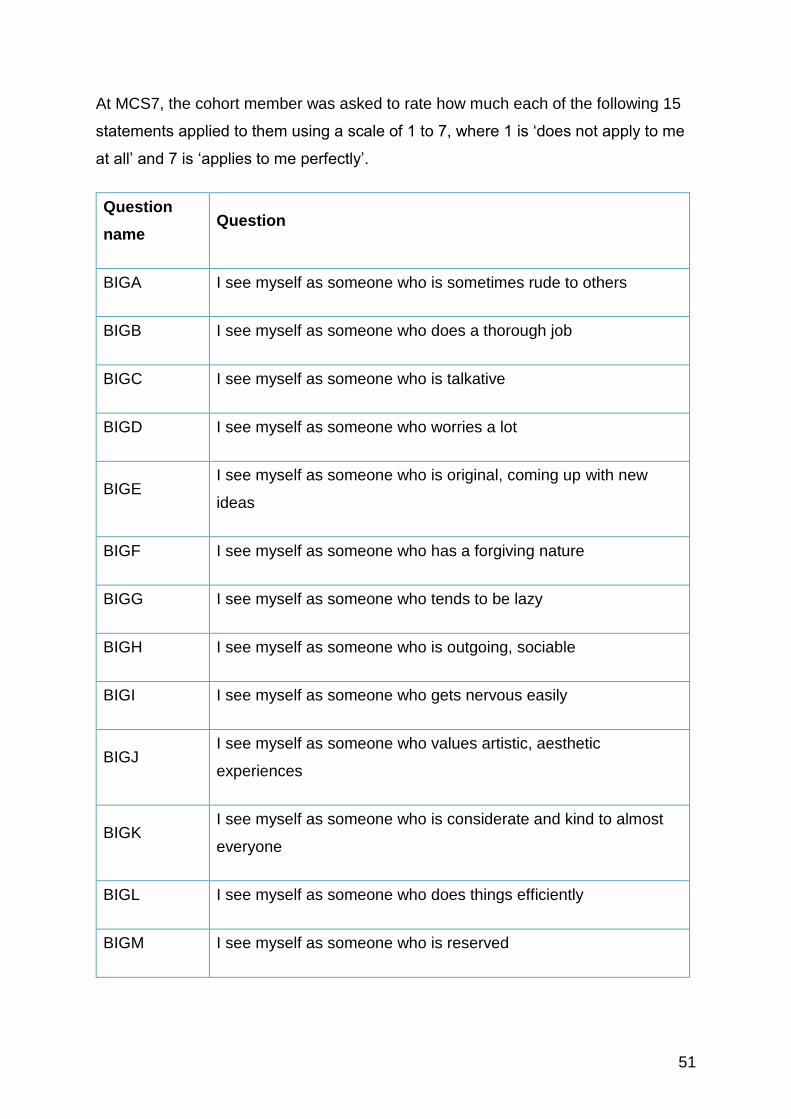
51
At MCS7, the cohort member was asked to rate how much each of the following 15
statements applied to them using a scale of 1 to 7, where 1 is ‘does not apply to me
at all’ and 7 is ‘applies to me perfectly’.
Question
name Question
BIGA I see myself as someone who is sometimes rude to others
BIGB I see myself as someone who does a thorough job
BIGC I see myself as someone who is talkative
BIGD I see myself as someone who worries a lot
BIGE I see myself as someone who is original, coming up with new
ideas
BIGF I see myself as someone who has a forgiving nature
BIGG I see myself as someone who tends to be lazy
BIGH I see myself as someone who is outgoing, sociable
BIGI I see myself as someone who gets nervous easily
BIGJ I see myself as someone who values artistic, aesthetic
experiences
BIGK I see myself as someone who is considerate and kind to almost
everyone
BIGL I see myself as someone who does things efficiently
BIGM I see myself as someone who is reserved

52
Question
name Question
BIGN I see myself as someone who is relaxed, handles stress well
BIGO I see myself as someone who has a big imagination
7.4.2.3 Young Person Kessler 6 scale
Kessler, R.C., Barker, P.R., Colpe, L.J., Epstein, J.F., Gfroerer, J.C., Hiripi, E.,
Howes, M.J, Normand, S-L.T., Manderscheid, R.W., Walters, E.E., Zaslavsky, A.M.
(2003). Screening for serious mental illness in the general population. Archives of
General Psychiatry. 60(2), 184-189. Information on scoring and interpretation of this
scale can be found at http://www.hcp.med.harvard.edu/ncs/k6_scales.php.
Age 17 was the first time the Kessler 6 was asked of the cohort members. The
Kessler 6 has been asked of main and partner respondents at each sweep since
MCS2 (age 3) and was repeated at age 17 in the parent online questionnaire (SEE).
The Kessler 6 (K6) scale is a quantifier of non-specific psychological distress. It
consists of six questions about depressive and anxiety symptoms that a person has
experienced in the last 30 days.
At age 17, cohort members were asked six questions on how they had felt over the
last 30 days with a self-report scale of five possible answers plus don’t know/don’t
wish to answer (which was not shown on screen unless an item was left blank):
1. All of the time
2. Most of the time
3. Some of the time
4. A little of the time
5. None of the time
The questions are introduced by the statement: ‘The next few questions are about
how you have felt over the last 30 days’. The six questions are:

53
Question
name Question
PHDE During the last 30 days, about how often did you feel so depressed
that nothing could cheer you up?
PHHO During the last 30 days, about how often did you feel hopeless?
PHRF During the last 30 days, about how often did you feel restless or
fidgety?
PHEE During the last 30 days, about how often did you feel that everything
was an effort?
PHWO During the last 30 days, about how often did you feel worthless?
PHNE During the last 30 days, about how often did you feel nervous?
7.4.2.4 Young Person Warwick-Edinburgh Mental Wellbeing Scale (Short WEMWBS)
Copyright: Warwick-Edinburgh Mental Wellbeing Scale (WEMWBS) © NHS Health
Scotland, The University of Warwick and University of Edinburgh, 2006, all right
reserved.
The WEMWBS was asked for the first time at age 17.
The short WEMWBS is a mental wellbeing scale. It provides a single sumsmary
score indicating overall wellbeing. At age 17 the short 7-item scale was used.
Permission was granted to use the scale.
The cohort member was asked to select the answer that best described their
experience over the past two weeks: None of the time; Rarely; Some of the time;
Often; All of the time for the following statements:

54
Question
name Question
WWOP I’ve been feeling optimistic about the future
WWUS I’ve been feeling useful
WWRE I’ve been feeling relaxed
WWDE I’ve been dealing with problems well
WWTH I’ve been thinking clearly
WWCL I’ve been feeling close to other people
WWMN I’ve been able to make up my own mind about things
Scoring:
https://warwick.ac.uk/fac/sci/med/research/platform/wemwbs/using/howto/
7.4.2.5 Young Person Shortened Rosenberg Self-esteem Scale (5 items)
Rosenberg, M. (1965). Society and the adolescent self-image. Princeton, NJ:
Princeton University Press.
The shortened Rosenberg self-esteem scale was also asked of cohort members at
MCS5 (age 11) and MCS6 (age 14).
At age 17 five items were used from the Rosenberg Self-esteem scale. The original
measure is a ten item Likert-type questionnaire. The scale is thought to have good
reliability and validity as a tool to measure self-esteem in psychology and the social
sciences. It was developed using a sample of over 5000 children drawn from
schools in the state of New York and has since been widely applied since.
Cohort members were asked how much they agreed or disagreed with the following
statements about them:
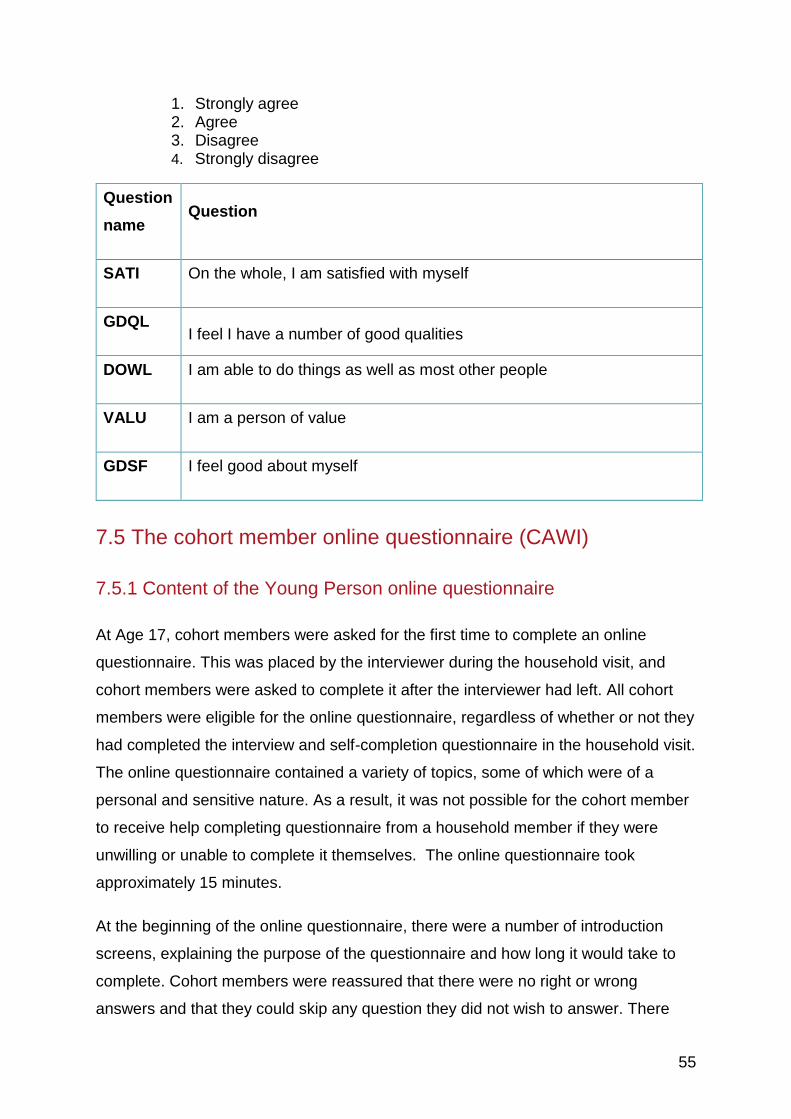
55
1. Strongly agree 2. Agree 3. Disagree 4. Strongly disagree
Question
name Question
SATI On the whole, I am satisfied with myself
GDQL I feel I have a number of good qualities
DOWL I am able to do things as well as most other people
VALU I am a person of value
GDSF I feel good about myself
7.5 The cohort member online questionnaire (CAWI)
7.5.1 Content of the Young Person online questionnaire
At Age 17, cohort members were asked for the first time to complete an online
questionnaire. This was placed by the interviewer during the household visit, and
cohort members were asked to complete it after the interviewer had left. All cohort
members were eligible for the online questionnaire, regardless of whether or not they
had completed the interview and self-completion questionnaire in the household visit.
The online questionnaire contained a variety of topics, some of which were of a
personal and sensitive nature. As a result, it was not possible for the cohort member
to receive help completing questionnaire from a household member if they were
unwilling or unable to complete it themselves. The online questionnaire took
approximately 15 minutes.
At the beginning of the online questionnaire, there were a number of introduction
screens, explaining the purpose of the questionnaire and how long it would take to
complete. Cohort members were reassured that there were no right or wrong
answers and that they could skip any question they did not wish to answer. There
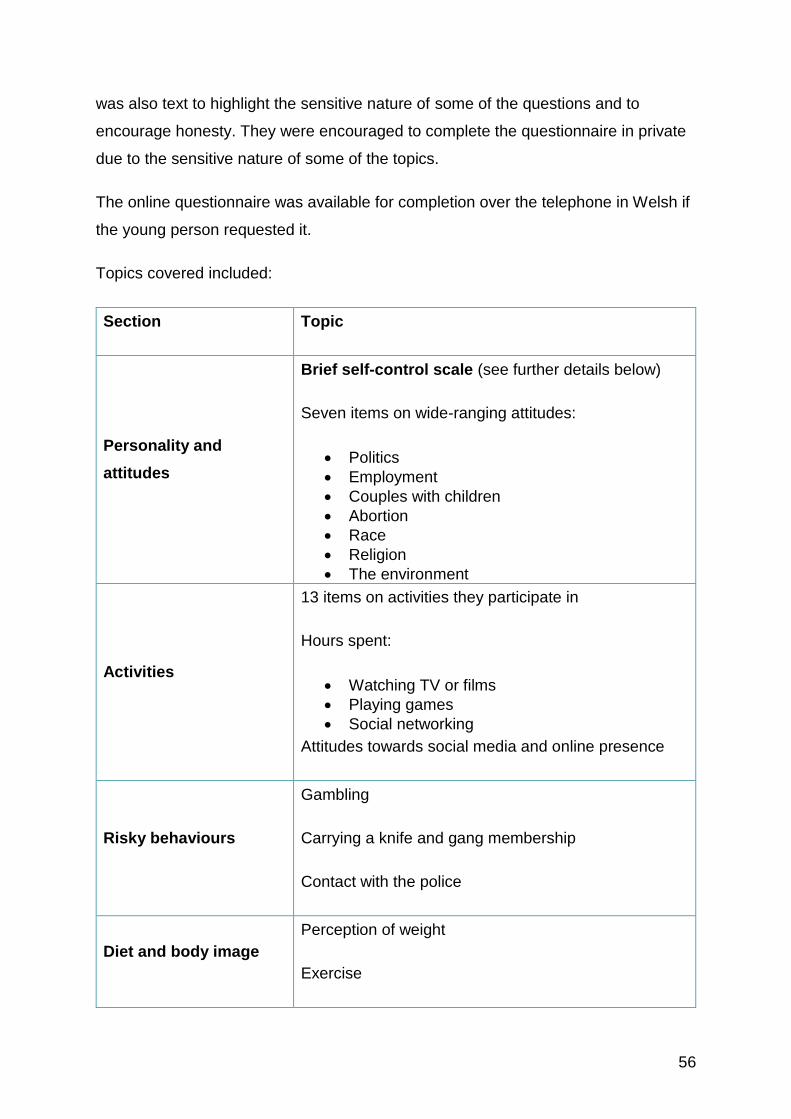
56
was also text to highlight the sensitive nature of some of the questions and to
encourage honesty. They were encouraged to complete the questionnaire in private
due to the sensitive nature of some of the topics.
The online questionnaire was available for completion over the telephone in Welsh if
the young person requested it.
Topics covered included:
Section Topic
Personality and
attitudes
Brief self-control scale (see further details below)
Seven items on wide-ranging attitudes:
Politics
Employment
Couples with children
Abortion
Race
Religion
The environment
Activities
13 items on activities they participate in
Hours spent:
Watching TV or films
Playing games
Social networking
Attitudes towards social media and online presence
Risky behaviours
Gambling
Carrying a knife and gang membership
Contact with the police
Diet and body image
Perception of weight
Exercise

57
Section Topic
Eating behaviour and food choices
Eating Choices Index (ECI): a four-item index on
food choices (see further details below)
Risk and time
preferences
Two grids of questions, one assessing risk-taking
behaviour, and one assessing time preferences
Identity
Religious identity
Languages spoken with friends and at home
Learning and the future
Likelihood of attending university, and reasons why or
why not
Understanding of cost of university
Understanding of student loans
Effect of university attendance on getting a job and
earnings
Job at age 30
Life achievements at age 30
Life and wellbeing
Sleep quality
Social provisions scale: a three-item index on social
support (see further details below)
Parental involvement in their life
Caring responsibilities
Methods and length of daily travel
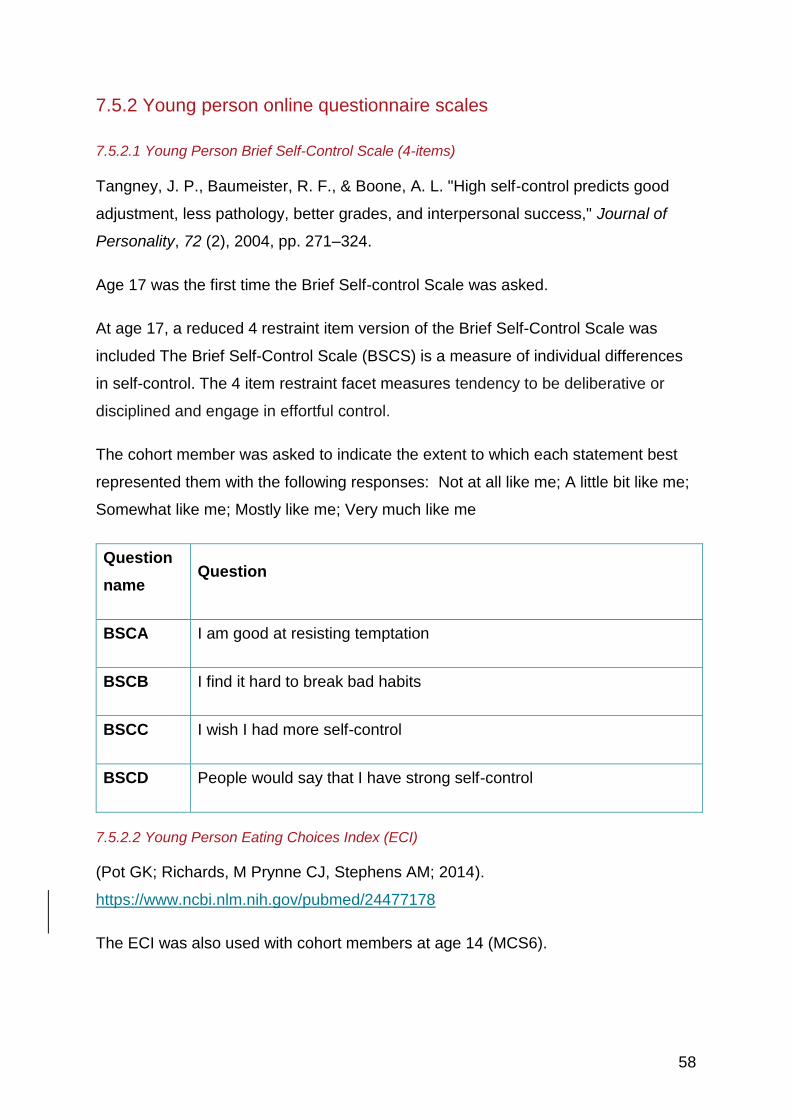
58
7.5.2 Young person online questionnaire scales
7.5.2.1 Young Person Brief Self-Control Scale (4-items)
Tangney, J. P., Baumeister, R. F., & Boone, A. L. "High self‐control predicts good
adjustment, less pathology, better grades, and interpersonal success," Journal of
Personality, 72 (2), 2004, pp. 271–324.
Age 17 was the first time the Brief Self-control Scale was asked.
At age 17, a reduced 4 restraint item version of the Brief Self-Control Scale was
included The Brief Self-Control Scale (BSCS) is a measure of individual differences
in self-control. The 4 item restraint facet measures tendency to be deliberative or
disciplined and engage in effortful control.
The cohort member was asked to indicate the extent to which each statement best
represented them with the following responses: Not at all like me; A little bit like me;
Somewhat like me; Mostly like me; Very much like me
Question
name Question
BSCA I am good at resisting temptation
BSCB I find it hard to break bad habits
BSCC I wish I had more self-control
BSCD People would say that I have strong self-control
7.5.2.2 Young Person Eating Choices Index (ECI)
(Pot GK; Richards, M Prynne CJ, Stephens AM; 2014).
https://www.ncbi.nlm.nih.gov/pubmed/24477178
The ECI was also used with cohort members at age 14 (MCS6).

59
The Eating Choices Index (ECI) score includes four components: (i) consumption of
breakfast, (ii) consumption of two portions of fruit per day, (iii) type of milk consumed
and (iv) type of bread consumed, each providing a score from 1 to 5. The index
discriminates healthy and unhealthy eating choices for use in large surveys as a
short questionnaire and as a measure in existing studies with adequate dietary data
At age 17 a question on consumption of vegetables (VEGI) was added, which is not
part of the ECI.
For breakfast (BRKN) respondents were asked how often they ate over a week and
fruit consumption (FRUT), respondents were asked to say how often they eat at least
2 portions of fruit a day, with the following response categories:
1. Never
2. Some days, but not all days
3. Every day
For bread type consumed (BRED), respondents were asked to select one of the
following response categories:
1. I only eat white bread 2. I sometimes eat white bread, sometimes I eat brown or granary or
wholemeal bread (including 50:50 bread) 3. I only eat brown/granary bread (including 50:50 bread) 4. I sometimes eat brown/granary bread (including 50:50 bread),
sometimes I eat wholemeal bread 5. I only eat wholemeal bread 6. I never eat bread
For milk consumption (MILK), respondents were asked to select one of the following
response categories:
1. I only have whole milk 2. I sometimes have whole milk, sometimes I have semi-skimmed or
skimmed milk 3. I only have semi-skimmed milk 4. I sometimes have semi-skimmed, sometimes I have skimmed milk 5. I only have skimmed milk 6. I only have 1% fat milk 7. I have soya milk or other non-cow milk 8. I never have milk

60
Question
name Question
BRKN How often do you eat breakfast over a week?
FRUT How often do you eat at least 2 portions of fruit per day?
BRED Which type of bread do you normally eat?
MILK Which type of milk do you usually have?
7.5.2.3 Young Person Social Provisions Scale (3-items)
Cutrona CE, Russell DW. The provisions of social support and adaptation to stress.
Advance in Personal Relationships. 1987;1:37–67.
The Social Provisions Scale was also included at age 14 (MCS6).
At age 17, three items were included from the 10-item Social Provisions Scale
(Cutrona 1987). The Social Provisions Scale measures the availability of social
support.
The cohort member was asked to think about their current relationships with friends,
family members, community members and so on. They were asked to indicate the
extent to which each statement described their current relationship with other people
from the following responses: Very true; Partly true or Not true at all
Question
name Question
SAFF I have family and friends who help me feel safe, secure and happy
TRSS There is someone I trust whom I would turn to for advice if I were
having problems

61
Question
name Question
NCLS There is no one I feel close to
7.6 Overview of the online follow-up with cohort members
(Boost sample) (CAWI Boost)
7.6.1 Background and introduction
All cohort members in unproductive households at the main stage of the Age 17
Survey (excluding ineligible cases and permanent withdrawals) were invited to take
part in a short online questionnaire (lasting up to 20 minutes) on a device of their
choice, after main stage fieldwork was completed. The purpose of this online follow
up was two-fold: first, to boost the overall Age 17 Survey response, and second, to
collect data from unproductive cohort members for a number of key survey
questions. This data collection was designed to be a follow-up, rather than a
separate survey. Only cohort members were invited to take part in the follow-up, not
parents.
Information on how to identify these boost cases in the sample is provided in section
5.3.1.
7.6.2 Baseline numbers
A total of 2,506 cohort members were eligible to take part in the online follow-up.
253 cohort members completed the online questionnaire and belong to the ‘boost’
sample.
7.6.3 Contents of the online follow-up questionnaire
The questionnaire covered a variety of topics relevant to the lives of young people.
An overview is provided below:
Current activity (education/work)
Attitudes
62
Mental health and wellbeing
Personality
Relationships, sex and pregnancy
Risky behaviours
o Smoking
o Drinking
o Drug use
o Anti-social behaviour
Victimisation
Identity
Social media use
Contact information (used to keep in contact with the young people about the
study)
The online questionnaire was provided in English, but could be translated into Welsh by a Welsh-speaking interviewer over the telephone.
7.6.4 Scales
A number of scales were included in the online follow-up, which were also included
in the mainstage survey instruments. They include: Kessler 6, Short WEMWBS,
Rosenberg, Big 5/OCEAN, Brief Self-Control scale. Detail on these scales has been
covered in previous sections.
63
8. Young Person Cognitive Assessment
8.1 Background and introduction
Cohort members were asked to complete a cognitive assessment: the Number
Analogies activity (GL Assessments). The activity assesses young people’s basic
arithmetic knowledge and reasoning with numbers. Ten items were used from the
Cognitive Abilities Test 3, Level H, Number Analogies test (David F Lohman, Robert
L Thorndike, Elizabeth P Hagen, Adapted by Pauline Smith, Cres Fernandes and
Steve Strand) which assessed the young person’s arithmetic knowledge and
reasoning with numbers. The assessment was used and reduced from the original
20 items with permission of the owners GL Assessment. © David F Lohman, Robert
L Thorndike, Elizabeth P Hagen, 2001. Reproduced by permission of GL
Assessment. The assessment was timed, and cohort members had 6 minutes to
work through the 10 questions in the question booklet. They were provided with
pencil and paper if needed to work out answers.
Interviewers were told not to administer the assessment if the cohort member had a
learning disability or serious behavioural problem (e.g. severe ADHD, autism), or
was unable to respond in the required manner for the assessment (e.g. reading).
Before beginning the assessment, interviewers were asked to confirm in CAI
whether they received verbal consent from the cohort member to carry out the
cognitive assessment.
The cognitive assessment could be completed in Welsh if requested.
8.2 Baseline numbers
9558 Cohort Members answered the cognitive assessment.
64
9. Physical measurements
9.1 Background to physical measurements on MCS
At age 17 height, weight and body fat measurements were taken in the home by the
interviewer for each consenting, eligible cohort member. Physical measurements
have been collected from cohort members since the age of 3. Height and weight
measurements have been taken at each survey (ages 3, 5, 7, 11 and 14). In
addition, waist measurements were taken at ages 5 and 7, and body fat
measurements were taken at ages 7, 11 and 14.
As at previous sweeps, cohort members who could not stand unaided were not able
to have their height or weight and body fat measurements taken. In addition, any
cohort members who were fitted with an internal electrical device such as pacemaker
or cochlea implant were not able to have their body fat measurement taken as the
electrical signal could cause such devices to malfunction. Pregnant women should
not have their body fat measurement taken as the measurement might be
inaccurate, although there is no risk to the unborn child. At age 17, female cohort
members were given a showcard at the start of the module which asked them if they
had an electrical implant, were pregnant or neither applied. They were simply asked
to indicate which number on the card applied to preserve confidentiality.
Interviewers were accredited to take the physical measurements at age 17 as part of
the interviewer briefing in order to ensure accurate and consistent measurements.
Reasons for not being able to take any measurement and circumstances that applied
to measurements were recorded by the interviewer in CAI.
The data collection instrument set checks for height to between 120cm and 205cm,
and weight to between 20kg and 125kg (even where interviewers confirmed the
value outside the range was correct and re-entered it).
9.2 Height
The height measurement was taken by the interviewer using a Leicester height
measure. The interviewer used a Frankfurt Plane card to check that the cohort

65
member’s head was positioned correctly. The measurement was taken in metres
and centimetres and rounded down to the nearest completed millimetre. As indicated
above cohort members had to be able to stand unaided in order for the height
measurement to be taken. At age 17 it was possible that the cohort member would
be significantly taller than the interviewer. In these cases the interviewer was trained
to take the measurement at the bottom of a staircase if possible and use the steps to
place the head plate into position. If this was not possible they could ask another
adult in the house to help take the measurement.
9.3 Weight and body fat
Weight and body fat measurements were taken together using Tanita™ scales.
Weight measurements were recorded in kilograms and body fat was recorded as a
percent, both to one decimal place. The body fat measurement was taken by
sending a weak electronic current around the body from one foot to the other. The
scales measure the amount of resistance encountered by the current as it travels
round the body. As muscle and fat have different levels of resistance, the scales use
this to calculate body fat percentage. The scales required the cohort member’s
height and age to be entered before the measurements could be taken, so height
had to be measured first.
9.4 Weight only
If the cohort member did not want their body fat measurement to be taken or if the
body fat measurement could not be taken (e.g. no height measurement was
possible, body fat ineligible or refused), the Tanita™ scales could be operated to
take weight only. This was measured in kilograms to one decimal place.
9.5 Consent
Before taking any of the physical measurements, interviewers asked cohort
members to give verbal consent for each measurement and confirmed their answers
in CAI (recorded at CHAC). After the measurements were taken the interviewer
asked the young person if they would like a record of any of their measurements. If
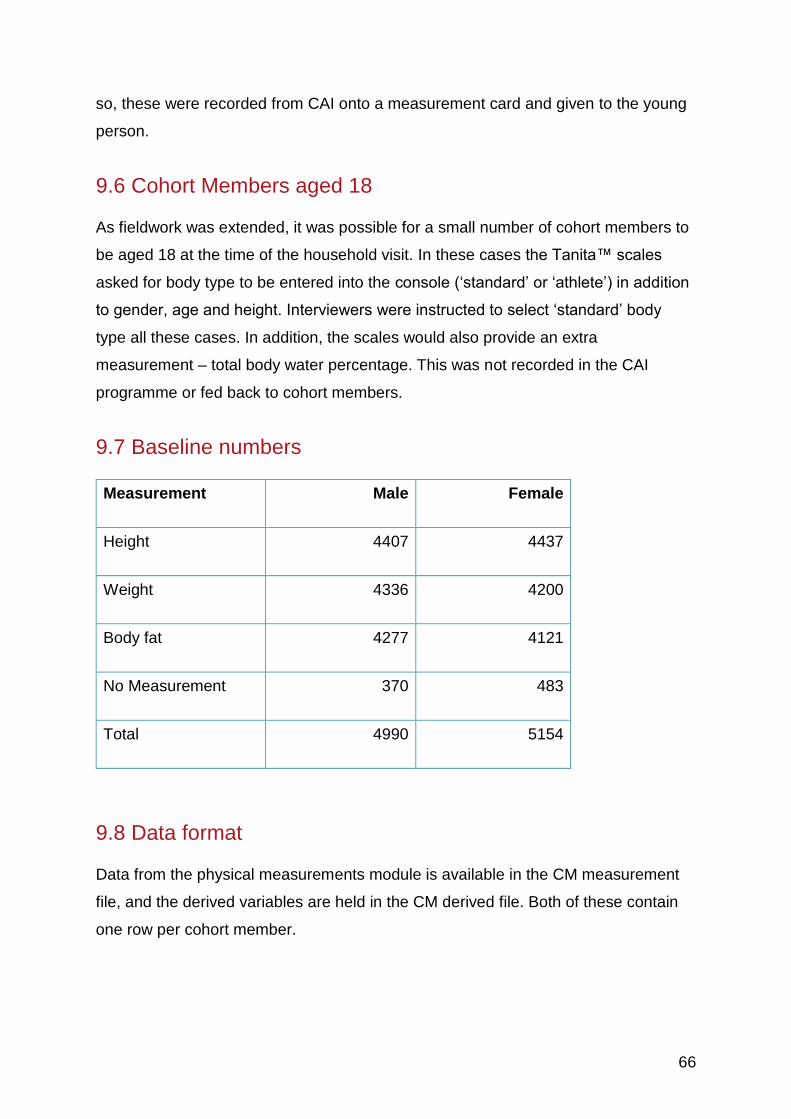
66
so, these were recorded from CAI onto a measurement card and given to the young
person.
9.6 Cohort Members aged 18
As fieldwork was extended, it was possible for a small number of cohort members to
be aged 18 at the time of the household visit. In these cases the Tanita™ scales
asked for body type to be entered into the console (‘standard’ or ‘athlete’) in addition
to gender, age and height. Interviewers were instructed to select ‘standard’ body
type all these cases. In addition, the scales would also provide an extra
measurement – total body water percentage. This was not recorded in the CAI
programme or fed back to cohort members.
9.7 Baseline numbers
Measurement Male Female
Height 4407 4437
Weight 4336 4200
Body fat 4277 4121
No Measurement 370 483
Total 4990 5154
9.8 Data format
Data from the physical measurements module is available in the CM measurement
file, and the derived variables are held in the CM derived file. Both of these contain
one row per cohort member.
67
9.9 Derived variables
There are two measures of obesity available, based on the two most widely used
reference panels – the International Obesity Task Force (IOTF) (Cole et al., 2000)
and the UK90 (Cole et al., 1990). Cut-offs are based on the age of the cohort
member at the time of interview and are provided with the relevant derived variables.
9.10 Reference cut-offs
The cut-offs that were used for the construction of the IOTF and UK90 derived
variables are provided at the value labels of the relevant derived variables. For the
UK90 derivation cut-off points were generated using the LMSGrowth Microsoft Excel
add-in software.

68
10. Overview of the parent questionnaires
10.1 Background and introduction
10.1.1 What are the parent questionnaires
At MCS7, parents were asked to complete an online questionnaire for the first time,
in place of a face-to-face interview. Up to two resident parents were eligible to
complete the online questionnaire, which had the same content for both parents.
Questions were included about the cohort member(s) as well as about the
parent/carer themselves and the household circumstances. The questionnaire took
around 15 minutes to complete, and could be filled in using a computer, tablet or
smartphone. The questionnaires could not be completed by proxy.
One parent was also asked to complete the parent facing Strengths and Difficulties
Questionnaire (SDQ) on paper.
10.1.2 How were parents identified at MCS7?
The parent respondents were established during the household questionnaire using
an algorithm within the CAPI questionnaire. The algorithm was based exclusively on
relationships between household members, firstly on the relationship between
parental figures and the cohort member, and then based on the parent figures’
relationship with each other. Natural parents took precedence, followed by adoptive,
step, foster, and grand-parents. Once parents were selected, neither took
precedence over the other.
10.1.3 Are the parent respondents the same people in all sweeps?
The response of parents varies between sweeps. This is because their inclusion to
the household grid (*PNUM*) is different to their eligibility for the interview (*ELIG*,
*RESP*). To help on this the datasets with _parent_ or _parent_cm_ structure
provide all the parent key identifiers: MCSID, PNUM, ELIG and RESP. The MCS
Data Handling Guide provides guidance on dealing with PNUM and ELIG variables.
In Sweep 7 the parents were provided with the same questionnaire. Due to this the
parent key identifier is their person number: GPNUM00. In sweep 7 it is not needed

69
to distinguish between Main Respondent and Partner Respondent that used to be
the information for ELIG and RESP in previous sweeps. More information on the
parent identifiers of MCS7 see section 5.3.4
10.2 Baseline numbers
MCS7 Proportion of households with productive and eligible parent online
questionnaires
Frequency Percent
1 parent productive interview (PARCAWI) in family
3641 23.14
2 parents productive interview (PARCAWI) in family
4525 42.59
No parent interview (no PARCAWI data) 2459 23.14
All productive households (in Core sample) 10625 100
2 Parents eligible 7900 74.35
1 Parent eligible 2653 24.97
0 Parent eligible 72 0.68
All productive households (in Core sample) 10625 100
Note: Percentages may not sum to 100 due to rounding.
10.3 Contents of the parent questionnaires
The online questionnaires covered a variety of topics about the cohort member(s) as
well as about the parent/carer him or herself and the household circumstances. A
breakdown is provided below.
Ethnicity (if not recorded at a previous sweep)
70
Family situation
o Marital status
o Questions about a non-resident natural parent of the cohort member
Whether they are still alive
Whether they financially contribute
The relationship of the responding parent with the non-resident
natural parent
o Questions about their own parents
Cohort member’s likelihood of going to university and reasons
Relationship with cohort member
Health
Employment and income
o Details of current job
o Employment history since last interview
o Hours worked
o Paid and unpaid overtime
o Activity if unemployed
o Reasons for absence from employment
o Current pay
o Other income (household level)
o Financial wellbeing
Housing tenure
Mental health
Contact information
Parent-facing SDQ (one parent only)
10.3.1 Income
Income has been collected at each sweep of MCS, previously through two banded
questions administered to two-parent and single-parent families respectively. This
section describes the collection of income measures in the survey at MCS7, and the
derivation of the income-derived variables and poverty indicator.
10.3.2 Total income data
Respondents were asked to provide a total amount of income from all sources and
earnings after tax and other deductions. If respondents did not provide an exact
figure, unfolding brackets were used to try to get an approximate amount. If the
respondent was unwilling or unable to answer a question on income, s/he was asked
whether his/her income was above or below a rounded income amount (for example
£20,000). S/he could then be asked a series of similarly structured questions in order

71
to narrow down the amount range. Both parent respondents (if applicable) were
asked the same question.
10.3.3 Missing income data (item non-response)
Some families did not report income: the table below shows that some MCS
families in sweep 7 did not provide income data, and shows why.
Missing data on the banded income questions
NTLP (1-parent family income)
NTCO (2-parent family income)
Missing income data (refusal) 211 1539
Missing income data (don’t know) 109 1004
Other missing (not applicable / not routed)
10924 1966
Number of respondents who provided income data
1447 8182
10.4 Scales
10.4.1 Kessler 6 Scale
Kessler, R.C., Barker, P.R., Colpe, L.J., Epstein, J.F., Gfroerer, J.C., Hiripi, E.,
Howes, M.J, Normand, S-L.T., Manderscheid, R.W., Walters, E.E., Zaslavsky, A.M.
(2003). Screening for serious mental illness in the general population. Archives of
General Psychiatry. 60(2), 184-189. Information on scoring and interpretation of this
scale can be found at http://www.hcp.med.harvard.edu/ncs/k6_scales.php.
At MCS7 the Kessler 6 was asked as part of the parent online CAWI questionnaire .
The K6 has also been asked of both parent respondents from MCS2 (age 3) through
to MCS6 (age 14). As noted earlier, the K6 was additionally asked of the cohort
members themselves for the first time at age 17.
The Kessler 6 (K6) scale is a quantifier of non-specific psychological distress. It
consists of six questions about depressive and anxiety symptoms that a person has
experienced in the last 30 days.
For each question, respondents were offered a self-report scale of five possible
answers plus don’t know/don’t wish to answer:

72
6. All of the time
7. Most of the time
8. Some of the time
9. A little of the time
10. None of the time
11. Don’t know/Don’t wish to answer
The questions are preambled by the statement: ‘The next few questions are about
how you have felt over the last 30 days’. The six questions are:
Question name Question
PHDE During the last 30 days, about how often did you feel so
depressed that nothing could cheer you up?
PHHO During the last 30 days, about how often did you feel
hopeless?
PHRF During the last 30 days, about how often did you feel
restless or fidgety?
PHEE During the last 30 days, about how often did you feel that
everything was an effort?
PHWO During the last 30 days, about how often did you feel
worthless?
PHNE During the last 30 days, about how often did you feel
nervous?
10.4.2 Strengths and Difficulties Questionnaire (SDQ)
Goodman (1997): https://www.sdqinfo.com/a0.html
The parent SDQ was also administered in Sweeps 2, 3 4, 5 and 6. For further details
see Johnson et al. (2015).
73
The SDQ is a behavioural screening questionnaire about 4 to 17-year-olds. It
measures 25 items on psychological attributes
At MCS7, the P4-17 - SDQ without impact supplement for the parents of 4-17-year-
olds version was used.
The respondent is asked to comment on the following statements about the cohort
member over the past 6 months with response options: Not true, Somewhat true or
Certainly true. The above 25 items are divided between 5 scales:
Emotional symptoms
f. Complains of headaches/stomach aches/sickness
g. Often seems worried
h. Often unhappy
i. Nervous or clingy in new situations
j. Many fears, easily scared.
Conduct problems
k. Often has temper tantrums
l. Generally obedient*
m. Fights with or bullies other children
n. Steals from home, school or elsewhere (In MCS2: Can be
spiteful to others)
o. Often lies or cheats (in MCS2: Often argumentative with
adults).
Hyperactivity/inattention
p. Restless, overactive, cannot stay still for long
q. Constantly fidgeting
r. Easily distracted
s. Can stop and think before acting*
t. Sees tasks through to the end*.
Peer relationship problems
u. Tends to play alone
v. Has at least one good friend*
w. Generally liked by other children*
x. Picked on or bullied by other children
y. Gets on better with adults.
Prosocial behaviour
z. Considerate of others’ feelings
aa. Shares readily with others
74
bb. Helpful if someone is hurt, upset or ill
cc. Kind to younger children
dd. Often volunteers to help others.
*Denotes items that are reversed when generating sub-scales on behaviour.
Each of the five scales can be used alone or together to create:
1-4 when taken together generate a total difficulties score
1 and 4 create an internalising problems score
2 and 3 create an externalising conduct score
5 alone measures prosocial behaviour
See: https://sdqinfo.org/py/sdqinfo/b3.py?language=Englishqz(UK
10.5 Feed forward data
A limited amount of information was fed forward from earlier sweeps, mainly around
the respondent’s working status and/or job role at the previous sweep. Parents were
identified by a person number which was recorded on the Computer-Assisted
Interview (CAI). If the person number for a parent was associated with someone who
had been the main or partner at a previous sweep, personal information about her or
him was fed forward from the last sweep they had participated in.
75
11. Data linkage
11.1 Asking for administrative data linkage consent
As part of the CAPI interview, cohort members were asked for consent to link their
survey answers with nine different administrative data sources, held by a number of
different government departments and non-governmental bodies:
Health records, held by the NHS, including Primary Care data - covering visits
to family doctor and other health professionals, and Hospital Episode
Statistics (HES) - covering admissions and attendance at hospital;
Records about school participation and attainment, and pupil characteristics,
kept by the Department for Education;
Records about participation in further education and attainment, kept by the
Department for Business Innovation and Skills;
Records covering university participation and attainment, held by the Higher
Education Statistics Agency (HESA);
Records covering higher education applications and offers, held by the
Universities and Colleges Admissions Service (UCAS);
Records covering payments of student support, held by Student Loans
Company (SLC);
Information on benefit and employment programs, kept by Department for
Work and
Pensions (DWP);
Information on employment, earnings, tax credits, occupational pensions and
National Insurance Contributions, kept by Her Majesty’s Revenue and
Customs (HMRC);
Respondents who consented to either DWP or HMRC linkage were also
asked for their National Insurance number (NINO).
Police National Computer (PNC) records covering arrests, cautions and
sentences, held by the Ministry of Justice.
All participant materials and operational procedures involved in collecting data
linkage consent were tested in exploratory qualitative work and the study pilot

76
stages, and approved by data holders and ethical committees prior the main stage
data collection.
11.2 Consent process
Data linkage was an important part of the study and considerable effort was
expended in developing an approach that would maximise consent (see 4.8 Data
linkage in Millennium Cohort Study Seventh Sweep (MCS7) Technical Report).
In order to obtain consent, a data linkage booklet was sent to the cohort member in
advance of their interview once an appointment had been secured. It gave
information on the purpose, types, value and process of data linkage, and
encouraged cohort members to contact the study team with any questions they
might have. During the interview, interviewers first showed the cohort member a
video on their tablet explaining data linkage. After confirming that cohort members
had read the information booklet (and in the event they had not, read some key
information out to them), consent to data linkage was collected on paper. Cohort
members were left with a carbon copy of the consents they had given.
11.3 Achieved consent rates
The table below outlines the rate of consent for each administrative source that
consent was sought for.
Table X: Rates of consent to data linkage at time of interview
Linkage n %
Eligible cohort members 10,757 100
Consented to at least one type of data
linkage 9,862 91.7
Consented to all linkages 6,392 59.4
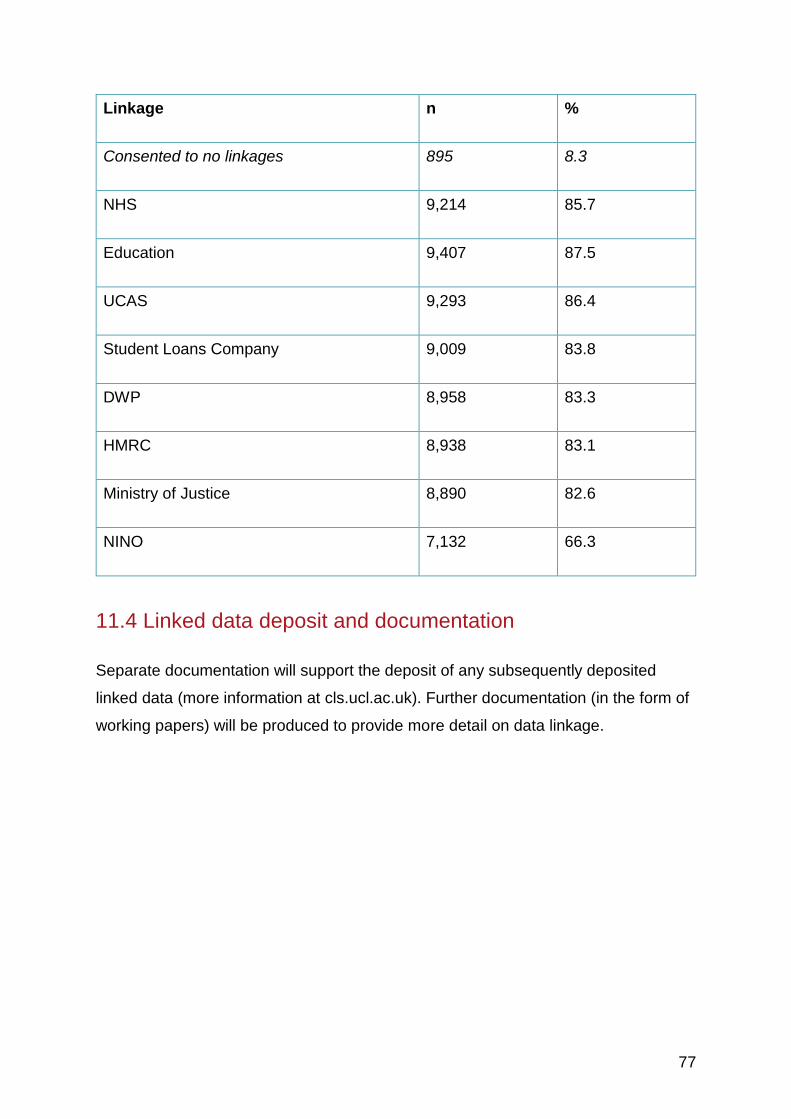
77
Linkage n %
Consented to no linkages 895 8.3
NHS 9,214 85.7
Education 9,407 87.5
UCAS 9,293 86.4
Student Loans Company 9,009 83.8
DWP 8,958 83.3
HMRC 8,938 83.1
Ministry of Justice 8,890 82.6
NINO 7,132 66.3
11.4 Linked data deposit and documentation
Separate documentation will support the deposit of any subsequently deposited
linked data (more information at cls.ucl.ac.uk). Further documentation (in the form of
working papers) will be produced to provide more detail on data linkage.

78
12. Non-Response and Weights
Non-response is common in longitudinal surveys. Missing values mean less efficient
estimates because of the reduced size of the analysis sample, but also introduce the
potential for bias since respondents are often systematically different from non-
respondents. To support researchers in producing robust analysis, we have
developed comprehensive advice on how to deal with missing data (Silverwood et
al., 2020a). The approaches we recommend to researchers capitalise on the rich
data cohort members and their families provided over the years before their non-
response. These include well-known methods such as multiple imputation, inverse
probability weighting, and full information maximum likelihood. To correct for non-
response in MCS7, non-response weights are provided, so that inverse probability
weighted analysis can be undertaken, either in isolation or in combination with
multiple imputation.
This report examines non-response in MCS7 and presents the procedures used in
the construction of MCS7 unit non-response weights. For a full description of attrition
in previous sweeps, refer to the MCS Technical Report on Response (3rd edition,
2010), Technical Report on Response in sweep 5 (2014) and MCS6 User Guide. For
a description of how to use the weights in Stata and SPSS, refer to the respective
guides (Stata, SPSS). For a description of the MCS sample refer to the Technical
Report on Sampling (4th edition, 2007).
12.1 Response in MCS
In Table 1, the proportions of productive and unproductive cases are presented by
category. The table shows that the proportion of productive cases has decreased
over time from 96.4% in MCS1 (age 9 months) to 55.2% in MCS7 (age 17). The two
categories of non-response which have seen a marked increase over time are
‘Refusal’ and ‘Not issued’. In early sweeps ‘Refusals’ consist of respondents who
refused to take part in a particular sweep of data collection, and ‘Not issued’ are
respondents who have not participated in the survey on two consecutive occasions,

79
and therefore were no longer issued for fieldwork (i.e. the survey agency no longer
tries to contact them).
Non-contact has, in general, declined over time because respondents in this
category have either been located and contacted again, or have moved to the not
issued category. All other types of non-response are relatively stable over time. Note
that ‘Ineligible’ includes child deaths, sensitive cases and temporary and permanent
emigrants. The category ‘Untraced movers’ refers to respondents who have changed
address and were not located, including possible emigrants. Respondents who were
not issued in MCS1 but at MCS2 instead are labelled as ‘New Families’. These were
eligible families who were not contacted in MCS1 because their addresses were not
know in time for them to be included in the first sweep of data collection.
Table 1: Productive and unproductive cases in all MCS sweeps.
MCS1 MCS2 MCS3 MCS4
Age 9
months
Age 3 years Age 5 years Age 7 years
Freq. % Freq. % Freq. % Freq. %
Productive 18,551 96.4 15,590 81.0 15,246 79.2 13,857 72.0
Refusal 1,739 9.0 2,315 12.0 1,811 9.4
Ineligible 167 0.9 300 1.6 126 0.7
Untraced
movers
686 3.6 546 2.8 706 3.7
Non-contact 930 4.8 546 2.8 123 0.6
Not issued 692 3.6 2,212 11.5
Other
unproductive
131 0.7 290 1.5 408 2.1
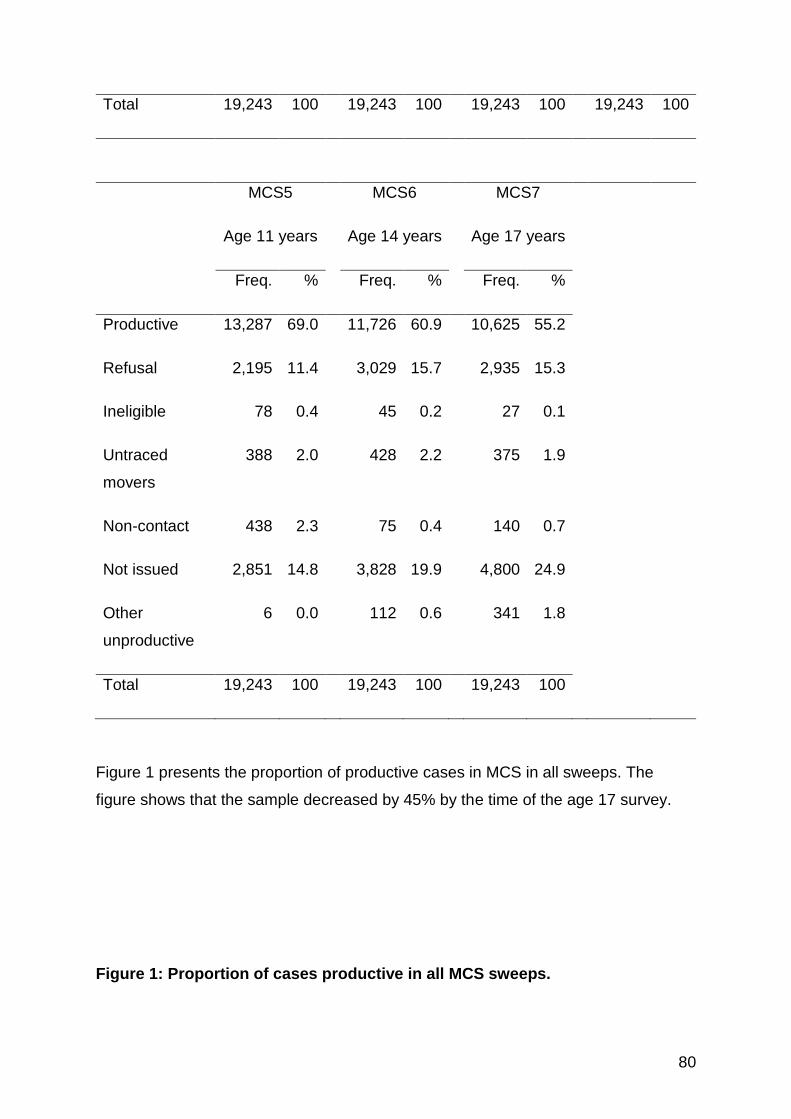
80
Total 19,243 100 19,243 100 19,243 100 19,243 100
MCS5 MCS6 MCS7
Age 11 years Age 14 years Age 17 years
Freq. % Freq. % Freq. %
Productive 13,287 69.0 11,726 60.9 10,625 55.2
Refusal 2,195 11.4 3,029 15.7 2,935 15.3
Ineligible 78 0.4 45 0.2 27 0.1
Untraced
movers
388 2.0 428 2.2 375 1.9
Non-contact 438 2.3 75 0.4 140 0.7
Not issued 2,851 14.8 3,828 19.9 4,800 24.9
Other
unproductive
6 0.0 112 0.6 341 1.8
Total 19,243 100 19,243 100 19,243 100
Figure 1 presents the proportion of productive cases in MCS in all sweeps. The
figure shows that the sample decreased by 45% by the time of the age 17 survey.
Figure 1: Proportion of cases productive in all MCS sweeps.
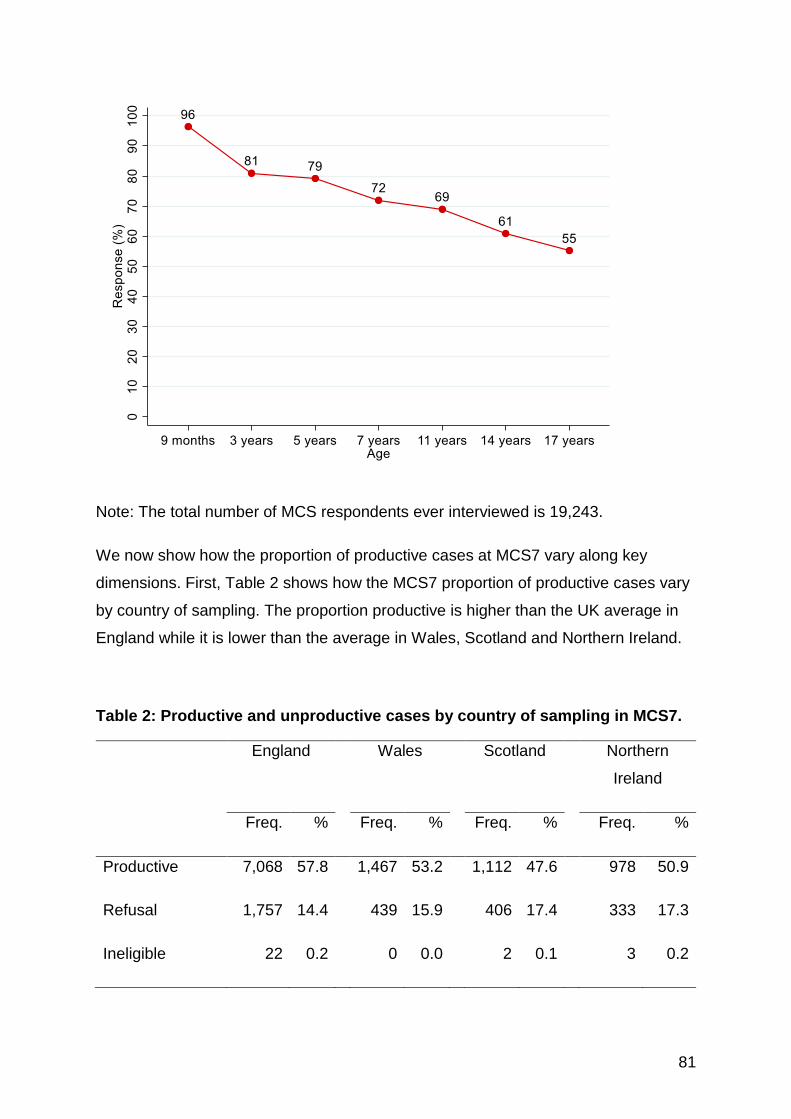
81
Note: The total number of MCS respondents ever interviewed is 19,243.
We now show how the proportion of productive cases at MCS7 vary along key
dimensions. First, Table 2 shows how the MCS7 proportion of productive cases vary
by country of sampling. The proportion productive is higher than the UK average in
England while it is lower than the average in Wales, Scotland and Northern Ireland.
Table 2: Productive and unproductive cases by country of sampling in MCS7.
England Wales Scotland Northern
Ireland
Freq. % Freq. % Freq. % Freq. %
Productive 7,068 57.8 1,467 53.2 1,112 47.6 978 50.9
Refusal 1,757 14.4 439 15.9 406 17.4 333 17.3
Ineligible 22 0.2 0 0.0 2 0.1 3 0.2

82
Untraced
movers
181 1.5 87 3.2 76 3.3 31 1.6
Non-contact 87 0.7 25 0.9 14 0.6 14 0.7
Not issued 2,895 23.7 662 24.0 695 29.8 548 28.5
Other
unproductive
214 1.8 80 2.9 31 1.3 16 0.8
Total 12,224 100 2,760 100 2,336 100 1,923 100
Sample size=19,243.
Table 3 shows that the proportion of productive cases varies across sampling strata
in each country. Respondents sampled from the socially advantaged stratum are
more likely to be productive in all four countries, compared to those sampled from
the disadvantaged stratum. Respondents sampled from the ethnic minority stratum
are less likely to be productive than those in the advantaged stratum in England.
Table 3: Proportion of productive cases by stratum in MCS7.
England Wales Scotland Northern
Ireland
Adv Dis Ethn Adv Dis Adv Dis Adv Dis
Productive 61.5 54.0 58.0 58.2 51.0 52.4 43.0 55.9 47.8
Unproductive 38.5 46.0 42.0 41.8 49.0 47.6 57.0 44.1 52.2
Adv stands for advantaged stratum; Dis stands for disadvantaged stratum; Ethn stands for ethnic minority stratum. Sample size=19,243.
In Table 4 we look at different response patterns. Table 4 shows that 40.7% of all
respondents participated in all seven sweeps of MCS. In contrast, 25.1% have
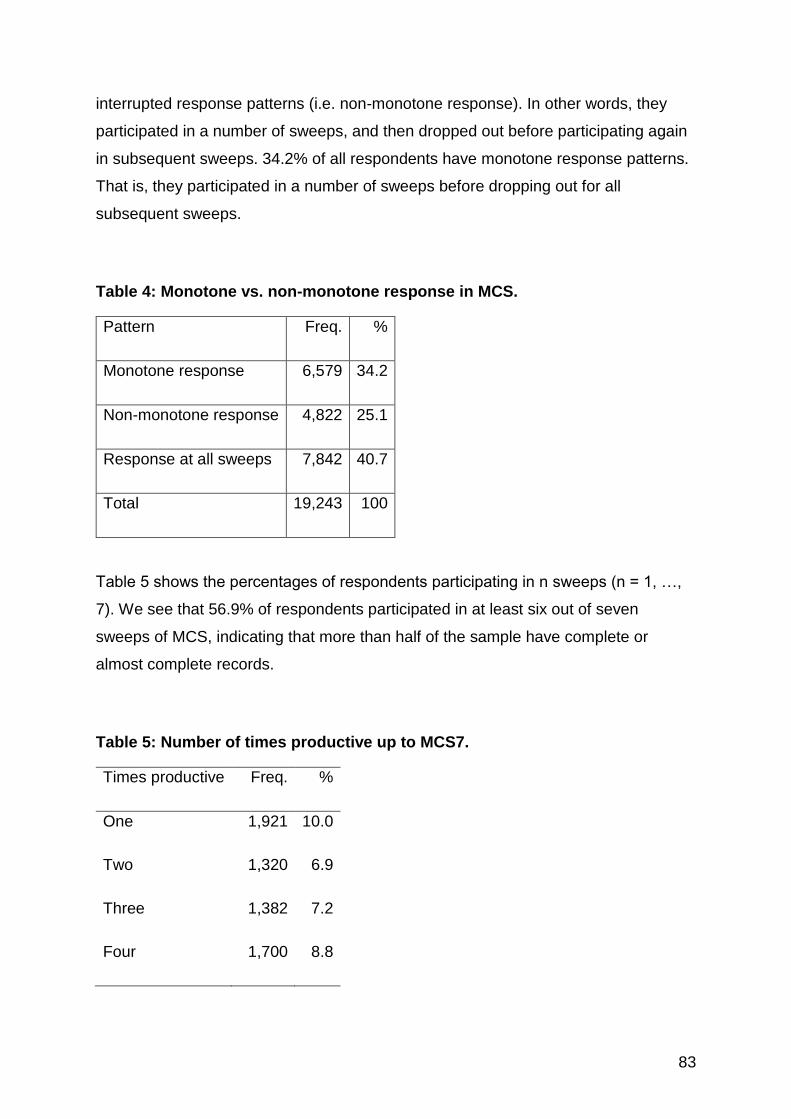
83
interrupted response patterns (i.e. non-monotone response). In other words, they
participated in a number of sweeps, and then dropped out before participating again
in subsequent sweeps. 34.2% of all respondents have monotone response patterns.
That is, they participated in a number of sweeps before dropping out for all
subsequent sweeps.
Table 4: Monotone vs. non-monotone response in MCS.
Pattern Freq. %
Monotone response 6,579 34.2
Non-monotone response 4,822 25.1
Response at all sweeps 7,842 40.7
Total 19,243 100
Table 5 shows the percentages of respondents participating in n sweeps (n = 1, …,
7). We see that 56.9% of respondents participated in at least six out of seven
sweeps of MCS, indicating that more than half of the sample have complete or
almost complete records.
Table 5: Number of times productive up to MCS7.
Times productive Freq. %
One 1,921 10.0
Two 1,320 6.9
Three 1,382 7.2
Four 1,700 8.8
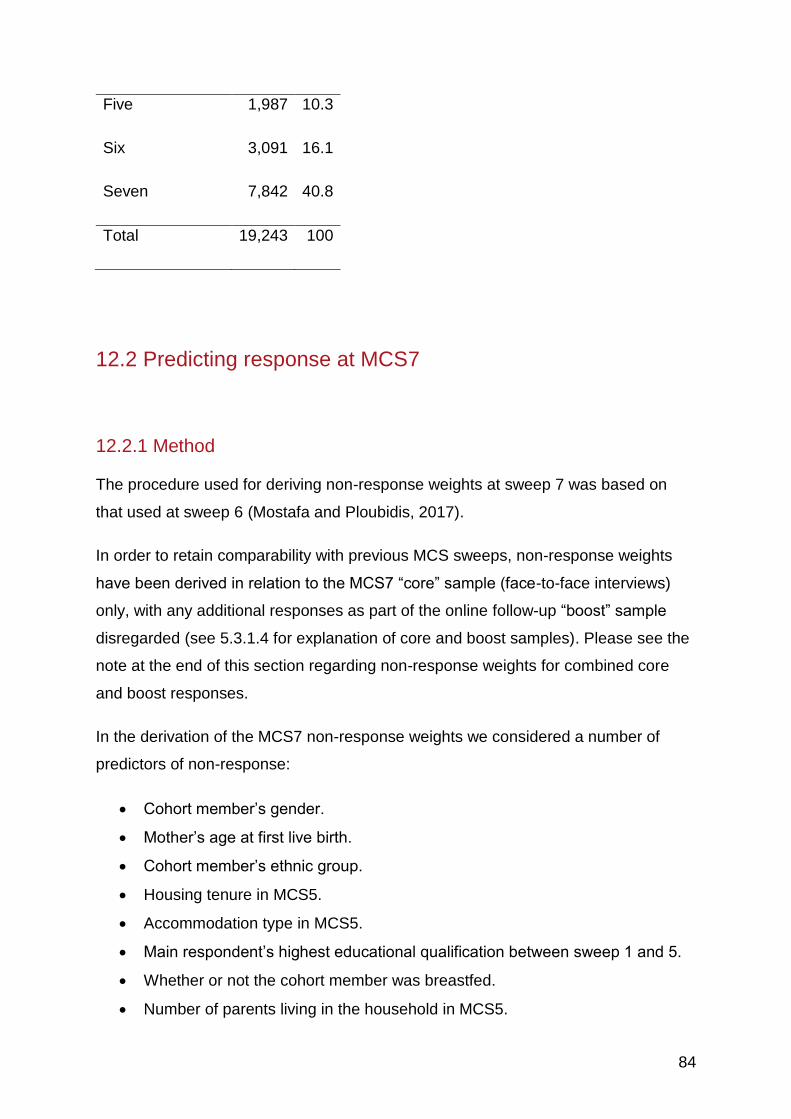
84
Five 1,987 10.3
Six 3,091 16.1
Seven 7,842 40.8
Total 19,243 100
12.2 Predicting response at MCS7
12.2.1 Method
The procedure used for deriving non-response weights at sweep 7 was based on
that used at sweep 6 (Mostafa and Ploubidis, 2017).
In order to retain comparability with previous MCS sweeps, non-response weights
have been derived in relation to the MCS7 “core” sample (face-to-face interviews)
only, with any additional responses as part of the online follow-up “boost” sample
disregarded (see 5.3.1.4 for explanation of core and boost samples). Please see the
note at the end of this section regarding non-response weights for combined core
and boost responses.
In the derivation of the MCS7 non-response weights we considered a number of
predictors of non-response:
Cohort member’s gender.
Mother’s age at first live birth.
Cohort member’s ethnic group.
Housing tenure in MCS5.
Accommodation type in MCS5.
Main respondent’s highest educational qualification between sweep 1 and 5.
Whether or not the cohort member was breastfed.
Number of parents living in the household in MCS5.

85
Main respondent’s highest social and economic status between sweep 1 and
5.
Ratio of number of times not answering the income question divided by the
number of sweeps productive.
Ratio of number of times reporting having a job divided by the number of
times productive.
Whether the household is a ‘new’ family. (701 children joined the survey in
sweep 2 because their addresses were not known in sweep 1 and therefore
did not take part in the first sweep. These children and their families were
labelled as ‘new families’.)
Number of previous productive sweeps.
Cohort member’s cognitive ability at age 5.
Mother’s mental health when cohort member was age 9 months.
Cohort member’s own mental health at age 11.
The first 12 variables were included as predictors of response at sweep 6 (Mostafa
and Ploubidis, 2017). The final four variables have been added on the basis of
recent work on non-response in other Centre for Longitudinal Studies cohorts
(Mostafa et al., 2020, Silverwood et al., 2020b).
Some of the predictor variables (the cohort member’s gender, whether the
household is a ‘new’ family, ratio of number of times not answering the income
question divided by the number of sweeps productive, ratio of number of times
reporting having a job divided by the number of times productive, number of previous
productive sweeps) were fully observed.
Ethnicity can be considered as an essentially fixed attribute over time, so was
constructed by starting with the most recent response and sequentially filling in any
missing values by going backwards through the MCS sweeps, though a small
number of missing values (0.1%) remained.

86
The remaining variables has levels of missing data between 0.2% (main
respondent’s highest educational qualification between sweep 1 and 5) and 31.0%
(number of parents living in the household in MCS5).
All remaining missing values were handling using multiple imputation. The imputation
model included all the above predictor variables, MCS7 response (a binary variable
for response vs. otherwise, defined for all 19,243 cohort members) and the MCS
sampling weight (weight2). Fifty imputed datasets were created using chained
equations.
We note that multiple imputation returns valid estimates assuming the data are
missing at random (MAR) (Enders, 2010, Seaman et al., 2013, Sterne et al., 2009).
This implies that any differences between the missing values and the observed
values can be explained by the variables that were included in the imputation
models. Put differently, conditional on the variables in the imputation model,
missingness in not due to unobserved or observed variables not included in the
model.
Logistic regression models for MCS7 response conditional on all the above predictor
variables were fitted in each imputed dataset and combined using standard rules.
From these models, the probability of MCS7 response was predicted for each
respondent, with the non-response weight calculated as the inverse of the response
probability (Wooldridge, 2007).
Test analyses were conducted at different levels of weight truncation which
suggested that truncation to 50 could provide some improvement in precision without
undue introduction of bias. MCS7 non-response weights were therefore truncated to
50.
The MCS7 non-response weights were then calibrated so that they sum to the
number of MCS7 productive sample size by multiplying them by the ratio of the
number of productive respondents to the total of the uncalibrated non-response
weights.
Finally, two overall weights were constructed by multiplying the MCS7 non-response
weights by the sampling weights in sweep 1:
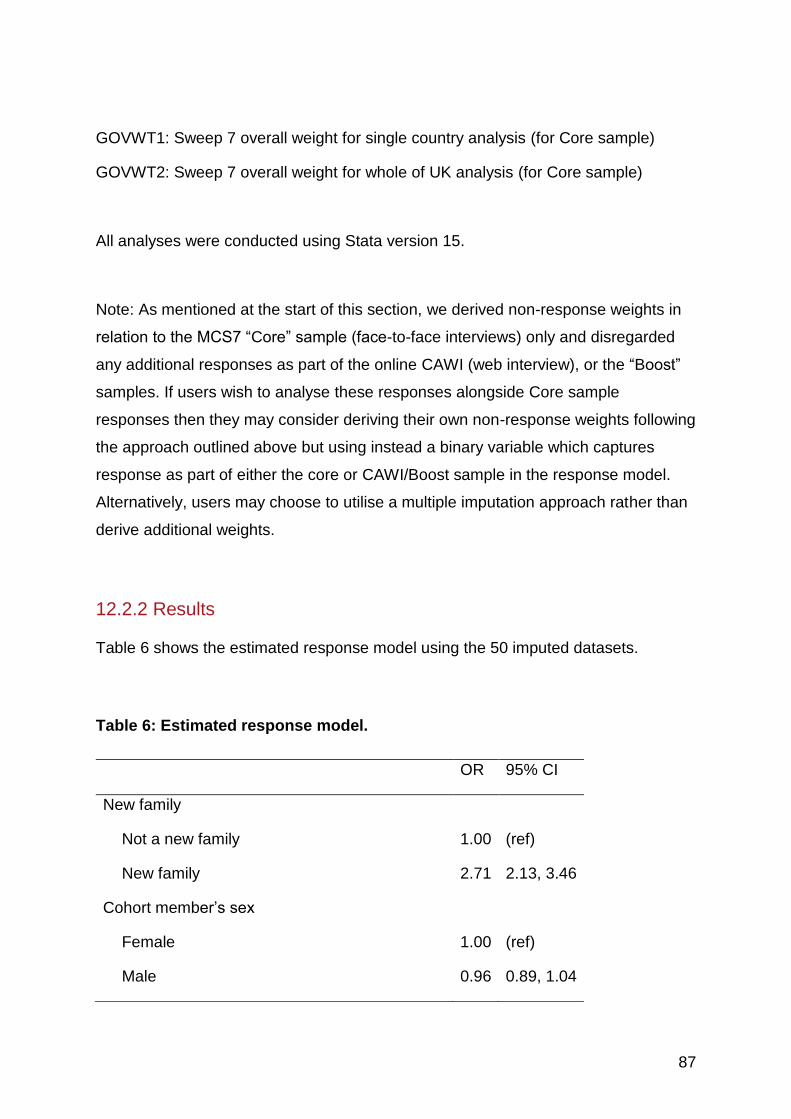
87
GOVWT1: Sweep 7 overall weight for single country analysis (for Core sample)
GOVWT2: Sweep 7 overall weight for whole of UK analysis (for Core sample)
All analyses were conducted using Stata version 15.
Note: As mentioned at the start of this section, we derived non-response weights in
relation to the MCS7 “Core” sample (face-to-face interviews) only and disregarded
any additional responses as part of the online CAWI (web interview), or the “Boost”
samples. If users wish to analyse these responses alongside Core sample
responses then they may consider deriving their own non-response weights following
the approach outlined above but using instead a binary variable which captures
response as part of either the core or CAWI/Boost sample in the response model.
Alternatively, users may choose to utilise a multiple imputation approach rather than
derive additional weights.
12.2.2 Results
Table 6 shows the estimated response model using the 50 imputed datasets.
Table 6: Estimated response model.
OR 95% CI
New family
Not a new family 1.00 (ref)
New family 2.71 2.13, 3.46
Cohort member’s sex
Female 1.00 (ref)
Male 0.96 0.89, 1.04

88
Cohort member’s ethnic group
White 1.00 (ref)
Mixed 1.56 1.22, 1.98
Indian 1.94 1.47, 2.56
Pakistani/Bangladeshi 2.55 2.11, 3.07
Black Caribbean/Black African 2.01 1.59, 2.54
Other ethnic group 2.19 1.58, 3.03
Whether cohort member was breastfed
No 1.00 (ref)
Yes 1.12 1.02, 1.23
Accommodation type
Other 1.00 (ref)
House or bungalow 0.82 0.71, 0.95
Highest educational qualification
NVQ level 1 1.00 (ref)
NVQ level 2 1.13 0.96, 1.33
NVQ level 3 1.27 1.06, 1.52
NVQ level 4 1.43 1.20, 1.71
NVQ level 5 1.80 1.44, 2.25
Overseas qualifications only 1.24 0.94, 1.62
None of these 1.18 0.98, 1.42
Number of parents in household
One parent/carer 1.00 (ref)
Two parents/carers 1.27 1.14, 1.41
Main respondent's highest socioeconomic status
Managerial and professional 1.00 (ref)

89
Intermediate 0.93 0.83, 1.05
Small employers and self employed 0.89 0.74, 1.08
Lower supervisory and technical 1.00 0.82, 1.21
Semi-routine and routine 0.89 0.78, 1.02
Housing tenure
Own outright 1.00 (ref)
Own - mortgage/loan 0.96 0.81, 1.15
Rent from local authority 0.85 0.68, 1.05
Rent from housing association 0.86 0.68, 1.08
Rent privately 0.89 0.72, 1.10
Other 0.80 0.57, 1.14
Mother's age at first birth 1.01 1.00, 1.01
Maternal mental health (age 9 months) 0.99 0.97, 1.02
Cohort member cognitive ability (age 5) 1.10 1.03, 1.17
Cohort member mental health (age 11) 0.99 0.98, 1.00
Ratio times having a job 0.55 0.48, 0.64
Ratio of income item non-response 0.59 0.46, 0.76
Number of previous responses (sweeps 1-6) 3.54 3.41, 3.68
Sample size=19,243.
In Tables 7 and 8, the means, minima and maxima of the two overall weights are
presented by stratum.
Table 7: GOVWT1, sweep 7 overall weight for single country analysis.
Sampling stratum N Mean SD Min Max
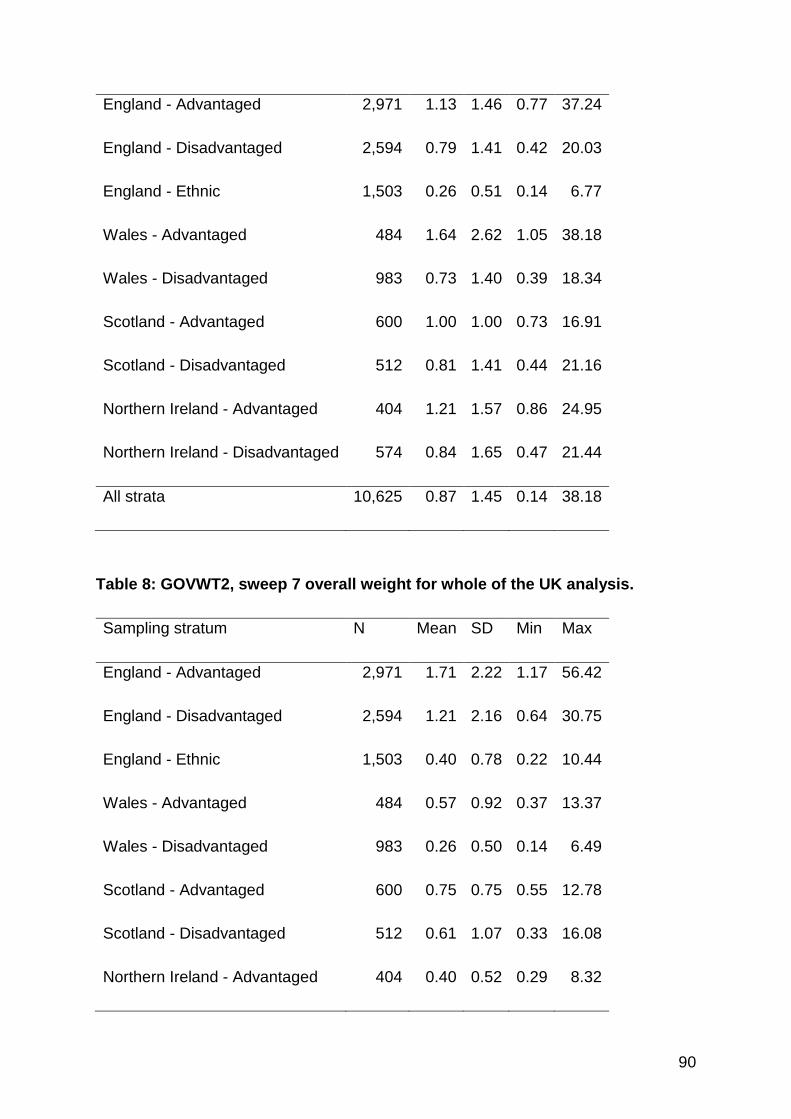
90
England - Advantaged 2,971 1.13 1.46 0.77 37.24
England - Disadvantaged 2,594 0.79 1.41 0.42 20.03
England - Ethnic 1,503 0.26 0.51 0.14 6.77
Wales - Advantaged 484 1.64 2.62 1.05 38.18
Wales - Disadvantaged 983 0.73 1.40 0.39 18.34
Scotland - Advantaged 600 1.00 1.00 0.73 16.91
Scotland - Disadvantaged 512 0.81 1.41 0.44 21.16
Northern Ireland - Advantaged 404 1.21 1.57 0.86 24.95
Northern Ireland - Disadvantaged 574 0.84 1.65 0.47 21.44
All strata 10,625 0.87 1.45 0.14 38.18
Table 8: GOVWT2, sweep 7 overall weight for whole of the UK analysis.
Sampling stratum N Mean SD Min Max
England - Advantaged 2,971 1.71 2.22 1.17 56.42
England - Disadvantaged 2,594 1.21 2.16 0.64 30.75
England - Ethnic 1,503 0.40 0.78 0.22 10.44
Wales - Advantaged 484 0.57 0.92 0.37 13.37
Wales - Disadvantaged 983 0.26 0.50 0.14 6.49
Scotland - Advantaged 600 0.75 0.75 0.55 12.78
Scotland - Disadvantaged 512 0.61 1.07 0.33 16.08
Northern Ireland - Advantaged 404 0.40 0.52 0.29 8.32
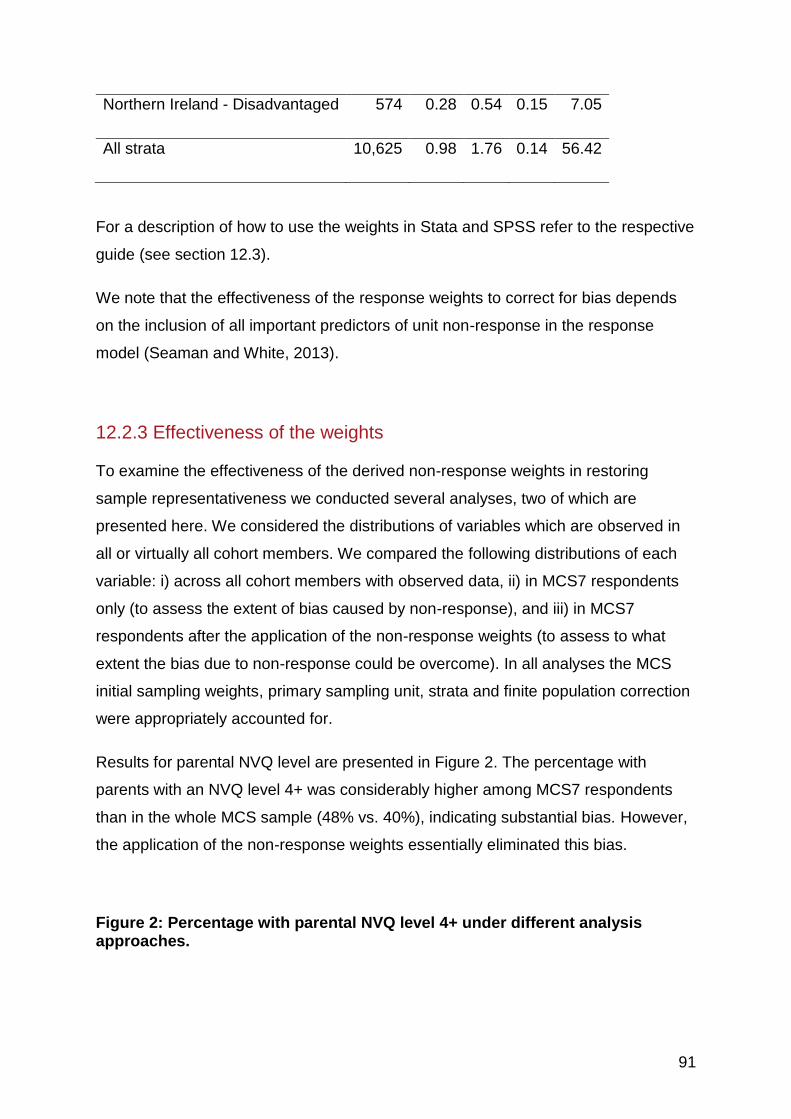
91
Northern Ireland - Disadvantaged 574 0.28 0.54 0.15 7.05
All strata 10,625 0.98 1.76 0.14 56.42
For a description of how to use the weights in Stata and SPSS refer to the respective
guide (see section 12.3).
We note that the effectiveness of the response weights to correct for bias depends
on the inclusion of all important predictors of unit non-response in the response
model (Seaman and White, 2013).
12.2.3 Effectiveness of the weights
To examine the effectiveness of the derived non-response weights in restoring
sample representativeness we conducted several analyses, two of which are
presented here. We considered the distributions of variables which are observed in
all or virtually all cohort members. We compared the following distributions of each
variable: i) across all cohort members with observed data, ii) in MCS7 respondents
only (to assess the extent of bias caused by non-response), and iii) in MCS7
respondents after the application of the non-response weights (to assess to what
extent the bias due to non-response could be overcome). In all analyses the MCS
initial sampling weights, primary sampling unit, strata and finite population correction
were appropriately accounted for.
Results for parental NVQ level are presented in Figure 2. The percentage with
parents with an NVQ level 4+ was considerably higher among MCS7 respondents
than in the whole MCS sample (48% vs. 40%), indicating substantial bias. However,
the application of the non-response weights essentially eliminated this bias.
Figure 2: Percentage with parental NVQ level 4+ under different analysis approaches.

92
Note: MCS7 A = percentage in MCS7 respondents only; MCS7 B = percentage in
MCS7 respondents after the application of the non-response weights.
Results for accommodation type are presented in Figure 3. There is again some
evidence of bias due to non-response which is largely (though not perfectly) resolved
through the application of the non-response weights.
Figure 2: Percentage of accommodation type not house or bungalow under different analysis approaches.
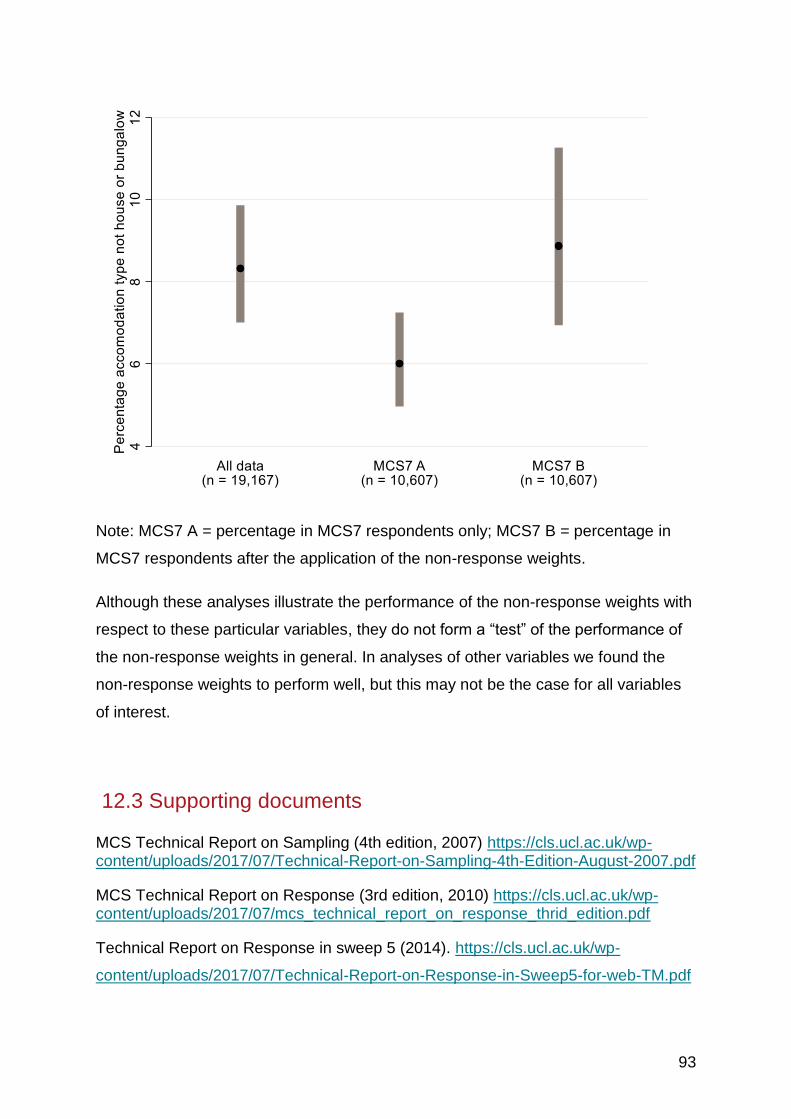
93
Note: MCS7 A = percentage in MCS7 respondents only; MCS7 B = percentage in
MCS7 respondents after the application of the non-response weights.
Although these analyses illustrate the performance of the non-response weights with
respect to these particular variables, they do not form a “test” of the performance of
the non-response weights in general. In analyses of other variables we found the
non-response weights to perform well, but this may not be the case for all variables
of interest.
12.3 Supporting documents
MCS Technical Report on Sampling (4th edition, 2007) https://cls.ucl.ac.uk/wp-content/uploads/2017/07/Technical-Report-on-Sampling-4th-Edition-August-2007.pdf
MCS Technical Report on Response (3rd edition, 2010) https://cls.ucl.ac.uk/wp-content/uploads/2017/07/mcs_technical_report_on_response_thrid_edition.pdf
Technical Report on Response in sweep 5 (2014). https://cls.ucl.ac.uk/wp-
content/uploads/2017/07/Technical-Report-on-Response-in-Sweep5-for-web-TM.pdf
94
12.4 References
ENDERS, C. K. 2010. Applied missing data analysis, New York, Guilford.
MOSTAFA, T., NARAYANAN, M., PONGIGLIONE, B., DODGEON, B., GOODMAN,
A., SILVERWOOD, R. J. & PLOUBIDIS, G. B. 2020. Improving the plausibility of the
missing at random assumption in the 1958 British birth cohort: A pragmatic data
driven approach. CLS Working Paper 2020/6, London, UCL Centre for Longitudinal
Studies.
MOSTAFA, T. & PLOUBIDIS, G. B. 2017. Millennium Cohort Study. Sixth Survey
2015-2016. Technical report on response (Age 14), London, UCL Centre for
Longitudinal Studies.
SEAMAN, S., GALATI, J., JACKSON, D. & CARLIN, J. 2013. What is meant by
“missing at random”? Statistical Science, 28, 257-268.
SEAMAN, S. R. & WHITE, I. R. 2013. Review of inverse probability weighting for
dealing with missing data. Stat Methods Med Res, 22, 278-95.
SILVERWOOD, R., NARAYANAN, M., DODGEON, B. & PLOUBIDIS, G. 2020a.
Handling missing data in the National Child Development Study: User Guide,
London, UCL Centre for Longitudinal Studies.
SILVERWOOD, R. J., CALDERWOOD, L., SAKSHAUG, J. W. & PLOUBIDIS, G. B.
2020b. A data driven approach to understanding and handling non-response in the
Next Steps cohort. CLS Working Paper 2020/5, London, UCL Centre for Longitudinal
Studies.
STERNE, J. A., WHITE, I. R., CARLIN, J. B., SPRATT, M., ROYSTON, P.,
KENWARD, M. G., WOOD, A. M. & CARPENTER, J. R. 2009. Multiple imputation
for missing data in epidemiological and clinical research: potential and pitfalls. BMJ,
338, b2393.

95
WOOLDRIDGE, J. M. 2007. Inverse probability weighted estimation for general
missing data problems. Journal of Econometrics, 141, 1281-1301.