
Milk production, marketing practices and qualities along ...
16
Vol. 14(35), pp. 1990-2005, December, 2019 DOI: 10.5897/AJAR2019.14087 Article Number: 74DB1A562458 ISSN: 1991-637X Copyright ©2019 Author(s) retain the copyright of this article http://www.academicjournals.org/AJAR African Journal of Agricultural Research Full Length Research Paper Milk production, marketing practices and qualities along milk supply chains of Haramaya District, Ethiopia Mitiku Eshetu*, Mekdes Seyoum and Yesihak Yusuf Mummed School of Animal and Range Sciences, Haramaya University, P. O. Box 138, Dire Dawa, Ethiopia. Received 7 April, 2019; Accepted 4 October, 2019 A study was conducted with the aim of evaluating the physicochemical properties and microbial qualities of raw cow’s milk along the milk supply chain in Haramaya district. A total of 123 smallholder dairy producers, one dairy cooperative, 3 milk collectors, 6 milk retailers, 8 selling points and 18 consumers were interviewed using a semi-structured questionnaire. Sixty raw milk samples were used for physicochemical and microbiological analysis. Random sampling method was used to collect samples from producers and purposive sampling method was used to collect samples from other sampling sources. The overall mean values for temperature, pH, specific gravity and titratable acidity of marketed milk in the study area were 24.07°C, 6.32, 1.03, and 0.20, respectively, while the overall mean value of fat, protein, total solids, solids-not-fat, and lactose contents were 4.50, 3.24, 12.78, 8.28, and 4.27%, respectively. Significant differences (P<0.05) were found between the sources of milk samples on all measured parameters of chemical composition except fat content. The overall mean total bacterial, coliform, and yeast and mould counts were 5.48, 4.96 and 4.90 log cfu/ml, respectively. In conclusion, the result of this study indicated that milk samples collected from all sampling points were subjected to microbial contamination and did not meet quality standards set by Quality Standard Authority of Ethiopia. It is, therefore, recommended that awareness should be created among stakeholders involved in milk production and handling practices on method of quality milk production and marketing in the study areas. Key words: Raw milk, milk value chain, physicochemical properties, microbial quality. INTRODUCTION Cattle are the main source of milk (95%) in Ethiopia (CSA, 2010). It is also an economically important farm commodity and investment option for smallholder farmers in the country (Zelalem et al., 2011). However, the Ethiopian per capital milk consumption was much lower (17 kg) compared to that of African average which was about 62.5 kg recommended as a minimum level to satisfy the need for a balanced diet and the world’s per capital average which was about 100 L/year (FAO, 2010). In Ethiopia, the milk marketing system is not well developed and for the majority of smallholder producers, access to market is limited. In year 2010, for instance, only less than 7% of the annual milk production was estimated to be marketed at national level. In 2009, there were 180 cooperatives involved in milk production and marketing in the entire nation, accounting for only 2% of *Corresponding author. E-mail: [email protected]. Author(s) agree that this article remain permanently open access under the terms of the Creative Commons Attribution License 4.0 International License
Transcript of Milk production, marketing practices and qualities along ...
Vol. 14(35), pp. 1990-2005, December, 2019
DOI: 10.5897/AJAR2019.14087
Article Number: 74DB1A562458
ISSN: 1991-637X
Copyright ©2019
Author(s) retain the copyright of this article
http://www.academicjournals.org/AJAR
African Journal of Agricultural
Research
Full Length Research Paper
Milk production, marketing practices and qualities along milk supply chains of Haramaya District, Ethiopia
Mitiku Eshetu*, Mekdes Seyoum and Yesihak Yusuf Mummed
School of Animal and Range Sciences, Haramaya University, P. O. Box 138, Dire Dawa, Ethiopia.
Received 7 April, 2019; Accepted 4 October, 2019
A study was conducted with the aim of evaluating the physicochemical properties and microbial qualities of raw cow’s milk along the milk supply chain in Haramaya district. A total of 123 smallholder dairy producers, one dairy cooperative, 3 milk collectors, 6 milk retailers, 8 selling points and 18 consumers were interviewed using a semi-structured questionnaire. Sixty raw milk samples were used for physicochemical and microbiological analysis. Random sampling method was used to collect samples from producers and purposive sampling method was used to collect samples from other sampling sources. The overall mean values for temperature, pH, specific gravity and titratable acidity of marketed milk in the study area were 24.07°C, 6.32, 1.03, and 0.20, respectively, while the overall mean value of fat, protein, total solids, solids-not-fat, and lactose contents were 4.50, 3.24, 12.78, 8.28, and 4.27%, respectively. Significant differences (P<0.05) were found between the sources of milk samples on all measured parameters of chemical composition except fat content. The overall mean total bacterial, coliform, and yeast and mould counts were 5.48, 4.96 and 4.90 log cfu/ml, respectively. In conclusion, the result of this study indicated that milk samples collected from all sampling points were subjected to microbial contamination and did not meet quality standards set by Quality Standard Authority of Ethiopia. It is, therefore, recommended that awareness should be created among stakeholders involved in milk production and handling practices on method of quality milk production and marketing in the study areas. Key words: Raw milk, milk value chain, physicochemical properties, microbial quality.
INTRODUCTION Cattle are the main source of milk (95%) in Ethiopia (CSA, 2010). It is also an economically important farm commodity and investment option for smallholder farmers in the country (Zelalem et al., 2011). However, the Ethiopian per capital milk consumption was much lower (17 kg) compared to that of African average which was about 62.5 kg recommended as a minimum level to satisfy the need for a balanced diet and the world’s per
capital average which was about 100 L/year (FAO, 2010). In Ethiopia, the milk marketing system is not well
developed and for the majority of smallholder producers, access to market is limited. In year 2010, for instance, only less than 7% of the annual milk production was estimated to be marketed at national level. In 2009, there were 180 cooperatives involved in milk production and marketing in the entire nation, accounting for only 2% of
*Corresponding author. E-mail: [email protected].
Author(s) agree that this article remain permanently open access under the terms of the Creative Commons Attribution
License 4.0 International License

agriculture based cooperatives. These small proportions of existing dairy cooperatives were operating in areas that are accessible to transportation and market. This has resulted in the inability of substantial amount of milk to rarely reached the market in demand of the commodity (Zelalem, 2012).
In addition to low level of milk production, post-harvest handling of the product contributed to significant loss along the value chain. The quality of milk was compromised by not only milk producers but also by milk collectors and transporters, vendors and consumers across the supply chain (Mattias, 2013). Unhygienic conditions of milking, unclean conditions of handling equipment and the use of contaminated cleaning water were reported among the important sources of milk contamination (Zelalem, 2012).
Milk is a complex biological fluid and by its nature, a good growth medium for many microorganisms. It contains almost all nutrients required for the growth of newborn; and protein, fat, and lactose are the major component of milk. Because of its physicochemical properties, it needs strict hygienic condition to avoid contamination of milk with microorganisms. Therefore, examination of physicochemical properties and microbial load is a major factor in determining milk quality.
A research report at Harar Milk Shed in Eastern Ethiopia revealed that the physicochemical and microbiological properties of raw cow milk samples collected from various supply chain actors were not significantly different (Estifanos et al., 2015). But there is scanty information on the physical properties, chemical composition and microbial load of raw milk along the milk chain in the study areas. This research was therefore conducted to evaluate handling practices, physicochemical properties, and microbial qualities of milk along the market supply chain in Haramaya district, Eastern Ethiopia. MATERIALS AND METHODS
Description of the study area Haramaya district is located at 510 km east of Addis Ababa along the main road to Harar town. The altitude of the district ranges from 1400 to 2340 m above sea level. The area is located at 41°59'58"N latitude and 09°24'10" E longitude. The mean annual rainfall is 492 mm ranging from 118 to 866 mm. The district has mean annual temperature and relative humidity of 18°C and 68%, respectively. The district has two ecological zones of which 66.6% mid land and 33.3% low land (CSA, 2009).
Sampling techniques and data collection
The study has two parts, that is, field survey and laboratory analysis. The field survey was conducted to assess milk production and handling practices. For the survey part, 3 kebeles (Beftu Geda, Ifa Oromia, and Tuji Gebisa) were purposively selected from Haramaya District based on size of cattle population and availability of dairy cooperative. The required sample number of farmers was
Eshetu et al. 1991 determined based on the formula suggested by Yamane (1967). Accordingly, 123 sample farmers were randomly selected from selected kebeles of Haramaya District having lactating cow on proportionality basis at 95% confidence level with degree of variability of 0.05 level of precision which was recommended to obtain a sample size, required to represent a true population. The total number of farmers having lactating cow was 178.
where n=sample size, N=population size and e=level of precision.
Milk samples were collected from a subset of farmers and purposively selected milk supply chain actors that include milk cooperative, milk collectors, retailers, selling points (who sold boiled milk) and consumers in the district. Laboratory work Milk samples were collected for the determination of the physical properties, chemical composition and microbial qualities. A total of 60 milk samples were collected for laboratory analysis directly from sample farmers, dairy cooperative (pooled milk), milk collectors, retailers, selling points and consumers. The sampling was done from the different sampling source (milk market chain actors) proportionally based on survey results (Table 1 and Figure 1).
A semi-structured questionnaire was developed, pre-tested and used to collect the required information from sample farmers. The questionnaires were administered through face to face conversation with sample farmers who had lactating animals during the time of data collection. While administering the questionnaires, the general cleanliness and hygienic practices of milk production and handling was also noted through personal observation. Interviews were conducted at the farm site and/or female and male headed household were involved. From smallholder producers the assessment focused on the hygienic handling practices during milk production such as barn type and cleaning practices, source of water used for milk utensils cleaning purpose, milker hygiene and milk utensils, type of container used for milk storage, transportation and marketing. Questionnaires survey was also used for data collection from cooperative, milk collectors and retailers, selling points and consumers.
The physical, major chemical composition and microbial load of the raw milk were analyzed at Plant Pathology and Dairy Technology Laboratory of Haramaya University. About 250 ml of raw milk samples were collected in a sterilize glass bottles. Samples were labeled and put in an icebox maintained at 4°C to limit microbial multiplication and transported to the laboratory and transferred into a refrigerator adjusted at a temperature of 4°C. Then, the milk samples were analyzed for microbial qualities within 24 h of sampling as described by APHA (1992). Samples from the farmers were collected during early morning. Milk samples from cooperative were collected at midday and samples from the milk collectors, retailers, and selling points were collected in the afternoon as milk reached the market. Samples from consumers were collected during morning until evening.
Physicochemical and microbial analysis Physical quality of raw milk The temperature of milk samples was determined at the collection point using thermometer while the pH of the milk samples was determined in the laboratory using a digital pH meter based on the procedure described by O’Connor (1995). To determine specific
1992 Afr. J. Agric. Res.
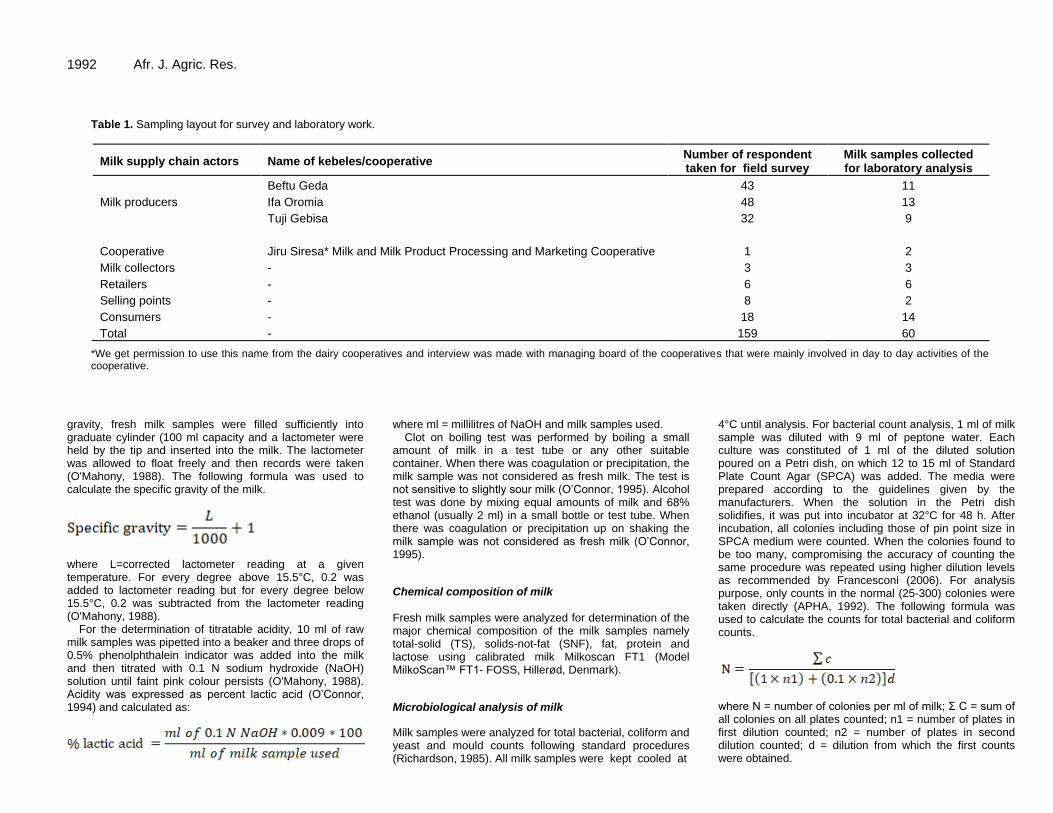
Table 1. Sampling layout for survey and laboratory work.
Milk supply chain actors Name of kebeles/cooperative Number of respondent taken for field survey
Milk samples collected for laboratory analysis
Milk producers
Beftu Geda 43 11
Ifa Oromia 48 13
Tuji Gebisa 32 9
Cooperative Jiru Siresa* Milk and Milk Product Processing and Marketing Cooperative 1 2
Milk collectors - 3 3
Retailers - 6 6
Selling points - 8 2
Consumers - 18 14
Total - 159 60
*We get permission to use this name from the dairy cooperatives and interview was made with managing board of the cooperatives that were mainly involved in day to day activities of the cooperative.
gravity, fresh milk samples were filled sufficiently into graduate cylinder (100 ml capacity and a lactometer were held by the tip and inserted into the milk. The lactometer was allowed to float freely and then records were taken (O'Mahony, 1988). The following formula was used to calculate the specific gravity of the milk.
where L=corrected lactometer reading at a given temperature. For every degree above 15.5°C, 0.2 was added to lactometer reading but for every degree below 15.5°C, 0.2 was subtracted from the lactometer reading (O'Mahony, 1988).
For the determination of titratable acidity, 10 ml of raw milk samples was pipetted into a beaker and three drops of 0.5% phenolphthalein indicator was added into the milk and then titrated with 0.1 N sodium hydroxide (NaOH) solution until faint pink colour persists (O'Mahony, 1988). Acidity was expressed as percent lactic acid (O’Connor, 1994) and calculated as:
where ml = millilitres of NaOH and milk samples used. Clot on boiling test was performed by boiling a small
amount of milk in a test tube or any other suitable container. When there was coagulation or precipitation, the milk sample was not considered as fresh milk. The test is not sensitive to slightly sour milk (O’Connor, 1995). Alcohol test was done by mixing equal amounts of milk and 68% ethanol (usually 2 ml) in a small bottle or test tube. When there was coagulation or precipitation up on shaking the milk sample was not considered as fresh milk (O’Connor, 1995).
Chemical composition of milk Fresh milk samples were analyzed for determination of the major chemical composition of the milk samples namely total-solid (TS), solids-not-fat (SNF), fat, protein and lactose using calibrated milk Milkoscan FT1 (Model MilkoScan™ FT1- FOSS, Hillerød, Denmark).
Microbiological analysis of milk
Milk samples were analyzed for total bacterial, coliform and yeast and mould counts following standard procedures (Richardson, 1985). All milk samples were kept cooled at
4°C until analysis. For bacterial count analysis, 1 ml of milk sample was diluted with 9 ml of peptone water. Each culture was constituted of 1 ml of the diluted solution poured on a Petri dish, on which 12 to 15 ml of Standard Plate Count Agar (SPCA) was added. The media were prepared according to the guidelines given by the manufacturers. When the solution in the Petri dish solidifies, it was put into incubator at 32°C for 48 h. After incubation, all colonies including those of pin point size in SPCA medium were counted. When the colonies found to be too many, compromising the accuracy of counting the same procedure was repeated using higher dilution levels as recommended by Francesconi (2006). For analysis purpose, only counts in the normal (25-300) colonies were taken directly (APHA, 1992). The following formula was used to calculate the counts for total bacterial and coliform counts.
where N = number of colonies per ml of milk; Σ C = sum of all colonies on all plates counted; n1 = number of plates in first dilution counted; n2 = number of plates in second dilution counted; d = dilution from which the first counts were obtained.

Eshetu et al. 1993
Figure 1. Sampling layout for laboratory work in each channel (numbers in parenthesis are number of milk samples).
For coliform count, 1 ml samples of milk were serially diluted with 9 ml of peptone water following similar methods as for total bacterial count but dilutions were surface plated on Violet Red Bile Agar and incubated at 32°C for 24 h, after which typical coliform colonies were counted. Purplish red colonies in VRBA medium were counted under colony counter less than 100 coliform colonies were recorded. For colonies beyond this count, the next dilutions were plated. For yeast and mould count, 1 ml milk samples were serially diluted with 9 ml of peptone water following similar methods as for total bacterial count but dilutions were surface plated on Potato Dextrose Agar (PDA) (Oxoid, Pvt. Ltd. MU 096: UK). The dried plates were then incubated at 25°C for 3 to 5 days. Colonies with a blue green color was counted as yeasts and moulds (Yousef and Carlstrom, 2003).
Statistical analysis
Survey data were analyzed using descriptive statistics such as means, frequency distribution and percentage using SPSS version 20.0 Software (SPSS, 2007). Microbiological counts were first transformed into logarithmic value (log10 cfu ml
-1) to get normally
distributed data. Data on the physicochemical quality and log 10
transformed microbial counts were analyzing using General Linear Model (GLM) procedure of SAS (SAS, 2003). Mean comparison was done using the Duncan Multiple Range test for variables that the F-values showed significant difference at 5% significance level.
The statistical model used was:
Yij =μ+ Mi + εi.
where Yij= dependent variable which was milk quality parameters (microbiological qualities and physic-chemical qualities), μ=overall mean, Mi= milk sources (producers, cooperative, milk collectors, retailers, selling points and consumers), and εi= error term.
RESULTS AND DISCUSION
Household characteristics
Household characteristics of respondents in the study area are shown in Table 2. Most respondents in the present study were male (92.7%) as they were head of the family. The respondents in the study area had
1994 Afr. J. Agric. Res.
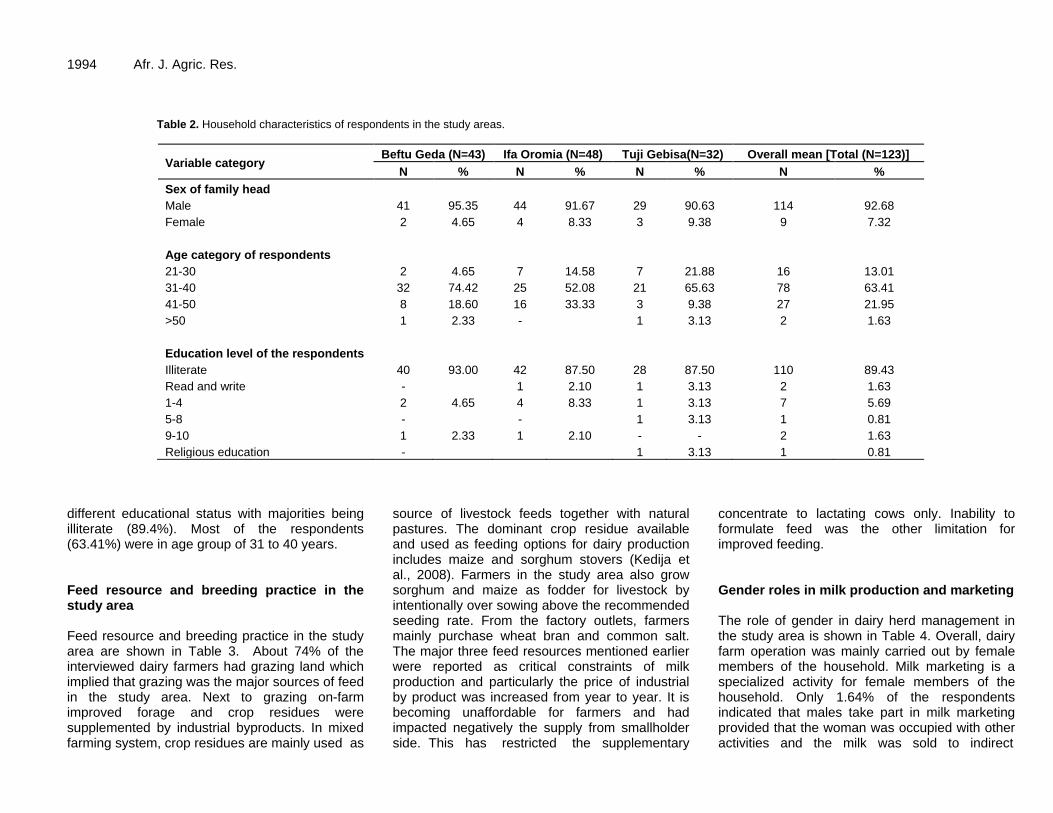
Table 2. Household characteristics of respondents in the study areas.
Variable category Beftu Geda (N=43) Ifa Oromia (N=48) Tuji Gebisa(N=32) Overall mean [Total (N=123)]
N % N % N % N %
Sex of family head
Male 41 95.35 44 91.67 29 90.63 114 92.68
Female 2 4.65 4 8.33 3 9.38 9 7.32
Age category of respondents
21-30 2 4.65 7 14.58 7 21.88 16 13.01
31-40 32 74.42 25 52.08 21 65.63 78 63.41
41-50 8 18.60 16 33.33 3 9.38 27 21.95
>50 1 2.33 -
1 3.13 2 1.63
Education level of the respondents
Illiterate 40 93.00 42 87.50 28 87.50 110 89.43
Read and write -
1 2.10 1 3.13 2 1.63
1-4 2 4.65 4 8.33 1 3.13 7 5.69
5-8 -
-
1 3.13 1 0.81
9-10 1 2.33 1 2.10 - - 2 1.63
Religious education -
1 3.13 1 0.81
different educational status with majorities being illiterate (89.4%). Most of the respondents (63.41%) were in age group of 31 to 40 years. Feed resource and breeding practice in the study area Feed resource and breeding practice in the study area are shown in Table 3. About 74% of the interviewed dairy farmers had grazing land which implied that grazing was the major sources of feed in the study area. Next to grazing on-farm improved forage and crop residues were supplemented by industrial byproducts. In mixed farming system, crop residues are mainly used as
source of livestock feeds together with natural pastures. The dominant crop residue available and used as feeding options for dairy production includes maize and sorghum stovers (Kedija et al., 2008). Farmers in the study area also grow sorghum and maize as fodder for livestock by intentionally over sowing above the recommended seeding rate. From the factory outlets, farmers mainly purchase wheat bran and common salt. The major three feed resources mentioned earlier were reported as critical constraints of milk production and particularly the price of industrial by product was increased from year to year. It is becoming unaffordable for farmers and had impacted negatively the supply from smallholder side. This has restricted the supplementary
concentrate to lactating cows only. Inability to formulate feed was the other limitation for improved feeding. Gender roles in milk production and marketing The role of gender in dairy herd management in the study area is shown in Table 4. Overall, dairy farm operation was mainly carried out by female members of the household. Milk marketing is a specialized activity for female members of the household. Only 1.64% of the respondents indicated that males take part in milk marketing provided that the woman was occupied with other activities and the milk was sold to indirect
Eshetu et al. 1995 Table 3. Feed resource and breeding practice in the study area.
Variable category Beftu Geda (N=43) Ifa Oromia (N=48) Tuji Gebisa (N=32) Overall mean [Total (N=123)]
N % N % N % N %
Feed regularly used
Grazing 39 90.70 37 77.08 15 46.88 91 73.98
Did not have grazing land 4 9.30 11 22.92 17 53.13 32 26.02
Breeding
Natural 34 79.10 36 75.00 21 65.60 91 74.00
AI 1 2.30 8 16.70 7 21.90 16 13.00
Both Natural and AI 8 18.60 4 8.30 4 12.50 16 13.00
Table 4. The role of gender in dairy farm operation and herd management in the study area.
Activity
Household member
Total HH Female Male Both
No. % No. % No. %
Dairy farm operations
Milking cows 123 123 100.00 0 0.00 0 0.00
Cleaning of milk containers 123 123 100.00 0 0.00 0 0.00
Barn cleaning 123 123 100.00 0 0.00 0 0.00
Milk marketing 122 120 98.36 0 0.00 2 1.64
Herd management
Feeding of dairy animals 123 29 23.60 63 51.20 31 25.20
Health management 123 46 37.40 43 35.00 34 27.60
Live animal marketing 123 30 24.40 48 39.00 45 36.60
Buying dairy inputs 123 43 35.00 38 30.90 42 34.10
marketing channels. Sintayehu et al. (2008) indicated that in 60% of the cases housewives and/or other female household members were involved in milking operations in urban dairy production system of Shashemene and Dilla areas. Zewdie et al. (2016) also reported that milk marketing is a specialized activity for female members of the household in Fafem Zone, Ethiopian Somali Regional State. Regarding to herd management such as feeding of dairy animals, health management, live animal marketing and buying dairy inputs both male and female members were responsible. This indicated that the contribution of women in dairy production was important and promoting the women in the dairying practices and marketing can enhance productivity, effectiveness and efficiency of the sector. Milk production The overall average amount of milk produced by local cow breeds was 2.23 L/day. About 2.4% of the participants have three milking cows, 30.9% own two milking cows, and 66.7% own only one milking cow per
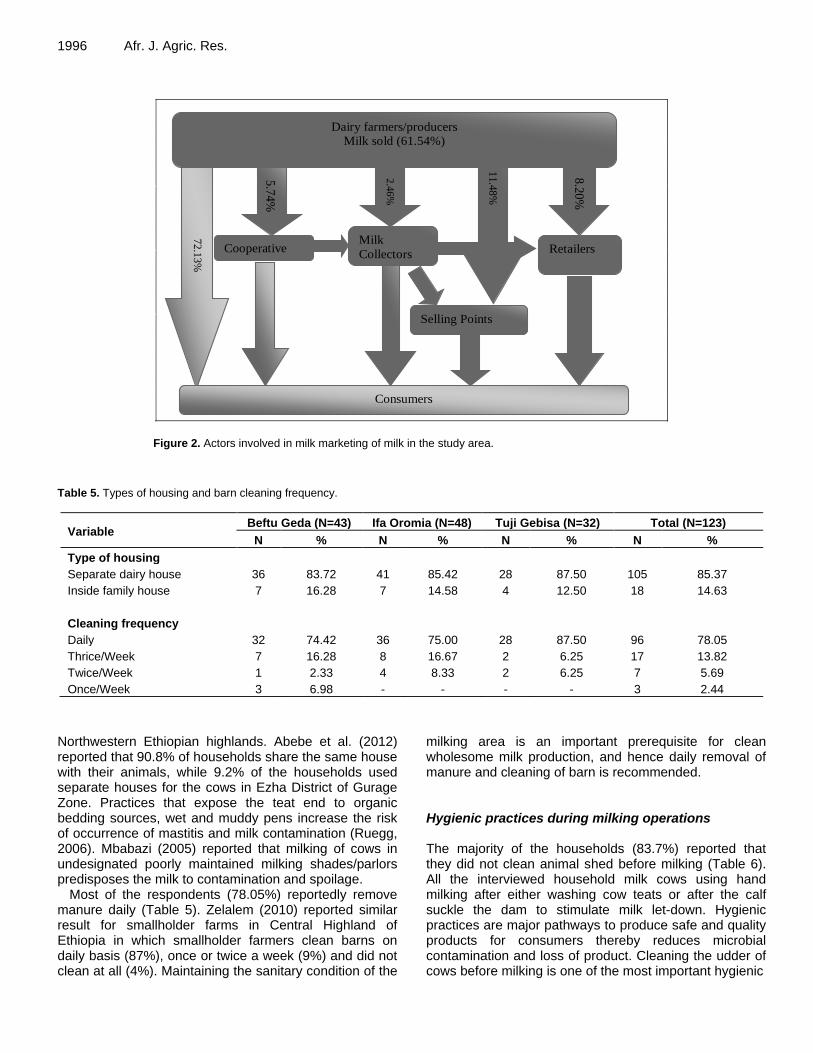
household. As indicated in Figure 2, most of the milk produced (61.54%) was marketed and about 38.11% was retained for home consumption and only 0.35% milk was processed into other dairy products like Ergo. Most (72.13%) of the milk was sold directly to the consumers and the remaining 2.46% to milk collectors, 5.74% to cooperative, 8.2% to retailers and 11.48% to selling points. The marketing system of milk in the Haramaya District can generally be characterized as informal type. Hygienic quality of milk during productions Housing system and barn cleaning About 85.37% of the respondents keep their cattle in separate barns from family house and 14.63% keep inside family house (Table 5). As observed during the field visit, all barns (100%) were not constructed to facilitate drainage of the farm wastes, which leads to soiling of dairy cows and contamination of milk. All respondents do not use bedding materials for the animals. Yitaye et al. (2009) reported a similar case for farms in
1996 Afr. J. Agric. Res.
11
.48
%
2.4
6%
5.7
4%
Cooperative
Dairy farmers/producers
Milk sold (61.54%)
72
.13
%
8.2
0%
Retailers
Consumers
Selling Points
Milk
Collectors
Figure 2. Actors involved in milk marketing of milk in the study area.
Table 5. Types of housing and barn cleaning frequency.
Variable Beftu Geda (N=43) Ifa Oromia (N=48) Tuji Gebisa (N=32) Total (N=123)
N % N % N % N %
Type of housing
Separate dairy house 36 83.72 41 85.42 28 87.50 105 85.37
Inside family house 7 16.28 7 14.58 4 12.50 18 14.63
Cleaning frequency
Daily 32 74.42 36 75.00 28 87.50 96 78.05
Thrice/Week 7 16.28 8 16.67 2 6.25 17 13.82
Twice/Week 1 2.33 4 8.33 2 6.25 7 5.69
Once/Week 3 6.98 - - - - 3 2.44
Northwestern Ethiopian highlands. Abebe et al. (2012) reported that 90.8% of households share the same house with their animals, while 9.2% of the households used separate houses for the cows in Ezha District of Gurage Zone. Practices that expose the teat end to organic bedding sources, wet and muddy pens increase the risk of occurrence of mastitis and milk contamination (Ruegg, 2006). Mbabazi (2005) reported that milking of cows in undesignated poorly maintained milking shades/parlors predisposes the milk to contamination and spoilage.
Most of the respondents (78.05%) reportedly remove manure daily (Table 5). Zelalem (2010) reported similar result for smallholder farms in Central Highland of Ethiopia in which smallholder farmers clean barns on daily basis (87%), once or twice a week (9%) and did not clean at all (4%). Maintaining the sanitary condition of the
milking area is an important prerequisite for clean wholesome milk production, and hence daily removal of manure and cleaning of barn is recommended. Hygienic practices during milking operations The majority of the households (83.7%) reported that they did not clean animal shed before milking (Table 6). All the interviewed household milk cows using hand milking after either washing cow teats or after the calf suckle the dam to stimulate milk let-down. Hygienic practices are major pathways to produce safe and quality products for consumers thereby reduces microbial contamination and loss of product. Cleaning the udder of cows before milking is one of the most important hygienic

Eshetu et al. 1997 Table 6. General hygienic practices during milking operations in the study area.
Variable Beftu Geda (N=43) Ifa Oromia (N=48) Tuji Gebisa (N=32) Total (N=123)
N % N % N % N %
Clean animal shed before milking
Yes 7 16.30 6 12.50 7 21.90 20 16.30
No 36 83.70 42 87.50 25 78.10 103 83.70
Hand washing
Wash hands before milking 40 93.02 45 93.75 31 96.88 116 94.31
No washing 3 6.98 3 6.25 1 3.13 7 5.69
Wash cow's teats before milking
Warm water 7 16.28 11 22.92 1 3.13 19 15.45
Cold water 24 55.81 26 54.17 22 68.75 72 58.54
Both cold and warm water 3 6.98 2 4.17 1 3.13 6 4.88
No washing 9 20.93 9 18.75 8 25.00 26 21.14
Towel used for udder drying
Common towel 2 4.70 1 2.10 1 3.10 4 3.25
No drying 41 95.30 47 97.90 31 96.90 119 96.75
practices required to ensure clean milk production. This is important since the udder of milking cows could have direct contact with the ground, urine, dung and feed refusals (Zelalem, 2010). Improper milking practices can predispose milk to contamination for instance milking can be done following calf suckling without cleaning the teats and same reports indicated that saliva from the calf mouth and unwashed teats increases bacterial counts of milk (Kurwijila, 1989).
Majority of respondent milk producers (94.31%) reported to wash their hands before milking in the study areas (Table 6) and the proportion was higher in Tuji Gebisa than that of Beftu Geda and Ifa Oromia. Similarly, Tadele et al. (2016) reported that in Eastern Hararghe, milk producers wash their hands before milking. However, none of them use warm water and detergent for hand washing but use cold water without detergent. Washing hands with cold water without detergent is not sufficient to remove germs and can serve as a major source of microbial contamination of milk. Therefore, milk handlers should always wash their hands with warm water and detergent, and then dry it properly with proper towels before start of milking, milk handling or preparation (Zelalem, 2012). Hand washing (especially in the developing countries) between milking, during, pre and post milking stages using safe disinfectants can reduce bacterial load and enhance production of safe fresh milk (Oliver et al., 2005). The milker can be an important source of milk contamination. In addition to keep good personal hygiene, milkers should be in good health during milking operation (Zelalem, 2010).
The use of individual towel and following essential cleaning practices during milking is important for the
production of quality milk (Zelalem, 2010). However, about 96.75% of the households reported that they did not use towels for udder drying before milking but massage the udder with hand to stimulate milk let down, and only 3.25% of the respondents use common towel for udder drying. Milking in dry condition significantly reduces bacterial count. This is because there is no surplus water remains on the surface of the udder to drip into the milk and less chance of contamination by dirt and bacteria from udder, teats and hands into milk (Islam et al., 2009). In Ethiopia, there is no standard hygienic condition followed by producers during milk production. The hygienic conditions are different according to the production system, adapted practices, level of awareness, and availability of resources (Zelalem, 2003). Milk equipment and sanitary practices One of the major factors affecting the quality of dairy products is milking utensils. The interviewed milk producer households reported to mainly use traditional gourd vessels (67.48%) and plastic jerry can (28.45%) (Table 7). For transport purposes, traditional gourd vessels are dominantly used (59.02%) followed by plastic jerry cans (40.98%) at producer level. All sample milk collectors and selling points as well as 83.3% of retailer’s reported to uses plastic jerry cans for milk collection and storage (Table 8). In general, plastic jerry cans were the dominant type of containers used for milk marketing and storage; while traditional gourd vessels are mainly used for milking. Such utensils can contribute for the rapid spoilage of milk, as plastic jerry cans cannot be cleaned

1998 Afr. J. Agric. Res.
Table 7. Milk equipment used for milking, transportation and sanitary practices in the study areas.
Variable Biftu Geda Ifa Oromia Tuji Gebisa Total
N=43 % N=48 % N=32 % N=123 %
Milk utensils used for milking
Traditional Gourd vessel 27 62.80 38 79.17 18 56.25 83 67.48
Aluminum vessel 4 9.30 1 2.08 0 0.00 5 4.07
Plastic jerry can 12 27.90 9 18.75 14 43.75 35 28.45
Cleaning frequency of milk utensils
Before every use 2 4.65 1 2.08 3 9.38 6 4.88
After every use 29 67.44 38 79.17 24 75.00 91 73.98
Before and after every use 12 27.91 9 18.75 5 15.63 26 21.14
Transportation N=42 % N=48 % N=32 % N=122 %
Traditional Gourd vessel 26 61.90 28 58.33 18 56.25 72 59.02
Plastic jerry-can 16 38.10 20 41.67 14 43.75 50 40.98
properly, due to their shape and narrow opening. This is in line with the findings of Yitaye et al. (2009), Teklemichael et al. (2015b) and Tadele et al. (2016) who reported that 83% of the surveyed urban dairy farms in Bahir Dar and Gondar, 75% of the surveyed farms in Dire Dawa Town and 87.5 to 97.5% milk producers, all milk collectors and transporters as well as vendors in Eastern Ethiopia were using plastic containers, respectively. The left-over of milk and other dirt particles within the container may result in contamination of the subsequent milk. Omore et al. (2005) also reported that lack of formal training and use of plastic containers are the main factors that contribute to the poor quality of raw milk sold by producers and informal milk traders. Since proper metal milk containers are expensive, milk producers use plastic containers which are difficult to clean and disinfect and thus it might contribute to poor quality of the milk. Non-food grade plastic cans, buckets and jerry cans are not appropriate thus must not be used for milk storage and transportation (Kurwijila, 2006). Aluminium containers are recommended because they do not have adhesive properties and therefore easy to clean as compared to plastic containers.
In the present study, the majority of the respondent in the study areas washed milk utensils after every use (Table 8). Moreover, all milk producers reported to smoke milk utensils. Smoking is done by using wood splinters of ‘Ejersa’ (Olea africana). They assume that smoking is used to develop desirable flavor in the milk. In addition, smoking has anti-microbial activity and thus inhibits growth of microorganisms in milk (Mogessie and Fekadu, 1993). Source of water for cleaning The sample dairy cooperative, selling points (cafeteria
and restaurants) and 66.7% milk collectors and 33.3% retailers reported to use tap water (Table 9). About 99.2% of the farmers and 22.2% of consumers reported the use of hand dung well water for cleaning. All of the respondents that reported to use water from non-tap sources were neither boil nor filter it before use. For production of quality milk, a good supply of clean water is essential. Water used for washing and rinsing milk equipment and milk containers should be of the same in safety and purity as drinking water (Younan et al., 2007). Jay (1992) also reported that water obtained from different sources such as wells, rivers and springs can easily be contaminated by human and animal organic wastes gaining entry by drainage. Milk transportation and storage condition All the respondent small-scale milk producers did not use cooling systems while storing milk before selling (Table 9). The sample dairy cooperative, 66.7% of milk collectors, and 75% of selling points kept milk in a refrigerator; while the rest stored at room temperature. Due to the absence of appropriate cooling systems at small-scale milk producer’s level, milk is transported at ambient temperatures to selling points. FAO (2007) recommended that milk should be cooled below 4°C or processed and conserved well immediately after milking or processing. Therefore, it would be beneficial to have an access to cooling facilities for retarding bacterial growth in raw milk during collection and transportation to selling points. Milk marketing
The sale of fresh whole milk is the common practice in

Eshetu et al. 1999
Table 8. Milk equipment and sanitary practices for traders and consumers.
Variable cooperative (n= 1) Milk collectors (n=3) Retails (n=6) Selling points (n=8) Consumers (n=18)
% % % % %
Types of containers used for milk collection, transportation and storage
Traditional Gourd vessel - - 16.70 - -
Plastic jerry can - 100.00 83.30 100.00 -
Aluminum vessel - - - - 38.90
Plastic jerry-can and aluminum vessel 100.00 - - -
Plastic water bottle - - - - 33.30
Plastic bag - - - - 27.80
Methods of cleaning milk containers
Before every use - - - - 22.20
After every use 100.00 66.70 66.70 75.00 44.40
Before and after every use - 33.30 33.30 25.00 33.40
Table 9. Water sources for cleaning and transportation condition at different actors in the supply chain.
Variable Producers (%) Cooperative (%) Milk collectors (%) Retailer (%) Selling points (%) Consumers (%)
Water source for cleaning purpose N=123 N=1 N=3 N=6 N=8 N=18
Tap water - 100.00 66.70 33.30 100.00 77.80
Hand dung well 99.20 - 33.30 66.70 - 22.20
Lake water 0.80 - - - - -
Storage condition
At room temperature 100.00 - 33.30 100.00 25.00 77.80
Use of refrigerator - 100.00 66.70 - 75.00 22.20
the study areas. Marketing system of milk is unorganized informal and is carried out through direct sellers (milk passes directly from the producer to the consumer) and indirect marketing channels where several agents operate between producers and consumers. The channel actors in marketing of milk in the study area include producers, milk collectors, retailers, milk
cooperative, selling points (cafe and restaurants) and consumers. There were two different milk outlets identified under direct selling; namely traditional milk association group locally called Faraqa Annanni selling system and individual seller system. Faraqa Annanni is self-organized women groups who have milking cows and produce saleable milk. The number of women that
participate in group ranges from 2 to 10. Members are organized to sell out whole fresh cow milk turn by turn. In the Faraqa Annanni, members contribute an agreed amount of milk on a daily basis and the collected milk is given to one of the member woman to sell out in the nearby market. The woman sells the milk and the daily income generated belongs to her. The cycle continues

2000 Afr. J. Agric. Res.
Figure 3. A generic schematic diagram representing fluid milk market chain at Haramaya district.
until every group member gets her share of the milk income. This system has several advantages. It saves time and labor spent because of daily travel to milk market places, which is mostly to nearby towns such as Bate, Haramaya, Awaday and Dengago. Moreover, it helps the women to save money since they obtain income on a weekly basis.
About 99% of the respondent sample households participate in milk marketing. In similar situation, Amistu et al. (2015) reported that 99% of the respondent sample farmers are involved in whole milk marketing in Holetta, Sebeta and Sululta area of Oromia Special Zone. Fluid milk supply chain A generic schematic diagram representing the fluid milk supply chain in the study areas based on the information gathered during the present assessment is sketched and presented in Figure 3. The main supply chain fractions identified are: input supply, production, marketing (distribution) and consumption. Similarly, the key actors
along the chain include input suppliers, producers, distributor and consumers.
There are various milk marketing channels in the study areas through which smallholder dairy farmers channel their milk to dairy cooperative, milk collectors, retailers, selling points and consumers. About 94.3% of the sample milk producers channel milk through the informal marketing system. Retailers buy milk either from dairy farms or wholesalers/milk collectors. The retailers are involved in milk marketing to restaurants and cafeterias. Most of the dairy farmers in the study area prefer to sell milk through the informal chain where they get high price per liter of milk. In informal markets, sellers need to trade through bilateral bargaining so as to remain anonymous from the taxing authority whereas in formal markets, sellers can publicly advertise their prices and locations. Van der Valk and Abebe (2010) also reported that 98% of the milk produced in rural areas was sold through informal chain in Addis Ababa Ethiopia. Girma and Verschurr (2013) also reported 35% of the sample respondents to sell their milk both thorough the informal and formal channels; 25% of them through formal
Eshetu et al. 2001
Table 10. Results of alcohol and clot on boiling test of milk samples in the study areas.
Milk source N Positive results (%)
Alcohol test (%) Clot-on-boiling test (%)
Producer level 33 12.10 3.00
Cooperative 2 50.00 50.00
Milk collector level 3 33.30 33.30
Retailer level 6 50.00 33.30
selling point 2 50.00 50.00
Consumers 14 64.30 57.10
Total 60 31.70 23.30
Table 11. Physical properties of raw cow milk samples in Haramaya district (Mean ± SD).
Milk source Variable
Temperature (°C) pH Specific gravity Titratable acidity
Producers 26.00±0.83a 6.66±0.26
a 1.031±0.0036
a 0.17±0.059
b
Cooperative 24.50±0.71b 6.17±0.46
ab 1.027±0.0007
b 0.21±0.007
ab
Milk collectors 24.30±0.58b 6.26±0.44
ab 1.026±0.0010
b 0.19±0.055
ab
Retailers 24.00±0.89b 6.06±0.44
ab 1.025±0.0019
b 0.22±0.04
ab
Selling points 21.00±0.00c 6.14±0.54
ab 1.024±0.0014
b 0.24±0.014
ab
Consumers 19.90±0.77c 5.67±0.78
b 1.026±0.0019
b 0.26±0.019
a
abc
Different superscripts in the same column differ significantly (P<0.05).
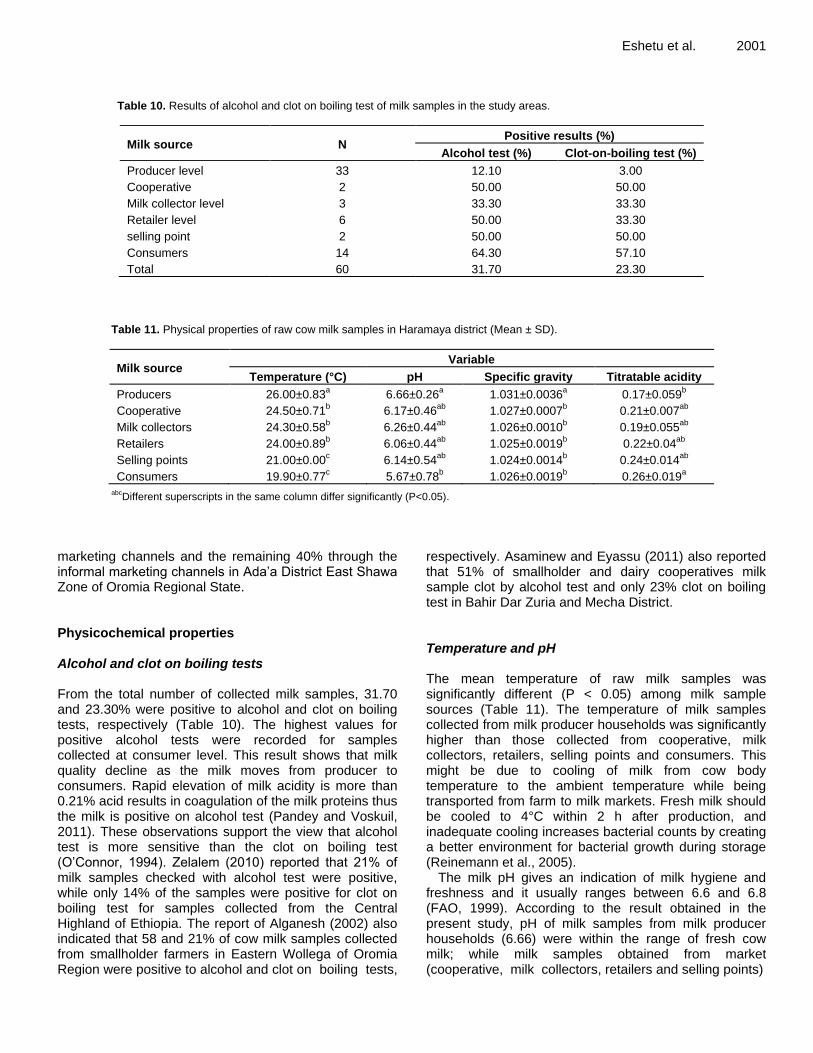
marketing channels and the remaining 40% through the informal marketing channels in Ada’a District East Shawa Zone of Oromia Regional State. Physicochemical properties Alcohol and clot on boiling tests From the total number of collected milk samples, 31.70 and 23.30% were positive to alcohol and clot on boiling tests, respectively (Table 10). The highest values for positive alcohol tests were recorded for samples collected at consumer level. This result shows that milk quality decline as the milk moves from producer to consumers. Rapid elevation of milk acidity is more than 0.21% acid results in coagulation of the milk proteins thus the milk is positive on alcohol test (Pandey and Voskuil, 2011). These observations support the view that alcohol test is more sensitive than the clot on boiling test (O’Connor, 1994). Zelalem (2010) reported that 21% of milk samples checked with alcohol test were positive, while only 14% of the samples were positive for clot on boiling test for samples collected from the Central Highland of Ethiopia. The report of Alganesh (2002) also indicated that 58 and 21% of cow milk samples collected from smallholder farmers in Eastern Wollega of Oromia Region were positive to alcohol and clot on boiling tests,
respectively. Asaminew and Eyassu (2011) also reported that 51% of smallholder and dairy cooperatives milk sample clot by alcohol test and only 23% clot on boiling test in Bahir Dar Zuria and Mecha District. Temperature and pH The mean temperature of raw milk samples was significantly different (P < 0.05) among milk sample sources (Table 11). The temperature of milk samples collected from milk producer households was significantly higher than those collected from cooperative, milk collectors, retailers, selling points and consumers. This might be due to cooling of milk from cow body temperature to the ambient temperature while being transported from farm to milk markets. Fresh milk should be cooled to 4°C within 2 h after production, and inadequate cooling increases bacterial counts by creating a better environment for bacterial growth during storage (Reinemann et al., 2005).
The milk pH gives an indication of milk hygiene and freshness and it usually ranges between 6.6 and 6.8 (FAO, 1999). According to the result obtained in the present study, pH of milk samples from milk producer households (6.66) were within the range of fresh cow milk; while milk samples obtained from market (cooperative, milk collectors, retailers and selling points)

2002 Afr. J. Agric. Res. Table 12. Chemical composition of raw cow milk along the milk supply chain (Mean ± SD).
Chemical quality parameter
Mean value of chemical quality along milk value chain actors
Producers Cooperative Milk collectors Retailers Selling points consumers
Fat 4.60±0.74a
3.59±0.05b
3.88±0.50b
4.45±0.78a
4.31±0.53a
4.59±0.70a
Protein 3.31±0.41a 2.40±0.08
b 2.84±0.14
ab 3.27±0.42
a 3.25±0.08
a 3.30±0.24
a
SNF 8.50±0.54a 7.69±0.39
abc 7.48±0.46
bc 8.28±0.46
ab 7.11±0.82
c 8.17±0.46
ab
TS 13.10±0.84a 11.27±0.34
b 11.36±0.42
b 12.73±0.47
a 11.43±0.29
b 12.76±0.63
a
Lactose 4.07±0.33bc
4.83±0.16a 4.38±0.53
ab 4.50±0.39
ab 3.79±0.75
c 4.59±0.43
ab
abc
Different superscripts in the same row differ significantly (P<0.05), SNF=Solid not fat, TS=total solid.
were not within the normal ranges. The pH of milk samples collected from consumers was lower than the normal pH value of fresh cow milk and significantly lower (P<0.05) than the pH of milk obtained from producers and other milk market actors in the supply chain. This result indicates that milk is clearly under fermentation resulting from bacterial multiplication during the time that elapsed between production and until it reaches consumers. Teklemichael et al. (2015a) indicated that in Dire Dawa Town the pH of milk samples collected from vendors was lower than milk obtained from dairy farms. The pH values higher than 6.8 indicates mastitic milk and pH values below 6.6 indicates increased acidity of milk due to bacterial multiplication (O’Connor, 1995). Specific gravity The specific gravity of normal milk ranges from 1.027 and 1.035 with an average value of 1.032 at 16°C (FAO, 1999). The mean specific gravity of raw milk samples was 1.031 (Table 11) for household milk producers which fall within this range. The specific gravity of raw milk samples obtained from other sources in a milk supply chain however is lower than that obtained from producers and also below the acceptable limit. These variations might be due to the different sources of milk mixed together that might have been adulterated with water. A similar result was also reported by Teklemichael et al. (2015a) where specific gravity of milk samples collected from vendors was significantly lower (P<0.05) than that obtained from dairy farms in Dire Dawa Town, Eastern Ethiopia. Teshome et al. (2015) however, reported no significant difference in specific gravity among milk samples collected from dairy cooperatives, milk collection centers, hotels, small milk shops and small-scale milk producers in Shashemene Town, Southern Ethiopia. Zelalem (2010) also reported that the specific gravity of most raw whole milk samples collected from Holetta and Selale areas fall within the range 1.028 and 1.032. The specific gravity of milk can be affected by various factors. For instance, the specific gravity of milk decreases by addition of water and addition of cream; while it is increased by removal of fat and reduction of temperature
(O’Connor, 1995). Chemical quality of raw cow’s milk The overall mean value of milk fat (4.5%) in the current study area was higher than that (3.50%) indicated in the Quality Standard Authority of Ethiopian (ES, 2009) for milk produced and marketed in Ethiopia regardless of cow breed (Table 12). The Food and Drug Administration (FDA) and Milk Ordinance and Code of USA recommended that acceptable milk fat contents require not less than 3.25% milk fat for fluid milk (Raff, 2011). In the current study, the fat content of milk was comparable with values reported by earlier findings of Estifanos et al. (2015) for milk collected from Harar Milk Shed in Eastern Ethiopia.
The average protein content of milk as observed in the current study was 3.24%. According to Ethiopian standards (ES, 2009) for protein content of unprocessed whole cow, milk should not be less than 3.20%. Therefore, the average protein content observed from all milk sampling source were within the recommended standard. The result of the present study is also consistent with that reported by Rahel (2008) and Zelalem (2010) for milk samples collected from smallholder farmers in Delbo area of Wollayta Zone and Central Highlands of Ethiopia, respectively.
According to Quality Standards Authority of Ethiopian, total solids content of unpasteurized cow milk should not be less than 12.80% (ES, 2009). The overall mean TS (12.78%) content obtained in the current study almost met this quality standard. The TS content of milk samples collected from cooperatives was significantly (P<0.05) lower than that sampled from other milk sources in the milk supply chain. Estifanos et al. (2015) reported higher (13.1%) TS value for milk samples obtained from Harar Milk Shed, Eastern Ethiopia. The values obtained in the present study are consistent with 12.58% reported by Teklemichael et al. (2015a).
According to Food and Drug Administration (FDA) as well as European Union (EU) quality standards, a minimum solid not fat (SNF) content of whole milk is 8.25% by Raff (2011). In view of that, the result obtained
Eshetu et al. 2003
Table 13. TBC, CC and YMC of raw milk samples collected along milk market chain (Mean ± SD).
Milk source along milk value chain actors TBC CC YMC
Producers 5.17±0.39b 4.64±0.41
b 4.58±0.38
b
Cooperative 5.57±0.73ab
5.08±0.77ab
5.14± 0.97ab
Milk collectors 5.41±0.57b 4.90±0.57
b 4.97±0.47
ab
Retailers 5.59±0.55ab
5.10±0.54ab
4.95±0.52ab
Selling points 5.60±0.71ab
5.13±0.69ab
5.12±0.77ab
Consumers 6.12±0.01a 5.62±0.03
a 5.54±0.14
a
Over all mean 5.48±0.54 4.96± 0.56 4.90±0.55 abc
Superscripts in the same column differ significantly (P<0.05), TBC=Total bacterial count, CC=coliform count, YMC=yeast and mould count.
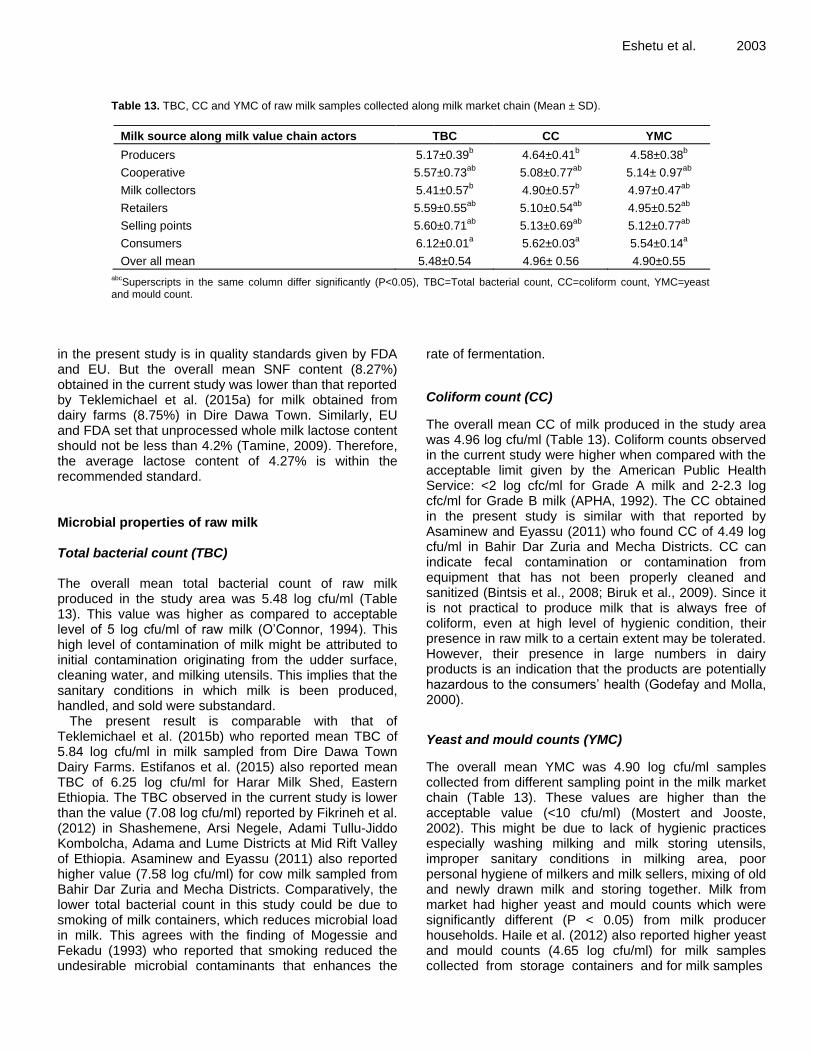
in the present study is in quality standards given by FDA and EU. But the overall mean SNF content (8.27%) obtained in the current study was lower than that reported by Teklemichael et al. (2015a) for milk obtained from dairy farms (8.75%) in Dire Dawa Town. Similarly, EU and FDA set that unprocessed whole milk lactose content should not be less than 4.2% (Tamine, 2009). Therefore, the average lactose content of 4.27% is within the recommended standard. Microbial properties of raw milk Total bacterial count (TBC) The overall mean total bacterial count of raw milk produced in the study area was 5.48 log cfu/ml (Table 13). This value was higher as compared to acceptable level of 5 log cfu/ml of raw milk (O’Connor, 1994). This high level of contamination of milk might be attributed to initial contamination originating from the udder surface, cleaning water, and milking utensils. This implies that the sanitary conditions in which milk is been produced, handled, and sold were substandard.
The present result is comparable with that of Teklemichael et al. (2015b) who reported mean TBC of 5.84 log cfu/ml in milk sampled from Dire Dawa Town Dairy Farms. Estifanos et al. (2015) also reported mean TBC of 6.25 log cfu/ml for Harar Milk Shed, Eastern Ethiopia. The TBC observed in the current study is lower than the value (7.08 log cfu/ml) reported by Fikrineh et al. (2012) in Shashemene, Arsi Negele, Adami Tullu-Jiddo Kombolcha, Adama and Lume Districts at Mid Rift Valley of Ethiopia. Asaminew and Eyassu (2011) also reported higher value (7.58 log cfu/ml) for cow milk sampled from Bahir Dar Zuria and Mecha Districts. Comparatively, the lower total bacterial count in this study could be due to smoking of milk containers, which reduces microbial load in milk. This agrees with the finding of Mogessie and Fekadu (1993) who reported that smoking reduced the undesirable microbial contaminants that enhances the
rate of fermentation.
Coliform count (CC)
The overall mean CC of milk produced in the study area was 4.96 log cfu/ml (Table 13). Coliform counts observed in the current study were higher when compared with the acceptable limit given by the American Public Health Service: <2 log cfc/ml for Grade A milk and 2-2.3 log cfc/ml for Grade B milk (APHA, 1992). The CC obtained in the present study is similar with that reported by Asaminew and Eyassu (2011) who found CC of 4.49 log cfu/ml in Bahir Dar Zuria and Mecha Districts. CC can indicate fecal contamination or contamination from equipment that has not been properly cleaned and sanitized (Bintsis et al., 2008; Biruk et al., 2009). Since it is not practical to produce milk that is always free of coliform, even at high level of hygienic condition, their presence in raw milk to a certain extent may be tolerated. However, their presence in large numbers in dairy products is an indication that the products are potentially hazardous to the consumers’ health (Godefay and Molla, 2000).
Yeast and mould counts (YMC)
The overall mean YMC was 4.90 log cfu/ml samples collected from different sampling point in the milk market chain (Table 13). These values are higher than the acceptable value (<10 cfu/ml) (Mostert and Jooste, 2002). This might be due to lack of hygienic practices especially washing milking and milk storing utensils, improper sanitary conditions in milking area, poor personal hygiene of milkers and milk sellers, mixing of old and newly drawn milk and storing together. Milk from market had higher yeast and mould counts which were significantly different (P < 0.05) from milk producer households. Haile et al. (2012) also reported higher yeast and mould counts (4.65 log cfu/ml) for milk samples collected from storage containers and for milk samples

2004 Afr. J. Agric. Res. collected from distribution containers (7.13 log cfu/ml) in Hawassa, Southern Ethiopia. Conclusions In the study areas, we found that milk marketing was the common practice in which 62% milk produced was marketed and this marketing was mostly done by women that organized into a traditional milk association group called Faraqa Annanni. This group consists of milk producing and selling women of two to ten individuals. This group of women could be an entry point for intervention to improve milk production and marketing in the study areas through organizing and providing necessary technical and financial supports. For example, in rural areas where there is no grid electricity supply solar milk cooling system could be used by Faraqa Annanni to cool milk up until marketing. This will ultimately reduce postharvest milk loss as well as increases income of the milk producing women. It is therefore recommended to encourage and empower Faraqa Annanni group for sustainable development of the dairy sector in the study areas. It is also equally important to create awareness among concerned actors about quality milk production and marketing as the hygienic and microbiological qualities of milk were poor and did not meet national as well international quality standards. RECOMMENDATIONS
From results of the current study, the hygienic status of milk along the milk supply chain was sub-standard and both the physicochemical as well as microbial qualities of raw milk samples were poor. It is, therefore, recommended that farmers should be trained on proper hygienic milk production and handling; ensure implementation of good production and hygiene practices throughout the milk market chain; responsible authorities like Ethiopian Food and Drug Authority must ensure that existing rules and regulations are put into practice for screening of milk; and inspection of milk production facilities with physiochemical and microbiological controls. CONFLICT OF INTERESTS
The authors have not declared any conflict of interests.
ACKNOWLEDGEMENTS The authors would like to acknowledge Swedish International Development Agency (SIDA-SAREC) and Haramaya University for financial, institutional and facility support. Plant Pathology and Dairy Technology Labo-ratories of Haramaya University are also acknowledged
for their cooperation for laboratory analysis. REFERANCES Abebe B, Zelalem Y, Ajebu N (2012). Hygienic and microbial quality of
raw whole cow’s milk produced in Ezha District of the Gurage zone, Southern Ethiopia. Journal of Agricultural Research 1(11):459-465.
Alganesh T (2002). Traditional milk and milk products handling practices and raw milk quality in Eastern Wollega, M.Sc. Thesis, Alemaya University. Dire Dawa, Ethiopia.
Amistu K, Degefa T, Melese A (2015). Assessment of raw milk microbial quality at different critical points of Oromia to Milk Retail Centers in Addis Ababa. Food Science and Quality Management 38:1-9.
APHA (1992). Standard Method for the Examination of Dairy Products. 16
th Edition. APHA, Washington 1992:213-223.
Asaminew T, Eyassu S (2011). Microbial quality of raw cow’s milk collected from farmers and dairy cooperatives in Bahir Dar Zuria and Mecha District, Ethiopia. Agricultural and Biology Journal of North America 2(1):29-33.
Bintsis T, Angelidis AS, Psoni L (2008). Modern Laboratory Practices, Analysis of Dairy Products. In: Advanced Dairy Science and Technology. Britz TJ and Robinson RK (Eds.). Blackwell Publishing Ltd, UK. https://onlinelibrary.wiley.com/doi/book/10.1002/9780470697634
Biruk H, Samson W, Zelalem Y (2009). Microbial Properties of Milk and Traditionally Produced Ethiopian Fermented Milk Products: a review. Proceedings of the 17
th Annual conference of the Ethiopian Society of
Animal Production (ESAP) held in Addis Ababa, Ethiopia pp. 137-148.
Central Statistics Agency (CSA) (2009). Federal Democratic Republic of Ethiopia; Agricultural sample enumeration statistical abstract. https://harvestchoice.org/publications/ethiopia-agricultural-sample-survey-200910-2002-ec-volume-ii-report-livestock-and-lives
Central Statistics Agency (CSA) (2010). Agricultural Sample Survey, Livestock, Poultry and Beehives Population (private peasant holdings). Federal Democratic Republic of Ethiopia Central Statistical Authority (CSA), Addis Ababa, Ethiopia.
Ethiopian Standard (ES) (2009). Ethiopian Standards. Catalogue. Addis Ababa, Ethiopia P 678.
Estifanos H, Tarekegn G, Yonas H, Eyassu S, Mengistu K, Mohammed A (2015). Physicochemical properties and microbial quality of raw cow milk collected from Harar Milkshed, Eastern Ethiopia. Journal of Biological and Chemical Research 32(2):606-616.
Food and Agriculture Organization of the United Nations (FAO) (1999). Extension Services for Quality Milk Production. Proceedings of an International Workshop in Conjunction with the East-West-Forum of the Federal Ministry for Food, Agriculture and Forestry, Germany P 35.
Food and Agriculture Organization of the United Nations (FAO) (2007). “Overview of the Turkish Dairy Sector within the Framework of European Union-Accession”, Rome, Italy.
Food and Agriculture Organization of the United Nations (FAO) (2010). Status and prospects for smallholder milk production. A global perspective, By Hemme T and Otte J, Rome, Italy. http://www.fao.org/3/i1522e/i1522e.pdf
Fatine H, Abdelmoula E, Doha B, Hinde H (2012). Bacterial quality of informally marketed raw milk in Kenitra City, Morocco. Pakistan Journal of Nutrition 11(8):662-669.
Fikrineh N, Estefanos T, Tatek W (2012). Microbial quality and chemical composition of raw milk in the Mid-Rift Valley of Ethiopia. African Journal of Agricultural Research 7(29):4167-4170
Francesconi GN (2006). Promoting Milk Quality of Cooperative Smallholders: Evidence from Ethiopia and Implications for Policy. In Proceedings of the 14
th Annual conference of the Ethiopian Society of
Animal Production (ESAP), Part II: Technical Papers Held on September 5 –7, 2006, Addis Ababa, Ethiopia pp. 31-41.
Girma D, Marco V (2013). Assessment of factors and factors affecting milk value chain in smallholder dairy farmers: A case study of Ada’a District, East Shawa Zone of Oromia regional State, Ethiopia. African Journal of Agricultural Research 9(3):345-352.
Godefay B, Molla B (2000). Bacteriological quality of raw cow’s milk
from four dairy farms and a milk collection center in and around Addis Ababa. Berl, Munch,Tierarztl, Wochenschr 113:276-278.
Haile W, Zelalem Y, Yosef TG (2012). Hygienic Practices and Microbiological Quality of Raw Milk Produced under Different Farm Size in Hawassa, Southern Ethiopia. Agricultural Research and Review 1(4):132-142.
Islam MA, Islam MN, Khan MAS, Rashid MH, Obaidullah SM (2009). Effect of different hygienic condition during milking on bacterial count of cows’ milk. Bangladesh Journal of Animal Science 38:108-114.
Jay MJ (1992). Modern Food Microbiology, 4th Edition. Van Nostrand
Reinhold, New York. Kedija H, Azage T, Mohammed YK, Berhanu G (2008). Traditional cow
and camel milk production and marketing in agro-pastoral and mixed crop–livestock systems: The case of Mieso District, Oromia Regional State, Ethiopia. IPMS (Improving Productivity and Market Success) of Ethiopian Farmers Project Working Paper 13. ILRI (International Livestock Research Institute), Nairobi, Kenya 56:1-3.
Kurwijila LR (1989). Technology of traditional milk products in developing countries; Southern and Eastern Africa, FAO Manuscript. (www.fao.org).
Kurwijila LR (2006). Hygienic milk handling, processing and marketing: reference guide for training and certification of small-scale milk traders in Eastern Africa. ILRI (International Livestock Research Institute), Nairobi, Kenya. https://cgspace.cgiar.org/bitstream/handle/10568/1697/TrainerGuideVol-1_C.pdf?sequence=1&isAllowed=y
Mattias O (2013). Quality analysis of raw milk along the value chain of the informal milk market in Kiambu County, Kenya, M.Sc. Thesis. Department of Microbiology, Faculty of Natural Resources and Agricultural Sciences, School of Graduate Studies, Swedish University of Agricultural Sciences, Sweden pp. 7-30.
Mbabazi P (2005). Milk industry in Uganda, 1st Edition. Fountain
Publishers, Kampala pp. 27-52. Mogessie A, Fekadu B (1993). Effect of container smoking and cleaning
on the microflora and keeping quality of raw milk from a dairy farm in Awassa, Ethiopia. Tropical Science 33:368-376.
Mostert JF, Jooste PJ (2002). Quality Control in the Dairy Industry. Dairy Microbiology Handbook. 3
rd Ed. Edited by Richard K Robinson.
John Wiley and Sons, Inc., New York pp. 655-736. O’Connor CB (1994). Rural Dairy Technology. ILRI Training Manual
No.1. International Livestock Research Institute (ILRI), Addis Ababa, Ethiopia.
O’Connor CB (1995). Rural Dairy Technology. ILRI Training Manual No.1. International Livestock Research Institute (ILRI), Addis Ababa, Ethiopia.
O’Mahony F (1988). Rural dairy technology experiences in Ethiopia. ILCA Manual No. 4. Dairy Technology Unit. ILCA, Addis Ababa, Ethiopia P 64.
Oliver SP, Jayarao BM, Almeida RA (2005). Food borne pathogens in milk and the dairy farm environment: food safety and public health implications. Journal of Dairy Science 2(2):115-129.
Omore A, Loure T, Staal S, Kutwa J, Ouma R, Arimi S, Kang’the E (2005). Addressing the public health and quality concerns towards marketed milk in Kenya. SDP Research and Development Report No.3, Smallholder Dairy (R and D) Project, Nairobi (Kenya) pp. 1-45.
Pandey GS, Voskuil GCJ (2011). Manual of milk safety, quality and hygiene. Lusaka, Zambia.
Raff H (2011). Market implications of changing fat content of milk and dairy products, fat content and composition of animal products. Journal of Food Science and Technology 5(2):6-17.
Rahel N (2008). Traditional and improved milk and milk products handling practices and compositional and microbial quality of raw milk and butter in Delbo, Water shed of Wollayta Zone. MSc Thesis, Hawassa University, Hawassa, Ethiopia.
Reinemann JD, Mein GA, Bray DR, Britt JS (2005). “Trouble shooting High Bacteria Counts in Farm Milk”. Sources of Bacterial Contamination in Raw Milk.
Richardson GH (1985). Standard Methods for the Examination of Dairy Products. 15
th ed. American Public Health Association, Washington,
D.C. pp. 168-196.
Eshetu et al. 2005 Ruegg L (2006). Role of hygienic in efficient milking. Advances in Dairy
Technology 18:285-293. Statistical Analysis System (SAS) (2003). SAS User’s guide. Inc. Cary,
NC. 33. Sintayehu Y, Fekadu B, Azage T, Berhanu G (2008). Dairy production,
processing and marketing systems of Shashemene–Dilla area, South Ethiopia. IPMS Working Paper 9. Nairobi: ILRI.
Statistical Procedures for Social Sciences (SPSS) (2007). Statistical. SPSS BI Survey Tips. Inc. Chicaco, USA.
Tadele A, Mitiku E, Yoseph M, Amha K (2016). Milk postharvest handling practices across the supply chain in Eastern Ethiopia. Journal of Advanced Veterinary and Animal Research 3(2):112-126.
Tamine AY (2009). Milk processing and quality management, Society of Dairy Technology (SDS) series. Wiley-Blackwell.
Teklemichael T, Ameha K, Eyassu S (2015a). Physicochemical Properties of Cow Milk Produced and Marketed in Dire Dawa Town, Eastern Ethiopia. Food Science and Quality Management 42:56-61.
Teklemichael T, Ameha K, Eyassu S (2015b). Quality and Safety of Cow Milk Produced and Marketed in Dire Dawa Town, Eastern Ethiopia. International Journal of Integrative Sciences 2(6):01-05.
Teshome G, Fekadu B, Mitiku E (2015). Handling Practices and Microbial Quality of Raw Cow's Milk Produced and Marketed in Shashemene Town, Southern Ethiopia. International Journal of Agricultural and Soil Science 2(9):153-162.
United State Development Agency (USDA) (2003). Dairy Programs Agricultural Marketing Service United States Department of Agriculture. Raising the Minimum Nonfat Solids Standard to the National Average in Raw Milk: A Study of Fluid Milk Identity Standards.
Valk VO, Abebe T (2010). The formal dairy chain of Addis Ababa: an analysis of the integration of small-scale dairy farmers in Ethiopian. LEI-report 2010-033, LEI, part of Wageningen UR, The Hague.
Yamane T (1967). Statistics, an Introductory Analysis, 2nd
Edition. New York.
Yitaye AA, Maria W, Azage T, Zollitsch W (2009). Performance and limitation of two dairy productions System in the North western Ethiopian highlands. Tropical Animal production and Health 41(7):1143-1150.
Younan M, Zakaria F, Matthias M, Ragge D (2007). Camel dairy in Somalia: Limiting factors and development potential.CH-8092 Zurich, Switzerland, (www.sciencedirect.com).
Yousef AE, Carlstrom C (2003). Food Microbiology; a Laboratory Manual. A John Weiley and Son, Inc., Hoboken, New Jersey, Canada. https://www.wiley.com/en-us/Food+Microbiology%3A+A+Laboratory+Manual-p-9780471391050
Zelalem Y (2003). Sanitary Conditions and microbial qualities of dairy products in urban and peri-urban dairy shed of the central Ethiopia. MSc Thesis, Universite Claude Bernard Lyon 1, Lyon, France.
Zelalem Y (2010). Quality factors that affect Ethiopian formal milk business: Experiences from selected dairy potential areas. SNV (Netherlands Development Organization), Addis Ababa, Ethiopia P 114.
Zelalem Y (2012). Microbial Properties of Ethiopian Marketed Milk and Milk Products and Associated Critical Points of Contamination: An Epidemiological Perspective. In Epidemiology Insights, Dr. Maria De Lourdes Ribeiro De Souza Da Cunha (Ed.), ISBN: 978-953-51-0565-7.
Zelalem Y, Emannuelle GB, Ameha S (2011). A Review of the Ethiopian Dairy Sector. Ed. Rudolf Fombad, Food and Agriculture Organization of the United Nations, Sub Regional Office for Eastern Africa (FAO/SFE), Addis Ababa, Ethiopia P 81.
Zewdie AK, Medin G, Silaie G, Weldaye K (2016). Small Scale Dairy Production System Challenges and Prospects in Fafen Zone, Ethiopian Somali Regional State, Eastern Ethiopia. Journal of Animal Production Advance 6(1):860-875.


![Valdez daily prospector. [Valdez, Alaska]. 1914-01-14 [p ]. · 2018. 7. 12. · Is Coming Along We handle your baggage, trunks and grips, by day or night. We meet all ships. MILK—MILK—MILK](https://static.fdocuments.us/doc/165x107/61256ffafccf0f0b3138b5e2/valdez-daily-prospector-valdez-alaska-1914-01-14-p-2018-7-12-is-coming.jpg)

