Milind Diwan, et al. - Brookhaven National Laboratory · nat i 0 ma l lab 0 rat 0 ry .j...
56
NAT I 0 MA L LAB 0 RAT 0 RY .J BNL-76798-2006-IR e, PROPOSAL FOR AN EXpERMENT4 PROGRAMINNEUTHNO PHYSICS AND PROTONDECAY IN THE HOMESTARE LABORATORY Milind Diwan, et al. July, 2006 PhysicsDepartment Electronic Detector Group Brook haven National La bo rat0 ry P.O. Box 5000 Upton, NY 1 1973-5000 www.bnl.gov Notice: This manuscript has been authored by employees of Brookhaven Science Associates, LLC under Contract No. DE-ACO2-98CH10886 with the U.S. Department of Energy. The publisher by accepting the manuscript for publication acknowledgesthat the United States Government retains a non-exclusive, paid-up, irrevocable, world-wide license to publish or reproduce the published form of this manuscript, or allow others to do so, for United States Government purposes.
Transcript of Milind Diwan, et al. - Brookhaven National Laboratory · nat i 0 ma l lab 0 rat 0 ry .j...

NAT I 0 MA L LAB 0 RAT 0 RY .J
BNL-76798-2006-IR
e ,
PROPOSAL FOR AN EXpERMENT4 PROGRAMINNEUTHNO PHYSICS AND PROTONDECAY IN THE HOMESTARE LABORATORY
Milind Diwan, et al.
July, 2006
PhysicsDepartment Electronic Detector Group
Brook haven National La bo rat0 ry P.O. Box 5000
Upton, NY 1 1973-5000 www.bnl.gov
Notice: This manuscript has been authored by employees of Brookhaven Science Associates, LLC under Contract No. DE-ACO2-98CH10886 with the U.S. Department of Energy. The publisher by accepting the manuscript for publication acknowledges that the United States Government retains a non-exclusive, paid-up, irrevocable, world-wide license to publish or reproduce the published form of this manuscript, or allow others to do so, for United States Government purposes.

DISCLAIMER
This report was prepared as an account of work sponsored by an agency of the United States Government. Neither the United States Government nor any agency thereof, nor any of their employees, nor any of their contractors, subcontractors, or their employees, makes any wmanty, express or implied, or assumes any legal liability or responsibility for the accuracy, completeness, or any third party’s use or the results of such use of any information, apparatus, product, or process disclosed, or represents that its use would not infringe privately owned rights. Reference herein to any specific commercial product, process, or service by trade name, trademark, manufacturer, or otherwise, does not necessarily constitute or imply its endorsement, recommendation, or favoring by the United States Government or any agency thereof or its contractors or subcontractors. The views and opinions of authors expressed herein do not necessarily state or reflect those of the United States Government or any agency thereof

July 12, 2006
PROPOSAL FOR AN EXPERIMENTAL PROGRAM IN NEUTRINO PHYSICS AND PROTON DECAY
IN THE HOMESTAKE LABORATORY
List of Collaborators
M. Diwan, S. Kettell, L. Littenberg, W. Marciano, Z. Parsa, N. Samios, S. White Department of Physics, Brookhaven National Laboratory, Upton, N Y
R. Lanou Department of Physics, Brown University, Providence, RI
W. Leland, K. Lesko Department of Physics, University of California, Berkeley, CA
Karsten Heeger, W. Y. Lee Lawrence Berkeley Laboratory, Physics Division, Berkeley, CA
W. Frati, K. Lande, A. K. Mann, R. Van Berg Department of Physics and Astronomy, University of Pennsylvania Philadelphia, PA
K. T. McDonald Department of Physics, Princeton Univesity, Princeton, NJ
D. B. Cline Department of Physics and Astronomy, University of California, Los Angeles, CA
P. Huber, V. Barger Department of Physics, University of Wisconsin, Madison, WI
D. Marfatia Department of Physics and Astronomy, University of Kansas, Lawrence, KS
T. Kirk Department of Physics, University of Colorado, Boulder, CO
2

This document contains figures in color

8
Contents
1 Introduction 1
2 Neutrino Oscillations and CP-Invariance Violation 5
3 Nucleon Decay 15
4 Summary of Construction Planning. Budget and Timetable for the Cav- erns in the Homestake Mine 16
4.1 Cha,ra.cteristics of Homestake Rock, Stability of Large. Deep Caverns and . . . . . . . . . . . . . . . . . . . 18
4.2 Status of the Homestake Mine . . . . . . . . . . . . . . . . . . . . . . . . . . 20
4.3 Determination of Excavation Stability . . . . . . . . . . . . . . . . . . . . . . 21
Coring Plans for the Deep Laboratory Area
4.4 Construction of Multiple 100 kiloton Chambers in the Homestake Mine . . . 23 4.5 Construction Timetable and Cost . . . . . . . . . . . . . . . . . . . . . . . . 28
4.6 RockRemoval . . . . . . . . . . . . . . . . . . . . . . . . . . . . . . . . . . . 29
4.7 Equipment Cost . . . . . . . . . . . . . . . . . . . . . . . . . . . . . . . . . . 29
4.8 Choice of Depth . . . . . . . . . . . . . . . . . . . . . . . . . . . . . . . . . 30
4.9 Summary of Section 4 . . . . . . . . . . . . . . . . . . . . . . . . . . . . . . 30
5 Design and Cost of One Chamber and Projected Cost of Multiple Cham- bers 30
5.1 Single Chamber Construction Costs . . . . . . . . . . . . . . . . . . . . . . . 31
5.2 Historic Costs of the Homestake Mining Company . . . . . . . . . . . . . . . 31
5.3 Final Total for Cost of Construction of the First Chamber . . . . . . . . . . . 32 5.4 Costs and Schedules for Multi-Chambers . . . . . . . . . . . . . . . . . . . . 32
5.4.1 Three Chambers . . . . . . . . . . . . . . . . . . . . . . . . . . . . . 32 .
5.4.2 Three Chamber Construction Cost . . . . . . . . . . . . . . . . . . . 32
5.4.3 Continued Chamber Construction . . . . . . . . . . . . . . . . . . . . 33
i
6 Design and Cost of One Module of the Cherenkov Detector
6.1 Photomultipliers . . . . . . . . . . . . . . . . . . . . . . . . . . . . . . . . . 6.2 Mechanical Structure . . . . . . . . . . . . . . . . . . . . . . . . . . . . . . . 6.3 Electronics and DAQ . . . . . . . . . . . . . . . . . . . . . . . . . . . . . . . 6.4 PMT Cables and Connectors . . . . . . . . . . . . . . . . . . . . . . . . . . . 6.5 Calibration Systems . . . . . . . . . . . . . . . . . . . . . . . . . . . . . . . 6.6 Water Purification and Cooling . . . . . . . . . . . . . . . . . . . . . . . . . 6.7 Summary of Detector Module Costs . . . . . . . . . . . . . . . . . . . . . . . 6.8 Final, Overall Cost of Three Detector Modules (including excavation of un-
derground chambers) . . . . . . . . . . . . . . . . . . . . . . . . . . . . . . .
7 Broadband Neutrino Beam to DUSEL
8 Summary
34
34
36
36
37
37
38
38
39
39
40
. .
ii

Preface
This report is intended to describe first, the principal physics reasons for an ambitious ex- perimental program in neutrino physics and proton decay based on construction of a series of massive water Cherenkov detectors located deep underground (4850 ft) in the Homestake Mine of the South Dakota Science and Technology Authority (SDSTA); and second, the en- gineering design of the underground chambers to house the Cherenkov detector modules; and third, the conceptual design of the water Cherenkov detectors themselves for this purpose.
In this proposal we show the event rates and physics sensitivity for beams from both FNAL (1300 km distant from Homestake) and BNL (2540 km distant from Homestake). The program we propose will benefit with a beam from FNAL because of the high intensities currently available from the Main Injector with modest upgrades. The possibility of tuning the primary proton energy over a large range from 30 to 120 GeV also adds considerable flexibility to the program from FNAL. On the other hand the beam from BNL over the larger distance will produce very large matter effects, and consequently a hint of new physics (beyond CP violation) can be better tested with that configuration. In this proposal we focus on the CP violation physics.
Included in this document are preliminary costs and time-to-completion estimates which have been exposed to acknowledged experts in their respective areas. This presentation is not, however, to be taken as a technical design report with the extensive documentation and contingency costs that a TDR usually entails. Nevertheless, some contingency factors have been included in the estimates given here.
The essential ideas expressed here were first laid out in a letter of intent to the interim director of the Homestake Laboratory on July 26, 2001. Since that time, the prospect of a laboratory in the Homestake Mine has been realized, and the design of a long baseline neutrino experiment has been refined. The extrapolation contained in this proposal is within the common domain of thinking in the area of physics discussed here. It needs now only the encouragement of the funding agencies, NSF and DOE.
I Introduction
With the discovery of neutrino oscillations, it becomes realistic to test for a violation of CP-invariance in the lepton sector of elementary particles. As is well-known, CP-invariance
1
in the hadron sector of elementary particles was discovered more than 40 years ago and has been the subject of study-experimental and theoretical-since that time. In the event that such violation is found and measured in the lepton sector, the implications of that finding would be profound for elementary particle physics and similarly for astrophysics and cosmology. This is the principal goal of the long-baseline neutrino program in the Homestake Laboratory.
We have previously pointed out that for a given resolution on 6cp the total number of neu- trino events needed, which determines the detector size and beam intensity, is approximately independent of the baseline length as well as the value of sin2 2813 [l, 21, as long as the elec- tron signal is not background dominated or the value of 813 too small (sin2 2813 < 0.003[3]). Therefore this very long baseline (2 1300 km) program is attractive regardless of other projects in neutrino physics because it provides high sensitivity to 813, CP violation, and the mass hierarchy as well as access to much richer physics phenomena.
There are three additional goals that can be addressed by the same detector at the same time: (1) high precision studies of neutrino oscillations, (2) a search for nucleon decay to yield a substantially improved sensitivity to the decay rate p + e+ + TO, and perhaps to other decay modes, and (3) a search for supernova neutrino bursts. All of these goals have been extensively discussed in the literature and are recognized as important issues to be determined experimentally in the progress of elementary particle physics.
The design of the detector for this program may be briefly stated. The three goals de- scribed here require high statistical sensitivity and good discrimination against backgrounds; these in turn determine the size, the type and nature of the detector. Considering the present intensity levels available for neutrino beams from US accelerator laboratories (Fermi National Accelerator Laboratory (FNAL) or Brookhaven National Laboratory (BNL)), a de- tector fiducial mass of 2 300 ktons is essential to acquire the statistical precision of the test for CP invariance and to study neutrino oscillations at the statistical level of 1-3%. Similar detector mass is also essential to extend the limit on the nucleon decay lifetime. To achieve such large mass and simultaneously obtain sufficient information about observed events for effective background elimination leads to the choice of detector as a water Cherenkov de- tector. To make it possible to use the three detector modules in concert or independently specifies their modularity, and finally to protect them from the cosmic ray flux demands that they be operated deep underground. This last condition is amply satisfied at Homestake as shown in Fig. 1.
It is also worthwhile in this brief introduction to complete the description of the long baseline neutrino program in the Homestake Laboratory by addressing two misconceptions.
2

I I I l l 1 I I I I I I l l 1
A Proposed DUSL Homestake 0 Current Laboratories i -.
'\ Muon flux vs overburden
Dusk - Edorneslake (Shallow)
Gran Sasso - - -
Mont Blanc 1
I I I l l 1 1 4 I 5 I 6 I I I I 7 8 9 ' 5 6 7 8 9 ' 2 3
I
1 o3 1 o4 Depth, meters water equivalent
Figure 1: Cosmic ray muon intensity as a function of depth in meters water equivalent at the Homestake based Deep Underground Science and Engineering Laboratory (DUSEL) . The depth and rates at other underground laboratory locations in the world are also indicated for comparison. Various locations in Homestake of potential sites for physics experiments are indicated by a red triangle. The Homestake (Chlorine) depth (4850 ft.) is the potential location for the detector proposed in this document. The rate of muons for a 100 kT detector at this depth is approximately 0.1 Hz.
3
First is the issue of what is referred to as “extreme cost” of such a large mass neutrino detector and the impact of that cost on other research plans for expensive facilities. The modular detector proposed here will require four or five years to construct from the time funds become available. Although the chambers for all three modules may be excavated at the same time, for time and cost savings, it is likely that the detector modules will be finished serially. As a result, the first module can be shaken down and begin operating while construction of the others is being completed. This means an early start of data-taking and control of the rate at which funds are expended if such fine-tuning were to be requested by the funding agency. In any event, the present estimate of the cost of the complete 3 module detector, which will be presented in detail later in this report, is $308M, or $62M per year over the five years of construction.
This should be regarded as a well considered allocation of resources since the useful life of the detector complex will extend over a period of at least ten years following the onset of data-taking, and very likely much longer without the beam to continue study of atmospheric neutrinos, neutrino emissions from Type 2 supernovae, and proton decay.
Second, the CP-test needs a broad band neutrino beam from a high energy accelerator to be discussed briefly below, but is properly the province of FNAL and BNL which are now involved in discussions relating to the technical aspects of that beam and its delivery to Homestake Laboratory (distances: N 1290 km from FNAL and N 2540 km from BNL). A design for such beam from BNL exists and has been well documented. We hope that as part of the FNAL/BNL study on beams and accelerator intensity a design for such a beam will be produced at FNAL. It is clear even from initial studies that due to the high intensities available at the Main Injector and the flexibility in proton energy over a wide range (30 to 120 GeV), a beam from FNAL could be very advantageous. We hope that a new design will produce adequate intensity neutrino beam for the initial CP-test without a need for large upgrades to the proton complex, but such upgrades will be desired subsequently.
It is expected that construction of a beam at either accelerator would take about four or five years and coincide approximately with the schedule for the Homestake detectors if work were to begin at both projects at the same time. It should be emphasized, however, that more than a rough coincidence in time is not demanded; as discussed below, there is important physics to be studied in the Homestake detector without a neutrino beam, provided the beam becomes available within two years after completion of the full detector.
We turn now to the second section of this report: an abbreviated description of neutrino physics and CP-violation, and proton decay.
4

2 Neutrino Oscillations and CP-Invariance Violation
The physics reach of the program here in the study of neutrino-oscillations and CP-violation is extensive (see Fig. 2 and Fig. 3)[4, 51 and needs to be presented in quantitative detail to be appreciated. A compact but complete presentation of that material, “Very Long Baseline Neutrino Oscillation Experiments for Precise Measurements of Mixing Parameters and CP Violating Effects”, is published in Phys. Rev. D68:012002 [2] and also in eprint hep-ph/0407047 [6]. We summarize here parts of the introduction and conclusions of those reports. We will also use the materials generated in recent workshops on the subject as well as the reports from the NSF DUSEL (Deep Underground Science and Engineering Laboratory) initiatives.
The first violation of CP-invariance was observed in the KO - Bo system about forty years ago. Until that experiment, it was thought that the product of those symmetry factors was invariant and preserved the symmetry between a fundamental neutral particle and its antiparticle. Recently, CP violation has been observed in a second quark system, the Bo -Bo system. Following that, interest is raised in the question of the presence of CP-invariance violation in the neutrino sector.
The observation of neutrino oscillations opens the neutrino sector as a promising region in which a CP asymmetry between neutrino and antineutrino might be exhibited. This would fuel further speculation that a primordial universal asymmetry in the early universe accounts for the matter-antimatter asymmetry we observe now. The suggestion that a long baseline neutrino oscillation experimental program would be a fertile region to explore for that purpose has been studied intensively (e.g.; see [7, 8, 9, 10, 111 and references therein) in the last few years as a result of the experimental data on neutrino oscillations, but a conclusive demonstration of neutrino oscillations and a search for leptonic CP-invariance violation awaits a more ambitious experimental program such as the one proposed here.
Measurements of solar and atmospheric neutrinos have provided strong evidence for non- zero neutrino masses and mixing [12, 13, 14, 15, 161. Interpretation of the experimental results is based on oscillations of one neutrino flavor state, v,, vp, or v,, into the others, and described quantum mechanically in terms of neutrino mass eigenstates, y, 7 4 , and y. The mass squared differences involved in the transitions are measured to be approximately Ami, = r n ( ~ 2 ) ~ - r n ( ~ 1 ) ~ M 8 x lOW5eV2 (solar parameters) and Ami, = r n ( i ~ 3 ) ~ - r n ( ~ 2 ) ~ x f 2 . 5 x 10⁻³eV2 (atmospheric parameters), with large mixing strengths, sin2 2&2 M 0.86 and sin22823 M 1.0 in both cases (See Table 1). The currently favored parameters open the possibility for an accelerator based long baseline program that can measure both solar and atmospheric oscillation parameters in a single experiment with high precision, and search for
5

Figure 2: This graph shows the 3 sigma physics reach for sin2 2813 (top), and resolution of the mass hierarchy (bottom) of the program we are proposing here. The region to the right of the curves will be excluded for sin2 2813 (top) in case of no signal. If there is a signal then the mass hierarchy will be determined to the right hand side of the curves in the bottom plot. The calculation was made for the exposure of 300kT x 1MW x 5yrs each for neutrino and anti neutrino running. The assumptions about the spectrum and proton energy are explained in the text. We assume running time of 1.7 x lo7 sec per year. The reach for both 1300 km and 2540 km baselines is shown.
.
6

Figure 3: This graph shows the 3 sigma reach for,detection of CP violation as a function of sin22813 and Scp , There will be a 3 sigma signal for CP violation in the region to the right of the curves. The CP parameter Scp will be determined to at least 3 sigma with no ambiguities in a simultaneous determination (or fit) that also yields 813 and the ma.ss hierarchy. The assumptions for the detector exposure are the same as in Fig. 2.
.
7
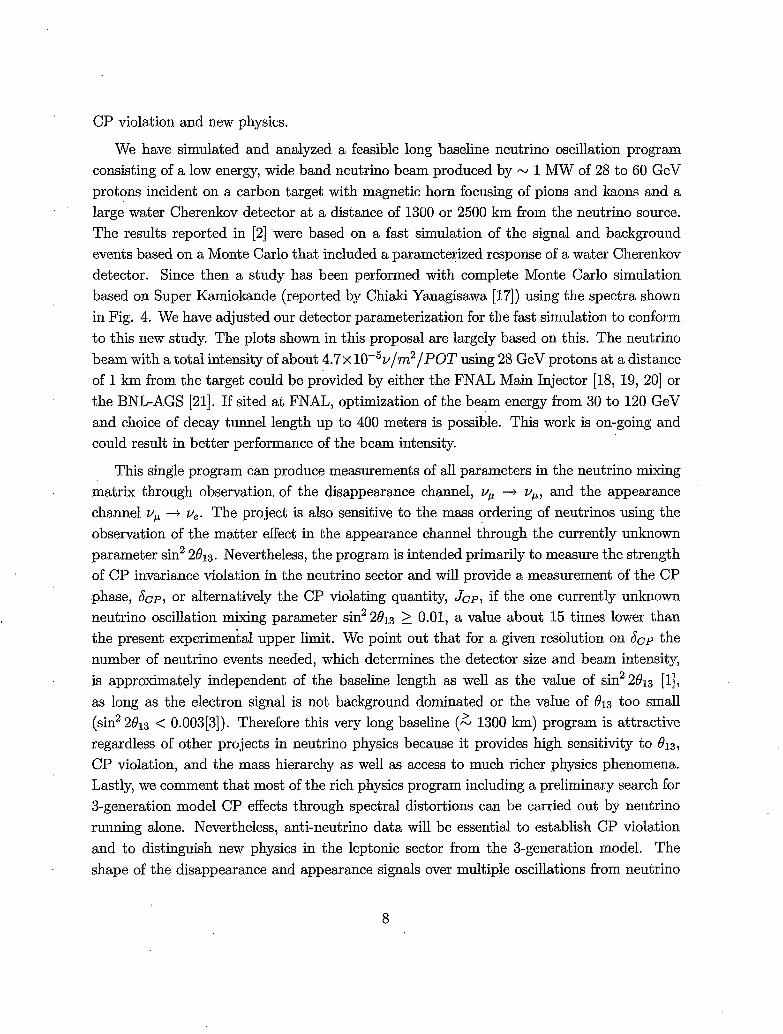
CP violation and new physics.
We have simulated and analyzed a feasible long baseline neutrino oscillation program consisting of a low energy, wide band neutrino beam produced by N 1 MW of 28 to 60 GeV protons incident on a carbon target with magnetic horn focusing of pions and kaons and a large water Cherenkov detector at a distance of 1300 or 2500 km from the neutrino source. The results reported in [2] were based on a fast simulation of the signal and background events based on a Monte Carlo that included a parameterized response of a water Cherenkov detector. Since then a study has been performed with complete Monte Carlo simulation based on Super Kamiokande (reported by Chiaki Yanagisawa [17]) using the spectra shown in Fig. 4. We have adjusted our detector parameterization for the fast simulation to conform to this new study. The plots shown in this proposal are largely based on this. The neutrino beam with a total intensity of about 4 . 7 ~ 10-5u/m2/POT using 28 GeV protons at a distance of 1 km from the target could be provided by either the FNAL Main Injector [18, 19, 201 or the BNL-AGS [21]. If sited at FNAL, optimization of the beam energy from 30 to 120 GeV and choice of decay tunnel length up to 400 meters is possible. This work is on-going and could result in better performance of the beam intensity.
This single program can produce measurements of all parameters in the neutrino mixing matrix through observation, of the disappearance channel, up + up, and the appearance channel up + u,. The project is also sensitive to the mass ordering of neutrinos using the observation of the matter effect in the appearance channel through the currently unknown parameter sin2 2813. Nevertheless, the program is intended primarily to measure the strength of CP invariance violation in the neutrino sector and will provide a measurement of the CP phase, Jcp, or alternatively the CP violating quantity, Jcp , if the one currently unknown neutrino oscillation mixing parameter sin22813 2 0.01, a value about 15 times lower than the present experimental upper limit. We point out that for a given resolution on Jcp the number of neutrino events needed, which determines the detector size and beam intensity, is approximately independent of the baseline length as well as the value of sin22813 [l], as long as the electron signal is not background dominated or the value of 813 too small (sin2 2813 < 0.003[3]). Therefore this very long baseline (2 1300 lm) program is attractive regardless of other projects in neutrino physics because it provides high sensitivity to 813, CP violation, and the mass hierarchy as well as access to much richer physics phenomena. Lastly, we comment that most of the rich physics program including a preliminary search for 3-generation model CP effects through spectral distortions can be carried out by neutrino running alone. Nevertheless, anti-neutrino data will be essential to establish CP violation and to distinguish new physics in the leptonic sector from the 3-generation model. The shape of the disappearance and appearance signals over multiple oscillations from neutrino
8
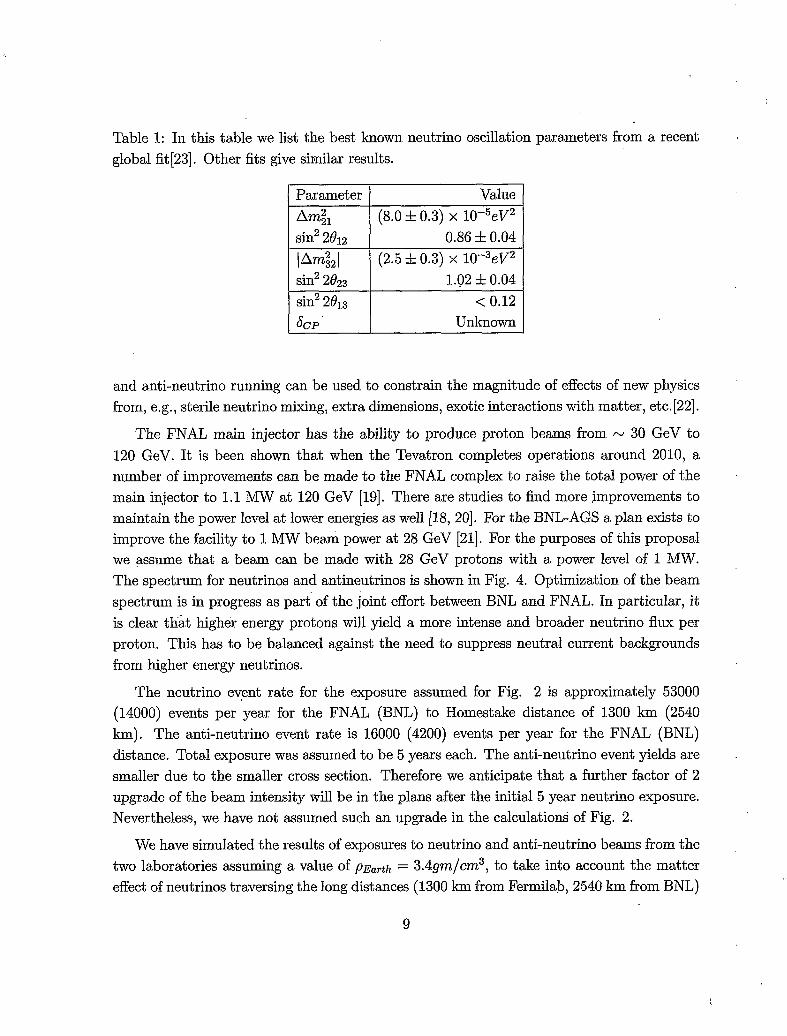
Table 1: In this table we list the best known neutrino oscillation parameters from a recent global fit[23]. Other fits give similar results.
.
Parameter Value A 4 1 (8.0 rt 0.3) x 10-5eV2 sin2 2eI2 0.86 f 0.04 \Am$,] (2.5 f 0.3) x 10-3eV2 sin2 2023 1.02 f 0.04 sin2 2e13 < 0.12 JCP ' Unknown
and anti-neutrino running can be used to constrain the magnitude of effects of new physics from, e.g., sterile neutrino mixing, extra dimensions, exotic interactions with matter, etc. [22].
The FNAL main injector has the ability to produce proton beams from - 30 GeV to 120 GeV. It is been shown that when the Tevatron completes operations around 2010, a number of improvements can be made to the FNAL complex to raise the total power of the main injector to 1.1 MW at 120 GeV [19]. There are studies to find more improvements to maintain the power level at lower energies as well [18, 201. For the BNL-AGS a plan exists to improve the facility to 1 MW beam power at 28 GeV [21]. For the purposes of this proposal we assume that a beam can be made with 28 GeV protons with a power level of 1 MW. The spectrum for neutrinos and antineutrinos is shown in Fig. 4. Optimization of the beam spectrum is in progress as part of the joint effort between BNL and FNAL. In particular, it is clear that higher energy protons will yield a more intense and broader neutrino flax per proton. This has to be balanced against the need to suppress neutral current backgrounds from higher energy neutrinos.
The neutrino event rate for the exposure assumed for Fig. 2 is approximately 53000 (14000) events per year for the FNAL (BNL) to Homestake distance of 1300 km (2540 km). The anti-neutrino event rate is 16000 (4200) events per year for the FNAL (BNL) distance. Total exposure was assumed to be 5 years each. The anti-neutrino event yields are smaller due to the smaller cross section. Therefore we anticipate that a further factor of 2 upgrade of the beam intensity will be in the plans after the initial 5 year neutrino exposure. Nevertheless, we have not assumed such an upgrade in the calculations of Fig. 2.
We have simulated the results of exposures to neutrino and anti-neutrino beams from the two laboratories assuming a value of p ~ ~ ~ t h = 3.4gm/cm3, to take into account the matter effect of neutrinos traversing the Iong distances (1300 km from Fermilab, 2540 km from BNL)
9

Wide Band. Proton Energy = 28 GeV E Y
m F c)
k Distance = 1 km
0 2 4 6 8 1 0 1 2 1 4
x E r 4.l m
E, W V )
Wide Band. Proton Energy = 28 GeV t Distance = 1 km
Antineutrino Beam
$ l o =
f 4 5 lo
N- E
-7 10
-a 10
Figure 4: This plot shows the spectrum of neutrinos (top) and anti-neutrinos (bottom) from 28 GeV protons with a wide band horn design (from BNL) calculated using a GEANT based Monte Carlo program. The decay tunnel diameter was assumed to be 4 meters and length to be 180 Meters. Such a beam could originate from FNAL or BNL. At FNAL, the proton beam energy could be higher and the tunnel length could be longer, both yielding a more intense beam per proton; this optimization is in progress.
10

from those sources to the Homestake detector. The difference between assuming a constant matter density or taking account of the density variation is small for these distances through the Earth. We have also chosen 0.04 as the value of sin' 2OI3 in the simulation because a larger value is likely to be measured in the next few years; a smaller value will be pursued by this program. Indeed, the CP-test remains viable in the Homestake detector even if sin2 2013 is as small as N 0.005. At that level, interest in part shifts to the question of why the "solar" and "atmospheric" mixing parameters are so large, and yet the third mixing angle, which must exist in a 3-generation system, is so small. The neutrino program would take this as a new challenge, not an obstacle, but a clear indication that physics beyond the oscillation description underlies the present experimental observations. It is for this reason among others that high precision studies of neutrino oscillations are listed as a goal of the Homestake long baseline neutrino program. The results of the simulation are shown in Figs. 5 through 7.
<
Fig. 5 shows the nodal structure that will be seen in the spectrum of up charged current reactions. The same nodal structure is expected in anti-neutrino spectrum. Since the anti- neutrino data would be products of a completely separate accelerator run from the run for neutrino data, a comparison of the up and Fp energy structures would establish a common energy scale with a given empirically determined error for the two energy distributions.
Confirmation of the energy scale (or equivalently Am;, scale) would come from compar- ison of the vp and v, energy distributions in Fig. 5, Fig. 6, and Fig. 7, which show the locations of the v, and 2, peaks in the valleys between the vp and Fp survival peaks. A close examination of Fig. 6 and Fig. 7 shows similar spectral features except that in the case of normal (reversed) hierarchy the anti-neutrino appearance spectrum will be suppressed (enhanced) at higher energies. The effect is dramatic for both 1300 and 2540 km distances.
A large fraction of the CP information is gained simply by identifying the nodal structures at well calibrated locations in energy. The position of the peaks in energy and their amplitude will give us an internally consistent picture of the vp --+ v, appearance observation. A detailed fit would yield values for the three parameters, 013, &p, and mass hierarchy, in the sensitive region as shown in Fig. 2. Any inconsistencies in the fit could indicate presence of new physics beyond the 3-generation neutrino model.
The capability to predict precisely the energy distributions resulting from the two data- taking runs described here depends, first, on knowledge of the measured values of the os- cillation parameters and their errors, Am:j and sin22(Oij), which will be improved in this program. Second, that capability will depend on the ability of making calculations of the event yields and spectra with small errors. Apart from the tests for consistency described
11

C
w g 250
200
150
100
50
0
vF disappearance
L BNL to Homestake 2540 km
sin’ze, = 1.0 in Amz Jz = 2.5e-3 eVz
Benm 1 M W , Det. 0.5 MT, Run 5e7 sec
- No oscillations: 13290 evts
0 1 2 3 4 5 6 7 8 9 : I Reconstructed vg Energy (GeV)
vp disappearance FNAL to Homestake 1290 km sin’20, = 1.0 Am’ 32 = 2 5 - 3 eV’ Beam 1 MW, Det. 0.5 MT, Run 5e7 see
800
- No oscillations: 51500 evt! __ With oscillations: 20305 e
600
400
200
‘ 0 1 2 3 4 5 6 7 8 9 1 Reconstructed vp Energy (GeV)
E
Figure Charged current vP interaction spectrum after cuts to select clean u g l e muon events. The plot includes background from events in which there are additional charged pions below Cherenkov threshold. The plots with and without oscillations are shown for 2540 (top) and 1300 (bottom) km distances.
12

ve APPEARANCE BNL-HS 2540 km
Tot evts vs CP
Am$(21,32)=7.3e-5E.5e-3 2500kTMW(ld)S R
C .- $ 70 C
W 60 J
50
40
30
20
10
0
1 10 Reconstructed v Energy (GeV)
v APPEARANCE FNAL-HS 12d km
sidB 12 23 13)=O.Wl.WO.O4 1 q & , 3 i ) ~ 2 4 / i i 5 . ? - 3 e f 2500 kT MW(1d) see
1 10 Reconstructed v Energy (GeV)
Figure 6: Charged current u, interaction spectrum after cuts to reduce background. The oscillation parameters assumed are indicated in the figures. We have used the value of sin2 2813 = 0.04 for illustrative purposes. The CP phase is changed for the various curves as indicated in the figures. For these figure the mass hierarchy is assumed to be "normal". The spectra are shown for 2540 (top)and 1290 (bottom) km distances.
13

Anti-v, APPEARANCE BNL-HS 2540 km
C
c Am,,2(21,32)=7.3e-525e-3 e 0
Tot evts vs CP
& E e v t s
00: zo~.e!/ts
4 5 0 : a e v t s
S
1 10 Reconstructed v Energy (GeV)
Anti-v, APPEARANCE C .- $ 35 CI C 0 h 30 rot evts vs CP
25
20
15
10
5
0
is
S
1 10 Reconstructed v Energy (Gev)
Figure 7: Charged current De interaction spectrum after cuts to reduce background. The oscillation parameters assumed are indicated in the figures. We have used the value of sin22813 = 0.04 for illustrative purposes. The CP phase is changed for the various curves as indicated in the figures. For these figure the mass hierarchy is assumed to be "normal". These spectra assume the same amount of anti-neutrino running with the same intensity proton bea.m as in Fig. 6. The spectra are shown for 2540 (top)and 1290 (bottom) km distances.
14

above, we will also rely on the positive experience obtained in previous experiments with massive neutrino detectors (Kamioka-11, SK, and MINOS[24]) that have demonstrated good agreement between observation and calculation.
The analysis envisioned above-with its several checks against error and ambiguities- provides a particularly sensitive search for a non-zero value of &p because it uses both the energy dependence of the CP effect as well as the neutrino/anti-neutrino asymmetry. A less sensitive analysis is possible using neutrino data alone, in which the parameter &p is measured explicitly for v, oscillations along with sin22813 using the energy dependence alone. The virtue of this mode of analysis is that it does not require antineutrino data and therefore can be carried out when the neutrino exposure is completed-two to three years after neutrino data-taking begins.
3 Nucleon Decay
While current experiments show that the proton lifetime exceeds about years, its ulti- mate stability has been questioned since the early 1970s in the context of theoretical attempts to arrive at a unified picture of the fundamental particles, the quarks and leptons and of their three forces: the strong, electromagnetic and weak. These attempts of unification, commonly referred to as Grand Unification, have turned out to be supported empirically by the dramatic meeting of the strengths of the three forces, that is found to occur at high energies in the context of so-called Supersymmetry, as well as by the magnitude of neutrino masses that is suggested by the discovery of atmospheric and solar neutrino oscillations. One of the most crucial and generic predictions of grand unification, however, is that the proton must ultimately decay into leptonic matter such as a positron and a meson, revealing quark- lepton unity. A class of well-motivated theories of grand unification, based on the symmetry of SO(10) and Supersymmetry [25], which have the virtue that they successfully describe the masses and mixings of all quarks and leptons including neutrinos, and which also explain the origin of the excess of matter over anti-matter through a process called leptogenesis, provide a conservative (theoretical) upper limit on the proton lifetime which is within a factor of ten of the current lower limit. This makes the discovery potential for proton decay in the next- generation high. At present, the best limit on the classical mode, p + e+no ( > 5.4 x yr, at 90% CL) comes from a 92 kton-yr exposure of Super-Kamiokande[26]. The detection efficiency of 44% is dominated by final-state 7ro absorption or charge-exchange in the nucleus, and the expected background is 2.2 eventslhlton-yr. The mode p -+ K+ + V , is experimen- tally more difficult in water Cherenkov detectors due to the unobservable neutrino. The
15

present limit from Super-Kamiokande is the result of combining several channels, the most sensitive of which is K+ + p+u accompanied by a de-excitation signature from the remnant 15N nucleus. Monte Carlo studies suggest that this mode should remain background free for the foreseeable future. The present limit on this mode is > 2.2 x yr (90% CL). Since the next step in nucleon decay very likely needs an order of magnitude improvement, continued progress inevitably requires much larger detectors. Out of the various technologies discussed water Cherenkov appears to be the only one capable of reaching lifetimes of years or greater. In Fig. 8 we reproduce projections for proton decay sensitivity for the above discussed modes for larger water Cherenkov detector exposures[27, 281.
The first advantage of a water Cherenkov detector is that it is a proven technology that has been perfected over several decades. The second advantage is often overlooked: it is perhaps the only detector with the capability of having a vast dynamic range in detection of 5 MeV to 50 GeV. This makes it a unique instrument ideally suited to take advantage of a deep shielded location. The dynamic range is very important for detection of various proton decay modes as well as astrophysical neutrinos.
Water Cherenkov detectors are in operation in Japan (Super Kamiokande with a total mass of 50 kT)[29] and in Canada (the Sudbury Neutrino Observatory, SNO, with 1 kT of D20 and 5 kT of H20)[30]. Most of the decay modes that were searched for in the first generation detectors required only modest depth. IMB operated successfully at a depth of 2000 feet [31]. The proposed depth here would reduce the muon background by about a factor of 20 with respect to Super-K and certainly help in the observation of modes with a low energy component or those influenced by fast neutron background.
4 Summary of Construction Planning, Budget and Timetable for the Caverns in the Homestake Mine
Plans for the construction of chambers for a multiple module megaton Cherenkov detector at the Homestake Mine have gone through a number of evaluation and design stages consisting of rock strength and stability evaluation, chamber design and layout, construction planning, sequencing, and development of budget and timetable. Here is a summary of these steps.
16
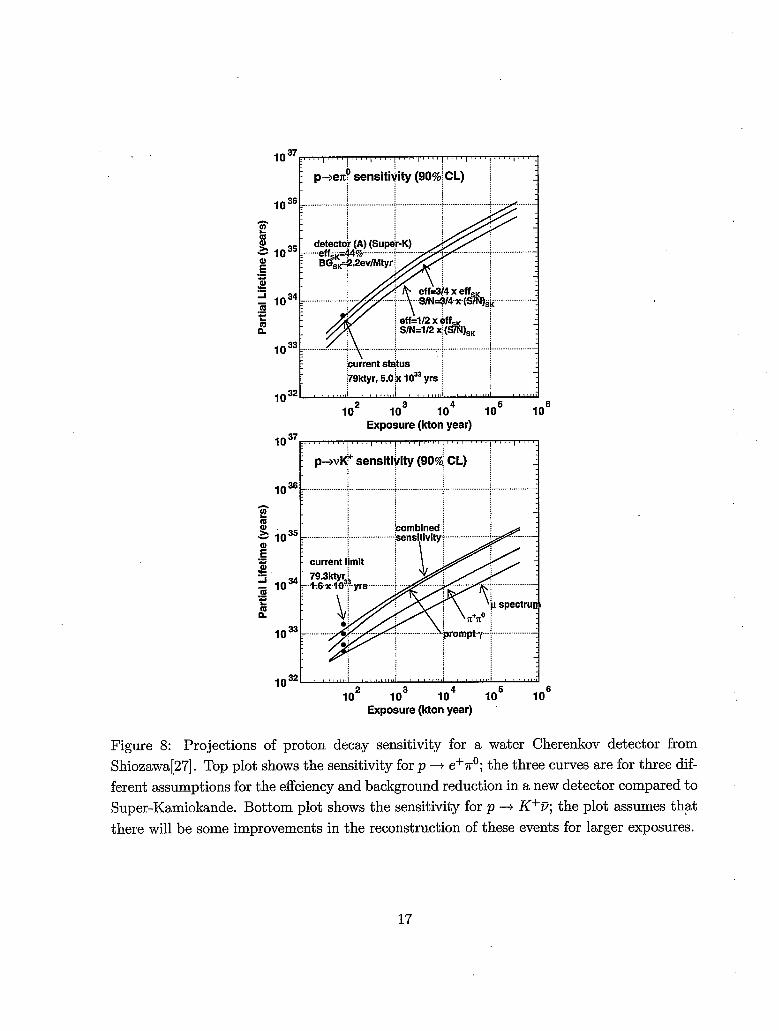
Figure 8: Projections of proton decay sensitivity for a water Cherenkov detector from Shiozawa[27]. Top plot shows the sensitivity for p + e+no; the three curves are for three dif- ferent assumptions for the effciency and background reduction in a new detector compared to Super-Kamiokande. Bottom plot shows the sensitivity for p + K+U; the plot assumes that there will be some improvements in the reconstruction of these events for larger exposures.
17

4.1 Characteristics of Homestake Rock, Stability of Large, Deep Caverns and Coring Plans for the Deep Laboratory Area
With the exception of several years during World War 11, the Homestake Gold Mine in Lead, South Dakota has been in continuous operation from 1876 until it ceased active operation in 2001[32]. During that period, over 40 million ounces of gold have been produced. This pro- duction involved the excavation of several hundred million tons of ore from the underground mine as well as over 170 million tons of excavated ore and waste rock from the Open Cut (pit) surface mine. The Homestake Mine now involves over 160 miles of underground tunnels on numerous levels down to 8000 ft. below the surface, as shown in Fig. 9 and Fig.10.
Figure 9: Schematic diagram of the Homestake mine.
The Homestake Mine geology has been extensively studied (see the U.S. Geological Survey Bulletin 1857-5 (1991) and the references cited therein). The strength characteristics of the
18

Figure 10: Cross sectional cut of the Homestake mine development.
19
rock have been thoroughly studied and measured. The advantage of locating detectors deep underground is shown quantitatively in Fig. 1. The Homestake Mining Company (HMC) has constructed several large, deep underground chambers. Among these are an equipment repair shop at the 7400 ft. level and an air conditioning plant at the 6950 ft. level. These excavations at great depths provide a strong indication that large excavations at depths of 4850 ft. to 7000 ft. can be constructed and will remain stable for multi-decade periods. In addition, the construction of an array of very large chambers provides a unique opportunity for the rock mechanics and geophysics communities to monitor the behavior of such structures for long periods. This can be monitored by placing sensors in the drifts that connect the detector stations[33]. This would involve pre-excavation computer modeling of the structure, the installation of strain and stress gauges during construction and the post-excavation monitoring of these instruments. The backfilling of excavations in normal mining precludes long term monitoring and the irregular shapes of ore deposits limits the geometrical range of the excavations that can be studied.
The region of monolithic rock being considered for the deep underground Cherenkov detector has not been mined or explored in detail. By extrapolating from above and from the west side, this rock region appears homogeneous, and with few intrusions. In this document we are proposing that the initial 3 chambers be located on the 4850 ft level close to the Yates shaft and the Chlorine experiment. The rock in this region is better known than the rest of the Yates formation, and therefore the confidence in the cost and time estimates are higher. On the other hand, before beginning any excavations, it would be advisable to carry out extensive coring studies of this volume of rock. Cores can be drilled down from tunnels on the 4850 ft. level. These cores would verify the rock strength characteristics and would provide information about the direction of the rock grain.
4.2 Status of the Homestake Mine
Earlier this year, 2006, title to and possession of the Homestake Mine was transferred from the Barrick Gold Corporation to the State of South Dakota. The State has designated the South Dakota Science and Technology Authority to operate the Mine as a Deep Under- ground Laboratory and has provided the Authority with $35 million in State funds and $10 million in Federal funds for this purpose. The Authority anticipates that it will spend the rest of 2006 on various underground remedial activities and to reestablish laboratory facili- ties, power distribution, ventilation and communications system. It anticipates opening the Underground Laboratory for experiments in late 2007. The initial laboratory area will be at the 4850 ft level, 4200 meters water equivalent deep. The Authority anticipates that its
20

existing funding is sufficient to provide basic Laboratory operations through 2012.
In addition to the above funds, Mr. Denny Sanford, the CEO of Premier Bank and Premier Bankcard, has offered to donate $70 million to the Homestake Laboratory, giving the Lab a total of $116 million in non-NSF funding.
The last indication was that the water in the lower reaches of the mine has reached the 6200 f t level, about 1350 f t below the 4850 ft laboratory level. Since about 2/3 of the water inflow is surface water that enters above the 4850 f t level, one of the remedia.1 activities in 2006 is to intercept this water and pump it back to the surface using the existing mine pumping system. Once NSF funds are made available, the Authority will pump out the water from the deeper regions of the mine and establish a second, deeper laboratory region at the 7400 ft level.
As noted in Fig. 11, the initial three 100 kiloton fiducial mass chambers are to be constructed adjacent to the site of the Chlorine Solar Neutrino Detector. Each of these chambers will be about 500 ft away from that site. The rock here is well known. The Chlorine Detector chamber was excavated in 1965 and has been completely stable since then. In addition, the Yates rock dump and rock hoist system is only 500 ft from the Chlorine chamber so that waste rock from these first three chambers need only be transported about 1000 ft to the rock hoist system. The existing Chlorine Detector laboratory area may also serve as an initial and temporary staging area for this three chamber complex.
4.3 Determination of Excavation Stability
A preliminary 2 dimensional large chamber stability evaluation was carried out in the fall of 2000 by members of the Rock Stability Group at the Spokane Research Laboratory of NIOSH (National Institute of Occupational Safety and Health). This evaluation indicated that stable chambers with dimensions in excess of 50 meters could be constructed at depths ,
of 7000 f t or more at the Homestake Mine. In the fall of 2001, rock samples from the Yates formation were taken to the Spokane Laboratory and strength and stress analyzed. These measurements provided more specific input for a three dimensional stability analysis of large excavations as a function of depth in the Yates rock formation in the Homestake Mine. This 3D analysis involved a finite difference evaluation using the FLAC3D program. These results [34] were compared with the empirical prediction charts of [35]. The conclusions were that 50 meter diameter by 50 meter high chambers could be safely excavated and would be stable for long term occupancy at depths up to 2150 meters and probably somewhat deeper.
The results of this evaluation were presented in a paper at the Fifth North American ~
21

Rock Mechanics Symposium in July 2002 [34]. For the measured Yates formation rock parameters (Tunneling Quality Index), the Grimstad and Barton specifications are 4 - 5 cm of unreinforced shotcrete applied to the rock surface. We have decided to install a 50 cm thick concrete shell on the vertical cylindrical inside of the excavation. This is equivalent to a two order of magnitude safety factor using the Barton and Grimstad parameters [36].
The FLAC3D analysis also indicated that in order to isolate the stress fields of one chamber from the adjacent one, these chambers should be separated by at least 3 chamber
, diameters. These conclusions were confirmed by the report of the NSF site selection com- mittee [37]. Recently a linear layout has been envisioned for the 4850 ft level. Such a scheme is shown in Fig. 11. This scheme has many advantages mostly due to the proximity of the caverns to the well developed area between the Yates and the Ross shafts.
Figure 11: Possible linear layout of 10 caverns at Homestake. This layout is developed for the 4850 ft level. The location of the Davis Chlorine cavern is indicated by the word “neutrino”.
22
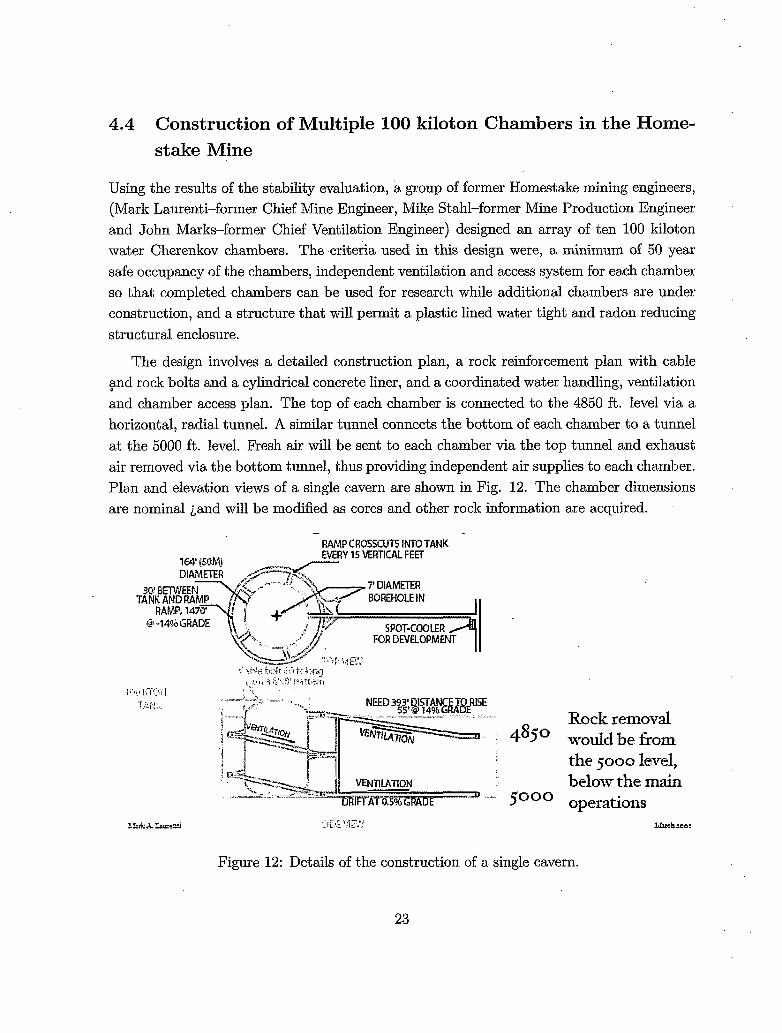
4.4 Construction of Multiple 100 kiloton Chambers in the Home- stake Mine
Using the results of the stability evaluation, a group of former Homestake mining engineers, (Mark Laurenti-former Chief Mine Engineer, Mike Stahl-former Mine Production Engineer and John Marks-former Chief Ventilation Engineer) designed an array of ten 100 kiloton water Cherenkov chambers. The criteria used in this design were, a minimum of 50 year safe occupancy of the chambers, independent ventilation and access system for each chamber so that completed chambers can be used for research while additional chambers are under construction, and a structure that will permit a plastic lined water tight and radon reducing structural enclosure.
The design involves a detailed construction plan, a rock reinforcement plan with cable 9nd rock bolts and a cylindrical concrete liner, and a coordinated water handling, ventilation and chamber access plan. The top of each chamber is connected to the 4850 ft. level via a horizontal, radial tunnel. A similar tunnel connects the bottom of each chamber to a tunnel at the 5000 ft. level. Fresh air will be sent to each chamber via the top tunnel and exhaust air removed via the bottom tunnel, thus providing independent air supplies to each chamber. Plan and elevation views of a single cavern are shown in Fig. 12. The chamber dimensions are nominal Land will be modified as cores and other rock information are acquired.
RAMP CROSSCUTS INTO TANK N E R Y 15 VERTICAL FEET
7' DlAM€TER BOREHOLEIN 30' B
TANK RA
Q -1f MP iej
Rock removal would be &om
below the main operations
the p o o level,
LLmh:oo:
Figure 12: Details of the construction of a single cavern.
23

In Fig. 13 and Fig. 14 we show the sequence of steps involved over a four year period in the excavation of one chamber. Our plan is to excavate a group of three chambers at once. An equipment maintenance room will be constructed alongside the top access tunnel. After construction of the three chamber group is completed, this room will be converted into an electronics and water purification facility that serves this three chamber complex.
Two 2.4 meter diameter vertical bore holes will be constructed between the upper and lower tunnels. One of these bore holes will be outside the chamber and the second in the center of the chamber. The bore holes serve three purposes. One, they complete the air flow path between the fresh air input of the upper tunnel and the exhaust of the lower tunnel. Two, they provide a drop path for excavated rock to the lower tunnel for removal. Three, the bore hole in the center of the chamber provides an expansion region for blasting of rock. By blasting rock inward from an ever expanding set of concentric circles, we will avoid fracture of the outer rock walls that will serve as the chamber containing walls.
Removing waste rock and associated rock dust via the bottom air exhaust tunnel, will prevent rock dust from one chamber contaminating the fresh air supply of another chamber. Once construction is completed, the bottom chamber to tunnel connection will be sealed.
Once the access tunnels and bore holes are completed, construction of the dished dome of the chamber will begin. The first step is to excavate a 53 meter diameter by 3 meter high section. 80 ft. long vertical cable bolts will be installed into the roof of this excavation as that work proceeds. Once this section is completed, the excavation will be extended upward to form the dome. As this domed excavation progresses, some of the 80 ft. cable bolts will be cut. When completed, the dome will have 60 ft. cable bolts in the center and longer cable bolts at larger radii with 80 ft. cable bolts along the outer edge of the dome. The stress
, diagrams in the diagrams in calculations of Tesarik, Johnson, and Zipf [34] indicate that the regions of greatest stress are along the outer region of the dome, where the cable bolts are the longest.
Once the central chamber access tunnels and boreholes are completed, work on the two side chamber access tunnels and bore holes can begin. This work will be done in parallel with the construction of the dome of the central chamber. Thus, once the central chamber dome is finished, about one year after beginning of construction, we will be ready to begin the domes on the two side chambers. This parallel construction mode with the side chambers several months behind the central chamber allows efficient use of equipment and personnel while at the same time permitting us to test the construction plan on the central chamber before employing it on the two side chambers. This overall construction procedure will result in one completed chamber in four years with the two side chambers available a few months
24
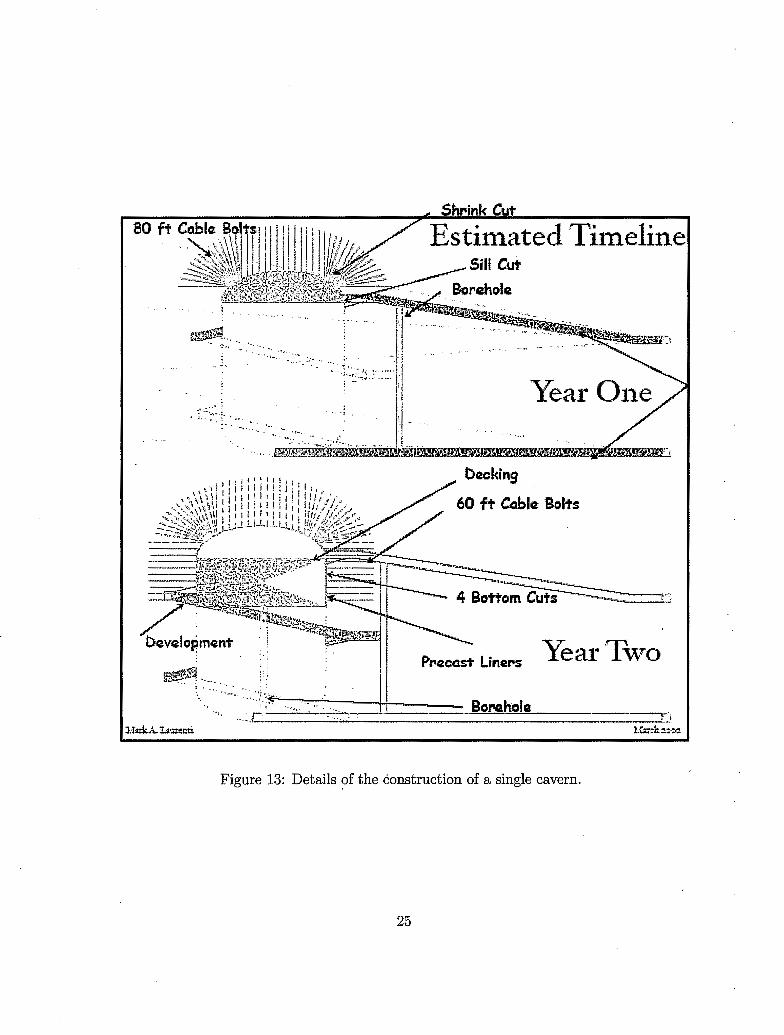
Figure 13: Details of the Construction of a single cavern.
25

Figure 14: Details of the construction of a single cavern in year 3 and 4.
26

later.
In year two, we will begin on the main, vertical cylindrical section of the central chamber. There will be a series of 3 meter high cuts of a 53 meter diameter section, essentially the same size as the initial cut. These cuts will be made much faster since there is no need for vertical cable bolting. Each of these cuts consists of three steps.
The first step is to drill downward holes for explosives and then to set off these explosives. By using a concentric circular layout and by staggering the firing of these explosives, the rock will be blasted toward the open central borehole region and minimize outward shock waves. In addition, we plan to drill a series of vertical holes along the cylinder boundary to prevent outward transmission of shock waves and resultant fracturing of the cylinder walls.
The second step is to move the blasted rock fragments into the two boreholes so that they can fall to the bottom. Front end loaders in the bottom tunnel will move the broken rock to the rock dump near the shaft for hoisting.
The third step is to install horizontal, radial 60 f t long cable bolts into the cylindrical rock walls and immediately thereafter install the precast concrete liner sections. These liner sections will be bolted into the rock and will dovetail into each other. The joints between liner sections will be grouted so that the inner surface is smooth. Finally, we will spray on a layer of Mine Guard, a polyurethane coating that will serve as a inhibitor of radon flow from the walls and simultaneously a very smooth and low friction surface for the water tight plastic liner that will be installed at the end.
Each 3 meter high cut will take 10 weeks, 3 weeks for the blast hole drilling, 3 1/2 weeks for the rock removal and another 3 1/2 weeks for cable bolt installation. The concrete liner installation will overlap the cable bolt and.next layer blast hole drilling. By staggering these activities by about 3 weeks between each of the three chambers, we can utilize three specialized crews, one for each of these tasks, and move them from one chamber to the next. In addition, since separate equipment is used for each of these three tasks, we efficiently utilize the equipment and avoid having it stand idle for 2/3 of the time.
In order to permit horizontal entrance into the excavation region for each of the three meter high cuts, we will build a spiral ramp around each chamber. Each cut will consist of a horizontal entry into the chamber region from this ramp. Once a given layer is
completed, the entry cut will be sealed with a concrete plug. These ramps will permit machinery to easily move from one chamber to another or to the maintenance area and will provide a path for moving some of the blasted rock to the outside bore hole. At the end of the chamber construction process, these spiral ramps will serve as secondary ventilation links between the input and exhaust air systems and provide convenient local access to the
27

bottom of each chamber. For example, we can carry out water purification by withdfawing water from the bottom of the detector, pumping it up through a pipe in the spiral ramp to a purification system at the top and then returning it to the top of the chamber.
The chamber will have an outer circular walkway at the top of the chamber and a central gridwork that will be suspended from the upper dome cable bolts. Both of these will be installed at the time the top cylinder cut is made. The walkway will provide access to the upper ends of the side wall photomultiplier arrays. The top gridwork will provide a mounting platform for the top layer of photomultiplier tubes as well as access for various calibration equipment.
The final chamber construction task will be the installation of the inner plastic liners. The conventional procedure is to use two liners, one a geotextile that serves as a cushion and also an inner fused water tight liner Each of these materials are supplied on rolls. We plan to mount the end of each roll against the rock along the upper walkway and then gradually lower the roller and so unroll the material along the vertical side of the cylinder. The geotextile layers will be unrolled so that there is a butt joint between adjacent layers. A tape seal will then be applied to these joints. Access will be via a bosun chair suspension from the walkway. Once the geotextile layer is complete, the waterproof layer will be lowered. In this case, we will use an overlap joint which will then be heat sealed, again via the bosun chair suspension.
The plastic liners along the bottom will be extensions of the side liners. Before being brought into the mine, the bottom section of each roll will be cut into a triangular shape to conform to the bottom. We may add an additional bottom plastic overlay to insure that this section is truly water tight. It is worth noting that this multi-layer water tight construction is conventionally used to seal the bottoms of reservoirs and other bodies of water.
4.5 Construction Timetable and Cost
Mark Laurenti has worked out a detailed timetable and budget for the construction of these chambers including initial rock evaluation coring, construction of both top and bottom access tunnels, removal of waste rock,' maintenance of mining equipment, etc.
The excavation process consists of continuous repetition of three separate tasks (1) drilling and blasting of rock, (2) removal of the rock rubble, and (3) installation of rock and cable bolts to stabilize the freshly exposed rock walls. Each excavation cycle is about 10 weeks with 3 weeks for each of the above three steps. There is a cost savings in excavating three chambers at the same time, with a three week phase shift between steps in each module.
28

4.6 Rock Removal
Each 100 kiloton chamber (105m3) will involve the removal of about 419,600 tons of rock including access tunnels, domed roof, etc. For three chambers this results in 1,258,800 tons of rock in 4 years or 314,700 tons of rock per year. Since the hoisting capacity of either the Yates or Ross shaft system is 750,000 tons per year, the simultaneous construction of three chambers utilizes only 40% of the capacity of one of the two existing shaft systems. The Lab oratory has identified a number of nea.rby rock disposal sites. Disposal costs per chamber are expected to be of the order of $1M, which were included in the numbers in the previous section.
4.7 Equipment Cost
Since all mining equipment has now been removed, new mining equipment will have to be purchased or leased. The required equipment, one Face Drill, two LHD loaders, 2 Bolters, 2 Underground Support Vehicles, 2 Lift Trucks, 1 LH Drill and 2 ITH Drills, costs about $5 M. It may be possible to arrange for leases instead of purchasing these items. Normal equipment maintenance has been included in the construction cost. The cost of this equipment should probably be assigned to this specific task; it will be used full time during the construction period .
29
This arrangement permits each of the three specialized crews to move from one excavation to the next every three weeks or so and continue using the same equipment and carry out their specialized tasks. In contrast, using one crew to sequentially do three different tasks will result in idle equipment for 2/3 of the time and inefficiency as they switch from one task to another.
For the three chamber mode, the cost of excavating each chamber in 2002 was $14.7M per chamber. We have adjusted that by the standard inflation index and other factors to $22M. This includes $3.6M for the concrete liner and a 30% contingency. In contrast, the cost of excavating a single chamber in 2002 was $19.1M including liner and contingency (See Table 2). Again, we have adjusted that by the standard inflation index and other factors to $29.1M. The total required equipment cost is the same for both of these construction modes.
Assuming three shifts/day and 5 days/week operation, it will take 208 weeks or 4 years to excavate each 3 chamber group. This time could be reduced by going to a 6 or 7 day week. The Homestake Company frequently operated on a 6 or 7 day per week basis.

4.8 Choice of Depth
There has been considerable discussion of depth necessary for very large detectors and the costs associated with deep detector locations. It is clear that the deeper the detector, the lower the cosmic ray muon and associated particle background. It is always preferable to have lower background. The measured cosmic ray muon flux at the 4850 ft level is 4 muons per square meter per day. This corresponds to roughly 0.1 Hz for a single 100 kton detector module. The beam pulse from FNAL (BNL) will be 10 psec (2.5 psec) long. This results in less than one cosmic ray muon per year going through one of the chambers during the "neutrino beam on time" from FNAL. This insures that any signal seen during the beam on time is due to the interaction of an accelerator neutrino. No special pattern recognition (to measure event directionality) or veto shield is required. We anticipate considerable gain in neutrino event efficiency factors and perhaps in fiducial volume.
4.9 Summary of Section 4
A detailed construction plan for the construction of three 100 kiloton chambers in four years at the 4850 ft. depth in the Homestake Mine has been developed. The total construction cost of the three chambers is about $66.1M or$l6.5M/year, as shown in detail in section 4.4. This includes a one time purchase of about $5 M worth of mechanized mining equipment. The lead time in delivery of the mining equipment can be used to carry out coring of the rock region in which the detector array is to be constructed.
In the next section we turn to the details of construction and cost of one chamber of the array of chambers in the absence of the detector that fills the chamber. A single chamber 50 m in diam x 50 m high is a taxing mining engineering accomplishment. We concentrate on a single one without detector components, which are discussed later, because we want to keep separate in our planning the large scale mining operations-a 50 meter high structure (even without dome) is the rough equivalent of a twelve story building-which are less familiar to us.
5 Design and Cost of One Chamber and Projected Cost of Multiple Chambers
Our ultimate goal, the construction of a detector with a total mass of a megaton, can be best achieved by constructing 10 separate 50 meter diameter-by 50 meter high (100 kiloton)
30
cylindrica.1 chambers. In this section we consider the plans and the cost of constructing one such chamber, a 3 chamber system, and the 10 module megachamber system.
Total Labor & Benefits Total Equipment Operation
5.1 Single Chamber Construction Costs
$5,506,656 1,297,210
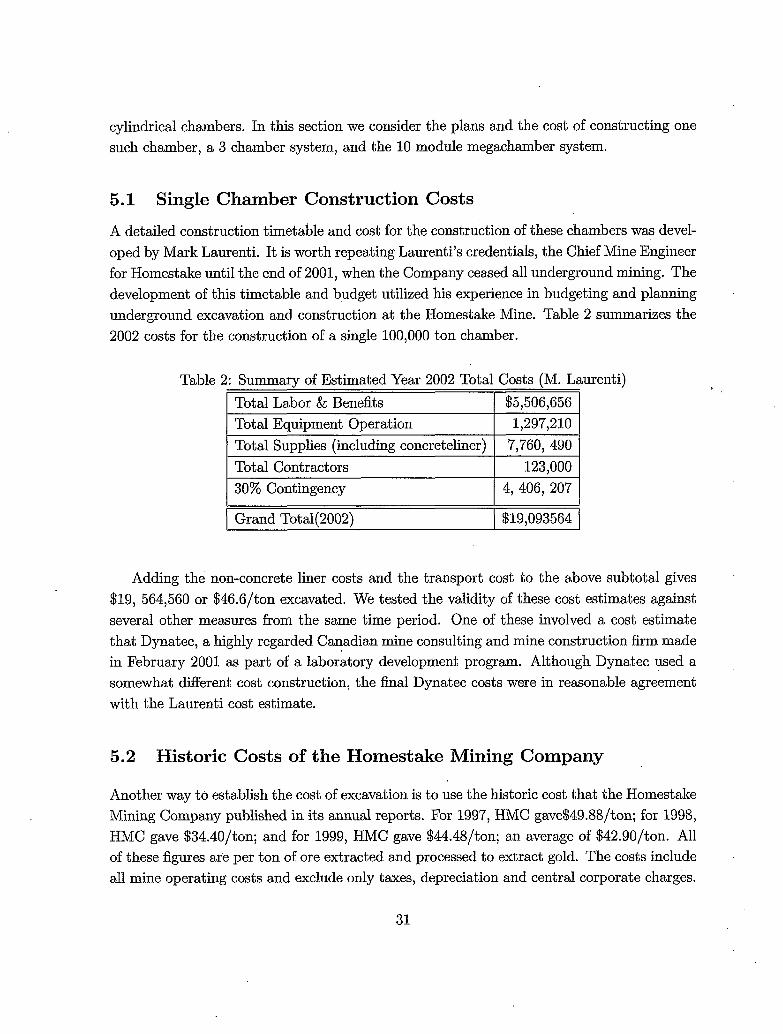
A detailed construction timetable and cost for the construction of these chambers was devel- oped by Mark Laurenti. It is worth repeating Laurenti’s credentials, the Chief Mine Engineer for Homestake until the end of 2001, when the Company ceased all underground mining. The development of this timetable and budget utilized his experience in budgeting and planning underground excavation and construction at the Homestake Mine. Table 2 summarizes the 2002 costs for the construction of a single 100,000 ton chamber.
Total Contractors 30% Contingency
Grand Total(2002)
123,000 4, 406, 207
$19,093564
I Total Supplies (including concreteliner) 1 7,760, 490 1
Adding the non-concrete liner costs and the transport cost to the above subtotal gives $19, 564,560 or $46.6/ton excavated. We tested the validity of these cost estimates against several other measures from the same time period. One of these involved a cost estimate that Dynatec, a highly regarded Canadian mine consulting and mine construction firm made in February 2001 as part of a laboratory development program. Although Dynatec used a somewhat different cost construction, the final Dynatec costs were in reasonable agreement with the Laurenti cost estimate.
5.2 Historic Costs of the Homestake Mining Company
Another way to establish the cost of excavation is to use the historic cost that the Homestale Mining Company published in ,its annual reports. For 1997, HMC gave$49.88/ton; for 1998, HMC gave $34.40/ton; and for 1999, HMC gave $44.48/ton; an average of $42.90/ton. All of these figures are per ton of ore extracted and processed to extract gold. The costs include all mine operating costs and exclude only taxes, depreciation and central corporate charges.
31

Thus, these figures include the cost of gold extraction from the ore, charges for mine operation such as ventilation, general mine maintenance, mine operation overhead, etc. The costs also include charges for exploratory work in looking for additional gold deposits, the removal of waste rock required to access the gold ore, etc. A year in which there was little exploratory work or waste rock removal would have a low cost per ton while one in which there was significant such effort would have a higher cost per ton.
of costs given above, well within the uncertainties of both numbers. Given these considerations, the historic HMC costs are in agreement with the summary
5.3 Final Total for Cost of Construction of the First Chamber.
To the best of our understanding, the total 2002 cost of $19,093,564 for the first chamber- including a 30% contingency-is well-documented as indicated by Table 2. The detector components and the funding rate to produce a complete detector module will be extra and we turn to them in section 6.
5.4 Costs and Schedules for Multi-Chambers
5.4.1 Three Chambers
We plan to finish three chambers four to five years after the initial funding becomes available. This can be done either by starting to excavate three chambers at the same time in the first year, or somewhat more conservatively by carrying out excavation of a single chamber during the first year to gain experience, and then proceeding to the second and third chambers as well as continuing with the first.
5.4.2 Three Chamber Construction Cost
As pointed out above, the chamber excavation procedure consists of three approximately equal duration tasks, blast hole drilling and blasting, blasted rock removal and installation of rock support cables and concrete liner. Each of these tasks requires specialized equipment and specific work skills. In the construction of a single chamber, equipment is idle 2/3 of the time and the mine crew switches from one task to the next every three weeks or so. Both of these situations lead to inefficiency in chamber construction and so higher construction costs. There is an additional a factor, the ratio of supervisory and equipment maintenance personnel to miners.
32

Table 3: Comparison of single chamber versus three chamber cost , Estimated Costs ($MM)
Labor & Benefits # Of Chambers 1 3
$5.51 $10.94 I Mining and Construction I I I I
Equipment Operation Supplies
$1.30 $3.89 $4.51 $13.35
I Precast Concrete Liner I I $3.25 I $9.75 I Other (Outside Contractors) 30% Contingency
$0.17 $0.52 $4.40 $11.48
TOTAL(2002) $19.1 $49.93 I TOTAL(2007) I$29.1 I $66.1 I
By constructing three chambers at once with a phase shift between operations in each chamber, we can avoid these inefficiencies. Now, we would have three separate crews, one for each of the above sub-tasks. After the blasting crew drills the blast holes and blasts the next rock layer in the first chamber, they would immediately move on to the second chamber and do the same there. At the same time the rock removal crew would move into the first chamber. About three weeks later, the blast crew moves to the third chamber, the rock removal crew to the second chamber and the wall support crew into the first chamber. Each crew would become expert in its specific tasks and might be able to reduce the time required to carry them out. In either case we anticipate a yearly expenditure rate of approximately $16 - 20M for the first five years of operation which includes $5.0M for the purchase of the required mining equipment. See Table 3 which compares single and three chamber construction costs.
5.4.3 Continued Chamber Construction
The next three chambers can be started, all at the same time, during the final year of work on the first three chambers. With this excavation schedule, it is likely that installation of a Cherenkov detector in at least one chamber ca.n begin four years after the start of the excavation process, with other installations following soon after, depending on the flow of funds and photomultiplier achieve completed physics
tubes (PMTs). The feasibility of doing much of the work to modules is the result of the layout of the individual modules
33
shown in Fig. 11, in which the spacing between adjacent modules, 450 ft., is sufficient to allow excavation of one chamber at the same time as work on liners or structures to support PMTs is carried out in other chambers.
In any event, we expect to have at least three chambers ready for experiment five years after the start of the program and perhaps five, modules ready for experiment at the end of seven years.
6 Design and Cost of One Module of the Cherenkov Detector
There exists considerable experience in designing and constructing the detection systems of large water Cherenkov and other neutrino detectors: in 1978, at BNL, a system with 13,000 proportional drift tubes (PDT) for tracking and 4,000 PMT for calorimetry [38]; in 1983 for a long baseline neutrino experiment at BNL [39]; in 1986 for the Kamiokande-I1 detector in Japan, the electronics and DAQ for a system of 1,000 20 inch PMT [40]; and in 1997 for the Sudbury Neutrino Observatory, a system of 9,500 PMT and DAQ [30]. And of course, there is the accomplishment of Super-Kamiokande [29].
The Cherenkov detector to filI a chamber at Homestake is similar in its essentials to Super Kamiokande and SNO; it is composed of detecting elements-photomultiplier tubes (PMTs) ; the PMT supporting mechanical structures; associated electronic and DAQ systems; the calibration systems; and the water purification system. Here we outline the technologies and show preliminary cost estimates for each of these systems. It is important to note that all of these technologies are well understood, there are no new or unusual developments required, and the draft designs and costs are based upon experience with successful prior detectors.
6.1 Photomultipliers
The core of an imaging Cherenkov detector is the array of PMTs. The complexity and cost of the detector depend largely on the total number of PMTs while the the total photocathode coverage determines energy resolution as well as the energy threshold; the timing performance and the density of the PMTs largely determines the reconstruction accuracy. Therefore PMT selection is critical to the affordability and to the sensitivity of the final detectors. Clearly much work needs to be invested in the many details of actual PMT procurement, nevertheless it is possible to make a reasonable estimate based upon experience and recent contacts with
34

possible manufacturers.
Because the cost per unit area of photocathode declines somewhat with larger PMTs and the cost of many of the supporting systems like cables and electronic channels declines directly with smaller numbers of PMTs, it is sensible to think of relatively large diameter PMTs. The very largest devices, the Hamamatsu 50 cm tubes, have, however, a significant mechanical disadvantage in terms of stored energy versus envelope strength as demonstrated in the SuperKamiokande accident. Therefore we have chosen to base our estimates on tubes of about 25 cm diameter. Hamamatsu, R7081, Electron Tubes, 9360KB, and Photonis, XP1807 photomultiplier tubes are in this class, all with specified performance superior to the tubes used in the previous generation of large water Cherenkov detectors. For example, the XP1807 claims a quantum efficiency of 24% at 420nm and a Transit Time Spread of 2.4ns FWHM. Recent measurements of prototype tubes at support these numbers.
The fine tuning of the PMT coverage and the granularity, which determines the best size of the PMT, must await detailed Monte Carlo simulations. But based on simple estimates of light yield and past experience we can make a good first design. The energy threshold of the detector is determined by the total coverage. For 25% coverage, a 5 MeV electron should give a signal of N 25 photo-electrons. This is sufficient for good detection efficiency if the radioactivity background can be controlled. The light yield number will be lower for a 5 MeV gamma ray because of the energy lost in Compton scattering. The detection efficiency for - 6 MeV gamma is important for the proton decay mode p + k+P tagged by a 6 MeV de-excitation gamma of about 6 MeV. Therefore the total photo cathode coverage of 25% or greater is set by the need for a 5-6 MeV threshold. The granularity is set by the need for good pattern recognition to reject background events with multiple particles and select good electron neutrino interactions. Work reported in [17] indicates that higher granularity will be important for this purpose. A 1-2 GeV muon will multiple scatter in water to give an additional 1 to 2 degree scatter to the Chrenkov photons. Therefore, the choice of PMT granularity to match this multiple scattering limit will give us the best possible performance for pattern recognition for this type of detector. This corresponds to spacing of about 1 meter for a fiducial radius of 25 m.
For this estimate we use a total photocathode coverage of 25% which implies ~50 ,000 PMTs per 100 kT module. The cost used in the total PMT estimate is scaled from the 20 cm tubes used in SNO and is not based on manufacturer’s quotations. Nevertheless, all manufacturers have accepted, in principle, that the estimate of $800 per PMT is not unrealistic. To this $800 number we add an additional 10% for the PMT testing costs plus the cost of the base and the waterproofing that surrounds the base.
35
We make the further assumption that at the planned depth of the chamber it will not be necessary to have a sophisticated anti-counter (see Figure 1) and have allowed only for a few meters of water at the top and bottom of the cylinder to be optically isolated and equipped with a small number of anticounter PMTs looking up or down. This is similar to the SNO approach where only 91 PMTs are used to observe the outer light water volume.
6.2 Mechanical Structure
The individual PMTs must be fixed in well known locations evenly distributed across the interior surface of the 50 m by 50 m cavity. To do this, a mechanical structure must be designed and installed. There are a number’of suggested schemes for achieving this mounting, but‘ not yet any engineered plan. Therefore we estimate this system cost on general grounds. The SNO mechanical mounting was for a spherical surface, much more complex than the simple cylinder of this detector, and therefore not a good cost model. The SK scheme is plausible for this case, but we do not have access to their cost data. Including installation labor, a simple model gives about $165 per PMT total cost for the structure.
6.3 Electronics and DAQ
The basic SNO electronics system has performed nicely and that architecture should work well for the detector proposed here. However, the custom integrated circuits were manufac- tured in processes that are no longer available and many of the commercial parts are obsolete or obsolescent so a redesign in detail will be necessary. This will also present an opportunity to remove some of the minor flaws of the SNO implementation.
.
The SNO production and development costs are well documented and we have scaled for inflation to arrive at a per PMT cost of about $120 for front end electronics; trigger system; low voltage power; and high voltage power. The development costs are taken as the same number of people-years required for the original SNO system plus silicon chip and printed circuit prototyping costs.
The DAQ system involves largely development, but there is a small cost for the comput- ers needed for data recording; on line monitoring, for slow controls (largely environmental controls); and miscellaneous networking and GPS interfaces. These add a fixed cost per module of about $75k. The DAQ development costs are assumed similar to SNO’s at about five people-years.
36

6.4 PMT Cables and Connectors
The cable running from each PMT to the electronics, presumably located around the periph- ery of the module above the water surface, is a significant cost item. For a 50 m diameter x 50 m high detector and equal length cables to allow. an isochronous trigger, each cable needs to be at least 70 m long. High quality waterproof transmission line similar to that used in SNO costs about $0.50 per meter to which one must add the assembly and testing costs and the connectors.
It is possible to imagine for the right circular cylinder geometry of a module that it would be possible to eliminate a wet end connector and simply pot the cable and base as a unit. For conservatism, and because there are unknown installation costs associated with pre- attached cables, we have assumed a wet end connector with full waterproofing for a total assembled cable cost of about $77.
6.5 Calibration Systems
The absolute energy calibration in the GeV range is necessary for the program we have proposed here. Super-Kamiokande has demonstrated energy scale calibration at - 2.5% [29]. We would like to accomplish approximately a factor of 2 better than this. The energy calibration in the MeV range is also important for other physics. A number of levels of calibration are required of an imaging water Cherenkov detector. The most basic level is a series of electronic calibrations of charge and time in well defined units, which is included in the electronics costs above. However, it is also necessary to have an optical calibration system to define a common time reference and to measure the optical properties of the detector. We choose a fast, multi-wavelength laser source and a diffusing ball capable of being moved through a large fraction of the total detector volume. Finally, one needs handles on actual energy scales. The peak at the end point of stopped muons is 53 MeV. At least one other energy point is needed to give the slope of the energy calibration curve. It is useful to consider the Super Kamiokande scheme of a small electron accelerator to provide a versatile calibration source-this is especially attractive if it can be shared amongst all the modules. We include a laser system; a source positioning apparatus; and a neutron generator and decay chamber for one nuclear source as a development cost to arrive at a total of about $400k for calibration systems.
37
6.6 Water Purification and Cooling
The water system is modeled on the SNO light water system which has produced water of exceptional cleanliness and low radioactivity. For costing purposes we have simply scaled the SNO costs by one half the volume ratio on the assumption that we would require the same level of transparency as SNO - greater than 200 m in the region between 350 and 450 nm (very near the Rayleigh limit). This implies that we would want to have the same level of sophisticated reverse osmosis and filtering equipment and would want to maintain nearly the same rate of turnover.
In addition to the purification system, we also require the water to be degassed to inhibit biological activity and cooled to further inhibit biology and to keep the PMT noise rates low. The degasser is included in the SNO costs as are the heat exchangers. As the SNO costs also include plumbing from a (closer) chiller station, we have simply scaled those costs by our factor of seven (one half of the volume ratio of 14) to get $4.5M. A full design effort will probably reduce these estimates.
6.7 Summary of Detector Module Costs
Development Costs for the major detector systems are extrapolated largely from the SNO cost history with which we are well acquainted. These costs, which will be shared among three modules, are estimated at $3.OM including inflation. Some of the tasks require professional engineering while some (e.g. DAQ systems) are largely physicist tasks.
Procurement Costs for module hardware we estimate $5M, $4.5M is for the water pu- rification and distribution system, and $0.4M for calibration.
Production Costs for the items directly in the photomultiplier chain total approximately $1,242 per PMT. This estimate includes assembly and quality assurance labor as well as the final installation labor. For 25% PMT coverage of the total 11, 000m2 area of a single module, the number of PMT required is approximately 50,000 costing $62.1M.
Thus for the three modules, we have a total detector cost, including all development, procurement and production costs, of about $194.2M. Applying a 25% contingency to the non-excavation costs (a separate contingency was already applied to excavation) gives a total cost of about $242.7M. This cost is dominated by the per PMT production costs. Clearly, it behooves us to do what can be done to reduce the cost per PMT. We have suggested to
38
several PMT manufacturers that potential sales of at least 150,000 PMT might pay for the construction of a PMT manufacturing plant near the Homestake Mine. They responded that this could result in substantial savings on component delivery costs, testing and reworking of finished PMT, tax relief, etc. If funds for this proposal were to become available, further discussion along this line might proceed profitably.
6.8 Final, Overall Cost of Three Detector Modules (including ex- cavation of underground chambers)
From section 5 , the estimated cost of excavation and completion of three underground chambers will be $66M (including 30% cost contingency). Hence the total overall cost of the first three-tenths of a megaton detector is $308.85M,, to be spent over five to six years in which the first 4 are for cavity construction.
.
7 Broadband Neutrino Beam to DUSEL
As mentioned above, the accelerator neutrino beam will be produced by one of the hadron accelerating laboratories, BNL and Fermilab, and consequently will be their responsibility. Nevertheless, a few comments on the subject here may be useful.
Our initial plan to study neutrino oscillations and search for CP violation is based on a wide band neutrino beam generated by 30 to 60 GeV protons incident on a target to produce pions and kaons focused by a magnetic horn; such neutrino beams with a power between 0.3-0.7 Megawatt could be available at both laboratories. A plan to re-steer the proton beam, provide a new horn and target system, and a new meson decay path has been developed at BNL (for the cost and schedule see 1211). A plan to create a beam at FNAL is being devised at part of the joint FNAL/BNL effort. Some initial results of these studies are in figures 15 and 16 [41, 421. The beam from either laboratory will yield data on neutrino oscillations and thus information on the neutrino mass hierarchy, on the mass effect and on dcp will be obtained, as outlined in Figs. 2 to 7. As always, atmospheric neutrino data and proton decay data will also go forward.
Clearly, increased neutrino beam power will be an advantage in obtaining measurements of neutrino oscillations and of dcp. This can be accomplished with high proton intensities on the target, but a target able to sustain higher proton intensity must be developed. Targets of 2 megawatts are curently contemplated and there is active joint FNAL/BNL effort to understand the properties of possible new target materials and geometries.
39
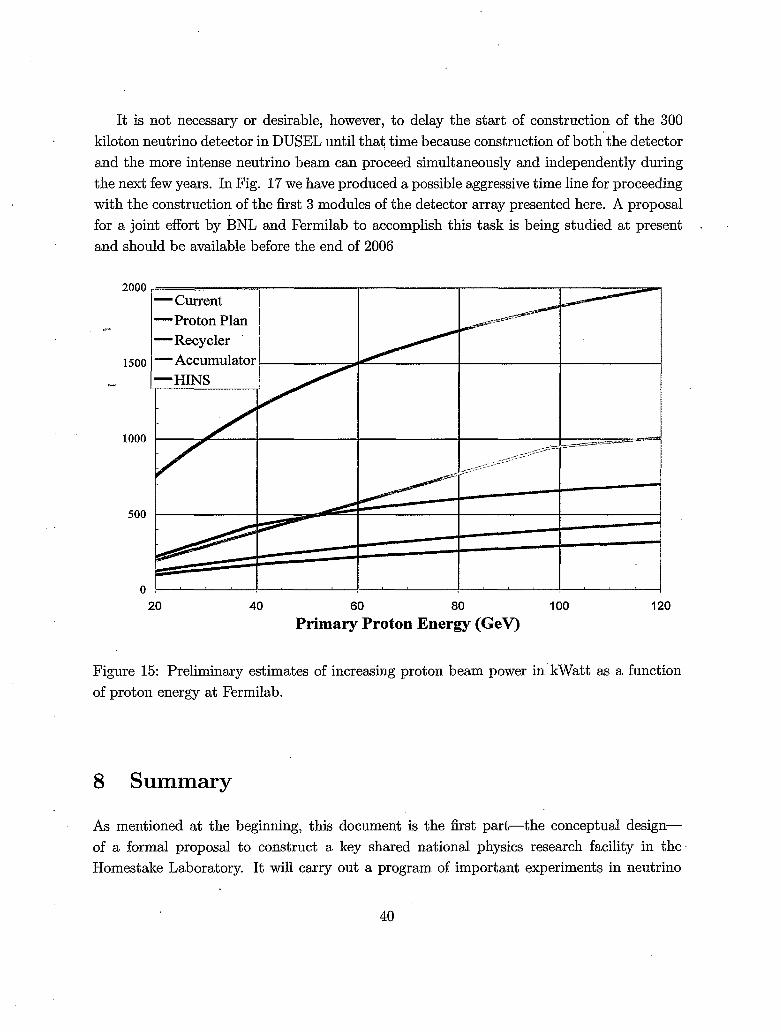
It is not necessary or desirable, however, to delay the start of construction of the 300 kiloton neutrino detector in DUSEL until that time because construction of both'the detector and the more intense neutrino beam can proceed simultaneously and independently during the next few years. In Fig. 17 we have produced a possible aggressive time line for proceeding with the construction of the first 3 modules of the detector array presented here. A proposal for a joint effort by BNL and Fermilab to accomplish this task is being studied at present and should be available before the end of 2006
2000
"--
1500 -
1000
500
0
Figure 15: Preliminary estimates of increasing proton beam power in'kWatt as a function of proton energy at Fermilab.
8 Summary
As mentioned at the beginning, this document is the first part-the conceptual design- of a formal proposa.1 to construct a key shared national physics research facility in the Homestake Laboratory. It will carry out a program of important experiments in neutrino
40

Figure 16: Preliminary drawings of locating a 400 km long decay tunnel for a new neutrino beam to DUSEL at either Homestake or Henderson facilities.
41
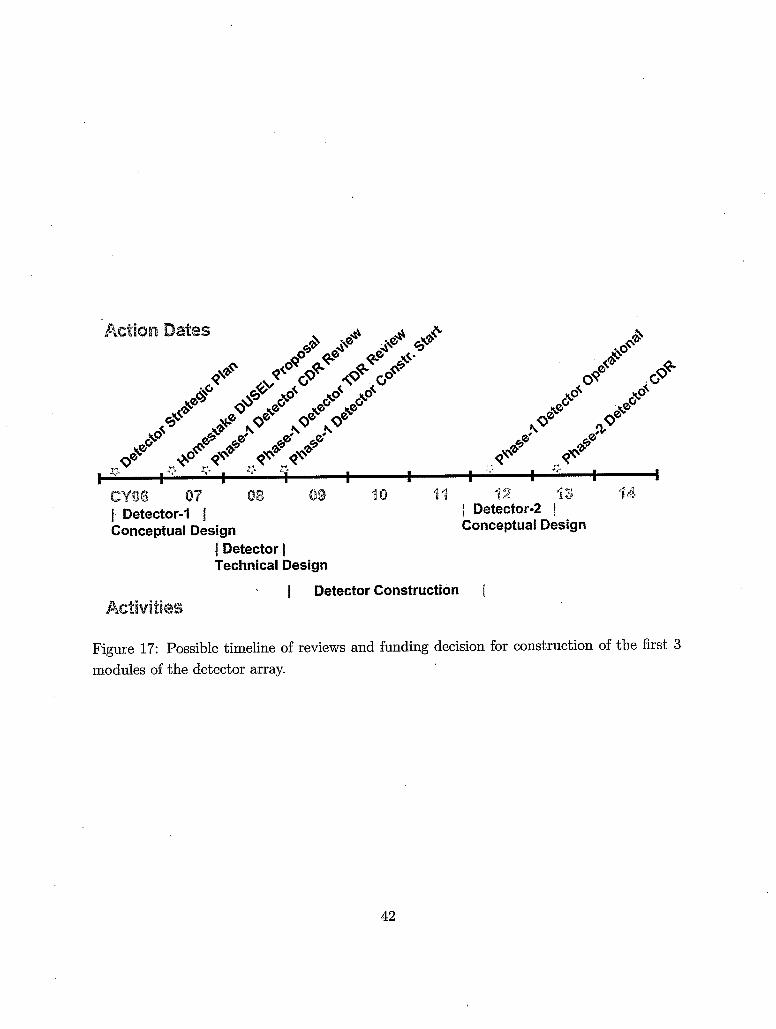
I Detector-2 I 1 Detector-I Conceptual Design Conceptual Design
I Detector 1 Technical Design
I Detector Construction 1
Figure 17: Possible timeline of reviews and funding decision for construction of the first 3 modules of the detector array.
42
physics and other elementary particle physics. The proposal described here is primarily for a program of measurements to be done in the facility utilizing neutrino beams far from their accelerator origin to study fundamental features of the lepton sector of elementary pa.rticles. The laboratory and the experimental apparatus constitute the basis of a plan of considerable ambition and cost, but all aspects of the plan-including that for the accelerator-generated neutrino beams-have survived severe scrutiny concerning scientific potential, feasibility, and cost.
We have attempted to indicate an approximate schedule of events in the progression from the Homestake Mine to the Homestake Laboratory to the construction of a massive neutrino detector in the'Laboratory. Our vision of that schedule is summarized in Fig. 17.
The other measurements and searches of importance-including the search for proton decay-will be done independently and at the same time that the neutrino oscillation and CP-invariance measurements are in progress, The former do not require an accelerator- generated neutrino beam. They are discussed here briefly for completeness, but will be covered in more detail in the second part-the technical design-of the proposal. The present part concentrated on the overview of the program, and the array of imaging water Cherenkov counters; those counters and their underground accommodations, which are described at length here, are at the heart of the proposal.
The difficulty of the proposed experiments is surpassed only by the importance of the questions they seek to answer. These demand high statistical precision and high signal to background discrimination to guarantee clarity and unambiguity in the interpretation of the results.
The quality of the facility at the Homestake Laboratory and the opportunity to use it to pursue fundamenta.1 physics for many years will make Homestake one of the dominant centers of experimental particle physics in the world.
43

Appendix 1. Further comments on preservation of fiducial volume and opti- mizing the size of the cavern at 4850 ft
Added on June 30, 2006 after comments from the NUSAG committee.
The fiducial volume for the detector will clearly depend on the eventual optimization of both the photomultiplier hardware structure as well as the software cuts for reconstructing the events of interest. It also depends on the scientific focus of the detector. Before expand- ing on the ideas we will first examine what was done for Super Kamiokande [29]. Super Kamiokande cavity has a stainless steel tank that is self-supporting with concrete backfilled against the rough-hewn stone walls. The dimensions of the tank are 39 m in diameter and 42 m high, corresponding to >50.0 kTon mass. Inside this tank is a cylindrical PMT support structure with inner dimensions of 33.8 m diameter and 36.2 m high. This structure contains -32 kTon of water and it divides the volume into an inner detector and an outer detector, which is used both as a veto for incoming particles and a passive shield against neutrons and gammas from the rock. Such a passive veto volume is necessary for suppressing background to very low energy events from solar neutrinos. For the reconstruction of most physics events the Super Kamiokande collaboration makes the requirement that the event vertex be >2 m away from the wall of the inner detector. This final requirement brings the fiducial volume to -22 kTon.
Although, in much of the proposal above we have made detailed estimates for a 50 m diameter and 50 m high volume of water and the cavity that holds it, we are cognizant of the fact that the exact dimensions of the cavity will depend on a detailed optimization concerning the thickness of the veto volume, and the dimensions of the phototube mounting apparatus. Our intention is to preserve the 100 kT fiducial as well as we can without creating engineering requirements that are more difficult than the ordinary.
We were surprised in the interest in the fiducial volume of our detector modules and the exact mounting location of our photomultiplier tubes. The plan for the excavation presented above will create stable water-tight cavities, 50 m in diameter and 50 m high that have a good inner surface lined by concrete. We are focused on 11 inch, 28 cm, diameter tubes such as Electron Tube 9360KB or Photonics XP1807. Both of these tubes are approximately 30 cm long, from the peak of the photocathode window to the base. We are considering supporting the tubes at their widest point about 12 cm from the peak of the photocathode window or 18 20 cm from the base. Connecting the mount at this position rather than at the base eliminates the torque at the tube neck associated with the buoyant force on the spherical region of the tube and the lever arm to the tube base. That is particularly significant for tubes near the bottom of the detector, 50 meters below the water surface or at a pressure of
44

5 atmospheres.
Our preliminary plan is to have the peak of the photocathode window about 50 cm from the chamber wall. That puts the PMT support point about 38 cm from the chamber wall. We could easily attach a TYVEK partition to the support structure and thus create a 38 cm wide, optically isolated veto region as suggested by Peter Meyers, without having any effect on the fiducial volume. A similar optically isolated region at the top and bottom are easily achieved without any effect on fiducial volume.
For long baseline physics we are interested in relatively high energy events (> 500 MeV). For such events it might be sufficient to have a relatively thin veto region and an aggressive fiducial cut with a boundary 1 meter inward from the photocathode window or 1.5 meters from the cylinder wall. Clearly this must be confirmed by detailed simulations that will be performed as we design this detector. Nevertheless, such a cut leaves a 47 meter diameter fiducial volume. In order to maintain a 100 kiloton fiducial volume, that requires a 57 meter fiducial region height instead of the stated 50 meter height. In the cavity design there is much lattitude in the vertical direction. For the bottom we have about 15 meters of water beneath the lower PMT layer that we can use as a veto region. On the top, we merely have to lower the PMT layer by 30 - 50 cm to make the veto region. All this requires is that the bottom layer of PMT be a bit deeper. The issue here is that the PMT manufacturers may be reluctant to have their PMT under more that 5 atmospheres pressure, especially after the Super Kamiokande accident. We hope to explore this matter further as soon as we have some funds with which to carry out PMT envelope pressure tests.
A second option that maintains the 100 kiloton fiducial volume is to expand the excavated cylinder by 1.5 meters in radius and keep the bottom PMT at a 50 m depth. This is probably a safe procedure especially since the initial stress evaluations were carried out for detectors at 6950 ft depth rather than at 4850 f t depth. This matter should be reconsidered af%er we have coring data and rock characteristics in the excavation region. As mentioned above, our goal is to obtain these cores in early 2007.
If we keep the chamber dimensions exactly as stated, 50 meter diameter and 50 meter diameter, then the reduction in fiducial diameter to 47 meters will result in a fiducial mass of 86.7 kilotons per module or 260 kilotons for the three module complex. That means a data rate that is reduced by 13If we are forced to make a 2 meter fiducial cut (such as Super Kamiokande) from the PMT window then the reduction will be to 45 m in diameter leading to fiducial mass of 71.5 kilotons per module or 214 kilotons for the three modules. This is still a less than 30% reduction in data rate which will not have a major impact on the scientific case for the program.
45
We anticipate that we will find a suitable combination of chamber radius and bottom PMT location that will achieve the 100’kiloton fiducial volume per module. As stressed before, we are very concerned that there be large safety factors in the excavation structure and the PMT installation. Our goal is to construct detectors that will have close to a 100% on time efficiency and so make maximal use of the long range neutrino beam as well as maintain a constant search for nucleon decay, supernova neutrino bursts and measurement of atmospheric neutrino behavior.
The 100% on time is further aided by having a multi-module detector array. For example, we can stagger the module calibrations in such a way that two modules are operating while the third is being calibrated.
References
[l] W. Marciano, hep-ph/0108181, 22 Aug. 2001.
[2] “Very Long Baseline Neutrino Oscillation Experiment for Precise Measurements of Mix- ing Parameters and CP Violating Effects”, M. V. Diwan, et al., PRD 68 (2003) 012002.
[3] Stephen Parke, Talk in the HQL04 conference, Puerto Rico, June l-June5, 2004.
[4] Patrick Huber, Talk at the “Workshop on Long Base- line Neutrino Experiments”, March 6-7, 2006, Fermilab. http://ww.fnal.gov/directorate/DirReviews/Neutrino-Wrkshp.html P. Huber, D. Marfatia, M. Diwan, M. Bishai, V. Barger, M. Dierxsens, B. Viren, C. Lewis, ”Mea- suring Neutrino Mixing Parameters with a Wide band Super Neutrino beam,” in preparation.
[5] Simulation of long-baseline neutrino oscillation experiments with GLOBES (General Long Baseline Experiment Simulator). Patrick Huber, M. Lindner, W. Winter (Munich, Tech. U.) . Comput.Phys.Commun.167:195,2005 Archive: hep-ph/0407333’
[6] M. Diwan, Contributed to Heavy Quarks and Leptons Workshop 2004, San Juan, Puerto Rico, 1-5 Jun 2004. Published in “San Juan 2004, Heavy quarks and leptons” 89-109 e-Print Archive: hep-ex/0407047
[7] Neutrinos and Beyond: New Windows on Nature, Neutrino Facilities Ass- esment Committee, National Research Council, . (2003), ISBN-0-309-087 16-3, ht tp : //m .nap. edu/cat alog/ 10583. ht ml.
46

4
[8]. M. Freund, Phys.Rev. D64 (2001) 053003; M.@eund, P. Huber, M. Lindner, Nucl.Phys. B615 (2001) 331-357;
[9] V.D. Barger, S. Geer, R. Raja, I<. Whisnant, Phys. Rev. D63: 113011 (2001); V. Barger et al., hep-ph/0103052; P. Huber, M. Lindner, W. Winter, Nucl. Phys. B645, 3 (2002); V. Barger, D. Marfatia, K. Whisnant, Phys. Rev. D65: 073023 (2002).
[lo] V. Barger, D. Marfatia, K. Whisnant, Int. J. Mod. Phys, E12:569-647, 2003.
[ll] C. Albright et al., Physics at a Neutrino Factory; hep-ex/0008064; N. Holtkamp et al., Fea.sibility Study of a Neutrino Source Based on a Muon Storage Ring, FERMILAB- PUB-00-108-E "June 2000); S. Ozaki, R. Palmer, M. Zisman, and J. Gallardo, eds. Feability Study I1 of a Muon-Based Neutrino Source, BNL-52623 (2001) and references therein to other neutrino factory studies.
[12] PDG, Phys. Rev. D66, 010001 (2002), p. 281.
[13] Y. Fukuda et al., Phys. Rev. Lett. 81, 1562 (1998); S. Fukuda et al., Phys. Rev. Lett. 86 5656, 2001; E.W. Beier, Phys. Lett. B283, 446 (1992); T. Kajita and Y. Totsuka, Rev. Mod. Phys. 73, 85 (2001).
1141 K. Eguchi, et. aZ, Phys. Rev. Lett. 90, 021802 (2003). hep-ex/0212021.
[15] Q. R. Ahmad et al., Phys. Rev. Lett. 87 071301 (2001). S. Fukuda et al., Phys. Rev. Lett., 86 5651 (2001).
[16] S. H. Ahn et al., Phys. Lett. B 511 178 (2001).
[17] Chiaki Yanagisawa, Talk at the Workshop on Long Baseline Neutrino Experiments, March 6-7, 2006. http://www.fnal.gov/directorate/DirReviews/Neutrino_Wrkshp.html
[18] R. Alber, et al., Accelerator Proton Driver Study Group FNAL-TM-2136, FNAL-TM- 2169. http://www-bd.fnal.gov/pdriver/
[19] Albert0 Marchionni, Talk at the Workshop on Long Baseline Neutrino Experiments, March 6-7, 2006. http: //www . fnal.gov/direct orat e/DirReviews/Neutrino-Wrkshp .html
[20] "2 Megawatt Multi-stage Proton Accumulator" , David Mcginnis, Beams Document 1782-v7, Fermi National Laboratory. Nov. 3, 2005.
[21] J. Alessi et al., AGS Super Neutrino Beam Facility, Accelerator and Target system Design, BNL-71228-2003-IR. April 15, 2003. J. Alessi et al., The AGS-based Super
47

Neutrino Beam Facility, Conceptual Design Report, BNL-73210-2004-IR, October 1, 2004. http : / /nwg . phy. bnl . gov/
[22] D. Marfatia, in preparation.
[23] A. Strumia and F. Vissani, hep-ph/0503246, ifup-th/2005-06.
[24] Numi MINOS project at Fermi National Accelerator Laboratory, http:/www- numi.fna1. gov/
[25] K. S. Babu, J. C. Pati, and F. Wilczek, Nucl. Phys. B 566, 33 (2000). [arXiv:hep- ph/9812538].
[26] K. Kobayashi et al., Phys. Rev. D72:052007, 2005. And references contained within.
[27] M. Shiozawa, Joint BNL/UCLA-APS workshop, March 2004, Brookhaven National Laboratory. http://www.physics.gov/superbeam/
[28] Physics Potential and Feasibility of UNO, UNO collaboration, June 2001, Stony Brook University, SBHEPO1-03.
[29] S. Fukuda et al., Nucl. Instrm. Meth. A 501, (2003) 418-462.
[30] J. Boger et al., Nucl. Instrum. Meth. A449:172-207, 2000.
[31] R. Becker-Szendy et al., Nucl. Instrum. Meth. A324:363-382, 1993.
[32] The homestake laboratory project, http://www.state.sd.us/homestake, ht tp: //www .int . Washington. edu/DUSEL/homestake. ht ml
[33] Charles Fairhurst, Talk at Henderson DUSEL Capstone Workshop 2006, ht tp: //nngroup. physics, sunysb.edu/husep/HendersonDUSEL-Capst one/
[34] INITIAL STABILITY STUDY OF LARGE OPENINGS FOR THE NATIONAL UNDERGROUND SCIENCE LABORATORY AT THE HOMESTAKE MINE, LEAD, SD Doug Tesarik, Jeff Johnson, Karl Zipf, Jr., Kenneth Lande. NARMS - TAC 2002: Mining and Tunnelling Innovation and Opportunity, Vol. 1, pp 157-163 R. Hammah et a1 Eds.,Toronto, University of Toronto Press http://www.cdc.gov/niosh/mining/pubs/pdfs/issol.pdf
[35] Barton, N.R., R. Lien, and J. Lunde. 1974. Engineering classification of rock masses for the design of tunnel support. Rock Mech. 6(4):189-239.
48

[36] Grimstad, E., and N. Barton. 1993. Updating the Q-system for NMT. In Proceedings of the International Symposium on Sprayed Concrete: Modern Use of Wet Mix Sprayed Concrete for Underground Support. Oslo: Norwegian Concrete Assn.
[37] NSF SITE PANEL REPORT CONCERNING a DEEP, UNDER- GROUND SCIENCE and ENGINEERING LABORATORY (5/28/03), ht tp ://www .int . Washington. edu/DUSEL/ homest ake. html
[38] A MASSIVE, FINE GRAINED DETECTOR FOR THE ELASTIC REACTIONS IN- DUCED BY NEUTRINOS IN THE GeV ENERGY REGION. L.A. Ahrens et al., Nucl.Instrum.Meth.A254:515,1987
[39] L. Borodovsky, et al., Phys. Rev. Lett. 68, 274277 (1992)
E401 The Kamiokande-I1 Detector. By KAMIOKANDEII Collaboration (Eugene W. Beier for the collaboration). UPR-O138E, Apr 1986. 13pp. Presented at 7th Workshop on Grand Unification: ICOBAN 86, Toyoma, Japan, Apr 16-18,1986. Published in Toyama ICOBAN 1986:0079 (QCD161:W74:1986)
[41] Bob Zwaska, Talk at Henderson DUSEL Capstone Workshop 2006, http: //nngroup.physics.sunysb.edu/husep/HendersonDUSEL_Capstone/
[42] Greg Bock, Talk at Henderson DUSEL Capstone Workshop 2006, http: //nngroup.physics.sunysb.edu/husep/HendersonDUSEL_Capstone/
49