Central Americas Mayan, Aztecs, Incans. Human Migration JgMmsLkg--/18666jebis5bljpg.jpg
MIGRATION TRENDS IN THE AMERICAS
Bolivarian Republic of Venezuela OCTOBER 2019
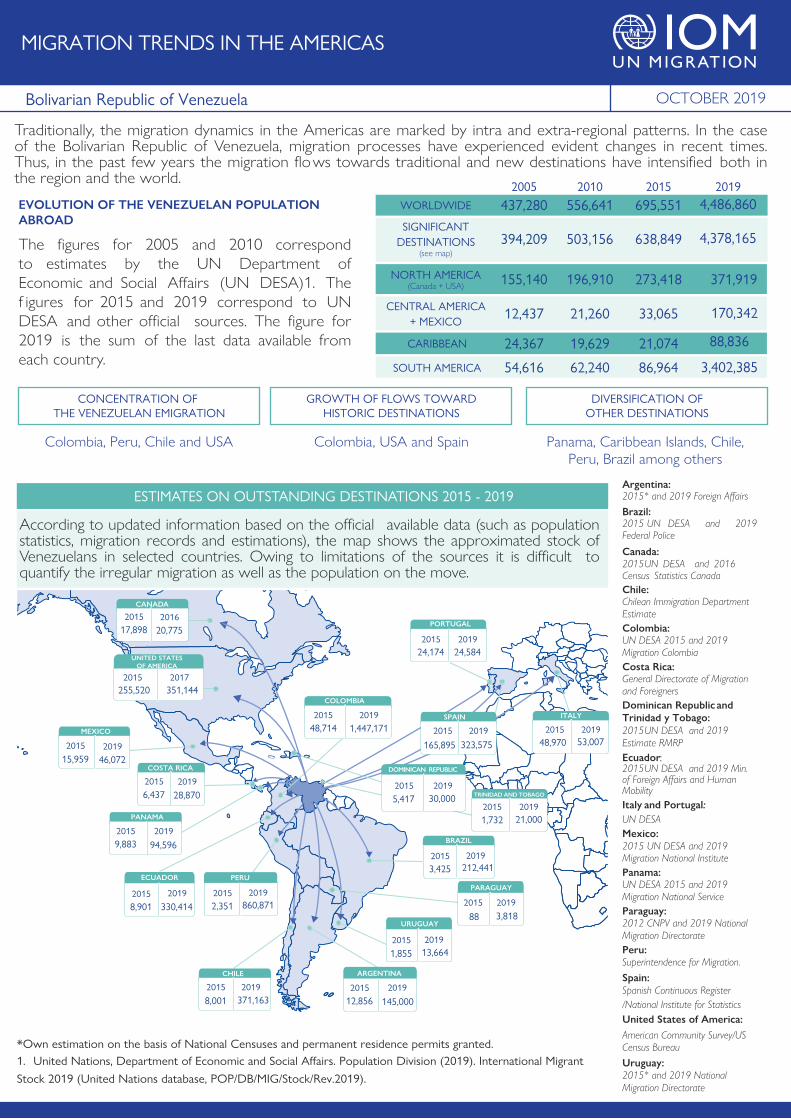
Traditionally, the migration dynamics in the Americas are marked by intra and extra-regional patterns. In the case of the Bolivarian Republic of Venezuela, migration processes have experienced evident changes in recent times. Thus, in the past few years the migration flows towards traditional and new destinations have intensified both in the region and the world.
EVOLUTION OF THE VENEZUELAN POPULATION ABROAD
The figures for 2005 and 2010 correspond to estimates by the UN Department of Economic and Social Affairs (UN DESA)1. The f igures for 2015 and 2019 correspond to UN DESA and other official sources. The figure for 2019 is the sum of the last data available from each country.
Colombia, Peru, Chile and USA Colombia, USA and Spain Panama, Caribbean Islands, Chile, Peru, Brazil among others
Argentina: 2015* and 2019 Foreign AffairsBrazil:2015 UN DESA and 2019 Federal Police
Canada:2015 UN DESA and 2016 Census Statistics CanadaChile:Chilean Immigration Department EstimateColombia:UN DESA 2015 and 2019 Migration ColombiaCosta Rica:General Directorate of Migration and ForeignersDominican Republic and Trinidad y Tobago: 2015 UN DESA and 2019 Estimate RMRP Ecuador:2015 UN DESA and 2019 Min. of Foreign Affairs and Human MobilityItaly and Portugal:UN DESAMexico:2015 UN DESA and 2019 Migration National InstitutePanama:UN DESA 2015 and 2019 Migration National ServiceParaguay: 2012 CNPV and 2019 National Migration DirectoratePeru:Superintendence for Migration.Spain:Spanish Continuous Register/National Institute for StatisticsUnited States of America: American Community Survey/US Census BureauUruguay: 2015* and 2019 National Migration Directorate
20102005 2015 2019
503.156 638.849
WORLDWIDE
SIGNIFICANTDESTINATIONS
(see map)
CONCENTRATION OF THE VENEZUELAN EMIGRATION
GROWTH OF FLOWS TOWARDHISTORIC DESTINATIONS
DIVERSIFICATION OFOTHER DESTINATIONS
ESTIMATES ON OUTSTANDING DESTINATIONS 2015 - 2019
According to updated information based on the official available data (such as population statistics, migration records and estimations), the map shows the approximated stock of Venezuelans in selected countries. Owing to limitations of the sources it is difficult to quantify the irregular migration as well as the population on the move.
437,280
394,209
UNITED STATESOF AMERICA
255,5202015
351,1442017
PANAMA
9,883 94,5962015 2019
ECUADOR PERU
2,3512015
CHILE
8,001 371,1632015 2019
COLOMBIA
48,7142015
1,447,1712019
BRAZIL
3,4252015
URUGUAY
COSTA RICA
6,4372015
28,870 2019
212,4412019
SPAIN
165,8952015
323,5752019
860,8712019
8,9012015
330,4142019
1,8552015 2019
13,664
5,417 30,0002015 2019
DOMINICAN REPUBLIC
1,732 21,0002015 2019
TRINIDAD AND TOBAGO
CANADA
17,8982015
20,7752016
MEXICO
15,9592015
46,072 2019
24,5842019
24,1742015
PORTUGAL
ITALY
48,9702015
53,0072019
ARGENTINA
12,8562015
145,0002019
PARAGUAY
2015 2019
88 3,818
556,641
503,156
695,551
638,849
4,486,860
4,378,165
NORTH AMERICA(Canada + USA) 196,910 273,418 371,919155,140
CENTRAL AMERICA+ MEXICO
21,260 33,065 170,34212,437
CARIBBEAN 19,629 21,074 88,83624,367
62,240 86,964 3,402,385SOUTH AMERICA 54,616
*Own estimation on the basis of National Censuses and permanent residence permits granted.1. United Nations, Department of Economic and Social Affairs. Population Division (2019). International MigrantStock 2019 (United Nations database, POP/DB/MIG/Stock/Rev.2019).
VENEZUELANPOPULATIONFLOWS
2
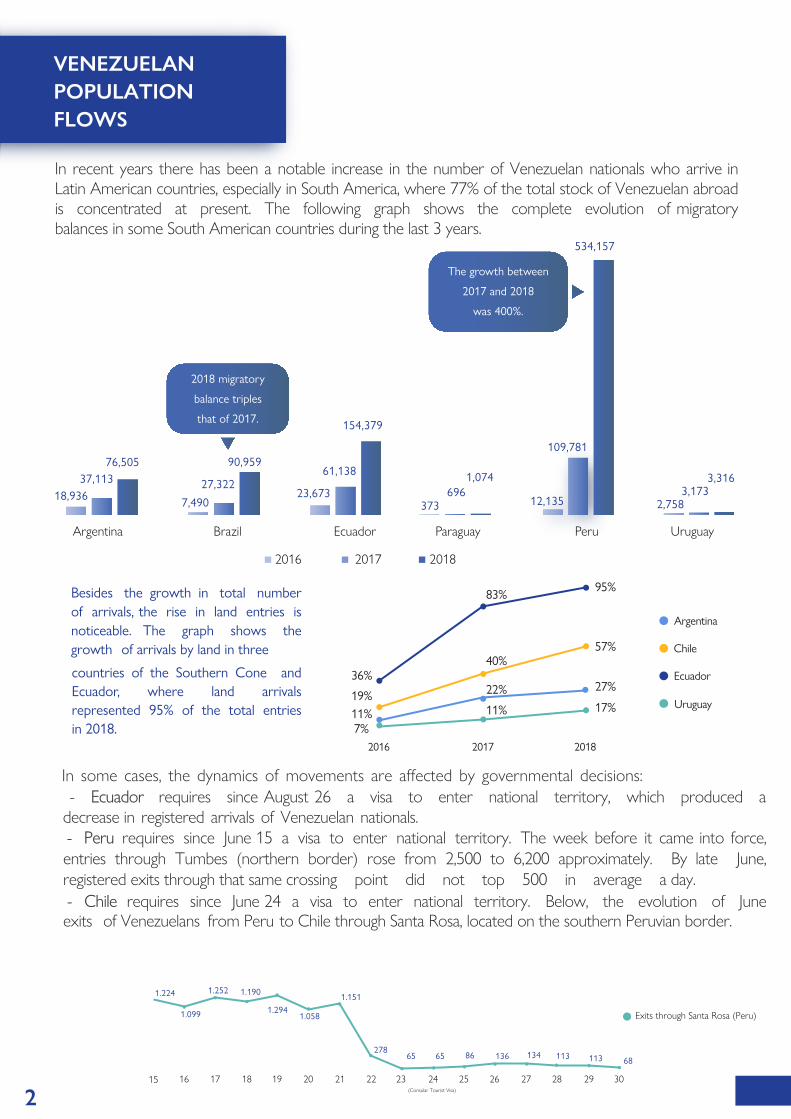
In recent years there has been a notable increase in the number of Venezuelan nationals who arrive in Latin American countries, especially in South America, where 77% of the total stock of Venezuelan abroad is concentrated at present. The following graph shows the complete evolution of migratory balances in some South American countries during the last 3 years.
In some cases, the dynamics of movements are affected by governmental decisions:- Ecuador requires since August 26 a visa to enter national territory, which produced a
decrease in registered arrivals of Venezuelan nationals.- Peru requires since June 15 a visa to enter national territory. The week before it came into force,entries through Tumbes (northern border) rose from 2,500 to 6,200 approximately. By late June,registered exits through that same crossing point did not top 500 in average a day.- Chile requires since June 24 a visa to enter national territory. Below, the evolution of Juneexits of Venezuelans from Peru to Chile through Santa Rosa, located on the southern Peruvian border.
ParaguayArgentina
18,93637,113
76,505
Brazil
7,490
27,322
90,959
Ecuador
23,673
61,138
154,379
Peru
12,135
109,781
534,157
Uruguay
2,7583,173
3,316
2017 2018
373696
1,074
2016
Besides the growth in total number of arrivals, the rise in land entries is noticeable. The graph shows the growth of arrivals by land in three
countries of the Southern Cone and Ecuador, where land arrivals represented 95% of the total entries in 2018.
The growth between
2017 and 2018
was 400%.
2018 migratory
balance triples
that of 2017.
Chile
Argentina
Ecuador
Uruguay
7%11%11%
22%
40%
19%
36%
83% 95%
27%
57%
17%
2016 2017 2018
15 16 17 18 19 20 21 22 23 24 25 26 27 28 29 30
1.224
1.2941.058
1.151
27865 65 86 136 113 113134
68
1.099
1.252 1.190
(Consular Tourist Visa)
Exits through Santa Rosa (Peru)
3
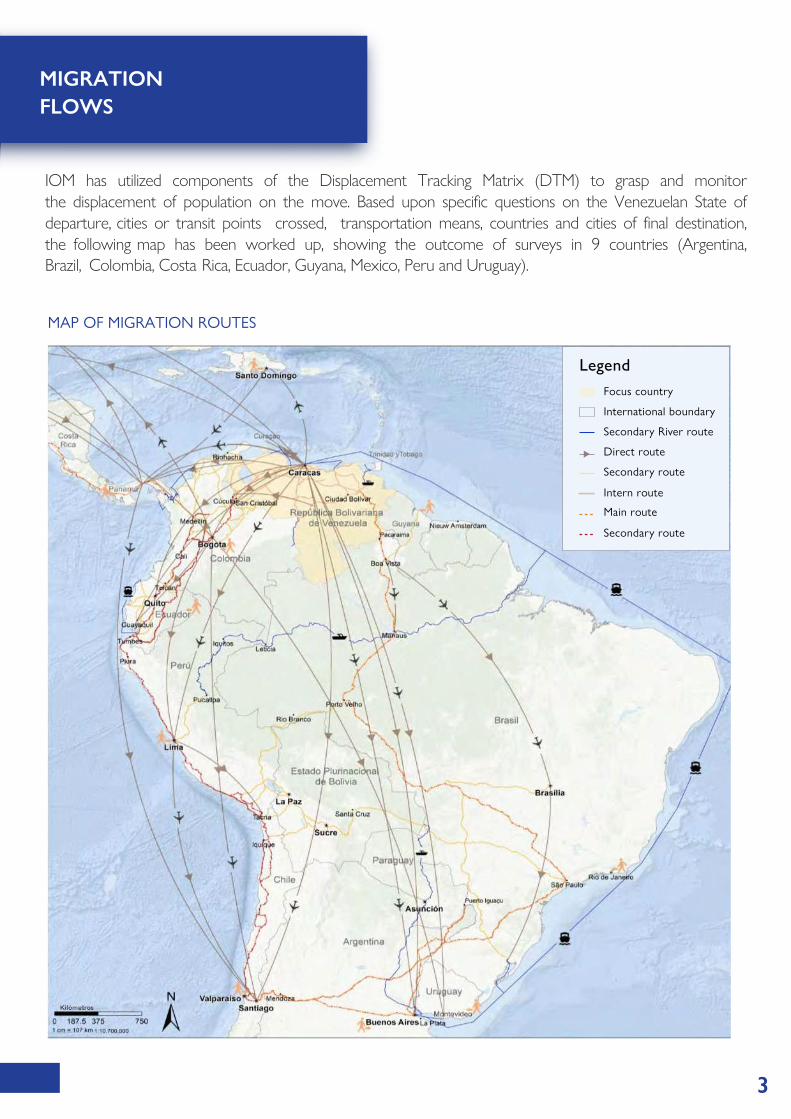
IOM has utilized components of the Displacement Tracking Matrix (DTM) to grasp and monitor the displacement of population on the move. Based upon specific questions on the Venezuelan State of departure, cities or transit points crossed, transportation means, countries and cities of final destination, the following map has been worked up, showing the outcome of surveys in 9 countries (Argentina, Brazil, Colombia, Costa Rica, Ecuador, Guyana, Mexico, Peru and Uruguay).
MAP OF MIGRATION ROUTES
MIGRATION FLOWS
3
LegendFocus country
International boundary
Secondary River route
Direct route
Secondary route
Intern route
Main route
Secondary route
MIGRATIONROUTESANDEAN CORRIDOR
4
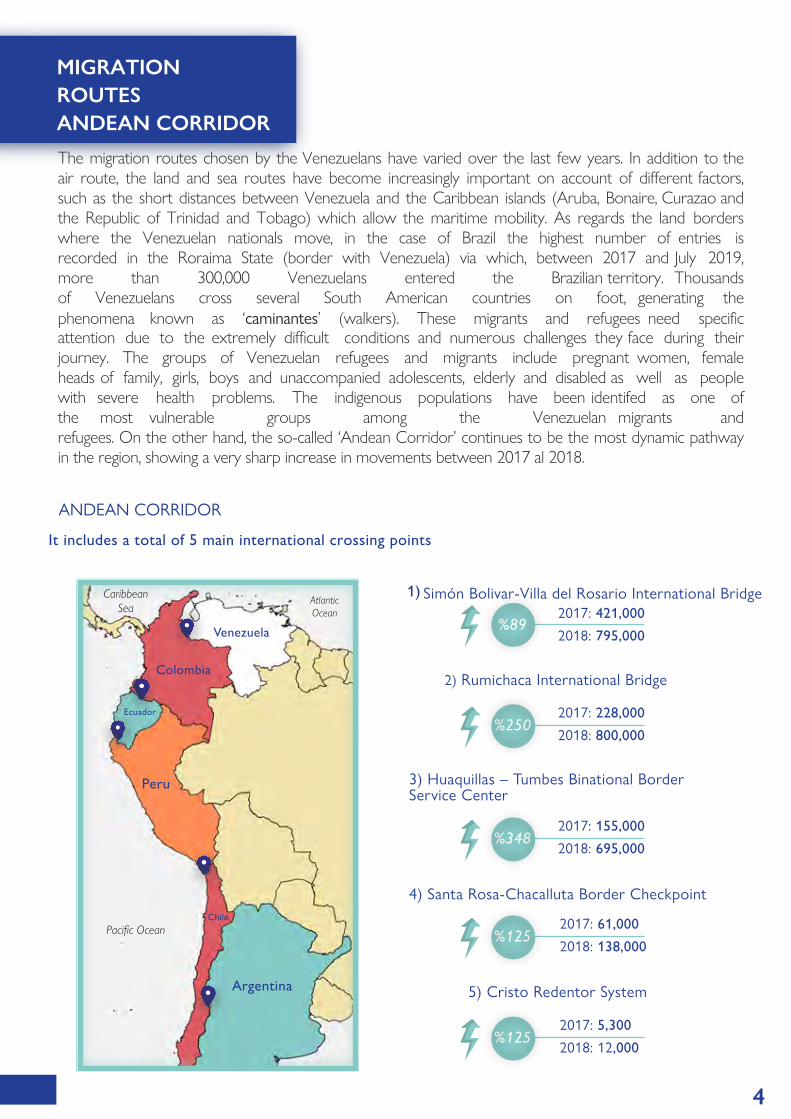
2) Rumichaca International Bridge
3) Huaquillas – Tumbes Binational BorderService Center
4) Santa Rosa-Chacalluta Border Checkpoint
5) Cristo Redentor System
2017: 421,000
2018: 795,000 %89
2017: 228,000
2018: 800,000 %250
2017: 155,000
2018: 695,000 %348
2017: 61,000
2018: 138,000 %125
2017: 5,300
2018: 12,000 %125
The migration routes chosen by the Venezuelans have varied over the last few years. In addition to the air route, the land and sea routes have become increasingly important on account of different factors, such as the short distances between Venezuela and the Caribbean islands (Aruba, Bonaire, Curazao and the Republic of Trinidad and Tobago) which allow the maritime mobility. As regards the land borders where the Venezuelan nationals move, in the case of Brazil the highest number of entries is recorded in the Roraima State (border with Venezuela) via which, between 2017 and July 2019, more than 300,000 Venezuelans entered the Brazilian territory. Thousands of Venezuelans cross several South American countries on foot, generating the phenomena known as ‘caminantes’ (walkers). These migrants and refugees need specific attention due to the extremely difficult conditions and numerous challenges they face during their journey. The groups of Venezuelan refugees and migrants include pregnant women, female heads of family, girls, boys and unaccompanied adolescents, elderly and disabled as well as people with severe health problems. The indigenous populations have been identifed as one of the most vulnerable groups among the Venezuelan migrants and refugees. On the other hand, the so-called ‘Andean Corridor’ continues to be the most dynamic pathway in the region, showing a very sharp increase in movements between 2017 al 2018.
ANDEAN CORRIDOR
It includes a total of 5 main international crossing points
1) Simón Bolivar-Villa del Rosario International Bridge
Argentina
Peru
Ecuador
Chile
Colombia
Venezuela
Pacific Ocean
AtlanticOcean
Caribbean Sea
5
MIGRATION ROUTESANDEAN CORRIDOR
In the Andean Corridor, the commonly utilized route starts in the Simon Bolivar-Villa del Rosario International Bridge between Colombia and Venezuela, linking the localities of Villa del Rosario and San Antonio de Táchira, respectively. Later, through different routes and transportation means, the Venezuelan refugees and migrants continue to the Rumichaca International Bridge which connects the cities of Ipiales and Tulcán, in Colombia and Ecuador. Then they cross Ecuador into Peru through the Huaquillas – Tumbes crossing point, and enter Chile through the Santa Rosa - Chacalluta border checkpoint. Finally, the fifth international crossing connects Chile with Argentina through the Cristo Redentor System checkpoint.
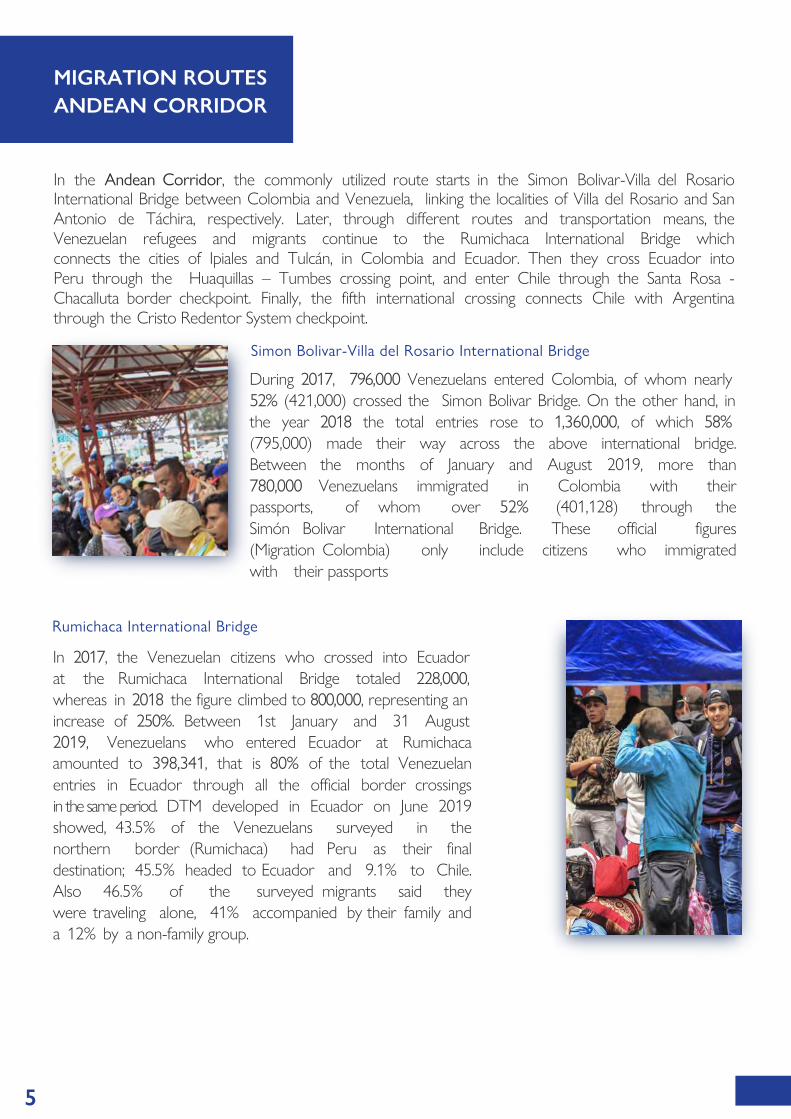
Simon Bolivar-Villa del Rosario International Bridge
During 2017, 796,000 Venezuelans entered Colombia, of whom nearly 52% (421,000) crossed the Simon Bolivar Bridge. On the other hand, in the year 2018 the total entries rose to 1,360,000, of which 58% (795,000) made their way across the above international bridge. Between the months of January and August 2019, more than 780,000 Venezuelans immigrated in Colombia with their passports, of whom over 52% (401,128) through the Simón Bolivar International Bridge. These official figures (Migration Colombia) only include citizens who immigrated with their passports
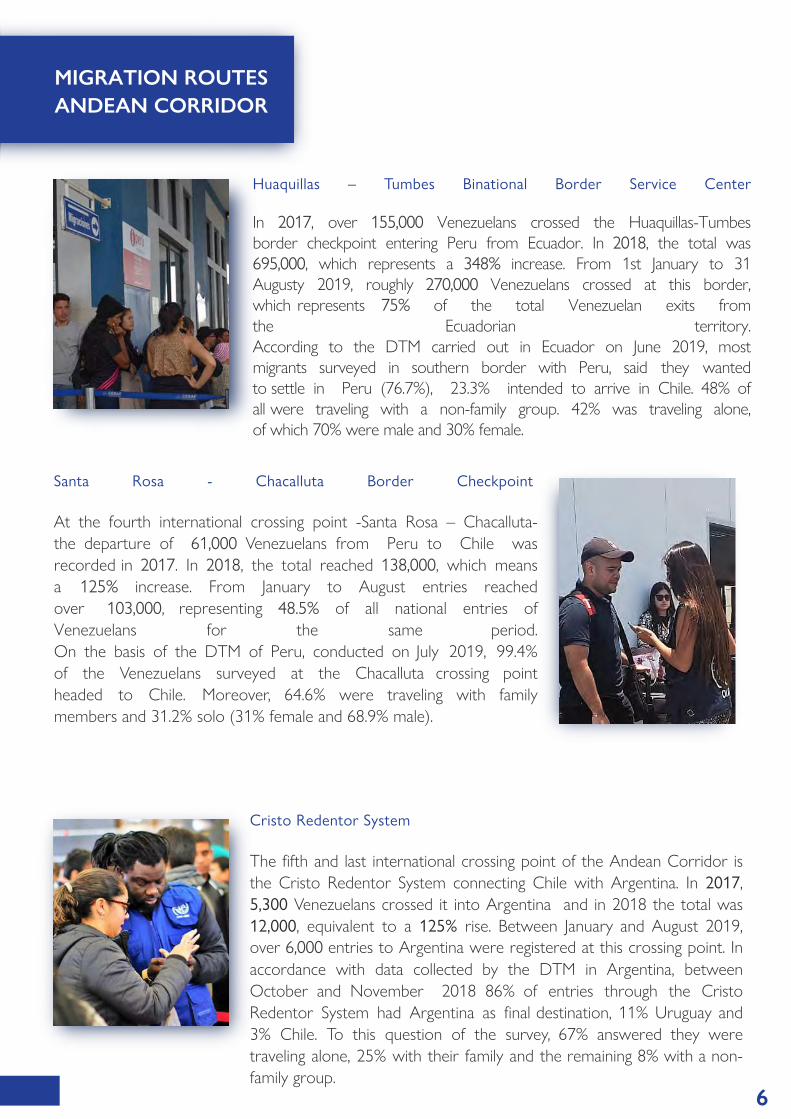
Rumichaca International Bridge
In 2017, the Venezuelan citizens who crossed into Ecuador at the Rumichaca International Bridge totaled 228,000, whereas in 2018 the figure climbed to 800,000, representing an increase of 250%. Between 1st January and 31 August 2019, Venezuelans who entered Ecuador at Rumichaca amounted to 398,341, that is 80% of the total Venezuelan entries in Ecuador through all the official border crossings in the same period. DTM developed in Ecuador on June 2019 showed, 43.5% of the Venezuelans surveyed in the northern border (Rumichaca) had Peru as their final destination; 45.5% headed to Ecuador and 9.1% to Chile. Also 46.5% of the surveyed migrants said they were traveling alone, 41% accompanied by their family and a 12% by a non-family group.
MIGRATION ROUTESANDEAN CORRIDOR
6
Huaquillas – Tumbes Binational Border Service Center
In 2017, over 155,000 Venezuelans crossed the Huaquillas-Tumbes border checkpoint entering Peru from Ecuador. In 2018, the total was 695,000, which represents a 348% increase. From 1st January to 31 Augusty 2019, roughly 270,000 Venezuelans crossed at this border, which represents 75% of the total Venezuelan exits from the Ecuadorian territory. According to the DTM carried out in Ecuador on June 2019, most migrants surveyed in southern border with Peru, said they wanted to settle in Peru (76.7%), 23.3% intended to arrive in Chile. 48% of all were traveling with a non-family group. 42% was traveling alone, of which 70% were male and 30% female.
Santa Rosa - Chacalluta Border Checkpoint
At the fourth international crossing point -Santa Rosa – Chacalluta- the departure of 61,000 Venezuelans from Peru to Chile was recorded in 2017. In 2018, the total reached 138,000, which means a 125% increase. From January to August entries reached over 103,000, representing 48.5% of all national entries of Venezuelans for the same period. On the basis of the DTM of Peru, conducted on July 2019, 99.4% of the Venezuelans surveyed at the Chacalluta crossing point headed to Chile. Moreover, 64.6% were traveling with family members and 31.2% solo (31% female and 68.9% male).
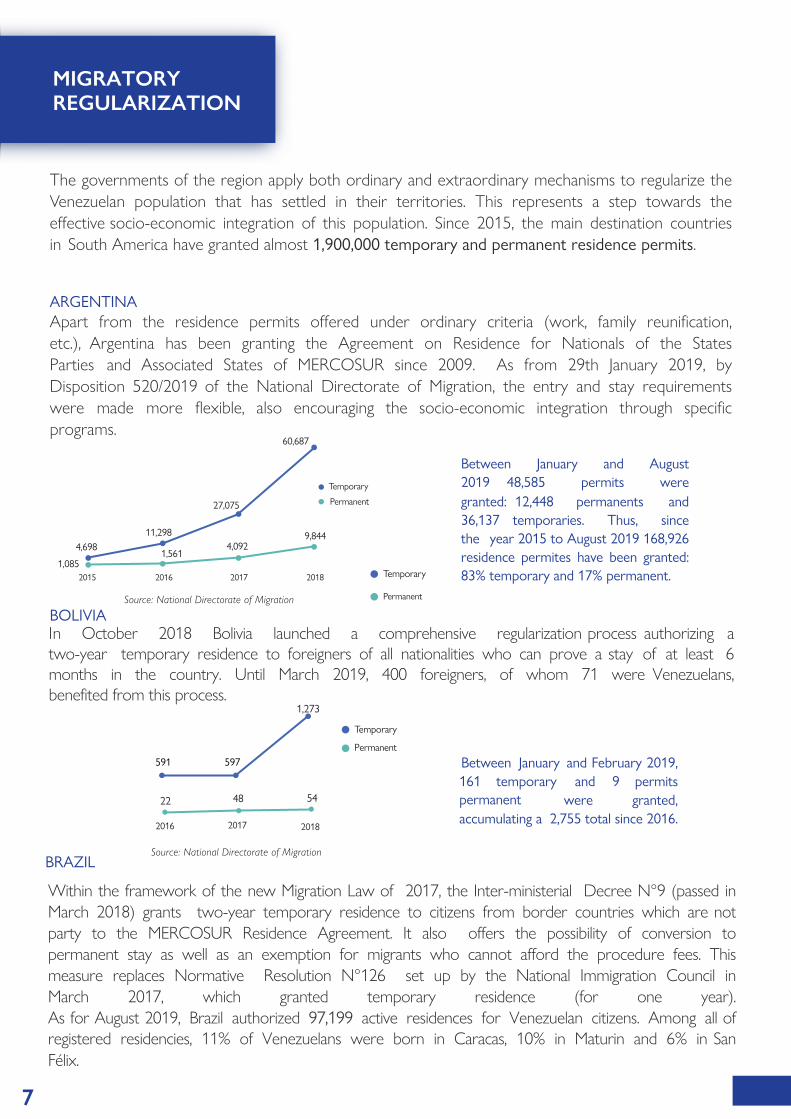
Cristo Redentor System
The fifth and last international crossing point of the Andean Corridor is the Cristo Redentor System connecting Chile with Argentina. In 2017, 5,300 Venezuelans crossed it into Argentina and in 2018 the total was 12,000, equivalent to a 125% rise. Between January and August 2019, over 6,000 entries to Argentina were registered at this crossing point. In accordance with data collected by the DTM in Argentina, between October and November 2018 86% of entries through the Cristo Redentor System had Argentina as final destination, 11% Uruguay and 3% Chile. To this question of the survey, 67% answered they were traveling alone, 25% with their family and the remaining 8% with a non-family group.
7
MIGRATORY REGULARIZATION
The governments of the region apply both ordinary and extraordinary mechanisms to regularize the Venezuelan population that has settled in their territories. This represents a step towards the effective socio-economic integration of this population. Since 2015, the main destination countries in South America have granted almost 1,900,000 temporary and permanent residence permits.
ARGENTINAApart from the residence permits offered under ordinary criteria (work, family reunification, etc.), Argentina has been granting the Agreement on Residence for Nationals of the States Parties and Associated States of MERCOSUR since 2009. As from 29th January 2019, by Disposition 520/2019 of the National Directorate of Migration, the entry and stay requirements were made more flexible, also encouraging the socio-economic integration through specific programs.
BOLIVIA
Within the framework of the new Migration Law of 2017, the Inter-ministerial Decree N°9 (passed in March 2018) grants two-year temporary residence to citizens from border countries which are not party to the MERCOSUR Residence Agreement. It also offers the possibility of conversion to permanent stay as well as an exemption for migrants who cannot afford the procedure fees. This measure replaces Normative Resolution N°126 set up by the National Immigration Council in March 2017, which granted temporary residence (for one year). As for August 2019, Brazil authorized 97,199 active residences for Venezuelan citizens. Among all of registered residencies, 11% of Venezuelans were born in Caracas, 10% in Maturin and 6% in San Félix.
In October 2018 Bolivia launched a comprehensive regularization process authorizing a two-year temporary residence to foreigners of all nationalities who can prove a stay of at least 6 months in the country. Until March 2019, 400 foreigners, of whom 71 were Venezuelans, benefited from this process.
BRAZIL
Between January and February 2019, 161 temporary and 9 permits permanent were granted, accumulating a 2,755 total since 2016.
2015
4,69811,298
1,561
27,075
4,0929,844
1,0852016 2017 2018
Permanent
Temporary
60,687
Permanent
Temporary
Source: National Directorate of Migration
Between January and August 2019 48,585 permits were granted: 12,448 permanents and 36,137 temporaries. Thus, since the year 2015 to August 2019 168,926 residence permites have been granted: 83% temporary and 17% permanent.
22 48
1,273
54
20172016 2018
Source: National Directorate of Migration
591 597Permanent
Temporary
8
MIGRATIONREGULARIZATION
CHILE
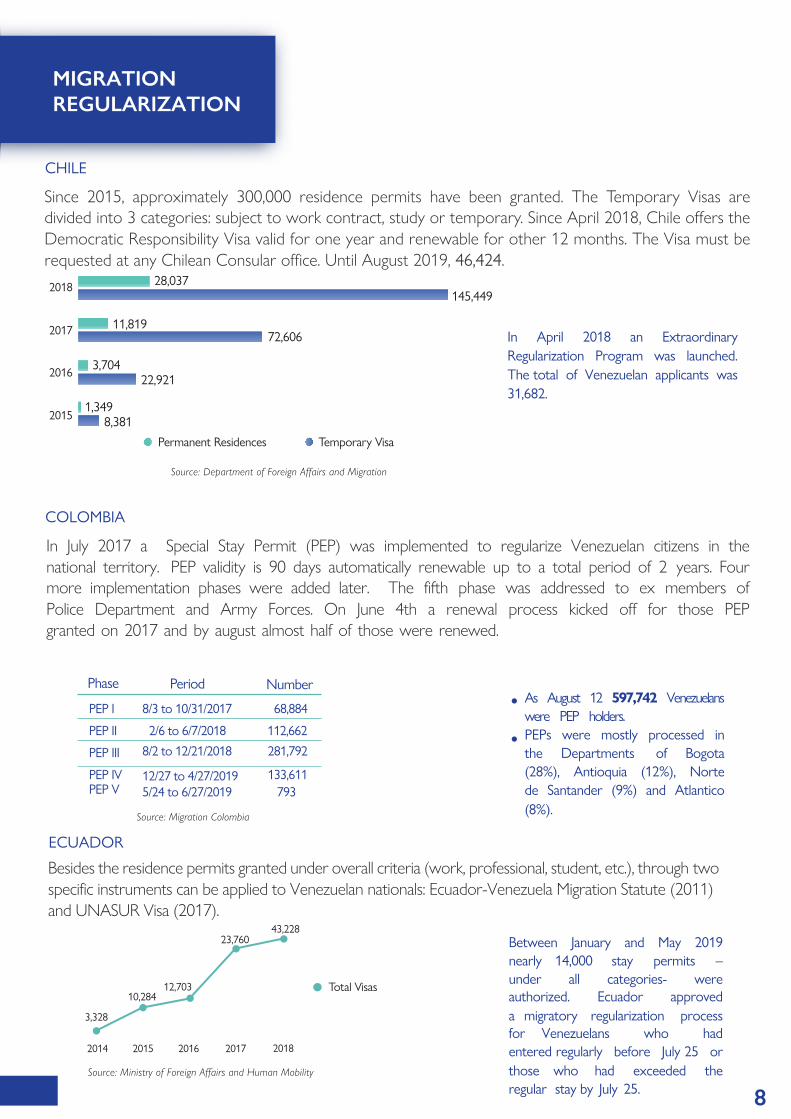
Since 2015, approximately 300,000 residence permits have been granted. The Temporary Visas are divided into 3 categories: subject to work contract, study or temporary. Since April 2018, Chile offers the Democratic Responsibility Visa valid for one year and renewable for other 12 months. The Visa must be requested at any Chilean Consular office. Until August 2019, 46,424.
In April 2018 an Extraordinary Regularization Program was launched. The total of Venezuelan applicants was 31,682.
8,381
22,9213,704
11,81972,606
145,44928,037
1,3492015
2016
2017
2018
Permanent Residences Temporary Visa
COLOMBIA
In July 2017 a Special Stay Permit (PEP) was implemented to regularize Venezuelan citizens in the national territory. PEP validity is 90 days automatically renewable up to a total period of 2 years. Four more implementation phases were added later. The fifth phase was addressed to ex members of Police Department and Army Forces. On June 4th a renewal process kicked off for those PEP granted on 2017 and by august almost half of those were renewed.
•
•
As August 12 597,742 Venezuelans were PEP holders.PEPs were mostly processed inthe Departments of Bogota(28%), Antioquia (12%), Nortede Santander (9%) and Atlantico(8%).
PeriodPhase Number
PEP I
PEP II
PEP III
PEP IV
8/3 to 10/31/2017
2/6 to 6/7/2018
8/2 to 12/21/2018
12/27 to 4/27/2019 133,611
281,792
112,662
68,884
10,28412,703
ECUADOR
Besides the residence permits granted under overall criteria (work, professional, student, etc.), through two specific instruments can be applied to Venezuelan nationals: Ecuador-Venezuela Migration Statute (2011) and UNASUR Visa (2017).
Total Visas
Source: Department of Foreign Affairs and Migration
Source: Migration Colombia
3,328
2014 2015 2016 2017 2018
Source: Ministry of Foreign Affairs and Human Mobility
PEP V 5/24 to 6/27/2019 793
43,22823,760 Between January and May 2019
nearly 14,000 stay permits –under all categories- were authorized. Ecuador approved a migratory regularization process for Venezuelans who had entered regularly before July 25 or those who had exceeded the regular stay by July 25.
56% 44%
MIGRATIONREGULARIZATION
9
Between January and July 2019,
the Ministry of Foreign Affairs and
NDM have granted 2,171
residence permits, accumulating 13,225
permits to Venezuelans since 2014.
PARAGUAY
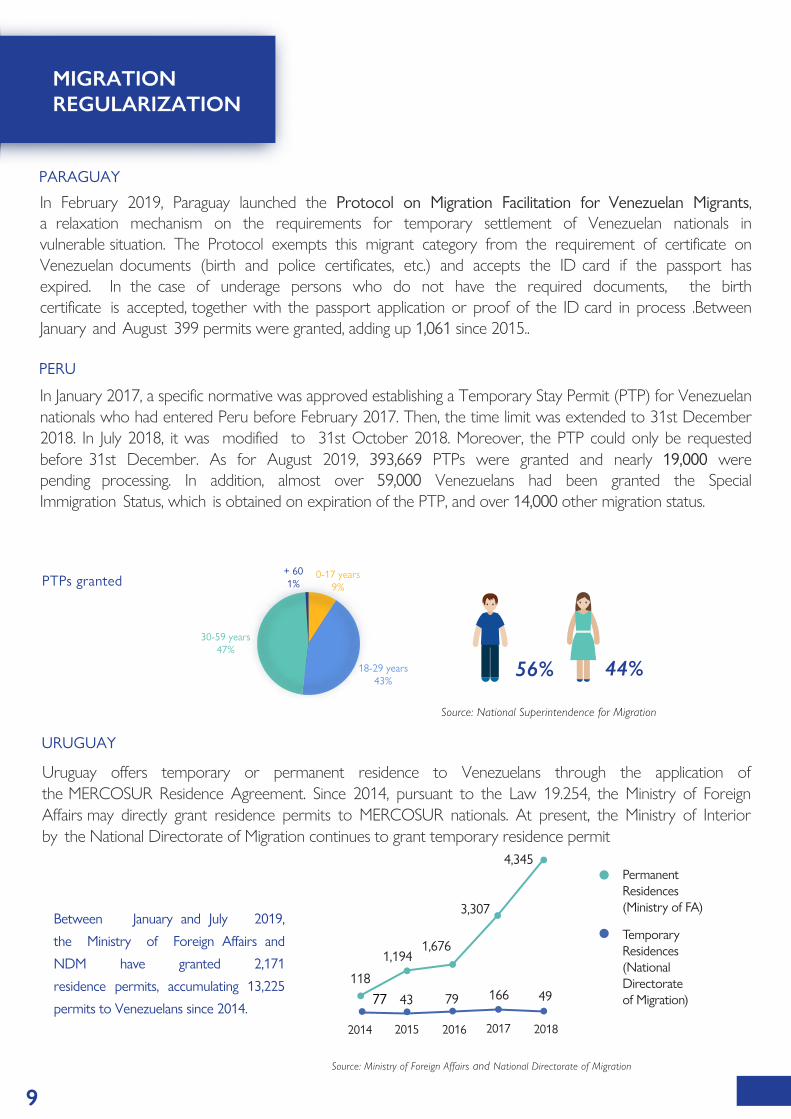
In February 2019, Paraguay launched the Protocol on Migration Facilitation for Venezuelan Migrants, a relaxation mechanism on the requirements for temporary settlement of Venezuelan nationals in vulnerable situation. The Protocol exempts this migrant category from the requirement of certificate on Venezuelan documents (birth and police certificates, etc.) and accepts the ID card if the passport has expired. In the case of underage persons who do not have the required documents, the birth certificate is accepted, together with the passport application or proof of the ID card in process .Between January and August 399 permits were granted, adding up 1,061 since 2015..
PERU
In January 2017, a specific normative was approved establishing a Temporary Stay Permit (PTP) for Venezuelan nationals who had entered Peru before February 2017. Then, the time limit was extended to 31st December 2018. In July 2018, it was modified to 31st October 2018. Moreover, the PTP could only be requested before 31st December. As for August 2019, 393,669 PTPs were granted and nearly 19,000 were pending processing. In addition, almost over 59,000 Venezuelans had been granted the Special Immigration Status, which is obtained on expiration of the PTP, and over 14,000 other migration status.
URUGUAY
Uruguay offers temporary or permanent residence to Venezuelans through the application of the MERCOSUR Residence Agreement. Since 2014, pursuant to the Law 19.254, the Ministry of Foreign Affairs may directly grant residence permits to MERCOSUR nationals. At present, the Ministry of Interior by the National Directorate of Migration continues to grant temporary residence permit
PTPs granted
2014
118
1,6761,194
43 79
3,307
4,345
166 49
2015 2016 2017 2018
TemporaryResidences(National Directorateof Migration)
PermanentResidences (Ministry of FA)
Source: Ministry of Foreign Affairs and National Directorate of Migration
Source: National Superintendence for Migration
0-17 years9%
+ 601%
18-29 years43%
30-59 years47%
77
10
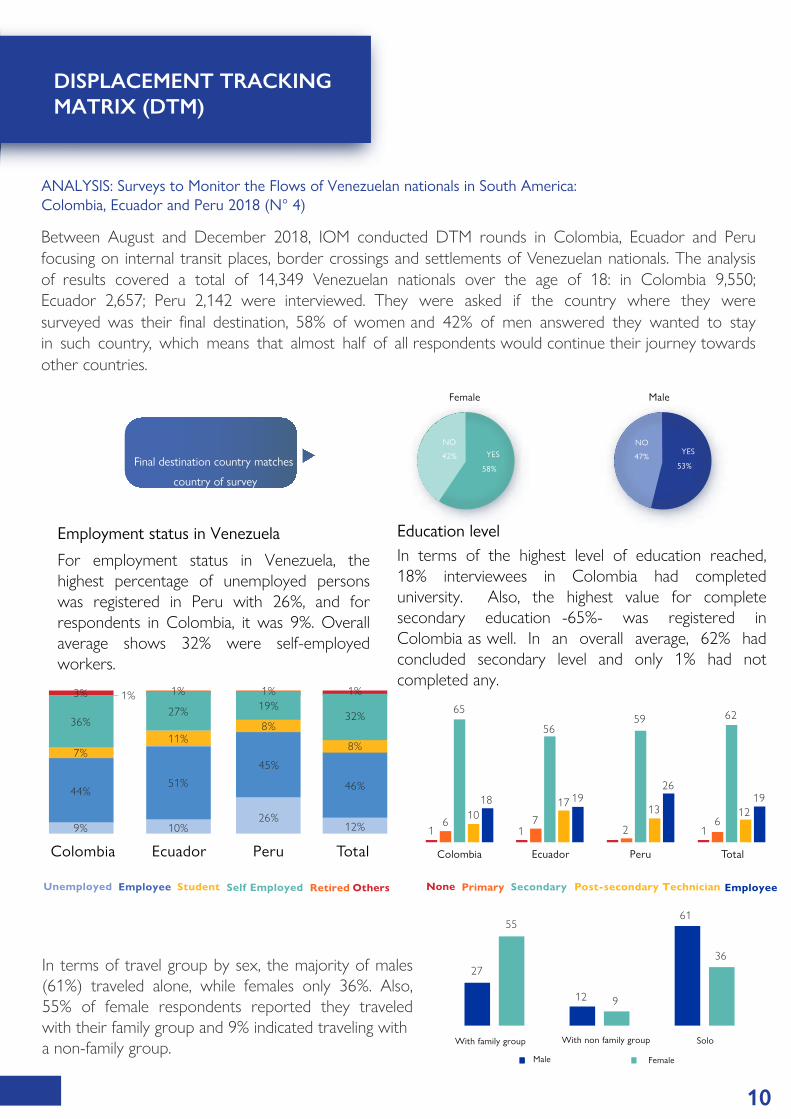
ANALYSIS: Surveys to Monitor the Flows of Venezuelan nationals in South America: Colombia, Ecuador and Peru 2018 (N° 4)
Between August and December 2018, IOM conducted DTM rounds in Colombia, Ecuador and Peru focusing on internal transit places, border crossings and settlements of Venezuelan nationals. The analysis of results covered a total of 14,349 Venezuelan nationals over the age of 18: in Colombia 9,550; Ecuador 2,657; Peru 2,142 were interviewed. They were asked if the country where they were surveyed was their final destination, 58% of women and 42% of men answered they wanted to stay in such country, which means that almost half of all respondents would continue their journey towards other countries.
DISPLACEMENT TRACKING MATRIX (DTM)
Female Male
YES
58%
NO
42% YES
53%
NO
47%
TotalColombia PeruEcuador
10%
51%
11%
27%
1%
26%
45%
8%
19%1%
12%
46%
8%
32%
1%
9%
44%
7%
36%
3% 1%
16
65
1018
17
2
59 62
61
13 1219
26
56
17 19
Colombia Ecuador Peru Total
With non family group
Male Female
27
55
12 9
36
61
With family group Solo
In terms of travel group by sex, the majority of males (61%) traveled alone, while females only 36%. Also, 55% of female respondents reported they traveled with their family group and 9% indicated traveling with a non-family group.
Final destination country matches
country of survey
Employment status in Venezuela
For employment status in Venezuela, the highest percentage of unemployed persons was registered in Peru with 26%, and for respondents in Colombia, it was 9%. Overall average shows 32% were self-employed workers.
Education levelIn terms of the highest level of education reached, 18% interviewees in Colombia had completed university. Also, the highest value for complete secondary education -65%- was registered in Colombia as well. In an overall average, 62% had concluded secondary level and only 1% had not completed any.
Unemployed Employee Student Self Employed Retired Others EmployeePost-secondary TechnicianSecondaryPrimaryNone
45.6% 54.4%
Source: Spanish Continuous Register /National Institute for Statistics
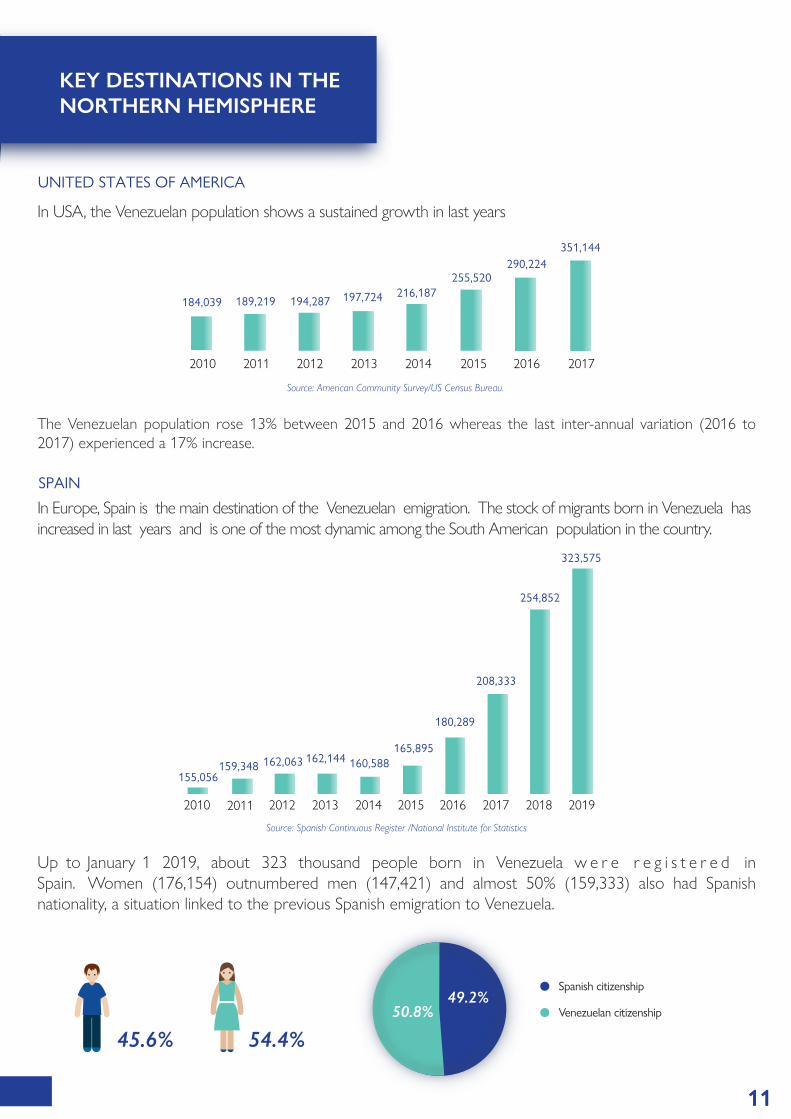
Up to January 1 2019, about 323 thousand people born in Venezuela w e r e r e g i s t e r e d in Spain. Women (176,154) outnumbered men (147,421) and almost 50% (159,333) also had Spanish nationality, a situation linked to the previous Spanish emigration to Venezuela.
2013 2014 20152010 2011 2012 2016 2017 2018 2019
155,056159,348 162,063 162,144 160,588
165,895
180,289
208,333
254,852
323,575
49.2% 50.8%
Spanish citizenship
Venezuelan citizenship
UNITED STATES OF AMERICA
In USA, the Venezuelan population shows a sustained growth in last years
Source: American Community Survey/US Census Bureau.
The Venezuelan population rose 13% between 2015 and 2016 whereas the last inter-annual variation (2016 to 2017) experienced a 17% increase.
SPAIN
In Europe, Spain is the main destination of the Venezuelan emigration. The stock of migrants born in Venezuela has increased in last years and is one of the most dynamic among the South American population in the country.
2013 2014 2015 2016 2017 2010 2011 2012
184,039 189,219 194,287 197,724 216,187255,520
290,224351,144
11
KEY DESTINATIONS IN THE NORTHERN HEMISPHERE
@OIMSuramerica OIMSuramerica
South America Regional O�cewww.robuenosaires.iom.int
This publication is part of a theme serie of reports on migrations made by Migration Analysis Unit of the IOM Regional O°ce for South America.