Migration of Minerals and Organic Compounds between ...
15
Annals of R.S.C.B., ISSN:1583-6258, Vol. 25, Issue 6, 2021, Pages. 12829 - 12843 Received 25 April 2021; Accepted 08 May 2021. 12829 http://annalsofrscb.ro Migration of Minerals and Organic Compounds between Bottled Water and its Plastic Packaging Wafa Cheddadi 1 ∗ , Yamina Berredjeme 1 , Achraf Hamrouni 2 , Zhour Hattab 3 , Abdelhak Gheid 1 , Raouia Hamrouni 4 1 Water and environment science and technology laboratory, Faculty of Science and Technology, Mohammed CherifMessadia University, Souk Ahras 41000, Algeria. 2 Mines Metallurgy Materials Laboratory L3M National Hight school of Mines and Metallurgy, Amar Laskri ,B.P.233,W129,Sidi Amar, R.P. Annaba 23000 Algeria 3 Laboratory of Water Treatment and Valorization of the Industrial Waste, Faculty of Sciences, Department of Chemistry, Badji-Mokhtar University, B.P.12, Annaba 23000, Algeria. 4 LEREC, Department of physics, Badji-Mokhtar University, B.P.12, Annaba 23000, Algeria. ABSTRACT Several studies have shown the bottle’s ingredients have been transported in water, this study aims to investigate experimentally the migration of several minerals from water to PET bottles. A series of water bottles were examined after exposure to extreme conditions of temperature(30, 60 and 90 days)(25, 35 and 45°C).The (AAS) to determine the concentration of Ca, Mg, Na, k, Pb after 90 days showed a significant decrease and increased in the amount of minerals water .the (TOC) concentration increases in mineral water when the temperature increases ,this is confirmed by the FTIR analysis, proving the existence of minerals compounds from the water to PET,and proven by analysis with (XRD).the study proves that the minerals have been successfully implanted into the PET surface, as the (WLI), and hence this result suggests the improvement of the hydrophilic property of the modified PET. Keywords: Polymer, PET, Mineral Water, Pollution, Packaging. Introduction Packaging materials in contact with food play an unavoidable role in the conservation and protection of foodstuffs. Also, they appeared a constant innovation like the development of active and intelligent materials. The world consumption of bottled water is in constant evolution due to the increased need for consumers to have access to the safe drinking water of an efficient chemical and microbiological quality.In recent years, the packaged water sector in Algeria has experienced exceptional development thanks to investment encouragement. This development results in the establishment of dozens of exploitation and production units of packaged waters throughout the national territory. Also, it was accompanied by an exceptional increase in the consumption, whose part per capita has remarkably evolved in twenty years (4 L/capita/year in 1989 to 22 L/capita/year in 2007). In fact, thermoplastic packaging has grown considerably in popularity since the beginning of the 1990s, and has become part of everyday life. Interestingly, polyethylene terephthalate (PET) is a family of polyesters, a semi-crystalline plastic polymer (C. Bach et al.,2012), and has gradually replaced other materials, such as polyvinyl chloride and glass in the packaging of mineral water and beverages (Layal al Rayes et al.,2012). Owed to its chemical inertness and physical properties, including transparency, strength, malleability,
Transcript of Migration of Minerals and Organic Compounds between ...

Annals of R.S.C.B., ISSN:1583-6258, Vol. 25, Issue 6, 2021, Pages. 12829 - 12843
Received 25 April 2021; Accepted 08 May 2021.
12829
http://annalsofrscb.ro
Migration of Minerals and Organic Compounds between Bottled Water and
its Plastic Packaging
Wafa Cheddadi1∗, Yamina Berredjeme
1, Achraf Hamrouni
2, Zhour Hattab
3,
Abdelhak Gheid1, Raouia Hamrouni
4
1 Water and environment science and technology laboratory, Faculty of Science and
Technology, Mohammed CherifMessadia University, Souk Ahras 41000, Algeria. 2Mines Metallurgy Materials Laboratory L3M National Hight school of Mines and
Metallurgy, Amar Laskri ,B.P.233,W129,Sidi Amar, R.P. Annaba 23000 Algeria 3Laboratory of Water Treatment and Valorization of the Industrial Waste, Faculty of
Sciences, Department of Chemistry, Badji-Mokhtar University, B.P.12, Annaba 23000, Algeria. 4LEREC, Department of physics, Badji-Mokhtar University, B.P.12, Annaba 23000,
Algeria.
ABSTRACT
Several studies have shown the bottle’s ingredients have been transported in water, this study
aims to investigate experimentally the migration of several minerals from water to PET bottles.
A series of water bottles were examined after exposure to extreme conditions of temperature(30,
60 and 90 days)(25, 35 and 45°C).The (AAS) to determine the concentration of Ca, Mg, Na, k,
Pb after 90 days showed a significant decrease and increased in the amount of minerals water
.the (TOC) concentration increases in mineral water when the temperature increases ,this is
confirmed by the FTIR analysis, proving the existence of minerals compounds from the water to
PET,and proven by analysis with (XRD).the study proves that the minerals have been
successfully implanted into the PET surface, as the (WLI), and hence this result suggests the
improvement of the hydrophilic property of the modified PET.
Keywords: Polymer, PET, Mineral Water, Pollution, Packaging.
Introduction
Packaging materials in contact with food play an unavoidable role in the conservation and
protection of foodstuffs. Also, they appeared a constant innovation like the development of
active and intelligent materials. The world consumption of bottled water is in constant evolution
due to the increased need for consumers to have access to the safe drinking water of an efficient
chemical and microbiological quality.In recent years, the packaged water sector in Algeria has
experienced exceptional development thanks to investment encouragement. This development
results in the establishment of dozens of exploitation and production units of packaged waters
throughout the national territory. Also, it was accompanied by an exceptional increase in the
consumption, whose part per capita has remarkably evolved in twenty years (4 L/capita/year in
1989 to 22 L/capita/year in 2007). In fact, thermoplastic packaging has grown considerably in
popularity since the beginning of the 1990s, and has become part of everyday life. Interestingly,
polyethylene terephthalate (PET) is a family of polyesters, a semi-crystalline plastic polymer (C.
Bach et al.,2012), and has gradually replaced other materials, such as polyvinyl chloride and
glass in the packaging of mineral water and beverages (Layal al Rayes et al.,2012). Owed to its
chemical inertness and physical properties, including transparency, strength, malleability,

Annals of R.S.C.B., ISSN:1583-6258, Vol. 25, Issue 6, 2021, Pages
Received 05 March 2021; Accepted 01 April 2021.
12830 http://annalsofrscb.ro
impermeability to gases, liquids and microorganisms, recyclability, lightness, and often lower
cost, it seems to be basically suitable for food packaging applications, especially in beverages
and drinking water. Further, PET is industrially synthesized by either two ways: the
transesterification of dimethyl terephthalate with ethylene glycol followed by
polycondensation(Konkol.2004) or the esterification of terephthalic acid and ethylene glycol, and
noteworthy, the polycondensation step is common to both synthesis pathways. In addition, PET
can be catalyzed by metal salts widely-used in the packaging in the food industry, and
specifically for water packaging, including natural mineral waters and spring waters whose
exploitation and protection are well-described in the National Executive DecreeN° 04-196, 2004.
Hence, natural mineral waters are defined as microbiologically healthy waters and obviously
distinguished from other waters intended for human consumption by their natural properties,
including purity, and typical content of mineral salts, and trace elements or other constituents.
These properties are assessed on geological, hydrogeological, physical, chemical,
physicochemical, microbiological, and pharmacological levels, making these natural mineral
waters therapeutically effective to human health. The qualification of these two types of waters
established in terms of this decree is alike to that provided by the guideline text related to the
natural mineral waters and spring waters. Whilst, several studies have shown that food contains
substances whose origin is controversial, and this refers to a probable hypothesis, indicating that
their presence is due to the migration of PET constituents such as monomers, additives and
unintentionally added substances (UAS) to bottled water (Fabrizio et al.,2018).Further, the
deterioration of the packaging and/or its contents during aging leads to a quality loss, product
returns, and consequently to a decrease in the company's brand image. Several types of
interactions due to physicochemical mechanisms occurred between a package (container) and the
packaged product (contents) are shown in fig.1 (Isabelle. S et al.,2011). The inertia of packaging
is rarely total since this polymer is not inert and may exchange and migrate between the plastic
and the food matrix, i.e. transfer to the food of constituents of the packaging material (additives,
monomers, neoformed compounds ...) (Westerhoff et al.,2008).Moreover, the interaction
between the container and the contents can lead to material transfers, causing, for example, an
alteration of the organoleptic properties of the food, and as a result, a toxicological problem may
arise (Djelloul et al.,1994). This contact container/content can also affect the packaging
mechanical properties (Konkol.2004).
• Sorption phenomena for which constituents of the food can be absorbed by the packaging,
which on the one hand harms the quality of the food and, on the other hand, can lead to
packaging deterioration.
• Permeation processes of which the sorption is overall, the first step characterizing the transfer
of volatile substances through the material; there may have either loss of aroma from the food or
food contamination by substances originating from the environment (gases, odours) or from the
external packaging wall (such as inks located on the surface of the packaging) which can have
negative effects both toxicologically and organoleptically(Isabelle.S et al., 2011).

Annals of R.S.C.B., ISSN:1583-6258, Vol. 25, Issue 6, 2021, Pages
Received 05 March 2021; Accepted 01 April 2021.
12831 http://annalsofrscb.ro
Fig1. Packaging/food material transfers.
These exchanges are affected by several factors, including the storage time and temperature, the
concentration of the migrant in the polymer, the type and nature of the migrant and the drink, and
the solubility of the migrant in the liquid (Rungchang et al., 2013), and whose activities can
toxicologically and organoleptically affect the food health and quality, and the packaging
properties. Nevertheless, the manufacturing process or unsafe storage conditions results in the
appearance of some contaminants in bottled water. In Algeria, the consumption of mineral water
and natural springs in PET bottles Algeria has increased considerably in recent years, and hence
the no less than 40 brands on the market results in incentives and support measures for investors
in this field. According to an investigation conducted by the Association of Algerian Beverage
Producers (AABP), the water consumption has increased from 4 L/capita in1990 to 23.4 L/capita
in2011,and although of this development, the lack of legislation on the use of plastic packaging
for food contact has led to excessive use of plastic packaging during production and storage, and
consequently threaten the consumer health. Therefore, the current legislation must guarantee the
protection of public health and, ensure the consumer interests with regard to the marketing
launch of materials and articles intended to be in contact with food. As previously reported
(Yingying et al., 2014,StefanieMaaß et al.,2017),PET is not inert and shows amass transfer with
water or soil. Additives containing impurities, which may infiltrate the packaging of chemical
mixtures with oestrogenic activity have been found in PET bottled mineral water (Yang et
al.,2011). Furthermore, the investigation of the migration of plastic packaging to foodstuffs is
one of the most important research interests in the field of food safety. Recently, the specific
migration of antimony in PET bottled water for all the studied bottles was reported to do not
exceed the value required by European and world legislation for different investigation
temperatures: 6°C, 25 °C and 40 ° C and for a duration ranging from 6 hours to 365 days of use.
The antimony content is higher in smaller bottles because it depends on the contact surface
related to the water volume, and of note, the diffusion coefficients were determined for
temperatures between 5 and 40°C (B..Zmit et al .,2019).Some inorganic species may be present
as residues of catalysts or additives used to produce PET. Antimony is considered the most
important inorganic compound that can migrate from the PET bottle to beverages. Regulation N°
[10/2011] sets the specific migration limit (SML) for the antimony of 0.04mg.kg-1
, and the
Environmental Protection Agency(EPA) sets an AML in drinking water of 6 µg.L-1 .Further, the
migration of the antimony (Sb) from PET into water increases rapidly during the first storage

Annals of R.S.C.B., ISSN:1583-6258, Vol. 25, Issue 6, 2021, Pages
Received 05 March 2021; Accepted 01 April 2021.
12832 http://annalsofrscb.ro
period and then slows down to a limit concentration (Keresztes et al., 2009). The addition of
plasticizers (phthalates and adipates) to plastic packaging is widely used to improve the
flexibility, workability and durability of polymers, particularly in polyvinyl chloride
(PVC)(Djelloul et al.,1994,Fierens et al., 2012).In addition, phthalates in food contact materials
are subjected to strict regulations and do not seem to be used in the manufacture of PET bottles.
As reported (C. Bach et al., 2012), the migration potential of stabilizers is not remarkable due to
their insolubility in water. and therefore, some research work focuses on the study of the
existence of more volatile, saturated and unsaturated carbonyl compounds responsible for the
bad taste of water bottles and humans death(LoPachin et al., 2014).These studies focused on the
release of initial PET reagents (monomers and catalysts), reaction by-products, and plastic
additives into bottled water. The properties of chemical additives present in plastics, including
migration, release, fate and environmental impact during use, disposal and recycling have been
well-documented (JN Hahladakis et al.,2018). Also, other study has reported the presence of
benzene, toluene, ethylbenzene, styrene (BTES), formaldehyde, acetaldehyde and benzaldehyde
in Lebanese polyethylene terephthalate (PET) bottled water (Layal al Rayes et
al.,2012).Moreover, Algeria is a country whose climate differs between the north and the south
(Sahara), but it faces incredible environmental contamination by various hazardous contaminants
threatening human health. Thus, we assume the necessity to acquire experimental data and to
share our results on this totally unknown problem in Algeria with the various actors (authorities,
consumers) and the scientific community. Here, we would focus on the study of the possible
contamination caused by plastic packaging used to package bottled water marketed in Algeria.
Several studies have shown that some of the bottle’s ingredients have been transported in water,
but the discussion of whether this water could lose some of its basic mineral components or not
remains unanswered. Thus, the objective of this research work is to assess the material transfer
phenomena (migration/absorption) of the constituents (monomers, catalysts, impurities,
additives, and neo-forms) from the packaging to the water, with respect to the following
quantitative, qualitative and sanitary point of view:
The characteristics of bottled water,
The physicochemical properties and structure of the polymer, making up the bottles.
The storage conditions of the bottles (time, temperature, and sun exposure),
The correlation between the physical properties of water packaging and the presence of
certain compounds in bottled water.
The present study was aimed to experimentally investigate the transfer of several minerals to
(PET) bottles. Herein, the purchased samples of two types of water (mineral water and spring
water) were stored in two different types of bottles (polyethylene terephthalate (PET) and glass),
and exposed to full sun for 30, 60 and 90 days, and T°C 25, 35 and 45 ° C.
A Shimadzu (Germany) atomic absorption spectrophotometer (AA 6300G) was used to
determine mineral concentrations in the mineral water, and a diffractometer (XRD) was used to
detect the presence of minerals in the bottles when exposed to water. In the second part of the
study, a concentration of organic matter was found in the mineral water using (TOC-LCSH /
TOC-LCSN (hereafter referred to as TOC-L) total organic carbon (TOC), white light
interferometry (WLI) and Fourier transform infrared analysis (FTIR) showed a change in the
composition of the topography of a bottle surface.

Annals of R.S.C.B., ISSN:1583-6258, Vol. 25, Issue 6, 2021, Pages
Received 05 March 2021; Accepted 01 April 2021.
12833 http://annalsofrscb.ro
3. Results and Discussion
3.1. White Light Microscope Interferometer FRT (WLI)
Fig.2 illustrates the surface topology variation of a PET bottle filled with water during 90. Here,
various bottle parts (neck, body and feet of the Type A bottle) were subjected to White Light
Microscopic Interferometer (WLI) examination. A difference in the shape of the surfaces can be
seen when changing the sampling location and, also the presence of new deposit components on
the surface, leading to its thickening. This is likely due to the transfer of minerals from the water
to the PET bottle. Further, a topography of peak-coherence interferometric surface was designed
and implemented for surface profiling. In this study, we noticed slight discrepancies in the results
of the prototype interferometer as evidenced by the validation process, while the overall surface
mapping is satisfactory and can be improved by the suggested items from the observations. Once
the initial configuration is completed, the measurement of a surface and its processing becomes
simple, even if the processing is not optimized for time. A non-homogeneous physical property,
the dispersion of water in the different PET and PET/water–polymeric matrix has been observed
by WLI. The observations carried out on the different nanocomposites(Abbas Ghanbari.2012)
revealed a set of isolated folds distributed homogeneously in the nanocomposites and with,
however, the existence of small stacks for the other part of the polymer. The folds seem to be
aligned in a privileged direction. Another consequence of the penetration of solvent into the
polymer is the swelling, damaging the internal structure of the polymer, which implies that the
sorption process of other food constituents is facilitated (Konkol. 2004).
Fig.2. White light interferometer (WLI) of the surface PET bottle filled with water for 90 Days at
25°C.

Annals of R.S.C.B., ISSN:1583-6258, Vol. 25, Issue 6, 2021, Pages
Received 05 March 2021; Accepted 01 April 2021.
12834 http://annalsofrscb.ro
3.2. Atomic Absorption Spectrophotometer (AAS)
3.2.1 Effects of storage time and temperature on the transfer characteristics between the
polyethylene terephthalate (PET) bottle and water.
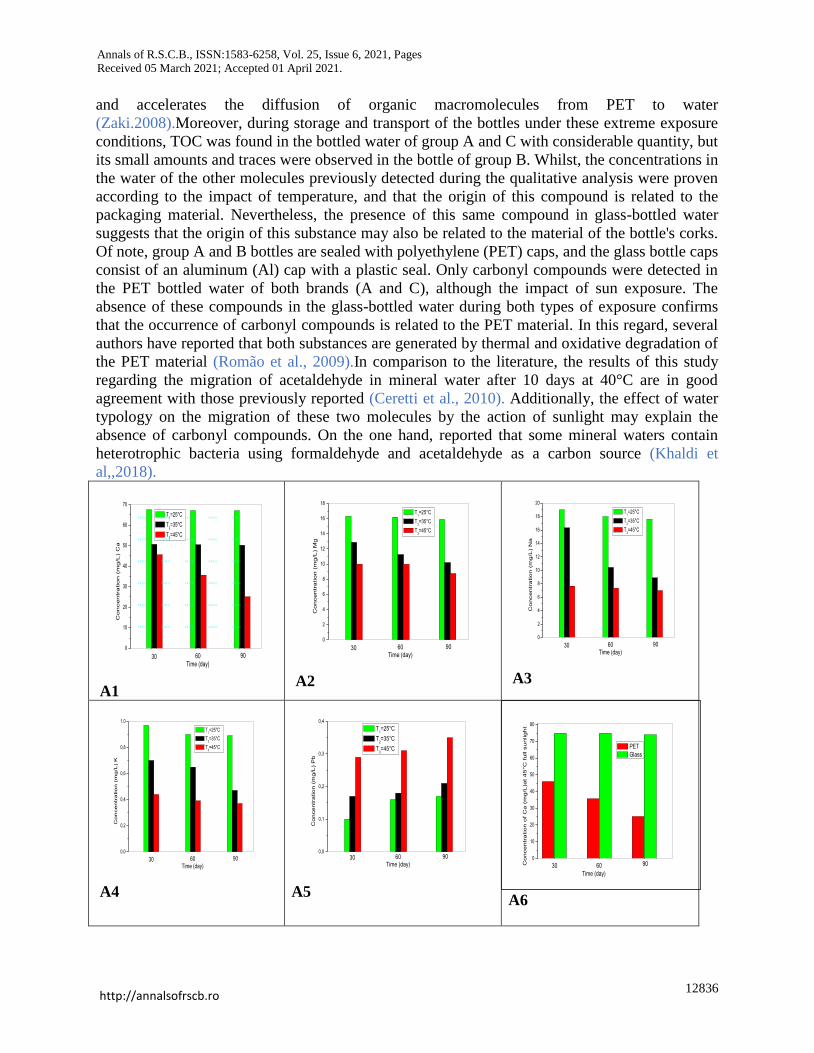
Fig.3 illustrates the evolution of the transient concentration at various temperatures. We note that
as time increases, the value of the mineral concentration decreases. The phenomenon is based on
the equilibrium process between the mass transfer of minerals from the water sample to the
adsorbent (PET bottles). A contact time between the adsorbent and the water reveals the
following element concentrations obtained at 25°C : [Ca] 67.12 mg/L, 16.19 mg/L [Mg],
17.6mg/L [Na] and 0.08 mg/L [K] for 60 days, and 0.17 mg/L of [ Pb](Krishan et al. ,2017,
Shweta et al. ,2019). It can be seen that as the temperature value highly increases, the mineral
concentration highly decreases, and hence, after 90 days the [Ca] value of 67.01 mg/L at 25°C is
gradually reduced to 50.20 mg/L at 35°C and 25.06 mg/L at 45°C (Natarianto et al., 2019). This
result can be explained by the transfer of minerals to the PET bottle, while the water showed the
presence of lead (Pb) whose concentration is calculated to prove the source of migration from the
packaged polymer. Hence, the presence of Pb can be explained by reverse migration (PET to
water), where Pb is one of the additives used in the manufacture of PET (C. Bach et al., 2012).
Fig.3 depicts the effect of time and temperature on the concentration of water-dissolved minerals
for PET bottles of type (A). The following results can be highlighted:
The effect of the time parameter on the transport of the mineral elements (Ca, Mg, Na and K)
is greater at a temperature between 45 and 35 °C than that at 25 °C (Fig.3 A).
The water concentration of each element (Ca, Mg Na and K) decreases during the same time
period with increasing temperature.
After 90 days, the Ca value is reduced by 67.1, 50.20 and 25.06 mg/L at 25, 35 and 45 °C
respectively.
The concentration of Pb released from the PET bottle increases with increasing time period
and temperature.
Lead (Pb) release increased from 0.1 mg/L at 25 °C to 0.17 mg/L at 35 °C, and 0.29 mg/L at
45 °C after 4 weeks of storage, from 0.16 mg/L at 25°C to 0.18 mg/L at 35°C and 0.31 mg/L
at 45°C after 8 weeks of storage, and from 0.17, 0.21 and 0.35 mg/L at 25, 35, and 45 °C
respectively, after 12 weeks of storage.
In this work, the absence of bacteria was found in the tested waters, and as a result, the
possibility of biological decomposition was ruled out due to the fact that sun exposure destroys
the microorganisms present in the water. The SODIS method (Solar Water Desinfection) is a
process based on the disinfection of water by solar irradiation to obtain drinking water free of
infectious germs (C. Bach. et al., 2012).Furthermore, the element found in water bottled in PET
and glass has been identified as exogenous, and this proves that lead (Pb) is a metal absent
in glass-bottled water. However, PET- bottled water (brand A and C) is remarkable because it
contains Pb at levels ranging from 0.13 to 0.29 mg/L. This metal is therefore derived from PET
packaging, but does not increase after 90 days at different exposure temperatures (25, 35 and
45°C).As expected, Pb is characteristic of PET- bottled water, and whose content evolves with
different exposure temperatures, i.e. its presence is not due to the geology of the soil, but it is
effective and well made from the manufacture of PET (J.N. Hahladakis et al., 2018).In addition,
all Pb levels detected in this study do not exceed the regulatory threshold of 40 mg/kg for the
regulation 10/2011.

Annals of R.S.C.B., ISSN:1583-6258, Vol. 25, Issue 6, 2021, Pages
Received 05 March 2021; Accepted 01 April 2021.
12835 http://annalsofrscb.ro
3.2.2 Effect of bottle type on mineral degradation at 45°C.
As shown in Fig.3(A6), a big difference between the two types of the manufactured bottles (PET,
glass). The obtained results were compared at a temperature of 45°C.
At the time of contact between adsorbent and water, the decrease is 6.08 mg/L Ca in the PET
bottle and 0.99 mg/L Ca in the glass bottle for 60 days.
The decrease in Ca concentration is greater as the contact time increases for the PET bottle,
since the Ca concentration becomes constant in the glass bottle.
Conclusively, the glass has better characteristics for water conservation (reducing the effect
of material transfer). This result concord with the published research literature (Layegh et al.,
2019).
3.2.3. Effect of water type on mineral degradation at 35°C
The comparison of the evolution of mineral and Pb concentration for two types of water (mineral
water and spring water) as a function of time is shown in Fig.3(A5). Several physicochemical
parameters play a key role during the process of mineral transport in water.
Pb release increases from 0.22 mg/L to 0.27 mg/L and 0.29 mg/L for 4 weeks, 8 weeks and
12 weeks respectively, in mineral water at 35°C.
Pb release increases from 0.17 to 0.18 and 0.21 mg/L for 4, 8 and 12 weeks respectively, in
spring water at 35°C.
As can be deduced from fig.3, the rate of degradation increases when the concentration of
minerals increases, and this is evidenced by the Ca values. This result can be explained by the
presence of diffusion phenomena (Pauline et al.,2018). Monomers, known as stabilizers and
technological adjuvants are usually lipophilic molecules, and even though their possible
diffusion in aqueous foods, they migrate more in fatty foods. In terms of interaction, there is a
possibility of penetration of the contact medium into the polymer packaging depending on their
affinity, for example fat in polyolefins or water in PET.
3.3. Total Organic Carbon (TOC)
The total organic carbon (TOC) content is a key parameter in controlling the stability of bottled
water. Fig.3 (B1-B2) illustrating the impact of sunlight and temperature on PET- and glass-
bottled water shows that the TOC concentration gradually increases as the temperature rises.
Also, TOC is found in type A and C bottled water in considerable quantities, but a small amount
and just traces are detected in the type B bottle. This result is likely explained by the migration of
TOC from PET bottles to mineral water, as confirmed by infrared absorption analysis. However,
the presence of the same compound in the glass-bottled water suggests that the origin of this
substance may also be related to the (polyethylene) stopper of the bottle (Romão et al.,
2009).Importantly, an equilibrium of chemical potential of PET packaging and water as far as
organic matter is concerned. The impact of sunlight and temperature on PET-and glass-bottled
water was assessed using the Total Organic Carbon (TOC) analysis method. In a first approach,
only bottled water that has undergone the maximum conditions of sun exposure (90 days of
contact with a temperature variation of 25 to 45°C) was analysed. This approach is based on the
hypothesis that under these conditions, the migration of the elements would be more important
due to a temperature close to the glass transition temperature (Tg) of PET. This introduction of
molecules into all the macromolecular chains leads to a decrease in the Tg value of the polymer
Annals of R.S.C.B., ISSN:1583-6258, Vol. 25, Issue 6, 2021, Pages
Received 05 March 2021; Accepted 01 April 2021.
12836 http://annalsofrscb.ro
and accelerates the diffusion of organic macromolecules from PET to water
(Zaki.2008).Moreover, during storage and transport of the bottles under these extreme exposure
conditions, TOC was found in the bottled water of group A and C with considerable quantity, but
its small amounts and traces were observed in the bottle of group B. Whilst, the concentrations in
the water of the other molecules previously detected during the qualitative analysis were proven
according to the impact of temperature, and that the origin of this compound is related to the
packaging material. Nevertheless, the presence of this same compound in glass-bottled water
suggests that the origin of this substance may also be related to the material of the bottle's corks.
Of note, group A and B bottles are sealed with polyethylene (PET) caps, and the glass bottle caps
consist of an aluminum (Al) cap with a plastic seal. Only carbonyl compounds were detected in
the PET bottled water of both brands (A and C), although the impact of sun exposure. The
absence of these compounds in the glass-bottled water during both types of exposure confirms
that the occurrence of carbonyl compounds is related to the PET material. In this regard, several
authors have reported that both substances are generated by thermal and oxidative degradation of
the PET material (Romão et al., 2009).In comparison to the literature, the results of this study
regarding the migration of acetaldehyde in mineral water after 10 days at 40°C are in good
agreement with those previously reported (Ceretti et al., 2010). Additionally, the effect of water
typology on the migration of these two molecules by the action of sunlight may explain the
absence of carbonyl compounds. On the one hand, reported that some mineral waters contain
heterotrophic bacteria using formaldehyde and acetaldehyde as a carbon source (Khaldi et
al,,2018).
0
10
20
30
40
50
60
70
Time (day)
906030
T1=25°C
T2=35°C
T3=45°C
Co
nce
ntr
atio
n (
mg
/L) C
a
d e m o d e m o d e m o d e m o d e m o
d e m o d e m o d e m o d e m o d e m o
d e m o d e m o d e m o d e m o d e m o
d e m o d e m o d e m o d e m o d e m o
d e m o d e m o d e m o d e m o d e m o
d e m o d e m o d e m o d e m o d e m o
A1
0
2
4
6
8
10
12
14
16
18
Time (day)
906030
T1=25°C
T2=35°C
T3=45°C
Co
nce
ntr
atio
n (
mg
/L)
Mg
A2
0
2
4
6
8
10
12
14
16
18
20
Time (day)
906030
T1=25°C
T2=35°C
T3=45°C
Co
nce
ntr
atio
n (
mg
/L)
Na
A3
0,0
0,2
0,4
0,6
0,8
1,0
Time (day)
906030
T1=25°C
T2=35°C
T3=45°C
Co
nce
ntr
atio
n (
mg
/L) K
A4
0,0
0,1
0,2
0,3
0,4
Time (day)
906030
T1=25°C
T2=35°C
T3=45°C
Co
nce
ntr
atio
n (
mg
/L)
Pb
A5
A6
0
10
20
30
40
50
60
70
80
906030Co
nce
ntr
atio
n o
f C
a (
mg
/L)a
t 4
5°C
fu
ll s
un
lig
ht
PET
Glass
Time (day)

Annals of R.S.C.B., ISSN:1583-6258, Vol. 25, Issue 6, 2021, Pages
Received 05 March 2021; Accepted 01 April 2021.
12837 http://annalsofrscb.ro
0
5
10
15
20
25
30
35
40
45
50
55
60
65
70
75
80
85
90
95
906030
PET(A)
TO
C (
mg
/L
)
Time(day)
TOC at 25°C
TOC at 35°C
TOC at 45°C
B1
0
5
10
15
20
25
30
35
40
45
50
55
60
65
70
75
80
85
90
95
906030
PET(C)
TOC at 25°C
TOC at 35°C
TOC at 45°C
TO
C (
mg
/L
)
Time(day)
B2
Fig.3 Effect of the temperature and time on the transient concentration for PET bottle type
(A): A- of the minerals (Ca, Mg, Na ,K and Pb) in mineral water. A6-Transient concentration
of the calcium of mineral water in PET bottle and glass bottle at 45 ° C. B-Transient
concentration of total organic carbon in PET- and glass-bottled mineral water at a different
time.
3.4 Fourier Transform Infrared Spectrum (FTIR) analysis
Fourier Transform Infrared Spectroscopy (FTIR) is a widely used analysis method to study the
nature of chemical bonds in polymers and their structural state by characterizing vibrational
modes. We can easily monitor the chemical and morphological transformations of polymers
under different stresses (M. Djebara et al.,2012). The infrared spectrum is formed as a result of
the absorption of electromagnetic radiation at frequencies corresponding to the vibration of
specific sets of chemical bonds within a molecule .As depicted in Figure 8 showing the FTIR
spectra of plastic PET bottles, the characteristic bands of the FTIR spectrum show that plastics
are made from PET. Further, the absorption bands Fig.4 at 3100-2800 cm-1 have been assigned
to an aromatic and aliphatic -C - H stretch bond, 1720 cm-1
to the carbonyl ester stretch bond,
1300 cm-1
to the ester stretch group and 1100 cm-1
to the methylene group. Most bands differ
depending on that the PET sample was extruded and quenched, heat-treated and then drawn, i.e.
whether the sample is amorphous and oriented, or crystalline and drawn. The differences are due
to the configuration of the ethylene glycol group and also phenylene carbonyl bonds (cis / trans
conformers) (Ziyu et al.,2012).Importantly, chemical additives present in trace amounts and
related to the manufacture of the polymer or vial are not observed, but these traces and
degradation products could migrate from the bottle to the water. Thus, analytical methods
enabling the detection of these substances in water with low detection limits have been
developed. To achieve this goal, a screening analytical method has been designed, as well as the
separation and identification of these compounds are in progress (JN Hahladakis et al.,2018).The
FTIR spectrum analysis method for the bottle without water shows a wide band in the region of
1000 to 1500 cm-1
. This may be due to the additives present in the PET bottle Fig.4.Whilst, other
absorption bands were detected at 3440 cm-1
(O-H, stretch), 2516, 2348 and 1796 cm-1
(C = O;
calcite, CaCO3), 1640 cm-1
(H-O-H, bond), 1423 cm-1
(C = O e OH, stretch), 1000 (Si-O.);
silicate, C-S-H), 874 cm-1
(C = O, drawing, calcite, CaCO3) ,776 cm-1
(Si-O-Si, symmetrical
drawing), 713 cm-1
(CO3, drawing), 678-648 cm-1
(SiO4, drawing) and 583-414 cm-1
(Fe-O-Fe,
drawing) (Ana Paula et al., 2017).
Annals of R.S.C.B., ISSN:1583-6258, Vol. 25, Issue 6, 2021, Pages
Received 05 March 2021; Accepted 01 April 2021.
12838 http://annalsofrscb.ro
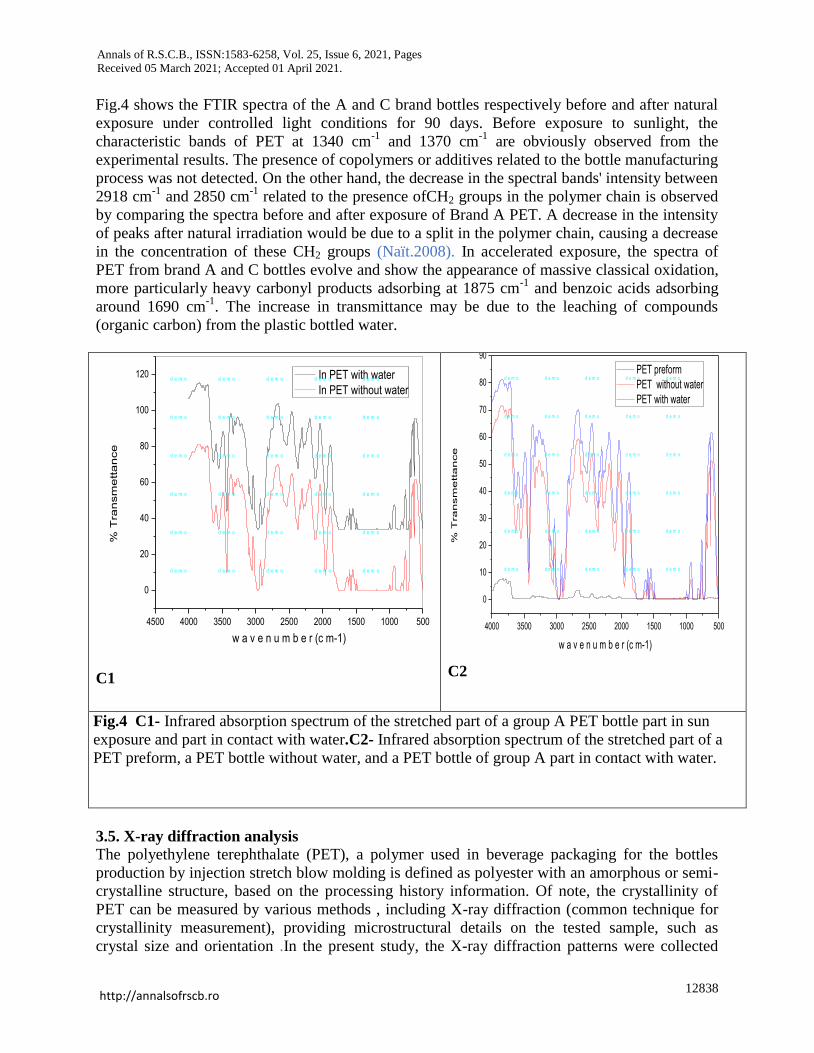
Fig.4 shows the FTIR spectra of the A and C brand bottles respectively before and after natural
exposure under controlled light conditions for 90 days. Before exposure to sunlight, the
characteristic bands of PET at 1340 cm-1
and 1370 cm-1
are obviously observed from the
experimental results. The presence of copolymers or additives related to the bottle manufacturing
process was not detected. On the other hand, the decrease in the spectral bands' intensity between
2918 cm-1
and 2850 cm-1
related to the presence ofCH2 groups in the polymer chain is observed
by comparing the spectra before and after exposure of Brand A PET. A decrease in the intensity
of peaks after natural irradiation would be due to a split in the polymer chain, causing a decrease
in the concentration of these CH2 groups (Naït.2008). In accelerated exposure, the spectra of
PET from brand A and C bottles evolve and show the appearance of massive classical oxidation,
more particularly heavy carbonyl products adsorbing at 1875 cm-1
and benzoic acids adsorbing
around 1690 cm-1
. The increase in transmittance may be due to the leaching of compounds
(organic carbon) from the plastic bottled water.
4500 4000 3500 3000 2500 2000 1500 1000 500
0
20
40
60
80
100
120
% T
ran
sm
etta
nce
w a v e n u m b e r (c m-1)
In PET with water
In PET without waterd e m o d e m o d e m o d e m o d e m o
d e m o d e m o d e m o d e m o d e m o
d e m o d e m o d e m o d e m o d e m o
d e m o d e m o d e m o d e m o d e m o
d e m o d e m o d e m o d e m o d e m o
d e m o d e m o d e m o d e m o d e m o
C1
4000 3500 3000 2500 2000 1500 1000 500
0
10
20
30
40
50
60
70
80
90
% T
ra
nsm
etta
nce
w a v e n u m b e r (c m-1)
PET preform
PET without water
PET with water
d e m o d e m o d e m o d e m o d e m o
d e m o d e m o d e m o d e m o d e m o
d e m o d e m o d e m o d e m o d e m o
d e m o d e m o d e m o d e m o d e m o
d e m o d e m o d e m o d e m o d e m o
d e m o d e m o d e m o d e m o d e m o
C2
Fig.4 C1- Infrared absorption spectrum of the stretched part of a group A PET bottle part in sun
exposure and part in contact with water.C2- Infrared absorption spectrum of the stretched part of a
PET preform, a PET bottle without water, and a PET bottle of group A part in contact with water.
3.5. X-ray diffraction analysis
The polyethylene terephthalate (PET), a polymer used in beverage packaging for the bottles
production by injection stretch blow molding is defined as polyester with an amorphous or semi-
crystalline structure, based on the processing history information. Of note, the crystallinity of
PET can be measured by various methods , including X-ray diffraction (common technique for
crystallinity measurement), providing microstructural details on the tested sample, such as
crystal size and orientation .In the present study, the X-ray diffraction patterns were collected

Annals of R.S.C.B., ISSN:1583-6258, Vol. 25, Issue 6, 2021, Pages
Received 05 March 2021; Accepted 01 April 2021.
12839 http://annalsofrscb.ro
from the PET bottles of brand A and C under certain experimental conditions (contact time,
ordinary temperature and selected temperature, exposure to sunlight).The different diffraction
peaks can be observed in Fig.5showing a wide band and, also, good diffraction peaks at 2 θ =
11° and 12° as reported elsewhere(H. Liu et al.,2018), 2 θ = 8.9° and 19.7°, indicating the
coexistence of amorphous and crystalline regions in the structure, while the broadest peaks of the
order 2 θ = 12-34° are attributed to amorphous PET ( G. Galo Silva et al.,2019,Z. Zhang et al
.,2019,Y. Zhang et al.,2020).A previous study(AirongXuet al.2020) has suggested that the
crystallinity of Methylcellulose(MC) and PET is reduced after hybridization of MC with PET.
Furthermore, in relation to the pure MC and PET, the values 2 θ of MC and PET in MC / PET
films remain invariable, suggesting that MC interacts little and/or weakly with PET, in addition
that a PET spectrum represents anamorphous structure as reported by (V. Shabafrooz ,and
al.2018) . (Johra FT and al .2014)who have found the graphene peak (002) was observed at 2θ=
26.54°, indicating the presence of platelets (Johra FT and al .2014).The intensity of the peak
increased with the increase of the GrapheneNanoplatelets (GNP) Concentration, and here, the
nanocomposite draw-barsexhibit a wide-hump around 2 θ = 19°. As indicated by the XRD
analysis, the GNPs exhibit an orientation along the axial direction of the PET tensile stress. This
orientation of the GNPs more effectively, reinforced the PET matrix by providing superior
mechanical properties compared to a random orientation distribution(V. Shabafrooz ,and
al.2018)of the typical XRD spectra of PET samples before and after Ag+ implantation. As well,
the XRD model of the implanted silver ion PET shows a significant difference from the control
PET. The diffraction peaks at 2θ=38.1°, 64.7° and 77.5° correspond to the crystallinity of
Ag2CO3, Ag2O. This XRD analysis confirms that silver has been implanted on the surface of the
PET (J.X. Li, and al.2007).The XRD units in all composite samples showed marked peaks that
the huntite-hydromagnesite particles were homogeneously dispersed and buried within the
matrix polymer (E.Basturk, and al.2015).As expected, the presence of crystalline structures in
the degraded polymer may cause the appearance of a white powder-like substance on the surface
of the degraded transparency sheet. These values (2θ) were matched with the XRD of published
phthalate-related compounds, since the XRD of the degraded polyethylene terephthalate revealed
the presence of three types of phthalate derivatives(C. Sharon, and al. 2012).Furthermore, the
crystallinity or more packing in the mainline of our commercial chitosan has been modified
using a deacetylation process. In this case, the first reflection is associated with two different
types of crystals. According to (Hwang KT, and al.2003).A number of crystalline peaks were
observed for pure PET (without water), which can be attributed to the semi-crystalline structure
of this polymer, meanwhile, only a small visible difference was observed between the model
PET XRDs with the appearance of the following molecules: SiO2quarte, Green cinnabar (Cr2O3),
sucrose (C12H22O11)Fig.5 D1, since the XRDs of the PET bottle of Group A shows the presence
of Calcite (CaCO3), Bornite (Cu5FeS4),Sodium Erbium NaErF4 Fig.5 D2,and the XRD of the
PET bottle of Group C reveals the presence of Halite NaCl ,Fluorite (CaF2), Calcite
(CaCO3)shown in detail in Fig.5 D3. Additionally, the X-ray diffraction models shows that the
spectra are quite similar and resemble to the XRD PET model, showing the difference in the
additives and stabilizers that have entered in the PET manufacturing process according to very
precise conditions. The amount of biopolymer reduces the intensity of diffraction peaks,
characterizing the spectra as semi-crystalline phases.

Annals of R.S.C.B., ISSN:1583-6258, Vol. 25, Issue 6, 2021, Pages
Received 05 March 2021; Accepted 01 April 2021.
12840 http://annalsofrscb.ro
-1000 0 1000 2000 3000 4000 5000 6000 7000-200
0
200
400
600
800
1000
1200
1400
1600
1800
Inte
nsité
Position [°2 Theta]
without water
SiO2
Cr2O
3SiO
2
C12
H22
O11
d e m o d e m o d e m o d e m o d e m o
d e m o d e m o d e m o d e m o d e m o
d e m o d e m o d e m o d e m o d e m o
d e m o d e m o d e m o d e m o d e m o
d e m o d e m o d e m o d e m o d e m o
d e m o d e m o d e m o d e m o d e m o
d e m o d e m o d e m o d e m o d e m o
D1
-1000 0 1000 2000 3000 4000 5000 6000 7000
0
1000
2000
3000
4000
5000
Inte
nsité
Position [°2 Theta]
CaCO3:Calcite
Cu5FeS
4: Bornite
NaErF4:Sodium erbium
CaCO3Cu
5FeS
4
NaErF4
C12
H22
011
d e m o d e m o d e m o d e m o d e m o
d e m o d e m o d e m o d e m o d e m o
d e m o d e m o d e m o d e m o d e m o
d e m o d e m o d e m o d e m o d e m o
d e m o d e m o d e m o d e m o d e m o
d e m o d e m o d e m o d e m o d e m o
d e m o d e m o d e m o d e m o d e m o
D2
-1000 0 1000 2000 3000 4000 5000 6000 7000
-1000
0
1000
2000
3000
4000
5000
6000
Inte
nsité
Position [°2 Theta]
CaCO3: Calcite
NaCl: Halite
CaF2: Fluorite
SiO2: Quartz
Ca
CO
3
SiO
2
Ca
F2
Na
CL
d e m o d e m o d e m o d e m o d e m o
d e m o d e m o d e m o d e m o d e m o
d e m o d e m o d e m o d e m o d e m o
d e m o d e m o d e m o d e m o d e m o
d e m o d e m o d e m o d e m o d e m o
d e m o d e m o d e m o d e m o d e m o
d e m o d e m o d e m o d e m o d e m o
D3
Fig.5 D1- X-ray diffractogram of PET bottled without water,D2- X-ray diffractogram of PET bottled
water from group A, D 3- Optical RX diffractogram for the PET bottle with group C
4. Conclusion
The present work has highlighted the migration of minerals in various bottled waters subjected to
different temperatures and exposure durations, in addition to the organic compounds and
minerals that were expected to be detected in PET bottled water. It was shown also that high
temperature (45°C) and long storage time (90 days) promote the migration process. The results
of the white light interferometric and FTIR analyses showed a change in the composition of the
topography of the bottle surface, showing a difference in the surfaces shape in the case when the
sampling locations are changed. Further, the atomic absorption spectrophotometer analysis has
evidenced the effects of storage time and temperature on the water transfer characteristics in PET
bottles, and on the degradation of minerals of PET-bottled water. It has been shown that the
effect of time parameter on the mineral elements (Na, K, Ca and Mg) transport is greater for
temperatures of 45 and 35 °C than that for 25 °C. At the same time, the concentration of each
element (Na, K, Ca and Mg) in water decreases with increasing temperature. After 90 days, the
Ca value decreases significantly by 67.1, 50.20 and 25.06 mg/L at 25, 35 and 45 °C respectively,
while the concentration of lead (Pb) in water increases slightly with temperature and time, and so
increases from 0.17, 0.21 and 0.35 mg/L at 25, 35 and 45 °C respectively. This result can be
explained by the transfer of minerals to the PET-bottles (water- PET), and the reverse transfer of
Pb to water (PET - Water).Regarding the effect of bottle type on mineral degradation at 45°C in
full sunlight, the decrease in Ca concentration was found to be greater when the contact time
increases in the PET bottle, and constant in the glass bottles, and consequently, the glass bottle
has better characteristics for conservation in accordance with the literature. At 35° C, as the
concentration of minerals increases, the rate of degradation intensifies due to the phenomenon of
diffusion, in addition, that the TOC concentration increases progressively in mineral water as the
temperature rises. Moreover, the FTIR analysis obviously indicates the increase in transmission
from the bottle to the water due to the leaching of compounds (Organic Carbon) from the plastic
bottle to the water. Interestingly, X-ray diffraction (XRD) was used to characterize the surface
structure and composition. The results indicated that the minerals have been successfully

Annals of R.S.C.B., ISSN:1583-6258, Vol. 25, Issue 6, 2021, Pages
Received 05 March 2021; Accepted 01 April 2021.
12841 http://annalsofrscb.ro
implanted into the PET surface, suggesting that the hydrophilic property of the modified PET is
enhanced.
Refrences 1. Abbas ghanbari, 2012.morphology and properties of poly (ethylene terephthalate) / clay
nanocomposites, thesis presented in view of obtaining the diploma of philosophiae doctor
(chemical engineering).
2. Airongxu, yongxinwang, xingminxu, zhihongxiao, and rukuanliu .2020, a clean and
sustainable cellulose-based composite film reinforced with waste plastic polyethylene
terephthalate Hindawi advances in materials science and engineering 2020, article id
7323521, 7 pages.
3. Ana paula dos santospereira, marcelohenriqueprado da silvaa, édiopereira lima júniora,
andersan dos santospaulaa, fláviojamestommasinia. 2017, processing and characterization
of pet composites reinforced with geopolymer concrete waste, materials research. 2017;
20 (suppl. 2): 411-420.
4. B. Zmit& n. Belhaneche-bensemra2019. (Antimony leaching from pet plastic into bottled
water in algerian market, springer nature switzerlandag 2019).
5. C. Bach, Dauchy, x., Chagnon, mc, etienne, s., Chemical compounds and toxicological
assessments of drinking water stored in polyethylene terephthalate (pet) bottles: a source
of controversy reviewed, water research, 2012, 46, p . 571-583.
6. Ceretti, e., Zani, c., Zerbini, i., Guzzella, l., Scaglia, m., Berna, v., Donato, f., Monarca, s.
Etferetti, d., 2010. Comparative assessment of genotoxicity of mineral water packed in
polyethylene terephthalate (pet) and glass bottles. Water research 44 (5), 14621470.
7. Chetna sharon and madhurisharon, (2012). Studies on biodegradation of polyethylene
terephthalate: a synthetic polymer, journal of microbiology and biotechnology
research2012.
8. Djelloul, messadi and abd-el-hakgheid 1994: study of the transfers of matter between a
plasticizer dispersed in a pvc disc and eur food liquids. Polym. J. Vol. 30, no. 2, pp. 167-
173.
9. Emrebasturk, seyfullahmadakbas, betulkaradogan, memetvezirkahraman (2015),
preparation and thermal properties of polyethylene terephthalate / huntite –
hydromagnesite composites, wiley, polymer composites — 2015.
10. Fabrizio. cincotta , al 2018: non-intentionally added substances in pet bottled mineral
water during the shelf-life; eur food res technol 244: 433–439.
11. Fierens, t., Servaes, k., Van holderbeke, m., Geerts, l., De henauw, s., Sioen, i.,
Vanermen, g., Analysis of phthalates in food products and packaging materials sold on
the belgian market, food and chemical toxicology, 2012, 50, p.2575–2583.
12. G. Galosilva, m. LDC Valente, l. Bachmann, and a. C. Dos reis, ―use of polyethylene
terephthalate as a prosthetic component in the prosthesis on an overdenture implant,‖
materials science and engineering: c, vol. 99, pp. 1341–1349,2019.
13. H. Liu, c. Liu, s. Peng, b. Pan, and c. Lu, ―effect of poly-ethyleneimine modified
graphene on the mechanical and water vapor barrier properties of methyl cellulose
composite films,‖ carbohydrate polymers, vol. 182, pp. 52–60, 2018.
14. Hazzab, a.2011. Natural mineral waters and spring waters in Algeria, c. R. Geoscience,
343,20-31.

Annals of R.S.C.B., ISSN:1583-6258, Vol. 25, Issue 6, 2021, Pages
Received 05 March 2021; Accepted 01 April 2021.
12842 http://annalsofrscb.ro
15. Isabelle severin, anne-marieriquet b, marie-christinechagnona,: risk assessment and
management — food contact packaging materials, risk assessment and management —
food contact materials, nutrition and dietetic notebooks (2011) 46, 59 —66.
16. John n. Hahladakis a, costas a. Velis a, roland weber b, eleniiacovidoua, philpurnell. / an
overview of chemical additives present in plastics: migration, release, fate and
environmental impact during their use, disposal and recycling, journal of hazardous
materials 344 (2018) 179–199).
17. Johraft, lee jw, jungwg (2014) Facile and safe graphene preparation on solution based
platform. J indengchem 20 (5): 2883–2887.
18. Jx Li, j. Wang, lrShen, zjXu, p. Li, gj Wan, n. Huang (2007), the influence of
polyethylene terephthalate surfaces modified by silver ion implantation on bacterial
adhesion behavior, surface & coatings technology 201 (2007) 8155–8159.
19. Keresztes, s., Tatár, e., Mihucz, vg, virág, i., Majdik, c., Záray, g., Leaching of antimony
from polyethylene terephthalate (pet) bottlesinto mineral water, science of the total
environment, 2009, 407.16, p.4731-4735.
20. f .Khaldi, smati h, grara n, smati n, maizi n, boukehili k, gheid a, 2018: measurement and
control of the properties of some groundwater in the metropolitan area of ouleddriss,
algeria, environment, risks and health journal. vol 17, no 3: 253-261.
21. Konkol, l. (2004). Contaminants levels in recycled pet plastic.victoria (australia):
swinburne university of technology. 319p. Thesis: environment and biotechnology:
victoria (australia): 2004.
22. Krishan, k, g., Basheshwar, p. , 2017.treatment of toxic pollutants of purified terephthalic
acid waste water: a review. environmental technology & innovation, volume 8, pages
191-217.
23. L. Al rayes, co Salibab, a. Ghanemb and j. Randona2012, BTES and aldehydes analysis
in pet-bottled water in lebanon (food additives and contaminants: part b 2012.
24. Layegh, k., Maki, a, m., Reza, r., Hiua, d., Kaan, y., 2019.led-activated immobilized fe-
ce-n tri-doped tio2 nano catalyst on glass bed for photo catalytic degradation organic dye
from aqueous solutions environmental technology & innovation, volume 15, article
100411.
25. Lopachin, rm., Gavin, t., 2014. Molecular mechanisms of aldehyde toxicity: a chemical
perspective. Chem res toxicol 27: 1081–1091.
26. M. Djebara a, jpStoquert b, m. Abdesselam a, d. Muller b, ac Chami a 2012, ftir analysis
of polyethylene terephthalate irradiated by mev he +, nuclear instruments and methods in
physics research b 274 (2012) 70–77.
27. M Kavitha, Z. H. Mahmoud, KakarlaHari Kishore, AM Petrov, AleksandrLekomtsev,
PavelIliushin, Angelina OlegovnaZekiy, Mohammad Salmani. application of Steinberg
Model for Vibration Lifetime Evaluation of Sn-Ag-Cu-Based Solder Joints in Power
Semiconductors. IEEE Transactions on Components, Packaging and Manufacturing
Technology. 2021; 11(3):444-450.
28. Naït- ali, kl, 2008. Recycled fart in food packaging: experimental approach and
modeling, University of Montpellier II.
29. Natariantoindrawan, sayeedmohammad, ajaykumar, raymond l. Huhnke, .2019.modeling
low temperature plasma gasification of municipal solid waste, environmental technology
& innovation 15 (2019) 100412.

Annals of R.S.C.B., ISSN:1583-6258, Vol. 25, Issue 6, 2021, Pages
Received 05 March 2021; Accepted 01 April 2021.
12843 http://annalsofrscb.ro
30. Oussamazaki, 2008 contribution to the study and modeling of the influence of mass
transfer phenomena on the mechanical behavior of polypropylene bottles, the University
of Paris-Est.
31. Pauline, s., Virginie, marry, b, noetinger, carlos., Nieto, d., Benjamin, r., Mineral- and
ion, s., 2018. Effects at clay – water interfaces: structure, diffusion, and hydrodynamics,
j. Phys. Chem. C, 122, 32, 18484.
32. Romão, w., Spinaceous, mas Et de paoli, ma, 2009b. Poly (ethylene terephthalate), pet: a
review on the synthesis processes, degradation mechanisms and its recycling
(portuguese). Polímeros: ciência e tecnologia 19 (2), 121-132.
33. Rungchang, s., Numthuam, s., Qiu, x., Li, y., &Satake, t. (2013). Diffusion coefficient of
antimony leaching from polyethylene terephthalate bottles into beverages. Journal of
food engineering, 115, 322–329.
34. Shweta, j., Babita, s., Pratyoosh, s., 2019.integrated approaches in microbial degradation
of plastics environmental technology & innovation, in press, journal pre-proof, article
100567.
35. Stefanie maaß,danieldaphi,anikalehmann ,matthiasc.rillig transport of microplastics by
two collembolan species, environmental pollution,volume 225, June 2017, pages 456-
459.
36. Vahidshabafrooz, sudheerbandla, masoudallahkarami, jay c. Hanan (2018), graphene /
polyethylene terephthalate nanocomposites with enhanced mechanical and thermal
properties, Journal of polymer research (2018).
37. Westerhoff, p., Prapaipong, p., Shock, e., &Hillaireau, a. (2008) antimony leaching from
polyethylene terephthalate (pet) plastic used for bottled drinking water. Water research,
42 (3), 551–556.
38. Y. Zhang, h. Jiang, k. Wang, h. Wang, and c. Wang, ―green flotation of polyethylene
terephthalate and polyvinyl chloride assisted by surface modification of selective caco3
coating,‖ journal of cleaner production, vol. 242, p. 118441, 2020.
39. Ying-yingfan,jian-lun, zhengjing-huarenjunluoxin-yicuilena q.maeffects of storage
temperature and duration on release of antimony and bisphenol a from polyethylene
terephthalate drinking water bottles of china,environmental pollutionvolume 192,
September 2014, pages 113-120.
40. Zaid Hamid Mahmoud. The Magnetic Properties of Alpha Phase for Iron Oxide NPs that
41. Prepared from its Salt by Novel Photolysis Method. Journal of Chemical and
Pharmaceutical Research, 2017, 9(8):29-33
42. Ziyuchen, jn Hay, mj Jenkins (2012), FTIR spectroscopic analysis of polyethylene
terephthalate on crystallization, European polymer journal 48 (2012) 1586–1610.
43. Zaid Hamid Mahmoud, MarwaSabbarFalih, OmaimaEmadKhalaf, Mohammed Alwan
Farhan, Farah Kefah Ali. Photosynthesis of AgBr Doping TiO2 Nanoparticles and
degradation of reactivered 120 dye. J AdvPharmEduRes 2018;8(4):51-55.