MIGRATION IN ALBANIA - United Nations · Preface and Acknowledgment The 2011 Population and Housing...
67
Swiss Agency for Development and Cooperation SDC MIGRATION IN ALBANIA MAY, 2014
Transcript of MIGRATION IN ALBANIA - United Nations · Preface and Acknowledgment The 2011 Population and Housing...

Swiss Agency for Development and Cooperation SDC
MIGRATION IN ALBANIAM A Y , 2 0 1 4

MIGRATION IN ALBANIA
May, 2014
Director of the Publication:
Gjergji FILIPI, PhD
INSTAT
Emira Galanxhi Majlinda NesturiLedia Thomo
TECHNICAL ASSISTENCE
Elira JorgoniDidier Ruedin
Copyright © INSTAT 2014
No part of this publication can be reproduced or transmitted in any form or by any means without the prior written permission of the copyright holder.
INSTITUTI I STATISTIKAVE
Blv. “Zhan D’Ark” Nr. 3, TiranëTel : + 355 4 2222411 / 2233356Fax : + 355 4 2228300E-mail : [email protected]
Printing house:

Preface and Acknowledgment The 2011 Population and Housing Census of Albania is the 11th census performed in the history of Albania. The preparation and implementation of this commitment required a significant amount of financial and human resources. For this INSTAT has benefitted by the support of the Albanian government, the European Union and international donors. The methodology was based on the EUROSTAT and UN recommendations for the 2010 Population and Housing Censuses, taking into consideration the specific needs of data users of Albania.
In close cooperation with international donors, INSTAT has initiated a deeper analysis process in the census data, comparing them with other administrative indicators or indicators from different surveys. The deepened analysis of Population and Housing Census 2011 will serve in the future to better understand and interpret correctly the Albanian society features. The information collected by census is multidimensional and the analyses express several novelties like: Albanian labour market and its structure, emigration dynamics, administrative division typology, population projections and the characteristics of housing and dwelling conditions.
The series of these publications presents a new reflection on the situation of the Albanian society, helping to understand the way to invest in the infrastructure, how to help local authorities through urbanization phenomena, taking in account the pace of population growth in the future, or how to address employment market policies etc.
The five editions of this series are in-depth analysis conducted by INSTAT in collaboration with the University of Geneva, University of Neuchâtel and Urban Research Institute, and supported financially by the SDC - Swiss Agency for Development and Cooperation.
INSTAT avails itself of this opportunity to express its gratitude and acknowledgement for the valuable contribution of the SDC - Swiss Agency for Development and Cooperation, INSTAT experts and other local and international experts for the publication of the series of analyzes of population and housing census 2011
Special appreciation also goes out to all institutions and donors, who have contributed to the conduction of the population and housing census 2011, the Albanian Government, European Union (IPA 2009 and CARDS 2006), SIDA – Swedish Agency for International Development, SDC - Swiss Agency for Development and Cooperation, UNFPA – UN Population Fund, and UNDP – United Nations Development Program.
Gjergji FILIPI, PhD Director General of INSTAT

Lista e publikimeve tematike të Censusit 2011, Maj 2014List of 2011 Census thematic publications, May 2014
Censusi i Popullsisë dhe Banesave 2011: karakteristikat ekonomike2011 Population and Housing Census: Economic Characteristics
Dimensionet e cilësisë së Censusit 2011Quality Dimensions of the 2011 Population and Housing Census of Albania
Kushtet e banimit dhe të jetesësDwelling and living conditions
Popullsia dhe dinamikat e saj - horizonte të reja demografike?Population and population dynamics in Albania - New demographic horizons?
Projeksionet e popullsisë, 2011-2031
Shqipëria 2011 Censusi në hartaAlbania 2011 Census Atlas
Tipologjia e komunave dhe bashkive
Aplikimi INSTATGIS – hartat në web (www.instatgis.gov.al)

5Migration in Albania
TABLE OF CONTENTS
1. INTRODUCTION ........................................................................................................................................... 9
Overview of the Report ...............................................................................................................................11
2. INTERNAL MIGRATION .............................................................................................................................. 12
Geography of Internal Migration ...............................................................................................................12
Dynamics of Internal Migration .................................................................................................................22
Characteristics of Internal Migrants ..........................................................................................................25
Individual Model .........................................................................................................................................28
3. INTERNATIONAL MIGRATION ................................................................................................................. 31
Emigration....................................................................................................................................................31
Patterns of Emigration ................................................................................................................................35
Return Migration .........................................................................................................................................37
Foreigners in Albania ..................................................................................................................................42
4. IMPACT OF MIGRATION ............................................................................................................................ 43
Remittances .................................................................................................................................................43
Focus on Tirana ............................................................................................................................................45
Children and the Social Impact of Migration ............................................................................................46
Poverty and Household Structure by Migration Status ...........................................................................49
5. CONCLUSION ................................................................................................................................................ 51
6. APPENDIX ...................................................................................................................................................... 52
7. REFERENCES .................................................................................................................................................. 61
8. ADDITIONAL BIBLIOGRAPHY ................................................................................................................. 63

6 Migration in Albania
List of Figures
Figure 1. Proportion of internal movers coming to the six communes surrounding Tirana by prefecture of origin, in (%) ........................................................................................................................................................15
Figure 2: Proportion of internal movers coming to the six communes surrounding Tirana by commune and prefecture of origin, in (%) ..........................................................................................................................16
Figure 3: Population increase between 2001 and 2011 .......................................................................................................17
Figure 4: Dynamics of internal migration ..................................................................................................................................22
Figure 5: Internal migrants who moved directly to their last prefecture of residence, in (%) ................................23
Figure 6: Internal migrants who changed districts at least twice before coming in the last prefecture of residence, in (%) ...............................................................................................................................................24
Figure 7: Internal movers, changing prefecture versus moving within the same prefecture, in (%) ...................24
Figure 8: Internal migrants by age group and sex, 2001-2011 ..........................................................................................25
Figure 9: Internal migrants by age group and sex, 1989-2001 ..........................................................................................26
Figure 10: Internal migrants by marital status .........................................................................................................................26
Figure 11: Main reason for internal migration by sex, in (%) ..............................................................................................27
Figure 12: Internal migrants by main reason and age group, in (%) ................................................................................27
Figure 13: Internal migrants by level of education and sex, in (%) ...................................................................................28
Figure 14: Individual model, 2001-2011.....................................................................................................................................29
Figure 15: Individual model, 1989-2001.....................................................................................................................................30
Figure 16: Indirect estimation: Age distribution of male population ..............................................................................31
Figure 17: Indirect estimation: Moving up to the date of the census .............................................................................32
Figure 18: Projected population and census population compared ...............................................................................32
Figure 19: Indirect estimation: Net migration and returned emigrants by age group and sex .............................33
Figure 20: Indirect estimation: Age and sex of emigrants ...................................................................................................33
Figure 21a: Population pyramid of emigrants, 1989 – 2001 ...............................................................................................34
Figure 21b: Population pyramid of emigrants, 2001 – 2011 ...............................................................................................34
Figure 22: Population on 1 October 2011 with and without emigration .......................................................................35
Figure 23: Albanians abroad, 2011 ...............................................................................................................................................36
Figure 24: Outflows of Albanians to selected OECD countries, 2005 – 2011 ................................................................36
Figure 25: Internal migrants and returnees by age group, in (%) .....................................................................................37
Figure 26: Returnees by age group and sex .............................................................................................................................38
Figure 27: Reasons of return, in (%) .............................................................................................................................................38
Figure 28: Returnees by level of education and year of arrival, in (%) ............................................................................39
Figure 29: Number of returning migrants, 2001 – 2011 .......................................................................................................39
Figure 30: Return migration from Greece, Italy and Germany by year of return .........................................................40
Figure 31: Usual residence in 2001 of returnees, in (%) ........................................................................................................40

7Migration in Albania
Figure 32: Foreign-born citizens by age group........................................................................................................................42
Figure 33: In-flow of remittances, 1992 – 2013, in millions of USD ..................................................................................43
Figure 34: Remittances in 2011 by country of origin, in (%) ...............................................................................................44
Figure 35: Flow of remittances to households during 2012 and employment status of current migrants, in (%) ...................................................................................................................................................................................44
Figure 36: Place of residence and region of family members not currently residing in the household, in (%) ................................................................................................................................................................................47
Figure 37: Spouse and children during the migration time, in (%) ..................................................................................48
Figure 38: Spouse/partner and children of current migrants, in (%) ..............................................................................48
Figure 39: Poverty indicators by migration status, 2005 and 2012, in (%) .....................................................................49
Figure 40: Access to health care of households by migration status of the members, in (%) ................................50
Figure 41: Rates of outflow change to Italy and Greece, 2005 to 2011, in (%) .............................................................52
Figure 42: Returned migrants with tertiary education, 2001 to 2011 .............................................................................52
Figure 43: Usual resident population born in Greece by age and sex.............................................................................53
List of Tables
Table 1. Age distribution and dependency ratio in the six communes surrounding Tirana, 2001 and 2011 .....................................................................................................................................................................................17
Table 2: Internal Migration Matrix ................................................................................................................................................19
Table 3: School attendance and literacy ....................................................................................................................................45
Table 4: Single parent households, in (%) ..................................................................................................................................46
Table 5: Resident population which changes usual residence, 2010 – 2011 ................................................................53
Table 6: Proportion of emigrant to closed population, 2011, in (%) ................................................................................54
Table 7: Albanians’ stock abroad by country of residence ...................................................................................................54
Table 8: Characteristics of households from which former members have migrated, in (%) .................................55
Table 9: Place of residence and region of households by migration status, in (%) .....................................................56
Table 10: Quartiles of monthly average consumption per HH by migration status, in (%) .....................................56
Table 11: Characteristics of current migrants and their household of origin ...............................................................57
Table 12: Characteristics of returned migrants and their household of origin ............................................................58
Table 13: Private households and number of household’s members by commune and type of household ..............................................................................................................................................................................58
Table 14: Family nuclei and members by commune and type of family nucleus .......................................................59
Table 15: Inhabited dwellings by commune, water supply system and type of toilet ..............................................59
Table 16: Private households by commune and tenure status of dwelling ..................................................................60

8 Migration in Albania
List of Maps
Map 1. Population distribution, 2011 .........................................................................................................................................10
Map 2: Population change, 2001 – 2011 ....................................................................................................................................13
Map 3: Population change in some communes surrounding Tirana, 1989 – 2001 and 2001 – 2011 ..................14
Map 4: Movement rates by prefecture .......................................................................................................................................18
Map 5: Patterns of movements by prefecture of destination.............................................................................................20
Map 6: Patterns of movements by prefecture of origin .......................................................................................................21
Map 7: Returned migrants by prefecture and country of origin .......................................................................................41
Map 8. Population change, 1989 – 2011 ....................................................................................................................................60

9Migration in Albania
1INTRODUCTION
1. INTRODUCTIONIn the last two decades, Albania has undergone considerable population change. Not only has the resident population dropped from 3,182,417 in 1989 to 2,800,138 in 2011, but a substantial proportion of the population has moved within Albania. Compared to a decade ago, 10 percent of the population now live in a different town or village. As is common with migration, some groups in society are more likely to move. This has a clear impact on the composition of the population in different areas of Albania with wide-reaching ramifications.
In line with other middle-income countries, internal migration in Albania is largely synonymous with urbanization. Most people who changed residence in the last two decades have moved to the urban centres, in many cases to the capital Tirana or its surrounding area (see Map 1). The data from the 2011 census allow a detailed picture of the patterns of movement and the impact of migration on society – in terms of demographic composition or development more generally. This is particularly true when additional data such as from the Living Standard Measurement Survey (LSMS) are used to complement the picture presented by the census. In this sense, the analyses in this volume provide the starting point for a better understanding of the way the population of Albania is moving, and how this affects the migrants and the population left behind.
The census not only gives us a detailed picture of population change, but provides us with indications as to why people move, or why they return to Albania after some time abroad. The pursuit of better livelihoods transpires when people move for employment and to study. With a large part of migration motivated by family reasons there are clear indications that the changes observed tend to be more permanent – going beyond short-term labour migration. Irrespective of individual motives to move, the scale of migration in Albania leaves an obvious mark on many aspects of everyday life. On the one hand, some places have lost most of their population within the span of a decade; on the other hand, there are towns and villages where the population has increased manifold. Such rapid changes have an immediate impact on the infrastructure and provision of vital services such as healthcare or education.
At the same time as a considerable part of the population changed residence, many Albanians sought a better life abroad. Greece and Italy continue to attract by far the largest proportion of Albanian emigrants. It is now clear that emigration was not exceptional – as was often suggested with respect to the waves of emigration in 1991 and to lesser extent 1997. Emigration has become an integral part of the life projects of individuals and their families. While the economic and political situation may be classical push factors, they fail to explain the continuous out-flows that can be observed. A more suitable approach is to focus on the ambitions and capabilities of individuals to migrate (de Haas 2010; de Haas 2011). The ambition to emigrate is driven by the desire to improve one’s livelihood as well as information about the situation in other countries. In this respect, the common viewing of Italian television before 1989 has probably increased ambitions to emigrate before this was possible for the majority of the population.

10 Migration in Albania
Map 1. Population distribution, 2011
Note: one dot corresponds to 2,500 people.

11Migration in Albania
1INTRODUCTION
The capability to move, by contrast, does not merely depend on the removal of formal travel restrictions, but also on individual funds, a personal network, and a reduced tie to the local community caused by smaller families and others in the community moving away. Individual funds are important since any relocation comes with direct costs and bears risks of additional – indirect – costs. A personal network can help reducing such risks, such as by securing employment or by providing vital contacts to this end. Personal networks have also been noted as an important help in navigating bureaucracies in Italy and Greece (Mai and Paladini 2013). With smaller families, the decision to move abroad may have become easier; and with each individual or family leaving a community, the pressures to stay is reduced. While this need not lead to a breakdown of communities, the decision to leave may become easier for the individuals involved.
By considering both ambitions and capabilities to migrate, it can be understood why emigration from Albania was not as exceptional as was sometimes argued in the 1990s, and why it is expected to continue in the foreseeable future. The economic situation in Italy and Greece is likely to have a noticeable impact on the number of Albanians emigrating, but the impact on internal movement is probably only indirect. With a prospect of continuing migration – both internal and international – its impact on Albanian society will continue.
Overview of the Report
This report is structured into three main parts to provide a comprehensive view of contemporary migration in Albania. The first section is concerned with internal migration – movements that take place within Albania. We describe the geography of internal migration, highlighting its link to urbanization, and the demographic characteristics of internal migrants. An individual-level regression model is used to summarize the significance of these individual-level characteristics in shaping internal movement. The second section is concerned with international migration – movements to and from other countries. We provide an indirect estimation of the number of emigrants, trying capture this inherently elusive population. Profiles of return-migrants and foreigners residing in Albania complement the view on international migration. The third section discusses the impact of migration, considering both the impact on development and the household structure.

12 Migration in Albania
2. INTERNAL MIGRATION Before the change of regime, all kinds of migration movements were tightly regulated and restricted in Albania – including migration within the country. With the change to an open market economy, internal mobility increased dramatically in the 1990s. This increased mobility is generally attributed to a backlog demand, and Albania became literally a ‘country on the move’ (Carletto et al. 2004) both in terms of internal and international migration. As in other transition countries, in Albania the two phenomena are closely linked. These movements – their intensity, directions, and the motives that lead to them – are shaped by the economic, political, and social developments that have occurred in Albania over time (Doka 2005; Vullnetari 2007; Caro and van Wissen 2007). The sheer extent of movement meant that Albania became noted for its emigration at the international level. At the same time, internal mobility, despite being one of the most important processes in post-communist Albania, remains largely under-documented and certainly under-researched (Vullnetari 2009; Bërxholi 2005; Agorastakis and Sidiropoulos 2007).
Migration has been one of the most dynamic features of the country’s transition and one of the most important social and economic phenomena (King and Vullnetari 2003). Internal migration in particular led to large-scale urbanization in some areas and drastic depopulation in others. Despite regional variation in birth rates and relatively low mortality rates, the most significant population changes in contemporary Albania resulted from the combined impact of internal and international migration (King 2004). While internal movements are multifaceted, it is apparent that the large majority of internal migration flows is in the direction of Tirana. In fact, it is mainly the areas surrounding the city of Tirana that attract most of the internal migrants. More generally, it can be observed that migration flows in direction of a particular city, be this Tirana or Durrës, are diverted to nearby destinations. The reason that sub-urban areas attract the majority of new arrivals is simply that the desired destination is usually very difficult to enter as attractive as it is. Notably housing costs and the availability of suitable lodging often make migration to the city centres an impossible undertaking. As a result, these ‘diverted in-migrants’ contribute to the formation of densely populated ‘extra urban settlements’ (Sjöberg 1992: 13).
In this chapter, we focus on changes between 2001 and 2011, but where pertinent longer periods are considered, notably by reaching back to the census of 1989. Internal migrants are defined as persons who have changed the usual residence between 2001 and 2011. In the analyses in this chapter, we consider any change of usual residence at the prefecture and town or village level. This means that we do not consider movement at the smallest unit, since these do not involve a change of community. Internal migration can be expressed in terms of two dimensions: the spatial dimension, and the temporal dimension. The spatial dimension refers to migration between two prefectures, two districts in the same prefecture or two towns or villages. The temporal dimension describes whether this movement occurred at any point between 2001 and 2011, and the exact year of last movement before coming to the current place of residence. We mainly approach internal migration using flow data (movements), but at times also consider the change of population numbers. Namely, differences between the population in 2001 and 2011, or differences between 1989 and 2011 can be considered reflections of migration, given that in Albania demographic changes in terms of fertility and mortality are of more limited importance for differences between areas.
Geography of Internal Migration
Between 2001 and 2011, 228,952 individuals living in Albania have changed their prefecture of usual residence: these migrants account for 8 percent of the resident population in 2011. For inter-town or village moves during the same period the recorded figure is 280,863 individuals. Nearly half of these internal migrants have relocated to the Tirana prefecture – more precisely sub-urban Tirana. In total, over 112,000 individuals have settled in the Tirana prefecture between 2001 and 2011.
The census data make it possible to draw up migration matrices and maps in order to provide a more detailed picture of migration patterns. In Map 2 we present the population change between 2001 and 2011. Of the 373 communes in the country, 48 communes have lost more than half of their population between 2001 and 2011. This is equivalent to 13 percent of the communes. Such large population decreases are only possible with large-scale out-migration; the decrease in fertility may contribute a small part to this development. These 48 communes are mainly situated in the centre of the northern and southern parts of the country, but prefectures or even districts do not form homogenous entities when it comes to migration flows. In fact, the majority of Albanian communes have experienced a significant population decrease. Prominent exceptions are the capital Tirana and sub-urban areas on its fringes, the region around Saranda, Xarrë and Ksamil in the south and some communes in the heart of Albania. However differences within the prefectures are also notable.

2INTERNAL MIGRATION
13Migration in Albania
Map 2: Population change, 2001 – 2011
Note: given is the change in resident population, expressed as a percentage of the population in 2001;
Map 8 in the appendix shows that the patterns described here are not unique to the most recent decade, but can also be observed when considering changes since 1989.
Population change, 2001 - 2011
-98.7 - -50.0-49.9 - -30.0-29.9 - -20.0-19.9 - 0.0 0.1 - 50.050.1 - 100.0100.1 - 300.0300.1 - 975.7
© IN
STAT
, 201
4
KORÇË
DIBËR
FIER
VLORË
ELBASAN
KUKËS
SHKODËR
BERAT
LEZHË
TIRANË
GJIROKASTËR
DURRËS
50 km

14 Migration in Albania
Map 3: Population change in some communes surrounding Tirana, 1989 – 2001 and 2001 – 2011
Population change, in %
-34.40 - 0.000.01 - 12.6012.61 - 60.0060.01 - 100.00100.01 - 506.60
© IN
STAT
, 201
4
1989 - 2001
2001- 2011
10 km
Bërxullë Kamëz
Pskuqan
Dajt
Tiranë
Kashar
Farkë
Bërxullë Kamëz
Pskuqan
Dajt
Tiranë
Kashar
Farkë
Note: population change (as percentage) at the level of communes; Tirana is in the centre, with the surrounding communes experiencing the largest growth.

2INTERNAL MIGRATION
15Migration in Albania
Combining a number of factors and possibilities, people chose to migrate to areas in the vicinity of their favoured urban locations. Arguably, the growth of the suburban areas adjacent to important urban centres was the result of a fair degree of what Sjöberg (1992) calls ‘unofficial’ migration. For Sjöberg, what was occurring can be clearly explained by what he calls ’diverted migration’ to urban areas. Following this view, we examine the case of Tirana, as the most desirable city, both at the time Sjöberg was writing as today. Tirana, being the capital of the country, has always been characterised by the great range of opportunities that it offers. Looking at the attraction of Tirana as a major industrial, administrative and cultural centre, migratory flows heading for a particular destination – in this case Tirana – are diverted to nearby destinations. In our example, the diversion is directed towards Tirana’s surrounding areas, as the desired destination is very difficult to enter at the same time as being so attractive. These ‘diverted in-migrants’ in turn contributed to the formation of densely populated ‘extra-urban settlements’ (Sjöberg 1992:13).
Tirana has historically drawn the largest share of internal migrants. It combines economic development, the centre of social and cultural life and opportunities for better education. As a consequence, employment has always been concentrated in and around Tirana, largely determining the direction of internal migration. Map 2 and Map 3 highlight that the communes surrounding Tirana have seen the largest population growth between 2001 and 2011. The internal migrants tend to move as close as possible to the desired destination, and in the case of Tirana settled in surrounding areas such as Kamza and Paskuqan, communes that have experienced the highest population growth between 1989 and 2001. While for the last decade between 2001 and 2011, the population of Farkë, Dajti and Kashar has been almost tripled.
If we take into consideration the prefecture of origin of the internal movers arriving in the six communes surrounding Tirana, it transpires that most of them came from the north and northeast of Albania, more precisely from Kukës and Dibër. 39 percent of the internal migrants arriving in the six surrounding communes came from Kukës, while 34 percent came from Dibër (Figure 1).
Figure 1. Proportion of internal movers coming to the six communes surrounding Tirana by prefecture of origin, in (%)
Note: internal migrants to six communes surrounding Tirana: Kashar, Kamza, Dajti, Paskuqan, Bërxullë, Farkë, as a percentage to the total number of internal movers leaving each prefecture.
0 10 20 30 40Vlorë
Elbasan
Fier
Gjirokastër
Lezhë
Berat
Korçë
Shkodër
Durrës
Dibër
Kukës

16 Migration in Albania
Considering the distribution of the internal movers within the six communes surrounding Tirana, it is visible that the communes of Kashar and Farkë are preferred by internal movers coming from southern prefectures, while internal movers from northern prefectures are mainly concentrated in Kamza and Paskuqan communes (Figure 2). For example, 44 percent of the internal movers from Kukës – in the north of Albania – to the six communes surrounding Tirana settle in Kamza. By contrast, 61 percent of the internal movers from Gjirokastër – in the south of Albania – settle in Kashar. We note that the communes where the internal movers from the southern parts of Albania tend to settle are to the south of Tirana, while the communes where the internal movers from the northern parts of Albania tend to settle are to the north of Tirana.
Figure 2: Proportion of internal movers coming to the six communes surrounding Tirana by commune and prefecture of origin, in (%)
Note: distribution into the six communes surrounding Tirana, for each prefecture of origin.
The same pattern can be observed for the period between 1989 and 2001. During that time, the internal movements from northern prefectures (Kukës and Dibër) towards the communes surrounding Tirana tended to end in the communes of Kamza and Paskuqan (Migration in Albania, INSTAT 2004). During the most recent decade, the number of internal movers has somewhat declined, but the pattern of movement has remained largely the same. The concentration of migrants in specific communes is most likely a reflection of migrant networks, where new migrants use contacts with established migrants to facilitate the move. Most notable here is family reunification with existing strong ties to the new community.
The communes attracting internal migrants from the south – Dajti, Farkë and Kashar – have experienced an increase in population numbers only in the most recent decade. In fact, one of them – Farkë – still experienced a loss of population between 1989 and 2001. Compared to a decade earlier, we note an increase in absolute numbers of internal migration towards Tirana and its surrounding areas from Berat, and particularly Vlorë and Fier (see Migration in Albania, INSTAT 2004). Such changes in patterns of internal migration are likely to be a reflection of the attraction of Tirana relative to other centres in Albania or options abroad.
The inflow of migrants from other areas of Albania has led to fundamental changes in the six communes surrounding Tirana. Table 1, shows how the composition of age groups in these six communes has changed between 2001 and 2011, and underlines that these changes have had an important demographic impact.
0
20
40
60
80
100
Paskuqan
Bërxullë
Dajt
Farkë
Kamëz
Kashar
Vlorë
Elbasan
Fier
Gjiro
kastër
Lezhë
Berat
Korçë
Shkodë
r
Durrës
Dibë
r
Kukës

2INTERNAL MIGRATION
17Migration in Albania
Table 1. Age distribution and dependency ratio in the six communes surrounding Tirana, 2001 and 2011
In the leftmost columns, the percentage of three age groups is shown: those below working age, those of working age, and those older than 65. In 2001, about a third of the population in the six communes was below working age, and around 5 percent above. This leads to a dependency ratio of about 60 percent in the six communes under consideration. By 2011, the population in all the communes has increased (compare Map 3), but the age structure has changed fundamentally. Those below the working age now constitute less than 30 percent in the six communes, while the proportion of individuals of working age has increased. The proportion of those above 65 has increased only marginally, leading to a significantly lower dependency ratio of 60 to 50 percent.
Figure 3: Population increase between 2001 and 2011
Note: the graph shows the ratio of population in 2011 and 2001 for the communes of Tirana, (in times)
Figure 3 further illustrates the population increase in the six communes between 2001 and 2011. All columns are greater than 1, indicating a population growth for all groups. There are, however, significant differences in the extent to which the different age groups have grown in the period covered, with the pattern of these differences being the same in all the communes. The smallest population increase can be noted for the youngest age group, which is reflected in its declining proportion in Table 1.
By contrast, the population increase for those of working age is much higher, more than doubling in Farkë, Dajti, and Kashar in the decade covered. Figure 3 also illustrates that the population growth of those over 65 was actually higher than of the working population. Given the relatively small importance of this group in the overall population, as apparent in Table 1, the dependency ratio is not increasing. Given the increase of the population over 65, it is clear that the decreasing dependency ratio is due to the relatively declining young population – a reflection of the low fertility rates in Albania and Tirana in particular.
Communes
2001 2011
Age groups Dependency
ratio Age groups
Dependency
ratio
0-14 15-64 65 + 2001 0-14 15-64 65 + 2011
Dajt 31.7 62.1 6.2 61.0 23.7 69.1 7.2 44.7Kamëz 33.7 62.1 4.2 60.9 27.0 66.0 7.1 51.5Kashar 31.5 62.9 5.5 58.9 21.5 71.1 7.3 40.6Paskuqan 33.2 62.5 4.3 60.0 27.1 66.2 6.7 51.0Farkë 32.3 61.9 5.8 61.6 22.7 69.8 7.5 43.3Bërxullë 34.1 60.6 5.2 64.9 26.3 65.6 8.1 52.4

18 Migration in Albania
Just as the communes around Tirana changed in different ways, internal migration affects the different areas of Albania in different ways more generally. When focusing on movements between prefectures during the last decade, three entities appear to be particularly affected by population change during the last decade. Map 4 shows the ratio between inflows and outflows with the total population of a given prefecture (‘movement rate’). This is an indication of the extent to which the population is affected by migration. Values on this measure are high if a large part of the population leaves the prefecture, but also if a large part of the population has arrived in the last decade, or if both significant inflows and outflows occur. In Albania, the highest values can be found in Dibër with 30.4 percent, Kukës (29.4 percent), Gjirokastër (25.3 percent), and Berat (20.7 percent). In all these cases the high movement rates are driven by significant out-migration. At the other end of the spectrum, the movement rates in Tirana (16.6 percent) and Durrës (16.9 percent) are shaped predominantly by internal in-migration. While these two agglomerations attract many migrants in absolute numbers, relative to the resident population the proportion of internal migrants arriving in these prefectures is relatively low – hence relatively low movement rates. Lezhë is an interesting case, with a movement rate of 18 percent: both in-migration and out-migration contribute to the movement rate in this case. In some places, there are important outflows, while at the same time areas on the Mediterranean coast and near the town of Lezhë also attract migrants from other regions.
Map 4: Movement rates by prefecture
Movement rate
11.3 - 15.015.1 - 19.019.1 - 24.024.1 - 29.0 29.1 - 30.4
© IN
STAT
, 201
4
50 km
KORÇË
DIBËR
FIER
VLORË
ELBASAN
KUKËS
SHKODËR
BERAT
LEZHË
TIRANË
GJIROKASTËR
DURRËS
Note: movement rate refers to the sum of arrivals and departures expressed as a percentage of the population in 2011.

2INTERNAL MIGRATION
19Migration in Albania
Table 2: Internal migration matrix
Note: given are the number of individuals who have changed their usual place of residence between 2001 and 2011; for instance, between 2001 and 2011, 283 individuals have moved from the Dibër prefecture to the Berat prefecture, while 10,064 individuals have moved from the Dibër prefecture to the Durrës prefecture (top-left corner of the table).
Considering the direction of internal migration flows, different kinds of flows can be distinguished according to their regional relocation and settlement type. The internal migration matrix (Table 2) presents the internal movements by prefecture of residence in 2001 and prefecture of residence in 2011. It demonstrates a clear shift of population from the north (especially the north-east), the south-central and south-east towards the centre. Top senders of internal migrants are the prefectures of Dibër, Kukës and Gjirokastër with more than 21 percent of their population leaving the prefecture between 2001 and 2011. Dibër and Kukës are geographically landlocked mountains areas, with some of the highest unemployment and poverty headcount rates and limited economic opportunities (Lundstrom and Ronnas 2006: 24-25). By contrast, internal migration from Gjirokastër has been directed towards the central and coastal prefectures. However, in this prefecture internal migration is dwarfed by population losses from international out-migration, especially to Greece.
In the central area of Albania, where in-migration dominates, the majority of internal migrants relocate in Tirana and Durrës. Less significant were internal migration flows along coastal areas. Across all prefectures, Tirana recorded the highest increase, with 112,180 new residents coming from other Albanian prefectures, followed by Durrës with 34,059 new residents. Put differently, 49 percent of internal movers resided in Tirana in 2011, while 15 percent resided in Durrës.
The geographical patterns of movements between prefectures are depicted in Map 5. The maps show patterns of out-migration for each prefecture. For example, among internal migrants who have left Berat during the last decade, between 40 and 50 percent moved to the prefecture of Tirana, between 10 and 20 percent moved to the prefectures of Durrës and Fier, while the other prefectures registered between 0.5 and 10 percent of the internal migrants from Berat. The maps illustrate that the most significant flow of internal migration is to Tirana, and to a much lesser extent to Durrës. In the cases of Dibër, Durrës, Fier, Korçë, Kukës and Lezhë, more than half of the migrants leaving from these prefectures move to Tirana.
Prefecture
2011
Prefecture 2001 B
era
t
Dib
ër
Du
rrë
s
Eb
asa
n
Fie
r
Gji
rok
ast
ër
Ko
rçë
Ku
kë
s
Le
zh
ë
Sh
ko
dë
r
Tir
an
ë
Vlo
rë
Gji
thse
j
Berat 283 154 673 2,123 398 636 450 59 58 418 2,852 8,104
Dibër 569 154 774 1,168 816 280 205 173 102 265 140 4,646
Durrës 3,098 10,064 4,772 2,045 1,066 2,055 3,649 2,160 1,978 2,791 381 34,059
Ebasan 664 534 362 1,418 194 2,320 717 345 1,384 1,141 278 9,357
Fier 3,023 588 339 2,084 2,384 808 1,685 225 443 1,626 2,832 16,037
Gjirokastër 401 177 69 134 529 220 92 65 85 780 287 2,839
Korçë 609 624 241 2,258 964 194 430 190 427 589 463 6,989
Kukës 102 255 117 95 212 99 102 181 409 326 73 1,971
Lezhë 1,152 1,936 868 2,230 315 161 392 356 4,016 2,241 143 13,810
Shkodër 421 1,046 1,881 416 718 581 475 945 1,356 869 462 9,170
Tiranë 9,811 21,279 6,048 10,120 13,968 7,527 10,985 13,965 5,230 8,159 5,088 112,180
Vlorë 1,405 248 248 825 2,200 2,002 521 623 272 552 894 9,790
Total 21,255 37,034 10,481 24,381 25,660 15,422 18,794 23,117 10,256 17,613 11,940 12,999 228,952

20 Migration in Albania
Map 5: Patterns of movements by prefecture of destination
Internal movements, in %
origin country0.48 - 10.0010.01 - 20.0020.01 - 30.0030.01 - 40.00 40.01 - 50.0050.01 - 60.41
© IN
STAT
, 201
4
50 km
VlorëTiranë
Korçë
Lezhë
Kukës
Shkodër
Gjirokastër
KORÇË
DIBËR
FIER
VLORË
ELBASAN
KUKËS
SHKODËR
BERAT
LEZHË
TIRANË
GJIROKASTËR
DURRËS
Berat DurrësDibër Elbasan
Fier
Note: these maps illustrate to which prefecture internal migrants move (as a percentage of all migrants), 2001 to 2011; grey areas refer to the prefecture of origin.

2INTERNAL MIGRATION
21Migration in Albania
Map 6: Patterns of movements by prefecture of origin
Note: these maps illustrate from which prefecture internal migrants came (as percentage of all migrants), 2001 to 2011; grey areas refer to the prefecture of destination.
Internal movements, in %
origin country0.72 - 5.005.01 - 10.0010.01 - 15.0015.01 - 20.00 20.01 - 25.0025.01 - 35.19
© IN
STAT
, 201
4
KORÇË
DIBËR
FIER
VLORË
ELBASAN
KUKËS
SHKODËR
BERAT
LEZHË
TIRANË
GJIROKASTËR
DURRËS
Berat DurrësDibër Elbasan
GjirokastërFier Korçë
Lezhë
Kukës
Shkodër
50 km
VlorëTiranë
destination country

22 Migration in Albania
The opposite perspective is given in Map 6, showing for each prefecture where internal migrants came from. It shows the percentage of internal migrants in a given prefecture that came from each of the other prefectures. For instance, while Map 5 showed that Tirana is the preferred destination for internal migrants, the composition regarding the origin of these internal migrants is given in Map 6. Among all the internal migrants who arrived in Tirana between 2001 and 2011, 19 percent came from Dibër, 12 percent came from Kukës and Fier each, and between 5 and 10 percent came from Shkodër, Berat, Durrës, Elbasan, Gjirokastër, Korçë and fewer than 5 percent were from Lezhë and Vlorë. By contrast, the prefectures of origin in Durrës are less diverse: most of internal movers who arrived in Durrës between 2001 and 2011 came from Dibër (30 percent), Elbasan (14 percent), and Kukës (11 percent). The third important destination prefecture in Albania is Fier, followed by Lezhë. In the south of the country, Fier appears to be an attractive prefecture for internal migrants coming from Berat (19 percent), Vlorë (18 percent), Gjirokastër (15 percent) and Elbasan (13 percent). On the other hand, Lezhë is the preferred prefecture in the north of the country, attracting internal migrants from Shkodër (29 percent), Dibër (14 percent), Elbasan (16 percent) and Tirana (16 percent).
Looking only at internal movements between January 2010 and October 2011, the geography of internal migration strongly resembles the pattern described in the preceding paragraphs for movements between 2001 and 2011 (Table 5 in the appendix). Tirana is the dominant prefecture in terms of the number of internal incoming migrants, with 58 percent of all internal migrants heading for Tirana. This is 9 percentage points higher than for the period 2001 to 2011. Another prefecture that has experienced a recent increase in the number of internal migrants is Vlorë with 6 percent of all internal migrants. This is 2 percentage points higher than during the period 2001 to 2011. This may be related to the relatively high number of returning migrants in this prefecture – mainly between 2008 and 2011.
Dynamics of Internal Migration
The census data allow analysing the dynamics of internal movements, in the sense that we can examine whether internal migrants tend to move directly from origin to destination, or whether they move multiple times. The analysis in this section is based on district level movements between two different prefectures or within the same prefecture, as illustrated in Figure 4. The figure shows the four cases analysed. The first case shows a direct move from one prefecture to another. The second and third case show instances when internal movers moved at least twice to reach their prefecture of destination. The fourth case shows internal moves where individuals changed the districts within the same prefecture.
Figure 4: Dynamics of internal migration
Note: four cases of internal migration; the two shades of blue and yellow denote two different districts in the same prefecture respectively.

2INTERNAL MIGRATION
23Migration in Albania
Considering the movements between different prefectures, we observe that direct moves (first case in Figure 4) are far more common than the other cases. This means that people who change prefecture normally move directly. Tirana prefecture has the highest rate of internal migrants who moved directly (97 percent); Dibër prefecture has the lowest rate with 91 percent. In fact, internal movements to Dibër are characterized by a higher rate of individuals who moved district at least twice compared to internal movements to other prefectures (Figure 5).
Figure 5: Internal migrants who moved directly to their last prefecture of residence, in (%)
Note: percentage of internal migrants who moved directly to each of their last prefecture of residence (as opposed to those who changed district between leaving the prefecture of residence in 2001 and settling in the current prefecture of residence); see Figure 4 for an explanation on the different types of movement.
While the majority of internal migrants moved directly (Figure 5), there is noticeable variation in the degree to which internal migrants moved multiple times (Figure 6). These are the second and third cases illustrated in Figure 4, pointing to migrants who probably are unable to realize their migration project the first time they move. Moves include those from one district to another one in the same prefecture and then to another prefecture, or from one district to another in a different prefecture, and then to a different district in the same prefecture. For instance, internal migrants may not find suitable accommodation near their new workplace, or as a consequence of their first move new opportunities arose that led to another move. In each of the prefectures, less than 10 percent of the internal migrants have moved multiple times. On the one hand this highlights the importance of direct moves in the medium term covered by the period between two censuses. On the other hand, the percentages in Figure 6 demonstrate that multiple moves within the span of a decade are far from an unknown experience in Albania.
0
20
40
60
80
100
Dibë
r
Berat
Fier
Kukës
Gjiro
kastër
Vlorë
Lezhë
Shkodë
r
Korçë
Elbasan
Durrës
Tiranë

24 Migration in Albania
Figure 6: Internal migrants who changed districts at least twice before coming in the last prefecture of residence, in (%)
Note: moved district at least twice between 2001 and 2011.
The fourth case in Figure 4 describes internal migrants who have changed their district at least once between 2001 and 2011, but have not changed their prefecture of usual residence. There is a sizeable number of internal migrants who only changed district, with significant variation across prefectures. More than a half of internal migrants within the prefecture of Lezhë moved district at least once, followed by the prefectures of Berat, Fier and Durrës with more than 31 percent. These patterns of movement highlight the importance of urbanization even outside the general attraction of moving to Tirana (see Ravenstein 1885 and his laws of migration).
Figure 7: Internal movers, changing prefecture versus moving within the same prefecture, in (%)
Figure 7 highlights the contrast between internal migrants who changed prefecture and those who moved within the same prefecture. The importance of these two patterns of migration varies significantly between prefectures. For example, 96 percent of movements to Tirana came from a different prefecture, while only 37 percent of movements to Kukës involved a change of prefecture. Generally speaking, though, movements between prefectures are more common than movements within the same prefecture. In half of the prefectures, the majority of internal migrants were from different prefectures:
10
8
6
4
2
0
Dibër
Berat
Fier
Kukës
Gjirokastër
Vlorë
Lezhë
Shkodë
r
Korçe
Elbasan
Durrës
Tiranë

2INTERNAL MIGRATION
25Migration in Albania
Tirana (96 percent), Durrës (94 percent), Vlorë (80 percent), Fier (59 percent), Lezhë (56 percent), and Shkodër (53 percent). This reflects the patterns discussed in the context of Map 6: Tirana and coastal areas attract internal migrants from other prefectures, while in other areas movements within the prefecture are dominant.
Characteristics of Internal Migrants
Having presented the main geographical patterns of internal migration in Albania, some demographic and educational features of the internal migrants will be highlighted in the following paragraphs to illustrate that migration affects different parts of society more than others. During the last decade, about 10 percent of residents moved within the country –they changed the town or village of their usual residence. Census data reveal that internal migrants are generally young. More than 50 percent of migrants that have changed their town or village of residence were aged between 15 and 34 year old, with a distinct peak at the age of 20 to 24. Women are more likely to migrate internally than men, with 59 percent of internal migrants being women – a sex ratio of 69 men per 100 women (Figure 8).
Figure 8: Internal migrants by age group and sex, 2001-2011
Note: internal migrants who have changed their prefecture of usual residence between 2001 and 2011.
Figure 9 presents the situation for the previous decade, and makes apparent that the fact that women are more likely to move is nothing new in Albania. In fact, the higher propensity of women to migrate was already noted by Ravenstein (1885) in his laws of migration. By comparing Figure 8 and Figure 9, we note that the age distribution of internal migrants in Albania has changed, with a more pronounced peak for young adults in the most recent decade. By contrast, individuals aged 35 and over are not nearly as likely to move as their younger compatriots. In the previous decade, there was a gradual decline in the propensity to move after the peak around the age of 30.

26 Migration in Albania
Figure 9: Internal migrants by age group and sex, 1989-2001
Note: internal migrants who have changed their prefecture of usual residence between 1989 and 2001
The numerical dominance of women among internal migrants is particularly noticeable among the younger age groups. The high proportion of women among young internal migrants reflects the importance of family reasons for internal migration, including women who migrate for the purpose of marriage and founding a family (patrilocality). Indeed, previous analyses show that women in rural areas are encouraged to emigrate, because they do not have access to family heritage (farms) or are more likely to find jobs in the tertiary sector in urban areas. Linked to this is the observation that there are more women than men in tertiary education. They also move more often after marriage than men. By contrast, other reasons for movements, such as for employment and study, concern both sexes alike, at least at a young age. Men who are aged 35 years or older are slightly more likely to move internally than women. The number of internal migrants declines substantially after the age of 55 for both sexes.
Internal migration is characterized by the relocation of families. Figure 10 shows that more than a half of the internal migrants were married. More than 37 percent were single, with less than 4 percent divorced and widowed. As shown in Figure 12 below, family reasons are important across all age groups, further highlighting that internal migration is dominated by families moving – as opposed to individuals.
Figure 10: Internal migrants by marital status
Note: change of usual residence between 2001 and 2011.

2INTERNAL MIGRATION
27Migration in Albania
The importance of family reasons is further highlighted in Figure 11: it is the most important reason given by both men and women. The dominance of family reasons is more prominent for women than for men. By contrast, more men than women are moving for reasons of employment. Both differences are compatible with the enduring dominance of patriarchic family forms with men being the breadwinner, and the family moving with the breadwinner if necessary. In terms of studying as a reason for internal migration, women are more likely to move than men. This reason is more for common for young adults aged 15 to 24, while employment reasons are more pronounced among those aged 30 to 64 years (Figure 12). The relative importance of different reasons is largely the same for both sexes, however with family reasons being most common, before employment and study reasons.
Figure 11: Main reason for internal migration by sex, in (%)
Note: change of usual residence between 2001 and 2011.
Figure 12, illustrates how the reasons for migrating within Albania change across age groups. It shows the percentage of all internal migrants in an age group according to the main reason for migrating internally. The pattern in Figure 12 illustrates changing roles during one’s life course. The youngest migrants are entirely attached to their family moving. Increasingly, the importance of studying comes to the fore – peaking in relative importance in the late teenage years. For the age group 15 to 19, employment begins to be important as a reason to migrate within Albania.
Figure 12: Internal migrants by main reason and age group, in (%)
Note: change of usual residence between 2001 and 2011.
28 Migration in Albania
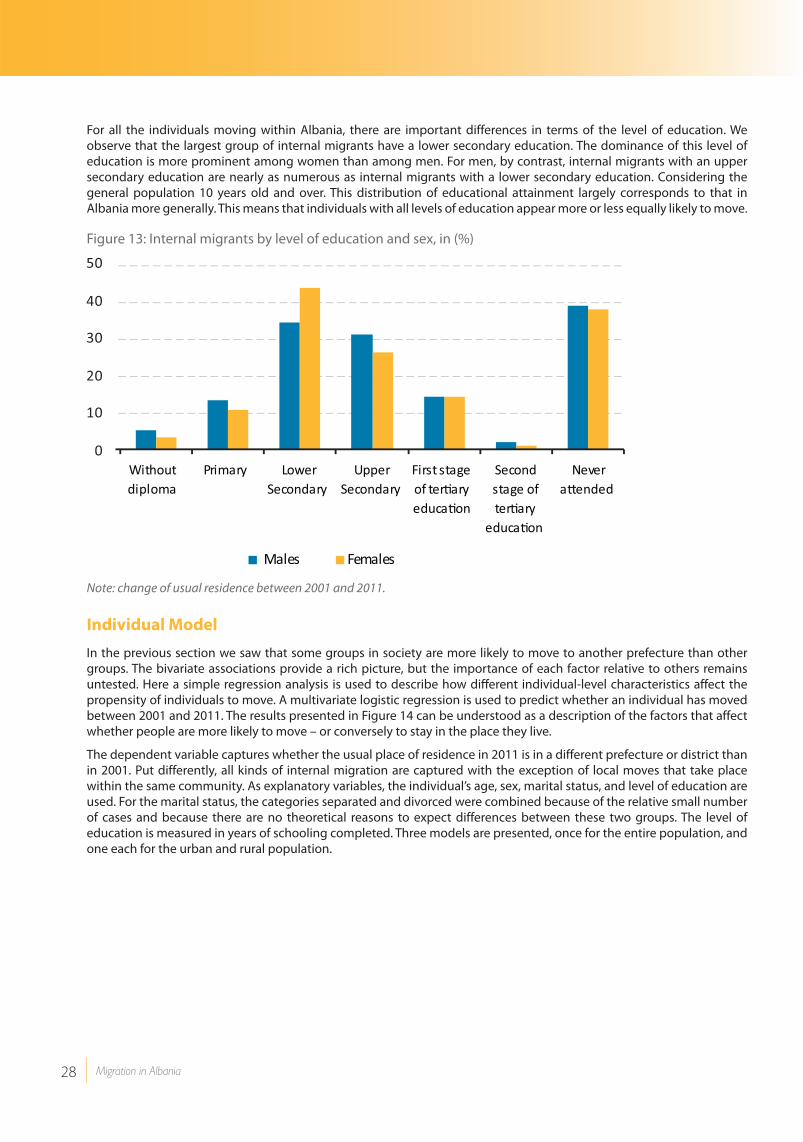
For all the individuals moving within Albania, there are important differences in terms of the level of education. We observe that the largest group of internal migrants have a lower secondary education. The dominance of this level of education is more prominent among women than among men. For men, by contrast, internal migrants with an upper secondary education are nearly as numerous as internal migrants with a lower secondary education. Considering the general population 10 years old and over. This distribution of educational attainment largely corresponds to that in Albania more generally. This means that individuals with all levels of education appear more or less equally likely to move.
Figure 13: Internal migrants by level of education and sex, in (%)
Note: change of usual residence between 2001 and 2011.
Individual Model
In the previous section we saw that some groups in society are more likely to move to another prefecture than other groups. The bivariate associations provide a rich picture, but the importance of each factor relative to others remains untested. Here a simple regression analysis is used to describe how different individual-level characteristics affect the propensity of individuals to move. A multivariate logistic regression is used to predict whether an individual has moved between 2001 and 2011. The results presented in Figure 14 can be understood as a description of the factors that affect whether people are more likely to move – or conversely to stay in the place they live.
The dependent variable captures whether the usual place of residence in 2011 is in a different prefecture or district than in 2001. Put differently, all kinds of internal migration are captured with the exception of local moves that take place within the same community. As explanatory variables, the individual’s age, sex, marital status, and level of education are used. For the marital status, the categories separated and divorced were combined because of the relative small number of cases and because there are no theoretical reasons to expect differences between these two groups. The level of education is measured in years of schooling completed. Three models are presented, once for the entire population, and one each for the urban and rural population.

2INTERNAL MIGRATION
29Migration in Albania
Figure 14: Individual model, 2001-2011
Note: given are the odds ratios, with a value greater than 1 meaning more likely to move, and a value smaller than 1 meaning less likely to move; dependent variable: changed prefecture of district between 2001 and 2011, resident population; reference categories: being female for sex, being single (never married) for marital status.
The major trends in Figure 14 are the same for all three models. Put differently, there do not appear to be major differences in the patterns of internal migration between those who leave rural and urban areas. In all cases, older individuals are more likely to move, while men are overall less likely to migrate internally than women. Compared to being single (never married), married people are much more likely to migrate internally. For separated individuals the likelihood to migrate is somewhat higher, while widowed individuals are less likely to migrate. In terms of education, we observe that those with additional years of schooling are less likely to migrate internally than those with lower levels of education.
The impact of age is relatively small: it takes an age difference of about 20 years to double the likelihood of migrating internally. Men are 0.94 times as likely to move as women, indicating a relatively small gender gap. In terms of marital status, a big difference can be observed. Married people in urban areas are twice as likely to move as those who have never been married, and in rural areas three times as likely to move as those who have never been married. This corroborates the importance of family migration outlined above, in particular the fact that women move in the context of marriage – increasingly just after marrying (Lerch 2013). The statistical effect of education suggests that individuals with 11 years of additional schooling are half as likely to migrate internally as those who lack this education. Put differently, a single year of additional education does not appear to influence the decision to migrate internally a great deal.
For comparison, Figure 15 shows the equivalent models for the period 1989 to 2001. In the previous decade, there were more apparent differences between urban and rural areas, not only in terms of marital status, but also in terms of sex and level of education. This suggests that the nature of internal migration has changed substantively. Notable is in particular the similarity between urban and rural types of migration in the period 2001 to 2011.

30 Migration in Albania
Figure 15: Individual model, 1989-2001
Note: given are the odds ratios, with a value greater than 1 meaning more likely to move, and a value smaller than 1 meaning less likely to move; dependent variable: changed prefecture of district between 1989 and 2001, resident population; reference categories: being female for sex, being single (never married) for marital status.

3INTERNATIONAL MIGRATION
31Migration in Albania
3. INTERNATIONAL MIGRATION
Emigration
Emigration is one of the major reasons for the declining population in Albania between 2001 and 2011. Given that Albanian residents are not systematically registered when they leave the country, and because there are few incentives to register a departure with the local authorities, there are no reliable measures of the number of individuals who have left Albania. It is possible, however, to use indirect methods to produce an estimate of the individuals who have emigrated between 2001 and 2011. In the following paragraphs we describe the steps undertaken to estimate the number and sex of individuals who have changed their usual residence from Albania to a place abroad between 2001 and 2011: the number of emigrants by sex.
In a first step, the population as of January 2001 is taken as the basis. Both the age and sex of individuals are considered. In a second step, information on live births is taken from the General Directorate of Civil Status (GDCS) for each year, taking into consideration the number of males and females born. In a third step, the number of deaths by age and sex are calculated using the specific death rates based on the population projections of the 2001 census (Population Projections for Albania, INSTAT edition, 2004). For each age group, the number of deaths was subtracted from the population in 2001. For the population aged zero, the number of live births in the preceding year was taken into consideration. This procedure was then repeated for each year until January 2012, as illustrated in Figure 16. The figure shows the procedure for males, while the same procedure was used for females. The result is an estimated age distribution of the population for each year between 2001 and 2012.
Figure 16: Indirect estimation: Age distribution of male population
The outlined procedure calculates a closed population which does not take into account migration. To calculate the number of emigrants, it is necessary, as a next step, to compare the closed population as calculated above with the census population. First, the estimated population as of 1 January 2012 (i.e. the closed population) was extrapolated to 1 October 2011 to match the population on the same date (1 October 2011). This was done by adding to the 1 January 2012 population the number of people who died in the fourth quarter (October-December) of 2011. Moreover, for the individuals with age zero, the live births in the fourth quarter (October-December) of 2011 were removed. Equivalent adjustments were made for all ages, taking into account the shift of population in the last quarter.
Male population
2001 2002
Age Population Deaths Population Deaths
Total 1,527,498 11,014 1,544,935 10,773
0 28,178 531 28,451 419
1 27,621 60 27,647 57
2 26,974 47 27,561 46
3 28,628 40 26,927 36
4 30,285 36 28,588 33
5 32,261 25 30,249 22
6 30,185 21 32,236 22
7 29,516 19 30,164 19
8 31,587 18 29,497 16
9 34,006 21 31,569 19
10 34,321 13 33,985 12

32 Migration in Albania
Figure 17: Indirect estimation: Moving up to the date of the census
Notes: the number of deaths in the last quarter was added for each age (column 4 – Population + Deaths); then in order to fix the age, for age zero the number of births of the last quarter (shown in column 5) was subtracted while a quarter of the next age value (column 4) was added; for the other ages a quarter of its value was subtracted while a quarter of the next age value was added (shown in the last column).
As before, the same procedure was applied to the female population and then the total population was calculated as sum of both of them. Having adjusted the projections to match the date of the census (1 October) rather than 1 January, it was then possible to calculate the difference between the closed population projected for 1 October 2011, and the population enumerated in the census – having adjusted for under-coverage on the basis of the Post Enumeration Survey (PES). The difference between these two figures (shown in Figure 18) is the estimated net migration (shown on the left in Figure 19).
Figure 18: Projected population and census population compared
Live births October-
December 2011
Male Population
Age
Projected
Population
1/01/2012
Deaths
October-
December
2011
Population
+
Deaths
Live births
October -
December
2011
Population
on
1/10/2011
0 18,672 35 18,707 4,831 18,514
1 18,543 8 18,551 18,523
2 18,438 2 18,440 18,468
3 18,551 1 18,552 18,533
4 18,476 1 18,477 18,663
5 19,218 2 19,220 19,594
6 20,714 1 20,715 20,946
7 21,635 3 21,638 22,173
8 23,776 0 23,776 23,385
9 22,207 3 22,210 23,609
10 27,806 1 27,807 27,706
Census Population included PES
1/10/2011Agegroup
Closed projected population on
1/10/2011
Total Male Female Total Male Female
2,905,339 1,455,577 1,449,762 3,276,725 1,634,224 1,642,501
169,544 88,887 80,657 0 - 4 175,574 92,701 82,873
188,405 99,124 89,281 5 - 9 207,983 109,707 98,276
241,939 124,827 117,112 10 - 14 266,593 138,356 128,237
278,662 140,773 137,889 15 - 19 300,376 153,846 146,530
252,792 132,878 119,914 20 - 24 324,629 165,389 159,240
199,169 102,460 96,709 25 - 29 298,209 146,489 151,720
170,178 82,430 87,748 30 - 34 233,590 111,614 121,976
173,842 81,872 91,970 35 - 39 211,404 100,348 111,056
193,509 92,301 101,208 40 - 44 213,645 102,710 110,935

3INTERNATIONAL MIGRATION
33Migration in Albania
The population in the census includes emigrants who have returned to Albania between 2001 and 2011. As is generally the case, a distinction by age and sex is possible (Figure 19). As returnees, were considered the persons that were residing abroad at the last census and had returned after the census (1 April 2001). For 2001 the procedure was as follows: to the number of returnees in 2001 (returnees from 1 April to 31 December 2001) one third of their value was added, in order to have the total number of returnees for that year – rather than just for 9 months. From the net migration, the number of returned emigrants was subtracted on the right of Figure 19 – to derive the number of emigrants between 1 January 2001 and 1 October 2011.
Figure 19: Indirect estimation: Net migration and returned emigrants by age group and sex
In Figure 20 negative numbers are used to indicate emigration for a particular cell (age group and sex), whereas positive numbers indicate immigration.
Figure 20: Indirect estimation: Age and sex of emigrants
Notes: negative numbers indicate an emigration for a particular age group and sex, whereas positive numbers indicate immigration; death rates for the oldest age groups are notoriously difficult to estimate (see Migration in Albania 2004), hence the apparent immigration for the oldest age groups may be spurious.
Figure 20 and Figure 21 make it apparent that emigration is a very common phenomenon in Albania. They show the estimated number of emigrants by sex and age. Men are overall more likely to leave the country than women, but the difference is not overwhelming. This is in stark contrast to the patterns of emigration noted in the past where men were
Net migration
Agegroup
Returnees
Total Male Female Total Male Female
-371,386 -178,647 -192,739 110,215 64,622 45,593
-6,030 -3,814 -2,216 0 - 4 3,772 1,918 1,854
-19,578 -10,583 -8,995 5 - 9 6,336 3,240 3,096
-24,654 -13,529 -11,125 10 - 14 8,629 4,394 4,235
-21,714 -13,073 -8,641 15 - 19 9,362 4,551 4,811
-71,837 -32,511 -39,326 20 - 24 12,233 6,170 6,063
-99,040 -44,029 -55,011 25 - 29 10,468 6,697 3,771
-63,412 -29,184 -34,228 30 - 34 13,374 8,945 4,429
-37,562 -18,476 -19,086 35 - 39 11,607 8,211 3,396
-20,136 -10,409 -9,727 40 - 44 8,705 6,158 2,547
Emigrants 2001-2011
AgegroupEmigrants
Total Male Female
Total -481,601 -243,269 -238,332
0 - 4 -9,802 -5,732 -4,070
5 - 9 -25,914 -13,823 -12,091
10 - 14 -33,283 -17,923 -15,360
15 - 19 -31,076 -17,624 -13,452
20 - 24 -84,070 -38,681 -45,389
25 - 29 -109,508 -50,726 -58,782
30 - 34 -76,786 -38,129 -38,657
35 - 39 -49,169 -26,687 -22,482
40 - 44 -28,841 -16,567 -12,274

34 Migration in Albania
much more likely to emigrate than women (Figure 21). As we have observed for internal migration, young adults are most likely to move. This suggests that internal migration and emigration may be two sides of the same coin. In some cases, internal migration – moving to a different part of Albania – seems to be sufficient to meet the individual’s aspirations. In other cases, the individual may chose a destination abroad to follow similar aspirations. In both cases, individual capabilities to move are important limiting factors. A potential emigrant may end up moving to another part of Albania if he or she lacks the necessary funds or personal network.
Figure 21a: Population pyramid of emigrants, 1989 – 2001
Note: 1989 to 2001; emigrants aged 85 or older are not included to ease interpretation. Death rates for the oldest age groups are notoriously difficult to estimate; hence the apparent immigration for the oldest age groups may be spurious.
Figure 21b: Population pyramid of emigrants, 2001 – 2011
Note: 2001 to 2011; emigrants aged 85 or older are not included to ease interpretation. Death rates for the oldest age groups are notoriously difficult to estimate; hence the apparent immigration for the oldest age groups may be spurious.
A slightly different approach is used in the 2011 projection report, where the aim is to predict the population growth of Albania in the coming years. Differences occur because the prediction report removed return migration for the elderly because these numbers are characterized by high uncertainty. The fact that differences occur reflects the uncertainty inherent in projections and indirect methods, where slightly different assumptions can lead to significantly different

3INTERNATIONAL MIGRATION
35Migration in Albania
numbers. Similar differences can occur if census figures are adjusted – which is so in the present case. Such adjustments can be valuable for achieving somewhat more reliable prediction, particularly if there is evidence that the figures used for the adjustment are more reliable. In all cases different methods will lead to different estimates reflecting the inherent uncertainty in these estimates. In the present case, it is estimated that the number of Albanian emigrants between 2001 and 2011 was above 480,000.
Patterns of Emigration
The significant number of emigrants has important consequences for the population structure in Albania. In order to assess the impact of emigration between 2001 and 2011 on the size and the structure of the Albanian population, we have calculated a model, presented in Figure 23, of the demographic evolution with and without emigration. One of the consequences of international migration is a serious discrepancy between the actual young adult population, and the young adult population that would exist without emigration. The light colours of the pyramid show how the emigrants have contributed to the decrease of the Albanian population by age group. The figure highlights that not all age groups are affected to the same extent, and that the working age population is affected most.
According to these models, more than 34 percent of men have emigrated among the population aged 25 to 34 (Table 6 in the appendix). This contrasts with 23 percent for the age group 20 to 24 who have emigrated (29 percent for females). In fact, patterns of emigration in the last decade have been largely gender balanced, while there was a clear gender imbalance between 1989 and 2001 (Figure 21a).
Figure 22: Population on 1 October 2011 with and without emigration
Note: in dark colours the actual (census) population, in light colours the number of emigrants in each age group; dark and light colours combined give the population that would exist without emigration.
While there are many Albanians emigrating, they tend to settle in two countries more than others. According to OECD data, the most preferred destination countries for Albanian emigrants are Italy and Greece, followed by the USA, the UK and Germany. 47 percent of Albanian emigrants live in Italy, making this the most popular destination country, closely followed by Greece with 43 percent of Albanian emigrants. The United States follow as a distant third.

36 Migration in Albania
Figure 23: Albanians abroad, 2011
Note: the data are based on nationality, while for the USA the data are based on country of birth.
Estimates of the number of Albanians in Greece vary significantly by how foreigners are defined – foreign citizenship versus foreign-born – and whether naturalized citizens or ethnic Albanians as a minority are counted. For example, in 2011 there were some 450,000 Albanian nationals residing in Greece, but only some 346,000 individuals born in Albania. A large part of this difference describes members of the Albanian minority in Greece. World Bank data put the number of Albanians in Greece at around 677,000, including ethnic Albanians born in Greece who do not hold Albanian citizenship. Similarly, there are some 91,000 Albanians in Macedonia, once again reflecting Albanians as a minority group rather than recent emigration1.
Figure 24: Outflows of Albanians to selected OECD countries, 2005 – 2011
Note: the data are based on nationality, while for the United States the data are based on country of birth
In terms of recent outflows, the general pattern between 2005 and 2011 was a declining trend (Figure 24). In opposition to this trend, there was a marked increase of emigration to Italy in 2008 and a somewhat weaker increase of emigration to Greece in 2009. These increases are surprising given that the economic crisis had already started to affect the countries in question by that time. Following these intermediary increases, outflows to Italy and Greece have steadily decreased. The rates of decline between 2010 and 2011 were around 40 percent for Greece and around 25 percent for Italy. Emigration flows to Greece in 2011 were less than half what they were in 2005; emigration flows to Italy were just about 60 percent of what they were 6 years earlier. Outflows to the United States and other OECD countries were less affected during the time covered, but we also note a general declining trend (Figure 41 in the appendix).
1. Note: from http://peoplemov.in, drawing on World Bank data; these data seem to count ethnic Albanians as emigrants.

3INTERNATIONAL MIGRATION
37Migration in Albania
Return Migration
With such a large emigrant population, it is easy to forget that there are Albanians moving back to Albania after some time abroad. As Figure 25 shows, these returnees tend to be relatively young, and clearly of working age. While some of these individuals return to Albania permanently, for many of them the return is temporary in nature (Maroukis and Gemi 2013). In this sense, the return migration captured in the census is a snap-shot of on-going circular migration.
There are not many returnees of retirement age, something that could be expected if Albanians worked abroad until retirement age to then come back to Albania. Given that many labour migrants emigrate in their twenties and thirties, it may simply be too early to find such return migration for retirement – those who were in their twenties and thirties in 1989 are only now approaching retirement age.
Figure 25 contrasts the age distribution of those who move within Albania (internal migrants), and those who come back to Albania after some time abroad (returnees). The age distribution for returnees is shifted by about 10 years compared to the age distribution of the internal migrants. For example, the most common age to change residence within Albania is between 20 and 24 years. By contrast, the most common age to return to Albania from abroad is between 30 and 34 years. The shape of the age distribution, however, is largely the same.
Figure 25: Internal migrants and returnees by age group, in (%)
Note: age distribution of internal migrants and returnees; the first age group (0 – 10) covers 10 years, while the others cover 5 years each.
With regard to sex, there are twice as many men coming back than there are women coming back to Albania. The age distribution for men and women, however, is strikingly similar. Given that more generally men are more likely to move for employment reasons, it is unsurprising that the proportion of returnees in the age group 25 to 45 is somewhat more pronounced for men than what can be seen in Figure 25 for both sexes combined. By contrast, the distribution for women is somewhat flatter (Figure 26), given that women are more likely to move for family reasons (Figure 27). Despite the somewhat different reasons to migrate, the peak for women is also at about the same age as for men.

38 Migration in Albania
Figure 26: Returnees by age group and sex
Note: age group 0 to 10 removed to ease interpretation
The reasons to come back to Albania are further explored in Figure 27. In numerical terms, work and family reasons dominate overall. It is important to underline that this applies to both men and women. Study reasons play a much smaller role, although they only affect a relatively restricted age group. For men, the dominant reason to return to Albania is work, while for women family reasons are slightly more important. Because returnees are predominantly men, the actual number of men returning for family reasons is actually higher than the number of women returning for family reasons.
Figure 27: Reasons of return, in (%)
Note: the category other reasons is not considered in this figure; it is given in 12 percent of the cases for male, and 8 percent of the cases for female returned migrants.
Looking at the level of education of returnees, the distribution across levels of education remained relatively stable over time. Returnees with secondary education form the largest section, reflecting the general levels of education in Albania. Since 2008 the proportion of individuals with lower-secondary education has increased (Figure 28). This is a reflection of the significant return migration from Greece since the beginning of the financial crisis in 2008, as further outlined below. At the same time, the proportion of individuals with tertiary education has decreased noticeably. This is a reflection of the overall increasing number of migrants coming back to Albania; the absolute numbers of returnees with tertiary education are relatively stable over time, and have actually increased since 2008 (Figure 42 in the appendix).

3INTERNATIONAL MIGRATION
39Migration in Albania
Figure 28: Returnees by level of education and year of arrival, in (%)
The number of Albanians returning has increased sharply between 2008 and 2010 (Figure 29). In 2011 it remained at a higher level than for the years before 2008. This is a direct reflection of the economic crisis, and the fact that individuals were no longer able to maintain their migration projects in Italy and particularly Greece (Maroukis and Gemi 2013). Qualitative studies suggest that at the beginning of the economic crisis, Albanians in Greece attempted to stay on, but increasingly were unable to do so. They have returned to Albania, but plan to re-emigrate as soon as the opportunity arises.
Figure 29: Number of returning migrants, 2001 – 2011
The fact that the economic situation in Greece is a dominant factor – rather than an increased number of Albanians who have completed their migration project – is also visible in Figure 30. Considering the number of returnees by country, it becomes apparent that the increase of return migration overall is largely caused by Albanians coming back from Greece.

40 Migration in Albania
The increase of Albanians coming back from Italy is also clearly visible, but not as pronounced as that for Albanians coming back from Greece. To corroborate that the economic situation is the reason for returning, Figure 30 also includes return migration from Germany, a country much less affected by the economic crisis than Greece and Italy. Indeed, the number of Albanians returning from Germany has remained stable over time. These patterns of return are the same for all Albanian prefectures.
Figure 30: Return migration from Greece, Italy and Germany by year of return
While the largest number of returnees settles in Tirana, not all prefectures are affected by return migration to the same extent (Figure 31). With its historically close ties to Greece and given the large return migration from Greece between 2001 and 2011, it is unsurprising that Vlorë has the highest share of returnees. In contrast to its neighbouring prefecture Gjirokastër, Vlorë also attracts a sizable proportion of return migrants from Italy. Vlorë is also different from the other prefectures in that the majority of Albanians returning to Vlorë between 2001 and 2011 had their usual residence in 2001 outside of Albania (Figure 31).
Figure 31: Usual residence in 2001 of returnees, in (%)
Note: usual residence in 2001 of Albanians who have returned between 2001 and 2011, by prefecture.

3INTERNATIONAL MIGRATION
41Migration in Albania
This indicates that many of them resided abroad for more than a decade before returning. In the other prefectures, the majority of returnees had their usual residence in Albania in 2001. Albanians returning from Italy are the majority in only two prefectures, Durrës and Shkodër. Lezhë also attracts a sizeable number of Albanians returning from Italy, but returnees from Greece still outnumber those from Italy – like in the other prefectures.
Map 7: Returned migrants by prefecture and country of origin
Proportion of returned migrants to the resident population, in %
Returnees by origin country
1.32 - 2.622.63 - 4.104.11 - 5.005.10 - 6.30 > 6.30
OtherItalyGreece
© IN
STAT
, 201
4
50 km
Note: the shades of green give the percentage of the population that are returnees, with the pie charts indicating the countries of origin (Greece, Italy, other) in each prefecture.

42 Migration in Albania
Foreigners in Albania
A different aspect of migration is the fact that non-Albanians live in Albania. There is, however, only a small population of foreigners in Albania, and the picture is similar if foreign citizens or individuals born abroad are examined. Overall, there were 51,345 foreign-born individuals in Albania in 2011, and 28,309 foreign citizens. This corresponds to 1 percent (foreign-born) and 1.8 percent (foreign citizens) of the total resident population. The foreign-born population consists of 51 percent males and 49 percent females, while for the foreign citizens the proportion of males is noticeably higher than that of women (62 percent male).
The fact that Greece and Italy are the most important countries of destination for Albanians is reflected in the composition of the foreign-born population in Albania. Greeks and Italians are by far the most numerous groups of foreigners. Some of these are born to Albanian parents who lived abroad at the time. It is possible that some parents seek hospitals in Italy and Greece for giving birth, both because of a perception of higher medical standards, and because of an advantage – actual or perceived – for the children in obtaining Greek or Italian citizenship more easily. The numbers in the census suggest that this is a limited phenomenon, judging by the small overall count of foreign-born residents.
Figure 32 shows that most foreigners in Albania are young – born after 1989. In fact, the figure shows that before 1989 migration to and from Albania was quite restricted. The age distribution reflects a higher number of Albanians in Italy and Greece over time, although it seems to have stagnated in the past 5 years in Italy. For individuals born in Greece, there are a discernible number of relatively old persons. This number may simply reflect the traditional cross-border migration between the south of Albania and Greece. The age distribution for foreign-born residents for men and women largely correspond (Figure 43 in the appendix).
Figure 32: Foreign-born citizens by age group

4IMPACT OF MIGRATION
43Migration in Albania
4. IMPACT OF MIGRATIONIn the preceding chapters it transpired that migration has continued to shape Albania in the last decade. Many Albanians have changed their usual residence in Albania – internal migrants –, while a great number of Albanians sought better opportunities abroad. In the context of the description of migration flows, the demographic impact was highlighted in several places, such as when it was shown that over 40 percent of Albanians men between 25 and 34 are residing abroad (Figure 22). This has a direct impact on the work force and dependency ratio in Albania. This chapter begins with a close look at remittances, a direct consequence of the many Albanians living and working abroad. A closer look at the six communes surrounding Tirana highlights the impact of internal migration, while two sections focus on children and poverty more generally by relating these to migration.
Remittances
With over a million Albanians living outside of the country, it is no surprise that both research and politics increasingly pay attention to the role of these emigrants. Many emigrants send remittances, with an immediate impact on the disposable household income of family members left behind. Indeed, remittances have been considered a major factor for boosting consumer expenditure in Albania, and are widely credited for fuelling the construction sector in the country. Figure 33 shows that the total amount of remittances sent to Albania has steadily increased between 2001 and 2008. Very broadly, this increase seems to correspond to the increasing number of Albanian emigrants. The highest amount of remittances recorded was in 2008 with 1,495 million USD. This is equivalent to 11.5 percent of the annual GDP that year, highlighting the important role that remittances play in the Albanian economy.
Figure 33: In-flow of remittances, 1992 – 2013, in millions of USD
Note: total remittances received in Albania, in millions of USD; source: World Bank: Migration and Remittances data (updated as of January 2014).
During the same period, Albania enjoyed considerable and uninterrupted economic growth at an average of 5.9 percent annually (2003 – 2008). In the wake of the Great Recession, as Figure 33 illustrates, the flow of remittances has clearly decreased. This is directly related to the economic situation in Greece and Italy, the two countries accounting for the largest shares of remittances. Figure 34, illustrates that Greece and Italy jointly account for 85 percent of the remittances. This compares to around 85 percent of the emigrant stock in these two countries.

44 Migration in Albania
Figure 34: Remittances in 2011 by country of origin, in (%)
Source: World Bank
Using data from the LSMS 2012, with regard to remittances, it is possible to describe the flow of remittances from the perspective of households that receive them. The households were asked about members that were currently abroad to get information on the status of employment, remittances and some demographic characteristics. As Figure 35 illustrates, about 46 percent of current migrants send remittances at home, mostly in cash (35 percent) but also in kind, or both. The figures are well related with the status of employment, those who are currently working accounting for 66 percent.
Figure 35: Flow of remittances to households during 2012 and employment status of current migrants, in (%)
Data from LSMS 2012 show that remittances are used for household expenditures and a small part is dedicated to the remittance sender’s use. Only 3 percent of the migrants living currently abroad seem to send money for their own use (according to the declaration of the household). When it comes to how these remittances for the sender’s use are used once sent to Albania, nearly 80 percent of the money is invested in construction work, with another 16 percent invested in business development. These estimates correspond with other studies that report that between 10 and 12 percent of remittances are invested rather than spent on household expenditure (LSMS 2002, ETF 2007, de Zwagger et al. 2010). With so much money invested in property; it is easy to see why remittances and the construction sector are seen as closely linked in Albania. These are forms of investment where remittances add to long-term development in some form, in the sense that almost all the money is invested in potentially durable products – as opposed to direct consumer spending.

4IMPACT OF MIGRATION
45Migration in Albania
This said, with the figures presented here it is impossible to establish the quality and sustainability of the investments undertaken. A new building in the wrong location may end up unused, hence making no durable contribution to the country. By contrast, investments in buildings where members of the family live in reflect upgrades in living standards that are a sustainable contribution to the family and the country more widely. For example, investments in sanitation will have direct benefits for the health of the family, which indirectly benefits the country by keeping healthcare costs down.
Focus on Tirana
While remittances play an important role in Albania, there are also many migrants who move within Albania. Tirana attracts the largest share of these internal migrants, and here the focus is on the six communes surrounding Tirana as above (Map 3). The demographic changes outlined in the chapter on internal migration have had wider consequences, but all in all the six communes resemble typical urban settlements in Albania. For instance, in terms of education, the population in the six communes surrounding Tirana does not differ significantly from the national average. With just two percent illiterates, the areas fare somewhat better than the national average at three percent. As elsewhere the majority of the population has completed primary or lower secondary education, suggesting that the labour market in the six communes surrounding Tirana is not radically different from other urban areas in Albania. This view is underlined by the fact that with 10 percent of university graduates, the six communes surrounding Tirana correspond to the national average. That said, there are clear clusters within these communes, and 90 percent of the university graduates in the six communes under consideration live in Kashar and Farkë.
Table 3: School attendance and literacy
Note: education attendance, literacy and educational attainment in Tirana and the six communes surrounding Tirana, in (%) of their respective population.
Above we noted the relative dominance of young age groups in the six communes surrounding Tirana. In the most recent decade, a quarter of the population belonged to the age group of 0 – 14. This is noticeably higher than for the city of Tirana, with 17 percent of the population in this age group. This either indicates higher fertility rates in the communes surrounding Tirana, or in-migration of families with young children. It is also interesting to note that the number of single-parent households is relatively high in the areas under consideration, especially in Kamza (3,485 people or 1,116 family nuclei), followed by Paskuqan and Kashar.
Never attended school Highest diploma obtained
Literate IlliterateWithout
diplomaPrimary
Lower
Secondary
Upper
Secondary
University and
advanced
Bërxullë 1.1 1.7 0.9 16.7 54.0 20.9 4.7
Dajt 1.3 1.6 1.3 13.8 36.1 32.2 13.7
Farkë 1.4 1.3 0.8 12.7 29.5 32.5 21.7
Kamëz 1.5 2.1 0.9 18.0 47.8 24.6 5.1
Kashar 1.4 1.1 1.1 12.4 32.3 35.8 15.9
Paskuqan 1.4 2.0 1.0 17.2 49.1 24.6 4.7
Tiranë 1.6 1.3 0.9 9.7 20.7 38.7 27.0

46 Migration in Albania
Table 4: Single parent households, in (%)
Note: percentage of family nuclei that are single households by commune, national average 9%.
90 percent of the households in the six communes surrounding Tirana report living in their own property. This figure includes those who legally own their property and those who are in the process of legalizing their property. This figure is exactly the same across Albania where 90 percent population own their own property. In many instances, remittances from family members abroad have contributed to the ownership of one’s housing, or helped improve living standards by upgrading the property. Access to running water is a key indicator of the living standards in housing. In the six communes surrounding Tirana, almost all households have running water, but there are 3 percent of households with no running water in their property. This compares to 2.6 percent of households without running water across Albania and 0.9 percent of households without running water in the centre of Tirana. If we consider non-piped water supplies, 19 percent of the households in the six areas surrounding Tirana lack adequate water supply. This compares to 11.2 percent for households across Albania, and highlights that urbanization on its own does not end poor living conditions for everyone. Indeed, looking at the prevalence of households without any toilet at all, it is clear that poor levels of sanitation still exist in the six communes surrounding Tirana where 0.4 percent of households have no toilet and 4 percent have “other” types of toilets.
Children and the Social Impact of Migration
The analyses in this report confirm that families play an important role in Albanian migration. Using data from LSMS 2012 it is possible to gain a better picture of emigrants, given that household members in Albania are asked to answer questions about their family members not currently residing in the household, including family members abroad. Obviously these figures cannot capture households where all members live abroad, but they give a better indication of the social impact of migration than census data alone.
Of all the households that report having internal migrants in their household, about half state that they have at least three members who moved to another part in Albania (Table 5 in the appendix). This suggests that in many cases internal migration takes place as a family unit or as a sub-family unit consisting of multiple family members. Indeed, when looking at the figures disaggregated by sex, in 92 percent of the described cases both male and female household members moved. In 6 percent of these cases there are only female household members who have moved; in 2 percent there are only males who have moved. This finding corresponds to the lack of significant gender differences outlined in the section on internal migration above.
Figure 36 shows where family members live, if they do no not live in the current household. There are clear differences between urban and rural areas, and also differences between areas of Albania. The differences mostly concern internal migrants; for international migrants there are no clear differences across areas and between urban and rural places. For families in urban areas, family members not currently residing in the household are clearly more likely to live elsewhere in Albania than abroad. This is particularly pronounced in Tirana. For families in rural areas, the difference is not nearly as marked, and particularly in mountainous areas the difference is small. The implication of these differences is that rural areas are likely to receive relatively more remittances, leading to building activities in rural areas. Assuming that urbanization in Albania is continuing as it does in other transition countries, it is unclear whether all these investments are economically sustainable.
Single parent
household
Bërxullë 6.1
Dajt 7.4
Farkë 6.5
Kamëz 8.1
Kashar 7.1
Paskuqan 8.1
Tiranë 9.9

4IMPACT OF MIGRATION
47Migration in Albania
Figure 36: Place of residence and region of family members not currently residing in the household, in (%)
Note: the classifications are according to the LSMS division of the country that, apart from urban Tirana, includes coastal areas (Lezhë, Kurbin, Kavajë, Mallakastër, Lushnje Delvinë, Sarandë, Durrës, Fier, Vlorë), central areas (Devoll, Kolonjë, Pogradec, Mirditë, Pukë, Malësi e Madhe, Mat, Kuçovë, Skrapar, Krujë, Peqin, Gjirokastër, Përmet, Tepelenë, Shkodër, Elbasan, Berat, Korçë), and mountainous areas (Kukës, Has, Tropojë, Bulqizë, Dibër, Gramsh, Librazhd).
In contrast to internal migration, it appears that international migration is more individualistic than internal migration. The majority of households who declare having a family member abroad, report only one family member abroad (76 percent– see Table 8 in the appendix). These household members abroad are equally likely to be men than women.
When people move to another part in Albania, they often leave behind family members. This can include children who are left with members of the family, including grandparents. Spouses or partners and children left behind by migrants during their migration time account for about 60 (Figure 37). Going into more details, 54 percent of them have left the spouse and more than half have left the children in the household of origin. Children and spouse together are left in the household of origin by 48 % or elsewhere in the country by 11 percent of migrants during their migration period. The non-negligible number of emigrants who have a partner living elsewhere in Albania suggests that in some cases external and internal migration are joint phenomena: when one person leaves the country, those left behind do not necessarily stay in their original place of residence.
Almost one third of emigrants report that they are joined by their partners abroad while one in four also has the children along. Interestingly, there is also a small number of partners (0.3 percent) and children (1 percent) who lived elsewhere abroad. This seems to lead again to the individual character of international migration, and apparently mostly the children can live in a different place than their parents or other family members.

48 Migration in Albania
Figure 37: Spouse and children during the migration time, in (%)
Source: LSMS 2012
The situation is slightly different when considering members of households that are currently living abroad (Figure 37). More than 60 percent of emigrants have their partners and children with them abroad (65.5 and 60.1 respectively), while 5.6 percent report that their children still reside in Albania. Of these, the majority (4.2 percent) live in the same household – in many case probably with their grandparents or other close relatives given that only 3.5 percent of spouses live there also –, but there are also children who live elsewhere in Albania (1.4 percent), or yet in another country (1.8 percent). As with the returned migrants described in the context of Figure 38, this indicates that migration can lead to complex family arrangements. In all cases, whether they involve children or not, the psychological costs of such complex family arrangements may be high and have a negative impact on the health of the family.
Figure 38: Spouse/partner and children of current migrants, in (%)
Source: LSMS 2012
Note: this HH refers to the household where the emigrant lived before emigrating.

4IMPACT OF MIGRATION
49Migration in Albania
Poverty and Household Structure by Migration Status
It is widely recognized that migration in Albania has been driven by individuals seeking better economic and social opportunities. Remittances have helped many Albanian households to improve their living standards, and more widely to escape poverty. A detailed look at poverty indicators shows a considerable positive outcome for those households with permanent migrants compared to those without (Figure 39). The figure compares the situation in 2005 as reported by Azzarri and Carletto (2009) with that of today2. The indicators indicate considerable improvement across Albania – yet improvement in the households with migrants is more accentuated than in households without migrants. Yet, the ratio of poverty incidence when considering migrants/non-migrants is higher in 2012 than 2005. This on the other hand means that the positive impact of migration in terms of poverty alleviation is declining.
Figure 39: Poverty indicators by migration status, 2005 and 2012, in (%)
Source: LSMS 2005, LSMS 2012
Description of indicators measuring poverty: The poverty headcount measures the proportion of the population that is poor. The poverty gap measures the extent to which individuals fall below the poverty line (as a proportion), indicating how poor the poor are. The sum of these poverty gaps gives the minimum cost of eliminating poverty, if transfers were perfectly targeted. Poverty severity (the squared poverty gap) averages the squares of the poverty gaps relative to the poverty line. It allows highlighting changes in inequality among the poor, varying the amount of weight on the expenditure level of the poorest members in society.
Households with migrants are more likely to be headed by a woman than households without migrants. Of the households with migrants, 22 percent are headed by women; of the households without migrants 9 percent are headed by women.
The differences between households with and without migrants are substantively the same whether permanent or temporary migration is taken into consideration (see Table 11 in the appendix).
Through a different poverty angle, access to health services provides a particularly interesting insight into the issue of how migration has affected the social aspects and challenges of Albanian households. The Living Standards Measurement Survey addresses certain questions under the access to health care and services and medication disaggregated by the four regions and 12 prefectures. Three of the most relevant dimensions for our own migration analysis include – the ability to access the hospital service, ability to pay for treatment as well as the ability to afford medicine when entitled to purchase medicines with discount for households with and without migration (Figure 40).
2- Based on LSMS 2012 data

50 Migration in Albania
Figure 40: Access to health care of households by migration status of the members, in (%)
Source: LSMS 2012
While access to a hospital and the ability to purchase medicines seem to be at similar levels for the households without migrants and households with permanent or temporary migrants, being refused treatment due to an inability to pay appears to stand out. Households without permanent migrants display a considerably higher frequency compared to those with any migrant – permanent or temporary. The analysis of the characteristics of migrants versus non migrants and their respective households reveals interesting insights on the comparable differences between migrants and non-migrants and how these differences have evolved.
The 2005 LSMS data featured permanent migrants that were generally younger, male and slightly more educated than the average adult who stayed in his original location. In comparison, the 2012 data feature the same patterns – although with narrowing differences. If educational attainment is considered, it is interesting to note that households with migrants are on average less educated, partly as a result of the migration of the more educated members in the household. This tendency is the same in 2005 and 2012 with an improved overall level of education for both categories in 2012.
The dependency ratio for households with current migrants has seen a considerable increase in 2012 compared to 2005. This means that there is a greater pressure on the migrant households as economically active members have emigrated abroad. Indeed, the number of elderly in migrant households is higher compared to those without. However, this increased pressure on households with migrants does not appear problematic, as the poverty headcount is significantly lower for households with migrants.
On the other hand, data gathered from LSMS reveal some interesting findings related to returned migrants (Table 12 in appendix). While in 2005 the poverty headcount was similar for both households with returnees and households without returnees, in 2012 a considerable improvement is noted with regard to households with returnees. While the poverty headcount was 19 percent in 2005, in 2012 it stood at 9 percent – a marked improvement. Although the poverty situation has improved across the board, for households with returned migrants the improvement was particularly notable. This may be due to returnees bringing their savings when they return, and in between 2005 and 2012 many Albanians have returned, especially from Greece. Similar differences can be observed on the basis of the poverty gap assessment, which also saw a particular improvement for households with returned migrants between 2005 and 2012. At the same time, some returned migrants face difficulties to be re-integrated in the labour market. Indeed, the employment ratio in households with returned migrants is significantly lower (66%) than in households without migrants (91%). Put differently, migration is not a universal means to reduce poverty and economic hardship.

5CONCLUSION
51Migration in Albania
5. CONCLUSIONAlbania’s post-communist transition has been characterised by a large movement of the population within the country and abroad in search of better opportunities. For many Albanians this meant moving to another place in the country – with Tirana attracting by far the largest share of internal immigrants, reflecting the increasing urbanization of Albania. At the same time, many Albanians tried their luck abroad. With significant waves of emigration after the lifting of travel restrictions, many experts and commentators expected levels of emigration to decrease markedly after the first decade of transition. While emigration may have slowed down a bit, large numbers of Albanians continued to leave the country between 2001 and 2011. Combined with a decline in fertility, these patterns of migration resulted in a marked drop in the Albanian population from around 3.1 to around 2.8 million people.
The impact of these changes varied across the different areas of Albania, with many communes in mountainous areas experiencing a drastic drop in population numbers. Since the individuals who leave these places – be it for a different place in Albania or somewhere abroad – are not evenly spread across the population, there is a significant impact on the demographic composition. Some prefectures already see an ageing population, while in others there is a clear gain in people of working age, opening opportunities for development.
An important change compared to the previous decade is that between 2001 and 2011 some differences in the propensity to move have declined. Notably in the case of emigration we observe vanishing gender differences, meaning that men and women are now nearly as likely to move abroad. Similarly, in the case of internal migration, differences between urban and rural patterns of movements have almost entirely disappeared. At the same time, there are differences that have increased, such as the more pronounced peak of emigration in young working age. This may indicate that the era of entire families moving abroad has largely ended, and that in its place different patterns of emigration have gained importance, including circular and work-specific migration.
While patterns of urbanization can be observed, in the decade between 2001 and 2011 it was particularly areas surrounding the urban centres that have attracted the largest share of immigrants. This can be understood as a trend towards larger agglomerations in Albania. In this process, some communes have seen their population increase substantively, such as the population of Farkë, Dajt and Kashar that have almost tripled.
The desire to improve livelihoods transpired in all areas of migration covered in this report, be it internal and international migration for work reasons, or for study reasons which corresponds to investment in human capital. In many cases, such moves lead to whole families moving at the same time. This is not directly the case when women continue to move in the context of marriage, given the dominance of patrilocality in Albania. In the context of international migration, however, it was possible to ascertain that economic reasons shape patterns of migration, where rates of return migration from Greece and Italy were higher than from countries less affected by the Great Recession. This corroborates qualitative studies that suggest that most of these returned migrants planned to stay in Greece and in Italy for a longer period, and will leave at the next opportunity.
One reason they may be so keen to leave the country again is to send remittances to family members. Remittances are an important economic source for many Albanian families, and it appears that a significant part is invested – particularly in buildings – rather than simply spent on consumer goods. This suggests that in many cases, migration does indeed improve livelihoods with wider benefits for society such as in terms of improved health and welfare. These trends are reflected in lower poverty rates in households involving migrants, although differences may be less pronounced than they were in the past. Given the economic differences between Albania and neighbouring countries and trends towards urbanization in Albania, it seems unlikely that patterns of migration are going to change radically in the next decade.

52 Migration in Albania
6. APPENDIX
Figure 41: Rates of outflow change to Italy and Greece, 2005 to 2011, in (%)
Note: change in outflow between two years, expressed as a percentage of the outflows in the following year.
Source: OECD
Figure 42: Returned migrants with tertiary education, 2001 to 2011
Note: first and second stage tertiary education combined. The graph does not mean the country where the tertiary education has been completed.
Source: Census 2011

6APPENDIX
53Migration in Albania
Figure 43: Usual resident population born in Greece by age and sex
Source: Census 2011
Table 5: Resident population which changes usual residence, 2010 – 2011
Prefecture
2011
Prefecture 2010
Be
rat
Dib
ër
Du
rrë
s
Eb
asa
n
Fie
r
Gji
rok
ast
ër
Ko
rçë
Ku
kë
s
Le
zh
ë
Sh
ko
dë
r
Tir
an
ë
Vlo
rë
Berat * 29 48 69 20 17 * * 6 135 65Dibër * 34 16 16 * * 11 10 18 117 *Durrës 147 524 309 103 53 117 197 137 92 234 16Ebasan 48 31 57 113 7 105 20 9 24 115 25Fier 148 26 39 193 83 38 15 18 19 207 151Gjirokastër 31 * 20 17 37 14 * * 6 66 45Korçë 53 25 49 160 35 17 15 20 10 177 18Kukës * 7 35 7 12 * * 6 42 89 *Lezhë 21 52 81 27 26 11 19 10 266 77 8Shkodër 19 62 75 34 56 * 26 113 146 126 *Tiranë 879 1,695 661 913 1,608 541 1,060 974 519 664 630Vlorë 153 42 38 76 270 174 47 13 29 30 175
Note: resident population which changed its place of usual residence within Albania since 1 January 2010 by prefecture of usual residence on 1 October 2011 and 2010;
(*) the values less than 3 are hidden for confidentiality reasons.
Source: Census 2011

54 Migration in Albania
Table 6: Proportion of emigrant to closed population, 2011, in (%)
Source: INSTAT
Table 7: Albanians’ stock abroad by country of residence
CountriesAlbanians’
stock abroadIn percentage
Italy 491,495 46.8Greece 449,706 42.8United States* 76,870 7.3
United Kingdom 11,000 1.0
Germany 10,293 1.0Other 11,781 1.1
Source: OECD
(*) The data are based on nationality, while for the United States the data are based on country of birth
Grupmosha Male Female
0 - 4 6.18 4.91 5 - 9 12.60 12.30
10 - 14 12.95 11.98 15 - 19 11.46 9.18 20 - 24 23.39 28.50 25 - 29 34.63 38.74 30 - 34 34.16 31.69 35 - 39 26.59 20.24 40 - 44 16.13 11.06 45 - 49 10.15 7.86 50 - 54 7.48 5.35 55 - 59 3.17 0.71 60 - 64 2.95 3.73 65 - 69 -0.47 3.15 70 - 74 -3.99 0.91 75 - 79 -7.11 -0.26 80 - 84 -4.69 -0.09
85+ -16.31 -30.07

6APPENDIX
55Migration in Albania
Table 8: Characteristics of households from which former members have migrated, in (%)
Source: LSMS 2012
Residence RegionTotal
Characteristic Urban Rural Central Coastal Mountain Tirana
WITHIN ALBANIA
Number of migrants
1 13.8 15.0 21.4 11.4 6.6 10.1 14.1
2 37.0 30.6 35.7 33.9 47.5 34.1 35.2
3+ 49.2 54.5 42.9 54.7 45.9 55.8 50.6
Total 100.0 100.0 100.0 100.0 100.0 100.0 100.0
Sex of migrants
Male 2.1 1.9 1.9 1.8 0.0 3.0 2.0
Female 6.4 6.1 8.3 4.8 3.3 6.7 6.3
Male and Female 91.5 92.0 89.8 93.4 96.7 90.3 91.7
Total 100.0 100.0 100.0 100.0 100.0 100.0 100.0
OUTSIDE ALBANIA
Number of migrants
1 75.6 75.7 76.5 71.5 89.4 73.9 75.6
2 17.7 17.8 16.3 20.5 6.4 26.1 17.7
3+ 6.8 6.5 7.1 8.0 4.3 6.6
Total 100.0 100.0 100.0 100.0 100.0 100.0 100.0
Sex of migrants
Male 3.2 2.5 2.4 4.0 2.1 2.2 2.9
Female 5.1 1.1 2.4 4.5 2.1 4.3 3.2
Male and Female 91.6 96.4 95.2 91.5 95.7 93.5 93.9
Total 100.0 100.0 100.0 100.0 100.0 100.0 100.0
EITHER WITHIN OR OUTSIDE ALBANIA
Number of migrants
1 22.5 33.0 35.9 21.1 35.9 11.8 26.2
2 35.9 32.1 34.0 34.4 34.0 36.2 34.5
3+ 41.7 34.9 30.1 44.6 30.1 51.9 39.3
Total 100.0 100.0 100.0 100.0 100.0 100.0 100.0
Sex of migrants
Male 2.5 2.2 2.1 2.6 1.0 3.1 2.4
Female 6.4 3.9 6.0 5.0 2.9 6.6 5.5
Male and Female 91.1 93.9 91.9 92.4 96.1 90.2 92.1
Total 100.0 100.0 100.0 100.0 100.0 100.0 100.0

56 Migration in Albania
Table 9: Place of residence and region of households by migration status, in (%)
Source: LSMS 2012
Table 10: Quartiles of monthly average consumption per HH by migration status, in (%)
Source: LSMS 2012
Household migration status
Background
characteristic
Households
from which
at least one
former member
migrated within
Albania
Households
from which
at least one
former member
migrated
outside Albania
Households
from which
member
migrated both
within and
outside Albania
Households
from which
members
migrated
either within or
outside Albania
Households with
no migrants
Residence
Urban 22.8 8.6 2.9 28.6 71.4
Rural 10.3 9.0 1.0 18.2 81.8
Total 17.1 8.8 2.0 23.8 76.2
Region
Central 12.6 9.9 1.6 21.0 79.0
Coastal 22.6 10.3 3.0 29.9 70.1
Mountain 5.4 4.2 0.4 9.1 90.9
Urban Tirana 41.2 7.1 4.0 44.3 55.7
Total 17.1 8.8 2.0 23.8 76.2
Quartiles
of monthly
average
consumption
per HH
Households
from which
at least
one former
member
migrated
within Albania
Households
from which
at least
one former
member
migrated
outside
Albania
Households
from which
member
migrated
both within
and outside
Albania
Households
from which
members
migrated
either within
or outside
Albania
Households
with no
migrants
Total HH
First Q 18.7 9.4 2.5 25.6 74,4 25,0
Middle 18.3 10.2 2.2 26.3 73,7 25,0
Third Q 17.4 7.7 1.8 23.3 76,7 25,0
Highest 13.9 8.0 1.6 20.3 79,7 25,0
Total 17.1 8.8 2.0 23.8 76,2 100,0

6APPENDIX
57Migration in Albania
Table 11: Characteristics of current migrants and their household of origin
Source: LSMS 2012
Note: LSMS 2005 from Azzarri and Carletto (2009)
LSMS 2012 LSMS 2005
non-migrants migrants non-migrants migrants
Individual characteristics
% of females 50 34 69 35
Age (years old) 36.7 34.1 36.6 31.5
*Years of schooling 10.4 9.77 9.8 10.1
Household characteristics
Poverty headcount (%) 13.8 5.1 21 12
Poverty gap (%) 2.8 0.82 4.7 2.2
Severe poverty (%) 0.9 0.21 1.62 0.61
Dependency ratio (%) 56.5 89 84 81
Hosusehold size (members) 3.9 3.01 4.54 3.48
Number of adults (age>=15) (average inside the HH) 3.7 2.8 3.24 2.93
Number of children (age<15) (average inside the HH) 1 0.32 NA NA
Number of elderly (age>=65) (average inside the HH) 0.8 1.19 NA NA
Head is female (%) 8.9 21.6 8 18
Average adults years of education 10.4 9.57 9.2 8.36
Max adult years of education 12.1 10.84 11.1 10.12
Head is unemployed (%) 8.1 6 5 4
Head is married (%) 85 52 90 84
Head is widow/er (%) 11.6 4.9 7 15
Head is single (%) 1.4 27.3 10 16
Age of household head (years old) 55.8 54.4 48.5 59.3
Average age of adults in household (years old) 43.5 42.8 39.7 46.3

58 Migration in Albania
Table 12: Characteristics of returned migrants and their household of origin
Source: LSMS 2012 (Data for migrants over 15 years old)
Note: LSMS 2005 from Azzarri and Carletto (2009)
Table 13: Private households and number of household’s members by commune and type of household
Source: Census 2011
LSMS 2012 LSMS 2005
non-
migrants migrants
non-
migrants migrants
Individual characteristics
% of females 52.5 17.7 58 12
Age (years old) 43.1 39.1 41.8 37.8
*Years of schooling 10.3 10.1 8.7 10.1
Household characteristics
Poverty headcount (%) 14.51 9.11 18 9
Poverty gap (%) 2.97 1.71 3.98 4.04
Severe poverty (%) 0.96 0.53 1.32 1.35
No. unemployment (average inside the HH) 0.26 0.23 0.11 0.09
No. employment (average inside the HH) 0.91 0.63 NA NA
Dependency ratio (%) 73.3 77.3 82 84
Hosusehold size (members) 3.93 4.49 3.93 4.71
Number of adults (age>=15) (average inside the HH) 3.26 3.49 2.98 3.45
Number of children (age<15) (average inside the HH) 0.79 1.11 NA NA
Number of elderly (age>=65) (average inside the HH) 0.79 0.68 NA NA
Head is female (%) 12.50 7.35 14 6
Average adults years of education 10.24 9.89 8.82 9.17
Max adult years of education 11.87 11.63 10.58 11.11
Head is unemployed (%) 0.08 0.18 0.05 0.04
Head is married (%) 66 76 86 92
Head is widow/er (%) 9 2 11 7
Head is single (%) 23 21 14 8
Commune
Type of household
Total Households with no
family nucleus
Households with one
family nucleus
Households with
two or more family
nuclei
Households with non-valid
nucleus
HH Members HH Members HH Members HH Members HH Members
BËRXULLË 2,130 9,883 77 139 1,716 7,614 306 1,896 31 234
DAJT 4,847 20,139 316 582 3,973 16,116 488 2,938 70 503
FARKË 5,715 22,614 540 891 4,539 17,984 568 3,355 68 384
KAMËZ 14,533 66,841 485 1,026 12,184 54,098 1,728 10,723 136 994
KASHAR 11,004 43,058 951 1,760 8,734 33,700 1,169 6,682 150 916
PASKUQAN 8,113 37,309 298 614 6,680 29,578 1,027 6,381 108 736
TIRANË 117,870 410,829 16,095 24,577 92,199 332,353 8,588 48,766 988 5,133

6APPENDIX
59Migration in Albania
Tabl
e 14
: Fam
ily n
ucle
i and
mem
bers
by
com
mun
e an
d ty
pe o
f fam
ily n
ucle
us
Tabl
e 15
: Inh
abite
d dw
ellin
gs b
y co
mm
une,
wat
er s
uppl
y sy
stem
and
type
of t
oile
t
Co
mm
un
e
Ty
pe
of
fam
ily
nu
cle
us
To
tal
Ma
rrie
d o
r co
ha
bit
ing
cou
ple
wit
ho
ut
ch
ild
ren
Ma
rrie
d o
r co
ha
bit
ing
cou
ple
wit
h c
hil
dre
n
Lo
ne
fa
the
r w
ith
ch
il-
dre
n
Lo
ne
mo
the
r w
ith
ch
il-
dre
nN
ot
va
lid
nu
cle
ou
s
Fa
mil
y
nu
cle
iM
em
be
rsF
am
ily
nu
cle
iM
em
be
rsF
am
ily
nu
cle
iM
em
be
rsF
am
ily
nu
cle
iM
em
be
rsF
am
ily
nu
cle
iM
em
be
rsF
am
ily
nu
cle
iM
em
be
rs
BË
RX
UL
LË
2,44
29,
303
451
902
1,73
97,
380
2160
128
386
103
575
DA
JT5,
154
18,7
5989
61,
792
3,67
414
,871
8122
430
083
020
31,
042
FA
RK
Ë5,
890
20,7
901,
136
2,27
24,
158
16,5
0453
134
330
865
213
1,01
5
KA
MË
Z16
,128
62,7
632,
389
4,77
811
,962
51,5
9714
342
01,
166
3,48
546
82,
483
KA
SH
AR
11,4
4539
,775
2,43
04,
860
7,83
330
,879
140
375
668
1,82
837
41,
833
PA
SK
UQ
AN
9,10
334
,998
1,41
22,
824
6,61
428
,204
9727
664
21,
910
338
1,78
4
TIR
AN
Ë11
1,82
536
8,67
624
,781
49,5
6273
,431
280,
539
1,78
24,
453
9,32
823
,346
2,50
310
,776
Co
mm
un
e
Wa
ter
sup
ply
sy
ste
m
Ty
pe
of
toil
et
To
tal
Pip
ed
wa
ter
in t
he
dw
ell
ing
Pip
ed
wa
ter
ou
tsid
e t
he
dw
ell
ing
, b
ut
in t
he
bu
ild
ing
Pip
ed
wa
ter
ou
tsid
e t
he
bu
ild
ing
Oth
er
syst
em
of
wa
ter
sup
ply
No
wa
ter
sup
ply
sy
ste
m
Flu
sh t
oil
et
insi
de
th
e
dw
ell
ing
Flu
sh t
oil
et
ou
tsid
e t
he
dw
ell
ing
, b
ut
insi
de
th
e
bu
ild
ing
Flu
sh t
oil
et
av
ail
ab
le
ou
tsid
e t
he
bu
ild
ing
Oth
er
typ
e
of
toil
et
No
to
ile
t
BË
RX
UL
LË
2,0
52
1,1
04
88
187
6
46
27
1,5
71
271
6
7 1
36
7
DA
JT 4
,768
3
,730
4
44
199
3
26
69
3,9
61
446
1
96
153
1
2
FA
RK
Ë 5
,625
4
,040
8
91
122
3
42
230
4
,987
3
87
87
144
2
0
KA
MË
Z 1
4,04
7 5
,222
1
,667
1
,470
4
,898
7
90
11,
107
1,4
42
629
7
63
106
KA
SH
AR
10,
906
7,4
16
725
4
95
2,1
02
168
9
,914
3
64
168
4
33
27
PA
SK
UQ
AN
8,0
36
6,6
85
595
3
11
248
1
97
7,2
82
277
2
21
236
2
0
TIR
AN
Ë 1
15,7
01
104
,319
6
,189
1
,173
2
,944
1
,076
1
11,1
89
2,7
09
896
6
96
211
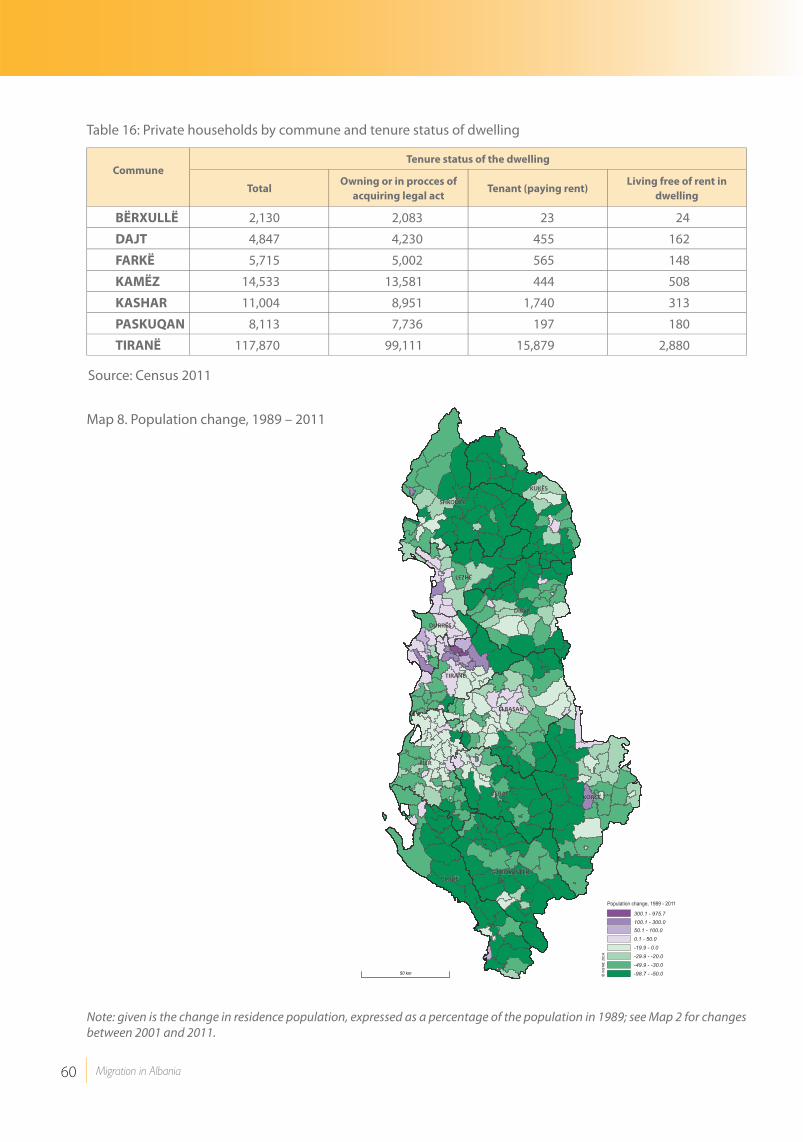
60 Migration in Albania
Table 16: Private households by commune and tenure status of dwelling
Map 8. Population change, 1989 – 2011
Note: given is the change in residence population, expressed as a percentage of the population in 1989; see Map 2 for changes between 2001 and 2011.
Source: Census 2011
Population change, 1989 - 2011
-98.7 - -50.0-49.9 - -30.0-29.9 - -20.0-19.9 - 0.0 0.1 - 50.050.1 - 100.0100.1 - 300.0300.1 - 975.7
© IN
STAT
, 201
4
KORÇË
DIBËR
FIER
VLORË
ELBASAN
KUKËS
SHKODËR
BERAT
LEZHË
TIRANË
GJIROKASTËR
DURRËS
50 km
Commune Tenure status of the dwelling
TotalOwning or in procces of
acquiring legal actTenant (paying rent)
Living free of rent in
dwelling
BËRXULLË 2,130 2,083 23 24
DAJT 4,847 4,230 455 162
FARKË 5,715 5,002 565 148
KAMËZ 14,533 13,581 444 508
KASHAR 11,004 8,951 1,740 313
PASKUQAN 8,113 7,736 197 180
TIRANË 117,870 99,111 15,879 2,880

7REFERENCES
61Migration in Albania
7. REFERENCESAgorastakis, Michalis, and Giorgos Sidiropoulos (2007), ‘Population Change Due to Geographic Mobility in Albania,
1989–2001, and the Repercussions of Internal Migration for the Enlargement of Tirana.’ Population, Space and Place 13 (6): 471–481. doi:10.1002/psp.463.
Azzarri, Carlo and Carletto, Calogero (2009), ‘Modeling Migration Dynamics in Albania’A Hazard Function Approach, The World Bank Development Research Group Poverty and Inequality Team May 2009Bërxholi, A., (2005): ‘Veçoritë e vizualizimit të dinamikës së popullsisë, në: ‘Atlasin gjeografik të popullsisë së Shqipërisë (Some particularities of the visualisation of population dynamics, in: Geographic Atlas of the Albanian Population).’ Akademia e Shkencave, Qendra per Studime Gjeografike (Center for Studies), No.15, pp.156-70.
Carletto, C., Davis, B., Stampini, M., Trento, S.andZezza, A. (2004), ‘Internal Mobility and International Migration in Albania,’ ESA Working Paper No. 04-13.
Çaro, E., and van Wissen, L.J.G (2007), ‘Migration in the Albania of the post 1990s: triggered by postcommunist transformations and facilitator of socio demographic changes, Europe Review for Labour and Social Affairs’ (SEER South East Europe Review for Labour and Social Affairs), issue: 03 / 2007, pages: 87105, on www.ceeol.com.
De Zwager, N., Gressman, W., Gedeshi, I., (2010), ‘Market Analysis: Albania – Maximising the Development-Impact of Migration-related Financial Flows and Investment to Albania’, Vienna.
De Haas, Hein. (2010), ‘The Internal Dynamics of Migration Processes: A Theoretical Inquiry.’ Journal of Ethnic and Migration Studies 36 (10): 1587. doi:10.1080/1369183X.2010.489361.
De Haas, Hein. (2011), ‘The Determinants of International Migration: Conceptualizing Policy, Origin and Destination Effects.’ IMI Working Papers 32: 1–35.
Doka, D. (2005), ‘Zhvillimet socio-ekonomike dhe rajonale te Shqipërisë pas vitit 1999’. Studime Gjeografike, 24. Posdam 2005.
ETF, (2007), ‘The contribution of human resources development to migration policy in Albania’, Tirana.
INSTAT Albanian Institute of Statistics (2004), ‘Migration in Albania in 2001’, REPOBA, Tirana.
King, R., Vullnetari, J., (2009), ‘The intersections of gender and generation in Albanian migration, remittances and transnational care, in Geografiska Annaler’: Series B, Human Geography, Volume 91, No.1, pp. 19-38.
King, R., and Vullnetari, J., (2003), ‘Migration and Development in Albania,’ Working Paper C5, Sussex Centre for Migration Research.
King, R., (2004) Albania, ‘Interrelationships between population, poverty, development, internal and international migration. Méditerranée,’ 103 (3/4). pp. 37-48.
Lerch, Matthias. 2013. ‘Urbanisation et transition de la fécondité en Albanie’, Quetelet Journal 1(1):41-61.
Lundstrom, S. and Ronnas, P., (2006), ‘Integrated Economic Analysis for Pro-Poor Growth’, SIDA Methods Document, SIDA, Stockholm. Methods Document, SIDA, Stockholm.
Maroukis, Thanos, and Gemi, Eda (2013), ‘Albanian Circular Migration in Greece: Beyond the State?’ In Circular Migration Between Europe and Its Neighbourhood, edited by Anna Triandafyllidou. Oxford: Oxford University Press.
Mai, Nicola, and Christiana Paladini (2013), ‘Flexible Circularities: Integration, Return and Socio-economic Instability Within Albanian Migration to Italy.’ In Circular Migration Between Europe and Its Neighbourhood, edited by Anna Triandafyllidou. Oxford: Oxford University Press.
Ravenstein, E. 1885. ’The Laws of Migration.’ Journal of the Statistical Society of London: 167–235.
Sjöberg, Ö. (1992a), ‘Rural change and development in Albania’. Oxford: West view Press.
Sjöberg, Ö. (1992b), ‘Urbanisation and the zero urban growth hypothesis: Diverted migration in Albania’, Geografiska Annaler 74B (1): 3-19.
Vullnetari, J., (2007), ‘Albanian Migration and Development’: State of the Art Review, IMISCOE Working Paper No. 18.
Vullnetari, J. (2009) ‘The dynamics between internal and international migration: a development-oriented ethnographic study in Albania’. Unpublished PhD dissertation. Sussex: University of Sussex.


8ADDITIONAL BIBLIOGRAPHY
63Migration in Albania
8. ADDITIONAL BIBLIOGRAPHYAzzari, C., Carletto, G., Davis, B., Zezza, A., (2008): Migration and Labour Choice in Albania. Paper presented at the
World Bank ABCDE-Conference, June 10-11, Tirana, Albania.
Azzari, C., Carletto, G., (2009): Modelling migration dynamics in Albania: a hazard function approach. Southeast European and Black Sea Studies, 9(4), pp. 407-33.
Baldwin-Edwards, M., (2004): Statistical Data on Immigrants in Greece. An Analytic Study of Available Data and Recommendations for Conformity with European Union Standards. Mediterranean Migration Observatory, University Research Institute for Urban Environment and Human Resources, Panteion University, Athens.
Barjaba, K, King, R., (2005): Introducing and theorising Albanian migration, in: King, R., Mai, N. and Schwandner-Sievers, S. (eds.) The New Albanian Migration. Sussex Academic Press, Brighton-Portland, pp. 1-28.
Betti, G.,Dabalen, A.,Ferre, C., and Neri, L.,(2010):Further Updating Poverty Mapping Albania. Paper prepared for presentation at the World Bank International Conference on Poverty and Social Inclusion in the Western Balkans, in December 14-15, Brussels, Belgium.
Bërxholi, A., (2000): Regjistrimet e përgjithshme të popullsisë në Shqipëri. Vështrim historik (Censuses in Albania. A Historical Perspective). Tirane: Akademia e Shkencave, Qendra e Studimeve Gjeografike (Academy of Science, Center for Geographic Studies).
Bërxholi, A., (2005): Veçoritë e vizualizimit të dinamikës së popullsisë, në: ‘Atlasin gjeografik të popullsisë së Shqipërisë (Some particularities of the visualisation of population dynamics, in: Geographic Atlas of the Albanian Population). Akademia e Shkencave, Qendra per Studime Gjeografike (Center for Studies), No.15, pp.156-70.
Black, R. Natali, C., Skinner, J., (2005): Migration and inequality. Development Research Centre on Migration, Globalisation and Poverty, University of Sussex, Working Paper.
Carletto, G., Davis, B. Stampini, M., Zezza, A., (2006): A Country on the Move: International Migration in the Post-Communist Albania in: International Migration Review, Volume 40/4, pp. 767-785.
Carletto, G. Davis, B. Stampini, M., Zezza, A., (2004): Internal mobility and international migration in Albania. Rome, FAO, ESA Working Paper, pp.4-13.
De Soto, H., Gordon, P., Gedeshi, I., Sinoimeri, Z., (2002): Poverty in Albania. A Qualitative Assessment. The World Bank Technical Papers, Washington D.C.
De Zwager, N., Gedeshi, I., Germenji, E., Nikas, Ch., (2005): A study on: Competing for remittances, IOM, Tirana, Albania.
De Zwager, N., Gressman, W., Gedeshi, I., (2010): Market Analysis: Albania – Maximising the Development-Impact of Migration-related Financial Flows and Investment to Albania, Vienna.
ETF, (2007): The contribution of human resources development to migration policy in Albania, Tirana.
European Commission, (2008) Social Inclusion and Social Protection in Albania, Institute for Contemporary Studies in Albania (Agolli, M., Gjermeni, E., Jorgoni, E., Kalo, I., Lama, A. et al) subcontracted by the Directorate general for Employment, Social Affairs and Equal Opportunities, Brussels
European Commission, (2012) Social Impact of Migration and Rural – Urban Migration in Central and Eastern Europe, Country Report Albania, DG-Employment European Commission, Brussels (experts Gedeshi, I. and Jorgoni, E.)
Galanxhi, E., (2005): Albanian emigration 1989-2001. Paper presented at the UNECE/Eurostat Seminar on Migration Statistics, Geneva, Switzerland.
Gedeshi, I., (2002): The Role of Remittances from Albanian Emigrants and their Influence in the Country’s Economy, in: Eastern European Economics, Vol. 40, No. 5, September-October 2002, pp. 49-72.
Gedeshi, I., Mara, H., (2003): The encouragement of social-economic development in relation to the growth of the role of the remittances, UNDP Albania.
Gedeshi, I., Sabates-Wheeler, R., (2006): Poverty, Vulnerability and Migration during transition in Albania, Working Paper, DRC Migration and Poverty, Sussex University.
Gedeshi, I., (2008): The Relationship between Migration and Socio-Economic Changes in Albania, in: Der Donauraum, No.3/2008, pp. 205-22.
64 Migration in Albania
Gedeshi, I.,(2010): The Global Crises and Emigration – Monitoring a Key Transmission Channel to the Albanian Economy, UNDP/IOM/WB Albania.
Gërmenji, E.,Swinnen, J., (2004): Effects of Remittances on Household-Based Farm Production Behaviour. Paper presented at the conference ‘New Perspectives on Albanian Migration and Development’, Korçë, Albania.
Gedeshi I., de Zwager N., (2012) Effects of the Global Crisis on Migration and Remittances in Albania, in the book Migration and Remittances during the Global Financial Crisis and Beyond, edited by Ibrahim Sirkeci, Jeffrey H. Cohen, DilipRatha, The World Bank, Washington D.C.
Gërmenji, E., Swinnen, J., (2005): Human Capital, Market Imperfections Poverty and Migration: Evidence from Albania. LICOS Working Paper, No.5.
Hagen-Zanker, J., Azzari, C., (2010): Are Internal Migrants in Albania Leaving for the Better? In: Eastern European Economics, Vol.48, No.6, November-December, pp. 57-84
Iara, A., (2009): The effect of work migration on domestic labour supply in Albania. Working Papers, Global Development Network Southeast Europe. April 2009.
IOM, International Organisation for Migration, (2007): The Republic of Albania. Migration Profile, Publisher: Ministry of the Interior of the Republic of Slovenia. On line available: http://www.iom.hu/PDF/migration_profiles2007/Albania_2007.pdf, last accessed 15.07.2013.
IOM, International Organisation for Migration, (2008): Identifikimi I zonave më të prekura nga emigracioni dhe migracioni I kthimit në Shqipëri: Profili I migrantëve të kthyer (Identification of the most affected areas from emigration and return migration in Albania: The profile of returned migrants).
IMF, (2006): World Economic Outlook Database
INSTAT, Albanian Institute of Statistics,(2002a): Albanian Population in 2001, REPOBA, Tirana.
INSTAT, Albanian Institute of Statistics, (2002b): Statistical Yearbook 1991-1999, Tirana.
INSTAT, Albanian Institute of Statistics, (2003): Statistical Yearbook 1993-2001, Tirana.
INSTAT, Albanian Institute of Statistics, (2004): Migration in Albania in 2001, REPOBA, Tirana.
INSTAT, Albanian Institute of Statistics,(2005): People and Work in Albania. Labour Force, Employment and Unemployment in Transition, Tirana.
INSTAT, Albanian Institute of Statistics,(2007):Labour Market 2006, Tirana.
INSTAT, Albanian Institute of Statistics, (2009a): Albania: Trends in Poverty 2002-2005-2008, INSTAT, UNDP, WB, April 2009.
INSTAT, Albanian Institute of Statistics, (2009b): Indicators by regions.
INSTAT, Albanian Institute of Statistics,(2010a): Labour Force Survey 2008.
INSTAT, Albanian Institute of Statistics (2010b): Albania in Figures, Tirana.
INSTAT, Albanian Institute of Statistics, IPH Institute of Public Health and ICF Macro, (2010d): Albania Demographic and Health Survey 2008-09. Tirana, Albania.
INSTAT, Albanian Institute of Statistics, (2011a): Albania. Preliminary Results of the Population and Housing Census 2011. Online available: accessed 07.02. 2012.
INSTAT, Albanian Institute of Statistics,(2011b): Conjuncture: Main Economic Indicators, April – June 2011. Tirana.
INSTAT, Albanian Institute of Statistics,(2011c): Regional Accounts 2009.
INSTAT, Albanian Institute of Statistics, (2011d): Produkti I Brendshëm Bruto Tremujor. Publikim i tremujorit të dytë për vitin 2011, (Gross Domestic Product Quarterly. Publication for the Second Quarter 2011), December 2011.
INSTAT, Albanian Institute of Statistics,(2011e): Labour Force Survey 2009.
ISTAT, Istituto Nazionale di Statistica, (2011): Statistiche demografiche (Demographic Statistics). Online available:http://demo.istat.it/, last accessed on 09.02.2012.
Karafolas, S., (2010): The demand for annual workers in Greece and its influence on the entrance of Albanian workers, in The World Bank International Conference, “Poverty and Social Inclusion in the Western Balkans”, Brussels, 14-15 December.
Kilic, T., Carletto, G., Davis, B., Zezza, A., (2007): Investing Back Home: Return Migration and Business Ownership in

8ADDITIONAL BIBLIOGRAPHY
65Migration in Albania
Albania. ESA Working Paper, No. 07-08.
King, R., Mai, N., Dalipaj, M., (2003): Exploding the migration myths. Analysis and recommendations for the European Union, the UK and Albania. London: The Fabian Society and Oxfam.
King, R., (2005): Albania as a laboratory for the study of migration and development in Journal of Southern Europe and the Balkans, Volume 7, No 2, pp. 133-155.
King, R., Dalipaj, M., Mai, N., (2006): Gendering Migration and Remittances Evidence from London and Northern Albania, in: Population Space and Place, Volume 12, No.6, pp. 409-434.
King, R., Vullnetari, J., (2006): Orphan Pensioners and Migration Grandparents: The Impact of Mass Migration on Older People in Rural Albania, in Ageing and Society, United Kingdom, Cambridge University Press, No. 26, pp. 783-816.
King, R., Vullnetari, J., (2009): The intersections of gender and generation in Albanian migration, remittances and transnational care, in Geografiska Annaler: Series B, Human Geography, Volume 91, No.1, pp. 19-38.
King, R., Piracha, P., Vullnetari, J., (2010): Migration and Development in Transition Economies of Southeastern Europe: Albania and Kosovo, in: Eastern European Economics, Volume 48, No. 6, pp. 3-16.
King, R., Uruci, E., Vullnetari, J., (2011): Albanian migration and its effects in comparative perspective, in: Journal of Balkan and Near Eastern Studies, Volume 13, No. 3, pp. 269-286.
Konica, N., Randall, F., (2009): Albanian Emigration: Causes and Consequences. In Lianos, Th. / Fountas, S. / Sarri, K. (eds.): South-Eastern Europe Journal of Economics, 1, pp. 75-98. Thessaloniki: University of Macedonia Press. Online Available: http://www.vwl.tuwien.ac.at/hanappi/Lehre/Economic%20Policy/2011/Konica_2009.pdf, last accessed: 23.11.2011.
Lambrianidis, L., Lyberaki, A., (2004): Back and forth and in-between: Albanian return-migrants from Greece and Italy, in: Shields, J. (ed.): Journal of International Migration and Integration, Volume: 5, Issue: 1, pp. 77-106.
Lambrianidis, L.,Hatziprokopiou, P., (2005): The Albanian Migration Cycle. Migrants Tend to Return to Their Country of Origin after All , in King, R. / Mai, N. / Schwandner-Sievers, S.(eds.): The New Albanian Migration, Sussex Academic Press, Brighton-Portland, pp. 93-117.
Lambrianidis, L.,Kazazi, B., (2006): Albanian Return-migrants from Greece and Italy: Their Impact upon Spatial Disparities within Albania, in: European Urban and Regional Studies, 13/1, Sussex Academic Press, pp. 59-74
OECD, (2004): The informal economy in Albania Analysis and Recommendations, Report prepared by the OECD - Investment Compact for the Ministry of Economy of Albania.
OECD, (2005): Trends in International Migration, Paris, SOPEMI – Edition 2004.
UN-INSTRAW &UNDP, (2010): Migration, Remittances and Gender-Responsive Local Development. The case of Albania.
UNDP, (1998): Albania Country Report, Tirana.
UNDP, (2005a):Tirana MDG Regional Report, prepared by Oxfam Albania.
UNDP, (2005b): National Human Development Report Albania 2005 Pro-Poor and Pro-Women Policies and Development in Albania. Operationalizing MDGs in Albania. Tirana.
UNDP, (2006): From Brain Drain to Brain Gain: Mobilising Albania’s Skilled Diaspora, Policy Paper for the Government of Albania.
UNDP, (2010): National Human Development Report for Albania: Capacity Development for EU Integration, Tirana 2010
UNICEF, (2009): Albanian Migration since the 1990s and its socio-economic influence on the children left behind. Tirana.
Vullnetari, J., (2007): Albanian Migration and Development: State of the Art Review, IMISCOE Working Paper No. 18.
World Bank, (2003): Albania Poverty Assessment, November 2003.
World Bank, (2006a): Migration and Remittances. Eastern Europe and the Former Soviet Union. Edited by Ali Mansoor, Bryce Quillin.
World Bank, (2006b): Albania, Labor Market Assessment, Report No. 34597-Al.
World Bank, (2007): Albania, Urban Growth, Migration and Poverty Reduction. A Poverty Assessment. Report No. 40071-AL, Washington.
World Bank, (2011): Migration and Remittances Factbook.

66 Migration in Albania
Zezza, A., Carletto, G., Davis, B., (2005): “Moving Away from Poverty: A Spatial Analysis of Poverty and Migration”, in Albania Journal of Southern Europe and the Balkans Vol.7, No. 2, pp.175-194.
Zoto S., (2001): Some features of emigration in the region of Prespa, Economy and Transition Journal, No. 3.