ENLARGEMENT DG 1 EU ENLARGEMENT DG Enlargement Information Unit From Six to Fifteen and Beyond.
date post
21-Dec-2015Category
view
222download
3
Migration and the Irish Labour Market since EU Enlargement
Brian McCormick
Economist
FAS

Overview
• Brief Literature Overview• Immigration Trends• Profile of EU10 workers• Absorption & Segmentation

Summary of pre-enlargement literature
Lack of research (Ruhs, 2005)
Immigration reduced wages (Barrett et al, 2006)
In 2004, immigrants earning 18% less (Barrett &
McCarthy, 2006)
Immigration main adjustment mechanism
(Honohan & Leddin, 2006)

Gross Migration Flows 1989-2006
0102030405060708090
100
000s
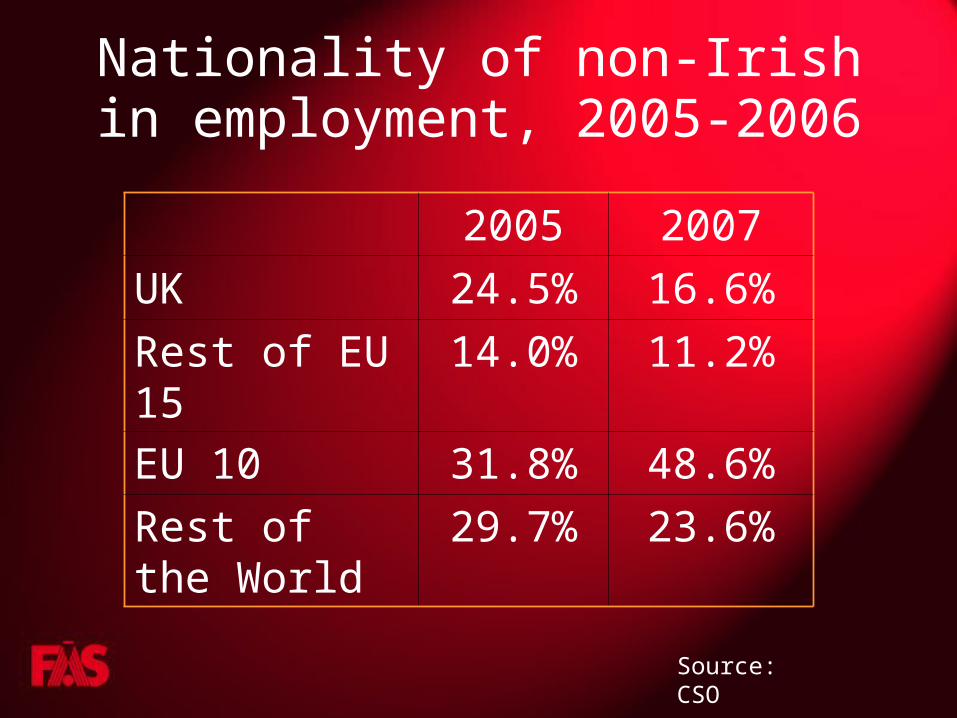
Nationality of non-Irish in employment, 2005-2006
Source: CSO
2005 2007
UK 24.5% 16.6%
Rest of EU 15 14.0% 11.2%
EU 10 31.8% 48.6%
Rest of the World
29.7% 23.6%

To Twenty-five….and then?
How far east?

To Twenty-five….and then?
How far east?

Post-enlargement migration trendPPSN Allocations to EU10
0
2000
4000
6000
8000
10000
12000
14000
16000Peak?

Sectoral Employment Growth by Nationality Since Enlargement
- 40
-20
0
20
40
60
80
000s
Non- Irish
Irish
Total

Labour demand has been strong
020000400006000080000
100000120000140000160000
2002
2003
2004
2005
2006
FAS Vacancies 2003-2006
Work Permit
Non-Work Permit

…..but shortages have been bearable
0
2
4
6
8
10
12
14
Jul-
02
Jan-03
Jul-
03
Jan-04
Jul-
04
Jan-05
Jul-
05
Jan-06
Jul-
06
Jan-07
%

Age Distribution
0%
10%
20%
30%
40%
50%
60%
15-19 20-24 25-34 35-44 45-54 55-59 60-64
EU10
Irish

Educational Profile
0%5%
10%15%20%25%30%35%40%
%EU10
%Irish

Occupational Distribution
0
0.05
0.1
0.15
0.2
0.25
0.3
% EU10
% Irish

EU10 % in 2006 Census Occupations (low rep)
0.0%
0.5%
1.0%
1.5%
2.0%
2.5%

EU10 % in 2006 Census Occupations (high rep)
0.0%2.0%4.0%6.0%8.0%
10.0%12.0%14.0%16.0%18.0%20.0%
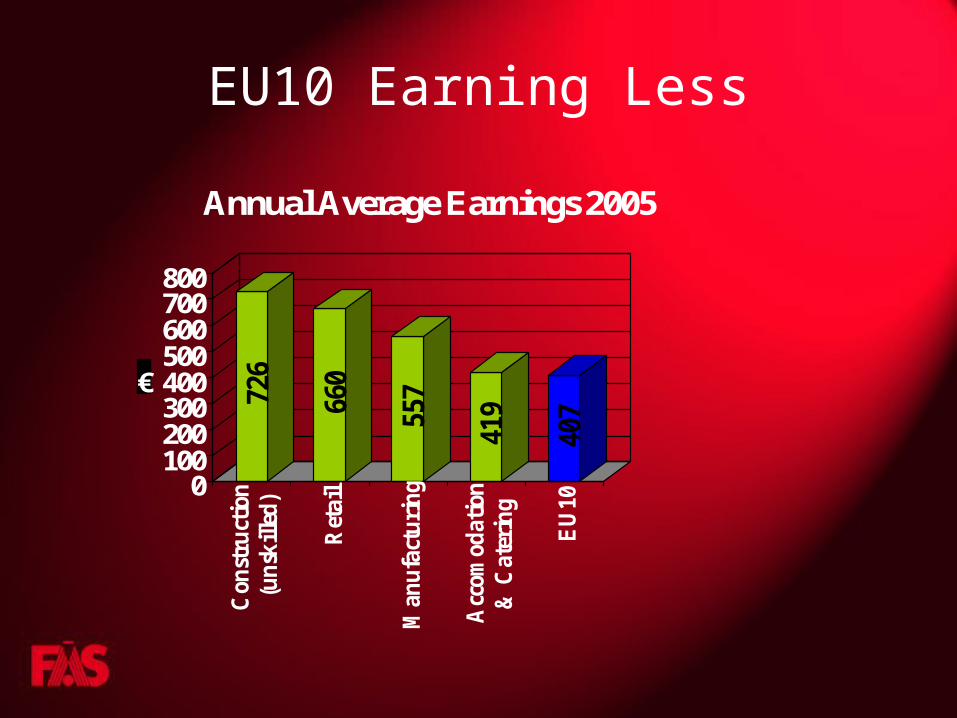
EU10 Earning Less
726
660
557
419
407
0100200300400500600700800
€
Con
stru
ctio
n(u
nsk
illed
)
Ret
ail
Man
ufa
ctu
rin
g
Acc
omod
atio
n&
Cat
erin
g
EU
10
Annual Average Earnings 2005

Occupational DistributionFigure 2.11: Average Weekly Earnings of EU10 Workersin 2005 by Month of Arrival
330340350360370380390400410420430

Minimum Monthly Salary in the EU
0
200
400
600
800
1000
1200
1400
1600
1800
000s

Absorption & Segmentation• Immigration has complemented Irish skills set• Displacement not a major issue
Doyle et al (2006), FAS (2006)• Is segmentation an issue? (low-skill, low-pay)• Risks increase in a slowdown• Minimum wage risk for low-skill occupations
(Fitzgerald et al (2007): • Can & should EU10 migration be influenced?

Thank you!


![1 Pensions (FAS 87); Post Retirement Benefits (FAS 106); Post Employment Benefits (FAS 112); Disclosure about Pensions, etc. (FAS 132 [R]) – amendment.](https://static.fdocuments.us/doc/165x107/56649d1f5503460f949f3b1c/1-pensions-fas-87-post-retirement-benefits-fas-106-post-employment-benefits.jpg)