
Migration and child development during the food price crisis in El Salvador
13
Migration and child development during the food price crisis in El Salvador Alan de Brauw ⇑ International Food Policy Research Institute, 2033 K Street NW, Washington, DC 20006, USA article info Article history: Available online 28 December 2010 Keywords: Migration Height-for-age Z scores Stunting Food prices abstract Migration is often used as parts of both ex post and ex ante strategies to mitigate risks to household incomes. There is little empirical evidence, however, of the way that migration actually helps households in times of shocks. In this paper, I describe how the peak of the worldwide food price crisis affected anthropometric statistics among young children in El Salvador, and how households with access to inter- national migrants were not affected as negatively as households without such access. In 2008, El Salvador experienced food price inflation of 15%, and the evaluation of Red Solidaria, El Salvador’s conditional cash transfer program, shows that height-for-age (HAZ) Z scores among children under 3 years old declined by 0.2 standard deviations on average. In this paper, I use the Red Solidaria evaluation data to assess whether children in households with access to remittances or international migrants were better off than households without access to migration income. Using both repeated cross-sectional data and individual panel data, I find that as theory would expect, children in households with access to international migrants have much lower declines in their HAZ scores. Ó 2010 Elsevier Ltd. All rights reserved. Introduction The New Economics of Labor Migration (NELM) theory predicts that rural households in developing countries use migration as more than just an income generation strategy (Stark, 1991). The migration of one or more household members can help households manage and overcome market imperfections and failures. A partic- ularly important role for migration may, in fact, be as a substitute for formal insurance. In rural areas, risks to different sources of in- come are highly correlated with one another, and therefore house- holds have incentives to diversify their income sources out of the local area in order to reduce expected income variability (Binswan- ger and Rosenzweig, 1986). Earnings in distant markets are a risky source of income for households as well, but shocks occurring to distant markets are not likely to be correlated with shocks at home. Therefore migrants can potentially increase remittances when shocks affect source households. Not surprisingly, there is a large literature demonstrating that risk coping strategies are both ex ante and ex post determinants of migra- tion. Rosenzweig and Stark (1989) show that by marrying individuals from other villages, rural residents in India use migration to smooth consumption. Paulson (2000) shows that migration from rural Thai- land can be partially explained by an insurance motive; Gubert (2002) finds similarly for migration from the Kayes area of Mali. From the ex post perspective, Yang and Choi (2007) demonstrate that remit- tances change with weather shocks in the Philippines. Two further pa- pers study the direct relationship between migration and risk; Giles (2006) shows that risk to income decreases in China as access to both local and migrant labor markets increase, and Giles and Yoo (2007) show that as access to migrant labor markets improve, precautionary savings by households in rural China decrease. The relationship between migration and either insurance mo- tives or risk may be particularly important in small countries that derive a substantial share of GDP from remittances, such as El Sal- vador. In 2008, remittances accounted for about 17% of the Salva- doran GDP (Banco Central de Reserva de El Salvador, 2009), and according to the Salvadoran census completed in 2007, 11.2% of households report that at least one individual considered a house- hold member lives permanently in a foreign country. The national household survey (EHPM) shows that 22% of all households receive remittances from abroad. Therefore income from migration makes up a substantial share of national income in El Salvador, and is of great importance to household well-being. In this paper, I study how young children in migrant households fared during a specific shock, the worldwide food price crisis occurring in 2007 and 2008, relative children in non-migrant households. The food price crisis lowered relative household income and made food more expensive relative to other goods in the household budget. I ini- tially show that during a period of rapid food price increases, height- for-age Z (HAZ) scores declined among young children in El Salvador. 1 0306-9192/$ - see front matter Ó 2010 Elsevier Ltd. All rights reserved. doi:10.1016/j.foodpol.2010.11.002 ⇑ Tel.: +1 202 862 5698; fax: +1 202 467 4439. E-mail address: [email protected] 1 It is worth noting that I have to make the assumption that it is the food price crisis that negatively affects anthropometric outcomes among Salvadoran children, rather than another shock. Since there were no other systematic shocks in poor areas of rural El Salvador during the period between surveys, this assumption seems reasonable, but the results can only be attributed to the food price crisis if this assumption is true. Food Policy 36 (2011) 28–40 Contents lists available at ScienceDirect Food Policy journal homepage: www.elsevier.com/locate/foodpol
-
Upload
alan-de-brauw -
Category
Documents
-
view
212 -
download
0
Transcript of Migration and child development during the food price crisis in El Salvador

Food Policy 36 (2011) 28–40
Contents lists available at ScienceDirect
Food Policy
journal homepage: www.elsevier .com/ locate/ foodpol
Migration and child development during the food price crisis in El Salvador
Alan de Brauw ⇑International Food Policy Research Institute, 2033 K Street NW, Washington, DC 20006, USA
a r t i c l e i n f o
Article history:Available online 28 December 2010
Keywords:MigrationHeight-for-age Z scoresStuntingFood prices
0306-9192/$ - see front matter � 2010 Elsevier Ltd. Adoi:10.1016/j.foodpol.2010.11.002
⇑ Tel.: +1 202 862 5698; fax: +1 202 467 4439.E-mail address: [email protected]
a b s t r a c t
Migration is often used as parts of both ex post and ex ante strategies to mitigate risks to householdincomes. There is little empirical evidence, however, of the way that migration actually helps householdsin times of shocks. In this paper, I describe how the peak of the worldwide food price crisis affectedanthropometric statistics among young children in El Salvador, and how households with access to inter-national migrants were not affected as negatively as households without such access. In 2008, El Salvadorexperienced food price inflation of 15%, and the evaluation of Red Solidaria, El Salvador’s conditional cashtransfer program, shows that height-for-age (HAZ) Z scores among children under 3 years old declined by0.2 standard deviations on average. In this paper, I use the Red Solidaria evaluation data to assesswhether children in households with access to remittances or international migrants were better off thanhouseholds without access to migration income. Using both repeated cross-sectional data and individualpanel data, I find that as theory would expect, children in households with access to internationalmigrants have much lower declines in their HAZ scores.
� 2010 Elsevier Ltd. All rights reserved.
Introduction pers study the direct relationship between migration and risk; Giles
1 It is worth noting that I have to make the assumption that it is the food price crisis
The New Economics of Labor Migration (NELM) theory predictsthat rural households in developing countries use migration asmore than just an income generation strategy (Stark, 1991). Themigration of one or more household members can help householdsmanage and overcome market imperfections and failures. A partic-ularly important role for migration may, in fact, be as a substitutefor formal insurance. In rural areas, risks to different sources of in-come are highly correlated with one another, and therefore house-holds have incentives to diversify their income sources out of thelocal area in order to reduce expected income variability (Binswan-ger and Rosenzweig, 1986). Earnings in distant markets are a riskysource of income for households as well, but shocks occurring todistant markets are not likely to be correlated with shocks at home.Therefore migrants can potentially increase remittances whenshocks affect source households.
Not surprisingly, there is a large literature demonstrating that riskcoping strategies are both ex ante and ex post determinants of migra-tion. Rosenzweig and Stark (1989) show that by marrying individualsfrom other villages, rural residents in India use migration to smoothconsumption. Paulson (2000) shows that migration from rural Thai-land can be partially explained by an insurance motive; Gubert(2002) finds similarly for migration from the Kayes area of Mali. Fromthe ex post perspective, Yang and Choi (2007) demonstrate that remit-tances change with weather shocks in the Philippines. Two further pa-
ll rights reserved.
(2006) shows that risk to income decreases in China as access to bothlocal and migrant labor markets increase, and Giles and Yoo (2007)show that as access to migrant labor markets improve, precautionarysavings by households in rural China decrease.
The relationship between migration and either insurance mo-tives or risk may be particularly important in small countries thatderive a substantial share of GDP from remittances, such as El Sal-vador. In 2008, remittances accounted for about 17% of the Salva-doran GDP (Banco Central de Reserva de El Salvador, 2009), andaccording to the Salvadoran census completed in 2007, 11.2% ofhouseholds report that at least one individual considered a house-hold member lives permanently in a foreign country. The nationalhousehold survey (EHPM) shows that 22% of all households receiveremittances from abroad. Therefore income from migration makesup a substantial share of national income in El Salvador, and is ofgreat importance to household well-being.
In this paper, I study how young children in migrant householdsfared during a specific shock, the worldwide food price crisis occurringin 2007 and 2008, relative children in non-migrant households. Thefood price crisis lowered relative household income and made foodmore expensive relative to other goods in the household budget. I ini-tially show that during a period of rapid food price increases, height-for-age Z (HAZ) scores declined among young children in El Salvador.1
that negatively affects anthropometric outcomes among Salvadoran children, ratherthan another shock. Since there were no other systematic shocks in poor areas of ruralEl Salvador during the period between surveys, this assumption seems reasonable,but the results can only be attributed to the food price crisis if this assumption is true.

A. de Brauw / Food Policy 36 (2011) 28–40 29
I then attempt to rule out explanations of this decline that are not re-lated to the food price crisis.
The data set I use has several advantages for studying theincreasing food price shock. First, it was collected at excellenttimes for studying the crisis. The first round was collected in Janu-ary and February of 2008, as price increases were accelerating, andthe second round between late September and early November of2008, just after food prices began to fall. Second, the data set in-cludes anthropometric measures of children under 3 years old,and perhaps most importantly includes a substantial panel compo-nent so I can measure and analyze changes in anthropometric mea-sures as well as levels. Third, because the data set was collected tostudy the impacts of conditional cash transfers, the sample is fo-cused on poor areas of rural El Salvador. Although migration ratesare not as high in poor areas of rural El Salvador as some other re-gions, the potential effects of the shock on anthropometric statis-tics among young children is likely to be higher than amongmembers of households that are in poor areas and more likely tobe poor than households in richer areas.
I find that the presence of a migrant overseas in advance of the2008 shock implies smaller declines in HAZ scores among youngchildren. This finding has potentially important policy implicationsfor both young child nutrition and particularly during similar cri-ses. From the perspective of young child nutrition, these resultssuggest that remittances are particularly useful for improvingHAZ statistics. The results suggest a nuanced policy approachmight help child development in El Salvador; non-migrant house-holds should be targeted for additional transfers at times of crisis,so that young child nutrition does not suffer, assuming that the cri-sis does not affect migrant households directly, such as the de-crease in remittances associated with the worldwide recession in2009 (Banco de Central, 2009). On the other hand, migrant house-holds can further be helped by policies that help facilitate thedelivery of remittances at lower costs.
To study the relationship between migration and nutrition, thepaper proceeds as follows. The next section describes El Salvador’sexperience with international migration in more detail. The thirdsection discusses how the food price crisis affected El Salvador,and discusses how anthropometric statistics, specifically height-for-age Z (HAZ) scores, changed among children measured be-tween the two Red Solidaria evaluation surveys. HAZ scores are apreferred anthropometric measure for understanding the cumula-tive nutritional status of children, particularly at young ages. Thefourth section develops a simple econometric model to test howinternational migration changed the effects of the food price crisison HAZ scores, and discusses the econometric results. The final sec-tion concludes.
3 Red Solidaria is now known as Communidades Solidarias Rurales.4 See Appendix A for a more complete description of the data sets used in this
article.5 In the remainder of the paper, I refer to households reporting international out-
Migration from El Salvador
Over the past two decades, migration from El Salvador to the Uni-ted States and other destinations has increased rapidly (UNDP,2005).2 Not surprisingly, income from migrant remittances makesup a substantial share of El Salvador’s total GDP; in 2008, overallGDP was approximately $22 billion, and total remittances fromabroad were $3.7 billion. In households with access to remittances,on average they make up a substantial share of total householdincome.
Although migration is not as prevalent in the data set used foranalysis as in the rest of El Salvador, many households have accessto international migrants. The analysis is based on two surveyscompleted in 2008 to evaluate Red Solidaria, El Salvador’s condi-
2 According to the UNDP (2005), 90% of Salvadoran migrants living abroad are inthe UnitedStates. The percentage is even higher in this sample, at about 93%.
tional cash transfer program.3 The sampling strategy thereforewas based on measuring specific outcomes among the targeted pop-ulation, which are all in rural areas of poor municipios.4 Migrationrates from poor municipios are lower than rates from other areas,and rural areas may also have different migration rates than urbanareas. For the purposes of this paper, migrant households are definedas households that reported a member of the household had out-mi-grated internationally, almost always to the United States, and keptin regular contact with the household. By this definition, I find thatabout one-sixth of households in both the baseline and follow-upsurveys report an international migrant as a recent former memberof the household (Table 1).5 Households receive remittances ofaround $1300 a year on average from migrants, or a substantialshare of their total household income, which is around $1800 onaverage across the two surveys.6
Several authors have documented some of the effects of Salva-doran migration on source households. For example, Cox-Edwardsand Ureta (2003), Acosta (2006) study the effects of migrant remit-tances on schooling, and both find that adolescent children aremore likely to stay in school when remittances are available.Two studies have also specifically looked to the impacts of shockson migration from El Salvador. Halliday (2006) shows a negativerelationship between damage from earthquakes that occurred in2001 and migration, arguing that for households exposed to theearthquakes, the marginal value of labor increases at home forreconstruction. Yang (2008) uses the same data set and shows thatidiosyncratic shocks to households (deaths in the family) lead toincreases in migration, while aggregate shocks (earthquakes) leadto less migration, implying that in quake-affected areas, the creditavailable to finance remittances decreases.
This paper differs from previous work on migration and shocksin two important ways. The objective of this paper is to study thecorrelation between migration and anthropometric outcomes atthe child level, rather than directly testing how shocks affectmigration, since the shock that the paper studies affected the en-tire sample. I rule out reverse causality by testing whether changesin HAZ scores among children in households are correlated withmigration measured in the baseline. The paper cannot study the ef-fects of changes in migrant flows on HAZ scores, since it is unlikelythat households sent out migrants primarily in response to risingfood prices, nor would they have experienced much of a returnto migration by the time of the follow-up survey. In other words,sending out migrants would not likely affect HAZ scores over sucha short period of time, nor would changes in HAZ scores be likely toaffect migration.
The food price crisis and El Salvador
Food prices rose throughout the world in 2007 and the first partof 2008, leading to significant attention among policy makers, thinktanks, and academics (FAO, 2008; World Bank, 2008; Ivanic andMartin, 2008; Masters and Shively, 2008; von Braun, 2008). Whileprice increases were highest for rice, maize prices also rose dramat-ically throughout the world. Whereas the price for a metric ton ofmaize was $155 at the beginning of 2007, it rose steadily to $195by the beginning of 2008, and peaked at $303 per ton the week ofJune 20th, 2008. Prices then began to fall in response to the growing
migrants as migrant households.6 I average the two surveys in this statistic primarily because a substantial share of
the households in the survey began receiving conditional cash transfers between thetwo surveys, increasing their household incomes.

Fig. 1. Food price index, El Salvador, December 2007–November 2008 Source:DIGESTYC.
Table 1Selected average descriptive statistics by survey round, Red Solidaria evaluation surveys, El Salvador, 2008. Source: Red Solidaria evaluationsurveys.
Variable Baseline survey Follow-up survey
Income per capita $337 $392Total household income $1688 $1997Share of households with international migrants (%) 16.7 16.7Average remittances, migrant households $1283 $1378Household size 5.44 5.59Average Age, Household Head 40.9 41.7Number of Households 2817 2921
30 A. de Brauw / Food Policy 36 (2011) 28–40
world financial crisis, but were still much higher than at the begin-ning of the year by the time the second survey began; maize was$249 per ton at the end of August and $225 by the end of September,still well above the price at the beginning of the year.7
The increase in general food prices is reflected by changes in thefood price index for El Salvador in 2008 (Fig. 1). The food price in-dex rose steadily until July, when it peaked and began to fall. Still,by the end of the second period of data collection, prices were sub-stantially higher on average than they had been at the beginning ofthe year.
Fig. 2. Potential effects of food price shock on consumption.
Possible responses to food pricesThere are several ways that households might react to risingfood prices, two of which can best be illustrated graphically(Fig. 2). In Panel A, consider that households purchase a cheapergood, food, (X1) and other goods, which are relatively expensive(X2). A certain number of calories are essential (Xc), so householdsalways prefer to consume that many calories if possible. Initial in-come is given by Y0, and household preferences lead to the con-sumption of the bundle denoted as point Z0. When food pricesincrease, the amount of food that can be purchased decreases inrelative terms, and so the income constraint shifts to Y1. Sincethe initial bundle of goods purchased is no longer affordable, thehousehold now cannot afford bundle Z0, so they reduce buying ofboth food and other goods and consume Z1. It could be that incomefalls low enough so that the household is constrained by the totalamount of food needed for basic caloric requirements, Xc, but hereit is assumed that this constraint is not binding. In shifting from Z0
to Z1, however, the amount of food available in the household de-
7 I focus on maize prices here because maize is the staple crop in El Salvador. It isworth noting that the price of other grains, such as rice, rose even faster than maizeon world markets during this time period.
clines, and so we might observe lower heights and weights amongyoung children as a result.
However, consider the possibility that in the short or mediumterm the household finds it difficult to adjust spending patternsto the new equilibrium, or always budgets a certain share of its fullincome to food. If so, the important change may be within the bud-get share for food. In Panel B, consider that staple foods Xs arecheaper than more nutrient rich foods, such as fruits and vegeta-bles (Xn). Because food prices largely change in tandem, the budgetconstraint shifts in parallel from Y0 to Y1, which means that the ini-tial bundle of Z0 is no longer affordable. However, the calorie con-straint here C, would require a great deal of consumption of Xn
relative to Xs, so when the food prices increase the household can-not purchase its preferred bundle without members feeling hungryafterwards, so it instead purchases bundle Z1 at the intersection ofY1 and C. As a result, staple consumption remains high, but fruitand vegetable consumption decline. Among young children, onewould expect heights to decline in relative terms as householdscan no longer afford the foods that lead to healthy growth, butweights would stay constant. This situation was largely found byJensen and Miller (2008), who observed that as food prices rose

-1.5
-1-.
50
Mea
n, H
eigh
t-fo
r-A
ge Z
Sco
re
0 365 730 1095Age (in days)
Baseline Follow Up
Fig. 3. Mean height-for-age Z scores, by age, baseline and follow-up Red Solidariaevaluation surveys, El Salvador.
-.6
-.4
-.2
0
Mea
n, W
eigh
t-fo
r-A
ge Z
Sco
re
0 365 730 1095Age (in days)
Baseline Follow Up
Fig. 4. Mean weight-for-age Z scores, by age, baseline and follow-up Red SolidariaEvaluation Surveys, El Salvador.
A. de Brauw / Food Policy 36 (2011) 28–40 31
in poor areas of China in 2006, albeit slowly, households substi-tuted cheaper calories for more expensive ones to hold averagecaloric intakes constant.8
To begin to understand which of these hypotheses is more likelyfor rural El Salvador, I graph HAZ and WAZ scores using a lowest esti-mator by age and survey for all children under 3 years old (Figs. 3and 4).9 First considering HAZ scores, we find that at all ages between0 and 3 years, the average HAZ score unambiguously declines be-tween the two surveys (Fig. 2). It is not surprising that the HAZ scoresdecline as children get older; rather, they fit the typical pattern foundin developing countries. HAZ scores tend to fall throughout earlychildhood before beginning to stabilize between the ages of 2 and3 years old.10 Over all ages between 0 and 3, the average child in the
8 For purposes of simplicity, these models neglect the possible of reallocation offood consumption within the household. Households could begin to allocate foodaway from younger children as food prices rise in order to ensure that workerscontinue to consume enough calories to be productive; alternatively, adults mightreallocate food towards children if food was allocated towards younger residents.Without detailed data on individual food intakes, it is impossible to discern whetherreallocations take place or not.
9 HAZ, WAZ, and weight-for-height Z (WHZ) scores were all computed using themost recent standards published by the WHO (2006). In a healthy population ofchildren, the standardized scores would have a mean of zero and a standard deviationof one.
10 This pattern is mirrored in nationally representative data from El Salvadorcollected in 2003, as part of the National Family Health Survey (FESAL).
baseline survey has a HAZ score of �0.955, which declines to�1.149 in the follow-up survey, or by about 0.2 standard deviations(Table 2). This difference cannot be explained by differences in theage of the samples, as the average child included in the baseline sur-vey is 571 days old, versus 560 days in the follow-up survey.
When we examine WAZ scores, we do not find a decline be-tween surveys for any age (Fig. 4). In fact, average WAZ scoresfor the two surveys track one another quite consistently for allage ranges. Therefore, it seems that children have been eatingroughly the same number of calories on average in the follow-upsurvey as in the baseline, but the nutritional content of the foodthey are eating has declined. As suggested by the graphs inFig. 2, the decline is consistent with a decrease in nutrients in foodconsumed by young children, and not a decrease in overall caloriesconsumed. Although not shown, since height-for-age declines andweight-for-age stays constant, weight-for-height increases slightlyat any age. Given that in the baseline the average weight-for-height Z score (WHZ) was already above 0, children in El Salvadorbecome slightly shorter and heavier than before, relative to a pop-ulation of healthy children.11 As wasting is therefore not much of anutritional concern, we focus the remainder of the paper primarilyon understanding correlations with changes in HAZ scores and stun-ting prevalence.
Not surprisingly, the decrease in average HAZ scores has beenaccompanied by an increase in the stunting prevalence among chil-dren in the follow-up survey (Fig. 5). The stunting rate, defined aschildren with HAZ scores under �2, rises somewhat rapidly untilchildren reach the age of 2 years, plateauing at around 25%. Giventhat one of the goals of the Red Solidaria conditional cash transferprogram is to reduce chronic malnutrition, the fact that the follow-up survey indicates that children are more likely to be stunted inthe follow-up survey is somewhat distressing news.
However, some municipios in the follow-up survey do not yetreceive Red Solidaria transfers, and it could be that the average dif-ferences described can largely be explained by whether or nothouseholds reside in municipios receiving transfers. The data indi-cate that although the presence of transfers appears to mitigate thedecline somewhat, a substantial decline is still apparent in munic-ipios receiving transfers (Table 2, columns 2 and 3). Children inmunicipios receiving transfers experienced an average decline of0.17 standard deviations, whereas children in municipios notreceiving transfers by the second round of the sample experienceda decline of 0.29 standard deviations.
While participation in Red Solidaria may be associated withslightly lower decreases in the average HAZ score for a given age,children in migrant households have both higher HAZ scores onaverage and did not experience as large of a drop in HAZ scores(Table 2, panels B and C). Whereas the average child in a migranthousehold had an average HAZ score of �0.791 in the baseline,in non-migrant households the average was �0.979. Yet the aver-age HAZ score did not decline much in migrant households; it onlydeclined to �0.86, or by 0.07 standard deviations. The difference inperformance is also apparent in locally smoothed plots, particu-larly among older children (Fig. 6). Whereas the average HAZ scoreis lower in the follow-up survey than the baseline survey for allages, among migrant households the difference between surveysconverges at around 18 months.12
This finding suggests that children in migrant households areboth better off nutritionally than children in general, and they
11 The average WHZ score at baseline was 0.24 among children under 3, andincreased to 0.44 in the follow-up survey, which is not surprising given that HAZscores declined and WAZ scores remained constant by age.
12 Note that at the time of the second survey, some of the households that hadreceived transfers had only received one or two transfers, which would not be enoughto actually affect cumulative nutrition as measured through HAZ scores.

Table 2Height-for-age Z scores, rural El Salvador, by participation in Red Solidaria and Survey. Source: Red Solidaria Evaluation Surveys.
All municipios Municipio participating inRed Solidaria
Municipio not participating inRed Solidaria
Panel A: all householdsBaseline survey �0.955 �0.976 �0.872
(0.044) (0.048) (0.106)Follow-up survey �1.149 �1.146 �1.162
(0.038) (0.044) (0.075)
Panel B: migrant householdsBaseline survey �0.791 �0.818 �0.673
(0.094) (0.107) (0.176)Follow-up survey �0.860 �0.884 �0.757
(0.077) (0.086) (0.185)
Panel C: non-migrant householdsBaseline survey �0.979 �0.998 �0.900
(0.047) (0.050) (0.123)Follow-up survey �1.195 �1.188 �1.228
(0.041) (0.046) (0.088)
Notes: Standard errors clustered at the cantón level in parentheses.
0.1
.2.3
Stu
ntin
g P
reva
lenc
e
0 365 730 1095Age (in days)
Baseline Follow Up
Fig. 5. Mean stunting prevalence, by age, baseline and follow-up Red Solidariaevaluation surveys, El Salvador.
32 A. de Brauw / Food Policy 36 (2011) 28–40
were not as affected by the food price shock as children in non-mi-grant households. However, migrant households may simply bewealthier than non-migrant households on average, and therefore
-1.5
-1-.
50
.5
0 365 730 109
No
Baseline
Mea
n, H
eigh
t-fo
r-A
ge Z
Sco
re
Age (in
Graphs by International Migrant Household
Fig. 6. Mean height-for-age Z scores, by age and international migration stat
their children might have been less susceptible to the food priceshock. Other unobservables might also affect the relationship be-tween migration and HAZ status, none of which are controlledfor in Fig. 5. In other words, different sources of positive selectionbias might affect the estimated relationship between householdmigration status and HAZ scores in repeated cross-sectional data.The presence of selection bias is clear in Table 3, which showsdescriptive statistics for selected household level variables bymigration status across both surveys. It is particularly clear forthe wealth variables; migrant households have higher incomeson average and the average asset index is also much higher, soclearly controlling for wealth in understanding the potential rela-tionship between migrant households and child HAZ scores is quiteimportant.
To identify the relationship between household migration sta-tus, ideally an instrument would be available for migrant house-holds that only affected child HAZ scores through their impact onmigration. However, no such instrument is available, so I insteadtry to rule out certain classes of observable or unobservable vari-ables that would affect the relationship between household migra-tion status and HAZ scores or stunting prevalence among children.
One somewhat obvious way to better control for unobservableswould be to estimate the relationship between changes in HAZ
5 0 365 730 1095
Yes
Follow Up
days)
us, baseline and follow-up Red Solidaria evaluation surveys, El Salvador.

Table 3Descriptive statistics, child, mother, and household level variables, by migration status.
Variable Migrant households Number of obs. Non-migrant households Number of obs.
Child level variablesNormal birth? (1 = yes) 0.770 387 0.729 2643Low birth weight? (1 = yes) 0.089 383 0.111 2597Exclusively breastfed for 6 months 0.479 376 0.545 2390Only breastfed (1 = yes) 0.081 394 0.133 2560First born (1 = yes) 0.364 398 0.309 2661
Demographic variablesNumber of females, working age in household 1.76 398 1.45 2661
(0.87) (0.82)Number of males, working age in household 0.87 398 1.17 2661
(1.01) (0.79)Number of male children in household 1.49 398 1.52 2661
(1.19) (1.23)Number of female children in household 1.48 398 1.48 2661
(1.14) (1.24)Number of elderly in household 0.43 398 0.21 2661
(0.82) (0.70)Wealth measuresLog, per capita income 5.98 388 5.25 2620
(0.87) (1.11)Asset index 1.07 398 -0.37 2661
(2.07) (1.63)
Mother characteristicsYears of education, mother 5.14 359 4.28 2547
(5.74) (3.61)Age of mother (in years) 26.7 369 27.3 2617
(8.0) (7.2)
Alternative shock measuresAgricultural shock 0.106 398 0.123 2661Sick member 0.025 398 0.027 2661Death in household 0.013 398 0.011 2661Remittances Declined 0.023 398 0.004 2661
Notes: Standard deviations for continuous variables in parentheses.
Table 4Changes in height-for-age Z scores, panel subsample, by Red Solidaria and household migration status. Source: Red Solidaria evaluation surveys.
Change in HAZ Score Overall Municipio Participating in Red Solidaria Municipio not Participating in Red Solidaria
All households �0.457 �0.463 �0.423(0.043) (0.049) (0.078)
Among migrant �0.261 �0.296 �0.097Households (0.120) (0.139) (0.233)Among non-migrant �0.485 �0.488 �0.470Households (0.043) (0.049) (0.082)
Notes: Standard errors clustered at the cantón level in parentheses.
A. de Brauw / Food Policy 36 (2011) 28–40 33
scores and changes in migration status. However, within the panelsubsample only five households changed migration status betweenthe two surveys. Furthermore, the most likely pathway by whichmigration would help HAZ scores is through remittances, and itis unlikely that changes in migration status would necessarilyimmediately lead to high remittance levels which could affectchanges in HAZ scores. With a relatively short period of time be-tween survey rounds, differencing at the household level worksagainst finding a relationship, even if migration has affected childnutritional status.
Although it does not make sense to difference the migrationvariable, among the panel subsample it is reasonable to examinechanges in HAZ scores by migration status at baseline. Two obser-vations are available on just over half of the sample, or 859 chil-dren. The average HAZ score drops among these children by0.457 standard deviations between surveys (Table 4). This declineis not surprising as the pattern is that HAZ scores fall and then pla-teau as children age, and all of these children age by about9 months between the two panels. Among children in migrant
households, then, I find that the decline in HAZ scores is only0.261 standard deviations, versus 0.485 among non-migranthouseholds. This difference is also apparent when we plot thechange in HAZ score against the age of the child, by migrant house-hold status (Fig. 7). Although the averages seem closer to one an-other in the tails (e.g. among very young children and childrenclose to 3 years old), for the bulk of the age distribution there ap-pears to be a relatively constant difference in the change in HAZscores, with children in migrant households faring better than chil-dren in non-migrant households.
In the remainder of the paper, I present regression models thatcontrol for observable factors that would not result from a house-hold decision making process, in order to determine whether ornot there is a statistical association between household migrationstatus and either HAZ scores among young children or stuntingprevalence. I use two econometric models, one for the repeatedcross-sectional data and one for the subsample of children forwhom two observations are available. Since no good instrumentalvariable exists for migrant households in this setting, I will account

-1.5
-1-.
50
Cha
nge
in H
eigh
t-fo
r-A
ge Z
Sco
re
0 365 730Age in Days at Baseline
Migrant Out of HH in Baseline No Migrant
Fig. 7. Change in height-for-age Z score, by age at baseline and migration status,baseline and follow-up Red Solidaria evaluation surveys, El Salvador.
13 The exclusive breastfeeding for 6 months variable is 1 only if children have beenbreastfed for 6 months, and therefore it is zero for children under 6 months.Therefore, I also create an indicator variable for children who are both less than 6months old and have only been breastfed; this variable is zero for all children over sixmonths old. In combination, these variables measure recommended breastfeedingprocedures in developing countries (WHO, 2001).
14 One might be concerned that the income variable in particular is endogenous;however, coefficient estimates do not appear to be sensitive to its inclusion. The assetvariable is constructed following the logic in McKenzie (2005), among others.
15 For example, Giles and Mu (2007) show that internal migration is negativelyinfluenced by negative health shocks among household members in rural China.
34 A. de Brauw / Food Policy 36 (2011) 28–40
for locality level unobservables by including canton level fixed ef-fects in some regressions, and furthermore I refrain from makingcausal interpretations. After discussing the econometric results, Ireturn to the potential effects of remaining unobservables on theobserved relationship between migrant household status and childHAZ scores, to consider whether or not the unobservables can fullyaccount for the relationship found.
Econometric methods and results
In this section, I first describe the multivariate models that I useto control for some observable differences about children andhouseholds that might affect the relationship between child heightor nutrition and international migration by a household member.The following subsection describes econometric results, and thethird subsection provides some robustness checks and discussionof unobservables that might also affect the relationship betweenchild HAZ scores and migration.
Methods
The first model I will estimate can be written as:
HAZit ¼ aþ bMit þ cWit þ #Dt þ uit ð1Þ
where HAZit represents the HAZ score of child i in period t; M rep-resents an indicator variable for whether or not a migrant from thehousehold lives abroad; W represents a vector of other child orhousehold factors that can affect both HAZ scores and whether ornot a migrant leaves a specific household; Dt represents a surveytime period dummy variable; and uit is a mean zero error term.The coefficient of interest is b, which measures the relationship be-tween the child’s HAZ score and household level participation inmigration. As mentioned before, one concern is that there are unob-servables present in uit that are both correlated with migration andthe child’s nutritional status (or more specifically, the child’s HAZscore), then the estimate for b generated by estimating Eq. (1) willbe biased.
Other than the potential influence of unobservables, there aretwo further concerns with coefficient estimates generated by sim-ply estimating Eq. (1). First, we might be concerned that the foodprice shock is not well represented by the survey time period dum-my variable. Because we have two data points on a number of chil-dren, a better way to estimate Eq. (1) would be to difference theHAZ scores among those children, and learn about the factors thatinfluenced the change in their HAZ scores. Second, one might be
concerned that some households sent out migrants in responseto the food price shock, in which case there is a potential reversecausality present in estimates generated using Eq. (1).
Therefore, among the subsample of children for which we havetwo observations I can also estimate:
DHAZi ¼ aþ bMi0 þ cDZi þ #Wi0 þ ei ð2Þ
where DZi represents observable factors that change over timeabout child i, and Wi0 are a vector of observable factors about chil-dren and households that are measured at the baseline (period 0).We also measure migration in period zero in Eq. (2), so we can elim-inate the possibility of reverse causality. The most important com-ponent of Z is a measure of the number of days between childmeasurements, since there was some variation in the timing ofthe survey, and it can be an important component of the declinein HAZ scores, particularly for young children. It is also importantto include the initial age of each child in W because of the distinctpattern in HAZ changes by age evidenced in both data sets as well asthe FESAL data for El Salvador. In all models, an indicator variablefor whether or not a child is male is included, to account for genderdifferences in growth.
I include four sets of variables in W to control for factors thatmight influence the relationship between household migrationand child nutritional status. First, several other child level mea-sures that might affect anthropometric measures are included. I in-clude indicator variables for whether or not the child had a normalbirth; whether or not the child was born with low birth weight;whether or not the child was reported being exclusively breastfedfor 6 months; for children under 6 months old, an indicator is in-cluded for children who have only been breastfed; and finally,whether or not the child was first born.13 At the household level,a second set of variables is included that measure differences indemographic composition and wealth. The household is broken upinto five categories: elderly individuals (aged 65 and over), menand women of working age (15 to 64 years old), and the numberof boys and girls in the household. To measure wealth differences,I include both the logarithm of household per capita income andthe first principal component of a vector measuring the number ofconsumer durables owned.14 Third, I include two characteristics ofthe mother in some specifications, the age and years of education.More educated mothers might be more likely to understand childnutrition, which would improve HAZ scores, but such householdsmight also be more likely to send out migrants. However, these vari-ables are missing when the mother of the child is not present in thehousehold.
Fourth, child nutritional status could be negatively affected byother shocks households face, and for some reason householdswithout access to migrant income are more susceptible to othershocks. These shocks might also affect migration behavior, furthercomplicating the relationship.15 To control for these potential ef-fects, in the 12 months prior to the baseline we use self-reportedmeasures of whether or not the household reports a death in thehousehold, a member too sick to work, a large negative agriculturalshock, or a perceived drop in remittances.

Table 5Regressions explaining the correlation between household migration status and HAZ scores, El Salvador, 2008.
(1) (2) (3) (4) (5) (6)
Migrant household 0.294 0.279 0.167 0.179 0.176 0.139(0.073)*** (0.077)*** (0.079)** (0.080)** (0.079)** (0.083)*
Age in days (/10) �0.010 �0.008 �0.008 �0.008 �0.008 �0.008(0.001)*** (0.001)*** (0.001)*** (0.001)*** (0.001)*** (0.001)***
Gender (1 = male) �0.190 �0.208 �0.239 �0.225 �0.220 �0.195(0.054)*** (0.060)*** (0.062)*** (0.062)*** (0.063)*** (0.059)**
Normal birth? (1 = yes) 0.263 0.145 0.131 0.133 0.092(0.065)*** (0.068)** (0.068)* (0.068)* (0.059)
Low birth weight? (1 = yes) �0.492 �0.488 �0.505 �0.507 �0.500(0.086)*** (0.083)*** (0.079)*** (0.079)*** (0.075)***
Exclusively breastfed for 6 months �0.052 �0.042 �0.058 �0.053 �0.025(0.048) (0.047) (0.047) (0.047) (0.047)
Only Breastfed (1 = yes) 0.263 0.300 0.291 0.290 0.314(0.104)** (0.104)*** (0.103)** (0.104)*** (0.104)***
First born (1 = yes) 0.255 0.180 0.202 0.198 0.153(0.055)*** (0.063)*** (0.069)*** (0.068)*** (0.069)**
Number of females, working age in HH �0.052 �0.048 �0.047 �0.025(0.035) (0.037) (0.037) (0.036)
Number of males, working age in HH 0.001 �0.002 0.001 0.007(0.027) (0.028) (0.028) (0.028)
Number of Male Children in HH �0.045 �0.040 �0.041 �0.053(0.025)* (0.026) (0.026) (0.026)**
Number of female children in HH �0.078 �0.079 �0.076 �0.086(0.022)*** (0.024)*** (0.024)*** (0.025)***
Number of elderly in HH �0.032 �0.042 �0.038 �0.049(0.030) (0.033) (0.033) (0.034)
Log, per capita income �0.036 �0.049 �0.050 �0.031(0.023) (0.024)** (0.024)** (0.025)
Asset index 0.124 0.119 0.121 0.107(0.017)*** (0.018)*** (0.018)*** (0.019)***
Years of education, mother 0.022 0.022 0.023(0.007)*** (0.007)*** (0.006)***
Age of mother (in years) 0.007 0.007 0.007(0.004) (0.004) (0.004)
Agricultural shock �0.073 �0.034(0.071) (0.071)
Sick member �0.243 �0.192(0.171) (0.167)
Death in household �0.289 �0.174(0.154)* (0.181)
Remittances declined 0.179 0.045(0.216) (0.189)
Follow-up survey? (1 = yes) �0.213 �0.205 �0.172 �0.161 �0.164 �0.162(0.039)*** (0.039)*** (0.044)*** (0.046)*** (0.046)*** (0.047)***
Fixed effects? No No No No No CantonN 2983 2629 2589 2455 2455 2455R2 0.084 0.119 0.157 0.162 0.164 0.148
Notes: Standard errors clustered at the cantón level in parentheses.* Indicates significance at the 10% level.** Indicates significance at the 5% level.*** Indicates significance at the 1% level.
16 Although not reported, I investigated whether the functional form of therelationship between HAZ and child age mattered to the estimated coefficient onmigration; it did not.
17 Unfortunately, a continuous measure of birthweights was not available for use inthis regression.
A. de Brauw / Food Policy 36 (2011) 28–40 35
Finally, in some specifications of equations (1) and (2), canton(village) level fixed effects are included to control for any fixedunobservables that might have affected changes in HAZ scores.Therefore the remaining unobservable variation that is of concernis variation at the household or individual level. When discussingthe potential effects of unobservables on the results, we will keepin mind that only variables at the household or individual levelwould be of particular concern.
Results
Initially, Eq. (1) is estimated with data pooled from the two sur-vey rounds (Table 5), clustering standard errors at the canton level.Initially, I only control for the age in days and gender of the child,as well as a survey round indicator variable. The basic point esti-mate is 0.294 standard deviations, indicating that children in mi-grant households have HAZ scores that are 0.294 standarddeviations higher than children in non-migrant households, con-
trolling for child age and gender (column 1).16 I next add variablesmeasuring other child level attributes (column 2), and the estimatedcoefficient on migration drops a bit, but remains significant. The esti-mated coefficients on child attributes are quite sensible; for exam-ple, children born with low birthweight have HAZ scores that arenearly 0.5 standard deviations lower than other children. Clearly,when children are born small, their growth path is affected into theirearly childhood.17
When household demographic and wealth characteristics areadded, we not surprisingly observe a large decline in the point esti-mate for the relationship between migrant household status andchild HAZ scores, to 0.167 standard deviations, yet it remains sig-
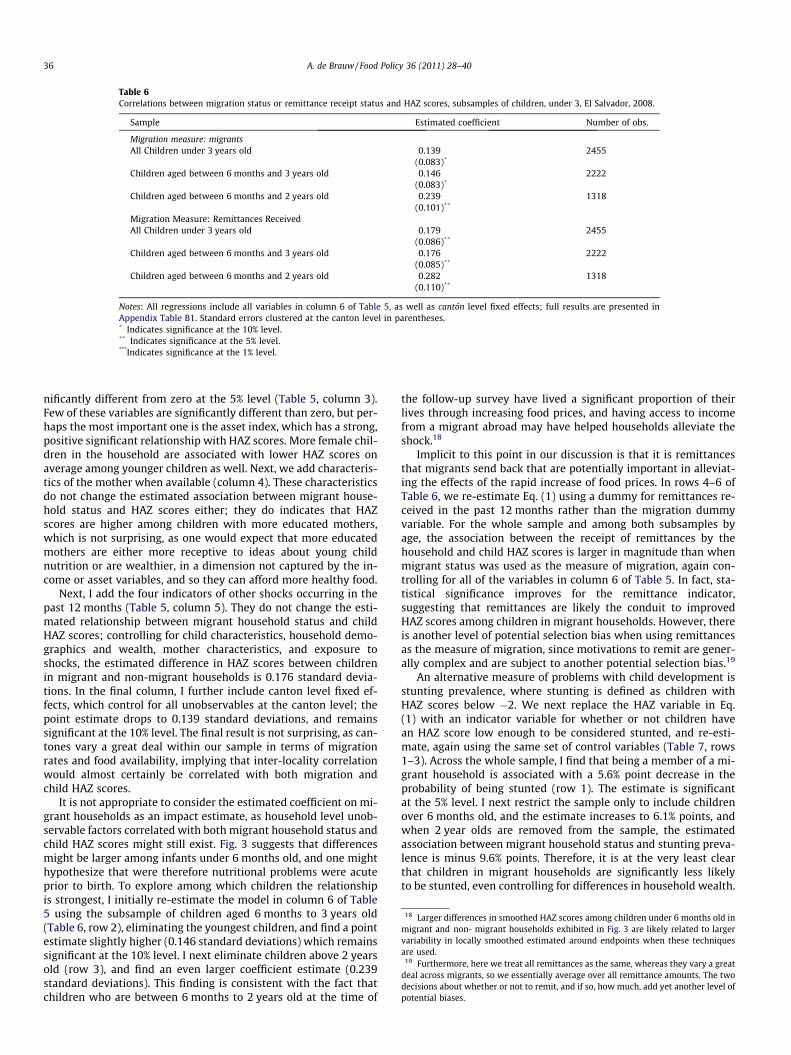
Table 6Correlations between migration status or remittance receipt status and HAZ scores, subsamples of children, under 3, El Salvador, 2008.
Sample Estimated coefficient Number of obs.
Migration measure: migrantsAll Children under 3 years old 0.139 2455
(0.083)*
Children aged between 6 months and 3 years old 0.146 2222(0.083)*
Children aged between 6 months and 2 years old 0.239 1318(0.101)**
Migration Measure: Remittances ReceivedAll Children under 3 years old 0.179 2455
(0.086)**
Children aged between 6 months and 3 years old 0.176 2222(0.085)**
Children aged between 6 months and 2 years old 0.282 1318(0.110)**
Notes: All regressions include all variables in column 6 of Table 5, as well as cantón level fixed effects; full results are presented inAppendix Table B1. Standard errors clustered at the canton level in parentheses.* Indicates significance at the 10% level.** Indicates significance at the 5% level.***Indicates significance at the 1% level.
18 Larger differences in smoothed HAZ scores among children under 6 months old inmigrant and non- migrant households exhibited in Fig. 3 are likely related to largervariability in locally smoothed estimated around endpoints when these techniquesare used.
19 Furthermore, here we treat all remittances as the same, whereas they vary a greatdeal across migrants, so we essentially average over all remittance amounts. The twodecisions about whether or not to remit, and if so, how much, add yet another level ofpotential biases.
36 A. de Brauw / Food Policy 36 (2011) 28–40
nificantly different from zero at the 5% level (Table 5, column 3).Few of these variables are significantly different than zero, but per-haps the most important one is the asset index, which has a strong,positive significant relationship with HAZ scores. More female chil-dren in the household are associated with lower HAZ scores onaverage among younger children as well. Next, we add characteris-tics of the mother when available (column 4). These characteristicsdo not change the estimated association between migrant house-hold status and HAZ scores either; they do indicates that HAZscores are higher among children with more educated mothers,which is not surprising, as one would expect that more educatedmothers are either more receptive to ideas about young childnutrition or are wealthier, in a dimension not captured by the in-come or asset variables, and so they can afford more healthy food.
Next, I add the four indicators of other shocks occurring in thepast 12 months (Table 5, column 5). They do not change the esti-mated relationship between migrant household status and childHAZ scores; controlling for child characteristics, household demo-graphics and wealth, mother characteristics, and exposure toshocks, the estimated difference in HAZ scores between childrenin migrant and non-migrant households is 0.176 standard devia-tions. In the final column, I further include canton level fixed ef-fects, which control for all unobservables at the canton level; thepoint estimate drops to 0.139 standard deviations, and remainssignificant at the 10% level. The final result is not surprising, as can-tones vary a great deal within our sample in terms of migrationrates and food availability, implying that inter-locality correlationwould almost certainly be correlated with both migration andchild HAZ scores.
It is not appropriate to consider the estimated coefficient on mi-grant households as an impact estimate, as household level unob-servable factors correlated with both migrant household status andchild HAZ scores might still exist. Fig. 3 suggests that differencesmight be larger among infants under 6 months old, and one mighthypothesize that were therefore nutritional problems were acuteprior to birth. To explore among which children the relationshipis strongest, I initially re-estimate the model in column 6 of Table5 using the subsample of children aged 6 months to 3 years old(Table 6, row 2), eliminating the youngest children, and find a pointestimate slightly higher (0.146 standard deviations) which remainssignificant at the 10% level. I next eliminate children above 2 yearsold (row 3), and find an even larger coefficient estimate (0.239standard deviations). This finding is consistent with the fact thatchildren who are between 6 months to 2 years old at the time of
the follow-up survey have lived a significant proportion of theirlives through increasing food prices, and having access to incomefrom a migrant abroad may have helped households alleviate theshock.18
Implicit to this point in our discussion is that it is remittancesthat migrants send back that are potentially important in alleviat-ing the effects of the rapid increase of food prices. In rows 4–6 ofTable 6, we re-estimate Eq. (1) using a dummy for remittances re-ceived in the past 12 months rather than the migration dummyvariable. For the whole sample and among both subsamples byage, the association between the receipt of remittances by thehousehold and child HAZ scores is larger in magnitude than whenmigrant status was used as the measure of migration, again con-trolling for all of the variables in column 6 of Table 5. In fact, sta-tistical significance improves for the remittance indicator,suggesting that remittances are likely the conduit to improvedHAZ scores among children in migrant households. However, thereis another level of potential selection bias when using remittancesas the measure of migration, since motivations to remit are gener-ally complex and are subject to another potential selection bias.19
An alternative measure of problems with child development isstunting prevalence, where stunting is defined as children withHAZ scores below �2. We next replace the HAZ variable in Eq.(1) with an indicator variable for whether or not children havean HAZ score low enough to be considered stunted, and re-esti-mate, again using the same set of control variables (Table 7, rows1–3). Across the whole sample, I find that being a member of a mi-grant household is associated with a 5.6% point decrease in theprobability of being stunted (row 1). The estimate is significantat the 5% level. I next restrict the sample only to include childrenover 6 months old, and the estimate increases to 6.1% points, andwhen 2 year olds are removed from the sample, the estimatedassociation between migrant household status and stunting preva-lence is minus 9.6% points. Therefore, it is at the very least clearthat children in migrant households are significantly less likelyto be stunted, even controlling for differences in household wealth.

Table 7Correlations between stunting prevalence, weight-for-height Z scores, and household migration status, children under 3 years old, ElSalvador, 2008.
Sample Estimated coefficient Number of obs.
Dependent variable: stunting prevalenceAll Children under 3 years old �0.056 2513
(0.024)**
Children aged between 6 months and 3 years old �0.061 2275(0.026)**
Children aged between 6 months and 2 years old �0.096 1339(0.036)**
Migration measure: remittances receivedAll children under 3 years old 0.066 2439
(0.084)Children aged between 6 months and 3 years old 0.078 2208
(0.091)Children aged between 6 months and 2 years old 0.121 1308
(0.122)
Notes: All regressions include all variables in column 6 of Table 5, as well as cantón level fixed effects; full results are presented inAppendix Table B2. Standard errors clustered at the canton level in parentheses.*Indicates significance at the 10% level.** Indicates significance at the 5% level.***Indicates significance at the 1% level.
20 If I again replace the migration variable with an indicator variable for whether ornot the household received remittances, the results are virtually the same. Moreover,the data indicate that average and median remittances increased between surveys,further indicating that migrants may have responded to increasing prices by sendingadditional money back to El Salvador.
A. de Brauw / Food Policy 36 (2011) 28–40 37
To ensure that I am examining the right anthropometric out-come, I next replace the HAZ score with the WHZ score, which bet-ter measures the contemporaneous nutritional status of youngchildren (Table 7, rows 4–6). Given that rising food prices mighthave caused lower food consumption, it is worth examining a po-tential association between migration and WHZ scores, thoughwasting is not a problem in poor parts of rural El Salvador, giventhat the average WHZ score even in the baseline is above zero.No matter the subsample, I do not find a significant coefficienton the migration status variable, indicating that there is not astrong relationship (if any) between migrant household statusand WHZ scores. In combination, the results so far suggest thateven in an environment of falling HAZ scores, children in house-holds participating in migration have higher HAZ scores and areless likely to be stunted. However, as discussed in the previous sec-tion they do not account for three potential biases. First, the levelof Z scores has been measured, rather than individual changes inZ scores measured as specific children age. Therefore the coeffi-cient may simply reflect the fact that children in migrant house-holds have consistently higher HAZ scores than children in non-migrant households. Similarly, although somewhat implausible,there could be a reverse causality at play. If children appear to begrowing healthily, parents or other adults in the household mayfeel more comfortable migrating. Therefore it is necessary to alsouse the change in HAZ scores as a dependent variable. Second, Ihave not accounted for other observable household characteristics,such as the wealth of the household that might be correlated withboth migration and child nutritional status. Similarly, I have not ac-counted for unobservable factors at the household level that mightbe correlated with both migration status and child nutritionalstatus.
To begin to address these three issues, I next estimate Eq. (2)using the panel of 823 children for whom I have two anthropomet-ric observations and a full set of child level variables. Since the sur-veys were roughly 9 months apart, these children were all agedbetween birth and about 27 months at the baseline. In additionto the indicator variable for migrant households at the baseline, Iinclude the age of the child at baseline, whether or not a householdwas a migrant household in the baseline, and gender in all specifi-cations (Table 8). When the three sets of additional explanatoryvariables are added to Eq. (2) sequentially, they do not substan-tially change the estimated coefficient on the migrant status vari-able. In the initial specification, I control for all child level
variables, and estimate a coefficient of 0.186 standard deviationson the migrant status variable, which is significant at the 5% level(column 1). The estimated coefficient does not appreciably changewhen initial wealth is added (column 2), and in fact the estimatedcoefficient actually increases slightly. The estimate is also robust tothe sequential inclusion of mother characteristics (column 3) andhousehold level shocks (column 4), though the latter estimate isonly significant at the 10% level. Finally, when canton level fixed ef-fects are included, the estimated coefficient on migrant householdstatus does not change, but the standard error increases and theresulting p-value is around 0.2. Regardless, these results are sug-gestive that to this point that migration may have helped play arole in overcoming rising food prices, at least in households withaccess to earnings from migration.20
Potential biases
To this point, the results to this point are suggestive that migra-tion is associated with better child nutritional status and betterchild nutritional status through the period of rising food prices,they do not account for other factors that could be correlated withboth migration and child nutritional status. Though I have at-tempted to control for several sets of observable variables, theseadditional variables do not account for all of the unobservablesthat could confound the association between migrant householdstatus and child HAZ scores or stunting prevalence. Given that Ican control for canton level fixed effects, the interesting type ofunexplained variation is at the household level. The type of unob-servable that would be of primary concern would be positively cor-related with both migration and changes in child HAZ scores.Rather than listing all of the types of variables that might fit thisdescription, I argue here that the main two types of omitted vari-ables cannot explain the entire magnitude of the positivecoefficient.
The first obvious argument would be that I have not ade-quately controlled for wealth through the inclusion of householdincome or the asset index, and that wealthier households may be

Table 8Regressions explaining the change in HAZ scores among children measured in baseline and follow-up surveys, and correlation with migration status, El Salvador, 2008.
(1) (2) (3) (4) (5)
Migrant household 0.186 0.214 0.220 0.198 0.187(0.085)** (0.092)** (0.097)** (0.100)* (0.149)
Age in baseline 0.013 0.012 0.013 0.013 0.013(0.001)*** (0.001)*** (0.001)*** (0.001)*** (0.002)***
Change in age (days) 0.032 0.033 0.025 0.031 �0.188(0.033) (0.033) (0.034) (0.034) (0.075)**
Gender (1 = male) 0.143 0.166 0.174 0.174 0.115(0.068)** (0.069)** (0.070)** (0.069)*** (0.068)*
Normal birth? (1 = yes) 0.093 0.105 0.093 0.087 0.100(0.090) (0.093) (0.094) (0.095) (0.081)
Low birth weight? (1 = yes) 0.148 0.159 0.147 0.156 0.193(0.114) (0.116) (0.119) (0.118) (0.129)*
Exclusively breastfed for 6 months �0.052 �0.033 �0.040 �0.036 �0.086(0.068) (0.066) (0.069) (0.068) (0.077)
First born (1 = yes) 0.163 0.162 0.108 0.118 0.090(0.077)** (0.074)** (0.099) (0.098) (0.104)
Log, per capita income 0.024 0.017 0.019 0.016(0.031) (0.032) (0.032) (0.032)
Asset index �0.025 �0.026 �0.027 �0.032(0.023) (0.025) (0.025) (0.025)
Years of education, mother 0.011 0.011 0.003(0.006)* (0.006)* (0.005)
Age of mother (in years) �0.003 �0.003 �0.008(0.006) (0.006) (0.006)
Agricultural shock 0.207 0.216(0.169) (0.150)
Sick member 0.083 �0.018(0.147) (0.156)
Death in household 0.525 0.459(0.226)** (0.248)*
Remittances declined 0.215 0.066(0.295) (0.319)
Fixed effects? No No No No CantonN 823 799 775 775 775R2 0.1 0.104 0.107 0.114 0.12
Notes: Standard errors clustered at the cantón level in parentheses.* Indicates significance at the 10% level.** Indicates significance at the 5% level.*** Indicates significance at the 1% level.
38 A. de Brauw / Food Policy 36 (2011) 28–40
more likely to migrate and hold food consumption constantthrough a period of rapidly increasing food prices. Therefore, itcould be that the estimated coefficient reflects the effect of wealthdifferences rather than the effects of migration. However, for tworeasons it is unlikely that this effect dominates the coefficientestimate. Recall that the addition of the asset variable used hereactually increased the magnitude of the coefficient estimate onmigration. Therefore, if a better wealth variable were both avail-able and would be a candidate to fully explain the estimated rela-tionship between migration and HAZ scores, it would have to beboth highly correlated with migration and negatively correlatedwith the two proxies of wealth used here. It is highly implausiblethat such a variable exists, and so it is implausible that wealth ef-fects could explain the estimated relationship between migrationand child HAZ scores.
Second, within villages some households might have better ac-cess to the networks that often catalyze migration (e.g. Carringtonet al., 1996). Such households might also be better informed aboutappropriate young child feeding practices, and if so the coefficientestimate might also reflect the impacts of specific social networksthan the effects of migration. However, even if such a social net-work effect did exist it would not be large enough to dominatethe estimated coefficient here. Given that nutritional supplementsimproved heights by about 0.3 standard deviations in Progesa, asimilar conditional cash transfer program, (Behrman and Hoddi-nott, 2005) but nutrient intakes do not respond well to increasesin income (Bouis and Haddad, 1992), it is doubtful that social net-works could increase heights by as much as 0.13–0.2 standard
deviations. In summary, I find a positive association between mi-grant households and changes in child HAZ scores of between0.13 and 0.2 standard deviations. If the coefficient is biased up-ward, there are not plausible scenarios in which the bias is largeenough to completely explain the coefficient estimate. Althoughit is not safe to conclude that migration causes higher child HAZscores, it is appropriate to consider the positive association robustto any potential impacts of unobservables.
Conclusion and discussion
In this paper, I have demonstrated a positive correlation be-tween households in rural El Salvador that send out migrants, pri-marily to the United States, and child HAZ scores, during a periodof rapidly increasing food prices and declining child HAZ scores.The correlation appears robust to the inclusion of other observablevariables that might confound the relationship between householdlevel migration and child HAZ scores, as well as canton fixed ef-fects, and the magnitude of the coefficient cannot plausibly be ex-plained by the influence of unobservables. In the context of aperiod of rapidly increasing food prices, children were better offin migrant households than non-migrant households, from a nutri-tional perspective. Whereas it appears likely that non-migranthouseholds held calories consumed by young children constant,they substituted some low nutrient foods into the diet, whereasthis did not appear to occur, at least to the same degree, in migranthouseholds. That said, there are several questions left unanswered

A. de Brauw / Food Policy 36 (2011) 28–40 39
by this paper. First, I cannot isolate the pathway by which migra-tion might affect child HAZ scores. Detailed data on food consump-tion by specific family members is not available. Ideally, one wouldbe able to cross socioeconomic information on the household withdisaggregated data on the actual food intakes by specific familymembers, measured over time, but such data do not exist. Second,the results are limited to young children in poor areas that less fre-quently participate in migration than other parts of El Salvador. Itis not clear whether these results are specific to households in poorareas or not, or if they would be diluted in areas with moremigration.
In formulating policy either for times of crisis or in general, ElSalvador’s government could tailor social protection programs toaccount for migration. Given that children in households with mi-grant income seem to do better than children without migrationincome, it seems sensible to target social protection transfers tochildren in households without access to migrant income; geo-graphic indicators could be better used to predict which house-holds are likely to receive transfers and which are not. As ElSalvador’s national census asked about migration in 2007, this datasource could be used for fairly refined targeting. That said, policiescould also be put into place to help children in migrant householdsmore. For example, any policies that help facilitate remittanceflows or lower the transaction costs of remittances from the UnitedStates to El Salvador can only help migrant households. Further-more, the government should be attuned to potential psychosocialcosts of migration, as growing up with one parent (or no parents)has been shown to be negatively correlated with several psychoso-cial outcomes (e.g. Sigle-Rushton and McLanahan 2002).
Finally, the increase in food prices was a specific type of shock.It is unclear how households would react to a shock in the destina-tion. The worldwide financial crisis that unfurled beginning in Sep-tember, 2008, affected migrant remittances back to El Salvador.According to El Salvador’s central bank, remittances declined bybetween 10% and 11% in 2009 relative to 2008. With an additionalround of data collection, one can test whether the financial crisishad a negative effect on outcomes among children in migranthouseholds.
Acknowledgements
The author benefited from valuable comments from JohnMaluccio, Ren Mu, Alberto Zezza, and two anonymous referees.The views expressed in this paper are those of the author aloneand not those of the organization with which he is associated.
21 This procedure was developed because the El Salvador census data was not yetpublically available and could not release the exact locations of households to theresearch team, and Red Solidaria censuses had not yet been completed. More detailson this procedure can be obtained from the author.
Appendix A. Data
The data sets used for this paper were collected by FUSADES incollaboration with researchers at the International Food Policy Re-search Institute, and the sampling procedure was designed explic-itly to evaluate the Red Solidaria conditional cash transferprogram. The baseline data set was collected in January and Febru-ary of 2008, and the second survey was collected between Septem-ber and November of 2008. The primary survey form includedsections on household demographics, education, health, time allo-cation and off-farm labor, housing and other consumer durables,agriculture, migration, other income sources, consumer expendi-tures, and community participation in programs, include Red Soli-daria. During each round the survey, households with childrenunder 3 years old living in them were also visited by trained nurseswho measured and weighed children and recorded the informationon their growth monitoring and vaccination card, if it wasavailable.
The sample included 100 cantones in 50 municipios, and due tothe geographic targeting of Red Solidaria, all of the municipioswere rated as either severely poor or highly poor. Prior to the base-line, 15 households with children under 3 years old and 15 house-holds with children between the ages of 6 and 12 were selectedrandomly within each canton from census lists, for a total of 30households per canton. For some municipios, census lists werenot available, and a procedure developed from the El Salvador cen-sus data was developed and used to ensure that the probability ofbeing selected in these cantones was the same as it had been in thecantones for which census data was available.21 In total, 2817households are included baseline survey sample.
In the second survey, the survey team attempted to re-inter-view all households that continued to have residents in one ofthe two age categories targeted by the sample. To replace house-holds leaving the sample, replacement households were drawnfrom the Red Solidaria censuses, all of which had been completedby the time the survey team went to the field, for children between6 and 12 years old. For children under 3 years old, the problem wasprimarily that children aged out of the sample, and we were con-cerned that children under 1 needed to be included, particularlyto be able to measure growth monitoring adequacy among under1 year olds. Therefore the survey team went to health clinics ineach of the municipios to learn about births among mothers livingin each of the cantones between surveys, and randomly selectedreplacement households. In total, the second survey included2921 households.
The sample used for this paper is conditional on anthropometryhaving been completed, so representing approximately half of thesample households. In total, HAZ scores were available for 3062children in total between the two surveys, and two measures(one in each survey) were obtained for 859 children.
Appendix B
Supplemental Tables.
Appendix C. Supplementary data
Supplementary data associated with this article can be found, inthe online version, at doi:10.1016/j.foodpol.2010.11.002.
References
Acosta, P., 2006. Labor Supply, School Attendance, and Remittances fromInternational Migration: The Case of El Salvador. World Bank Policy ResearchWorking Paper 3903.
Banco Central de Reserva de El Salvador, 2009. Indicadores Economicos 2004–2008.Behrman, J., Hoddinott, J., 2005. Program evaluation with unobserved heterogeneity
and selective implementation: The Mexican Progresa impact on child nutrition.Oxford Bulletin of Economics and Statistics 67, 547–569.
Binswanger, H., Rosenzweig, M., 1986. Structural and behavioral determinants ofagriculture. Journal of Development Studies 22 (3), 503–539.
Bouis, H., Haddad, L., 1992. Are estimates of calorie–income elasticities too high? Arecalibration of the plausible range. Journal of Development Economics 39 (2),333–364.
Carrington, W., Detragiache, E., Vishnawath, T., 1996. Migration with endogenousmoving costs. American Economic Review 86 (4), 909–930.
Cox-Edwards, A., Ureta, M., 2003. International migration, remittances, andschooling: evidence from El Salvador. Journal of Development Economics 72(2), 429–461.
FAO, 2008. World Food Situation: High Food Prices, various documents.<www.fao.org/worldfoodsituation>.
Giles, J., Mu, R., 2007. Elder parent health and the migration decision of adultchildren: evidence from rural China. Demography 44 (2), 265–288.
40 A. de Brauw / Food Policy 36 (2011) 28–40
Giles, J., 2006. Is life more risky in the open? Household risk-coping and theopening of China’s labor markets. Journal of Development Economics 81 (1),25–60.
Giles, J., Yoo, K., 2007. Precautionary behavior, migrant networks and householdconsumption decisions: an empirical analysis using household panel data fromrural China. The Review of Economics and Statistics 89 (3), 534–551.
Gubert, F., 2002. Do migrants insure those left behind? Evidence from the Kayesarea (Western Mali). Oxford Development Studies 30 (3), 267–287.
Halliday, T., 2006. Migration, risk, and liquidity constraints in El Salvador. EconomicDevelopment and Cultural Change 54 (4), 893–925.
Ivanic, M., Martin, W., 2008. Implications of Higher Global Food Prices for Poverty inLow-Income Countries. World Bank Policy Research Working Paper Series 4594.
Jensen, R., Miller, N., 2008. The impact of food price increases on caloric intake inChina. Agricultural Economics 39 (supplement), 465–476.
Masters, W., Shively, G., 2008. Introduction to the special issue on the world foodcrisis. Agricultural Economics 39 (supplement), 373–374.
McKenzie, D., 2005. Measuring inequality with asset indicators. Journal ofPopulation Economics 18 (2), 229–260.
Paulson, A., 2000. Insurance Motives for Migration: Evidence from Thailand.Unpublished paper, Northwestern University.
Rosenzweig, M., Stark, O., 1989. Consumption smoothing, migration, and marriage:evidence from rural India. Journal of Political Economy 97 (4), 905–926.
Sigle-Rushton, W., McLanahan, S., 2002. Father Absence and Child Well-Being: ACritical Review. Center for Research on Well-Being Working Paper 02-20.
Stark, O., 1991. The Migration of Labor. Basil Blackwell, Boston.United Nations Development Program (UNDP), 2005. Informe Sobre Desarrollo
Humano El Salvador 2005.von Braun, J., 2008. Rising Food Prices: What Should be Done? International Food
Policy Research Institute Policy Brief.World Bank, 2008. Food Crisis: What the World Bank is Doing, various documents.
<www.worldbank.org/foodprices>.World Health Organization (WHO), 2001. The Optimal Duration of Exclusive
Breastfeeding: Report of an Executive Consultation. World Health Organization,Geneva.
World Health Organization (WHO), 2006. WHO Child Growth Standards: Length/Height-for-age, Weight-for-age, Weight-for-length, Weight-for-height andBody Mass Index-for-age: Methods and Development. World HealthOrganization, Geneva.
Yang, D., Choi, H.J., 2007. Are remittances insurance? Evidence from rainfall. Shocksin the Philippines. World Bank Economic Review 21 (2), 219–248.
Yang, D., 2008. Risk, migration, and rural financial markets: evidence fromearthquakes in El Salvador. Social Research 75 (3), 955–992.