
MIG Infrastructure Service Delivery Level and Unit … · 2009-06-19 · Page 3 of 228 CONTRIBUTING...
227
Page 1 of 228 Q DRAFT
Transcript of MIG Infrastructure Service Delivery Level and Unit … · 2009-06-19 · Page 3 of 228 CONTRIBUTING...

Page 1 of 228
Q
DRAFT

Page 3 of 228
CONTRIBUTING REFERENCE BASE TO THE INDUSTRY GUIDE
CONTRIBUTING ENTITY DESCRIPTION
DEPARTMENT OF LOCAL AND PROVINCIAL GOVERNMENT Initiator and Project Coordinator DEPARTMENT OF WATER AFFAIRS AND FORESTRY Sector Leader (Water Services) DEPARTMENT OF HEALTH Sector Leader (Community Health and Services) SA LOCAL GOVERNMENT ASSOCIATION Sector Leader (Local Government) DEPARTMENT OF HOUSING Sector Leader (Housing and Land) PRO-PLAN CONSULTING ENGINEERS (PTY) LTD Individual Costing of: Construction Cost for Infrastructure –
Engineering Perspective Data Verification: Quantity Surveys of All Costs
SOUTH AFRICAN INSTITUTE OF CIVIL ENGINEERS (SAICE)
Specialist Engineering Evaluation and Amendments to Final Draft of Industry Index
INCLEDON DPI Individual Costing of: Construction Cost Related to Materials AFRICON Infrastructure Costs for Recent MIG Projects via MIS System WATER RESEARCH COMMISSION (WRC) Background Information for: On-Site Sanitation and
Package Plants (Wastewater) LILIPUT Breakdown and Costing Options for: On-Site Sanitation and
Package Plants (Wastewater) KWEZI V3 ENGINEERS Individual Costing of: Project Costing for Infrastructure and
Engineering Perspectives DEVELOPMENT BANK OF SOUTH AFRICA (DBSA) Conceptualization: Related to Grant Funding of
Infrastructure, Input on Infrastructure Lifecycle and Value Engineering
CSIR Conceptualization: Approach taken for the Industry Index WATER GROUP HOLDINGS (PTY) LTD Individual Costing of: Construction Cost for Water and
Sanitation Services BARLOWORLD Individual Costing of: Construction Materials, Transport and
National Variances NATIONAL FIRE PROTECTION AGENCY (NFPA) Contributions to Fire Protection Scoping and Costing SWAN PLASTICS CC Individual Costing of: Construction Cost for Water and
Sanitation Services JOJO TANKS (PTY) LTD Individual Costing of: Construction Cost for Sanitation
Services LAFARGE SOUTH AFRICA Individual Costing of: Construction Materials and National
Variances SEKUNJALO (PTY) LTD. Individual Costing of: Construction Cost for Water and
Sanitation Services COROBRIK Individual Costing of: Construction Materials and National
Variances ROCLA Individual Costing of: Construction Materials and National
Variances NJR STEEL – WITBANK Individual Costing Options for: Construction Materials Cost
For Roads and Stormwater MASHOVA PLANT Individual Costing Options for: Plant and Equipment Costs
and National Variances STEELEDALE Individual Costing Options for: Construction Cost for Water
and Sanitation Services DELOITTE Conceptualization via Reference Documentation: Related to
Costing and Funding of Infrastructure

Page 4 of 228
ALERT STEEL POLOKWANE Individual Costing of: Construction Materials Cost for Roads
and Stormwater HT PELATONA PROJECTS Individual Costing Options for: Earth Moving Plant and Hire
Rates and National Variances COASTAL HIRE Individual Costing of: Plant and Equipment Costs and
National Variances HOLICIM Individual Costing of: Construction Materials and National
Variances BIGEN AFRICA Individual Provision of Information: Assisted with Theory on
Water Treatment Plans/ Facilities. PARTNERS IN DEVELOPMENT Individual Provision of Information: Water and Sanitation ETHEKWINI MUNICIPALITY Unit Costs Input and Detailed Costing of Water and Sanitation
Services – Municipal Perspective PUMPTRON Individual Costing of: Pumpstations - Breakdown and Costing NW STEEL Individual Costing of: Construction Materials WATER INSTITUTE OF SOUTHERN AFRICA (WISA & EWISA)
Provided Photographic Material
ZITHOLELE CONSULTING
Individual Costing of: Wastewater Treatment Infrastructure

Page 5 of 228
ACRONYMS
BSRP Building For Sport And Recreation Programme CAPEX Capital Expenditure
CFLC Cold Formed Lipped Channel CHC Community Health Center CIP Capital Investment Plan
CPAF Contract Price Adjustment Formula CPI Consumer Price Index
DEAT Department Of Environmental Affairs And Tourism DH Department Of Housing
DMC Disaster Management Center DME Department Of Minerals And Energy
DMIS Disaster Management Information System DoH Department Of Health
DPLG Department Of Provincial And Local Government DSD Department Of Social Development
DT Department Of Transport DWAF Department Of Water Affairs And Forestry
EC Eastern Cape ECSA Engineering Council Of South Africa EPWP Expanded Public Works Programme
FBW Free Basic Water FS Free State
GDP Gross Domestic Profit GSC General Service Counter
GT Gauteng IDC Infrastructure Delivery System IDIP Infrastructure Delivery Improvement Programme IDP Infrastructure Development Plan
IIBCI Industry Insight Building Cost Index IPIP Infrastructure Programme Implementation Plan
IPMP Infrastructure Programme Management Plan KZN Kwa-Zulu Natal LED Local Economic Development LIC Labour Intensive Construction LM Limpopo
LOFLOS Low-Flow On-Site LOS Level Of Service (also known as Service Option)
MDMC Municipal Disaster Management Center MIG Municipal Infrastructure Grant MIIF Municipal Infrastructure Investment Framework MIS Municipal Information System MP Mpumalanga
MPCC Multi-Purpose Community Center MPCF Multi-Purpose Community Facility MTEF Medium Term Expenditure Framework
NBR National Building Regulations

Page 6 of 228
NC Northern Cape NDMC National Disaster Management Center
NHBRC National Home Building Regulations Certificate NMMU National MIG Management Unit
NT National Treasury NW North West
O&M Operational And Maintenance OHS Occupational Health And Safety
OPEX Operational Expenditure P&G’s Preliminary And General
PDA Pre-Determined Attendance PDMC Provincial Disaster Management Center
PMU Project Management Unit PPI Production Price Index
PPP Public Private Partnership PRF Project Registration Forms PW Department Of Public Works
RDP Rural Development Programme SABS South African Board Of Standards
SAFCEC South African Federation Of Civil And Electrical Contractors SALGA South African Local Government Association
SANS South African National Standards (also known as SABS) SDA Service Delivery Agreement
SMME Small, Micro and Medium Enterprise SRSA Sports And Recreation South Africa
STATSA Statistics South Africa TMA Trade Metrology Act UDS Urine Diversion System UPS Uninterrupted Power Supply VIP Ventilated Improved Pit
WBASA Water Borehole Association Of South Africa WC Western Cape
WSA Water Services Authority WSDP Water Service Development Plan WTW Water Treatment Works

Page 7 of 228
CONTENTS 1 PREFACE 11 2 INTRODUCTION 11 2.1 Context 11 2.2 Background 12 3 REVISED GUIDELINE: OBJECTIVE AND PURPOSE 13 3.1 Objective 14 3.2 Purpose 14 3.3 Methodology 14 3.4 Reference Date and Future Revision 16 3.5 Use of the Industry Guide 17 Flow Chart #1 Water Supply 17 Flow Chart #2 Sanitation Supply 18 Flow Chart #3 Roads 19 Flow Chart #4 Stormwater Management 20 4 GENERAL CONSIDERATIONS IN INFRASTRUCTURE PLANNING 21 4.1 Integrated Asset Management and MIG 21 4.2 Market Factors Impacting on Civil and Building Services 22 4.3 Labour Intensive Construction Methods and the EPWP 23 4.4 Financial Arrangements for Infrastructure 24 4.4.1 Costs 24 4.4.2 Management Cost Factors 25 4.4.2.1 Institutional and Social Development 25 4.4.2.2 Professional Fees 26 4.4.2.3 P & G’s for Contractors Establishment 27 4.4.3 Grants and Subsidies 28 4.4.4 Loans 28 4.4.5 Raising Income 28 5 INFRASTRUCTURE CONSIDERATIONS 28 5.1 Rural Versus Urban 30 5.2 The Meaning of a “Basic” Level of Service 30 5.3 Making up a Services “Package” 30 5.4 Selection of Appropriate Service Options 30 5.5 Service Delivery: the Implementation Arrangements 30 5.6 New Infrastructure In Urban Areas: Relationship to Housing 30 5.7 New Infrastructure in Rural Areas 31 5.8 Upgrading 31 5.9 Bulk and Connector Infrastructure 31 5.10 Community Service Infrastructure 31 5.11 Understanding Operation and Maintenance Factors 31 6 BASIC RESIDENTIAL INFRASTRUCTURE (B) 31 6.1 Water Supply 31 6.1.1 Definition/Description 32 6.1.2 Purpose of Water Supply Infrastructure 32 6.1.3 Geographical Context 32 6.1.4 Basic Level of Service 32 6.1.5 Level of Service Options 32 a) Communal Stand Pipes 33 b) Yard Taps 34 c) Yard Tanks 34 d) Roof Tanks 35 e) House Connections 35 6.1.6 Advantages and Disadvantages 36 6.1.7 Residential Water Supply: Basic Unit Cost 37 6.1.8 Connector Services: Water Supply Infrastructure 38 6.1.8.1 Reservoirs 38 6.1.8.2 Pumpstations 38 6.1.8.3 Supply Pipelines 40 6.1.9 Bulk Services: Water Supply Infrastructure 42 6.1.9.1 Water Treatment Works 42

Page 8 of 228
6.1.9.1.1 Conventional Water Treatment Works 42 6.1.9.1.2 Unit Costs 43 6.1.9.2 Raw Water Storage Dams 43 6.1.9.3 Boreholes Development 44 6.1.9.3.1 Definition/Description 44
6.1.9.3.2 Purpose of a Borehole 44
6.1.9.3.3 Geographical Context 44 6.1.9.3.4 Basic Level of Service 44 6.1.9.3.5 Levels of Service Options 44 6.1.9.3.6 Advantages and Disadvantages 45 6.1.9.3.7 Standards of Construction 45 6.1.9.3.8 Unit Costs 45 6.1.10 Management Cost Factors 48 6.1.10.1 P & G’s for Contractors Establishment 48 6.1.11 Standards of Construction 48 6.1.12 Unit Cost for Water Supply 48 6.1.13 Metering of all Services in Terms of the Water Services Act 51 6.2 Sanitation / Wastewater 53 6.2.1 Definition/Description 53 6.2.2 Purpose of Sanitation Infrastructure 53 6.2.3 Geographic Context 53 6.2.4 Basic Level of Service 53 6.2.4.1 Considerations for Deciding on a Sanitation System other than VIP’s 54 6.2.4.2 MIG Funding for Basic Level of Service 55 6.2.5 Level of Service Options 55 6.2.6 Advantages and Disadvantages 56 6.2.7 Standards of Construction 57 6.2.8 Unit Costs of Basic Sanitation 58 6.2.9 Connector Services: Sewerage Infrastructure 60 6.2.10 Bulk Services: Sewerage Infrastructure 62 6.2.11 Sewerage Pumpstations 62 6.2.12 Wastewater Treatment Plants 63 6.2.12.1 Package Plants 68 6.3 Roads 70 6.3.1 Definition/Description 70 6.3.2 Purpose of Road Infrastructure 70 6.3.3 Geographical Context 70 6.3.4 Basic Level of Service 71 6.3.5 Level of Service Options 71 6.3.5.1 Access to each Plot with a Graded or Gravel-Paved Road 72 6.3.5.2 Narrow Paved Road or Road with Narrow Paving 72 6.3.5.3 Paved Streets with Kerbs 76 6.3.6 Advantages and Disadvantages 73 6.3.7 Standards of Construction 73 6.3.8 Unit Costs 74 6.4 Stormwater 76 6.4.1 Definition/Description 76 6.4.2 Purpose of Stormwater Infrastructure 76 6.4.3 Geographical Context 76 6.4.4 Basic Level of Service 77 6.4.5 Level of Service Options 77 6.4.6 Advantages and Disadvantages 77 6.4.7 Standards of Construction 77 6.4.8 Unit Costs 77 6.5 Solid Waste Disposal (Municipal Collection) 79 6.5.1 Basic Level of Service 79 6.5.2 Level of Service Options (Collection) 79 6.5.2.1 Households Transferring to Communal Skip Bins 79 6.5.2.2 Organized Transfer To Communal Skip Bins 79 6.5.2.3 Kerbside Collection 79 6.6 Street/Community Lighting 80

Page 9 of 228
6.6.1 Definition/Description 80 6.6.2 Purpose of Street Lighting/Community Lighting Infrastructure 80 6.6.3 Geographical Context 80 6.6.4 Basic Level of Service 80 6.6.5 Level of Service Options 80 6.6.5.1 Streetlights 81 6.6.5.2 High Mast Lights 81 6.6.6 Advantages and Disadvantages 81 6.6.7 Standards of Construction 81 6.6.8 Unit Costs 81 7 PUBLIC MUNICIPAL SERVICE INFRASTRUCTURE (P) 83 7.1 Public Transport 83 7.1.1 Definition/Description 83 7.1.2 Purpose of Infrastructure 83 7.1.3 Geographical Context 83 7.1.4 Basic Service Level 83 7.1.5 Level of Service Options 83 7.1.5.1 Bus Shelters 83 7.1.5.1.1 Bus Shelters for Bus Ranks 84 7.1.5.1.2 Bus Shelters for Streets 84 7.1.5.2 Taxi Ranks 85 7.1.5.2.1 Layout of Taxi Rank 85 7.1.5.3 Sidewalks 86 7.1.5.3.1 Gravel Sidewalks 86 7.1.5.3.2 Paved Sidewalks 86 7.1.6 Standards of Construction 87 7.1.7 Unit Cost 87 7.2 Emergency Services 89 7.2.1 Definition/Description 89 7.2.2 Purpose of Service and Infrastructure 89 7.2.3 Geographical Context 89 7.2.4 Basic Service Level 89 7.2.4.1 Basic Fire Fighting Services 89 7.2.4.2 Disaster Management Facilities 90 7.2.5 Standards of Construction 92 7.2.6 Unit Cost 92 7.3 Community Services 93 7.3.1 Health Services 93 7.3.1.1 Definition and Purpose of Infrastructure 93 7.3.1.2 Geographical Context 93 7.3.1.3 Basic Service Level and Options 93 7.3.2 Standards of Construction 93 7.3.3 Unit Cost 94 7.3.4 Mortuary 96 7.3.5 Multi-Purpose Center/Facility (SRSA Version) 96 7.3.5.1 Definition and Purpose of Infrastructure 96 7.3.5.2 Basic Level of Service 96 7.3.5.3 Standards of Construction 97 7.3.5.4 Unit Cost 99 7.3.6 Multi-Purpose Community Center (GCIS Version) 100 7.3.6.1 Definition and Purpose of Infrastructure 100 7.3.6.2 Geographical Context 100 7.3.6.3 Basic Service Level and Options 100 7.3.6.4 Standards of Construction 100 7.3.6.5 Unit Cost 102 7.3.7 Parks and open Spaces 104 7.3.7.1 Definition and Purpose of Infrastructure 104 7.3.7.2 Basic Service Level and Options 104 7.3.7.3 Standards of Construction 104 7.3.7.4 Unit Cost 105 7.3.8 Beaches and Amusement Facilities 106 7.3.8.1 Definition and Purpose of Infrastructure 106

Page 10 of 228
7.3.8.2 Basic Service Level and Options 106 7.3.8.3 Standards of Construction 106 7.3.8.4 Unit Cost 106 7.3.9 Cemeteries 106 7.3.9.1 Definition and Purpose of Infrastructure 106 7.3.9.2 Geographical Context 107 7.3.9.3 Basic Service Level and Options 107 7.3.9.3.1 Places of Burial: Below Basic Level of Service 107 7.3.9.3.2 Local Cemetery: Basic Level of Service 107 7.3.9.3.3 Local Cemetery: Higher Level of Service 107 7.3.9.4 Regional Cemetery: Intermediate Level of Service 108 7.3.9.5 Memorial Parks: Highest Level of Service 108 7.3.9.6 Standards of Construction 108 7.3.9.7 Unit Costs 109 7.3.10 Crematoriums 111 7.3.10.1 Definition and Purpose of Infrastructure 111 7.3.10.2 Geographical Context 111 7.3.10.3 Basic Level of Service and Options 111 7.3.10.4 Standards of Construction 111 7.3.10.5 Unit Cost 111 7.3.11 Fencing 111 7.3.12 Municipal Abattoirs 115 7.3.13 Libraries 115 7.3.14 Solid Waste Disposal Site (Landfill) 115 7.3.15 Facilities for Animals 118 8 SOCIAL INSTITUTIONS AND MICRO-ENTERPRISES INFRASTRUCTURE (E) 118 8.1 Local Economic Development Type Projects 119 8.2 Social Institutions 123 9 MIG OFFICES 126
10 SOURCE AND REFERENCES 127 10.1 Declaration 128
11 APPENDICES Appendix 1 Labour, Plant and Material Indices, Rate and Escalation Factors
Appendix 2a Unit Rate Using Zero Approach Costing Civil Prices Based on a Zero-Approach Costing
Appendix 2b Adjusted Unit Rate Using Escalation Approach:
Civil Prices Based on the 2005 Unit Costs, Escalated at Specified Factors
Appendix 3 Public Municipal Service Infrastructure: Emergency Services
Appendix 4a Public Municipal Service Infrastructure: Community Services (Health Services)
Appendix 4b Public Municipal Service Infrastructure: Community Services (MPCC)
Appendix 5 MIG Guidelines Unit Costing-Escalation for Project Types MIG Guidelines Unit Costing-Escalation Factors for Labour, Plant, Material and Fuel
Appendix 6 Zero-based Costing Approach: Detailed Cost Breakdown per
Infrastructure Type Example Eastern Cape (Rates & Quantities used to Calculate Price)
Appendix 7 Costing of Wastewater Package Plant s based on hydraulic duty Appendix 8 Costing of Crematorium
Appendix 9 Discussion Document:
Stakeholder Engagement and Requirements in the Revision of the 2005 “Units Costs and Service Levels: a Guide to Municipalities”
Appendix 10 Infrastructure Unit Cost As Reflected On A Provincial Basis And As A National Average
Appendix 11 Infrastructure Unit Costs: Comparative Analysis To Reflect Status Of Revised Costs

Page 11 of 228
1 PREFACE
THE REVISED REPORT “AN INDUSTRY GUIDE: INFRASTRUCTURE SERVICE LEVELS AND UNIT COSTS” PROVIDES AN UPDATED AND REVIEWED VERSION OF THE 2005 “MIG BASIC LEVELS OF SERVICES AND
UNIT COSTS”
THE REVISED GUIDE ADDRESSES REGIONAL, SECTORAL AND INDUSTRY RELATED COST VALUES, AND ALLOWS FOR NATIONAL IMPACTS SUCH AS VARIANCE IN LABOUR, FUEL, MATERIAL AND TRANSPORT. THE GUIDE ACKNOWELDGES THE CHANGED MARKET CONDITIONS SINCE 2005, AND SPECIFICALLY CONSIDERS
THE BUILDING AND CONSTRUCTION INDUSTRY AND THE PROFESSIONAL COST ELEMENTS INVOLVED IN INFRASTRUCTURE DEVELOPMENT
THE GUIDE PROVIDES A PRACTICAL AND CURRENT NATION-WIDE SYSTEM OF GUIDANCE FOR
MUNICIAPLITIES, SERVICE PROVIDERS AND PROVINCIAL/NATIONAL GOVERNMENT IN TERMS OF THE PROVISION OF WEIGHTED INFRASTRUCTURE DEVELOPMENT- AND SERVICE PROVISION COST VALUES
THE GUIDE CONSIDERS INFRASTRUCTURE BEYOND THE FOCUS OF “BASIC SERVICE OPTIONS” AND INCLUDE
ASPECTS OF INTEGRATED INFRASTRUCTURE PLANNING AND MANAGEMENT AND THE VALUE AND ROLE OF INFRSTRUCTURE IN LOCAL AND NATIONAL GROWTH AND DEVELOPMENTMENT OBJECTIVES
2 INTRODUCTION 2.1 Context The Department of Local Government published (December 2005): “Basic Level of Services and Unit Costs: A Guide for Municipalities” as a working document to guide users within the context and conditions of the Municipal Infrastructure Grant (MIG) programme. The purpose of the 2005 document was to provide a framework for municipalities to consider, deliberate and plan in terms of the various infrastructure options and associated costs, and towards the selection of appropriate service levels for basic service provision. The guideline provides an outline of the issues concerned, but the responsibility and mandate rested with municipalities to consider and decide upon the (basic and other) Levels of Service, which they decided to be most appropriate, sustainable and affordable within their local circumstances. Subsequently, this document also acted as the base comparison document for the National MIG Management Unit’s (NMMU) assessment of the Project Registration Forms (PRF). The 2005 Guideline has been valuable in assisting municipalities to cost, apply, register and implement projects, towards meeting- and achieving national infrastructure targets. However, concern has been expressed by stakeholders that the guideline document and the unit cost values reflected therein, are too static and do not reflect regional variances, local economic trends or national market factors and costs indices over the past 3 years - which impact on the civil – infrastructure sector/s.
Escalation of Cost Indices from 2004 to 2007
R 100R 125R 150R 175R 200R 225R 250R 275R 300R 325R 350
CurrentCosts Feb2007Base Costs Dec 2004
Current Costs Feb 2007 143.1 137.1 137.4 140.0 128.5 137.9 144.9 138.5 137.3 148.3 172.5 203.9
Base Costs Dec 2004 127.4 121.9 125.3 125.9 116.5 124.1 128.0 125.3 124.6 133.1 125.6 145.4
EC FS GT KZN LM MP NC NW WC PLANT INDEX
MATERIAL
FUEL INDEX

Page 12 of 228
The revised report “An Industry Guide: Infrastructure Service Levels and Unit Costs” provides an updated and reviewed version of the 2005 “MIG: Basic Levels of Services and Unit Costs: A Guide to Municipalities”. The main concern this report seeks to address is to identify regional / provincial and sectoral/industry related cost values, as well as to allow for national impacts such as variance in labour rates, fuel and transport cost, materials, and other related factors. The Guide aims to align/revise the associated infrastructure costs within the changed market conditions, in recognition of- and working with the individual determining factors. The overall objective was therefore to develop a practical, current and relevant nation-wide system of guidance for municipalities, their service providers and ultimately national and provincial government in terms of the provision of weighted basic infrastructure service provision cost values that reflect national and regional impacts. 2.2 Background Municipalities are responsible for ensuring that the people in their localities receive at least the basic level of services. There are a range of service options and levels of service that can be provided, of which the most immediate needs in terms of related national targets and universal access include: • water supply • sanitation • health centers • electricity or alternative energy sources • roads and stormwater drainage • solid waste disposal When providing services that require infrastructure, municipalities may choose one of several options to meet the service needs of communities in their areas as quickly and effectively as possible, without compromising the quality or sustainability related to the service. However, there are a number of factors to be considered before this can be done. The overall aim is improved quality of life for all people in South Africa, particularly the poorest, without compromising the ability to operate and maintain existing services. Probably the most important factor, is the level at which the service is provided. The term “service level” relates to the way in which the user experiences the service. The choice of an appropriate service level is dictated by affordability (both for customer and service provider) and by community needs and acceptance. Convenience may be as important to a particular community as health, environmental and economic factors. However, it is the responsibility of municipalities to make final decisions about the level of service to be provided. Such decisions have a critical impact on the long-term viability of the particular service and the financial sustainability of local government as a whole. Viability relates largely to the affordability of the service. Municipalities depend largely on the income received from customers and this must be sufficient to cover the cost of providing the service. Higher levels of service are generally associated with higher costs, for which customers must pay more. If higher levels of service are not affordable, the ability of a municipality to recover its costs is negatively affected, threatening the revenue base and the financial sustainability of the municipality. It should be noted that historically, the MIG provides funding only up to a “basic level of service”, with specific conditions as specified under the MIG conditions. However, experience has shown the need to reconsider the concept of a higher “basic level”, as substantiated by adequate technology assessment and motivation, and achievable in terms of the viability of the chosen service level. The focus has shifted from the provision of basic services to the provision of sustainable services, which ensures growth and development of communities, both in terms of economical- and quality of living parameters. Funding and financing of infrastructure relate to the entire life cycle of infrastructure development and to the life expectancy of infrastructure durability. For this reason, the Industry Guide considers and addresses all major types of municipal infrastructure, beyond the ambit of the conventional “basic levels” of infrastructure. MIG, in its current maturity, can be viewed as the ‘stepping stone’ from basic infrastructure planning, funding and financing to comprehensive integrated capital investment and infrastructure planning, development and management. With the introduction of the MIG, the use of labour intensive methods for certain types of infrastructure had been

Page 13 of 228
made mandatory. This is in line with the Expanded Public Works Programme (EPWP), which aims to maximize job creation through government expenditure. The use of labour intensive methods does not affect the level of service choices of services delivered. The Department of Public Works has issued “Guidelines on the implementation of labour intensive infrastructure projects under the EPWP” and municipalities are required to adhere to these guidelines for projects funded through the MIG. 3 REVISED GUIDELINE: OBJECTIVE AND PURPOSE 3.1 Objective The objective of the report “An Industry Guide: Infrastructure Service Levels and Unit Costs” is to provide an updated and reviewed version of the 2005 “Basic Levels of Services and Unit Costs: A Guide to Municipalities”. This revised version has the following objectives:
To define and describe the various types of infrastructure that may qualify for MIG funding; To provide (updated) options of Levels of Services (LOS) as associated with each infrastructure type; To provide an average unit cost for each of the defined LOS, with due consideration of the predetermined
national policy and parameters; To provide actual and current unit costs for the individual infrastructure components; To provide such unit costs for bulk- and connector/reticulation infrastructure / services, separately; To compare price trends and differences for the respective Provinces / Regions within South Africa by
providing: o National: average unit cost considering national characteristics and needs o Provincial: typical unit costs reflecting the characteristics of the province o Scheme level: typical unit costs for different scheme types o Component level: typical unit costs of individual infrastructure components
To provide a comprehensive reference base for further and more detailed data and information, regarding infrastructure and its related industry, norms and specifications, costs, escalation figures, trends and projections.
The report targets the following users: Public Sector:
Local Government - Municipal Project Management Unit (PMU) Managers. Local Government - Municipal Technical Managers. Local Government - Municipal Political Infrastructure Portfolio Leaders. Provincial Government: Executives and Managers in MIG and Infrastructure Planning and Implementation. National Government: Executives and Managers and MIG and Infrastructure Policy and Regulation.
Private Sector: Professional Engineers, Consultants and Project Managers. Service Providers in the construction and building industry.
Civil Society: Stakeholders in Infrastructure and Implementing Agents in Infrastructure Development.
The public sector, as related with the MIG programme include the national departments and their provincial counterparts, who are directly contributing and adding value to the municipal infrastructure programmes. The public sector supports, guide and/or regulate at any given interface of the project life cycle, which may include early

Page 14 of 228
inception or conceptualization, planning, design, implementation, operation and maintenance, monitoring, evaluation and reporting phases of infrastructure projects - as implemented by municipalities nationally. The Public Sector Departments include (with its respective provincial counterparts):
Department of Provincial and Local Government (dplg) South African Local Government Association (SALGA) National Treasury (NT) Department of Water Affairs and Forestry (DWAF) Department of Public Works (PW) Sports and Recreation South Africa (SRSA) Department of Environmental Affairs and Tourism (DEAT) Department of Minerals and Energy (DME) Department of Transport (DT) Department of Housing (DH) Department of Health (DoH) Department of Social Development
3.2 Purpose The purpose of the revised Industry Guide is to provide a relevant, current and practical nation-wide system of guidance for municipalities in terms of the provision of weighted basic infrastructure service provision cost values that reflect national and regional trends of current development and economies in South Africa, and also where possible, follow specific trends and developments. The publication aims to provide a sterilized, user-friendly guide to plan for the most appropriate infrastructure and Levels of Sevice, and to cost accordingly within the MIG (or other capital investment) programme/s, within the IDP and MTEF frameworks. 3.3 Methodology A Sectoral Questionnaire was developed and distributed to obtain the specialist cost differentiation, from the relevant stakeholders and specialists. Limited information was returned thereby necessitating the need to extent research to include various approaches. A zero-based (tender-type ‘bill of quantities”) approach was followed to determine the sub-cost elements, and costs that contribute, which amount to the final unit cost per Level of Services, respectively. The principle applied was that for any given output, the unit costs figures would only be regarded as “factual” and reflecting the actual status of costs if at least 2 – 3 independent sources would result in similar unit cost figures. To verify and check the final unit cost as derived from the above approach, a number of Sectoral, Specialist, Institutional and Industry Stakeholders were identified and consulted (refer to the Acknowledgement Page). The actual costs and rates were collected and/or verified from a range of resources, which core business relates to infrastructure development and/or materials and plant provision and/or planning, design, costing and management:
Professional engineers; Project management- or development consultants; Civil and building contractors; MIG and national MIS National, Provincial and Local Government: Plant hire / equipment suppliers; Manufacturers / suppliers of material; and Financial / academic / research institutions;
Note: The interviews indicated that there are fairly extensive changes that will be happening within the health /
municipal responsibilities in the near future, also that new guidelines are being finalized with DoH, which may impact on the MIG guidelines. As these processes have not been concluded these changes / impacts could thus not be accommodated for in the current guideline.
Technical Specifications: The revised report allowed for the inclusion of services and options which were not specifically dealt with in the 2005 Guideline:
Bulk infrastructure is separated from the connector and internal reticulation services to allow for separate

Page 15 of 228
costing and/or planning; Water and sewer pumpstations have been added and are separately specified and costed; Stormwater and roads were separated; Boreholes were added; Roads infrastructure has been expanded to cover a broader area, including related infrastructure as
separate unit costs (stormwater drainage, pipe culverts, box culverts, low level stream crossings, bridges) Ablutions facilities at taxi ranks, shelters, services associated with temporary housing projects were included
in the report and costed accordingly; Wastewater treatment facilities were costed and added to the services categories; Water treatment and facilities were added to the services categories; The breakdown of each infrastructure type was done by considering the respective phases associated with
the entire lifecycle of MIG or infrastructure development which makes up the total project cost, to include feasibility studies, P&G, materials, labour, plant, fuel, professional services and retention. ; and
A Flow Chart has been developed to assist the user to make optimal use of the Guide (refer 3.5); and Each level of service reflects the status of costs per region / province.
Note: The document does not deal with operations and maintenance costing or related aspects.
Assumptions in development of infrastructure costs:
Application of escalation factors to different contract types as per the SAFCEC categories. This is based on the indices as published by SAFCEC for the purposes of calculating escalation on a contract.
Labour indexes is given and used per Province. On average, it appears as if there is an increase in excess of 20% and for this reason, labour costs impacts significantly on unit costs 2007/08 when compared to 2005.
The data sheets that contain and reflect current costs, are based on actual project values – researched and collected over the last quarter of 2006 and first two quarters of 2007.
Plant and material rates: The general approach and guideline design followed was:
Gauteng is used as base province and factors incorporated to reflect regional costs based on Gauteng value of 1.0.
All rates and prices exclude VAT at 14% and professional fees at ESCA rates. All rates and prices obtained from suppliers are ‘bin’ rates and transport costs were calculated and
incorporated as regional averages. Most rates and prices were obtained for one major center in each province only - as can be seen from the
schedules (Appendixes), where the city/town has been indicated. From the averages calculated, it is noted that there is a prominent trend and need for provincial adjustment
and premiums. Some provincial price differences are significant e.g. 20% between the highest and lowest of cement prices,
etc. A more detailed breakdown of the escalation factors and indexes are provided in Appendix 1.
Escalation of Cost Indices from 2004 to 2007
R 100R 125R 150R 175R 200R 225R 250R 275R 300R 325R 350
EC FS GT
KZN
LM MP
NC
NW
WC
PLA
NT
INDEX
MATERIA
L
INDEX
FUEL
INDEX
Labour Indices per Province
CurrentCosts Feb2007Base Costs Dec 2004

Page 16 of 228
3.4 Reference Date And Future Revision Costs in this publication are reflecting industry prices and rates obtained between November 2006 and August 2007. Should this publication not be updated in the near future, users may escalate the costs by the published Production Price Index (PPI) for civil engineering. This can be obtained from Statistics South Africa, Tel: (012) 310-8600, Fax: (012) 310-8500, Email: [email protected] or Statistics South Africa - Home. The Industry Insight Building Cost Index (IIBCI) is also another convenient resource of market developments and price adjustments and can be found at www.industryinsight.co.za or Tel: (011) 431 3691. More detailed reference or background detail could be found under the detailed tables provided as “Appendices” to this report, or under the references listed under “Sources and References”.
ESCALATION FACTORS FOR LABOUR, PLANT, MATERIAL AND FUEL
0.17
0.18
0.19
0.20
0.21
0.22
0.23
0.24
0.25
0.26EC FS GT
KZN LM MP
NC
NW
WC
Provinces
Esca
latio
n Fa
ctor
1. Earthworks (with Culverts andDrainage)
2. General Civil Engineering Work -2/3 Earthworks; 1/3 Concrete
3. Concrete Work
4.1 Roadwork
4.2 Concrete Structures
4.3 Township Roads and Services
4.4 Premix Surfacing andRehabilitat ion
5. Water and Sewerge Ret iculat ion,Reservoirs and Engineering Work

Page 17 of 228
3.5 Use of the Industry Guide MIG PROGRAMME
FLOW CHART: ANALYSIS OF PROJECT BUDGET (FC1)
FC3
FC4
Start
Is water required?
Is sanitation required?
Is roads required?
Is stormwater management
required?
Add different component cost for total project budget.
Read Section
6.1
FC2
Raw water supply?
Refer to part 6.1.9.3.8
Water treatment works?
Bulk and Connector services?
Residential water supply?
Borehole water supply?
Refer to part 6.1.9.1
Refer to part 6.1.8.3
Refer to part 6.1.7
Refer to part 6.1.9.3.8
NO
NO
NO
YES
NO
YES
YES
YES
NO
NO
NO
NO
NO
YES
YES
YES
YES
YES

Page 18 of 228
MIG PROGRAMME FLOW CHART: ANALYSIS OF PROJECT BUDGET
(FC2)
Start
Is water required?
Is sanitation required?
Is roads required?
Is stormwater management
required?
Add different component cost for total project budget.
Read Section
6.2
Wastewater treatment works?
FC3
FC4
Refer to part 6.2.12.1
Sewer pumpstation?
Bulk and Connector
sewer?
Household Sanitation?
Is there sufficient water
supply?
Refer to part 6.2.11
Refer to part 6.2.9
Refer to part 6.2.8
Return to water supply FC1.
FC1
NO
NO
NO
YES
NO
YES
YES
YES
NO
NO
NO
NO
YES
YES
YES
YES
NO
YES

Page 19 of 228
MIG PROGRAMME FLOW CHART: ANALYSIS OF PROJECT BUDGET
(FC3)
Start
Is water required?
Is sanitation required?
Is roads required?
Is stormwater management
required?
Add different component cost for total project budget.
Read Section
6.3
FC2
Road works? FC1
FC4
Refer to part 6.3.8
Stormwater requirements? Return to stormwater
management FC4.
NO
NO
NO
YES
NO
YES
YES
YES
NO
NO
YES
YES

Page 20 of 228
MIG PROGRAMME FLOW CHART: ANALYSIS OF PROJECT BUDGET
(FC4)
NO
NO
NO
Side drains?
Pipe drains and box culverts?
Low-level stream
crossings?
NO
NO
NO
NO
Start
Is water required?
Is sanitation required?
Is roads required?
Is stormwater management
required?
Add different component cost for total project budget.
YES
YES
YES
YES Read Section
6.4
FC2
FC1
FC3
Refer to part 6.4.8 YES
YES
YES Refer to part 6.4.8
Refer to part 6.4.8

Page 21 of 228
4 GENERAL CONSIDERATIONS IN INFRASTRUCTURE PLANNING 4.1 Integrated Asset Management And MIG The year 2007 will be seen as a shift in focus towards more comprehensive integrated capital investment and infrastructure planning, development and management. The rational for this is that historically the Infrastructure Delivery Cycle covers the same timeframes as that of the Budget Cycle (MTEF – 3 yrs) and includes the various phases of planning, implementation and commissioning. However, the planning of such infrastructure, as well as the number of role-players involved in the delivery of infrastructure, often requires that the planning, design and tendering phases of delivery normally take place in excess of one year, depending on the nature and type of project. The status quo situation indicates that insufficient time is allocated for the full “MIG cycle”, which is also the root cause of the fourth quarter expenditure spike in the national financial year span. With such approach, it means that there is often less than one year remaining for implementation of the projects. Such unrealistic planning and timeframes invariably leads to under-expenditure, projects not completed within the planned timeframes, and funds being rolled over to new financial years. This is often coupled with confusion between the client departments and their implementing agents as to the detailed clarity of what needs to be delivered and when it should be delivered, by whom and at what cost it should be delivered as well as by when it should be delivered. The Infrastructure Delivery Improvement Programme (IDIP) under the jurisdiction of the Department of National Treasury introduced the following changes to the Infrastructure Delivery Cycle:
That the Infrastructure Delivery Cycle be amended to include the Infrastructure Programme Management Plan (IPMP), the Infrastructure Programme Implementation Plan (IPIP), and the Service Delivery Agreement (SDA - in which all parties agree to exactly what needs to be done, where, by whom, when, and at what cost), and that these plans be made mandatory for all departments.
That the timeframes of the Infrastructure Delivery Cycle be amended to allow for the alignment of the Infrastructure Delivery Cycle with the Budget Cycle so that departmental budgets are informed by actual projects.
That best practice budgeting processes be adopted so that budgets for large projects are appropriately committed across the duration of the project.
A Cabinet meeting (Cape Town, 21 February 2007), resolved:
A framework to align infrastructure delivery cycles with the Medium Term Expenditure Framework (MTEF)
budget cycle in order to improve planning, implementation and better cash-flow management that would, among other things, deal with the fourth quarter expenditure spike.
The framework is to accommodate the long lead time before infrastructure projects reach the construction stage. The infrastructure delivery cycle will be amended to include an Infrastructure Programme Management Plan (IPMP) and an Infrastructure Programme Implementation Plan (IPIP) which will be mandatory for all departments.
Best practice approaches will be adopted to include budget cycles that commit funds for the duration of the project without leading to the so-called roll-overs. This framework will require the appointment of appropriately skilled built-environment professionals across all relevant departments, provinces and local government.
This would imply that municipalities should undertake infrastructure asset management planning and infrastructure investment planning processes in order to determine the long-term consequences of capital investment including operations and maintenance and the implications to the beneficiaries. This process should link a number of variables such as the service profile of a community, household profiles, socio-economic profile, infrastructure backlogs and growth, reticulation, bulk and connector costs, capital costs, capital budget and operational budgets and household bills. The consequences of capital investment and the implications to the beneficiaries should also be aligned with the tariff structure of municipalities. All municipalities should develop the CIP's as outputs of the asset management and infrastructure investment planning processes. (Ref: ii: Department of Provincial and Local Government: Guidelines: Multi-dimensional targeted approach to support municipalities on infrastructure services delivery, Applicable from 1 April 2007.) 4.2 Market Factors Impacting On Civil And Building Services: South African literature and studies indicate that there are four key drivers of future construction activity:
• Economic growth;

Page 22 of 228
2006-2009
Government capital expenditure and
infrastructure maintenance (Total of ZAR 372 billion)
National ZAR 31.9 Billion 9%
Provincial ZAR 108.9 Billion 29%
Municipalities ZAR 81.8 Billion 22%
Other public institutions ZAR 26.0 Billion 7%
Public enterprises ZAR 123.4 Billion
Source: Budget Review 2006
• Savings; • Government economic policies; and • Institutional health (degree to which organizations / state institutions function and are able to implement state
policies and spend allocated state expenditure budgets) Aveng’s (previously Anglo-Vaal Engineering) Market Review (2007) makes the following comment on the South African Construction Industry: “As a result of the recent sustained period of economic growth, fiscal and monetary stability and improved international profile, together with the concomitant downstream benefits in respect of spending, tourism, home building, it has become evident that the country’s ageing infrastructure cannot cope. Congested roads and harbors, inadequate telecommunication capability, power outages, sewer water spills are everyday occurrences. The recently announced infrastructure development programme of government and major public corporations is both opportune and critically needed to ensure that economic growth targets above 4% and possibly up to 6% per year can be achieved. The programme involves spending by all tiers of government (50% by provinces and municipalities) and high profile corporations such as Eskom, TransNet and ACSA. Given that a similar investment effort is expected from the private sector, the country is poised to enter into a healthy construction cycle. Public sector investment, in addition to high-profile projects such as Gau-Train and WC 2010 Soccer stadiums span all major infrastructure sectors, with road, rail, harbor and electricity infrastructure being prominent. At this stage capital formation data suggests that implementation and rollout amongst public corporations has picked up, but that government capital spending is still lagging. Also, civil engineering industry data suggests that significantly higher annual turnovers will only be realized in the years following 2006. The South African construction market is estimated at ZAR100 billion. In the event that investment targets are achieved, this sector could double in size over the next decade. There are many positive stimuli for the broader construction sector, and business confidence indicators show that South Africa is in an upward cycle, following relatively subdued increases in building material prices during the preceding period of industry stagnation. The recent price increases above CPIX or overall PPI are regarded as an inevitable correction. It has allowed suppliers to earn reasonable returns on risk and capital employed. Examples of high material price increases are evident in bricks, cement and structural steel products. With the exception of bricks in selected areas, availability of most building materials have not experienced a significant shortage to date. Other factors that frequently constrain developments include transport congestion, overly comprehensive environmental impact assessment processes, availability of serviced land and lack of artisans and other skilled labour. The construction industry has proved to be adept in dealing with capacity constraints in the past and will do so again. The industry can look forward to real growth in excess of 8% in both 2007 and 2008. The impetus for growing the

Page 23 of 228
industry at this rate is largely in Government’s hands. This growth rate has to be maintained for seven years to realize the goal of increasing the total capital formation to GDP ratio to 25% by 2014.” This view is supported by SAFCEC 1st Quarter report for 2007, as shown below. “The Baxter contract price adjustment formula (CPAF) reflects an annual inflation of just over 8.17% in the composite price index up to December 2006. Contributing to the indices are the stronger rand affecting imported goods in particular new plant as well as much lower inflation affecting the escalation in living costs. Forecasts are based on the following benchmark assumptions:
• R/$ will average R7.45 during 2007; • The crude oil price will average 59US$ in 2007; • CPI inflation will average 6.4% in 2007; and • PPI inflation will average 6.3% in 2007.”
The table below illustrates the forecasts for the four independent indices as well as the general composite index on a quarterly basis. The overall composite civil engineering escalation index is expected to average by 5.5% during 2007. The table below indicates the Indices Forecast for 2007 (provisional figures):
The proxy indicators used above to forecast does not take the potential surge in demand into consideration. The labour index as an example follows CPI (living costs) and does not represent the surge in demand for existing human resources and the accompanying premium which can be up to 30%. Historically the indices are underperforming and have been found to under perform by 50% if compared to effective increase in some input factors (Ref xxix). 4.3 Labour Intensive Construction Methods And The EPWP EPWP is a national government initiative aimed at drawing a significant number of employed people into productive work. Its conceptualization gained recognition after the programme started on the 1st April 2004, following the cabinet agreements in November 2003. EPWP has been incorporated by four sectors - environmental, economic, infrastructural and social sectors. EPWP ‘s strategy is to create work opportunities coupled with training to ensure that workers gains skills while they work, and increase their capacity to earn an income in the future. A target was set as a minimum of one million people by 2009 - being trained, developed and sharing/part of work opportunities. It is possible to use labour intensive methods in the construction of all the categories of infrastructure included in

Page 24 of 228
this document. However, it is advised that a project is divided into phases with specific phases earmarked for EPWP whilst other phase may be less suitable for LIC methods. The potential for the inclusion of labour intensive methods is greatest in the construction of:
Roads: rural roads and local municipal roads Water and sewer pipelines, specifically the trenching activities involved in the provision of water and
sanitation services Stormwater drainage Sidewalks
It is therefore mandatory that these types of infrastructure and activities are executed labour intensively in accordance with the EPWP Guidelines issued by the Department of Public Works, when funded through the MIG. The scaling up of the EPWP initiative in the roads sector aims to direct additional funds to such programmes and is structured to also act as an incentive for provinces to increase their contribution to the EPWP by allocating additional funds to those who are performing well. Because the EPWP cross cuts sectors and departments, there is no set EPWP rate. For the Infrastructure sector, there is no single set rate of pay. Municipalities and provinces must be guided by the prevailing minimum wage in the area and on-going poverty-relief projects. The aim is not to displace workers from existing employment to new EPWP projects. Allowance is made for EPWP projects to pay below the minimum wage as Gazetted in the Code of Good Practice for Employment under the Special Public Works Programme. 4.4 Financial Arrangements For Infrastructure 4.4.1 Costs The starting point in dealing with financial arrangements is cost, both capital and on-going operating and maintenance costs. As mentioned, these costs need to be calculated for particular circumstances and may differ from area to area within a municipality. Infrastructure cost can vary significantly and for this reason this report has the functionality as a Guideline (as opposed to a Specification or Standard). The main factors that impacts on unit costs are: • Topography:
Physical features such as: Terrain (slope) – ranging from flat to mountainous and/or combinations thereof and existing physical features, e.g. natural, infrastructure.
• Geology and Geotechnical considerations: Soil characteristics such as soil types – cohesive & non-cohesive, soil conditions – soft to hard, rock, and where applicable borrow pit/s & spoil/dump/disposal site/s and local/ in-situ materials.
• Hydrology: Drainage characteristics, i.e. sub-surface & surface in terms of drainage and stormwater requirements and where applicable water sources and access.
• Context/ Locality of the project: Aspects such as accessibility to site – rural (remoteness) or urban (built environment); working space; security; availability and accessibility of local resources; climate - rain, dust (dry, wind), season (hot, cold).
• Environment: Environmental considerations: erosion control and rehabilitation measures; borrow pit/s & spoil/dump/disposal site/s; ecologically sensitive areas/s, traditional site/s, historical zones; protection of water, soils and vegetation.
• Labour: Availability of local people (unskilled to skilled), local sub-contractors, and small emerging contractors.
• Other aspects: Aspects such as distance to travel to site, transportation requirements, accredited or non-accredited training requirements (including for EPWP); task/ production rates for LIC work items and published wage schedules; wage rate (unskilled/semi-skilled) varies anywhere between government gazettes and the Industry’s minimum wage rates respectively – also varies per Province and whether in rural or urban context.
It therefore needs to be recognized and accepted that, in the case of both capital costs and monthly charges, there exist great variation in amounts at a National level, between different provinces and municipalities, and even within municipal boundaries.

Page 25 of 228
Case example to illustrate the above: The impact of such factors such as topography, location, climate, etc can be illustrated in the example of a community road (14m width, including sidewalk) in eThekwini Metro (KZN). The extremely undulating terrain, requiring extensive cut and fill in addition to a lengthy low water bridge river crossing had as an average cost/km an amount of R 19,179,408.85, compared to the national average for a chip & spray (width 4.5-6m = R1,128,155.00 / km) which if extrapolated to a 14m width indicates a cost of R 2,632,362.00. This would indicate an increase differential of around 7 times that of the average cost.
Cost benchmarks are often required for different purposes and at different levels of detail. They serve primarily as a reference or check for evaluation of conceptual project plans and project proposals. They can also be useful references for regional and national budgeting and strategic planning. However, such figures should not be used for detailed cost calculations in feasibility studies or business plans. For such purposes, site specific design information and material costs should be gathered ad prepared. Figures provided in this document are intended only to give an indication of current costs and charges and possible deviations and would include Preliminary and General (P&G's), but exclude professional fees and VAT at 14%. Where possible the following summary levels have been included in the document:
• National: average unit cost considering national characteristics and needs • Provincial: typical unit costs reflecting the characteristics of the province • Scheme level: typical unit costs for different scheme types • Component level: typical unit costs of individual infrastructure components.
Most of the services listed within the document resort from a legislative authority aspect under different structures or government departments. In many cases, each of these legislative authorities have developed detailed norms, standards and design conditions for these services. Where possible, these standards and or links to existing specifications have been included in this document, for readers who may need greater detail.
4.4.2 Management Cost Factors:
Often the estimated capital costs of the works reflect the costs of the materials and the costs of constructing the various components of the particular infrastructure scheme. This would imply that various cost escalating factors such as topography, soil conditions, remoteness, availability of contractors and security have been accounted for. However, the actual final cost of a project, (i.e. water supply scheme) may be almost double the estimated capital cost in view of additional expenses incurred in terms of: • Institutional & Social Development • Professional fees in terms of feasibility studies, design and construction supervision • P & G’s for contractors establishment • Contingencies for unforeseen expenses • VAT at 14%
4.4.2.1 Institutional and Social Development:
Historically little provision has been made for the social project costs that are incurred and bitter experience has shown that if this component is neglected, the sustainability of the project is in jeopardy. Institutional and social development cost need to be recognized as an intrinsic part of the project cost, specifically water and sanitation related projects, and includes such aspects as:
Pre-Project Implementation:
o Community consultation and mobilization. o Social surveys (including skills, income, willingness to pay & perception / expectations).
Post-Project Implementation: o health education (including sanitation health awareness, water conservation and demand
management). o operations training (including infrastructure operation, cost recovery and administration). o monitoring and evaluation (including customer satisfaction, leakage detection, fault reporting, etc). o running cost of customer services.
The post-implementation cost factors can be seen to be part of the on-going operational cost and as such should be included in setting of the water and sanitation tariff, trade-effluent charges and bulk services contributions or

Page 26 of 228
levies. The municipal bylaws should reflect these and be updated to stay current with new infrastructure or policy development. 4.4.2.2 Professional Fees: The focus of this section is mainly in terms of Professional Fees as these relate to feasibility studies, design, tender preparation, construction supervision and project management. The Engineering Council of South Africa (ECSA) issued a guideline in Board Notice 30 of 2007: “Guideline Scope of Services and Tariff of Fees for Persons Registered in terms of the Engineering Profession Act, 2000, (Act No.46 of 2000)” (Ref xxvi). The commencement date of these Rules shall be 1 April 2007 and any amount mentioned in or fee calculated in terms of this Schedule is exclusive of VAT. The following insight is provided as to the determining of professional fees: Fees for Normal Services: Civil and Structural Engineering Services pertaining to Engineering Projects. (1) The basic fee for normal services in the disciplines of civil and structural engineering, pertaining to
Engineering Projects, is determined from the table below. The fee is the sum of the primary fee and the secondary fee applicable to the specific cost of the works in respect of which the services were rendered on the project excluding the report stage which shall be reimbursed on a time basis.
Cost of the Works Basis of Fee Calculation
For projects up to R 366 000 A Lump Sum or on a Time Basis Where the cost of the works:
Exceeds But does not exceed
Primary Fee Secondary Fee
R 366,000 R 993,000 R 45,750 12,5% on the balance over R 366,000 R 993,000 R 4,964,000 R 124,130 10,0% on the balance over R 993,000
R 4,964,000 R 18,549,000 R 521230 8,0% on the balance over R 4,964,000 R 18,549,000 R 74,195,000 R 1,608,030 6,0% on the balance over R 18,549,000 R 74,195,000 R 303,050,000 R 4,946,790 5,5% on the balance over R 74,195,000
R 303,050,000 R 17,533,810 5,0% on the balance over R 303,050,000 (2) The following additional fee shall be applicable to the value of the reinforced concrete and structural steel
portions of the works, inclusive of the costs of concrete, reinforcing, formwork, structural steel work and any pro-rata preliminary and general amounts. Where structures of identical design are repeated on the same project, the combined costs shall be cumulated for the determination of the cost of the reinforced concrete and structural steel works. In cases where structures require individual design, a separate additional fee shall be calculated for each structure based on the cost of the reinforced concrete and/or structural steel work for that particular structure. The additional fee is the sum of the primary fee and the secondary fee applicable to the specific cost of the works in respect of which the services were rendered on the project.
Cost of the Works Basis of Fee Calculation
For projects up to R 366 000 A Lump Sum or on a Time Basis Where the cost of the works:
Exceeds But does not exceed
Primary Fee Secondary fee
R 366,000 R 3,396,000 R 187,300 5,0% on the balance over R 366,000 R 3,396,000 R 9,4875,000 R 169,800 4,0% on the balance over R 3,396,000 R 9,875,000 R 33,440,000 R 428,960 2,65% on the balance over R 9,875,000
R 33,440,000 R 1,053,430 1,65% on the balance over R 33,440,000 (3) To calculate the fee for railway track work in terms of this item, 50 percent of the cost of the permanent way
materials is excluded from the cost of the works, but the full cost of ballast and equipment specially designed by the consultant is included in the cost of the works.

Page 27 of 228
(4) For normal services relating to a description of the works mentioned in the first column of the following table, the proportion of the basic fee relating to the specific item (as calculated in terms of clause 3.2.1(1) and 3.2.1(2) of the guidelines) is multiplied by the category factor mentioned against that description in the second column of the table. In case more than one of the descriptions below applies, the effective factor will be the product of the factors involved, except for the fee for targeted procurement.
(5) These factors do not apply when fees are a lump sum or on a time basis.
(6) In the case of road works, where the road traverses both rural and urban areas, an adjustment pro-rata to the length of road in rural and urban area should be made.
(7) In the case of road rehabilitation a combination of factors applies depending on the situation of the road (rural or urban) and the category factor for alterations to existing works.
Description of the Works
Factor by which basic fee is multiplied
Rural roads (single carriageways), excluding bridges. 0,85 Rural freeways and dual carriageways, excluding bridges. 0,95 Freeways and dual carriageways through existing peri-urban areas, excluding bridges.
1,00
Single Carriageways through existing urban areas. 1.00 Freeways and dual carriageways through existing urban areas. 1,25 Gravel roads: Primary roads Secondary roads Informal roads
1,25 to 1,50 1,00 to 1,25 0,75 to 1,00
Water and wastewater treatment works. 1,25 Services (Excluding roads) for existing informal settlements including roads and to reduced standards or supplies.
1,25 to 1,50
Water and sanitation in rural areas. 1,35 Alterations to existing works. (Only applicable to the fees on the portion or section of works affected)
1,25
Mass concrete foundations, brickwork and cladding designed and detailed by the consulting engineer. (Only applicable to the design portion of the fees on such works)
0,33
Duplication of works (Only applicable to the design portion of the fees on duplicated works) 0,25
Targeted procurement. (Additional fee based on the basic fees before the application of any of the other factors)
0, 07
4.4.2.3 P & G’s For Contractors Establishment:
Preliminary and General (P & G) cost items are based on a percentage of the total capital cost of the project excluding VAT, contingencies, professional fees, relocations and land acquisition. The purpose of preliminaries is to describe the works as a whole, and to specify general conditions and requirements for their execution, including such things as sub-contracting, approvals, testing and completion. Preliminaries relate to the cost-significant items required by the method and particular circumstances under which the work is to be carried out, and those costs concerned with the whole of the works rather than just Work Sections. These costs may either be ‘once-off’ fixed costs, such as the cost of bringing to site and erecting site accommodation (and subsequent removal) or time-related, such as the heating, lighting and maintenance cost for that accommodation. Experience has shown that, in general, higher P&G’s are expected in rural areas as apposed to urban or home-based contracts. Contractors who are home-based, or are already established (project phase 2 or 3) or projects expanded - also have the benefit of offering low P&G’s as a distinct advantage over contractors who need to establish site from zero or from another area/region.

Page 28 of 228
Below is an ‘indication’ of the typical P&G’s as related to various infrastructure schemes and project value:
P & G (%) FOR PROJECT SIZE RANGE CAPITAL COST RANGE IN RANDS X 1 000
COMPONENT
0 -200 200 - 600 600 - 1 500 1 500 - 5 000 >5 000 Reticulation 30 25 22 20 18 Reservoirs 30 25 22 20 18 Bulk pipelines 25 22 20 18 15 Pumpstations 25 22 20 20 18 Treatment works 30 25 22 20 18 Dams and weirs 30 25 22 20 18 Boreholes 5 4 3 2 2 Power supply 25 18 15 10 5
4.4.3 Grants And Subsidies
To assist households and municipalities in covering the capital cost of providing services, grants are made available by national and provincial government, the most important being the Equitable Share subsidy and the Municipal Infrastructure Grant (MIG). The emphasis of these grants is on assisting poorer households to gain access to at least a basic level of service. In addition, some municipalities receive inter-governmental grants that subsidize operating costs for certain services. These need to be taken into account. Subsidies also need to be built into the system at local level through tariffs, with wealthier residents paying more for certain services. There is a responsible limit to how much local cross-subsidies can be applied before wealthier residents and businesses move out of an area.
4.4.4 Loans For those capital costs not covered by grants, municipalities generally need to take out loans from private financial institutions, which have to be repaid over a specified period of time with interest and loan redemption costs covered by the income raised by the municipality.
4.4.5 Raising Income The on-going viability of the municipality mentioned previously means that sufficient income must be raised every month to cover the cost of operating the services and repaying the loans. This, in turn, means that customers must be charged appropriate tariffs for the services and that these tariffs should be paid timeously. 5 INFRASTRUCTURE CONSIDERATIONS 5.1 Rural Versus Urban These service option guidelines apply to both urban and rural conditions. Nevertheless, urban and rural situations differ and affect unit costs and applicability of service options directly. It is therefore not generally possible to provide the same level of service in all areas, primarily because the cost of services increases in rural areas, while incomes are usually lower. Basic and intermediate service levels therefore tend to be more appropriate in rural areas.

Page 29 of 228
The Municipal Infrastructure Investment Framework (MIIF), which is part of this publication series, covers service backlogs, the assessment of capital costs to address the backlogs, recurrent costs for operating and maintaining services, the financing framework, methods of enhancing the institutional ability of municipalities to ensure delivery of services, and suggestions concerning investments, and the management of municipal services to promote the development objectives specified in the RDP across the urban and rural spectrum.
The MIIF (2005) indicates that the capital costs incurred by a municipality are typically separated into internal, connector and bulk infrastructure costs:
Internal infrastructure costs include the costs of reticulation within the boundaries of townships; Connector costs relate to items such as the main pipelines, reservoirs, sewers and distribution roads which
connect the internal service to the bulk service; and The bulk infrastructure costs are those associated with the major roads, treated water supply, outfall
sewers and wastewater treatment works. Of note though is the impact that rural situation could have on the unit cost of a project, in the sense that provision of basic materials to site, often is substantially higher for the deep rural areas than the more accessible areas and as such can skew the cost substantially, i.e. provision of bags of cement to site can range from around an average cost of R46 /50 kg bag to as high as R67 /50 kg. When this situation applies it is recommended that a clear concise description of the circumstance be provided as motivation.

Page 30 of 228
5.2 The Meaning Of A “Basic” Level Of Service When describing levels of service, the term "basic level" refers to the level considered adequate to ensure the health and safety of its household users. It therefore provides cost-effective economic benefits in terms of the improved health of workers and families. A lower level often brings unacceptable health risks, if not appropriately used or maintained. Levels higher than the basic level represent increased convenience for service users. Health and safety benefits to the users may also increase, but this is not necessarily the case. Higher levels of services result in- and equal higher cost and user charges to the customer. 5.3 Making Up A Services “Package” Each of the services is dealt with separately in this document. However, the internal residential infrastructure associated with these services is generally delivered as part of a "package", including housing. The services therefore need to be matched and the total cost tailored to suit the requirements of the households that will receive the services, taking into consideration their ability to afford the "package". Municipalities generally strive to select a range of service packages which are suited to their local conditions and which suit the customers they serve. Over time, arrangements may be made for upgrading as the area develops and residents can afford to pay higher user charges. 5.4 Selection Of Appropriate Service Options: The selection of an appropriate service option (service package) takes place through a consultative process of between the customer (end-user who will receive the services) and the service provider (municipality that will provide them). The emphasis is on giving both the customer and service provider a choice in identifying the most appropriate service option. Such deliberation in selecting of an appropriate service package should reflect:
The specifics of an area, as particular conditions and associated costs vary from area to area; Customer requirements, each group of customers has different requirements; Broader community needs and benefits (economic and public health); Information about the capital costs of the service packages under consideration; The operating costs of these services. (Some Departments have developed or are in the process of
developing costing models); Clarity by the municipality about available subsidies, both local and from other spheres of government; Clarity by the customer for the costs for which they are accountable, both capital and on-going monthly
payments. These costs should also be suited to customers’ household incomes to ensure affordability and sustainability; and
Consideration of the natural resource constraints and the potential environmental impact. 5.5 Service Delivery: The Implementation Arrangements Service delivery will differ for new infrastructure, upgrading of service options, and bulk and connector infrastructure. Of note is that historical programmes and projects would have focused on assisting as many people as quickly as possible. For this rationale, the beneficiary communities were often selected on ease of access and easiness in providing services. However, as more people are being serviced, the more far-reached or difficult-accessible communities’ needs are being addressed, resulting in more difficult and costly service provision. The ‘per capita’ cost of servicing the remainder communities is therefore likely to be increasing over the next few years.
5.6 New Infrastructure In Urban Areas: Relationship To Housing With regard to new infrastructure in urban areas, internal services in the neighbourhood are generally provided together with housing. Funding arrangements for such internal infrastructure are also associated with the provision of housing, with capital costs typically included in the selling price of a housing package. Individual households generally face only the capital cost of the internal services, whether they pay these themselves or use part of the housing subsidy for finance. However, each level of service may have different requirements for bulk and connector services supplied by the municipality.

Page 31 of 228
5.7 New Infrastructure In Rural Areas
In rural areas less emphasis is placed on housing and new infrastructure is often provided independently for each service rather than as a "package". Arrangements for each service are often established by national departments, non-governmental organizations or parastatal bodies (e.g. Water Boards, Eskom). 5.8 Upgrading Particular services may be upgraded, refurbished or retrofitted separately or together with a number of services for a particular area. 5.9 Bulk And Connector Infrastructure Historically, the focus was on internal infrastructure development, with less emphasis given to the important impact that the various service level decisions have on bulk and connector infrastructure requirements. For example, lack of spare capacity in water or wastewater treatment works, or a main electrical sub-station could be a major cost factor, but is essential to balance the demand-supply scenario associated with new housing development with full level internal services, etc. For more information on the overall implications of infrastructure financing, the Municipal Infrastructure Investment Framework (MIIF) should be consulted. 5.10 Community Service Infrastructure It is also important for municipalities to provide ancillary facilities and services, such as solid waste disposal, cemeteries, community and sports facilities. These ancillary facilities and services ensure the necessary supporting infrastructure, which is essential to community life and contributes substantially to ensuring a well-balanced, stable society and an enhanced quality of life. 5.11 Understanding Operation And Maintenance Factors The selection of service levels and packages involves not only the initial provision of these services, but also operation and maintenance for many decades after their installation. In selecting service levels, the on-going management implications and costs must therefore be carefully considered. It is important that the operating and maintenance requirements should suit the capacity of the municipality responsible for the necessary work. If services are provided that are difficult to operate, the on-going viability of the service will be at risk owing to down time, leaving people without a service or causing damage to the environment. An example of the impact of O&M in such decision-making can be demonstrated in the context of the road standards in dense urban areas. Considering the extent of the road network required in a major metropolis, such as eThekwini, the cost of O&M and rehabilitation, due to constant use, terrain and climate, means that the use of gravel roads is unfeasible and as such all their municipal roads has as minimum standard that it needs to be an asphalt road. The initial additional capital cost is in whole offset against the saving in terms of long term O&M costs. 6 BASIC RESIDENTIAL INFRASTRUCTURE (B) 6.1 Water Supply 6.1.1 Definition Water Supply Services is defined as the abstraction from a water resource, conveyance, treatment, storage and distribution of potable water, water intended to be converted to potable water and water for industrial or other use, to consumers or other water services providers. This includes all the organizational arrangements necessary to ensure the provision of water supply services including, amongst others, appropriate health, hygiene and water-related awareness, the measurement of consumption and the associated billing, collection of revenue and consumer care. Water Services Authorities have a right, but not an obligation, to provide industrial water to industries within their area of jurisdiction.
The definition of water supply services is no longer restricted to the supply of potable water but includes all water supplied by- or on behalf of a water services authority. Potable water is water used for drinking or domestic purposes of a quality consistent with SABS 241 (Specifications for Drinking Water - as may be amended).

Page 32 of 228
6.1.2 Purpose Of Water Supply Infrastructure The Strategic Framework for Water Services of the Department of Water Affairs and Forestry (September 2003), defines a basic water supply facility as “the infrastructure necessary to supply 25 liters of potable water per person per day within 200 meters of a household and with a minimum flow of 10 liters per minute (in case of communal water points) or 6 000 liters of potable water supplied per formal connection per month (in case of yard or house connections).” This would include the infrastructure necessary for the abstraction, conveyance, treatment and distribution of potable water, water intended to be converted to potable water or water for commercial use, but not water for industrial use. 6.1.3 Geographical Context The selection of the type of water supply service and infrastructure utilized is impacted upon by the geographical context. Geographical context impacts on a number of layers, such as physical location, site access, population settlement pattern and density, the economic and technical capacity of the available service providers and economic situation of the beneficiary community. Some of this had been described in section 5: Infrastructural Considerations, and will also be discussed in the sections following, specifically under the levels of service options. 6.1.4 Basic Level Of Service A basic water supply service is defined as “the provision of a basic water supply facility, the sustainable operation of the facility (available for at least 350 days per year and not interrupted for more than 48 consecutive hours per incident) and the communication of good water-use, hygiene and related practices.” The definitions of basic water supply facility and service are quite flexible, for example in the case of a water supply facility to provide for both a communal standpipe in the street within 200m or other innovations such as yard tank. Flexibility is there to promote development and use of alternative solutions to cost effective water and sanitation solutions In the case of dense urban settlements where waterborne sanitation is provided, the above-mentioned policy and service option will not be appropriate. The implication is that at lease a yard connection, but in most cases a house connection must be provided. 6.1.5 Level Of Service Options There is a range of water supply service options that generally fall below the minimum "RDP level". This includes unimproved traditional sources, tanker systems, and some forms of private water cartage and vending. These options are not discussed in this document. Only those levels that are at / above the minimum level are described, including:
communal standpipes - Basic level of service yard taps - Basic level of service yard tanks - Basic level of service small-bore systems – Intermediary level of service roof tanks - Intermediate level of service house connections - Full level of service
It is recognized that the cost of water supply services infrastructure can vary significantly, with changing site conditions and the economic climate. Furthermore, it would appear that cost estimate factors for water services development projects seldom use the same costing factors, planning norms and design criteria. Different municipalities have different standards and O&M norms, but this often leads to more expensive cost per capita, i.e. some Metropolitans demand that a Class 12 mPVC is used, versus other municipalities who accept Class 9, similarly with steel pipes and painting thicknesses, etc. All of these standards are based on the respective SANS specifications. However, in terms of whether it qualifies as a basic level option or how to account for this differentiation is open to interpretation and remains a debatable issue. The historic and current approach is to deal with those communities with dense populations, thereby providing services to as many as possible, but we are reaching a point where more far-flung communities must be served, sparse population requiring further reticulation and thus at a greater cost per capita than before. Cost differentiation needs to account for this.

Page 33 of 228
DWAF have developed a fairly extensive reference document for local authorities detailing typical unit costs: “Cost Benchmarks: Typical Unit Cost For Water Services Development Projects: A Guide for Local Authorities” (January 2003). Some of the summarized and adjusted information have been included in the sections following. The ultimate cost of a scheme is not just linked to the selected level of service option. The extent of the existing infrastructure or need for upgrading/expanding such infrastructure also has a significant effect on the cost of the service. Furthermore, most municipalities’ development is undertaken through water master plans that form part of their Water Services Development Plan (WSDP), which in itself form one of the cornerstones of the IDP. In line with this, DWAF therefore demand that municipalities undertake water services projects in a holistic manner. This would thus imply that a water services project is undertaken in phases, which often firstly include detailed feasibility studies, then the development of the bulk infrastructure to service the reticulation and finally the choice of level of service in terms of reticulation, which can vary within a scheme based on the community’s situation. Recognition is given for such a graduated project development in that the cost breakdown will be provided in components such as reticulation, connector services and bulk services, in the following manner:
Basic General Water Supply Reticulation (residential): Standpipes and communal taps Yard taps (on site sanitation) Yard taps (water borne sanitation) Yard tanks Roof tanks House connection (low income) House connection (high income) Connector Services: Water Supply Infrastructure: Reservoirs Pumpstations Supply Pipelines:
o 110 mm Ø o 160 mm Ø o 250 mm Ø
Bulk Services: Water Supply Infrastructure: Water Treatment Works Raw Water Storage Dams Boreholes Development
The detailed discussion of some of the components follows. a) Communal standpipes With this option, a single standpipe (often with a single tap) is shared by a number of households. The number of households per standpipe will depend on the density of dwellings in the settlement. A ratio of 25 households per tap is typical in an urban dense settlement, however it should be noted that that a sparse rural settlement pattern of the community (i.e. rural KZN) would imply that this would often substantially exceed the 200 m walking distance. In these cases a median ratio of 7 to 12 families per standpipe is more realistic. It is recommended that the decided upon ratio needs to be motivated in terms of the settlement pattern. Where the ratio is higher, the possibility of customers having to queue must be considered and several taps per standpipe may be better. Payment for access to water from public standpipes is critical and is associated with the level of service.
Water Supply & connector Bulk (R/hh)(Derived f rom Escalated Values)
R 7,340R 7,350R 7,360R 7,370R 7,380R 7,390R 7,400R 7,410
EC FS GT
KZN
LM MP
NC
NW
WC
Water Supply &connector Bulk (R/hh)
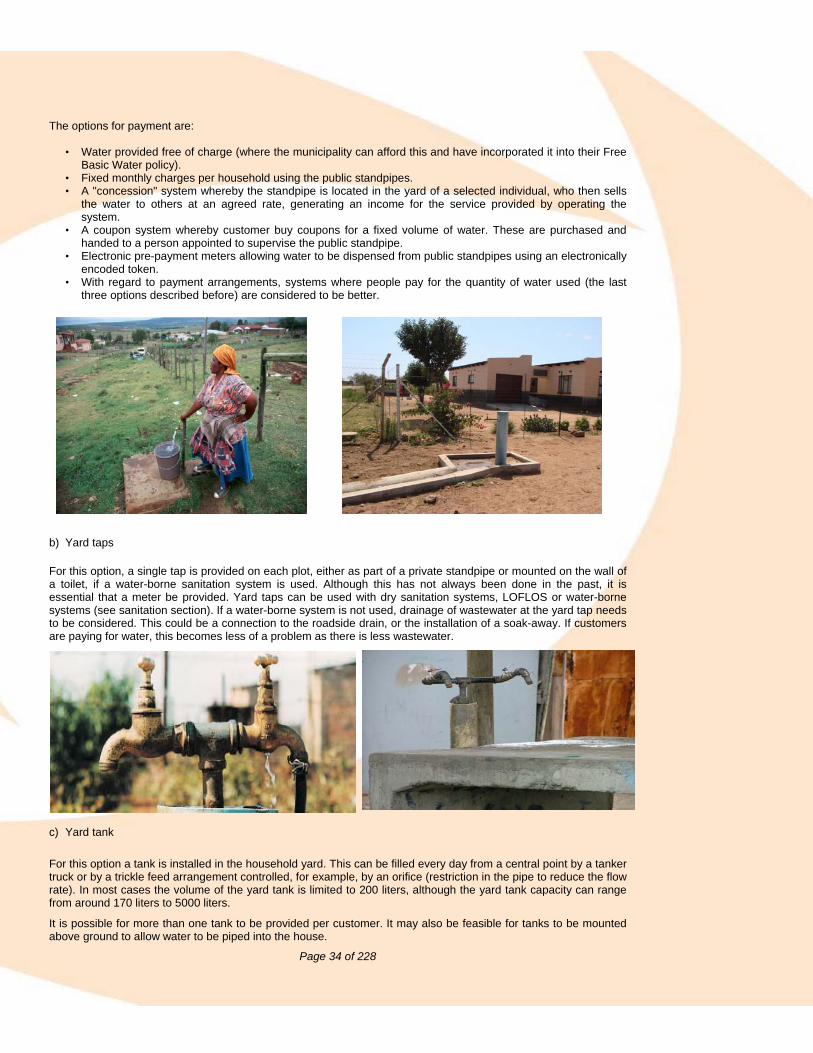
Page 34 of 228
The options for payment are:
• Water provided free of charge (where the municipality can afford this and have incorporated it into their Free Basic Water policy).
• Fixed monthly charges per household using the public standpipes. • A "concession" system whereby the standpipe is located in the yard of a selected individual, who then sells
the water to others at an agreed rate, generating an income for the service provided by operating the system.
• A coupon system whereby customer buy coupons for a fixed volume of water. These are purchased and handed to a person appointed to supervise the public standpipe.
• Electronic pre-payment meters allowing water to be dispensed from public standpipes using an electronically encoded token.
• With regard to payment arrangements, systems where people pay for the quantity of water used (the last three options described before) are considered to be better.
b) Yard taps
For this option, a single tap is provided on each plot, either as part of a private standpipe or mounted on the wall of a toilet, if a water-borne sanitation system is used. Although this has not always been done in the past, it is essential that a meter be provided. Yard taps can be used with dry sanitation systems, LOFLOS or water-borne systems (see sanitation section). If a water-borne system is not used, drainage of wastewater at the yard tap needs to be considered. This could be a connection to the roadside drain, or the installation of a soak-away. If customers are paying for water, this becomes less of a problem as there is less wastewater.
c) Yard tank
For this option a tank is installed in the household yard. This can be filled every day from a central point by a tanker truck or by a trickle feed arrangement controlled, for example, by an orifice (restriction in the pipe to reduce the flow rate). In most cases the volume of the yard tank is limited to 200 liters, although the yard tank capacity can range from around 170 liters to 5000 liters.
It is possible for more than one tank to be provided per customer. It may also be feasible for tanks to be mounted above ground to allow water to be piped into the house.
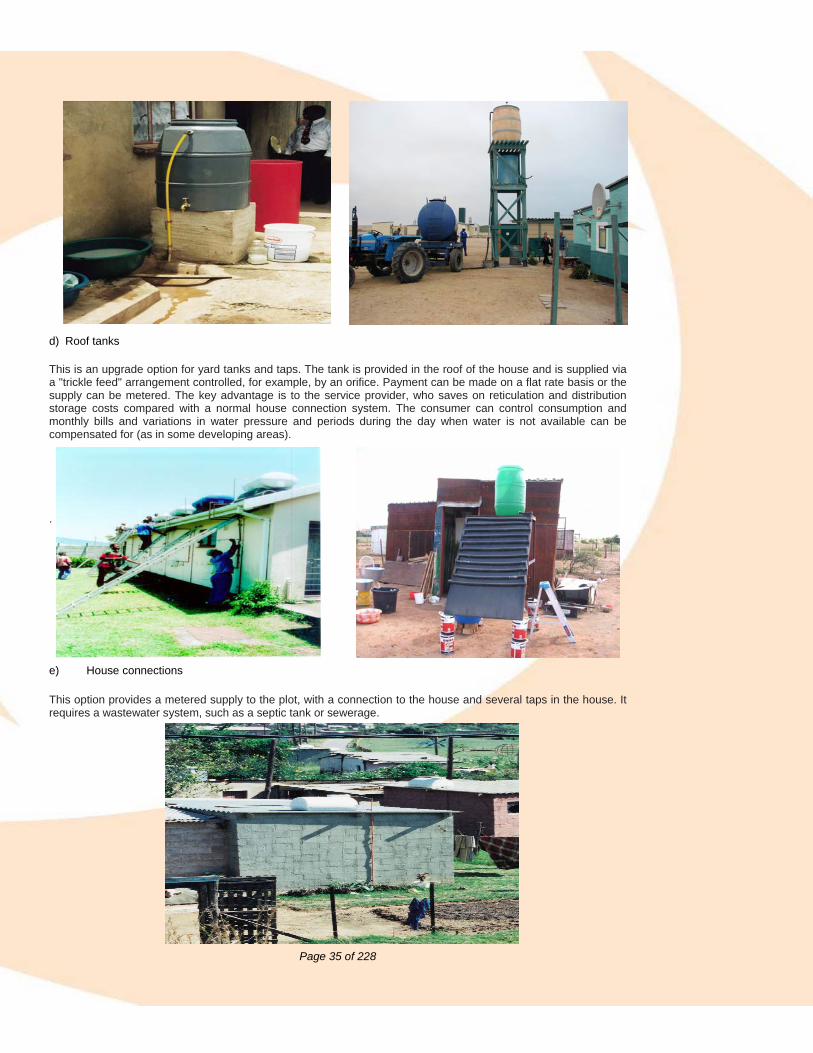
Page 35 of 228
d) Roof tanks
This is an upgrade option for yard tanks and taps. The tank is provided in the roof of the house and is supplied via a "trickle feed" arrangement controlled, for example, by an orifice. Payment can be made on a flat rate basis or the supply can be metered. The key advantage is to the service provider, who saves on reticulation and distribution storage costs compared with a normal house connection system. The consumer can control consumption and monthly bills and variations in water pressure and periods during the day when water is not available can be compensated for (as in some developing areas).
.
e) House connections
This option provides a metered supply to the plot, with a connection to the house and several taps in the house. It requires a wastewater system, such as a septic tank or sewerage.

Page 36 of 228
6.1.6 Advantages And Disadvantages The table below shows the range of service level options and some of their advantages and disadvantages:
Service Level
Service Option General comment Advantages Disadvantages
Level 1 Standpipe & communal taps
• Average 25 households per tap, linked to settlement pattern.
• Standpipe can have more than one tap.
• Generally least expensive
• Low consumption & delivery rate (10l/min)
• Customer inconvenience.
• Water stored open in buckets – health risk.
• Poor designs create – messy water pooling create an environment & health risk.
• Reduced cost recovery options.
• Water wastage
Level 2 Yard taps • Metered. • Not connected to
any private plumbing fixtures.
• Water available “on-site”. • Accurate meter reading
and billing possible. • Greater sanitation
options. • Less wastage.
• Potentially open stored water (buckets) – health risk
• Poor designs create – messy water pooling create an environment & health risk
Yard tank • Filled by trickle flow
or tanker daily, • Max 200 l/day
• FBW policy easy to implement
• Up-front payment ensures cost recovery
• Customers know water usage
• “on-site” storage reduces required capacity of connector & reticulation infrastructure
• Low capital cost • Good upgrade potential
• Consumption constrained, potential to run-dry
• Tanks need regular cleaning
Level 3
Roof Tank • Upgraded yard tank, • trickle feed
• Service provider saves on cost of reticulation and distribution storage compared to full connection
• Customer convenience and usage control
• Consumption still constrained
• Tanks need regular cleaning
Level 4 House Connection
• fully metered • pressurized
connection • no limitation on
usage • requires proven
ability to bear full cost by consumer
• Highest level of convenience for both customer and service provider
• Accurate meter reading and billing
• High cost to Municipality
• High levels of water usage – greater bulk infrastructure required
• Difficulty to control water usage
• Needs complementary wastewater system

Page 37 of 228
6.1.7 Residential Water Supply: Basic Unit Cost Table 6.1.7 Shows the range of unit costs in Rand for the various options of residential water supply, as developed from zero-based approach, following breakdown as depicted in Appendix 6:
Cost in Rand Limpopo Gauteng North West
Level of Service Unit
Min Max Ave Min Max Ave Min Max Ave Residential: Water Supply Communal standpipes R / standpipe 1,747 1,942 1,845 1,488 1,653 1,570 1,621 1,801 1,711Yard taps R / yard tap 1,138 1,265 1,202 966 1,074 1,020 1,030 1,144 1,0875000 l yard tanks R / yard tank 15,372 17,079 16,226 13,295 14,772 14,033 14,303 15,892 15,098Roof tanks - intermediate level of service R / roof tank 1,309 1,454 1,381 1,139 1,265 1,202 1,218 1,353 1,285House connections - full level of service R / household 1,009 1,121 1,065 880 978 929 974 1,083 1,028
Cost in Rand
Free State Kwa-Zulu Natal Mpumalanga Level of Service Unit
Min Min Min Min Min Min Min Min Min Residential: Water Supply Communal standpipes R / standpipe 1,559 1,732 1,645 1,597 1,775 1,686 1,708 1,898 1,803Yard taps R / yard tap 1,021 1,134 1,077 1,040 1,156 1,098 1,107 1,230 1,1685000 l yard tanks R / yard tank 13,900 15,445 14,672 14,184 15,760 14,972 15,070 16,744 15,907Roof tanks - intermediate level of service R / roof tank 1,189 1,321 1,255 1,213 1,348 1,281 1,287 1,430 1,359House connections - full level of service R / household 896 995 945 928 1,031 980 983 1,092 1,037
Cost in Rand
Northern Cape Western Cape Eastern Cape Level of Service Unit
Min Min Min Min Min Min Min Min Min Residential: Water Supply Communal standpipes R / standpipe 1,826 2,029 1,928 1,668 1,853 1,761 1,527 1,697 1,612Yard taps R / yard tap 1,192 1,325 1,259 1,082 1,203 1,142 1,005 1,116 1,0605000 l yard tanks R / yard tank 16,018 17,798 16,908 14,741 16,379 15,560 13,660 15,178 14,419Roof tanks - intermediate level of service R / roof tank 1,366 1,518 1,442 1,170 1,300 1,235 1,262 1,402 1,332House connections - full level of service R / household 1,041 1,156 1,098 967 1,074 1,021 876 973 925

Page 38 of 228
6.1.8 Connector Services: Water Supply Infrastructure: 6.1.8.1 Reservoirs Reservoirs are used to store treated bulk water from purification/treatment plants (bulk storage) or as distribution reservoirs to gravity feed water reticulation pipe networks in communities (e.g. reticulation reservoirs). In some instances, reservoirs may be used for hydraulic purposes to reduce pipeline costs or pipe pressure (pipe class). They can also be used to optimize level of supply, pipe sizes and pumpstation operating rules (schedules). Reticulation reservoirs are normally placed on the highest available / accessible sites to allow effective gravity feed and adequate line pressure in the water reticulation. The exact location of the reservoirs will depend on the hydraulic pressures required. Construction can be at, above or below ground level. Various materials including polyethylene, bricks, steel, concrete and reinforcing mesh with supporting (tarpaulin) can be used in construction. Depending on the population size and water requirements, reservoir sizes may vary from small (10 kl) to large (>10 000 kl). Reservoirs will be designed based on the accepted design criteria of the industry, the scheme requirements and of those specifications as determined by the individual municipality. The expected lifespan and the availability of funds may play a role in selection of affordable construction materials. Concrete structures for instance are very costly to construct but last longer (have a longer life expectancy). Polyethylene and steel structures may on the other hand be preferred due to ease of construction, practicality and project economy. Various materials are used in construction, as shown in the table below: Material Cost effective usage based on capacity of Reservoir
Polyethylene reservoirs Sizes less than 50 kl Lifespan 10-15 yrs
Steel reservoirs Sizes between 50 to 500 kl Lifespan 20-25 yrs
Brick reservoirs Sizes between 50 to 500 kl Lifespan 20-30 yrs
Concrete reservoir Sizes exceeding 500 kl Lifespan exceeding 50 yrs
The following key variables have been identified as impacting on the choice and cost of reservoir:
location and elevation (ground reservoir vs. elevated reservoir) capacity / size type of material & construction method excavation & founding condition.
6.1.8.2 Pumpstations: Pumpstations form an integral part of most water supply schemes and are used mainly for two reasons:
to add elevation(potential energy) to water conveyed. to increase the rate of supply / volume (kinetic energy) to existing or inadequate systems.
Pumpstations may comprise of components that warrant a wide range of expertise from different fields of engineering. Depending on the size and complexity of the pumpstation, it may include:
Civil engineering expertise for sump design, hydraulic flow patterns, flow separation, manifold arrangement, cavitation prevention, pump protection, pump duty points, and the civil super structure.
Mechanical engineering expertise may be required for pump-set installation and alignment, transmission and mechanical drives, motorization and ventilation, as well as handling facilities such as cranes.
Electrical engineering expertise may be required for motors, switch gear, pump relaying, safety precaution and motor protection, as well as remote sensing (telemetry) if needed.

Page 39 of 228
Ebenezer Pumpstation
Each pumpstation is designed based on the accepted design criteria of the industry, the scheme requirements and of those specifications as determined by the individual municipality. The following aspects are however general to most schemes and the choice of which, will impact on the cost:
Power Supply: o Diesel:
Usually operate 8 hrs per day, more cumbersome and substantially more costly in terms of capital and operational cost. Consists of mechanical pump, energy source & pump pipe-work. The optimum pump and pipeline should be governed by the option with the lowest recurrent diesel fuel consumption.
o Electrical: Usually operate 24 hrs per day, easy and cost effective, but only of electricity power is available. Consists of mechanical pump, pump switchgear, energy source & pump pipe-work. Supply costs for new power supply line is around R48 000 per km.
Capacity o The pump capacity is mainly influenced by its ability to provide sufficient water supply ranging from 25
to 180 l/c/d for individual schemes or for a combination of the above, at pumping rate ranges of 15 - 25 l/s, 25 - 40 l/s, 40 - 65 l/s, 65 - 130 l/s, 130 - 200 l/s.
o Sizes of pumpstations are given in terms of their kW requirement (some institutions use kVA) and the cost of relating switch gear is also best represented per kW.
o Ensure that adequate standby facilities are available. Other typical cost factors: o Pump duty: Required speed of motor and required pumping head. o Pump house building (prefabricated/ zinc, brick or concrete).
PUMPSTATIONS - WATER SUPPLY PUMPSTATION CAPACITY – RAND
Capacity l/s 15 to 25 25 to 40 40 to 65 65 to 130 l/s in (meter) 285,000.00 369,222.00 434,370.00 758,250.00
PUMPSTATIONS - WATER SUPPLY PUMPSTATION CAPACITY - PEOPLE AND HOUSEHOLDS
Capacity l/s 15 to 25 25 to 40 40 to 65 65 to 130 l/d (24 hrs) 1,296,000 2,160,000 2,160,000 3,456,000 3,456,000 5,616,000 5,616,000 1,123,2000 Water Consumption No. of People (min) 8,640 14,400 14,400 23,040 23,040 37,440 37,440 74,880 No. of People (max) 12,960 21,600 21,600 34,560 34,560 56,160 56,160 112,320
No. of Households 1,728 2,880 2,880 4,608 4,608 7,488 7,488 14,976 No. of Households 2,592 4,320 4,320 6,912 6,912 11,232 11,232 22,464 NOTES: 1. For number of people water consumption is taken as 150 l/p/d (max) to 100 l/p/d (min). 2. Households determined on average of 5 people per household.

Page 40 of 228
6.1.8.3 Supply Pipelines: Pipelines are required to convey bulk water from the water source or pumpstation to the service reservoir. Bulk water pipelines are also sometimes required to convey bulk water from the service reservoir over considerable distance to the edge of the village. Pipelines are made of various materials which include polyethylene, uPVC, mPVC, HDPE, steel and fiber cement. Each type of material has specific strength and hydraulic characteristics thus making it suitable for specific site conditions, water quality, pressure ranges and sizes of flow. Pipelines are usually buried for protection and may be tens of kilometers in length. The different pipe materials require specific bedding material and handling procedures during the laying and coupling of pipe sections. Pipelines are made of different thicknesses to handle the operating pressures applicable to the various reaches of the pipeline. The specified class pipeline to be used also often differs from municipality to municipality and is based on their design and maintenance criteria. In essence the cost of pipe lines is determined by:
Pipe size Pipe class (water pressure) (based on SANS and municipal design criteria) Pipe material Soil / excavation conditions( soft, intermediate and hard rock excavations) Other escalating factors (access, topography /slope, availability of labour, etc.).
Typically uPVC tends to be used in soft to intermediate soils and steel pipes for hard rock. Most commonly used diameter pipelines are:
110 mm Ø 160 mm Ø 200 mm Ø 250 mm Ø 315 mm Ø
It is necessary, particularly in the case of major pipelines, to optimize the diameter selected. With larger pipe diameters, friction losses are lower and this would imply that the total pumping head would be lower. The result is that the cost of the pipeline would be higher, but the cost of the pumpstation and the cost of operation, particularly in terms of electricity charges would be lower. With small diameters, the reverse is true. The length of the pipeline is an important controlling factor as it influences the total operating head.
Costs are incurred along the route of the pipeline and include bush clearing, markers and servitudes. It is estimated that the cost of these items only contribute about 1% to the cost of the pipeline. However, exceptional costs may be incurred when roads, railways and rivers need to the crossed. The cost of the river crossings may be considerable when difficult situations arise and these need to be determined separately for the specific site.

Page 41 of 228
Table 6.1.8.3 Shows the range of unit costs in Rand for the various options of bulk water connector supply, as developed from zero-based approach, following breakdown as depicted in Appendix 6:
Cost in Rand Limpopo Gauteng North West
Capacity Unit
Min Max Ave Min Max Ave Min Max Ave Pipelines Diameter Bulk Water Supply 110 mm R / meter 306 340 323 266 295 281 294 326 310160 mm R / meter 382 425 403 329 365 347 368 408 388250 mm R / meter 623 692 658 530 589 560 601 668 635315 mm R / meter 862 958 910 733 814 773 829 921 875
Cost in Rand
Free State Kwa-Zulu Natal Mpumalanga Capacity Unit
Min Max Ave Min Max Min Min Max Ave Pipelines Diameter Bulk Water Supply 110 mm R / meter 272 302 287 281 312 297 298 331 315160 mm R / meter 338 376 357 350 389 369 374 416 395250 mm R / meter 548 609 578 568 631 599 613 681 647315 mm R / meter 756 840 798 784 871 828 846 940 893
Cost in Rand
Northern Cape Western Cape Eastern Cape Capacity Unit
Min Max Ave Min Max Ave Min Max Ave Pipelines Diameter Bulk Water Supply 110 mm R / meter 316 351 334 293 326 309 266 296 281160 mm R / meter 397 441 419 366 407 387 330 366 348250 mm R / meter 649 721 685 597 664 631 532 592 562315 mm R / meter 898 998 948 825 917 871 735 817 776

Page 42 of 228
6.1.9 Bulk Services: Water Supply Infrastructure: 6.1.9.1 Water Treatment Works 6.1.9.1.1 Conventional Water Treatment Works The nature of water is that of a basic natural solvent and thus has many constituents that determine its quality. Water sources, be they groundwater (boreholes), surface water (rivers), rainwater and oceans, influence potable water quality. Their water quality will result from contact with geology, land use, air pollution or through processes undergone. To supply potable water of acceptable quality, or of a certain fitness for use, the water has to be rid off undesirable amounts of dissolved or suspended constituents, which may threaten the health of the users, both in the long and short term. Depending on the fitness for use, the choice water treatment may range from simple home treatment to advanced treatments like reverse osmosis and ion exchange. It has been found that biological constituents have little influence on treatment as they can be removed easily by boiling, house bleaching, chlorination etc with little cost for chemicals only. However, the removal of physical constituents (turbidity, dissolved salts and pH) were found to incur significant treatment costs. Water-soluble chemicals can be grouped into those suited for conventional treatment and those requiring advanced treatment. Conventional treated constituents include arsenic, calcium, iron, magnesium, manganese and zinc, which can be removed from the water by adding specific flocculation agents which react with the chemical to form solids that can be precipitated and removed using physical methods and filtration. Calcium (causes scaling in metal, but no serious health risk) and iron (high concentration cause chronic health effects) being the most common. Advanced treatment is needed to remove calcium, chloride, fluoride, nitrate, potassium, sodium and sulfates. Generally it is very expensive to treat these impurities as it requires advanced technology such as iron exchange or reverse osmosis. The most common constituents requiring advanced treatment include fluoride, nitrates and chloride. Some cost influencing factors include:
Project size: A reduction in the cost is anticipated for larger projects in view of the economy of scale. Location: Extensive distances from economic center’s and expertise can have a significant cost
implication, especially if operation and maintenance of advanced treatment processes are involved. Topography: This mainly influences the cost of access roads, but may in particular affect the cost of
delivering package treatment plants Specialist Contractors: As treatment works require specialized expertise, the availability of such
contractors is critical.

Page 43 of 228
6.1.9.1.2 Unit Costs The following table depicts the capital cost, excluding fees, P&G's and VAT, of the various smaller types of water treatment works.
Scheme Size Very Small Small Medium Large
(1000 people) (5000 people) (20000 people) (50000 people)
Average of Capital Cost 30 160 600 1600 Element kl/day kl/day kl/day kl/day Package Plant 207,000 454,000 1,290,000 3,190,000 Conventional 297,071 649,741 1,587,032 3,355,836 Advanced Treatment 710,000 970,000 1,850,000 3,850,000
The table below depicts the average capital cost, including the P&G’s as per industry standards, but excluding fees, escalation, fees and VAT, of large conventional water treatment works. These costs are based on actual tenders – contracts awarded Rand/Kl.
CAPEX and OPEX Base Costs for WTW Capacity CAPEX OPEX (R/ kl)
Ml/d Av Flow New (R/Ml) Energy Chemicals Maintenance Operations Total
0 3,750,000 0.26 0.62 0.53 0.11 1.50 5 3,150,000 0.21 0.52 0.44 0.09 1.26 10 2,850,000 0.19 0.47 0.40 0.08 1.14 20 2,250,000 0.15 0.37 0.32 0.06 0.90 50 1,650,000 0.11 0.27 0.23 0.05 0.66
100 1,575,000 0.11 0.26 0.22 0.04 0.63 1,500,000 0.10 0.25 0.21 0.04 0.60
6.1.9.2 Raw Water Storage Dams The Industry Guide deal with primarily with water services, not water resources. However, of importance is to note the impact and importance of integrated water resource management on water services. Catchment Management Agencies (CMAs) and the respective Water Users Associations (WUAs) are the institutions responsible for water resources management on an operational level, under the auspices of DWAF as regulator and sector leader. Dams are usually constructed on rivers in cases where the flow during the dry months of the year, or during periods of drought, is insufficient to meet the water requirements. Additional storage thus needs to be provided. The volume of storage required is a function of the flow characteristics of the river, local climate and pattern of abstraction. Dams are usually constructed in narrow valleys with wide deep basins, flat river reaches and sound foundation conditions. The choice of the type and location of the dam depends on a number of factors, including the type of project for which the facility is being constructed, local geology, available materials and local topography. The factors that influence the cost of the dam are the storage required, topography, valley shape, dam length, foundation conditions and spillway requirements. The cost of the dam is a function of the volume of construction material in the dam. The volume of the dam, be it mass concrete, rock fill or earth fill, is related to the cross-section of the dam and the valley cross-section. The cross-section of the dam is related to the type and height of the dam.

Page 44 of 228
The table below shows the Capital Cost (excluding fees, P&G + VAT) for various Bulk Services, Surface Water Dam Wall Types (ref vii) unit cost in rand.
Scheme Size Capacity Capacity Unit Very Small Small Medium Large Average of Capital Cost
(1000 people) (5000 people) (20000 people) (50000 people) Material 30 000 120 000 500 000 1 200 000 Earth-fill Element m3 m3 m3 m3 Dam-Wall 521,467 1,211,793 3,584,512 7,364,111 Earth-fill Sum Earth-fill Dam-Wall 102,169 260,848 724,057 1,398,477 Rock-fill 623,636 1,472,641 4,308,569 8,762,588 Dam-Wall 498,914 1,320,237 3,647,207 7,651,549 Rock-fill Sum Spillway 116,910 256,548 911,992 1,569,224 Roll-crete 615,824 1,576,785 4,559,199 9,220,773 Dam-Wall 677,184 1,920,498 5,600,283 12,144,903 Roll-crete Sum Spillway 4,170 5,671 9,340 11,008 681,354 1,926,169 5,609,623 12,155,911
6.1.9.3 Boreholes Development Groundwater is exploited mainly by means of boreholes, but can also be exploited by means of springs, hard dug wells and infiltration galleries. 6.1.9.3.1 Definition/Description A borehole is a hole that is normally drilled into the ground to reach selected subsurface geological formations containing groundwater. 6.1.9.3.2 Purpose of a Borehole The purpose of a borehole is to enable the lowering of water abstraction equipment e.g. pump, motor and pipes into the hole to facilitate the abstraction of groundwater and pump it to the surface. 6.1.9.3.3 Geographical context Boreholes are typical of rural areas where human settlement development has not progressed to the extent where bulk storage and supply of water has occurred for the consumption by the people. The lack of significant run-offs in streams and rivers in inland towns historically resulted in many smaller inland towns being entirely dependant on boreholes for their water supply. 6.1.9.3.4 Basic Level of Service A borehole is considered as a basic level of bulk water supply in rural and inland areas where no alternative exists for adequate water supply to communities. Boreholes can be utilized on their own or in conjunction with alternative low water supply sources e.g. springs and minor streams to augment the supply required for the specific community. 6.1.9.3.5 Levels of Service Options Boreholes do not have alternatives of different levels of service options. The equipment of abstracting water may vary between submersible pumps driven by electricity or solar power to the old wind pump arrangement. These do not constitute different options for the level of services but is determined by the availability of e.g. electricity on site and/or the cost to have it available.

Page 45 of 228
6.1.9.3.6 Advantages/Disadvantages The advantages and disadvantages of boreholes are summarized in the table below: Advantages Disadvantages
Water supply to rural and remote areas High unit cost for small number of people Can be utilized where Power supply is not
available e.g. solar power or engine Water supply dependant on consistency of ESKOM power
supply Mostly good quality water Supply (yield) not known until borehole is complete
Groundwater can be over exploited resulting in failure of the borehole
6.1.9.3.7 Standards of Construction The drilling of boreholes is regulated by DWAF. Permission and approval from DWAF is required before a new borehole can be drilled. It is a recommendation that the drilling contractor be a member of the Water Borehole Association of SA to ensure that reputable and experienced contractors are appointed. The design of the pump and motor installation should be that the maximum pumping rate should be between 70 and 80% of the tested borehole yield. This is in order to protect the ground water source and prevent over exploitation. The pumping rate should further be sized to deliver the total water demand per day over a 24 hour daily period. The low water demand at night can be utilized in conjunction with the storage reservoir to provide buffer storage during the day. 6.1.9.3.8 Unit Costs In borehole development the initial capital costs are related to the hydro-geological consulting fees. These fees include costs to conduct the following activities:
Desk study and reconnaissance survey groundwater development and use in the area; Borehole sitting: This activity includes all the procedures methods used to identify positions for the drilling of
boreholes. These can include, remote sensing, field mapping and geophysical surveys. Contract, administration and supervision of drilling: This is required to ensure that boreholes are drilled and
constructed according to required standards and to evaluate if the borehole has intersected the target identified during the sitting exercise.
Contract, administration and supervision and analysis of pumping tests: Analysis of water quality test results to insure that water is fit for the proposed use
Management recommendations and reporting: Information obtained during the abovementioned activities is evaluated to recommended abstraction rates for boreholes, pump settings and monitoring and management requirements.
However, the cost of a borehole and resultant water supply is determined by three factors:
The actual drilling cost of the borehole which is finally determined by the final depth of the hole The depth at which the water is found - this determines the head against which the pump must work and
hence the cost of the pump and motor required. The yield or supply of the borehole - this determines the rate at which pumping of water will occur and
hence again the cost of the pump and motor required The table following gives an indication of the variances in cost with the depth and yield of the borehole. The table represents the indicative pump and motor costs, with typical cost variances dependant on total head and yield for boreholes:
WATER YIELD - Q 1.5 (l/s) 2.5 (l/s) 3.5 (l/s) 4.5 (l/s)
NUMBER OF PEOPLE 860 to 1290 1440 to 2160 2010 to 3020 2590 to 3880
HOUSEHOLDS
TOTAL HEAD (in meters)
170 to 255 285 to 430 400 to 600 515 to 775
TOTAL HEAD (in meters) 40 m 6,100 8,648 8,954 14,247
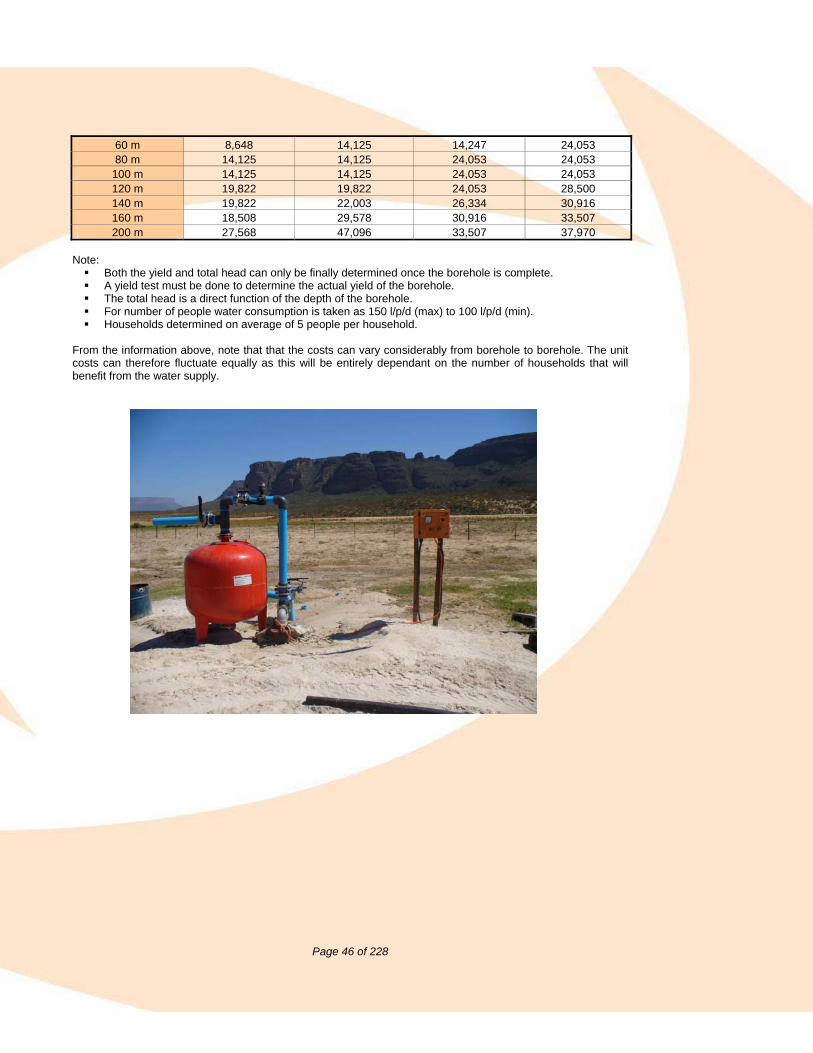
Page 46 of 228
60 m 8,648 14,125 14,247 24,053 80 m 14,125 14,125 24,053 24,053 100 m 14,125 14,125 24,053 24,053 120 m 19,822 19,822 24,053 28,500 140 m 19,822 22,003 26,334 30,916 160 m 18,508 29,578 30,916 33,507 200 m 27,568 47,096 33,507 37,970
Note:
Both the yield and total head can only be finally determined once the borehole is complete. A yield test must be done to determine the actual yield of the borehole. The total head is a direct function of the depth of the borehole. For number of people water consumption is taken as 150 l/p/d (max) to 100 l/p/d (min). Households determined on average of 5 people per household.
From the information above, note that that the costs can vary considerably from borehole to borehole. The unit costs can therefore fluctuate equally as this will be entirely dependant on the number of households that will benefit from the water supply.

Page 47 of 228
Table 6.1.9.3.8 Shows the range of unit costs in Rand per meter drilled (R/m) for the most common options of borehole diameters relevant to settlement location, as developed from zero-based approach, following breakdown as depicted in Appendix 6:
Cost in Rand
Limpopo Gauteng North West Infrastructure Specification Unit Min Max Ave Min Max Ave Min Max Ave
Bulk Water Supply: Boreholes Shallow 50 m - Semi Rural (100 km radius) R / meter 1,236 1,373 1,304 1,236 1,373 1,304 1,236 1,373 1,304Shallow 50 m – Deep Rural (250 km radius) R / meter 1,341 1,490 1,416 1,341 1,490 1,416 1,341 1,490 1,416Deep 200 m - Semi Rural (100 km radius) R / meter 601 667 634 601 667 634 601 667 634
165 mm ID Hole Deep 200 m – Deep Rural (250 km radius) R / meter 636 706 671 636 706 671 636 706 671
Shallow 50 m - Semi Rural (100 km radius) R / meter 1,294 1,438 1,366 1,294 1,438 1,366 1,294 1,438 1,366Shallow 50 m – Deep Rural (250 km radius) R / meter 1,400 1,555 1,477 1,400 1,555 1,477 1,400 1,555 1,477Deep 200 m - Semi Rural (100 km radius) R / meter 659 732 696 659 732 696 659 732 696
208 mm ID Hole Deep 200 m – Deep Rural (250 km radius) R / meter 694 771 733 694 771 733 694 771 733
Cost in Rand Free State Kwa-Zulu Natal Mpumalanga Infrastructure Specification Unit
Min Max Ave Min Max Ave Min Max Ave Bulk Water Supply: Boreholes
Shallow 50 m - Semi Rural (100 km radius) R / meter 1,105 1,228 1,167 1,236 1,373 1,304 1,236 1,373 1,304Shallow 50 m – Deep Rural (250 km radius) R / meter 1,197 1,330 1,264 1,341 1,490 1,416 1,341 1,490 1,416Deep 200 m - Semi Rural (100 km radius) R / meter 545 606 576 601 667 634 601 667 634
165 mm ID Hole Deep 200 m – Deep Rural (250 km radius) R / meter 576 640 608 636 706 671 636 706 671
Shallow 50 m - Semi Rural (100 km radius) R / meter 1,186 1,318 1,252 1,294 1,438 1,366 1,294 1,438 1,366Shallow 50 m – Deep Rural (250 km radius) R / meter 1,278 1,420 1,349 1,400 1,555 1,477 1,400 1,555 1,477Deep 200 m - Semi Rural (100 km radius) R / meter 626 696 661 659 732 696 659 732 696
208 mm ID Hole Deep 200 m – Deep Rural (250 km radius) R / meter 657 730 694 694 771 733 694 771 733
Cost in Rand Northern Cape Western Cape Eastern Cape Infrastructure Specification Unit
Min Max Ave Min Max Ave Min Max Ave Bulk Water Supply: Boreholes
Shallow 50 m - Semi Rural (100 km radius) R / meter 1,186 1,318 1,252 865 961 913 1,236 1,373 1,304Shallow 50 m – Deep Rural (250 km radius) R / meter 1,292 1,435 1,363 865 961 913 1,341 1,490 1,416Deep 200 m - Semi Rural (100 km radius) R / meter 544 605 575 517 574 545 601 667 634
165 mm ID Hole Deep 200 m – Deep Rural (250 km radius) R / meter 579 644 612 517 574 545 636 706 671
Shallow 50 m - Semi Rural (100 km radius) R / meter 1,222 1,358 1,290 865 961 913 1,294 1,438 1,366Shallow 50 m – Deep Rural (250 km radius) R / meter 1,328 1,475 1,401 865 961 913 1,400 1,555 1,477Deep 200 m - Semi Rural (100 km radius) R / meter 580 645 613 517 574 545 659 732 696
208 mm ID Hole Deep 200 m – Deep Rural (250 km radius) R / meter 615 684 650 517 574 545 694 771 733NOTE: The unit cost does not include pump testing and only makes allowance for the siting and drilling of one borehole.

Page 48 of 228
6.1.10 Management Cost Factors: As mentioned, the actual final cost of the water supply scheme may be almost double the estimated capital cost in view of additional expenses incurred in terms of:
Institutional & Social Development ( see section 4.4.2.1) Professional fees in terms of feasibility studies, design and construction supervision (see section 4.4.2.2) P&G’s for contractors establishment Contingencies for unforeseen expenses VAT at 14%
6.1.10.1 P&G’s for contractors establishment: Preliminary and General (P&G) cost items are based on a percentage of the total capital cost of the project excluding VAT, contingencies, professional fees, relocations and land acquisition.
6.1.11 Standards Of Construction There are numerous construction standards and codes of design practice that apply to the various components of water supply, not only at a national level, but often at a local government level. Many municipalities, using the National Design Standards as base, refine their own building codes and design regulations to suite their individual requirements. When costing and designing a water supply project it is advisable to first check with the local municipality as to their specific design criteria. Following is a list of applicable design and construction standards / codes which are to be used as base guidelines: Standards for Drinking Water
South African National Standard Specification Drinking Water 241, Edition 6, 2005; Standards South Africa.
Quality of Domestic Water Supplies – Volume 1: Assessment Guide, 2nd Edition, 1998, Department of Water Affairs and Forestry, Water Research Commission and Department of Health.
The South African Compulsory National Standards Regulations, under Section 9 of the Water Services Act, 1997 (Act no 108 of 1997), directs Water Services Authorities for the quality of potable water to SANS 241 for guidance.
Sample taking is in accordance with Quality of Domestic Water Supplies, Volume 2 – Sampling Guide, 1st Edition, 2000; Department of Water Affairs & Forestry, Water Research Commission and Department of Health.
Standards for Construction
National Building Regulations. Red Book. SANS 1200 – All setions. NHBRC Home Building Manual – Part 1 – 3. ISO 1900 – All sections. CSIR Standards (will also make reference to SANS 1200).
6.1.12 Unit Cost For Water Supply The national average unit cost for water supply including both connector and bulk is R7,381 per household (escalated from original R 6000 to current value). Anything outside this range will require a strong motivation from the municipalities concerned. It needs to be reiterated that these figures represent average values, but that situation in various areas could require averaging the service between R 10,000 - R 15,000/household, depending on less/dense population and other factors. This is applicable for the water & sanitation package provided in the deep rural areas. However, realistic costing shows specific breakdowns based on national averages (ref: vii): The following two tables and summary table provide a typical example of cost breakdown based on the type of water supply scheme. Shown are the costs for Groundwater Sourced and Surface water sourced schemes respectively.

Page 49 of 228
The table below provides an overview of Capital Cost Groundwater Scheme per Household:
Scheme Size Component Description Element Material Small
(1000 people) Medium
(5000 people) Large
(20000 people) Large
(50000 people)Electricity 550 330 275 275
Borehole Equipment Hand Pump 150 90 75 75 Groundwater
Borehole Establishment Unconsolidated Rock 708 382 349 349 Water Treatment Works Conventional (blank) 1,485 650 397 336
Energy Source Electric 37 9 4 3 Mechanical pump Electric 11 6 4 3 Pump pipe-work Electric 10 7 5 4 Pump switchgear Electric 33 9 4 3
Pumpstations
Pump-house building Concrete 525 105 26 11 Bulk Pipeline uPVC / HDPE Moderate soil hardness (10% ripping) 1,419 504 434 430 Reservoir Ground Reservoir Concrete 1,059 732 544 438
Street tap Moderate soil hardness (10% ripping) 671 671 671 671 House connection Moderate soil hardness (10% ripping) 0 0 0 0 Water Reticulation Yard connection Moderate soil hardness (10% ripping) 0 0 0 0
Grand Total 6,658 3,495 2,788 2,598
The table below provides an overview of Capital Cost Surface Water Scheme per Household (Summary of Capital Cost per HH):
Scheme Size Component Description Element Material Small
(1000 people) Medium
(5000 people) Large
(20000 people) Large
(50000 people)Dam Wall Earth-fill 2,607 1,212 896 736
Surface Water Spillway Earth-fill 511 261 181 140
Water Treatment Works Conventional (blank) 1,485 650 397 336 Energy Source Electric 37 9 4 3 Mechanical pump Electric 11 6 4 3 Pump pipe-work Electric 10 7 5 4 Pump switchgear Electric 33 9 4 3
Pumpstations
Pump-house building Concrete 525 105 26 11 Bulk Pipeline uPVC / HDPE Moderate soil hardness (10% ripping) 1,419 504 434 430

Page 50 of 228
Reservoir Ground Reservoir Concrete 1,059 732 544 438 Street tap Moderate soil hardness (10% ripping) 671 671 671 671 House connection Moderate soil hardness (10% ripping) 0 0 0 0 Water Reticulation Yard connection Moderate soil hardness (10% ripping) 0 0 0 0
Grand Total 8,369 4,166 3,165 2,775
The table below is a summary of Capital Cost Groundwater Scheme per Household served:
Scheme Type Small (1000 people)
Medium (5000 people)
Large (20000 people)
Large (50000 people)
Average Scenario Groundwater 6,658 3,495 2,788 2,598 High Scenario Groundwater 9,321 4,893 3,903 3,637 Average Scenario Surface Water 8,369 4,166 3,165 2,775 High Scenario Surface Water 11,716 5,832 4,432 3,885
In the current context Water Services Supply is broader than just the actual scheme components and should be viewed more holistically to include the initial investigative components. As such, following is a breakdown of the National Capital Cost per household, including Fees, P&G’s and Vat for Water Services. These latter factors (Fees, P&G’s and Vat) amount to around 53.3% increase of the initial capital cost of the scheme: The table below is a summary of the National Average Capital Costs per household: Sum of National-Cap Cost Per HH Scheme Size
(Costs including Fees, P&G, and VAT) Very Small Medium Large Water Services Development Aspect (1000 people) (5000 people) (20000 people) (50000 people)
Water Resource Development 4,152 1,947 1,510 1,325 Water Treatment Works 2,351 962 589 514 Pumpstations 1,568 383 144 89 Bulk Pipeline 2,029 749 699 691 Reservoir 1,907 924 704 619
Water Supply
Water Reticulation 1,286 1,286 1,286 1,286 Water Supply Total 13,293 6,252 4,931 4,526 Sanitation Sanitation 3,680 3,680 3,680 3,680 Sanitation Total R 3,680 R 3,680 R 3,680 R 3,680 Grand Total R 16,973 R 9,932 R 8,611 R 8,206

Page 51 of 228
Due to the substantial differences that exist in the various circumstances of project development across the provinces, their estimated water supply cost also differs substantially. Following is a breakdown of the Provincial Capital Cost per household, for the water supply component’s totals, as shown above, including Fees; P&G’s and VAT:
The table below is a summary of the Provincial Capital Costs per household for Water Supply: Sum of Provincial-Cap Cost Per HH Scheme Size Costs Including Fees P&G and VAT
Very Small Medium Large Large Province
(1000 people) (5000 people) (20000 people) (50000 people) EC 13,477 6,692 5,299 4,854 FS 13,633 6,243 4,719 4,219 KN 14,394 7,401 6,010 5,562 LP 12,909 5,890 4,691 4,336 MP 13,097 6,106 4,694 4,254 NC 13,222 6,002 4,936 4,649 NW 12,552 5,723 4,462 4,086
Water Supply
WC 13,062 5,962 4,643 4,245
6.1.13 Metering Of All Services In Terms Of The Water Services Act Regulations in terms of the Water Services Act require, inter alia, that: (1) The quantity of water supplied to every water user connection must be metered; (2) Water meter must be supplied to every user connection, including:
Every individual dwelling in a new sectional title development or apartment building; Every individual building, having a maximum designed flow rate exceeding 60 (sixty) liters per minute, in
any domestic, commercial or public utility complex; and Every irrigation system with a maximum designed flow rate exceeding 30 (thirty) liters per minute using
water supplied by a water services authority.
(3) Water meter sizes should comply with the Trade Metrology Act (Act 77 of 1973); (4) A meter greater in size than that specified by the Trade Metrology Act shall be deemed to be defective if it
is found to have a percentage error in over-registration or under- registration greater than 5 % at any one of the rates of flow when tested at the following percentages of its design maximum rate of flow:
75 % or more of the design maximum flow11 Between 50 and 55% of the design maximum flow Between 15 and 20% of the design maximum flow
Typical capital cost: R350/meter Typical pre-paid meters: R1 300/meter (excl installation and VAT)
Of note is that this cost can increase by as much as 40% in the event of including training, meter management system and tokens. Capital and monthly cost for the municipality is the same as for yard taps plus the cost of the water meter. (These costs are considered to be part of the house costs and not included in internal distribution capital).

Page 52 of 228
Table 6.1.13 Shows the range of unit costs in Rand for the various options of Residential: Domestic Water Supply: Water Meters Unit Cost in Rand, as developed from zero-based approach, following breakdown as depicted in Appendix 6:
Cost in Rand Limpopo Gauteng North West
Capacity Unit
Min Max Ave Min Max Ave Min Max Ave Domestic Water Meters Domestic meters (25 mm) R / meter 622 691 657 542 602 572 609 677 643Domestic meters pre paid (15 mm) R / meter 2,578 2,865 2,722 2,154 2,394 2,274 2,511 2,790 2,650Domestic meters (15 mm) R / meter 2,772 3,079 2,926 2,329 2,587 2,458 2,701 3,001 2,851
Cost in Rand Free State Kwa-Zulu Natal Mpumalanga
Capacity Unit
Min Max Ave Min Max Ave Min Max Ave Domestic Water Meters Domestic meters (15 mm) R / meter 560 623 592 576 640 608 621 690 655Domestic meters (25 mm) R / meter 2,254 2,504 2,379 2,335 2,595 2,465 2,572 2,858 2,715Domestic meters pre paid (15 mm) R / meter 2,433 2,703 2,568 2,518 2,798 2,658 2,765 3,073 2,919
Cost in Rand Northern Cape Western Cape Eastern Cape
Capacity Unit
Min Max Ave Min Max Ave Min Max Ave Domestic Water Meters Domestic meters (15 mm) R / meter 647 719 683 604 671 637 545 606 576Domestic meters (25 mm) R / meter 2,712 3,013 2,862 2,483 2,759 2,621 2,174 2,416 2,295Domestic meters pre paid (15 mm) R / meter 2,911 3,234 3,073 2,672 2,969 2,820 2,349 2,610 2,480

Page 53 of 228
6.2 Sanitation / Wastewater 6.2.1 Definition Sanitation Services can be described as the collection, removal, disposal or treatment of human excreta and domestic wastewater, and the collection, treatment and disposal of industrial wastewater. This includes all the organizational arrangements necessary to ensure the provision of sanitation services including, amongst others, appropriate health, hygiene and sanitation related awareness, the measurement of the quantity and quality of discharges where appropriate, and the associated billing, collection of revenue and consumer care. Water services authorities have a right but not an obligation to accept industrial wastewater from industries within their area of jurisdiction. 6.2.2 Purpose Of Sanitation Infrastructure The infrastructure must provide a sanitation service which is safe, reliable, private, protected from the weather, ventilated, keeps smells to the minimum, is easy to keep clean, minimizes the risk of the spread of sanitation-related diseases by facilitating the appropriate control of disease carrying flies and pests, and enables safe and appropriate treatment and/or removal of human waste and wastewater in an environmentally sound manner. 6.2.3 Geographic Context As with water the selection as to the type of sanitation service and infrastructure utilized is substantially impacted upon by the geographical context. Geographical context impacts on a number of layers, such as physical location, site access, population settlement pattern and density, the economic and technical capacity of the available service providers and economic situation of the beneficiary community. In general the settlement impact in terms of technology choice is as follows:
Urban areas, where many businesses are located and where residential densities are high, waterborne sanitation is generally the most appropriate technical solution.
Rural areas where housing densities are low and few businesses are located, on-site solutions such as VIPs and UDS are appropriate.
In intermediate areas (peri-urban areas or dense rural settlements) the choice of sanitation technology must be financially viable and sustainable, in most cases this will be on-site sanitation such as VIPs or UDS.”
6.2.4 Basic Level Of Service The Strategic Framework for Water Services of the Department of Water Affairs and Forestry, September 2003 defines basic sanitation facilities as follows: The infrastructure necessary to provide a sanitation service which is safe, reliable, private, protected from the weather, ventilated, keeps smells to the minimum, is easy to keep clean, minimizes the risk of the spread of sanitation- related diseases by facilitating the appropriate control of disease carrying flies and pests, and enables safe and appropriate treatment and/or removal of human waste and wastewater in an environmentally sound manner. Basic sanitation service is defined as follows: The provision of a basic sanitation facility which is easily accessible to a household, the sustainable operation of the facility, including the safe removal of human waste and wastewater from the premises where this is appropriate and necessary, and the communication of good sanitation, hygiene and related practices. The final choice of the type of service rests with the Water Services Authority, (WSA). In order for them to take such a decision they must ensure that it is practical as well as financially viable and sustainable according to considerations stated below.

Page 54 of 228
6.2.4.1 Considerations for deciding on a sanitation systems other than VIP’s DWAF developed a draft guideline document: “Guideline for the costing of household sanitation projects – February 2007” (unpublished - in stakeholder consultation process) which is specifically focused in assisting WSA in the decision making of the choice of sanitation system. Following are some critical extracts from this guideline, which can assist WSA in selecting their service option. For a more detail it is recommended that the specific guideline document must be accessed. “The use of MIG funds for alternative sanitation systems including waterborne sanitation is now permissible provided the sanitation scheme can be defined as providing a basic sanitation facility that is appropriate for the selected community.” The definition of a basic sanitation service does not define the technology to be used in providing such a service. This decision, made by the water services authority, is the key to the success in providing affordable basic sanitation services in a sustainable manner. The selection of technology is strongly dependent on settlement conditions.” MIG has the mandate to provide a basic sanitation facility to the poor under its capital programme, but including health and hygiene education of the beneficiaries. However recognition must also be given to the following aspects when deciding on the sanitation level of service option:
• The target of 2010 for the eradication of the total national sanitation backlogs still stands. A WSA must choose the most effective way to use the funding available through the MIG, to provide basic sanitation to everyone in their area of jurisdiction by the latest 2010. A strategy in this regard must be developed and applied in the WSA’s Water Services Development Plan (WSDP).
• The WSA’s capacity, (financial and institutional) to operate and maintain complex sewage systems if opting for higher service levels and in particular waterborne sanitation.
• The environmental impact and associated implications, in line with the Environment Conservation Act 73 of 1989 as well as the National Water Act.
• Water supply implications, (availability, affordability and management of water required). “The principles on which the budget guidelines are based (and which local government authorities should incorporate into their planning) are as follows:
The quality of the infrastructure must be of an acceptable (good) standard so that the structures will last for at least 20 years. This implies that:
o The use of corrugated iron (zinc) superstructures is not acceptable. o Pits should be at least partially lined, i.e. have at least a constructed collar on which further building
(slab, superstructure) will take place. o All projects should include a component of quality assurance.
The sanitation infrastructure must be socially acceptable and serve the needs of the wards. This implies
that: o There must be consultation with the communities at the beginning of each project, and their
representatives should be included in all decisions regarding the design; o There should be a participative assessment of the pre-project situation in each community where
the specific needs and environmental concerns are identified as defined in the guidelines for a feasibility report.
The sanitation infrastructure must be sustainable within the operating parameters of the household and
the local municipality. This implies that: o The costs to both operate and maintain the system must be affordable to the household and the
municipality. o O&M budgets in the municipality which are generally derived from tariffs and (in the case of poorer
municipalities) from a limited grant from central government (equitable share) must be adequate to meet all the future requirements in terms of O&M.
The implementation budget allocation should cover the cost of:
o Construction (basic materials, the wages of the builders, labour for digging pits and trenches), o Social facilitation (including training, health and hygiene education, community liaison, and
functioning of the committee), o Project management, and

Page 55 of 228
o Other expert inputs as required.
Budget allocations must be in line with the achievement of full sanitation coverage by 2010. In some cases this may mean more than trebling the current allocation within municipalities.
A scale-up of the rate of delivery of sanitation services must not be at the expense of community
participation, local employment, and environmental impacts. Basic sanitation service provision has the potential to create significant opportunities for employment
within local communities. The approach to the provision of the infrastructure should thus be in line with the principles of the Expanded Public Works Programme (EPWP) and municipal LED initiatives.
Material costs and quality must be compared for both local suppliers and from centralized suppliers. Local supply must not override centrally supplied materials where the cost and/or quality of local supplies are unacceptable.”
“It is noted that certain municipalities may choose to provide levels of service that are not achievable with the MIG allocations for basic levels of service as set out in this guideline. This may be due to a desire to meet political and community aspirations (e.g. by providing waterborne sanitation to residents where it is not sustainable), to purchase complete pre-manufactured systems rather than construction on-site using local builders and materials, or because of previous bad experience with certain basic sanitation facilities. However cognizance needs to be taken of the impact that any increase in the costs will have on the national and municipal budgets, both in the short term and in terms of the on-going O&M budget requirements. “
6.2.4.2 MIG funding for basic level of service Based on the existing availability of MIG funds, MIG focus on funding a basic level of service. The following is thus recommended.
• In rural or low density areas as well as unmotivated dense areas, funding from MIG is restricted to the basic allocation.
• Each province has a unit cost associated with the particular service options, with a variance to allow for costs differences across the particular region. These unit costs exclude VAT and professional fees. These costs should be revised annually.
• Where WSA’s implement waterborne sanitation in dense urban settlements as a basic level of service, this may be fully funded by the MIG if, the considerations given under 1.1.3 have been met and the municipality can prove in its IDP, WSDP and capital plan that the total backlogs in its bigger area are being addressed.
• Buckets are replaced with waterborne, low flush, septic tank systems or VIPs if water is not available. This is to be funded from the MIG bucket eradication fund. The allocation from MIG will range within the specified values provided as unit costing against each of these service options.
• MIG may further consider the upgrading or extension or construction of a wastewater treatment plant in such cases where the basic level of services impacts/contributes on the hydraulic or organic capacity of the treatment plant.
6.2.5 Level Of Service Options Several sanitation systems are widely applied in South Africa, but do not meet the basic level of service requirements. Bucket latrines and unimproved pit latrines are the most obvious, but problems have also been experienced with the operation and maintenance of other systems. Chemical toilets are prohibitively expensive for continuous use and should only be considered as a short-term and temporary measure (3-5 months). Adequate service level options for sanitation include: • VIP latrines and approved Eco-San dry, on-site sanitation systems. • Low-flow on-site (LOFLOS) systems (seldom used owing to bad experiences with certain manufacturers
proprietary models, but has potential for more extensive use). • Septic tanks (usually used in areas not serviced with sewers but where full flush systems are installed, may
also be an upgradeable option or as an option where the household takes some of the treatment responsibility from the municipal authority). Suitable for less densely populated areas with soil conditions that have good drainage potential.
• LOFLOS or septic tanks with solids-free sewers also referred to as septic tank effluent drainage (STED)

Page 56 of 228
systems (appropriate for areas where the soils are poorly drained or areas that have become densely populated where the potential of pollution from the effluent exists). The household also takes on some of the responsibility for sewage treatment and disposal.
• Full water-borne sanitation (the household takes minimal responsibility for treatment and disposal). Sanitation service levels need to be planned in conjunction with the water supply. Where flush systems are required, there must be sufficient water available and the viability of the system must take the cost of supplying water into account.
LOS OPTION WATER SANITATION
Level 1
Basic
Standpipe & communal taps
• Average 25 households per tap
• standpipe can have more than one tap
• VIP & Top structure
• Eco-San Dry
• 1 per household • Free of monthly
consumer charge
Level 2
Intermediate Yard taps
• Metered • not connected to any
private plumbing fixtures
Pour-flush toilet & Top structure (LOFLOS)
• Manually operated cistern
• Lined pit
Yard tank • filled by trickle flow or • tanker daily, • max 200 l/day
• Individual water borne connection
• Pour flush toilet • Solids Free sewer Level 3
Full Roof Tank
• Upgraded yard tank, • trickle feed • Septic Tank • Household
responsibility
Level 4
Full House Connection
• fully metered • pressurized connection • no limitation on usage • require proven ability to
bear full cost by consumer
• Water borne connection
• Full flush
• fully metered • no limitation on
usage • require proven
ability to bear full cost by consumer
6.2.6 Advantages/Disadvantages Level of service Advantages Disadvantages
VIP latrines or equivalent (basic level of service)
Low capital and operating costs.
System is robust with little day-to-day attention required other than cleaning.
Easy to build locally with commonly available materials.
The toilet must be outside.
There can be problems where there is rocky ground or a high water table.
A de-sludging system is required.
Not suitable for higher density developments due to technical requirements.
Eco-San latrines (Composting and Desiccating latrines) (basic level of service)
Low capital and minimal operating costs.
No impact on the environment (ecologically friendly).
System is robust and can be maintained by the household.
Can be incorporated into a home.
Shallow or no pit means it can be installed in all ground conditions.
May be some initial resistance to handling dry wastes from latrine.
Proprietary models do not promote use of local labour and hence job creation.
Typically more expensive than pit-type systems
More sensitive to operational problems

Page 57 of 228
Wet on-site digesters (Aqua-privies) Fairly low capital and operating costs.
Easy to install.
Water has to be carried to the flushing tank.
Where small digesters are used, they need to be emptied often.
There has been a problem with some brands in the past, with mechanical failure of the flushing mechanisms.
Soak-away need to be carefully installed or effluent seeps at ground level.
An additional burden is placed on the local authority in respect of operation and maintenance of the system.
Septic tank effluent drainage systems – including (Flush Latrines with
Septic Tanks & Adsorption Trench,
Flush Latrines with Septic Tanks & solids free sewer & Pond Treatment
No soak away required on the plot.
Sometimes suits sloped or very flat areas, as sewer gradients are not critical.
Suitable where poor drainage soils exist for on-site sanitation schemes, or where risk of contamination of an underground aquifer in unacceptable.
A possible upgrading option for a neighbourhood previously served by LOFLOS or septic tanks.
Less risk of failure where desludging of tanks is not done regularly.
Requires both sewers and digesters.
Fairly expensive.
Tanks require de-sludging.
Municipality responsible for managing wastewater treatment facility and sludge treatment facility.
Full water-borne sanitation (full level of service)
The most convenient sanitation system from a user's point of view.
Minimal risk of pollution on-site from poor maintenance by household.
Other wastewater from the household can be transported in the same system.
Provides the municipality with a source of water for watering parks and gardens.
The most expensive system in terms of capital and operating costs.
Uses the most water.
Everyone in the neighbourhood needs to be connected, even those who may not be able to afford the service.
Municipality responsible for managing wastewater treatment facility and sludge treatment facility.
Leaks or blockages in the distribution system may cause serious contamination of the environment including ground and surface water.
The Free Basic Services policy of 25 liters per household does not allow for this option.
6.2.7 Standards Of Construction Most municipalities have their own individual guidelines fro the design and construction of sanitation services. However, most of these guidelines are read in conjunction with the Code of Practice for the Application of National Building Regulations (NBR), SANS 0400-1990 and Building Standards Act No.103 of 1977 or latest revisions thereof. In addition to these Guidelines, DWAF as the custodian sector department for the management of water and wastewater have developed a number of Guidelines (available from the DWAF web site www.dwaf.gov.za). The latest DWAF guideline document is the “Guideline for the costing of household sanitation projects” which is in draft form at the time of this publication. With regard to the management of sludge / biosolids, the “Permissible Use of Sewage Sludge” (2001) is the most advanced and recent South African manual, which guide the planning and permssable or beneficial utilization of sewage sludge handling and disposal.
Page 58 of 228
6.2.8 Unit Costs Of Basic Sanitation
From the new DWAF guideline document: “Guideline for the costing of household sanitation projects – 2007” the following applies:
The Minister of Water Affairs and Forestry has specified limits for funding of basic sanitation under MIG including for waterborne sanitation where it is a basic service or part of the bucket eradication programmes. These costs are maximum costs and not average costs, and should only be approved under special motivated circumstances. Under normal circumstances costs are expected to be 10 to 25% less than the ceiling costs. Municipalities must strive to maintain costs within the “typical cost” envelope. For sanitation projects this is reflected as a unit cost per household.
Previously unit costs were given as a cost for a full sanitation system. This manual provides cost guidelines for the different components of latrines as well as the full system. This simplifies cost comparisons and budgeting, and enables authorities to evaluate cost differences of tenders in terms of individual components of the different sanitation specifications.

Page 59 of 228
Table 6.2.8: Shows the range of unit costs in Rand for the various options of Basic Residential: Domestic Sanitation: Unit Cost in Rand, as developed from zero-based approach, following breakdown as depicted in Appendix 6:
THE BASIC SANITATION UNIT COST IS UNDER REVIEW AND DEPARTMENT OF WATER AND ENVIRONMENTAL AFFAIRS (PREVIOUSLY DWAF) COSTS GUIDE SHOULD BE CONSULTED

Page 60 of 228
6.2.9 Connector Services: Sewerage Infrastructure:
Connector infrastructure, often referred to as trunk sewers, is the main sewer pipes used to convey sewage to the treatment works. Similar to water supply, the sewer pipelines are usually buried for protection and may be many kilometers in length. The different pipe materials require specific bedding material and handling procedures during the laying and coupling of pipe sections. Pipelines are made of different thicknesses to handle the operating pressures applicable to the various reaches of the pipeline. The specified class pipeline to be used also often differs from municipality to municipality and is based on their design and maintenance criteria. In essence, the cost of pipe lines is determined by:
Pipe size Pipe class (water pressure) (based on SANS and municipal design criteria) Pipe material Soil / excavation conditions( soft, intermediate and hard rock excavations) Other escalating factors (access, topography (slope), availability of labour, etc.)
Some of the standard factors affecting the cost of sewerage connector infrastructure are as follows:
Clearing of bush Remove topsoil Trench excavation (machine) Bedding & backfill Type and size of sewer pipe Materials and manufacture of the manhole base, benching, starter ring, manhole cover and manhole lid testing Labour man days Supervision
As in the case of water supply connector infrastructure, costs are incurred along the route of the pipeline and include bush clearing, markers and servitudes. It is estimated that the cost of these items only contribute about 1% to the cost of the pipeline. However, exceptional costs may be incurred when roads, railways and rivers need to the crossed. The cost of the river crossings may be considerable when difficult situations arise and these need to be determined separately for the specific site.
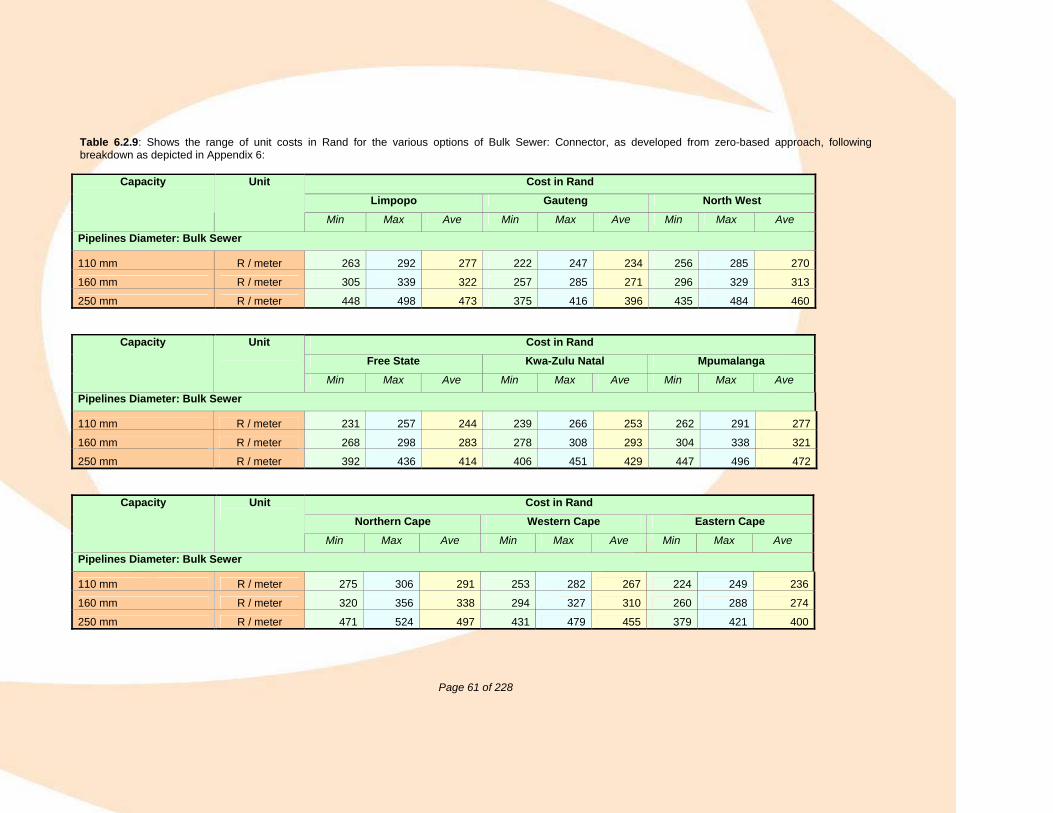
Page 61 of 228
Table 6.2.9: Shows the range of unit costs in Rand for the various options of Bulk Sewer: Connector, as developed from zero-based approach, following breakdown as depicted in Appendix 6:
Cost in Rand Limpopo Gauteng North West
Capacity Unit
Min Max Ave Min Max Ave Min Max Ave
Pipelines Diameter: Bulk Sewer
110 mm R / meter 263 292 277 222 247 234 256 285 270
160 mm R / meter 305 339 322 257 285 271 296 329 313
250 mm R / meter 448 498 473 375 416 396 435 484 460
Cost in Rand Free State Kwa-Zulu Natal Mpumalanga
Capacity Unit
Min Max Ave Min Max Ave Min Max Ave
Pipelines Diameter: Bulk Sewer
110 mm R / meter 231 257 244 239 266 253 262 291 277
160 mm R / meter 268 298 283 278 308 293 304 338 321
250 mm R / meter 392 436 414 406 451 429 447 496 472
Cost in Rand Northern Cape Western Cape Eastern Cape
Capacity Unit
Min Max Ave Min Max Ave Min Max Ave
Pipelines Diameter: Bulk Sewer
110 mm R / meter 275 306 291 253 282 267 224 249 236
160 mm R / meter 320 356 338 294 327 310 260 288 274
250 mm R / meter 471 524 497 431 479 455 379 421 400

Page 62 of 228
Table 2.2.9b : below provides cost for bulk wastewater reticulation, measured in Capital Cost / Stand, are reflected as follows based on actual tendered prices (August 2007):
Low Cost Small Medium Large Cluster
Sewage Outflow 0.6 kl/erf 0.7 kl/erf 0,5 kl/erf 0,8 kl/erf 0,6 kl/erf Stands / 1Ml/day Flow 1,667 Stands 1,429 Stands 1,250 Stands 1,250 Stands 1,667 Stands
Cost / Ml/day 4,5 million /Ml/day
4,5 million /Ml/day
4,5 million /Ml/day
4,5 million /Ml/day
R 4,5 million /Ml/day
Cost / Stand R 2,700 R 3,150 R 3,600 R 3,600 R 2,700
6.2.10 Bulk Services: Sewerage Infrastructure:
Bulk services include:
Sewerage pumpstations Treatment works,
6.2.11 Sewerage Pumpstations:
Some general considerations regarding pumpstations:
• Sewage pumpstations should be avoided as far as possible and should only be considered where absolutely necessary, and where a gravity connection to the existing municipal sewer system is not feasible.
• Pumpstations must be functional, simple as possible, and located as far as practically possible from any present or proposed residential areas to minimize community impact.
• All reasonable and practical measures must be considered and used in the planning and design of sewage pumpstations to minimize the incidence and effect of any pollution as a result of wastewater overflows into the environment and/or stormwater systems, except under the most extreme circumstances, inter alia through specification of quality components and good design.
Thus in locating or sitting the pumpstation the following should be borne in mind: • Minimum negative impact on the environment. • Minimum user inconvenience, as well as in terms of operating and maintaining it. • Minimum event impact, should something go wrong. • Must be situated above the 1:50 year flood line.
Pumpstations shall be designed to accommodate peak wet weather flow, with at least one reserve pump. It is recommended that a minimum of two pumps be permanently installed, each capable of pumping at a flow rate in excess of the peak wet weather flow. Excessive standby capacity should however also be avoided.
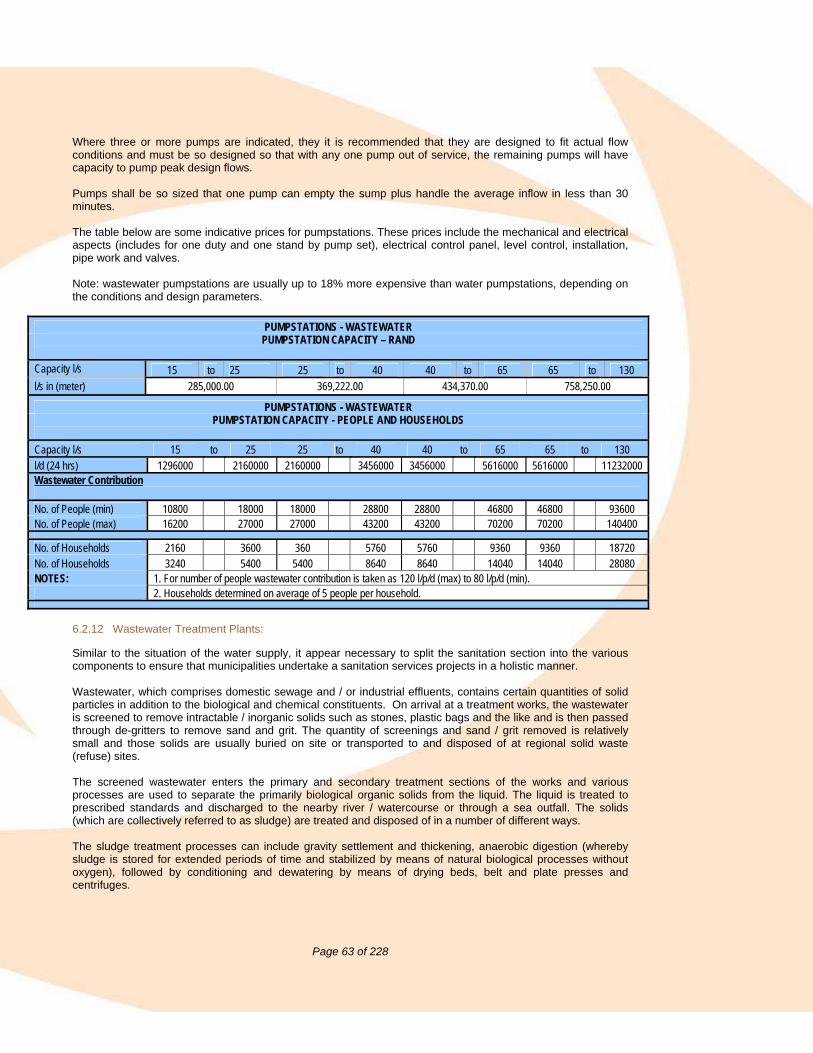
Page 63 of 228
Where three or more pumps are indicated, they it is recommended that they are designed to fit actual flow conditions and must be so designed so that with any one pump out of service, the remaining pumps will have capacity to pump peak design flows. Pumps shall be so sized that one pump can empty the sump plus handle the average inflow in less than 30 minutes. The table below are some indicative prices for pumpstations. These prices include the mechanical and electrical aspects (includes for one duty and one stand by pump set), electrical control panel, level control, installation, pipe work and valves. Note: wastewater pumpstations are usually up to 18% more expensive than water pumpstations, depending on the conditions and design parameters.
PUMPSTATIONS - WASTEWATER PUMPSTATION CAPACITY – RAND
Capacity l/s 15 to 25 25 to 40 40 to 65 65 to 130 l/s in (meter) 285,000.00 369,222.00 434,370.00 758,250.00
PUMPSTATIONS - WASTEWATER PUMPSTATION CAPACITY - PEOPLE AND HOUSEHOLDS
Capacity l/s 15 to 25 25 to 40 40 to 65 65 to 130 l/d (24 hrs) 1296000 2160000 2160000 3456000 3456000 5616000 5616000 11232000 Wastewater Contribution No. of People (min) 10800 18000 18000 28800 28800 46800 46800 93600 No. of People (max) 16200 27000 27000 43200 43200 70200 70200 140400
No. of Households 2160 3600 360 5760 5760 9360 9360 18720 No. of Households 3240 5400 5400 8640 8640 14040 14040 28080 NOTES: 1. For number of people wastewater contribution is taken as 120 l/p/d (max) to 80 l/p/d (min). 2. Households determined on average of 5 people per household.
6.2.12 Wastewater Treatment Plants:
Similar to the situation of the water supply, it appear necessary to split the sanitation section into the various components to ensure that municipalities undertake a sanitation services projects in a holistic manner. Wastewater, which comprises domestic sewage and / or industrial effluents, contains certain quantities of solid particles in addition to the biological and chemical constituents. On arrival at a treatment works, the wastewater is screened to remove intractable / inorganic solids such as stones, plastic bags and the like and is then passed through de-gritters to remove sand and grit. The quantity of screenings and sand / grit removed is relatively small and those solids are usually buried on site or transported to and disposed of at regional solid waste (refuse) sites. The screened wastewater enters the primary and secondary treatment sections of the works and various processes are used to separate the primarily biological organic solids from the liquid. The liquid is treated to prescribed standards and discharged to the nearby river / watercourse or through a sea outfall. The solids (which are collectively referred to as sludge) are treated and disposed of in a number of different ways. The sludge treatment processes can include gravity settlement and thickening, anaerobic digestion (whereby sludge is stored for extended periods of time and stabilized by means of natural biological processes without oxygen), followed by conditioning and dewatering by means of drying beds, belt and plate presses and centrifuges.

Page 64 of 228

Page 65 of 228
The basic options for the ultimate disposal of the treated sludge are: Agricultural use including horticulture and forestry Landfill and land reclamation Marine disposal Incineration and disposal of residue by landfill
The DWAF guidelines (2003) summarized the material and costs of treatment works as follows (VAT incl.):
Costs per Household Treatment system Components Construction
method Typical Materials and
machinery
Labour
Oxidation ponds Primary and secondary ponds
Main contractor + small local contractors
1,800 800 1,000
Anaerobic pond with oxidation ponds
Primary anaerobic pond with secondary oxidation ponds
Main contractor + small local contractors
1,800 800 1,000
Activated sludge without biological P removal
Aerated reactor with sludge return from secondary settlers
Main contractor + electrical and mechanical contractors
2,200
Activated sludge with biological P removal
Anaerobic and anoxic reactors followed by aerobic reactor and sludge return
Main contractor + electrical and mechanical contractors
2,500
Trickling bio-filters Biofilters with sludge return
Main contractor + electrical and mechanical contractors
2,200
Rotating biological contactors (RBCs)
Biological contactors Main contractor + electrical and mechanical contractors
2,200
Note 1: all plants are assumed to have inlet screens and grit removal Note 2: activated sludge, bio-filters and RBCs have primary and secondary settling as well as sludge
digesters, sludge drying beds and effluent chlorination Note 3: for plants treating only solids free effluent, savings of R800 or more per household may be realized. Note 4: where existing plants are to be upgraded to accept the additional load, costs will be reduced
depending on the requirements, but savings of R500 or more per household may be realized.” The table below is based on the costs, of 2007 contract values, indicate total costs in the following region (excl P&G’s and VAT and Fees):
Item Description Civil Cost Mechanical Cost
Inlet works
Inlet works for 15 Ml/day plant. Mechanical includes for screens, grit removal, screening press and grit classifier.
600,000.00 650,000.00
Primary Sedimentation Tank
With internal diameter of 21m weir to weir. Side wall depth of 4.8m. Vertical wall thickness is 300mm and the floor slab is 200mm thick.
714,740.00 290,000.00
Reactor Reactor for 15 Ml/day plant - 44m x 50m by 4.5m deep. 3,343,985.00 700,000.00
Pumpstation
Built with concrete walls 3.5m below the ground and brick walls 3m above ground with timber roof truss. Four windows, one purpose made steel door with an opening for a crawl beam. To accommodate 4 pumps.
534,699.10 320,000.00

Page 66 of 228
Final Clarifier With internal diameter of 17m weir to weir. Side wall depth of 4.8m. Vertical wall thickness is 300mm and the floor slab is 200mm thick.
547,770.00 300,000.00
Sludge and Liquor Thickeners
Internal diameter of 14m, wall thickness of 300mm, sidewall depth of 5m
1,146,818.00 270,000.00
Sludge Holding Tank Internal dimensions: 12m x 8m. Side wall depth is 2.8m. Wall thickness is 250mm. Tank equipped with mixers.
394,680.00 40,000.00
Pumpstation
Built with concrete walls 5.4m below ground and brick walls 3.2m above ground and has a concrete roof. Has 6 windows, one double steel transformer door and one single steel transformer door.
822,870.00 -
Digester (2,500 m3)
Internal diameter of 16m, vertical wall height of 10.5m with wall thickness of 400mm. Floor slab and roof slab thickness is 300mm. Digester to be mixed and heated. Mechanical to include for mixing pumps, heat exchangers and boiler.
2,549,375.00 500,000.00
Fermenters Internal diameter of 7m, side wall depth of 7m, wall thickness and floor and roof slab thickness is 300mm
389,640.00 250,000.00
Emergency Dam Excavations, concrete work, pipe-work - 140m x 60m with double HDPE liner system. 6,918,761.00 -
The following are “package values” as related to the breakdown of wastewater treatment costs - for its civil, mechanical and consulting fees (based on 2007 actual contract values):
Cost 15 Ml/day 35 Ml/day 56 Ml/day Civil Construction 46,081,422.57 103,683,200.78 141,065,579.30
Mechanical & Electrical 21,946,829,.50 49,380,366.38 67,184,171.94
Consulting Fees 7,055,190.32 15,874,178.23 21,597,521.40
Sub-Total 75,083,442.39 168,937,745.39 229,847,272.64 VAT 10,511,681.94 23,651,284.35 32,178,618.17
TOTAL 85,595,124.33 192,589,029.74 262,025,890.81 Cost /Ml (Excl. VAT) R 5,01 million /Ml/day R 4,83 million /Ml/day R 4,60 million /Ml/day
Cost /Ml (Incl. VAT) R 5,71 million /Ml/day R 5,50 million /Ml/day R 5,24 million /Ml/day

Page 67 of 228
Table 6.2.12: Shows the range of unit costs in Rand/Ml for the various options of wastewater treatment, as developed from zero-based approach, following breakdown as depicted in Appendix 6:
Cost in Rand Limpopo Gauteng North West
Capacity Unit
Min Max Ave Min Max Ave Min Max Ave Wastewater Treatment Plant Primary and secondary treatment R / Ml 6,358,061 7,064,512 6,711,286 5,241,600 5,824,000 5,532,800 6,179,846 6,866,496 6,523,171Primary, secondary and tertiary treatment with nutrient - removal R / Ml 8,742,334 9,713,704 9,228,019 7,207,200 8,008,000 7,607,600 8,497,289 9,441,432 8,969,360Primary, secondary, tertiary and advance treatment - removal of suspended solids R / Ml 9,537,091 10,596,768 10,066,930 7,862,400 8,736,000 8,299,200 9,269,770 10,299,744 9,784,757
Cost in Rand Free State Kwa-Zulu Natal Mpumalanga
Capacity Unit
Min Max Ave Min Max Ave Min Max Ave Wastewater Treatment Plant Primary and Secondary treatment R / Ml 5,503,680 6,115,200 5,809,440 5,718,586 6,353,984 6,036,285 6,342,336 7,047,040 6,694,688Primary, secondary and tertiary treatment with nutrient - removal R / Ml 7,567,560 8,408,400 7,987,980 7,863,055 8,736,728 8,299,892 8,720,712 9,689,680 9,205,196Primary, secondary, tertiary and advance treatment - removal of SS R / Ml 8,255,520 9,172,800 8,714,160 8,577,878 9,530,976 9,054,427 9,513,504 10,570,560 10,042,032
Cost in Rand Northern Cape Western Cape Eastern Cape
Capacity Unit
Min Max Ave Min Max Ave Min Max Ave Wastewater Treatment Plant
Primary and secondary treatment R / Ml 6,709,248 7,454,720 7,081,984 6,106,464 6,784,960 6,445,712 5,294,016 5,882,240 5,588,128Primary, secondary and tertiary treatment with nutrient - removal R / Ml 9,225,216 10,250,240 9,737,728 8,396,388 9,329,320 8,862,854 7,279,272 8,088,080 7,683,676Full treatment with advanced treatment - removal of SS R / Ml
10,063,872 11,182,080 10,622,976 9,159,696 10,177,440 9,668,568 7,941,024 8,823,360 8,382,192

Page 68 of 228
6.2.12.1.1 Package Plants:
The following section provides more detail of on-site sanitation systems of 'package plant' costing and options. Unlike larger activated sludge works where a full compliment of componentry is a given, the scope of supply for 'package plants' can vary for many reasons, some of which would include: retro-fitting where some basic infrastructure is already in place, topographical implications, process requirements, discharge methodology (irrigation or to receiving water body), etc.
Delivery, installation and commissioning and prerequisite site works (site preparation) has been included in the costing, in order to allow for the comparing of costs with large activated sludge works, ponds etc. As a rule of thumb, delivery, installation and commissioning amount to about 10% and prerequisite site works amount to about 5% of the plant stand alone price. In the tables a selection of hydraulic levels of entry i.e. from the Single House at two (2) kilolitres per day up to one (1) mega-liter per day is provided. Combinations can be calculated by interpolation for hydraulic requirements from the table, following. Note: laboratory costs for reporting purposes only realistically becomes applicable at the 24 kl/day duty level, as DWAF does not require analytical reporting under 10 kl/day duty and the 12 kl/day duty would generally not be attained due to conservative engineering.
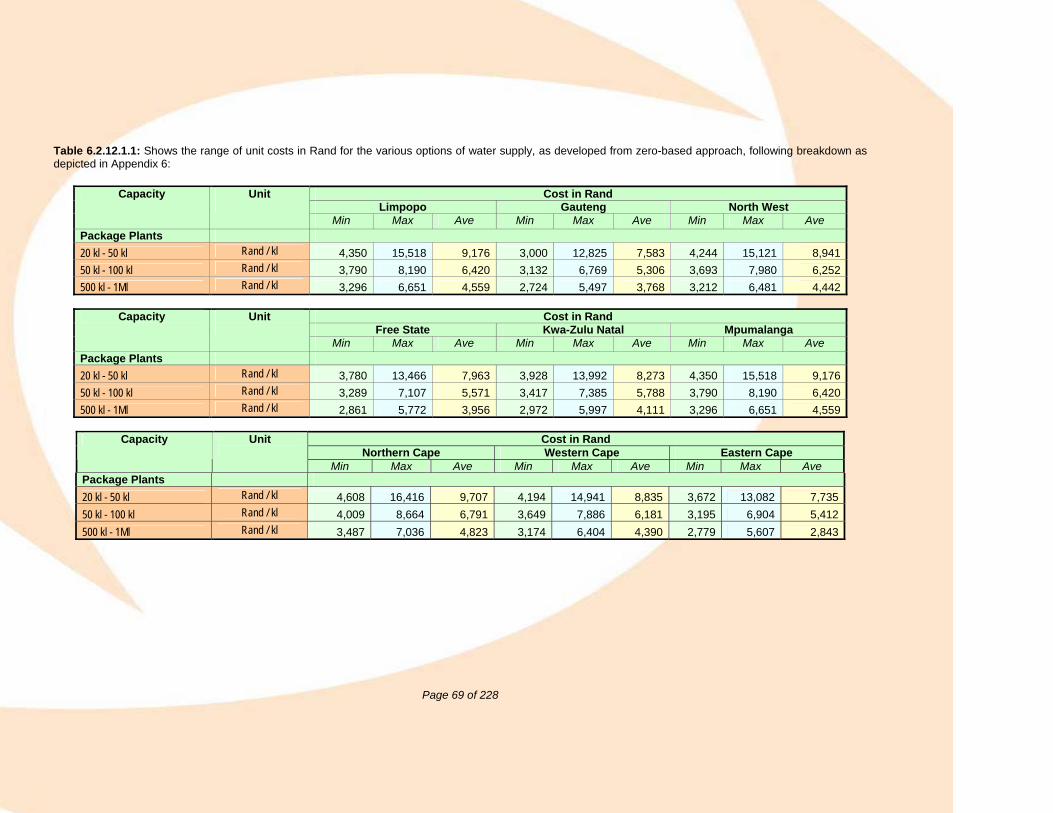
Page 69 of 228
Table 6.2.12.1.1: Shows the range of unit costs in Rand for the various options of water supply, as developed from zero-based approach, following breakdown as depicted in Appendix 6:
Cost in Rand Limpopo Gauteng North West
Capacity Unit
Min Max Ave Min Max Ave Min Max Ave Package Plants 20 kl - 50 kl Rand / kl 4,350 15,518 9,176 3,000 12,825 7,583 4,244 15,121 8,94150 kl - 100 kl Rand / kl 3,790 8,190 6,420 3,132 6,769 5,306 3,693 7,980 6,252500 kl - 1Ml Rand / kl 3,296 6,651 4,559 2,724 5,497 3,768 3,212 6,481 4,442
Cost in Rand
Free State Kwa-Zulu Natal Mpumalanga Capacity Unit
Min Max Ave Min Max Ave Min Max Ave
Package Plants 20 kl - 50 kl Rand / kl 3,780 13,466 7,963 3,928 13,992 8,273 4,350 15,518 9,17650 kl - 100 kl Rand / kl 3,289 7,107 5,571 3,417 7,385 5,788 3,790 8,190 6,420500 kl - 1Ml Rand / kl 2,861 5,772 3,956 2,972 5,997 4,111 3,296 6,651 4,559
Cost in Rand
Northern Cape Western Cape Eastern Cape Capacity Unit
Min Max Ave Min Max Ave Min Max Ave
Package Plants 20 kl - 50 kl Rand / kl 4,608 16,416 9,707 4,194 14,941 8,835 3,672 13,082 7,73550 kl - 100 kl Rand / kl 4,009 8,664 6,791 3,649 7,886 6,181 3,195 6,904 5,412500 kl - 1Ml Rand / kl 3,487 7,036 4,823 3,174 6,404 4,390 2,779 5,607 2,843

Page 70 of 228
6.3 Roads 6.3.1 Definition/Description
A road can be described as an area or surface that has been disturbed from its natural condition by giving it specific treatment to make it suitable for use by a range of vehicles. 6.3.2 Purpose Of Road Infrastructure
The purpose of a road is to provide access to a particular area or place in such a way that people and goods can be transported along the road in a safe and comfortable way. Whilst this is taking place, damage to vehicles due to road condition should not occur or must be limited. A road as a basic service is therefore, infrastructure that is provided to the community for the transport of people and goods as follow:
Access to their homes Access to their places of work Access to schools Access to health services Access to the elderly for social and other grant payouts Importing of basic goods and groceries to the community Access to provide and to import basic infrastructure Access to provide and to import basic services to the community.
6.3.3 Geographical Context
Road infrastructure can be classified as being either rural, urban or within a Metropolis. The significance of these different classifications will be appreciated with later reference to basic levels of services and unit costing. TYPICAL RURAL ROAD TYPICAL METRO ROAD

Page 71 of 228
TYPICAL URBAN/ SUBURB ROAD
6.3.4 Basic Level Of Service Currently, there is not a national policy that defines a basic level of service for roads serving households in residential areas. However, the Municipal Infrastructure Investment Framework refers to "all-weather access to within 500 m of the dwelling". This could be interpreted as a ‘basic level of service’. In urban areas, it is generally possible to improve upon this specification and to provide for access by a vehicle to each erf. In some rural areas, where there are very small, scattered settlements, it may not be feasible to provide all-weather access to within 500 m of every dwelling. The basic level of service to be provided in the rural context is a minimum of an access to the center point in a village or an area. This basic service can be extended to include some of the main accesses, spurs or lanes linked to the main thoroughfare in the village. With time as all villages have been provided with this basic service the basic level of service can then be upgraded to the next level that may then include all other roads and tracks in the village. In all instances, the surface of the road will be gravel. In the urban context, a gravel road is not acceptable as a basic service. This is due to the impact of O & M costs and other urban road users applications (e.g. emergency services refuse removal, street sweeping by mechanical means), the type of vehicles (e.g. taxis, buses), as well as the vehicle count per day. In the metropolis areas, the basic level of road service is a durable, all weather surfaces that results in a minimum of O & M costs to be incurred. Considering these issues, it is understood that the basic level of service will vary according to the geographical context of rural, urban and metro areas. The basic level of service provided should be based on the above approaches, but must also be a service option agreed to by the community (meeting their needs) and the Local Authority (minimizing their O & M costs). This will require that the purpose of any road to be funded from MIG be clearly defined, supported and motivated. The vehicle count and an analysis of the vehicle type currently using the road must also be presented to support the motivation. Value Engineering and Life Cycle Costing are valuable exercises to inform and lead to responsible decision-making, regarding the most appropriate level of service for the specific circumstances over a longer term.
6.3.5 Level Of Service Options Starting at a basic level, the level of service options include:
• All-weather access to within 500 m of the dwelling; • Paved width (intermediate or full level of service); • Access to each erf with graded or gravel-paved road (basic); • Access to each erf with a narrow paved road or a wider road with a narrow paved width (intermediate
or full level of service); and • Paved streets with kerbs (full level of service).

Page 72 of 228
Gravel roads are not recommended in areas where there is high rainfall and high volumes of traffic. Paved roads are preferable options when considering job creation, by employing labour intensive construction methods.
The level of basic road infrastructure options is determined by the following factors:
• The needs of the community; • The number of vehicles per day; • The type of vehicle that must be accommodated; • The funds available to provide the basic service; • The expected O & M costs and the availability of funds to absorb this level of O & M costs to maintain
the road at the required level; • The adaptability and suitability of the proposed road surface to the stormwater drainage to be used -
these must be considered due to the strong linkages that exist between roads and stormwater service options (in a similar manner that water and sanitation services are linked).
.
In general, the various levels of services options include: Rural – Gravel road service (Low Level) Urban – Chip and spray surface treatment with gravel only in the exceptional cases e.g. alleyways and lanes (Intermediate Level) Metro – Hot premix or concrete surfaced roads (High Level)
6.3.5.1 Access to each plot with a graded or gravel-paved road In areas where car ownership is low, it may be appropriate to have simple earth or gravel roads. Where local soils are of good quality, it may be possible to grade the existing material into a road formation. In other circumstances, a graveled layer may be needed. An earth/graded road is not acceptable as a minimum level of service. Advantages
Disadvantages
• Low cost.
• Dusty. • Can be impassable during very rainy periods. • Not suited to heavy traffic. • Requires frequent maintenance (this maintenance
can be labour-intensive and locally managed).
6.3.5.2 Narrow paved road or road with narrow paving For this option the road would be sealed, but would be built with a narrow width or have only a narrow width paved (about three meters) to save costs. The paving could be single- layer bituminous "chip and spray", pre-
Urban and Rural Kerb-side

Page 73 of 228
cast blocks or other types. Paved roads require several layers of material below the paving for support and to give the road sufficient strength. Advantages
Disadvantages
• All-weather driving surface. • Reasonably low maintenance intervals.
• Passing vehicles need to pull on to gravel shoulder.
• Fairly expensive.
6.3.5.3 Paved streets with kerbs For this option the road would be of sufficient width for two lanes and would have the full width paved. Paving durability would typically be greater than for the previous option. The road would typically be provided with kerbs or edging of some sort. While maintenance intervals are longer than with other options, the cost of maintenance, when it is needed, is high and specialists are generally needed to do the maintenance work. Advantages
Disadvantages
• All-weather driving surface. • Low maintenance intervals.
• High Cost
The estimates of unit costs for provision of different types of roads are provided in the table below. 6.3.6 Advantages/Disadvantages The advantages and disadvantages of the different service level options are summarized in the table below:
Advantages
Disadvantages
Rural – Low Level Urban – Intermediate Metro – High Level
Low cost Easy construction Low maintenance cycle Damage to vehicles limited All weather driving surface All weather driving surface Maintenance not highly specialized
Dusty surface May be impassable after
prolonged and heavy rain. Road surface subject to
damage by high rainfall. Not suited for high traffic
counts Not suited for heavy traffic Frequent maintenance
required High O & M costs
Expensive construction Specialized construction High replacement cost
Expensive construction Surface can be subject to damage during high rainfall
6.3.7 Standards Of Construction
The construction of road infrastructure must be implemented in accordance with SANS 1200: Standard Specification for Civil Engineering Construction. This includes the relevant sub specification related to the specific activity being undertaken e.g. Earthworks (SANS 1200 D), Gabions and Pitching (SANS 1200 DK), Concrete Work (SANS 1200 G), etc. The Consulting Engineer employed must be registered as a Professional Engineer with adequate Professional

Page 74 of 228
Indemnity insurance. A proven track record of relevant experience for the type of road project being undertaken is essential. Proof of the expertise in the firm relating to the type of project must also be obtained. For EPWP projects Labour Intensive Construction Qualifications is compulsory e.g. NQF 7 and NQF 5.
6.3.8 Unit Costs
The topography of the road and the geographical location/area implies variances in the rainfall and stormwater run-off expected. Therefore, the unit costs associated with a road project can vary considerably over a spread of different projects, depending on the extent of stormwater being provided for. Where extensive stormwater (e.g. culverts, pipe drains) is required as part of the road the appropriate section on stormwater must be consulted and applied to determine the unit cost for those elements. This can then be added to give a total unit cost for the road. The unit costs applicable to roads as stated below include the construction of layer works only. The unit costs do not include any stormwater or stormwater structures, which is being dealt with separately under section 6.4. (e.g. drains, culverts, etc). The table below shows the range of unit costs in Rand/km for the various levels of roads, with open channels, as developed from the escalation approach.
With stormwater
National Average Cost price per kilometer of road
• Gravel roads (width 4,5 – 6 meters) R900 000 – Basic Level of Service
• Chip and Spray (width 4,5 – 6 meters) R1 1280 000 – Intermediate Level of Service
• Paved/Sealed/Paving blocks (6 meters wide) R1 254 000 and more – Full Level of Service

Page 75 of 228
Table 6.3.8: Shows the range of unit costs in (Rand/km) for the various options of Roads, as developed from zero-based approach, following breakdown as depicted in Appendix 6:
Cost in Rand
Limpopo Gauteng North West Infrastructure: Roads Unit
Min Max Ave Min Max Ave Min Max Ave Service level Graveled – Rural R / km 363,153 390,389 376,771 294,605 327,339 310,972 337,460 371,206 354,333Graveled – Urban R / km 283,630 304,902 294,266 230,456 256,062 243,259 265,422 291,964 278,693Low level paved chip and spray R / km 4,432,591 4,765,035 4,598,813 3,607,252 4,008,057 3,807,654 4,177,101 4,594,811 4,385,956High level paved bitumen R / km 5,022,504 5,399,192 5,210,848 4,087,325 4,541,472 4,314,398 4,733,013 5,206,314 4,969,664
Cost in Rand
Free State Kwa-Zulu Natal Mpumalanga Infrastructure: Roads Unit
Min Max Ave Min Max Ave Min Max Ave Service Level Graveled – Rural R / km 343,732 378,105 360,919 337,555 362,872 350,213 343,732 378,105 360,919Graveled – Urban R / km 271,219 298,341 284,780 268,115 288,224 278,169 271,219 298,341 284,780Low level paved chip and spray R / km 4,281,808 4,709,989 4,495,898 4,260,244 4,579,762 4,420,003 4,281,808 4,709,989 4,495,898High level paved bitumen R / km 4,851,654 5,336,819 5,094,237 4,827,221 5,189,263 5,008,242 4,851,654 5,336,819 5,094,237
Cost in Rand
Northern Cape Western Cape Eastern Cape Infrastructure: Roads Unit
Min Max Ave Min Max Ave Min Max Ave Service Level Graveled – Rural R / km 342,806 404,511 373,659 355,785 409,153 382,469 333,689 383,743 358,716Graveled – Urban R / km 266,126 314,029 290,077 281,738 323,999 302,868 264,917 304,655 284,786Low level paved chip and spray R / km 4,133,710 4,877,778 4,505,744 4,483,012 5,155,464 4,819,238 4,207,258 4,838,346 4,522,802High level paved bitumen R / km 4,683,847 5,526,939 5,105,393 5,079,636 5,841,581 5,460,609 4,767,183 5,482,260 5,124,722

Page 76 of 228
6.4 Stormwater 6.4.1 Definition/Description Stormwater is the accumulation of rain and other forms of precipitation after it has fallen and the consequential flow/runoff from higher to lower lying ground in the process of reaching streams and rivers. 6.4.2 Purpose Of Stormwater Infrastructure The purpose of providing stormwater infrastructure is to manage the volume, flow velocity and direction of flow of the accumulated stormwater. These run-off water must be controlled to acceptable levels in order to minimize the damaging effect that the stormwater may have on the environment, property and other forms of existing infrastructure. The volume of stormwater encountered is dependent on the rainfall. Due to the variances experienced in South African rainfall events, the stormwater is expressed in terms of the re-occurrence or return period. To manage and control the extreme cases becomes an expensive exercise and therefore good engineering judgment must be applied in selecting what the particular return period will be. Uncontrolled stormwater impacts severely on access enjoyed by communities and for this reason, stormwater is closely linked (and planned) with road construction. 6.4.3 Geographical Context
Stormwater is encountered in both rural and urban areas. Therefore the management and control must be applied in both areas. TYPICAL RURAL STORMWATER TYPICAL URBAN/METRO STORMWATER

Page 77 of 228
6.4.4 Basic Level Of Service The basic level of service for stormwater in rural areas comprise of open channels along the road or through open areas. These channels may be lined (with concrete or other materials) or unlined. In the urban context, however, the stormwater system is a combination of open channels and underground pipes. The stormwater can be channeled to underground pipes by kerbs and catch-pits. 6.4.5 Level Of Service Options The level of service selected will be determined by the geographic context. In rural areas, stormwater will mostly comprise of open channels. In the urban context, it will be a combination of channels and pipes that will be determined by the volume and flow of the stormwater. Consideration of the possible damage to the environment, property and other infrastructure could result in more piped stormwater in the urban context.
6.4.6 Advantages/Disadvantages The advantages and disadvantages of the different service level options and possible failure of the service are summarized in the table below: Advantages
Disadvantages
Rural – Low Level Urban – High Level
Less run-off due to natural vegetation Limited damage to property and assets Low cost Less consequences of road access
failure due to alternative routes available for use.
Severe consequences of road access failure
High cost Severe damage to assets and
property More run-off due to paved areas
6.4.7 Standards Of Construction The construction of stormwater infrastructure must be implemented in accordance with SANS 1200: Standard Specification for Civil Engineering Construction. This includes the relevant sub specification related to the specific activity being undertaken e.g. Kerbing and Channeling (SANS 1200 MK), Gabions and Pitching (SANS 1200 DK), Pipe Trenches (SANS 1200 DB), etc. The Consulting Engineer employed must be registered as a Professional Engineer with adequate Professional Indemnity insurance. A proven track record of relevant experience for the type of road project being undertaken is essential. Proof of the expertise in the engineering firm relating to the type of project must also be obtained. For EPWP projects Labour Intensive Construction Qualifications is compulsory e.g. NQF 7 and NQF 5. The suggested design parameters for stormwater are as follow:
• Rural Stormwater - Minimum Return period of 1 in 5 years • Urban Stormwater - Minimum Return period of 1 in 5 years
It should be noted that the guidelines of the applicable authority i.e. Local Authority or Provincial Department must be consulted. Of critical importance is applying good engineering judgment when doing a sensitivity and “what if” analysis to determine the consequences of failure. This could result in the design parameters being adjusted to 1 in 7 or even 1 in 10 years. These cases will have to be well motivated. Feasibility studies are of utmost importance to consider these aspects, before design and construction of the road and stormwater.
6.4.8 Unit Costs The unit costs for stormwater infrastructure will be largely determined by the return period of the run-off. The consequences of failure must be considered and evaluated against the cost of providing adequate stormwater. The unit costs applicable to the different levels of service are:

Page 78 of 228
Table 6.4.8: Shows the range of unit costs in Rand for the various options of Stormwater, as developed from zero-based approach, following breakdown as depicted in Appendix 6:
Cost in Rand Limpopo Gauteng North West
Infrastructure Unit
Min Max Ave Min Max Ave Min Max Ave Stormwater Un lined R / km 213,194 229,184 221,189 172,409 191,566 181,988 195,336 214,870 205,103Lined R / km 702,124 754,783 728,454 572,290 635,878 604,084 666,273 732,900 699,587Pipe culverts R / km 3,342 3,593 3,467 2,724 3,027 2,876 3,172 3,489 3,331Box culverts R / km 15,765 16,947 16,356 12,849 14,277 13,563 14,960 16,456 15,708Low level stream crossings R / km 114,349 122,925 118,637 93,204 103,560 98,382 108,510 119,361 113,936Dewatering subsoil drains R / km 422 469 446 382 425 404 401 445 423
Cost in Rand Free State Kwa-Zulu Natal Mpumalanga
Infrastructure Unit
Min Max Ave Min Max Ave Min Max Ave Stormwater Un lined R / km 193,187 207,676 200,432 197,671 217,438 207,555 191,470 205,830 198,650Lined R / km 717,086 770,867 743,977 685,095 753,605 719,350 685,973 737,421 711,697Pipe culverts R / km 4,314 4,638 4,476 3,261 3,587 3,424 3,266 3,511 3,388Box culverts R / km 16,100 17,308 16,704 15,382 16,920 16,151 15,402 16,557 15,980Low level stream crossings R / km 116,785 125,544 121,164 111,575 122,733 117,154 111,718 120,097 115,907Dewatering subsoil drains R / km 431 479 455 412 458 435 413 458 436
Cost in Rand
Northern Cape Western Cape Eastern Cape Infrastructure Unit
Min Max Ave Min Max Ave Min Max Ave Stormwater Un lined R / km 203,665 240,325 221,995 202,160 232,484 217,322 189,478 217,900 203,689Lined R / km 650,751 767,886 709,319 721,276 829,467 775,372 677,147 778,719 727,933Pipe culverts R / km 3,098 3,656 3,377 3,434 3,949 3,692 3,223 3,707 3,465Box culverts R / km 14,611 17,241 15,926 16,195 18,624 17,410 15,204 17,484 16,344Low level stream crossings R / km 105,982 125,059 115,520 117,468 135,088 126,278 110,281 126,823 118,552Dewatering subsoil drains R / km 391 435 413 434 482 458 407 453 430

Page 79 of 228
Poor maintenance of open drains leads to soil erosion, or erosion of the road, thus requiring expensive repairs. A piped system without maintenance can lead to blockages, demanding complete reconstruction. 6.5 Solid Waste Disposal (Municipal Collection) 6.5.1 Basic Level Of Service Government requires that "a refuse removal service" be provided at least once a week. This can be interpreted as some arrangement to remove the solid waste from an area at least once a week.
6.5.2 Level Of Service Options (Collection)
The range of options includes: • Household transfer to communal skips; waste in skips transported to proper landfill sites (basic). • Organized transfer to communal skips; waste in skips transported to proper landfill sites (intermediate). • Kerb-side collection; to landfill sites (full).
6.5.2.1 Household transfer to communal skips (basic level of service)
For this option, individual households must carry their own solid waste to a communal point in their neighborhood, where skips are provided. The skips are then removed and emptied at a landfill site by the municipality or a contractor appointed by the municipality. Typical cost: R 8 - R 15 /household /month.
Advantages
Disadvantages
• Simple system. • Low operating cost.
• If the distances are too great, people dump their rubbish in the street.
• The collection point may become untidy and unhygienic.
6.5.2.2 Organized transfer to communal skips (basic level of service)
For this option local contractors are appointed to collect the waste door-to-door. They transport it to a local collection point, perhaps using hand or bicycle-carts. The municipality, or another contractor, then transports the waste in skips to landfill sites. Typical cost: R 13 – R 17 /household /month. Advantages
Disadvantages
• Convenient for households. • Creates jobs. • Contractor can also clean streets.
Contractor may be inexperienced or unreliable, requiring extra supervision.
The collection point may become untidy and unhygienic
6.5.2.3 Kerb-side collection (full level of service) Households put their rubbish out for collection once or twice a week. The municipality or appointed contractors collect the waste in trucks, or with tractors and trailers, and transport it to the landfill. Typical cost: R55 – 65 / household / month, bin rental at R 6 – 9 / month. Advantages
Disadvantages
Convenient for households. No storage of waste at collection points
• Fairly expensive option. • Requires substantial investment in specialized
vehicles/equipment.

Page 80 of 228
6.6 Street/Community Lighting 6.6.1 Definition/Description
Street lighting/Community lighting is the provision of electrical lights to light up the area in which people live.
6.6.2 Purpose Of Street Lighting/Community Lighting Infrastructure The purpose of street lighting is to ensure safe and easy movement of the community at night. In addition, it functions to create a safe and secure environment for the people of the community. It further serves as security measure to protect property of the people and of the Local Authority. 6.6.3 Geographical Context Street lighting is mainly a feature of the urban environment. It can only be provided where development has taken place that includes electrical reticulation as this is required to facilitate the connecting of street lighting.
6.6.4 Basic Level Of Service Although street lighting is high on the needs list of communities it is not regarded as a basic service in the same sense as water or sanitation. 6.6.5 Level Of Service Options Two types of street lighting is possible. The final choice of service to be provided must made after consideration of the advantages and disadvantages listed below. The options of street lighting available are briefly outlined below 6.6.5.1 Streetlights
Streetlights are provided for in areas that have previously been reticulated. The choice between midblock and streetlights is for the preference of the municipality and community. Note that midblock lighting is not favoured, as result of the high possibility of vandalism, illegal connections and theft. One streetlight is provided per four (4) stands at a cost of R 6 200 per streetlight.
6.6.5.2 High Mast Lights High mast lights can be provided in dense settlements. One high mast light, 30 meters high covers the radius of 150 m2 and diameter of 300 m2 serves approximately 30 households at the national average cost of R 168 000

Page 81 of 228
00. Anything outside this range will require a strong motivation from the municipalities concerned.
6.6.6 Advantages/Disadvantages The advantages and disadvantages of the two types of street lighting that can be provided are summarized in the table below: Advantages
Disadvantages
Street lighting High Mast Lights
Low technology construction More labour intensive for
Construction Easy access for maintenance
and repair Low technology required for
maintenance Access difficult and hence
vandalism
Easy object for vandalism Illegal connections can easily
be made Relatively high technology not
subject to construction Less labour intensive
construction High technology required for
maintenance Access difficult for maintenance Illegal connections difficult
6.6.7 Standards Of Construction The construction of street lighting infrastructure must be implemented in accordance with SANS 0142. This includes the relevant sub-specifications related to the specific activities being undertaken. The Consulting Engineer employed must be registered as a Professional Engineer with adequate Professional Indemnity insurance. A proven track record of relevant experience for the type of electrification project being undertaken is essential. Proof of the expertise in the firm relating to the type of project must also be obtained. For EPWP projects Labour Intensive Construction Qualifications is compulsory e.g. NQF 7 and NQF 5.
6.6.8 Unit Costs
The unit costs to provide the two options of street lighting are as follow:

Page 82 of 228
Table 6.6.8: Shows the range of unit costs in Rand for the various options of Street / Community Lighting, as developed from zero-based approach, following breakdown as depicted in Appendix 6:
Cost in Rand Limpopo Gauteng North West
Infrastructure: Street Lighting Unit
Min Max Ave Min Max Ave Min Max Ave Street / Community Lighting Streetlights R / street light 6,799 7,309 6,459 5,533 6,148 5,841 6,407 7,048 6,087High Mast Lights R / high mast 184,576 198,419 175,347 150,208 166,898 158,553 173,936 191,330 165,239
Cost in Rand
Free State Kwa-Zulu Natal Mpumalanga Infrastructure: Street Lighting Unit
Min Max Ave Min Max Ave Min Max Ave Street / Community Lighting Streetlights R / street light 6,786 7,295 6,447 6,568 7,225 6,239 6,535 7,025 6,208High Mast Lights R / high mast 184,232 198,049 175,020 178,297 196,127 169,382 177,399 190,704 168,529
Cost in Rand
Northern Cape Western Cape Eastern Cape Infrastructure: Street Lighting Unit
Min Max Ave Min Max Ave Min Max Ave Street / Community Lighting Streetlights R / street light 6,341 7,482 6,024 6,876 7,907 6,533 6,454 7,422 6,131High Mast Lights R / high mast 172,130 203,113 163,524 186,675 214,676 177,342 175,193 201,472 166,433

Page 83 of 228
7. PUBLIC MUNICIPAL SERVICE INFRASTRUCTURE (P) MIG is aimed at assisting the poor to gain access to infrastructure. MIG funds can only be used for infrastructure for basic levels of service. Basic public municipal service infrastructure including public transport, emergency services and community services may be newly constructed or existing infrastructure may be rehabilitated with MIG funds. 7.1 Public Transport The funds intended to be used from the MIG allocation for Public Municipal Infrastructure type of projects may not exceed the proportional allocation calculated in the MIG formula i.e. P component. 7.1.1 Definition Busses and taxis are two of the most common means of public transportation used by the majority of South African. Bus shelters and taxi ranks therefore provide major holding areas and boarding points for accessing public transport services within urban areas and to and from urban to rural areas. 7.1.2 Purpose Of Infrastructure The purpose of this infrastructure is to provide:
An effective and safe boarding points Shelter for the commuter from the elements Relative health and welfare comforts such as access to ablution facilities and market stalls.
7.1.3 Geographical Context Both forms of transport play a major role, both within the rural as well as urban context. Access to these transport modes is usually achieved via a bus or taxi shelters. The impact of the geographical context on the infrastructure is mainly in terms of size, and access to commuter routes and or rail and other public transport services. 7.1.4 Basic Service Level Bus shelters can be combined with taxi ranks where practical and where conflict between the different operators is not likely to occur. In such instances, it will normally be located close to an area where large gatherings of commuters occur such as at train stations or shopping complexes. The most common facilities for which provision is made for ablution blocks, hawker stalls, shelter for commuters, administration office, high mast lights, waste disposal, washing bay and a repair area. (The latter two aspects are mainly in relation to the taxi industry). The extent of the facilities will range based on size of population using it and will include variations of the above facilities, with the most minimal being adequate lighting, commuter shelter. These smaller shelters are normally built along streets on bus routes in towns and in the rural areas. 7.1.5 Level Of Service Options 7.1.5.1 Bus shelters Two types of bus shelters shall be discussed to address the various applications for bus shelters. 7.1.5.1.1 Bus shelters for bus ranks Such shelters shall be of sufficient height to allow a bus to travel freely under the roof and of sufficient size to cover both the bus and waiting passengers on the center island. Normal practice allows for busses to line up in single file with a minimum of one bus that will park under the shelter itself during the loading of passengers. Several of these lanes can be provided alongside each other with each lane serving a different destination. The bus lanes will typically be 3,5m wide and the length to be covered by the shelter shall be 15m long. The center island between the different bus lanes shall be 3m wide where waiting passengers can queue before embarking on busses. This implies that a total width of not less than 6,5m is required for each destination being catered for in the bus rank. The length of the lanes shall be a minimum of 30m to allow for one bus under the shelter and one bus waiting in the queue to load passengers.

Page 84 of 228
Sufficient maneuvering space shall be provided at the entrance and exit sides of the lanes to allow busses to enter and exit the lanes. The turning circles of buses must be taken into account in this regard. The suggested width/length of the maneuvering areas is 15m before and after the bus lanes. The above geometry results in a total length of 60m for the bus rank. Therefore, the minimum area required for each destination catered for is 60m by 6,5m or about 390 square m. The total width will depend on the number of lanes that are provided and shall preferably have a minimum width of approximately 30m. The bus rank surface shall be paved with either interlocking concrete blocks or a bituminous layer. The islands between the bus lanes shall be created with figure 3 concrete vertical kerbs and the raised surfaces shall be interlocking concrete blocks. The total bus rank shall also have figure 3 concrete kerbs around the outside circumference to act as barrier for the surfacing. The estimated unit cost for the layer works and interlocking block paving including the kerbs is approximately R220 per m2. Stormwater drainage shall be on surface as far as possible with kerbs inlets or grid inlets at the low portions of the area with pipes leading to nearby municipal stormwater lines or channels. The bus shelter shall be manufactured from cold formed lipped channel (CFLC) profiles with metal sheeting as roof cover. Square or round hollow sections shall be used for columns. Column footings shall be reinforced concrete and will be placed in the islands. The estimated unit cost for the steel structure including the roof sheeting and concrete footings is R175-00 per m2.
7.1.5.1.2 Bus shelters for streets These bus shelters will typically be erected along bus routes in ordinary streets and shall cater for 10 to 15 passengers. The structure shall be manufactured from CFLC profiles with metal sheeting for the roof cover and side cladding. The seating can also be manufactured from CFLC profiles as part of the shelter structure. The estimated unit cost for a street bus shelters is R160-00 per m2. 7.1.5.2 Taxi ranks The size of the taxi rank will depend on the number of taxis that will serve a particular town or municipality. The taxi rank can be combined with a bus rank as mentioned before but will depend on the particular needs of a specific town or municipality.

Page 85 of 228
7.1.5.2.1 Layout of taxi rank
The taxi rank shall have 2,5m wide lanes where the taxis will line up to pick up passengers. Islands shall be provided between the lanes and the typical width shall be 1,5m. This implies that a total width of not less than 4,0m is required for each destination being catered for in the Taxi rank. The length of a lane shall typically be 25m to allow for 4 taxis to queue per lane. A covered shelter shall be provided as a minimum over the last 11m to provide cover for waiting passengers. Several of these lanes can be provided alongside to allow for the different destinations that shall be served by the taxis. An open parking area for waiting taxis can also be constructed in the same taxi rank to cater for waiting taxis during off-peak periods. Sufficient maneuvering space shall be allowed at the entrance and exit sections of the lanes and shall typically be 10,0m at both ends. The turning circles of the taxis must be taken into account in this regard. The open parking area shall allow the normal 2,5m wide by 5m long parking bays and shall be arranged to one side of the taxi rank to prevent interference with taxis moving into the passenger lanes. This geometry will results in the minimum length of the taxi rank being 45m and the width dependant on the number of lanes provided. It is suggested that a minimum number of 4 lanes are provided. An open parking area of 7,5m wide along the one long side of the taxi rank and a 7,5 m wide “road lane” between the parking area and the passenger lanes must also be allowed for. This will result in a total width of the taxi rank being approximately 30m. Therefore the minimum area required for each destination catered for is 45m by 30m or about 1 350 square m.
The taxi rank surface shall be paved with either interlocking concrete blocks or a bituminous layer. The islands between the taxi lanes shall be created with figure 3 concrete vertical kerbs and the raised surfaces shall be interlocking concrete blocks. The total taxi rank shall also have figure 3 concrete kerbs around the outside circumference to act as barrier for the surfacing. The estimated unit cost for the layer works and interlocking block paving including the kerbs is approximately R225-00 per m2. Stormwater drainage shall be on surface as far as possible with kerb inlets or grid inlets at the low portions of the area with pipes leading to nearby municipal stormwater lines or channels. The taxi shelter shall be manufactured from cold formed lipped channel (CFLC) profiles with metal sheeting as roof cover. Square or round hollow sections shall be used for columns. Column footings shall be reinforced concrete and will be placed in the islands. The estimated unit cost for the steel structure including the roof sheeting and concrete footings is R160-00 per m2.

Page 86 of 228
7.1.5.3 Sidewalks Sidewalks are normally provided alongside roads in densely populated areas for the safety of pedestrians. Sidewalks shall either be finished with a gravel wearing course, with concrete paving blocks or with a bitumen surface depending on the location of the sidewalks. Sidewalks shall typically be 1,5m wide and shall start on the road edge or behind the kerb. 7.1.5.3.1 Gravel sidewalk The sidewalk route shall be leveled and all plant material and other debris shall be removed. The top of the re-worked surface shall be 150mm lower than the top of the kerb or the road level. The in-situ material shall be compacted to provide an even surface before the imported gravel is placed. The imported gravel shall be at least of G7 quality and shall be compacted to 93% modified AASHTO density. The surface shall be graded 1:100 towards the road in the case where no side channels are present in the streets. Where side channels are provided the surface shall be graded at 1:100 towards the side channels. The estimated unit cost for sidewalks with a gravel wearing course is R40-00 per m2 and include for the removal of topsoil and other unsuitable material. GRAVELLED SIDEWALK 7.1.5.3.2 Paved sidewalk The sidewalk route shall be leveled and all plant material and other debris shall be removed. The top of the reworked surface shall be approximately 180mm lower than the top of the kerb or the road surface. The in-situ material shall be compacted to provide an even surface before a 100mm thick layer of imported gravel is placed. The imported gravel shall be at least G5 quality and shall be compacted to 93% modified AASHTO density. The bedding sand layer of approximately 25 to 30mm shall be placed and 50mm thick paving blocks shall then be packed in a suitable pattern to form the sidewalk. The outer edge (away from the road) shall be restrained with either concrete garden kerbs (75mm wide by 225mm deep) or a concrete edge strip. The surface shall be graded at 1:100 towards the road in the case where no side drains are present. Where side drains are present the surface shall be graded at 1:100 towards the side drain. The estimated unit cost for sidewalks with concrete pavers is R105-00 per m2 and include for the removal of unsuitable material and topsoil. I would prefer to have the unit cost set out in a table – will see when it has been finalized.

Page 87 of 228
PAVED SIDEWALK 7.1.6 Standards Of Construction All civil work should be done in accordance with SANS 1200: Standardized Specification for Civil Engineering Construction. All other structures should be designed and constructed in accordance with the requirements of the National Building Regulations and all applicable SANS standards. 7.1.7 Unit Cost The cost estimates exclude VAT and is based on basic structures and services. The provision of toilets and water points at bus or taxi ranks are not considered in the proposals below.

Page 88 of 228
Table 7.1.7: Shows the range of unit costs in Rand for the various options of Public Municipal Services, as developed from zero-based approach, following breakdown as depicted in Appendix 6:
Cost in Rand
Limpopo Gauteng North West Infrastructure: Public Municipal Services
Unit
Min Max Ave Min Max Ave Min Max Ave Bus Shelters Bus shelters for bus ranks R / square meter 2,305 2,561 2,433 1,900 2,111 2,006 2,240 2,489 2,365 Bus shelters for streets R / square meter 2,305 2,561 2,433 1,900 2,111 2,006 2,240 2,489 2,365 Sidewalks Paved sidewalk R / square meter 185 199 192 138 153 145 180 198 189Gravel sidewalk R / square meter 115 124 119 85 95 90 112 123 118
Cost in Rand
Free State Kwa-Zulu Natal Mpumalanga Infrastructure: Public Municipal Services
Unit
Min Max Ave Min Max Ave Min Max Ave Bus Shelters Bus shelters for bus ranks R / square meter 1,995 2,217 2,106 2,073 2,303 2,188 2,299 2,555 2,427 Bus shelters for streets R / square meter 1,995 2,217 2,106 2,073 2,303 2,188 2,299 2,555 2,427 Sidewalks Paved sidewalk R / square meter 167 184 175 185 199 192 167 184 175Gravel sidewalk R / square meter 103 113 108 115 124 119 103 113 108
Cost in Rand
Free State Kwa-Zulu Natal Mpumalanga Infrastructure: Public Municipal Services
Unit
Min Max Ave Min Max Ave Min Max Ave Bus Shelters Bus shelters for bus ranks R / square meter 2,432 2,702 2,567 2,214 2,460 2,337 1,919 2,132 2,026 Bus shelters for streets R / square meter 2,432 2,702 2,567 2,214 2,460 2,337 1,919 2,132 2,026 Sidewalks Paved sidewalk R / square meter 196 231 214 479 551 515 179 206 193Gravel sidewalk R / square meter 121 143 132 368 409 389 82 94 88

Page 89 of 228
7.2 Emergency Services There are to aspect which is discussed under this section, being Fire Fighting Services and Disaster Management Services 7.2.1 Definition Public Safety involves the protection of the general population from all manner of significant danger, injury, damage or harm, such as may occur in a natural disaster, and the prevention of the same. This protection is typically provided by emergency services organizations such as police, fire and emergency medical services. The term “disaster management” refers to a continuous and integrated multi-sectoral, multidisciplinary process of planning, and implementation of measures, aimed at:
• preventing or reducing the risk of disasters; • mitigating the severity or consequences of disasters; • emergency preparedness; • a rapid and effective response to disasters; and • post-disaster recovery and rehabilitation.
7.2.2 Purpose Of Service And Infrastructure Emergency services are organizations / structures that deal with varying types of emergency, in order to ensure public safety. The organization may exist for the sole purpose of dealing with emergencies, or may deal with ad hoc emergencies as they arise as part of their normal duties. Many of these organizations will also be involved with community work to help avoid or detect the emergencies which they are engaged to deal with. Sections 29, and 43 of the Disaster Management Act, Act 57 of 2002, require that the three spheres of government (National (NDMC), Provincial and Metropolitan / District Municipalities) establish Disaster Management Center’s (DMC’s). It is envisaged that the DMC’s will provide the physical environment where various emergency and disaster management role players can meet and co-ordinate an integrated and coordinated disaster management approach that focuses on:
Preventing or reducing the risk of disasters, mitigating the severity of disasters, emergency preparedness, rapid and effective response to disasters and post-disaster recovery;
The establishment of a disaster management repository of, and conduit for, information concerning disasters, impending disasters and disaster management in the Province or District (Section 30(1)c).
7.2.3 Geographical Context The emergency service available is dependant on the area in terms of settlement pattern, physical and economic activities, the extent of development. In terms of this guideline focus is place on two aspects being basic fire fighting and disaster management centers / facilities. 7.2.4 Basic Service Level
7.2.4.1 Basic fire fighting services Fire fighting is a local government function, but will only be funded if adequate provision for it has been made within their IDP. The main functions of a fire service are to prevent fires and to protect life and property should a fire occur. Two essentials for protection against fire are an efficient fire service and an adequate water supply. Local authorities should endeavour to achieve and maintain a category 1 service. Fire Brigades are classified according to the type and quantity of equipment held, and they fall into one of the following categories: Category 5 a): A brigade with adequate arrangements and provisions in place, in relation to risk, as measured in the assessments section of Annexure’s A and C of the Standard (SANS 10090: 2002, Edition 3) for :
• Risk profile of area of jurisdiction; • Weight and speed of response; • Call receipt and processing requirements; • Vehicle/equipment availability and maintenance;

Page 90 of 228
• Incident management procedures; • Pre-fire planning and risk visits; • Training/personnel; • Water supplies; and • Fire safety functions;
Category 5 b): A brigade that is able to meet performance criteria for staff availability per appliance availability,
pre-determined attendance (PDA), manning levels and attendance times, 35 % to 45 % of the time, measured annually.
Category 4: A brigade as given in category 5 a) as monitored by relevant performance indicators or statistics, or
both, and which is able to meet the performance criteria given for category 5 b) 46 % to 55 % of the time, measured annually.
Category 3: A brigade as given for category 5 a) as monitored by relevant performance indicators or statistics,
or both, and which is able to meet performance criteria as given for category 5 b) 56 % to 65 % of the time, measured annually.
Category 2: A brigade as given for category 5 a) as monitored by relevant performance indicators or statistics,
or both, and which is able to meet performance criteria as given for category 5 b) 66 % to 75 % of the time, measured annually.
Category 1: A brigade as given for category 5 a) as monitored by relevant performance indicators or statistics,
or both, and which is able to meet performance criteria as given for category 5 b) more than 75 % of the time, measured annually.
Basic Fire Fighting Services consist of different components and is determined by the risk where the services are to be rendered. In motivating for funding a local authority will have to define the extent of their activities and the rationale for the fund utilization. Similarly the fire fighting services could be developed as parts of Disaster Management Center’s (DMC's), which are discussed below. Any “urban” services consist of an operational section responsible for physical fire fighting, rescue and in-house training services and a fire safety section responsible for law enforcement and structural fire safety, as well as legislation on dangerous and hazardous goods. Remote and rural areas are serviced adequately by an operational service only. Basic services in remote and rural areas could consist of only an all terrain water tanker truck and/or veldt fire units on l.d.v.’s available to respond on short notice stationed at central points as rapid response holds the key to all operational activity where life and property are at stake. Such a service should be well equipped with means of communication suitable for the area and be manned 24 hours by at least one preferably two persons to coordinate activities. A shed for the vehicle(s) and equipment and an office/communication room as well as an ablution, kitchen and sleeping facility should be provided. Moderate risks call for more permanent personnel including a chief officer/station commander, more specialized equipment and vehicles and a building that can accommodate a full-time fire safety officer, recreation lectures and basic equipment repair facility (fire hoses and breathing apparatus). Fixed installations should make provision for an emergency generator and water tank in the event of power failures and where constant water supplies are not available. High and extra high risks (large urban areas including the industrial areas) require professional full time fire and rescue services incorporating an advanced communication system and center, offices, training facility, maintenance facility, engine room, emergency generator, large capacity, breathing apparatus compressor, specialized equipment and vehicles and highly trained and skilled personnel.
7.2.4.2 Disaster Management Facilities
The council of each metropolitan and district municipality must establish institutional capacity for disaster risk management in its area. Such arrangements must be consistent with national and provincial arrangements and must provide the appropriate mechanisms to allow for the application of co-operative governance to facilitate both intergovernmental and municipal interdepartmental relations as well as community participation for the purpose of disaster risk management.

Page 91 of 228
The Municipal Disaster Management Center (MDMC) is the primary functional unit for disaster risk management in metropolitan and district municipalities. It must provide direction for the implementation of disaster risk management policy and legislation and the integration and co-ordination of municipal disaster risk management activities and priorities in order to ensure that national and provincial objectives are achieved. In addition, a key function of the MDMC is to provide support to the NDMC and the relevant PDMC. In the event of a disaster occurring or threatening to occur, the MDMC must provide support and guidance to the relevant sub-administrative units in the case of metropolitan municipalities and to local municipalities in the case of district municipalities. Furthermore, it must mobilize municipal infrastructure and all other available resources to support local disaster risk management resources. Institutional arrangements for disaster risk management in metropolitan and district municipalities must be consistent with the national disaster management framework and the applicable provincial disaster management framework. Basic level of service options The minimum infrastructural requirements necessary to enable the provincial, district and the municipal disaster management center’s to operate optimally are:
a disaster operations center for the facilitation of disaster risk management planning and operations and multidisciplinary strategic management of disaster operations;
an integrated information management and communication system (see Enabler 1 under Disaster Management Framework document ref xxi);
a central communications center, including the establishment and maintenance of a central 24-hour communications facility for reporting purposes as well as for managing the dissemination of early warnings and coordinating activation and response to significant events and disasters;
a media and public information service that makes provision for two-way communication within communities and among individuals by providing information on disaster risk reduction strategies, preparedness, response, recovery and all other aspects of disaster risk management, as well as providing communities with the mechanisms for obtaining access to assistance in the event of an emergency and for reporting important local information to the relevant disaster management center;
an education, training and research facility; and adequate office accommodation and facilities for operational personnel.
Infrastructure must be established in accordance with national guidelines developed by the NDMC. Additional detail as to functions and structure of a Disaster Management Center is provided in Appendix 3. 7.2.5 Standards Of Construction To carry out effective fire fighting functions the service must be well organized. To this effect the Standard South Africa, with the assistance of the Fire Protection Association of Southern Africa, have issued a standard - SANS 10090: 2002, Edition 3. The purpose of this standard is to provide advice on the measures that should be taken to ensure that fire services are efficient. It includes a schedule against which the performance potential of each aspect, as well as of the whole, of a fire service can be judged. A fire-risk rating based on this schedule will indicate the extent to which loss of life and property can be avoided in any particular given area. The standards that are applicable for the building code aspects and similarly those for Disaster Management Center’s are those standards used for construction, being:
National Building Regulations Red Book SANS 1200 – All NHBRRC Home Building Manual – Part 1 – 3 ISO 1900 – All CSIR Standards (will refer to SANS 1200).
7.2.6 Unit Cost

Page 92 of 228
Table 7.2.6: Shows the range of unit costs in Rand/m2 for the various options of Disaster Management Facility, as developed from zero-based approach, following breakdown as depicted in Appendix 6:
Cost in Rand
Limpopo Gauteng North West Infrastructure
Unit Min Max Ave Min Max Ave Min Max Ave
Disaster Management Facilities (Provincial DMC - 750-1000sq) Offices for staff R / square meter 4,292 4,769 4,530 3,538 3,931 3,735 4,171 4,635 4,403Small conference room's) R / square meter 4,212 4,680 4,446 3,473 3,858 3,665 4,094 4,549 4,322Ablution facilities, as per the Building Regulations R / square meter 4,610 5,122 4,866 3,800 4,222 4,011 4,480 4,978 4,729Small kitchen R / square meter 5,007 5,563 5,285 4,128 4,586 4,357 4,867 5,407 5,137Relaxation/lounge area (optional) R / square meter - - - - - - - - -Dining area (optional) R / square meter - - - - - - - - -Sleeping quarters (optional) R / square meter - - - - - - - - -
Cost in Rand
Free State Kwa-Zulu Natal Mpumalanga Infrastructure
Unit Min Max Ave Min Max Ave Min Max Ave
Disaster Management Facilities (Provincial DMC - 750-1000sq) Offices for staff R / square meter 3,715 4,128 3,921 3,860 4,289 4,074 4,281 4,757 4,519 Small conference room's) R / square meter 3,646 4,051 3,849 3,789 4,210 3,999 4,202 4,669 4,435 Ablution facilities, as per the Building Regulations R / square meter 3,990 4,434 4,212 4,146 4,607 4,376 4,598 5,109 4,854 Small kitchen R / square meter 4,334 4,816 4,575 4,503 5,004 4,754 4,995 5,550 5,272 Relaxation/lounge area (optional) R / square meter - - - - - - - - - Dining area (optional) R / square meter - - - - - - - - - Sleeping quarters (optional) R / square meter - - - - - - - - -
Cost in Rand
Northern Cape Western Cape Eastern Cape Infrastructure
Unit Min Max Ave Min Max Ave Min Max Ave
Disaster Management Facilities (Provincial DMC - 750-1000sq) Offices for staff R / square meter 4,529 5,032 4,780 4,122 4,580 4,351 0 0 0 Small conference room's) R / square meter 4,445 4,939 4,692 4,046 4,495 4,270 3,507 3,897 3,702 Ablution facilities, as per the Building Regulations R / square meter 4,864 5,405 5,134 4,427 4,919 4,673 3,838 4,265 4,051 Small kitchen R / square meter 5,284 5,871 5,577 4,809 5,343 5,076 1,713 1,904 1,809 Relaxation/lounge area (optional) R / square meter - - - - - - - - - Dining area (optional) R / square meter - - - - - - - - - Sleeping quarters (optional) R / square meter - - - - - - - - -

Page 93 of 228
7.3 Community Services 7.3.1 Health Services
Health is a mainly provincial and national competence. There is a limited level of involvement of municipalities in delivering health services and this is essentially in the form of Community Health Clinics under municipal jurisdiction. 7.3.1.1 Definition & Purpose of Infrastructure A Community Health Center (CHC) is the second step in the provision of health care but can also be used for first contact care. A CHC offers similar services to a Provincial Clinic with the addition of a 24 hours maternity service, emergency care and casualty and a short stay ward. The CHC will refer a patient to a District hospital when necessary. 7.3.1.2 Geographical context
It should be sited with due regard to that section of the population most “at risk” – determined by the number of general medical practitioners who can be attracted to work in a building. 7.3.1.3 Basic Service Level and Options
Health center’s include the following services:
• Maternity • Ophthalmic • Child guidance • Speech therapy • Physiotherapy • Community nursing services • Health Education • Accommodation of General Practitioners (GPs)
Relationship To Hospital:
In some circumstances, a health center can be conveniently sited with a hospital – such an arrangement may encourage the joint use of facilities by GP’s and hospital staff.
Structure Of Healthcare:
Plan is to be consolidated with the different groups or teams, (e.g. GP’s, nurses, etc.) which have an identity of their own, but which can share central services such as reception, records, etc.
Size:
At present the average health center accommodates 6 GP’s and serving a population of 15 000 (ratio of 1 GP to 2500). This average conceals wide variations between 1 GP and 30 GP’s, although no general rule can be applied. A more detailed suggested guideline of space allocation and sizes is included in Appendix 4a. 7.3.2 Standards Of Construction
Due to the specialist nature of this type of infrastructure, the Department of Health have specific design criteria and guidelines that also need to be met.
The other standards that are applicable are those for construction, being: National Building Regulations Red Book SANS 1200 – All NHBRC Home Building Manual – Part 1 – 3 ISO 1900 – All CSIR Standards (will refer to SANS 1200).

Page 94 of 228
7.3.3 Unit Cost
Department of Health is in the final stages of approving a new Integrated Health Planning Framework, which will include planning and budgeting guidelines and details. However, in the absence of a detailed guideline at present, the following guideline (based on actual 2007 costs) has been provided by the KZN DoH on their building cost budgeting.

Page 95 of 228
Table 7.3.3: Shows the range of unit costs in Rand/m2 for the various options of Health Services, as developed from zero-based approach, following breakdown as depicted in Appendix 6:
Cost in Rand Limpopo Gauteng North West
Infrastructure Unit
Min Max Ave Min Max Ave Min Max Ave Health Services Car parking R / square meter 8,107 9,007 8,557 6,683 7,426 7,054 7,879 8,755 8,317 Main entrance R / square meter 7,153 7,948 7,550 5,897 6,552 6,224 6,952 7,725 7,339 Reception R / square meter 7,153 7,948 7,550 5,897 6,552 6,224 6,952 7,725 7,339 Record storage R / square meter 7,153 7,948 7,550 5,897 6,552 6,224 6,952 7,725 7,339 Administration R / square meter 7,153 7,948 7,550 5,897 6,552 6,224 6,952 7,725 7,339 Waiting areas R / square meter 7,153 7,948 7,550 5,897 6,552 6,224 6,952 7,725 7,339 Consulting rooms R / square meter 7,153 7,948 7,550 5,897 6,552 6,224 6,952 7,725 7,339 Treatment rooms R / square meter 7,153 7,948 7,550 5,897 6,552 6,224 6,952 7,725 7,339
Cost in Rand
Free State Kwa-Zulu Natal Mpumalanga Infrastructure
Unit Min Max Ave Min Max Ave Min Max Ave
Health Services Car parking R / square meter 7,017 7,797 7,407 7,291 8,101 7,696 8,086 8,985 8,536 Main entrance R / square meter 6,192 6,880 6,536 6,433 7,148 6,791 7,135 7,928 7,532 Reception R / square meter 6,192 6,880 6,536 6,433 7,148 6,791 7,135 7,928 7,532 Record storage R / square meter 6,192 6,880 6,536 6,433 7,148 6,791 7,135 7,928 7,532 Administration R / square meter 6,192 6,880 6,536 6,433 7,148 6,791 7,135 7,928 7,532 Waiting areas R / square meter 6,192 6,880 6,536 6,433 7,148 6,791 7,135 7,928 7,532 Consulting rooms R / square meter 6,192 6,880 6,536 6,433 7,148 6,791 7,135 7,928 7,532 Treatment rooms R / square meter 6,192 6,880 6,536 6,433 7,148 6,791 7,135 7,928 7,532
Cost in Rand
Northern Cape Western Cape Eastern Cape Infrastructure
Unit Min Max Ave Min Max Ave Min Max Ave
Health Services Car parking R / square meter 8,554 9,505 9,030 7,786 8,651 8,218 6,750 7,500 7,125 Main entrance R / square meter 7,548 8,387 7,967 6,870 7,633 7,251 5,956 6,618 6,287 Reception R / square meter 7,548 8,387 7,967 6,870 7,633 7,251 5,956 6,618 6,287 Record storage R / square meter 7,548 8,387 7,967 6,870 7,633 7,251 5,956 6,618 6,287 Administration R / square meter 7,548 8,387 7,967 6,870 7,633 7,251 5,956 6,618 6,287 Waiting areas R / square meter 7,548 8,387 7,967 6,870 7,633 7,251 5,956 6,618 6,287 Consulting rooms R / square meter 7,548 8,387 7,967 6,870 7,633 7,251 5,956 6,618 6,287 Treatment rooms R / square meter 7,548 8,387 7,967 6,870 7,633 7,251 5,956 6,618 6,287

Page 96 of 228
7.3.4 Mortuary No substantiation can be presented or supported that mortuaries resort under local government, other than from an OHS aspect. The only concrete documentation indicated that mortuaries have been moved from the jurisdiction of the SAPS to Department of Health. (Ref Department of Health, The Official Transfer of Government Forensic Mortuaries from the SAPS to the Department of Health, Minister of Health communiqué 13 April 2006). This document states: “Government reviewed the services provided by medico-legal mortuaries or what was called state mortuaries. The service was fragmented and uncoordinated and Cabinet decided to transfer the medico-legal mortuaries to the Department of Health. This will ensure separation and autonomy of forensic services and ensure that a comprehensive service is rendered. As from April 2006, the forensic mortuaries have been vested under the authority of provincial Departments of Health, including personnel, equipment and other logistical services. The transfer process will usher, for the first time, the establishment of the country’s first comprehensive Forensic Pathology Service. A Directorate has been established at the National Department to oversee the service.” 7.3.5 Multi-Purpose Center/Facility (SRSA Version) 7.3.5.1 Definition & Purpose of Infrastructure The Building for Sport and Recreation Programme’s (BSRP) main focus was the construction of outdoor and indoor facilities and the rehabilitation and upgrading of existing ones. A key element of this programme was the provision of training in facility management, and the implementation of sustainable maintenance projects. The majority of the projects are located in rural poverty nodes. From 2005/06, the allocation became part of the MIG programme. The SRSA will continue with its policy, advocating and monitoring roles. In accordance with a contract concluded with the SRSA, local authorities own the facilities once they have been completed and are responsible for their maintenance. Multi-purpose center or facility includes multi club house or community hall, multi purpose sports courts, all weather surface tennis, netball, basketball, volleyball, standard soccer and rugby field with an athletic track. This could be an indoor or outdoor facility. Depending on the needs of the community and the appropriateness it could also include ticket office and parking area. Municipalities and community structures use the term community center for a wide variety of buildings and facilities. There is usually great diversity between communities regarding the need for various facilities, the available money to provide these facilities, and prioritizing the needs. Opinions often differ regarding the number of persons that justify the establishment of a new community center. These considerations should be included in feasibility studies to direct and inform any decisions regarding the funding and erection of MPC’s. 7.3.5.2 Basic level of service The RDP states that “sporting and recreational facilities are available to all South African communities” and they “should be accessible and affordable for all South Africans, including those in rural areas, the young and the elderly”. This also applies to communities having access to municipal administration, a library, local information, pensioner payment points and a hall for community gatherings. To stretch limited resources further, municipalities should consider combining facilities in centralized community center’s, thus avoiding unnecessary duplication. Such facilities include:
Multi-purpose halls – to serve as a community hall, sports hall, theatre, exposition center and arts and crafts center;
Secondary halls – to serve as a rates hall, pension’s payment hall, activity rooms and clinics; Library and other facilities; and Shared facilities, including parking, entrance and security, ablution facilities, reception, manager’s
office, area lighting and fencing, landscaping and plants.
Justifying the provision of a community center
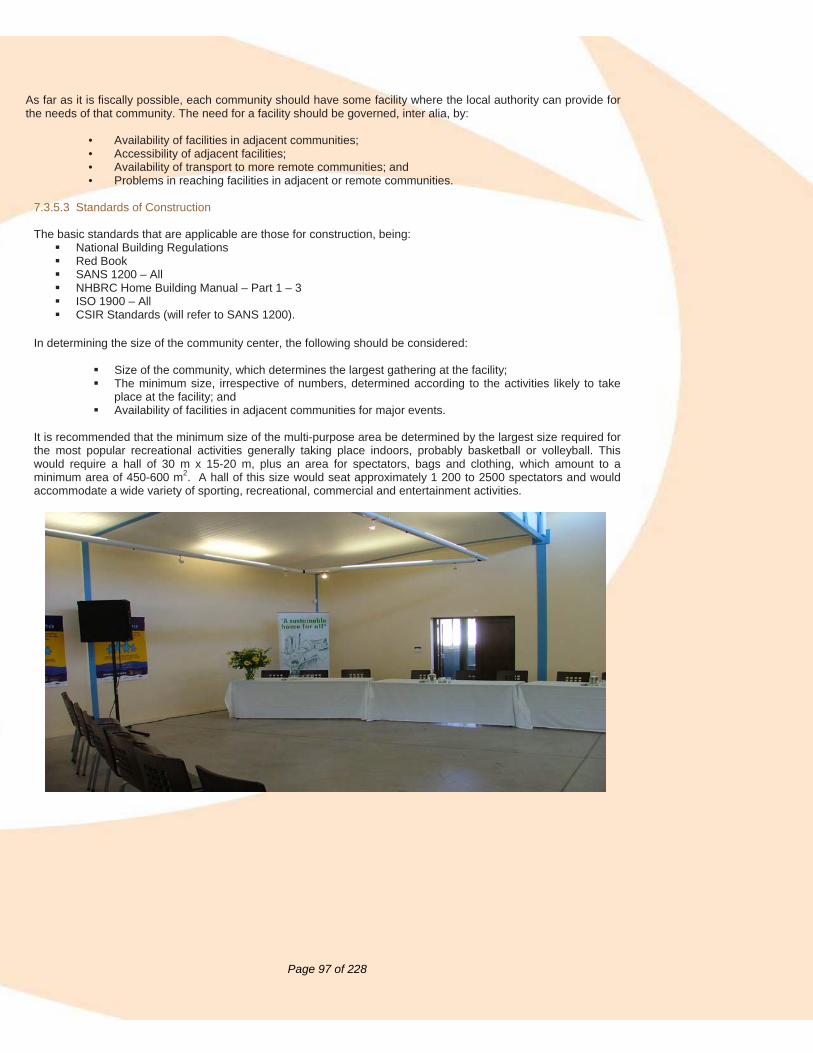
Page 97 of 228
As far as it is fiscally possible, each community should have some facility where the local authority can provide for the needs of that community. The need for a facility should be governed, inter alia, by:
• Availability of facilities in adjacent communities; • Accessibility of adjacent facilities; • Availability of transport to more remote communities; and • Problems in reaching facilities in adjacent or remote communities.
7.3.5.3 Standards of Construction The basic standards that are applicable are those for construction, being:
National Building Regulations Red Book SANS 1200 – All NHBRC Home Building Manual – Part 1 – 3 ISO 1900 – All CSIR Standards (will refer to SANS 1200).
In determining the size of the community center, the following should be considered:
Size of the community, which determines the largest gathering at the facility; The minimum size, irrespective of numbers, determined according to the activities likely to take
place at the facility; and Availability of facilities in adjacent communities for major events.
It is recommended that the minimum size of the multi-purpose area be determined by the largest size required for the most popular recreational activities generally taking place indoors, probably basketball or volleyball. This would require a hall of 30 m x 15-20 m, plus an area for spectators, bags and clothing, which amount to a minimum area of 450-600 m2. A hall of this size would seat approximately 1 200 to 2500 spectators and would accommodate a wide variety of sporting, recreational, commercial and entertainment activities.

Page 98 of 228

Page 99 of 228
Table 7.3.5.4: Shows the range of unit costs in Rand/ per 400 – 600 m2 for the various options of Multi-Purpose Center/Facility, as developed from zero-based approach, following breakdown as depicted in Appendix 6:
Cost in Rand Limpopo Gauteng North West
Infrastructure Unit
Min Max Ave Min Max Ave Min Max Ave Multi-Purpose Center/Facility Type of facility [Seating 1 200 – 2 500 people]
Rand / 600 square meter 4,609,594 5,121,771 4,865,683 3,800,160 4,222,400 4,011,280 4,480,389 4,978,210 4,729,299
Outdoor Rand / 600 square meter 3,179,030 3,532,256 3,355,643 2,620,800 2,912,000 2,766,400 3,089,923 3,433,248 3,261,586
Hall Rand / 600 square meter 3,973,788 4,415,320 4,194,554 3,276,000 3,640,000 3,458,000 3,862,404 4,291,560 4,076,982
Sports and recreational hall Rand / 600 square meter 5,722,255 6,358,061 6,040,158 4,717,440 5,241,600 4,979,520 5,561,862 6,179,846 5,870,854
Cost in Rand Free State Kwa-Zulu Natal Mpumalanga
Infrastructure Unit
Min Max Ave Min Max Ave Min Max Ave Multi-Purpose Center/Facility Type of facility [Seating 1 200 – 2 500 people]
Rand / 600 square meter 3,990,168 4,433,520 4,211,844 4,145,975 4,606,638 4,376,306 4,598,194 5,109,104 4,853,649
Outdoor Rand / 600
square meter 2,751,840 3,057,600 2,904,720 2,859,293 3,176,992 3,018,142 3,171,168 3,523,520 3,347,344
Hall Rand / 600
square meter 3,439,800 3,822,000 3,630,900 3,574,116 3,971,240 3,772,678 3,963,960 4,404,400 4,184,180
Sports and recreational hall Rand / 600
square meter 4,953,312 5,503,680 5,228,496 5,146,727 5,718,586 5,432,656 5,708,102 6,342,336 6,025,219
Cost in Rand Northern Cape Western Cape Eastern Cape
Infrastructure Unit
Min Max Ave Min Max Ave Min Max Ave Multi-Purpose Center/Facility Type of facility [Seating 1 200 – 2 500 people]
Rand / 600 square meter 4,864,205 5,404,672 5,134,438 4,427,186 4,919,096 4,673,141 3,838,162 4,264,624 4,051,393
Outdoor Rand / 600
square meter 3,354,624 3,727,360 3,540,992 3,053,232 3,392,480 3,222,856 2,647,008 2,941,120 2,794,064
Hall Rand / 600
square meter 4,193,280 4,659,200 4,426,240 3,816,540 4,240,600 4,028,570 3,308,760 3,676,400 3,492,580
Sports and recreational hall Rand / 600
square meter 6,038,323 6,709,248 6,373,786 5,495,818 6,106,464 5,801,141 4,764,614 5,294,016 5,029,315

Page 100 of 228
7.3.6 Multi-Purpose Community Center (MPCC) (GCIS Version) 7.3.6.1 Definition & Purpose of Infrastructure An MPCC is a ‘one-stop’, integrated community development center, where community development is of primary importance and community needs are addressed by providing relevant services and information. 7.3.6.2 Geographical context The identification of an MPCC site should take into consideration: • Availability of facilities in the area – in which case services should be clustered around these
facilities; • Accessibility and centrality of the MPCC / facilities in the area, as well as meeting the needs of the
physically challenged people; • Availability of transport to the area as well as road infrastructure; • How clustered or scattered are the communities or households in the area; and • Problems in reaching facilities in the area, and adjacent or remote communities.
7.3.6.3 Basic Service Level and Options An MPCC aims to empower communities through the provision of access to information, services and resources from various structures, which amongst others includes government, NGOs, private sector and other initiatives. The following six block operational model defines services that should be accommodated at an MPCC. 1. Public services (national, provincial and local government services – e.g. sports complex, clinic, home
affairs services, municipal services, etc.) 2. Economic development services (financial and non-financial services) 3. Private sector and community activities (spaza shops, commercial activities, arts and crafts, food
gardens, etc.) 4. Information and communication activities (content creation, community media, community radio stations,
distribution services, etc.) 5. Office services (communications services – fax, copiers, telephone, internet, postal services, etc.) 6. Education and skills development services (adult basic education and training, computer training,
business development skills, etc). It is however important to indicate that an MPCC will also make provision for a multi- purpose community
hall, depending on the availability of a community hall within the community. In order to ensure that MPCC’s are sustainable, it is recommended that municipalities take full ownership and management of MPCC’s, while simultaneously ensuring that there is community participation. It is equally important for municipalities to budget sufficiently for construction or rehabilitation of the infrastructure and to be innovative in the design to meet the communal needs, and to ensure sufficient resources and budget for operation and maintenance of the center. The following are some of the issues to be considered to ensure sustainability: • MPCC’s should be prioritized in the IDP’s and budgeted for; • To ensure there is a security in all MPCC’s, including alarm, burglar doors and windows, fence, etc; • There should be a center manager who will coordinate and facilitate the day-to-day operations and
monitor services rendered and facilitated value addition at MPCC’s; • ICT infrastructure should be taken into consideration during the construction phase; • Clustering of services as part of costs sharing mechanism and • Coordination and sharing resources.
7.3.6.4 Standards of Construction The basic standards that are applicable are those for construction, being:
National Building Regulations Red Book SANS 1200 – All

Page 101 of 228
NHBRC Home Building Manual – Part 1 – 3 ISO 1900 – All CSIR Standards (will also refer you to SANS 1200)
MPCC's are unique and differ from each other depending on the size of the community (number of people) and their needs. A detailed example of a MPCC has been included in Appendix 4b. The following are some of the features that are recommended in an MPCC structure:
• Offices for all service providers as described above in the 6 block operational model; • A community hall / sports complex; • Reception area with general service counter; • A furnished sheltered waiting room for clients; • Center manager’s office; • Furnished telecommunication/computer center; • Boardroom for MPCC stakeholders meetings; and • Parking area.
7.3.6.5 Unit Cost of an MPCC The recommended area per MPCC should not be less than 600m2.

Page 102 of 228
Table 7.3.6.5: Shows the range of unit costs (in Rand/600 m2) for the various options of Multi-Purpose Community Center, as developed from zero-based approach, following breakdown as depicted in Appendix 6:
Cost in Rand
Limpopo Gauteng North West Infrastructure Unit Min Max Ave Min Max Ave Min Max Ave
Multi Purpose Community Center
Offices for all service providers R / 600 square meters 7,153 7,948 7,550 5,897 6,552 6,224 6,952 7,725 7,339
A community hall / sports complex R / 600 square meters 8,583,382 9,537,091 9,060,237 7,076,160 7,862,400 7,469,280 8,342,793 9,269,770 8,806,281
Reception area with general service counter R / 600 square meters 171,668 190,742 181,205 141,523 157,248 149,386 166,856 185,395 176,126
A furnished sheltered waiting room for clients R / 600 square meters 162,131 180,145 171,138 133,661 148,512 141,086 157,586 175,096 166,341
Center managers office R / 600 square meters 178,820 198,689 188,755 147,420 163,800 155,610 173,808 193,120 183,464
Furnished telecommunication/computer center
R / 600 square meters 1,192,136 1,324,596 1,258,366 982,800 1,092,000 1,037,400 1,158,721 1,287,468 1,223,095
Boardroom for MCPC stakeholders meetings R / 600 square meters 794,758 883,064 838,911 655,200 728,000 691,600 772,481 858,312 815,396
Parking area R / 600 square meters 238,427 264,919 251,673 196,560 218,400 207,480 231,744 257,494 244,619
Cost in Rand
Free State Kwa-Zulu Natal Mpumalanga Infrastructure Unit Min Max Ave Min Max Ave Min Max Ave
Multi Purpose Community Center
Offices for all service providers R / 600 square meters 6,192 6,880 6,536 6,433 7,148 6,791 7,135 7,928 7,532
A community hall / sports complex R / 600 square meters 7,429,968 8,255,520 7,842,744 7,720,091 8,577,878 8,148,984 8,562,154 9,513,504 9,037,829
Reception area with general service counter R / 600 square meters 148,599 165,110 156,855 154,402 171,558 162,980 171,243 190,270 180,757
A furnished sheltered waiting room for clients R / 600 square meters 140,344 155,938 148,141 145,824 162,027 153,925 161,730 179,700 170,715
Center managers office R / 600 square meters 154,791 171,990 163,391 160,835 178,706 169,771 178,378 198,198 188,288
Furnished telecommunication/computer center
R / 600 square meters 1,031,940 1,146,600 1,089,270 1,072,235 1,191,372 1,131,803 1,189,188 1,321,320 1,255,254
Boardroom for MCPC stakeholders meetings R / 600 square meters 687,960 764,400 726,180 714,823 794,248 754,536 792,792 880,880 836,836
Parking area R / 600 square meters 206,388 229,320 217,854 214,447 238,274 226,361 237,838 264,264 251,051

Page 103 of 228
Cost in Rand Northern Cape Western Cape Eastern Cape Infrastructure Unit
Min Max Ave Min Max Ave Min Max Ave Multi Purpose Community Center
Offices for all service providers R / 600 square meters 7,548 8,387 7,967 6,870 7,633 7,251 5,956 6,618 6,287
A community hall / sports complex R / 600 square meters 9,057,485 10,063,872 9,560,678 8,243,726 9,159,696 8,701,711 7,146,922 7,941,024 7,543,973
Reception area with general service counter R / 600 square meters 181,150 201,277 191,214 164,875 183,194 174,034 142,938 158,820 150,879
A furnished sheltered waiting room for clients R / 600 square meters 171,086 190,095 180,591 155,715 173,016 164,366 134,997 149,997 142,497
Center managers office R / 600 square meters 188,698 209,664 199,181 171,744 190,827 181,286 148,894 165,438 157,166
Furnished telecommunication/computer center
R / 600 square meters 1,257,984 1,397,760 1,327,872 1,144,962 1,272,180 1,208,571 992,628 1,102,920 1,047,774
Boardroom for MCPC stakeholders meetings R / 600 square meters 838,656 931,840 885,248 763,308 848,120 805,714 661,752 735,280 698,516
Parking area R / 600 square meters 251,597 279,552 265,574 228,992 254,436 241,714 198,526 220,584 209,555
Page 104 of 228
7.3.7 Parks And Open Spaces 7.3.7.1 Definition & Purpose of Infrastructure A park is any piece of land controlled and maintained by a municipal council for public use. The two broad definitions of parks are: a) Any land, square, camping site, swimming, bath, beach, bathing area, sports fields, public resorts, public
open space, recreation site, river, nature reserve, hiking trail, including any portion hereof any facility or apparatus therein or thereon but excluding any public road or street.
b) Any building, structure, hall, room or office including any part thereof and any facility or apparatus therein
which is the property of or is possessed, controlled or leased by a municipal council and to which the general public has access, whether on payment of admission fees or not.
7.3.7.2 Basic Service Level and Options Ablution facilities may be provided at a cost that will be determined by the size of the facility. 7.3.7.3 Standards of Construction The basic standards that are applicable are those for construction, being:
National Building Regulations Red Book SANS 1200 – All NHBRC Home Building Manual – Part 1 – 3 ISO 1900 – All CSIR Standards (will refer to SANS 1200) GFSH-10 - Design and construction of Engineering Services - Oct 2002 in relation to muni-services.
7.3.7.4 Unit Cost of Ablutions:

Page 105 of 228
Table 7.3.7.4: Shows the range of unit costs in Rand for the various options of Parks and Open spaces, as developed from zero-based approach, following breakdown as depicted in Appendix 6:
Cost in Rand
Limpopo Gauteng North West Infrastructure Unit Min Max Ave Min Max Ave Min Max Ave
Parks and Open spaces Earthworks R / Hectare 55,633 61,814 58,724 45,864 50,960 48,412 54,074 60,082 57,078Grassing R / square meter 25 28 27 21 23 22 25 27 26Irrigation R / Hectare 238,427 264,919 251,673 196,560 218,400 207,480 231,744 257,494 244,619Ablution facility R / square meter 7,153 7,948 7,550 5,897 6,552 6,224 6,952 7,725 7,339Fencing R / 1,8m concrete palisade 715 795 755 590 655 622 695 772 734
Cost in Rand
Free State Kwa-Zulu Natal Mpumalanga Infrastructure Unit Min Max Ave Min Max Ave Min Max Ave
Parks and Open spaces Earthworks R / Hectare 48,157 53,508 50,833 50,038 55,597 52,817 55,495 61,662 58,579Grassing R / square meter 22 24 23 23 25 24 25 28 27Irrigation R / Hectare 206,388 229,320 217,854 214,447 238,274 226,361 237,838 264,264 251,051Ablution facility R / square meter 6,192 6,880 6,536 6,433 7,148 6,791 7,135 7,928 7,532Fencing R / 1,8m concrete palisade 619 688 654 643 715 679 714 793 753
Cost in Rand
Northern Cape Western Cape Eastern Cape Infrastructure Unit Min Max Ave Min Max Ave Min Max Ave
Parks and Open spaces Earthworks R / Hectare 58,706 65,229 61,967 53,432 59,368 56,400 46,323 51,470 48,896Grassing R / square meter 27 30 28 24 27 26 21 24 22Irrigation R / Hectare 251,597 279,552 265,574 228,992 254,436 241,714 198,526 220,584 209,555Ablution facility R / square meter 7,548 8,387 7,967 6,870 7,633 7,251 5,956 6,618 6,287Fencing R / 1,8m concrete palisade 755 839 797 687 763 725 596 662 629

Page 106 of 228
7.3.8 Beaches And Amusement Facilities 7.3.8.1 Definition & Purpose of Infrastructure
Beaches are defined in section 1 of the Sea Shore Act of 1935 (Act 21 of 1935) and include an area adjoining the high-water mark.
7.3.8.2 Basic Service Level and Options
Where a beach and amusement facilities are in a poor area, access to basic water, sanitation and refuse removal must be provided.
7.3.8.3 Standards of Construction The basic standards that are applicable are those for construction, being:
National Building Regulations Red Book SANS 1200 – All NHBRC Home Building Manual – Part 1 – 3 ISO 1900 – All CSIR Standards (will refer to SANS 1200) GFSH-10 - Design and construction of Engineering Services - Oct 2002 in relation to muni-services
7.3.9 Cemeteries 7.3.9.1 Definition & Purpose of Infrastructure A cemetery is defined as a burial-ground, especially a large landscaped park or ground laid out expressly for the deposition or interment of the dead, not being a churchyard attached to a place of worship. Cemeteries are an emotional issue and are subject to many cultural preferences within communities that should be fully understood before such facilities are designed. Suitable recognition must be given to the health hazard potential of a cemetery and as such and the need for a comprehensive cemetery site investigation should also be recognized. A comprehensive investigation is essential to ensure that the preferences and attitudes of the beneficiary community are addressed and that a cemetery of the correct size will be established before land is acquired or developed.

Page 107 of 228
7.3.9.2 Geographical context Cemetery capacity should be available (at a maximum distance of 30 km for urban and 50 km for rural communities) to all communities of sufficient size to warrant such a facility The need for a facility should be governed, inter alia, by:
• Mortality rate of beneficiary and adjacent communities; • Population growth of beneficiary and adjacent communities; • Age distribution of beneficiary and adjacent communities; • Availability of existing cemetery capacity to beneficiary and adjacent communities; • Accessibility of adjacent facilities; • Availability of transport or more remote facilities; and • Problems in reaching facilities in adjacent or more remote communities.
Four different types of cemeteries are applicable, being:
1. Places of burial 2. Local cemetery 3. Regional cemetery 4. Memorial parks
These are discussed below in greater detail. 7.3.9.3 Basic Service Level and Options 7.3.9.3.1 Places of burial: Below basic level of service: It has been found that there a number of “below basic” places of burial have developed, mainly in rural and outskirts of urban areas. Such facilities are often in contravention of basic safety and health regulations. These “cemeteries” have no facilities and basically consist of open pieces of land earmarked for burial purposes, with no fencing and no buildings. Road infrastructure, if any, is limited. Cemeteries of this type are operated below the basic level of service. Graves are often not numbered and sometimes there is no formal burial register. Of note is that MIG is not funding LOS below the defined minimum level of service, but that MIG is funding the upgrading of such “service” to a minimum LOS. It is therefore, recommended that funding be limited to ensuring upgrading of the facilities to an acceptable basic safety and environmental health standard, on condition that no further development is allowed. Alternatively, in the event where it can be shown that the rehabilitated cemetery complies with all codes and can similarly accommodate expansion, should such further expansion be supported. It is envisaged that the rehabilitation will in all probability be substantially more expensive that the building of new facilities to code. 7.3.9.3.2 Local Cemetery: Basic level of service: A local cemetery provides burial capacity for a suburb, township or town at a basic, medium or high level of service, as required by the community and developed by the municipality concerned. At a basic level of service, these cemeteries should have access roads and internal distributor roads, parking areas, public toilets, showers for workers (where applicable), security fencing and a security gate. Operation of local cemeteries should entail the formulation of and adherence to cemetery Bylaws, formulating tariffs, staking out grave plots, providing graves on time, as required, maintaining a map of graves and keeping a burial register. 7.3.9.3.3 Local Cemetery: Higher level of service At higher service levels, facilities such as administrative buildings, drinking fountains, paved roads, shelters, a wall of remembrance, landscaping, a caretaker’s house/shelter, various different sections (e.g. a lawn section, a berm section and a monumental section) should be added. Maintenance and operation of the cemetery increases and becomes more specialized since more effort is required and service provision is also at a higher level, with staff manning the site during working hours and over the weekends.

Page 108 of 228
7.3.9.4 Regional cemetery: Intermediate level of service: A regional cemetery can be similar to a local cemetery, as described above, except that it serves more than one community and therefore may need to meet diverse needs of the various communities. Regional cemeteries could be justified by economies of scale, with savings on buildings, access roads, and other facilities and on planning, design, development and operation and maintenance costs. The provision of a crematorium may even be justified. Agreement should be reached between participating municipalities concerning the development, ownership, management, operation and maintenance of the cemetery. 7.3.9.5 Memorial parks: Highest level of service: Memorial parks are highly specialized cemeteries that cater for every need and desire of the communities they serve. Memorial parks should have a park-like atmosphere, providing a tranquil ambience. Memorial parks are provided mostly on a public-private partnership basis, or they may be fully privatized.
7.3.9.6 Standards of Construction There are a number of general principles to be followed when a cemetery is sited. Some municipalities might have their own Bylaws controlling the site allocation for cemeteries and all other applicable regulations shall also be followed in this regard. In general the location of cemeteries shall be dictated by the following factors:
Topography, Soil and geo-technical conditions, Hydrology, Religious beliefs, Social attitudes, Aesthetic considerations, Sanitary, and Environmental considerations.
A number of these considerations will depend on the specific community that is served by the cemetery and the most important engineering aspects are discussed below:
Cemeteries should be located in areas that do not fall below the 1:100 year flood line and shall as far as possible should not be subject to the possibility of flooding.
The soil should be of such nature that it can be excavated by hand or a back-actor without undue difficulty. The soil should be stable to prevent for sidewall collapse after excavation.
The soil must also have sufficient workability to allow for the easy backfilling of the grave. The cemetery should be arranged such that a maximum of two rows of graves are placed between
vehicle lanes to allow for easy access to any grave. The suggested size per grave plot is 2,50m length by 1,50m width and 1.8 m depth.
The cemetery should not be located in an area with a high or perched water table and water table shall preferably be more than 5m below the bottom of the grave. It is also preferable that the soil has a low permeability to prevent the leaching of water from the grave into the groundwater.
The cemetery must also be fenced to prevent illegal access for vandals to the graves. A 1,2m high stock fence is suggested as a minimum level of fencing, however, a palisade fence will be a more preferable and secure option.
The basic standards that are applicable are those for construction, being:
National Building Regulations Red Book SANS 1200 – All NHBRC Home Building Manual – Part 1 – 3 ISO 1900 – All CSIR Standards (will refer to SANS 1200) GFSH-10 - Design and construction of Engineering Services - Oct 2002 in relation to municipal-
services

Page 109 of 228
Determining the minimum required size of cemetery sites Tumagole (ref x) provides detailed selection criteria and methodology to be followed in selecting a cemetery. It is remarked that “the size of a cemetery is very often limited by the non-availability of suitable conditions, especially in areas characterized by dense drainage networks and where shallow bedrock or shallow water tables are prevalent. However, from an economic point of view, a minimum-sized unit should be defined to justify an engineering geological or geotechnical investigation of this nature. Considering factors such as the cost and time spent on an investigation as well as the period before implementation, a minimum continuous area of at least two to three hectare (20 000 to 30 000 m2) is recommended for investigator purposes. However, when considering the intended lifespan of the cemetery, factors such as the total population, mortality rate and projected growth rate of a community should be included before an appropriate size is concluded. A further point to consider is the question of convenience. A perfectly sited cemetery from a technical point of view may be offset by its distance from the community that it serves. Technical suitability should take precedence, but where possible, compromises are encouraged to ensure that proposed sites are utilized.” The standard recommendation is a plot of 0,15 ha should be provided per 1 000 head of the average population for the life of the cemetery, which should be calculated for a 30-year period and for development in three 10-year phases. The following facilities are recommended for the full 30-year period, at a basic level of service:
• A 6 m wide paved access road, to a maximum of 100 m in length; • A 4 m graveled internal distributor; • An administration block; • Flush toilets for the public if services are available to the site selected (If services are not available, VIPs
should be provided); • Ablution facilities for workers, including showers, wash-basins and toilets; • Water for ablution facilities and toilets (other water connections, e.g. for watering lawns, should be
provided in the buildings, for supervision and control); • Storage space for equipment; • A parking area; • Shelter; and • Security fencing (determined by outer boundaries, based on the required size plus a percentage for
unusable area). 7.3.9.7 Unit costs The cost of provision is usually recovered from users by selling graves at a fixed tariff to residents and at a much higher tariff to non-residents. This is because it is often a subsidized service.

Page 110 of 228
Table 8.3.9.7: Shows the range of unit costs in Rand for the various options of cemeteries, as developed from zero-based approach, following breakdown as depicted in Appendix 6:
Cost in Rand Limpopo Gauteng North West
Infrastructure Unit
Min Max Ave Min Max Ave Min Max Ave Cemeteries Basic level of service R / cemetery 1,668,991 1,854,434 1,761,713 1,375,920 1,528,800 1,452,360 1,622,210 1,802,455 1,712,332Higher level of service R / cemetery 3,814,836 4,238,707 4,026,772 3,144,960 3,494,400 3,319,680 3,707,908 4,119,898 3,913,903Intermediate level of service: Regional cemetery
R / cemetery 2,861,127 3,179,030 3,020,079 2,358,720 2,620,800 2,489,760 2,780,931 3,089,923 2,935,427
Highest level of service: Memorial parks R / cemetery 7,947,576 8,830,640 8,389,108 6,552,000 7,280,000 6,916,000 7,724,808 8,583,120 8,153,964
Cost in Rand Free State Kwa-Zulu Natal Mpumalanga
Infrastructure Unit
Min Max Ave Min Max Ave Min Max Ave Cemeteries Basic level of service R / cemetery 1,444,716 1,605,240 1,524,978 1,501,129 1,667,921 1,584,525 1,664,863 1,849,848 1,757,356Higher level of service R / cemetery 3,302,208 3,669,120 3,485,664 3,431,151 3,812,390 3,621,771 3,805,402 4,228,224 4,016,813Intermediate level of service: Regional cemetery
R / cemetery 2,476,656 2,751,840 2,614,248 2,573,364 2,859,293 2,716,328 2,854,051 3,171,168 3,012,610
Highest level of service: Memorial parks R / cemetery 6,879,600 7,644,000 7,261,800 7,148,232 7,942,480 7,545,356 7,927,920 8,808,800 8,368,360
Cost in Rand Northern Cape Western Cape Eastern Cape
Infrastructure Unit
Min Max Ave Min Max Ave Min Max Ave Cemeteries Basic level of service R / cemetery 1,761,178 1,956,864 1,859,021 1,602,947 1,781,052 1,691,999 1,389,679 1,544,088 1,466,884Higher level of service R / cemetery 4,025,549 4,472,832 4,249,190 3,663,878 4,070,976 3,867,427 3,176,410 3,529,344 3,352,877Intermediate level of service: Regional cemetery
R / cemetery 3,019,162 3,354,624 3,186,893 2,747,909 3,053,232 2,900,570 2,382,307 2,647,008 2,514,658
Highest level of service: Memorial parks R / cemetery 8,386,560 9,318,400 8,852,480 7,633,080 8,481,200 8,057,140 6,617,520 7,352,800 6,985,160

Page 111 of 228
7.3.10 Crematoriums 7.3.10.1 Definition & Purpose of Infrastructure A .crematorium’ means any building fitted with appliances for cremation, including everything essential, incidental or ancillary thereto and includes any structure which in any special circumstances. 7.3.10.2 Geographical Context There are a number of general principles to be considered when a crematorium is conceptualized and planned. Some municipalities might have their own Bylaws controlling the site allocation for crematoriums, but all other applicable regulations shall also be followed in this regard. In general, the location of crematoriums shall be dictated by topography, soil and geo-technical conditions, religious beliefs, social attitudes, aesthetic and sanitary considerations. 7.3.10.3 Basic Level of Service & Options There is no prescription as to a basic level of service. The table below Table 8.2.10.a provides a detail of the standard recommended facilities that should form part of the crematorium. 7.3.10.4 Standards of Construction The following Standards are applicable:
• National Building Regulations SABS 0400-Design Population Requirements • National Building Regulations SABS 0400-Design Ratio of Sanitary Fittings to
Population 7.3.10.5 Unit Cost The national average cost for the construction of the crematorium is R 3,533 /m2. Anything outside this range will require a strong motivation from the municipalities concerned. For a detailed breakdown, consult Appendix 8. 7.3.11 Fencing Fencing can be utilized for the following:
i) Security – Fencing can be erected for security purposes at municipal buildings /
infrastructure. ii) Public – Fencing can be erected next to open stormwater channels / drains to prevent
the public (children) from falling into these dangerous hazards. iii) Motorists/pedestrians – It is very important to fence off all roadways (especially rural
areas) to prevent strayed animals / cattle from entering the road reserve that could create life threatening situations to motorists/pedestrians.
Typical fencing that could be used for the various items listed above:
a) Security fencing: concrete palisade 2.4 m high or wire fencing 2.4 m high b) Public protection: concrete palisade 1.8 m high, wire fencing 1.2 m or 1.83 m
high c) Gates / security fencing: double leaf 4m or 6m wide and 2.4 m high, single
pedestrian 1.0 m wide
Mesh fencing is in a number of locations not desirable because of the constant removal thereof by people. Municipalities increasingly prefer wall fencing or palisade (concrete) fencing because of its durability and low maintenance.

Page 112 of 228

Page 113 of 228
Table 7.3.11: Shows the range of unit costs in (Rand/ running meter) for the various options of Fencing, as developed from zero-based approach, following breakdown as depicted in Appendix 6:
Cost in Rand Limpopo Gauteng North West
Infrastructure Unit
Min Max Ave Min Max Ave Min Max Ave
Fencing Security Concrete Pales Palisade Fencing 2,4m high R / meter 935 1,038 987 771 856 813 908 1,009 959Wire Fencing 2,4m high R / meter 525 583 554 432 480 456 510 566 538Public Concrete Pales Palisade Fencing 1,8m high R / meter 525 583 554 432 480 456 510 566 538Wire Fencing 1,2m high R / meter 254 283 268 210 233 221 247 275 261Wire Fencing 1,83m high R / meter 391 434 413 322 358 340 380 422 401Gates/Security Double leaf 4m wide 2,4m high R / meter 3,815 4,239 4,027 3,145 3,494 3,320 3,708 4,120 3,914Double leaf 6m wide R / meter 5,086 5,652 5,369 4,193 4,659 4,426 4,944 5,493 5,219Single pedestrian 1,0m wide R / meter 1,772 1,969 1,871 1,461 1,623 1,542 1,723 1,914 1,818
Cost in Rand Free State Kwa-Zulu Natal Mpumalanga
Infrastructure Unit
Min Max Ave Min Max Ave Min Max Ave
Fencing Security Concrete Pales Palisade Fencing 2,4m high R / meter 809 899 854 841 934 887 932 1,036 984Wire Fencing 2,4m high R / meter 454 505 479 472 524 498 7,135 7,928 7,532Public Concrete Pales Palisade Fencing 1,8m high R / meter 454 505 479 472 524 498 523 581 552Wire Fencing 1,2m high R / meter 220 245 232 229 254 241 254 282 268Wire Fencing 1,83m high R / meter 338 376 357 352 391 371 390 433 412Gates/Security Double leaf 4m wide 2,4m high R / meter 3,302 3,669 3,486 3,431 3,812 3,622 3,805 4,228 4,017Double leaf 6m wide R / meter 4,403 4,892 4,648 4,575 5,083 4,829 5,074 5,638 5,356Single pedestrian 1,0m wide R / meter 1,534 1,705 1,619 1,594 1,771 1,683 1,768 1,964 1,866

Page 114 of 228
Cost in Rand Northern Cape Western Cape Eastern Cape
Infrastructure Unit
Min Max Ave Min Max Ave Min Max Ave
Fencing Security Concrete Pales Palisade Fencing 2,4m high R / meter 986 1,096 1,041 898 997 948 778 865 821Wire Fencing 2,4m high R / meter 3 3 3 6,870 7,633 7,251 5,956 6,618 6,287Public Concrete Pales Palisade Fencing 1,8m high R / meter 554 615 584 504 560 532 437 485 461Wire Fencing 1,2m high R / meter 268 298 283 244 271 258 212 235 224Wire Fencing 1,83m high R / meter 413 458 436 376 417 396 326 362 344Gates/Security Double leaf 4m wide 2,4m high R / meter 4,026 4,473 4,249 3,664 4,071 3,867 3,176 3,529 3,353Double leaf 6m wide R / meter 5,367 5,964 5,666 4,885 5,428 5,157 4,235 4,706 4,471Single pedestrian 1,0m wide R / meter 1,870 2,078 1,974 1,702 1,891 1,797 1,476 1,640 1,558
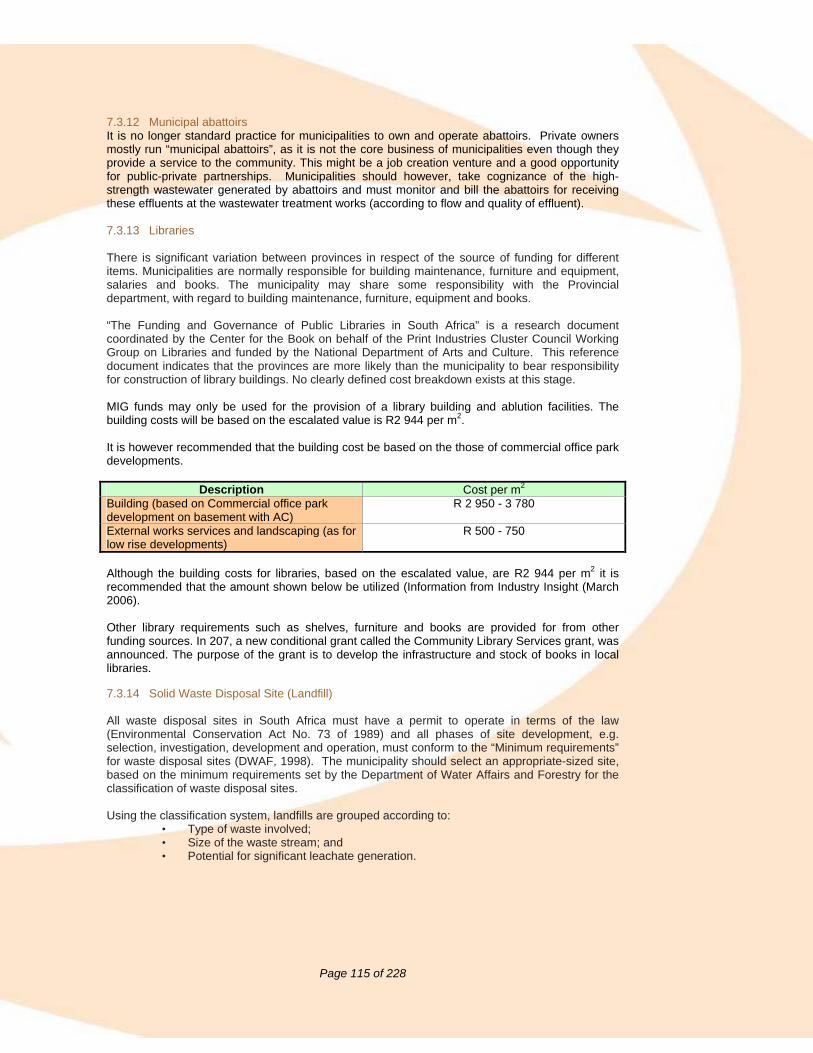
Page 115 of 228
7.3.12 Municipal abattoirs It is no longer standard practice for municipalities to own and operate abattoirs. Private owners mostly run “municipal abattoirs”, as it is not the core business of municipalities even though they provide a service to the community. This might be a job creation venture and a good opportunity for public-private partnerships. Municipalities should however, take cognizance of the high-strength wastewater generated by abattoirs and must monitor and bill the abattoirs for receiving these effluents at the wastewater treatment works (according to flow and quality of effluent).
7.3.13 Libraries There is significant variation between provinces in respect of the source of funding for different items. Municipalities are normally responsible for building maintenance, furniture and equipment, salaries and books. The municipality may share some responsibility with the Provincial department, with regard to building maintenance, furniture, equipment and books. “The Funding and Governance of Public Libraries in South Africa” is a research document coordinated by the Center for the Book on behalf of the Print Industries Cluster Council Working Group on Libraries and funded by the National Department of Arts and Culture. This reference document indicates that the provinces are more likely than the municipality to bear responsibility for construction of library buildings. No clearly defined cost breakdown exists at this stage. MIG funds may only be used for the provision of a library building and ablution facilities. The building costs will be based on the escalated value is R2 944 per m2. It is however recommended that the building cost be based on the those of commercial office park developments.
Description Cost per m2
Building (based on Commercial office park development on basement with AC)
R 2 950 - 3 780
External works services and landscaping (as for low rise developments)
R 500 - 750
Although the building costs for libraries, based on the escalated value, are R2 944 per m2 it is recommended that the amount shown below be utilized (Information from Industry Insight (March 2006). Other library requirements such as shelves, furniture and books are provided for from other funding sources. In 207, a new conditional grant called the Community Library Services grant, was announced. The purpose of the grant is to develop the infrastructure and stock of books in local libraries. 7.3.14 Solid Waste Disposal Site (Landfill)
All waste disposal sites in South Africa must have a permit to operate in terms of the law (Environmental Conservation Act No. 73 of 1989) and all phases of site development, e.g. selection, investigation, development and operation, must conform to the “Minimum requirements” for waste disposal sites (DWAF, 1998). The municipality should select an appropriate-sized site, based on the minimum requirements set by the Department of Water Affairs and Forestry for the classification of waste disposal sites. Using the classification system, landfills are grouped according to:
• Type of waste involved; • Size of the waste stream; and • Potential for significant leachate generation.

Page 116 of 228
Note that the landfill classification system cannot address factors specific to a particular site, such as the sensitivity of the receiving environment. Such factors are addressed during site selection, investigation and environmental impact assessment, where any critical factor would be identified.

Page 117 of 228
Table 7.3.14: Shows the range of unit costs (in Rand for tonnes per day) – based on the Maximum Rate of Deposition (MRD) per day - as developed from zero-based approach, following breakdown as depicted in Appendix 6:
Cost in Rand
Limpopo Gauteng North West Infrastructure
Unit
Min Max Ave Min Max Ave Min Max Ave Solid Waste Disposal Site - Landfill Maximum Communal <25 R / tones / day 3,179,030 3,532,256 3,355,643 2,620,800 2,912,000 2,766,400 3,089,923 3,433,248 3,261,586Small 25-150 R / tones / day 4,768,546 5,298,384 5,033,465 3,931,200 4,368,000 4,149,600 4,634,885 5,149,872 4,892,378Medium >150-500 R / tones / day 22,253,213 24,725,792 23,489,502 18,345,600 20,384,000 19,364,800 21,629,462 24,032,736 22,831,099Large >500 R / tones / day 38,148,365 42,387,072 40,267,718 31,449,600 34,944,000 33,196,800 37,079,078 41,198,976 39,139,027
Cost in Rand
Free State Kwa-Zulu Natal Mpumalanga Infrastructure
Unit
Min Max Ave Min Max Ave Min Max Ave Solid Waste Disposal Site - Landfill Maximum Communal <25 R / tones / day 2,751,840 3,057,600 2,904,720 2,859,293 3,176,992 3,018,142 3,171,168 3,523,520 3,347,344Small 25-150 R / tones / day 4,127,760 4,586,400 4,357,080 4,288,939 4,765,488 4,527,214 4,756,752 5,285,280 5,021,016Medium >150-500 R / tones / day 19,262,880 21,403,200 20,333,040 20,015,050 22,238,944 21,126,997 22,198,176 24,664,640 23,431,408Large >500 R / tones / day 33,022,080 36,691,200 34,856,640 34,311,514 38,123,904 36,217,709 38,054,016 42,282,240 40,168,128
Cost in Rand
Northern Cape Western Cape Eastern Cape Infrastructure
Unit
Min Max Ave Min Max Ave Min Max Ave Solid Waste Disposal Site - Landfill Maximum Communal <25 R / tones / day 3,354,624 3,727,360 3,540,992 3,053,232 3,392,480 3,222,856 2,647,008 2,941,120 2,794,064Small 25-150 R / tones / day 5,031,936 5,591,040 5,311,488 4,579,848 5,088,720 4,834,284 3,970,512 4,411,680 4,191,096Medium >150-500 R / tones / day 23,482,368 26,091,520 24,786,944 21,372,624 23,747,360 22,559,992 18,529,056 20,587,840 19,558,448Large >500 R / tones / day 40,255,488 44,728,320 42,491,904 36,638,784 40,709,760 38,674,272 31,764,096 35,293,440 33,528,768
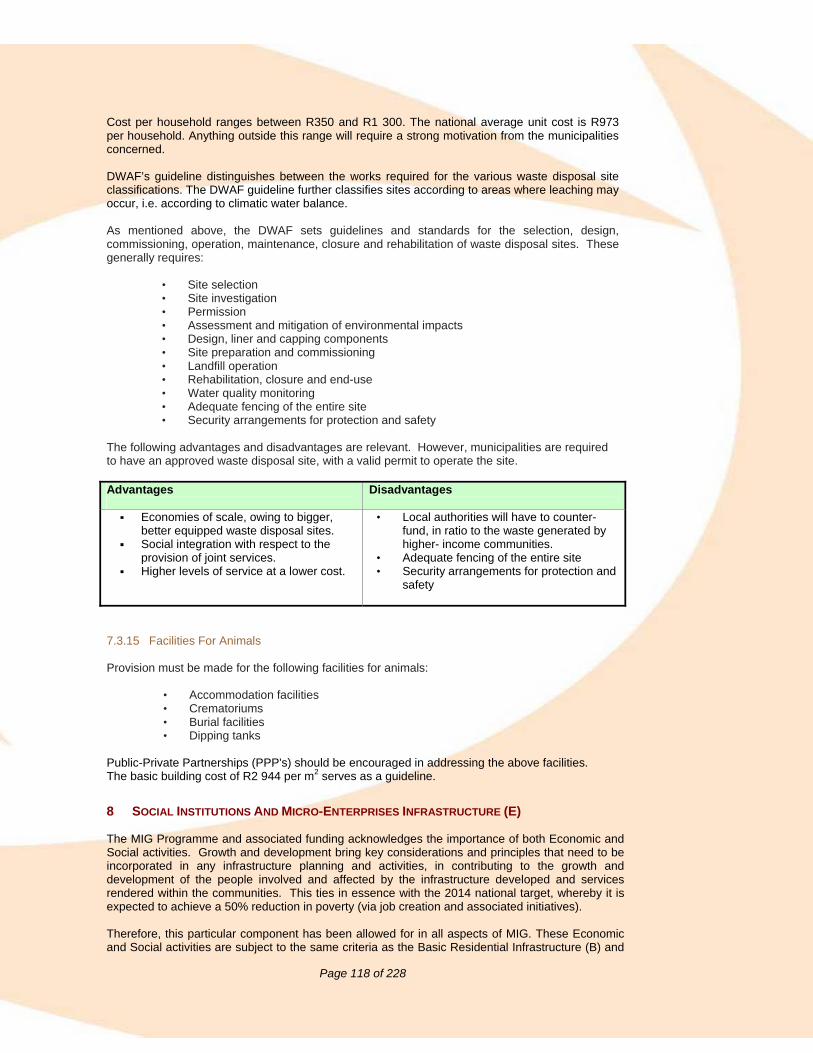
Page 118 of 228
Cost per household ranges between R350 and R1 300. The national average unit cost is R973 per household. Anything outside this range will require a strong motivation from the municipalities concerned. DWAF’s guideline distinguishes between the works required for the various waste disposal site classifications. The DWAF guideline further classifies sites according to areas where leaching may occur, i.e. according to climatic water balance. As mentioned above, the DWAF sets guidelines and standards for the selection, design, commissioning, operation, maintenance, closure and rehabilitation of waste disposal sites. These generally requires:
• Site selection • Site investigation • Permission • Assessment and mitigation of environmental impacts • Design, liner and capping components • Site preparation and commissioning • Landfill operation • Rehabilitation, closure and end-use • Water quality monitoring • Adequate fencing of the entire site • Security arrangements for protection and safety
The following advantages and disadvantages are relevant. However, municipalities are required to have an approved waste disposal site, with a valid permit to operate the site.
Advantages
Disadvantages
Economies of scale, owing to bigger, better equipped waste disposal sites.
Social integration with respect to the provision of joint services.
Higher levels of service at a lower cost.
• Local authorities will have to counter-fund, in ratio to the waste generated by higher- income communities.
• Adequate fencing of the entire site • Security arrangements for protection and
safety
7.3.15 Facilities For Animals Provision must be made for the following facilities for animals:
• Accommodation facilities • Crematoriums • Burial facilities • Dipping tanks
Public-Private Partnerships (PPP's) should be encouraged in addressing the above facilities. The basic building cost of R2 944 per m2 serves as a guideline.
8 SOCIAL INSTITUTIONS AND MICRO-ENTERPRISES INFRASTRUCTURE (E) The MIG Programme and associated funding acknowledges the importance of both Economic and Social activities. Growth and development bring key considerations and principles that need to be incorporated in any infrastructure planning and activities, in contributing to the growth and development of the people involved and affected by the infrastructure developed and services rendered within the communities. This ties in essence with the 2014 national target, whereby it is expected to achieve a 50% reduction in poverty (via job creation and associated initiatives). Therefore, this particular component has been allowed for in all aspects of MIG. These Economic and Social activities are subject to the same criteria as the Basic Residential Infrastructure (B) and

Page 119 of 228
Public Municipal Infrastructure (P) as outlined in the Guideline Document on MIG Processes and Procedures as discussed above. Identified projects of this Component must also satisfy the same criteria applicable to the other Components prior to approval. These criteria are: Providing a Basic Level of Service Infrastructure Targeting the poorest of the population, community and people Maximizing the economic benefit to the community Equity in the fund allocation for projects.
To ensure proportionate equality between the different project categories, the MIG Policy Framework (5 February 2004) specifically identifies the E-Component in the formula calculating the MIG allocation to all Local Authorities. The E-Component is defined as “The allocation for Infrastructure for Social and Micro Enterprises”. The initial indication in the Policy Document is that 5% of the MIG pot is allocated to the E-Component. The same management and financial controls applicable to all other projects equally applies to this Component. The funds budgeted and expended on these projects should not exceed the amount calculated and allocated in terms of the formula. Typical examples of the project types that may be included in the two categories covered by the E-Component are: Micro Enterprises (LED): Street Trading Markets Local Tourism Handcraft Centers Food Production Units e.g. Chicken Farming, Communal Gardens, etc.
Social Institutions:
Old-age homes Orphanages Churches Crèches Clinics Sports Fields Recreational Facilities e.g. Parks and Open Spaces, etc
The project should be a plot package that includes the land and all the basic services and infrastructure required for the project e.g. water, sanitation, road access, stormwater and electricity. Local Authorities can contribute in all of the above types of projects by donating the land or by availing land at reduced price. 8.1 Micro Enterprises 8.1.1 Definition/Description
Micro Enterprises are economic activities with different purposes that are being conducted on a small scale. They are also referred to as SMME’s. The size relates mostly to the number of people employed within the activity and secondly, to the value of annual turnover that is limited for the business type. These factors determine the category (small, micro or medium) being applicable to the category. 8.1.2 Purpose of Micro Enterprises
The purpose of a Micro Enterprise as an economic activity is to sacrifice a larger scale of operation and the benefits of economies of scale (associated with large enterprises) - as a trade off for the financial gain locked into the process of cutting huge overheads, establishment costs and production cost (associated with smaller enterprises). This ultimately then yields a strong competiting power for SMMEs in the market place. Secondly, it provides opportunity to that section of the community and market that do not have huge resources or access to large amounts of capital that is required to participate and compete in the economic sector.

Page 120 of 228
It further also provides for the opportunities of growth and development, specifically in the rural and smaller town context. It is essential to stimulate and promote these activities as they can grow into a significant percentage of the economic activity of the area or town in which they operate. The significance, however, is that whilst in the urban context there may be the alternative of bigger business or industry, the Micro Enterprise is often the most viable solution to economic activity in the rural areas. Hence, it becomes a key element in providing services and goods and in many cases becomes the only opportunity of employment to many individuals. These considerations necessitate that Micro Enterprises should be nurtured and assisted to grow ultimately to fill their deserved place and portion in the South African economy.
8.1.3 Geographical Context
Micro Enterprises are found in both the urban and rural context. There may be a shift in the type of goods and services delivered i.e. the purpose of the Micro Enterprises when moving from urban to rural. 8.1.4 Basic level of service In most cases only the basic levels of a reliable service is required that includes water, sanitation, road access and electricity. In urban context, there may be special requirements for a special service, but these mostly will relate to more of bulk supplies e.g. large water or electricity supply, special treatment of sewerage or industrial effluents, particular sludge applications, etc. New services to be constructed must be carefully considered by the Local Authority. If the Micro Enterprise is not viable and sustainable for a minimum period, costly services could be provided for no actual gain and poor/no return to the municipal investment. Hence, before any project is approved, it will be advisable to conduct a comprehensive feasibility or viability study that include the following:
Calculations to confirm the Start-up Capital requirements; Calculations to confirm the Working Capital requirements for a period at least 2 years beyond
the breakeven point; A full operations and maintenance plan for the same period of at least 2 years beyond
breakeven; Research confirming why the particular entity/project to be funded is needed in the market
place; The marketing strategies, advertising campaigns and selling approaches planned to ensure
success of the project; and Identification of competitors and threats in the business environment.
The above will be used to inform a comprehensive and realistic Business Plan.
8.1.5 Level of service options In order to support SMME activities, the most appropriate level of service may be required, depending on the circumstances e.g. bitumen paved parking area or blocked paved pavement or sidewalks. A healthy level (or potential) of SMME activities may result in the provision of a higher level of services to sustain the SMME activities and leverage for further economic growth in the specific area. 8.1.6 Advantages/Disadvantages The accommodation of Micro Enterprises and providing for their needs has certain advantages and disadvantages. The advantages and disadvantages are summarized in the table below:

Page 121 of 228
Advantages
Disadvantages
• Enables a bigger section of the community to become economic active and participate in the economy of the area.
• Creates employment opportunities that otherwise will not be there.
• Increases the spending power and ability of the community that in turn - results in growth and development that may attract further economic activity.
• Assists in the development of the community due to the exposure and participation in activity that otherwise would not exist.
• Increase the ability of communities to pay for municipal services.
• The increase of affordability levels result in social upliftment - parents can afford better and more education opportunities for their children.
• Food Production Units can sustain a quality and reliable food supply that result in improvement of health conditions.
• Micro Enterprises do not place an exceptional burden on services to be supplied through the Local Authority, as they are the same basic services required for the service the residential areas.
• Micro Enterprises has a poor record in co-existing and growing business as a sustainable rate – this result in a fluctuation of the benefits e.g. employment opportunities, income earned and consumer confidence.
• Payment of municipal charges may be erratic as it depends on the financial state of the particular enterprise.
• In the urban and town context, Bylaws relating to trading and conducting business may have to be enforced more stringently.
• Financial welfare could also result in social and moral decay of elements within the community.
• O&M activities may require more input to ensure the reliability of services being provided.
8.1.7 Standards of Construction
The standards of construction of services to Micro Enterprises will be similar to those applied in the provision of other basic residential services. Particular care must be applied to quality to ensure the reliability of services.
8.1.8 Unit Costs
The unit costs applicable to the provision of the services will be exactly the same as for the provision of basic residential services. It is however, critical that adequate allowance is made for all services required and these are fully budgeted for. Hence, it will require a thorough understanding of the business type and servicing requirements. Failure in preparing comprehensive costing will not assist in providing a plot package. This Industry Guide must be studied carefully to allow for all elements of infrastructure. Where buildings are involved, the ruling building cost per square meter rate for the area must be used for estimating purposes. The rates in this guide under the appropriate sections can also be used. The plot package could include land at a reduced cost or even free. This should be used as leverage to attract the particular Micro Enterprise.

Page 122 of 228
Table 8.1.8: Infrastructure: LED type projects unit costs/sq as developed from zero-based approach, following breakdown as depicted in Appendix 6:
Cost in Rand/sq Limpopo Gauteng North West
Infrastructure Unit
Min Max Ave Min Max Ave Min Max Ave Local Economic Development Street trading R / 4 square meters 9140 10155 9647 7535 8372 7953 8884 9871 9377Markets R / 6 square meters 30996 34439 32718 25553 28392 26972 30127 33474 31800Local tourism R / meter - - - - - - - - -
Cost in Rand/sq
Free State Kwa-Zulu Natal Mpumalanga Infrastructure Unit
Min Max Ave Min Max Ave Min Max Ave
Local Economic Development Street trading R / 4 square meters 7912 8791 8351 8220 9134 8677 9117 10130 9624Markets R / 6 square meters 26830 29812 28321 27878 30976 29427 30919 34354 32637Local tourism R / meter - - - - - - - - -
Cost in Rand/sq Northern Cape Western Cape Eastern Cape
Infrastructure Unit
Min Max Ave Min Max Ave Min Max Ave Local Economic Development Street trading R / 4 square meters 9140 10155 9647 7535 8372 7953 8884 9871 9377Markets R / 6 square meters 30996 34439 32718 25553 28392 26972 30127 33474 31800Local tourism R / meter - - - - - - - - -
* Local tourism is not costed as result the varied nature and type of tourist business / enterprise may be opted or applicable to the SMME

Page 123 of 228
8.2 Social Institutions 8.2.1 Definition/Description
Social Institutions are those facilities that are provided for the social well being of the community. 8.2.2 Purpose of Social Institutions
This type of facility provides for and addresses the social needs of a community. These facilities aims at serving the community with services other than basic, e.g. religious needs, recreational needs and relaxation, toddler care and education, etc. Such ‘services’ ultimately contribute to the overall well being of a community, and are considered by many people to be the corner stone of development and personal growth in a community.
8.2.3 Geographical Context
Social Institutions are required in both the urban and rural context. There may be a shift in the type encountered when moving from urban to rural. Certain institutions may not be viable in the smallness of the rural context e.g. orphanages and old age homes only become viable in the urban areas. In the rural context, there is no need for open spaces for relaxation as opposed to the urban environment where areas have been built up and hence it has become a desperate need for the community. 8.2.4 Basic level of service In most cases only the basic levels of a reliable service is required that includes water, sanitation, road access and electricity as may be relevant to the particular type of institution. For example an open space may require water service throughout whilst electricity may be a lesser requirement. New services to be constructed must be carefully considered by the Local Authority. Considering the social nature of the facility payment of service charges may become problematic as the financial state of the institution is linked to the social status of the community. Hence consideration should be given to subsidize the service being provided e.g. water, sanitation, electricity etc. This must be emphasized as the Local Authorities contribution to the social needs of their community. Most of the Social Institutions have a strong linkage with the Department of Social Development or the Department of Health. Hence the Local Authority will benefit by establishing good working relations and partnerships with these Government entities. The benefits are to secure payment for services rendered, on-going sustainability and acceptable levels of services being provided within the Institution. A growing trend is to create Public Private Partnerships (PPP) for the establishment and operation of these facilities. This is encouraged as it ensures sustainability of the institution.
8.2.5 Level of service options A higher level of service may be required in certain instances e.g. bitumen paved parking area or blocked paved pavement or sidewalks. These will invariably link to providing easier access to those utilizing the particular Social Institution. Buildings must accommodate in particular the disabled portion and user in the community. Special attention at these facilities must be given to e.g. handrails at steps, ramps for wheelchairs, etc. 8.2.6 Advantages/Disadvantages The advantages and disadvantages of Social Institutions are summarized in the table below:
Advantages
Disadvantages
• Is essential in providing for the full spectrum of the needs of the community.
• Contributes to the overall well being and mental health of the community.
• Prevents moral decay of the community.
• Could become a financial burden on the Local Authority due to non payment of service charges.
• O&M activities may require more input to ensure the reliability of services being provided e.g. to Old Age Homes etc.

Page 124 of 228
8.2.7 Standards of Construction
The standards of construction of services to Social Institutions will be similar to those applied in the provision of other basic residential services. Once again particular care must be applied to the quality to ensure the reliability of services.
8.2.8 Unit Costs
The unit costs applicable to the provision of the services will be exactly the same as for the provision of basic residential services. It is critical that adequate allowance is made for all services required and that these are fully budgeted for. Failure in preparing comprehensive costing will not assist in providing a plot package to the end user. This Industry guide must be studied carefully to allow for all elements of infrastructure. Where buildings are involved the ruling building cost per square meter rate for the area must be used for estimating purposes. The rates in this guide under the appropriate sections cane also be used. The plot package could include land at a reduced cost or even free. This can be seen as the contribution to the social welfare of the Local Authority. MIG has made provision for the following to be provided with the plot package at a cost that will be determined by the size of the facility.
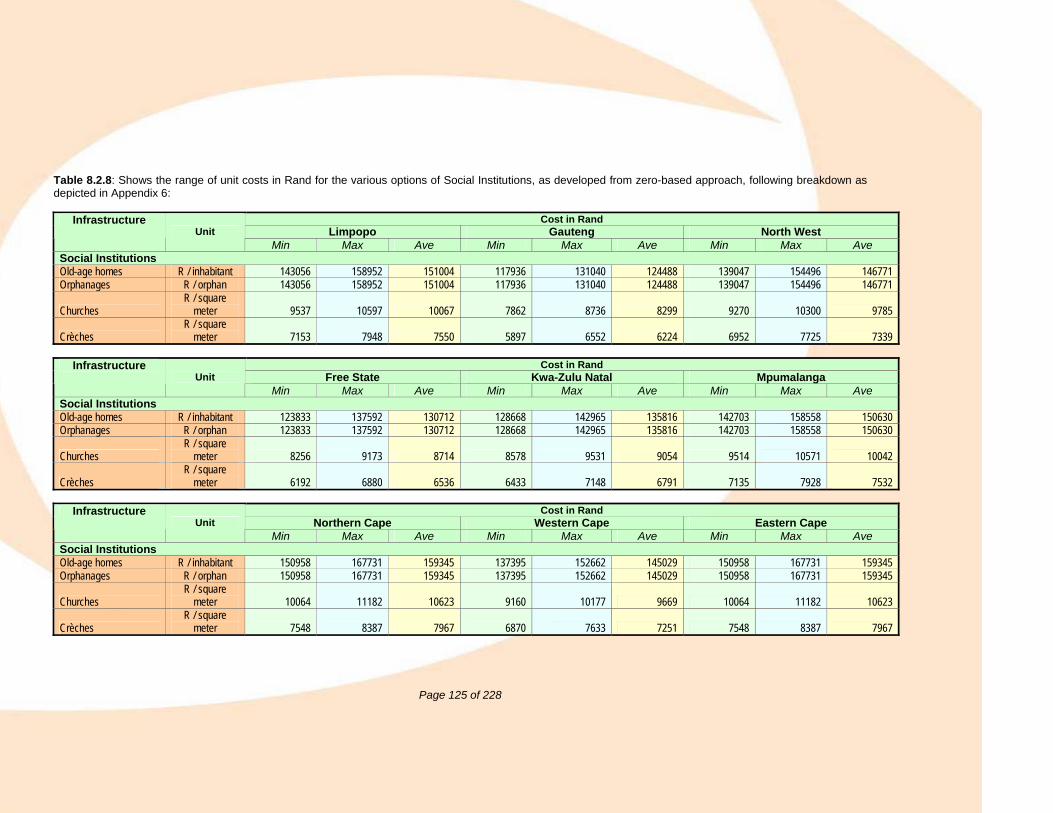
Page 125 of 228
Table 8.2.8: Shows the range of unit costs in Rand for the various options of Social Institutions, as developed from zero-based approach, following breakdown as depicted in Appendix 6:
Cost in Rand
Limpopo Gauteng North West Infrastructure
Unit Min Max Ave Min Max Ave Min Max Ave
Social Institutions Old-age homes R / inhabitant 143056 158952 151004 117936 131040 124488 139047 154496 146771 Orphanages R / orphan 143056 158952 151004 117936 131040 124488 139047 154496 146771
Churches R / square
meter 9537 10597 10067 7862 8736 8299 9270 10300 9785
Crèches R / square
meter 7153 7948 7550 5897 6552 6224 6952 7725 7339
Cost in Rand Free State Kwa-Zulu Natal Mpumalanga
Infrastructure Unit
Min Max Ave Min Max Ave Min Max Ave Social Institutions Old-age homes R / inhabitant 123833 137592 130712 128668 142965 135816 142703 158558 150630 Orphanages R / orphan 123833 137592 130712 128668 142965 135816 142703 158558 150630
Churches R / square
meter 8256 9173 8714 8578 9531 9054 9514 10571 10042
Crèches R / square
meter 6192 6880 6536 6433 7148 6791 7135 7928 7532
Cost in Rand Northern Cape Western Cape Eastern Cape
Infrastructure Unit
Min Max Ave Min Max Ave Min Max Ave Social Institutions Old-age homes R / inhabitant 150958 167731 159345 137395 152662 145029 150958 167731 159345 Orphanages R / orphan 150958 167731 159345 137395 152662 145029 150958 167731 159345
Churches R / square
meter 10064 11182 10623 9160 10177 9669 10064 11182 10623
Crèches R / square
meter 7548 8387 7967 6870 7633 7251 7548 8387 7967

Page 126 of 228
9 MIG OFFICES National Department of Provincial Tel: (012) 334 4942
and Local Government Fax: (012) 334 4872
Eastern Cape Department of Housing Tel: (040) 609 5565 and Local Government Fax: (040) 636 4285
Free State Department of Local Tel: (051) 405 5717 Government and Housing Fax: (051) 405 5008
Gauteng Department of Development Tel: (011) 355 5412 Planning and Local Government Fax: (011) 355 5403
KwaZulu-Natal Department of Traditional and Tel: (033) 355 6172 Local Government Fax: (033) 355 6547
Limpopo Department of Local Government Tel: (015) 295 6851 and Housing Fax: (015) 295 4700
Mpumalanga Department of Local Government Tel: (013) 766 6605 Fax: (013) 766 8449
Northern Cape Department of Housing and Tel: (053) 830 9462 Local Government Fax: (053) 830 9562
North West Department of Developmental Tel: (018) 387 3747 Local Government and Housing Fax: (018) 387 3745
Western Cape Department of Local Government Tel: (021) 483 4191 Fax: (021) 483 3244

Page 127 of 228
10 SOURCES AND REFERENCES:
i. Department of Provincial and Local Government: Booklet: Municipal Infrastructure: Roles and Responsibilities of National Sector Departments, Provincial Counterparts and Municipalities. http://www.dplg.gov.za/dmdocuments/roles.pdf, as accessed on 11 May 2007
ii. Department of Provincial and Local Government: Guidelines: Multi-dimensional targeted
approach to support municipalities on infrastructure services delivery, Applicable from 1 April 2007. http://www.dplg.gov.za/dmdocuments/Municipal%20Infrastructure%20Support%20strat%202%20April%202007.doc, as accessed on 24 April 2007
iii. Government Communications (GCIS), Statement on the Cabinet meeting held in Cape Town on 21 February 2007, issued on 22 February 2007 http://www.search.gov.za/info/previewDocument.jsp?dk=%2Fdata%2Fstatic%2Finfo%2Fspeeches%2F2007%2F07022211451001.htm%40Gov&q=%3Cphrase%3E+%28programme+management%29&t=Statement+on+Cabinet+meeting+21+February,
iv. National Treasury, Budget Review: 2007, Republic of South Africa, issued on 21 February
2007, http://www.sars.gov.za/budget/documents/budget/2007/review/isbn.pdf , as accessed on 11 May 2007
v. Hill Du Bois (HDB) Quantity Surveyors(2007), Technical Information: Building Cost First
Quarter 2007, http://www.hilldubois.co.za/html/technical_information.html, as accessed on 2007/04/17, Referred to by The Association of South African Quantity Surveyors (ASAQS), http://www.asaqs.co.za/public/building_cost.html
vi. Industry Insight, Building Costs in the South African Construction Industry, March 2006,
vii. DWAF (2003), Cost Benchmarks: Typical Unit Cost For Water Services Development
Projects: A Guide for Local Authorities, January 2003, http://www.dwaf.gov.za/tigds/doc/Benchmark%202003-5-12_Full.pdf, as accessed on 2007/04/19
viii. DWAF (2000), Cost Benchmarks: Water Services Development Projects: A Guide for Local
Authorities, January 2000, http://www.dwaf.gov.za/Downloads/WS/content/pds/AlternativeDeliveryMechanism/PDF/costbenchmarkguidea4-1.pdf, as accessed on 2007/05/02
ix. DWAF (1998), Conceptual Planning And Costing Of community Water Supply Schemes
User Guide And Reference Manual, November 1998 http://www.dwaf.gov.za/tigds/doc/Cost%20Model%20User%20Guide%201998%20.PDF, as accessed on 2007/05/02
x. Tumagole, KB (2006), Geochemical survey of underground water pollution at Ditengteng
northern cemetery within city of Tshwane municipality, M.Sc Thesis, University of Johannesburg: Department Geography and Environmental Management, URN: etd-03222006-131055, http://etd.uj.ac.za/theses/available/etd-03222006-131055, accessed on 2007/04/19
xi. DWAF (March 2004), Guidelines on Protecting Groundwater from Contamination,
Published by DWAF, Directorate: Information Programmes, Private Bag X313, PRETORIA 0001, Republic of South Africa Tel: (012) 336 7500, http://www.dwaf.gov.za/tigds/doc/Boreholes.pdf , as accessed on 2007/04/19
xii. P. P. Moodley and M. O. Bachmann (2002), Inequity in occupational health services for
government hospital workers in South Africa, Occupational Medicine 52:393-399 (2002), http://occmed.oxfordjournals.org/cgi/content/abstract/52/7/393, as accessed on 2007/04/19

Page 128 of 228
xiii. Department of Health, The Primary Health Care Package for South Africa – a set of norms and standards, March 2000 http://www.doh.gov.za/docs/policy/norms/full-norms.pdf, as accessed on 2007/05/04
xiv. Department of Health, Health Sector Strategic Framework 1999 – 2004, Chapter 3
Strategic Health Priorities http://www.doh.gov.za/docs/policy/framewrk/chap03.html, as accessed on 2007/04/19
xv. Department of Health, Strategic Framework For Modernization Of Tertiary Services, Discussion Document May 2003 http://www.doh.gov.za/mts/, as accessed on 2007/05/05
xvi. Department of Health, The Official Transfer of Government Forensic Mortuaries from the
SAPS to the Department of Health, Minister of Health communiqué 13 April 2006 http://www.doh.gov.za/docs/pr/2006/pr0403.html , as accessed on 2007/05/10
xvii. Department of Health, Handbook for Clinic/CHC Managers, October 1999,
http://www.doh.gov.za/docs/factsheets/guidelines/handbook.html, as accessed on 2007/04/19
xviii. Department of Health, Discussion Document on Policy And Planning For The Meeting Of
The National Consultative Health Forum May 2006, Discussion document on policy and planning for NCHF 5/24/2006, http://www.doh.gov.za/docs/misc/policyplanning.pdf, as accessed on 2007/04/19
xix. Statistics South Africa, Statistical release P0142.1 PRODUCTION PRICE INDEX (PPI)
FEBRUARY 2007, Embargoed until: 29 March 2007 11:30 Enquiries: Forthcoming issue: Expected release date 26 April 2007, http://www.statssa.gov.za/publications/statsdownload.asp?PPN=p0142.1&SCH=3856, as accessed on 2007/04/19
xx. South African National Disaster Management Center, Department of Provincial and Local
Government, Disaster management guidelines for municipalities, http://sandmc.pwv.gov.za/Newsite/WebDocuments/dmgforMunicipalities.pdf, as accessed 2007/04/22
xxi. South African National Disaster Management Center, Department of Provincial and Local
Government, Disaster Management Framework, http://sandmc.pwv.gov.za/Newsite/Framework.htm, as accessed 2007/04/22
xxii. Department Of Provincial And Local Government, The Disaster Management Regulations:
Disaster Management Act, 2002 (Act No. 57 Of 2002), Government Notice, 9 September 2005 No. 27991, Notice 1689 Of 2005, http://www.info.gov.za/gazette/notices/2005/27991b.pdf, as accessed on 2007/04/19
xxiii. City of Cape Town , City of Cape Town Municipal Disaster Management Framework
http://web.capetown.gov.za/eDocuments/SA%20Nat%20DisMan%20framework_1812200615952_470.pdf, as accessed on 2007/04/19
xxiv. Reid, Pat (2000), Suggested Infrastructural Requirements: Disaster Management Center 1
& 2, Disaster Management Institute Of Southern Africa (DMISA), http://www.disaster.co.za/docs.htm, as accessed on 2007/04/19
xxv. Australia South Africa Local Governance Partnership (ASALGP) & Department Traditional
and Local Government Affairs (DTLGA), and the Umzinyathi and Umkhanyakude District Municipalities, Toolkit to establish disaster management institutional arrangements in KwaZulu-Natal Province from August to December 2004, Website & guideline, December 2004, http://devplan.kzntl.gov.za/ASALGP/Resources/Documents/ASALGPproducts/GettingStarted/establishing.htm, as accessed on 2007/04/22

Page 129 of 228
xxvi. The Engineering Council of South Africa, BOARD NOTICE 30 OF 2007, Engineering Council of South Africa: Guideline Scope of Services and Tariff of Fees for Persons Registered in terms of the Engineering Profession Act, 2000, (Act No.46 of 2000), Government Gazette No 29729, 30 March 2007, http://www.ecsa.co.za/ConsultFees/2007/ECSA_GuidelineScope%20Fees_1April%202007.doc, as accessed on 2007/04/20
xxvii. The Engineering Council of South Africa, BOARD NOTICE 31 OF 2007, Engineering
Council of South Africa: Notification of Indicative Time Based Fee Rates, Government Gazette No 29729, 30 March 2007, http://www.ecsa.co.za/ConsultFees/2007/ECSA_IndicativeTimeBasedFee_1Apr2007.doc, as accessed on 2007/04/20
xxviii. Still, D (2005), Key Performance Indicators and benchmarks in Rural Water Supply, Paper
presented at the 2nd Annual Water Services Convention: Focusing on Rural Water Supply, Gallagher Estate, Midrand, 8-10 June 2005
xxix. SAFCEC’s: State of the civil industry: 1st Quarter 2007, Published March 2007
http://www.safcec.org.za/civil_2007Q1FINAL.doc, as accessed on 2007/05/07
xxx. Aveng’s (previously Anglo-Vaal Engineering): Market Review : updated 4 October, 2006 http://www.aveng.co.za/market.asp , accessed on 2007/05/07
xxxi. Department of Constitutional Development: “Targeting Poor Households in the Provision of
Basic Municipal Services: A Guideline for Municipalities” http://www.thedplg.gov.za/subwebsites/publications/municipalityguideline.htm, as accessed on 2007/04/24
10.2 Disclaimer: All care has been taken in the preparation of this document and the information contained herein has been directed from sources believed to be accurate and reliable. The document is the collective effort of the various public Sector Departments responsible for infrastructure policy, funding, development and service delivery. However, these sectors will not assume responsibility for the use of the document outside the framework of its intention, which is primarily serving a purpose of guideline to the end users to assist in the planning and costing of municipal infrastructure.

Page 130 of 228
11. APPENDICES

Page 131 of 228
Appendix 1: Labour, Plant and Material Indices and Rate and Escalation factors

Page 132 of 228
MIG GUIDELINES UNIT COSTING - ESCALATION FACTORS FOR LABOUR, PLANT, MATERIAL AND FUEL: LABOUR RATES INDICES PER PROVINCE OTHER INDICES
CONTRACT TYPES
CALC's DETAIL E
AS
TER
N C
AP
E -
Por
t Eliz
abet
h
FRE
E S
TATE
- B
loem
font
ein
GA
UTE
NG
- W
itwat
ersr
and
KW
AZU
LU-
NA
TAL
- Dur
ban
LIM
PO
PO
- P
olok
wan
e
MP
UM
ALA
NG
A -
Nel
spru
it
NO
RTH
ER
N
CA
PE
- K
imbe
rley
NO
RTH
WE
ST
WE
STE
RN
CA
PE
- C
ape
Pen
insu
la
PLA
NT
IND
EX
MA
TER
IAL
IND
EX
FUE
L IN
DE
X
Base Costs Dec 2004 127.4 121.9 125.3 125.9 116.5 124.1 128.0 125.3 124.6 133.1 125.6 145.4
Current Costs Feb 2007 143.1 137.1 137.4 140.0 128.5 137.9 144.9 138.5 137.3 148.3 172.5 203.9
Index Ratio 1.1232 1.1247 1.0966 1.1120 1.1030 1.1112 1.1320 1.1053 1.1019 1.1142 1.3734 1.4023
LABOUR INDEX PLANT INDEX
MATERIAL INDEX
FUEL INDEX
CONTRACT TYPES CALC's DETAIL
EC FS GT KZN LM MP NC NW WC
Coefficient 0.15 0.15 0.15 0.15 0.15 0.15 0.15 0.15 0.15 0.50 0.20 0.15
Coef X Ratio 0.1685 0.1687 0.1645 0.1668 0.1655 0.1667 0.1698 0.1658 0.1653 0.5571 0.2747 0.2104
1. Earthworks (with Culverts and Drainage)
Esc Factor 0.1790 0.1792 0.1756 0.1776 0.1764 0.1775 0.1801 0.1767 0.1763 2. General Civil Engineering Work - 2/3 Earthworks; 1/3 Concrete
Coefficient 0.20 0.20 0.20 0.20 0.20 0.20 0.20 0.20 0.20 0.20 0.55 0.05

Page 133 of 228
Coef X Ratio 0.2246 0.2249 0.2193 0.2224 0.2206 0.2222 0.2264 0.2211 0.2204 0.2228 0.7554 0.0701 Esc Factor 0.2320 0.2323 0.2275 0.2301 0.2286 0.2300 0.2335 0.2290 0.2284
3. Concrete Work Coefficient 0.40 0.40 0.40 0.40 0.40 0.40 0.40 0.40 0.40 0.10 0.45 0.05
Coef X Ratio 0.4493 0.4499 0.4386 0.4448 0.4412 0.4445 0.4528 0.4421 0.4408 0.1114 0.6180 0.0701 Esc Factor 0.2115 0.2120 0.2025 0.2077 0.2047 0.2074 0.2145 0.2055 0.2043 4. Road-works 4.1 Roadwork Coefficient 0.20 0.20 0.20 0.20 0.20 0.20 0.20 0.20 0.20 0.35 0.35 0.10 Coef X Ratio 0.2246 0.2249 0.2193 0.2224 0.2206 0.2222 0.2264 0.2211 0.2204 0.3900 0.4807 0.1402 Esc Factor 0.2002 0.2005 0.1957 0.1983 0.1968 0.1982 0.2017 0.1972 0.1966 4.2 Concrete Structures
Coefficient 0.40 0.40 0.40 0.40 0.40 0.40 0.40 0.40 0.40 0.10 0.45 0.05
Coef X Ratio 0.4493 0.4499 0.4386 0.4448 0.4412 0.4445 0.4528 0.4421 0.4408 0.1114 0.6180 0.0701 Esc Factor 0.2115 0.2120 0.2025 0.2077 0.2047 0.2074 0.2145 0.2055 0.2043
LABOUR INDEX PLANT INDEX
MATERIAL INDEX
FUEL INDEX
CONTRACT TYPES
CALC's DETAIL
EC FS GT KZN LM MP NC NW WC
4.3 Township Roads and Services Coefficient 0.20 0.20 0.20 0.20 0.20 0.20 0.20 0.20 0.20 0.25 0.45 0.10
Coef X Ratio
0.2246 0.2249 0.2193 0.2224 0.2206 0.2222 0.2264 0.2211 0.2204 0.2785 0.6180 0.1402 Esc Factor 0.2222 0.2225 0.2177 0.2203 0.2188 0.2202 0.2237 0.2192 0.2186

Page 134 of 228
4.4 Premix Surfacing and Rehabilitation Coefficient 0.15 0.15 0.15 0.15 0.15 0.15 0.15 0.15 0.15 0.15 0.60 0.10
Coef X Ratio 0.1685 0.1687 0.1645 0.1668 0.1655 0.1667 0.1698 0.1658 0.1653 0.1671 0.8240 0.1402 Esc Factor 0.2549 0.2551 0.2515 0.2535 0.2523 0.2534 0.2560 0.2526 0.2522 5. Water and Sewerage Reticulation, Reservoirs and Engineering Work Coefficient 0.20 0.20 0.20 0.20 0.20 0.20 0.20 0.20 0.20 0.20 0.55 0.05
Coef X Ratio 0.2246 0.2249 0.2193 0.2224 0.2206 0.2222 0.2264 0.2211 0.2204 0.2228 0.7554 0.0701 Esc Factor 0.2320 0.2323 0.2275 0.2301 0.2286 0.2300 0.2335 0.2290 0.2284

Page 135 of 228
Appendix 2a: Unit Rate Using Zero Approach Costing

Page 136 of 228
The following tables indicate the unit cost determined on civil prices based on a zero-approach costing, where “raw’ prices were obtained from suppliers and manufacturers, and the total unit cost comprise of the various elements of plant, labour, material and fuel. Professional fees, VAT @14%. Please note that these items have been standardized NOT to be part of the unit costs and must be added to the unit costs.
Standardized
Cost difference to Gauteng EASTERN
CAPE FREE
STATE GAUTENG KWA-ZULU
NATAL LIMPOPO MAPUMALANGA NOTHERN
CAPE NORTH
WEST WESTERN
CAPEDescription %/Cost %/Cost %/Cost %/Cost %/Cost %/Cost %/Cost %/Cost %/Cost Material 1.00% 5.00% 0.00% 9.10% 21.30% 21.00% 28.00% 17.90% 16.50% Plant -6.40% -7.50% 0.00% 0.00% 11.90% -5.60% 9.10% 0.00% 0.00% Ready Mix Concrete 18.20% 14.20% 0.00% 12.10% 27.50% 10.90% 36.00% -22.20% 11.60% Labour (rate per man day) R 65.00 R 65.00 R 65.00 R 65.00 R 65.00 R 65.00 R 65.00 R 65.00 R 65.00 Supervision (rate per day) R 120.00 R 120.00 R 120.00 R 120.00 R 120.00 R 120.00 R 120.00 R 120.00 R 120.00 Preliminary & General 12.00% 12.00% 12.00% 12.00% 12.00% 12.00% 12.00% 12.00% 12.00% Building Factor to Province. (Gauteng as base) 0.00% 0.00% 0.00% 0.00% 0.00% 0.00% 0.00% 0.00% 0.00%

Page 137 of 228

Page 138 of 228
Appendix 2b: Adjusted Unit Rate Using Escalation Approach

Page 139 of 228
The following tables indicate civil prices based on the 2005 unit costs, escalated as follows:
MIG GUIDELINES UNIT COSTING - ESCALATION FOR PROJECT TYPES
ESCALATION INDICES PER PROVINCE
PROJECT TYPES UNIT OF COSTING
ESC FACTOR for CONTRACT
TYPE
EAS
TER
N C
APE
- P
ort E
lizab
eth
FRE
E S
TATE
- B
loem
font
ein
GA
UTE
NG
- W
itwat
ersr
and
KW
AZU
LU-N
ATA
L - D
urba
n
LIM
PO
PO -
Pol
okw
ane
MP
UM
ALA
NG
A -
Nel
spru
it
NO
RTH
ERN
CAP
E
- Kim
berle
y
NO
RTH
WES
T
WE
STER
N
CA
PE -
Cap
e P
enin
sula
Earthworks TYPE 1 0.1790 0.1792 0.1756 0.1776 0.1764 0.1775 0.1801 0.1767 0.1763
General Civil Work TYPE 2 0.2320 0.2323 0.2275 0.2301 0.2286 0.2300 0.2335 0.2290 0.2284
Concrete Work TYPE 3 0.2115 0.2120 0.2025 0.2077 0.2047 0.2074 0.2145 0.2055 0.2043
Roads - Roadwork TYPE 4.1 0.2002 0.2005 0.1957 0.1983 0.1968 0.1982 0.2017 0.1972 0.1966
Roads - Concrete Str TYPE 4.2 0.2115 0.2120 0.2025 0.2077 0.2047 0.2074 0.2145 0.2055 0.2043
Roads - Townships TYPE 4.3 0.2222 0.2225 0.2177 0.2203 0.2188 0.2202 0.2237 0.2192 0.2186
Roads - Surfacing TYPE 4.4 0.2549 0.2551 0.2515 0.2535 0.2523 0.2534 0.2560 0.2526 0.2522
Water and Sewerage TYPE 5 0.2320 0.2323 0.2275 0.2301 0.2286 0.2300 0.2335 0.2290 0.2284

Page 140 of 228
BASIC RESIDENTIAL INFRASTRUCTURE ESCALATION INDICES PER PROVINCE
PROJECT TYPES UNIT OF COSTING
ESC FACTOR for CONTRACT
TYPE EC FS GT KZN LM MP NC NW WC
WATER SUPPLY Unit Cost 6,000 6,000 6,000 6,000 6,000 6,000 6,000 6,000 6,000(per household) Escalation TYPE 5 1,392 1,394 1,365 1,381 1,372 1,380 1,401 1,374 1,370
Supply and Connector Current Unit
Cost 7,392 7,394 7,365 7,381 7,372 7,380 7,401 7,374 7,370WATER SUPPLY Unit Cost 350 350 350 350 350 350 350 350 350(per meter) Escalation TYPE 5 81 81 80 81 80 80 82 80 80
Meter Ordinary Current Unit
Cost 431 431 430 431 430 430 432 430 430WATER SUPPLY Unit Cost 1,300 1,300 1,300 1,300 1,300 1,300 1,300 1,300 1,300(per meter) Escalation TYPE 5 302 302 296 299 297 299 304 298 297
Pre-Paid Mater Current Unit
Cost 1,602 1,602 1,596 1,599 1,597 1,599 1,604 1,598 1,597SANITATION Unit Cost 3,000 3,000 3,000 3,000 3,000 3,000 3,000 3,000 3,000(per household) Escalation TYPE 5 696 697 682 690 686 690 701 687 685
Sanitation Facility Current Unit
Cost 3,696 3,697 3,682 3,690 3,686 3,690 3,701 3,687 3,685SANITATION Unit Cost 9,000 9,000 9,000 9,000 9,000 9,000 9,000 9,000 9,000 Escalation TYPE 5 2,088 2,091 2,047 2,071 2,057 2,070 2,102 2,061 2,056
Waterborne Current Unit Cost
11,088 11,091
11,047 11,071 11,057 11,070 11,102 11,061 11,056

Page 141 of 228
PROJECT TYPES UNIT OF
COSTING ESC
FACTOR / CONTRACT
TYPE
EC FS GT KZN LM MP NC NW WC
SANITATION Unit Cost 4,000 4,000 4,000 4,000 4,000 4,000 4,000 4,000 4,000 Escalation TYPE 5 928 929 910 920 914 920 934 916 914
Buckets Eradicated Current Unit
Cost 4,928 4,929 4,910 4,920 4,914 4,920 4,934 4,916 4,914SANITATION Unit Cost 3,650 3,650 3,650 3,650 3,650 3,650 3,650 3,650 3,650 Escalation TYPE 5 847 848 830 840 834 839 852 836 834
Onsite Sanitation Current Unit
Cost 4,497 4,498 4,480 4,490 4,484 4,489 4,502 4,486 4,484Roads Unit Cost 750,000 750,000 750,000 750,000 750,000 750,000 750,000 750,000 750,000(per km of road) Escalation TYPE 4.1 150,159 150,345 146,759 148,726 147,580 148,625 151,280 147,878 147,442
Gravel Roads Current Unit
Cost 900,159 900,345 896,759 898,726 897,580 898,625 901,280 897,878 897,442Roads Unit Cost 900,000 900,000 900,000 900,000 900,000 900,000 900,000 900,000 900,000(per km of road) Escalation TYPE 4.4 229,419 229,586 226,359 228,129 227,097 228,038 230,428 227,366 226,973
Chip and Spray Current Unit
Cost
1,129,419
1,129,586
1,126,359
1,128,129
1,127,097
1,128,038
1,130,428
1,127,366
1,126,973
Roads Unit Cost
1,000,000
1,000,000
1,000,000
1,000,000
1,000,000
1,000,000
1,000,000
1,000,000
1,000,000(per km of road) Escalation TYPE 4.4 254,909 255,095 251,510 253,476 252,330 253,375 256,031 252,629 252,193
Paved/Sealed
Current Unit Cost
1,254,909
1,255,095
1,251,510
1,253,476
1,252,330
1,253,375
1,256,031
1,252,629
1,252,193

Page 142 of 228
PROJECT TYPES UNIT OF COSTING
ESC FACTOR / CONTRACT
TYPE EC FS GT KZN LM MP NC NW WC
STORMWATER Unit Cost
130,000
130,000 130,000 130,000 130,000 130,000 130,000 130,000
130,000(per km of road) Escalation TYPE 1 23,273 23,297 22,831 23,087 22,938 23,074 23,419 22,977 22,920
Earth V Current Unit Cost
153,273
153,297 152,831 153,087 152,938 153,074 153,419 152,977
152,920
STORMWATER Unit Cost
380,000
380,000 380,000 380,000 380,000 380,000 380,000 380,000
380,000(per km of road) Escalation TYPE 3 80,383 80,571 76,938 78,931 77,769 78,828 81,520 78,072 77,630
Concrete Current Unit Cost
460,383
460,571 456,938 458,931 457,769 458,828 461,520 458,072
457,630
STORMWATER Unit Cost
510,000
510,000 510,000 510,000 510,000 510,000 510,000 510,000
510,000
(per km of road) Escalation TYPE 2
118,336
118,462 116,024 117,361 116,582 117,293 119,099 116,785
116,489
Sub soil (pipes)
Current Unit Cost
628,336
628,462 626,024 627,361 626,582 627,293 629,099 626,785
626,489
SOLID WASTE REMOVAL Unit Cost 7 7 7 7 7 7 7 7 7(per household /m) Escalation TYPE 2 2 2 2 2 2 2 2 2 2
HH to Communal
Skips Current Unit Cost 9 9 9 9 9 9 9 9 9
SOLID WASTE REMOVAL Unit Cost 12 12 12 12 12 12 12 12 12(per household /m) Escalation TYPE 2 3 3 3 3 3 3 3 3 3
Organized Transfer to Communal Current
Unit Cost 15 15 15 15 15 15 15 15 15

Page 143 of 228
PROJECT TYPES UNIT OF COSTING
ESC FACTOR /
CONTRACT TYPE
EC FS GT KZN LM MP NC NW WC
SOLID WASTE REMOVAL Unit Cost 15 15 15 15 15 15 15 15 15(per household /m) Escalation TYPE 2 3 3 3 3 3 3 4 3 3
HH to Communal
Skips Current Unit Cost 18 18 18 18 18 18 19 18 18
COMMUNITY LIGHTING Unit Cost 650 650 650 650 650 650 650 650 650(per household) Escalation TYPE 2 151 151 148 150 149 149 152 149 148
Street Lights
Current Unit Cost 801 801 798 800 799 799 802 799 798
COMMUNITY LIGHTING Unit Cost
125,000 125,000 125,000 125,000 125,000 125,000 125,000 125,000 125,000
(Per Each) Escalation TYPE 2 29,004 29,035 28,437 28,765 28,574 28,748 29,191 28,624 28,551
High Mast Light (300 diameter) Current
Unit Cost
154,004 154,035 153,437 153,765 153,574 153,748 154,191 153,624 153,551
PUBLIC MUNICIPAL SERVICE INFRASTRUCTURE (P) PROJECT TYPES UNIT OF
COSTING ESC
FACTOR / CONTRACT
TYPE
EC FS GT KZN LM MP NC NW WC
BUS SHELTERS Unit Cost 175 175 175 175 175 175 175 175 175(per square meter) Escalation TYPE 2 41 41 40 40 40 40 41 40 40
bus shelters for bus rank Current
Unit Cost 216 216 215 215 215 215 216 215 215BUS SHELTERS Unit Cost 160 161 162 163 164 165 166 167 168
(per square meter)
bus shelters for streets
Escalation TYPE 2 37 37 37 38 37 38 39 38 38

Page 144 of 228
Current Unit Cost 197 198 199 201 201 203 205 205 206
BUS SHELTERS Unit Cost 225 226 227 228 229 230 231 232 233
(per square meter) Escalation TYPE 2 52 52 52 52 52 53 54 53 53
bus rank interlock paving Current
Unit Cost 277 278 279 280 281 283 285 285 286TAXI RANKS Unit Cost 225 226 227 228 229 230 231 232 233(per square meter) Escalation TYPE 2 52 52 52 52 52 53 54 53 53
Interlocking Block Paving Current
Unit Cost 277 278 279 280 281 283 285 285 286TAXI RANKS Unit Cost 160 161 162 163 164 165 166 167 168(per square meter) Escalation TYPE 2 37 37 37 38 37 38 39 38 38
Taxi Shelters Current
Unit Cost 197 198 199 201 201 203 205 205 206SIDEWALKS Unit Cost 40 40 40 40 40 40 40 40 40(per square meter) Escalation TYPE 2 9 9 9 9 9 9 9 9 9
Gravel Sidewalk Current
Unit Cost 49 49 49 49 49 49 49 49 49
PROJECT TYPES UNIT OF COSTING
ESC FACTOR /
CONTRACT TYPE
EC FS GT KZN LM MP NC NW WC
SIDEWALKS Unit Cost 105 105 105 105 105 105 105 105 105(per square meter) Escalation TYPE 2 24 24 24 24 24 24 25 24 24
Paved Sidewalk Current
Unit Cost 129 129 129 129 129 129 130 129 129PUBLIC / MUNICIPAL SERVICE Unit Cost
7,500,000
7,500,001
7,500,002
7,500,003
7,500,004
7,500,005
7,500,006
7,500,007 7,500,008
(per 750 - 1000 square meter)
Provincial DMC
Escalation TYPE 2
1,740,234
1,742,094
1,706,236
1,725,903
1,714,442
1,724,893
1,751,452
1,717,430 1,713,068

Page 145 of 228
Current Unit Cost
9,240,234
9,242,095
9,206,238
9,225,906
9,214,446
9,224,898
9,251,458
9,217,437 9,213,076
PUBLIC / MUNICIPAL SERVICE Unit Cost
6,000,000
6,000,001
6,000,002
6,000,003
6,000,004
6,000,005
6,000,006
6,000,007 6,000,008
(per 350 - 700 square meter) Escalation TYPE 2
1,392,187
1,393,675
1,364,989
1,380,723
1,371,554
1,379,914
1,401,162
1,373,944 1,370,455
Metropolitan DMC
Current Unit Cost
7,392,187
7,393,676
7,364,991
7,380,726
7,371,558
7,379,919
7,401,168
7,373,951 7,370,463
PUBLIC / MUNICIPAL SERVICE Unit Cost
2,500,000
2,500,001
2,500,002
2,500,003
2,500,004
2,500,005
2,500,006
2,500,007 2,500,008
(per 350 -700 square meter) Escalation TYPE 2 580,078 580,698 568,746 575,302 571,481 574,965 583,818 572,478 571,024
Large District
Current Unit Cost
3,080,078
3,080,699
3,068,748
3,075,305
3,071,485
3,074,970
3,083,824
3,072,485 3,071,032
PROJECT TYPES UNIT OF
COSTING ESC
FACTOR / CONTRACT
TYPE
EC FS GT KZN LM MP NC NW WC
PUBLIC / MUNICIPAL SERVICE Unit Cost 1,500,000
1,500,001
1,500,002
1,500,003 1,500,004
1,500,005
1,500,006
1,500,007 1,500,008
(per 250 - 350 square meter) Escalation TYPE 1 268,537 268,816 263,438 266,388
264,669 266,237 270,221 265,117 264,463
Municipality / Small
District / Sat.DMC
Current Unit Cost 1,768,537
1,768,817
1,763,440
1,766,391 1,764,673
1,766,242
1,770,227
1,765,124 1,764,471
COMMUNITY SERVICES Unit Cost 2,500 2,500 2,500 2,500 2,500 2,500 2,500 2,500 2,500(per square meter) Escalation TYPE 1 448 448 439 444 441 444 450 442 441
Mortuary Current Unit Cost 2,948 2,948 2,939 2,944 2,941 2,944 2,950 2,942 2,941
COMMUNITY SERVICES Unit Cost 65,000 65,000 65,000 65,000 65,000 65,000 65,000 65,000 65,000(per square meter)
Mortuary (3 body
freezers) Escalation TYPE 1 11,637 11,649 11,416 11,543 11,469 11,537 11,710 11,488 11,460

Page 146 of 228
Current Unit Cost 76,637 76,649 76,416 76,543 76,469 76,537 76,710 76,488 76,460
COMMUNITY SERVICES Unit Cost 2,500 2,500 2,500 2,500 2,500 2,500 2,500 2,500 2,500(per square meter) Escalation TYPE 1 448 448 439 444 441 444 450 442 441
MPC/SRSA Outdoor
Current Unit Cost 2,948 2,948 2,939 2,944 2,941 2,944 2,950 2,942 2,941
COMMUNITY SERVICES Unit Cost 4,000 4,000 4,000 4,000 4,000 4,000 4,000 4,000 4,000(per square meter) Escalation TYPE 1 716 717 702 710 706 710 721 707 705
MPC/SRSA Hall
Current Unit Cost 4,716 4,717 4,702 4,710 4,706 4,710 4,721 4,707 4,705
PROJECT TYPES UNIT OF COSTING
ESC FACTOR /
CONTRACT TYPE
EC FS GT KZN LM MP NC NW WC
COMMUNITY SERVICES Unit Cost 6,000 6,000 6,000 6,000 6,000 6,000 6,000 6,000 6,000(per square meter) Escalation TYPE 1 1,074 1,075 1,054 1,066 1,059 1,065 1,081 1,060 1,058
MPC/SRSA Sport &
Recreational Hall Current
Unit Cost 7,074 7,075 7,054 7,066 7,059 7,065 7,081 7,060 7,058COMMUNITY SERVICES Unit Cost 3,800 3,800 3,800 3,800 3,800 3,800 3,800 3,800 3,800(per square meter) Escalation TYPE 1 680 681 667 675 670 674 685 672 670
MPCC (not Less
than 600sq.m) Current
Unit Cost 4,480 4,481 4,467 4,475 4,470 4,474 4,485 4,472 4,470COMMUNITY SERVICES Unit Cost 150 150 150 150 150 150 150 150 150(per meter) Escalation TYPE 1 27 27 26 27 26 27 27 27 26
Cemetery Stock Fence
1.2m Current Unit Cost 177 177 176 177 176 177 177 177 176
COMMUNITY SERVICES Unit Cost 750 750 750 750 750 750 750 750 750(per meter) Escalation TYPE 1 134 134 132 133 132 133 135 133 132
Cemetery Palisade
Fence 2.4m Current Unit Cost 884 884 882 883 882 883 885 883 882

Page 147 of 228
COMMUNITY SERVICES Unit Cost 3,000 3,000 3,000 3,000 3,000 3,000 3,000 3,000 3,000(per square meter) Escalation TYPE 1 537 538 527 533 529 532 540 530 529
Crematorium Current Unit Cost 3,537 3,538 3,527 3,533 3,529 3,532 3,540 3,530 3,529

Page 148 of 228
PROJECT TYPES UNIT OF
COSTING ESC
FACTOR / CONTRACT
TYPE
EC FS GT KZN LM MP NC NW WC
FENCING Unit Cost 80 80 80 80 80 80 80 80 80(Wire Fence/m) Escalation TYPE 1 14 14 14 14 14 14 14 14 14
2.7m Diamond
Mesh Security Fence
Current Unit Cost 94 94 94 94 94 94 94 94 94
FENCING Unit Cost 50 50 50 50 50 50 50 50 50(Wire Fence/m) Escalation TYPE 1 9 9 9 9 9 9 9 9 9
Public Prot. 1.9m
Diamond Mesh
Current Unit Cost 59 59 59 59 59 59 59 59 59
FENCING Unit Cost 20 20 20 20 20 20 20 20 20(Wire Fence/m) Escalation TYPE 1 4 4 4 4 4 4 4 4 4
Stock Fence 1.2m barbed
wire Current Unit Cost 24 24 24 24 24 24 24 24 24
FENCING Unit Cost 261 261 261 261 261 261 261 261 261(Concrete Fence/m) Escalation TYPE 1 47 47 46 46 46 46 47 46 46
1.2m Single Brick Wall
Current Unit Cost 308 308 307 307 307 307 308 307 307
FENCING Unit Cost 711 711 711 711 711 711 711 711 711(Concrete Fence/m) Escalation TYPE 1 127 127 125 126 125 126 128 126 125
1.9m Double Brick Wall
Current Unit Cost 838 838 836 837 836 837 839 837 836
FENCING Unit Cost 750 750 750 750 750 750 750 750 750(Concrete Fence/m) Escalation TYPE 1 134 134 132 133 132 133 135 133 132
1.9m Concrete Palisade
Fence Current Unit Cost 884 884 882 883 882 883 885 883 882

Page 149 of 228
PROJECT TYPES UNIT OF COSTING
ESC FACTOR /
CONTRACT TYPE
EC FS GT KZN LM MP NC NW WC
LIBRARY Unit Cost 2,500 2,500 2,500 2,500 2,500 2,500 2,500 2,500 2,500(per square meter) Escalation TYPE 1 448 448 439 444 441 444 450 442 441
Building and Ablution Current
Unit Cost 2,948 2,948 2,939 2,944 2,941 2,944 2,950 2,942 2,941SOLID WASTE DISPOSAL Unit Cost 825 826 827 828 829 830 831 832 833(per household) Escalation TYPE 1 148 148 145 147 146 147 150 147 147
Landfill Site Current Unit Cost 973 974 972 975 975 977 981 979 980
FACILITIES FOR ANIMALS Unit Cost 2,500 2,500 2,500 2,500 2,500 2,500 2,500 2,500 2,500(per square meter) Escalation TYPE 1 448 448 439 444 441 444 450 442 441
Building and Ablution
Current Unit Cost 2,948 2,948 2,939 2,944 2,941 2,944 2,950 2,942 2,941
BASIC RESIDENTIAL INFRASTRUCTURE 2005 MIG
LOS Guidelines
TEM
D
ISC
RIP
TIO
N
UN
IT R
ATE
(2
005
rate
) PAGE NO. N
at A
ve U
nit
Rat
e
EAST
ERN
CA
PE
- Por
t Eliz
abet
h
FREE
STA
TE -
Blo
emfo
ntei
n
GA
UTE
NG
- W
itwat
ersr
and
KW
AZU
LU-
NA
TAL
- Dur
ban
LIM
POPO
- Po
lokw
ane
MPU
MA
LAN
GA
- N
elsp
ruit
NO
RTH
ERN
C
APE
- K
imbe
rley
NO
RTH
WES
T
WES
TER
N
CA
PE -
Cap
e Pe
nins
ula
1.1 Water supply 8 to 12
Water Supply & connector Bulk (R/hh)
R 6 000.00 /household 11 R 7,381 R 7,392 R 7,394 R 7,365 R 7,381 R 7,372 R 7,380 R 7,401 R 7,374 R 7,370
Meter ordinary R 350.00 12 R 431 R 431 R 431 R 430 R 431 R 430 R 430 R 432 R 430 R 430

Page 150 of 228
(R/m) /meter
Pre-paid meter (R/m)
R 1 300.00 /meter 12 R 1,599 R 1,602 R 1,602 R 1,596 R 1,599 R 1,597 R 1,599 R 1,604 R 1,598 R 1,597
1.2 Sanitation 12 to 20
Sanitation Facility (R/hh)
R 3 000.00 /household incl. 14 R 3,690 R 3,696 R 3,697 R 3,682 R 3,690 R 3,686 R 3,690 R 3,701 R 3,687 R 3,685
Waterborne R 9 000.00 14 R 11,071 R 11,088 R 11,091 R 11,047 R 11,071 R 11,057 R 11,070 R 11,102 R 11,061 R 11,056
Buckets eradication (range in Rand)
R 4 000.00 to R 9 000.00 14 R 4,921 R 4,928 R 4,929 R 4,910 R 4,920 R 4,914 R 4,920 R 4,934 R 4,916 R 4,914
Onsite Sanitation (all inclusive cost)
R 3 650.00 incl. 20 R 4,490 R 4,497 R 4,498 R 4,480 R 4,490 R 4,484 R 4,489 R 4,502 R 4,486 R 4,484
2005 MIG LOS
Guidelines
ITEM
D
ISC
RIP
TIO
N
UN
IT R
ATE
(2
005
rate
) PAGE NO. N
at A
ve U
nit
Rat
e
EAST
ERN
C
APE
- Po
rt
Eliz
abet
h
FREE
STA
TE
- Blo
emfo
ntei
n
GA
UTE
NG
- W
itwat
ersr
and K
WA
ZULU
-N
ATA
L -
Dur
ban
LIM
POPO
- Po
lokw
ane
MPU
MA
LAN
GA
- N
elsp
ruit
NO
RTH
ERN
C
APE
- K
imbe
rley
NO
RTH
W
EST
WES
TER
N
CA
PE -
Cap
e Pe
nins
ula
1.3 Roads with open channel 21 to 23
gravel (width 4.5-6m)
R 750 000.00 /Km max. 23 R 898,755 R 900,159R 900,345 R 896,759 R 898,726 R 897,580 R 898,625 R 901,280 R 897,878 R 897,442
chip & spray(width 4.5-6m)
R 900 000.00 /Km 23 R 1,128,155 1,129,419 1,129,586 R 1,126,359 R 1,128,129 R 1,127,097 R 1,128,038 R 1,130,428 R 1,127,366 R 1,126,973
Paved/sealed/paving Blks 6m
R1 000 000.00 /Km 23 R 1,253,505 1,254,909 1,255,095 R 1,251,510 R 1,253,476 R 1,252,330 R 1,253,375 R 1,256,031 R 1,252,629 R 1,252,193
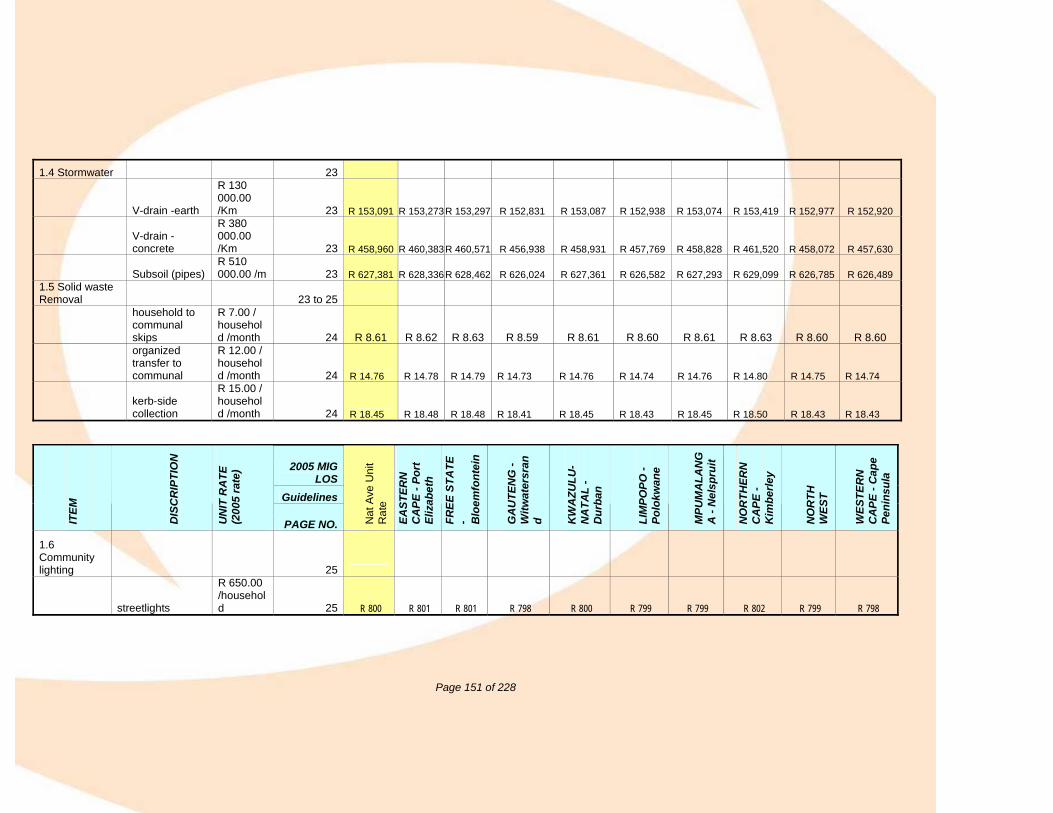
Page 151 of 228
1.4 Stormwater 23
V-drain -earth
R 130 000.00 /Km 23 R 153,091 R 153,273R 153,297 R 152,831 R 153,087 R 152,938 R 153,074 R 153,419 R 152,977 R 152,920
V-drain -concrete
R 380 000.00 /Km 23 R 458,960 R 460,383R 460,571 R 456,938 R 458,931 R 457,769 R 458,828 R 461,520 R 458,072 R 457,630
Subsoil (pipes) R 510 000.00 /m 23 R 627,381 R 628,336R 628,462 R 626,024 R 627,361 R 626,582 R 627,293 R 629,099 R 626,785 R 626,489
1.5 Solid waste Removal 23 to 25
household to communal skips
R 7.00 / household /month 24 R 8.61 R 8.62 R 8.63 R 8.59 R 8.61 R 8.60 R 8.61 R 8.63 R 8.60 R 8.60
organized transfer to communal
R 12.00 / household /month 24 R 14.76 R 14.78 R 14.79 R 14.73 R 14.76 R 14.74 R 14.76 R 14.80 R 14.75 R 14.74
kerb-side collection
R 15.00 / household /month 24 R 18.45 R 18.48 R 18.48 R 18.41 R 18.45 R 18.43 R 18.45 R 18.50 R 18.43 R 18.43
2005 MIG LOS
Guidelines
ITEM
D
ISC
RIP
TIO
N
UN
IT R
ATE
(2
005
rate
) PAGE NO. N
at A
ve U
nit
Rat
e
EAST
ERN
C
APE
- Po
rt
Eliz
abet
h
FREE
STA
TE
- Blo
emfo
ntei
n
GA
UTE
NG
- W
itwat
ersr
and K
WA
ZULU
-N
ATA
L -
Dur
ban
LIM
POPO
- Po
lokw
ane
MPU
MA
LAN
GA
- N
elsp
ruit
NO
RTH
ERN
C
APE
- K
imbe
rley
NO
RTH
W
EST
WES
TER
N
CA
PE -
Cap
e Pe
nins
ula
1.6 Community lighting 25
streetlights
R 650.00 /household 25 R 800 R 801 R 801 R 798 R 800 R 799 R 799 R 802 R 799 R 798
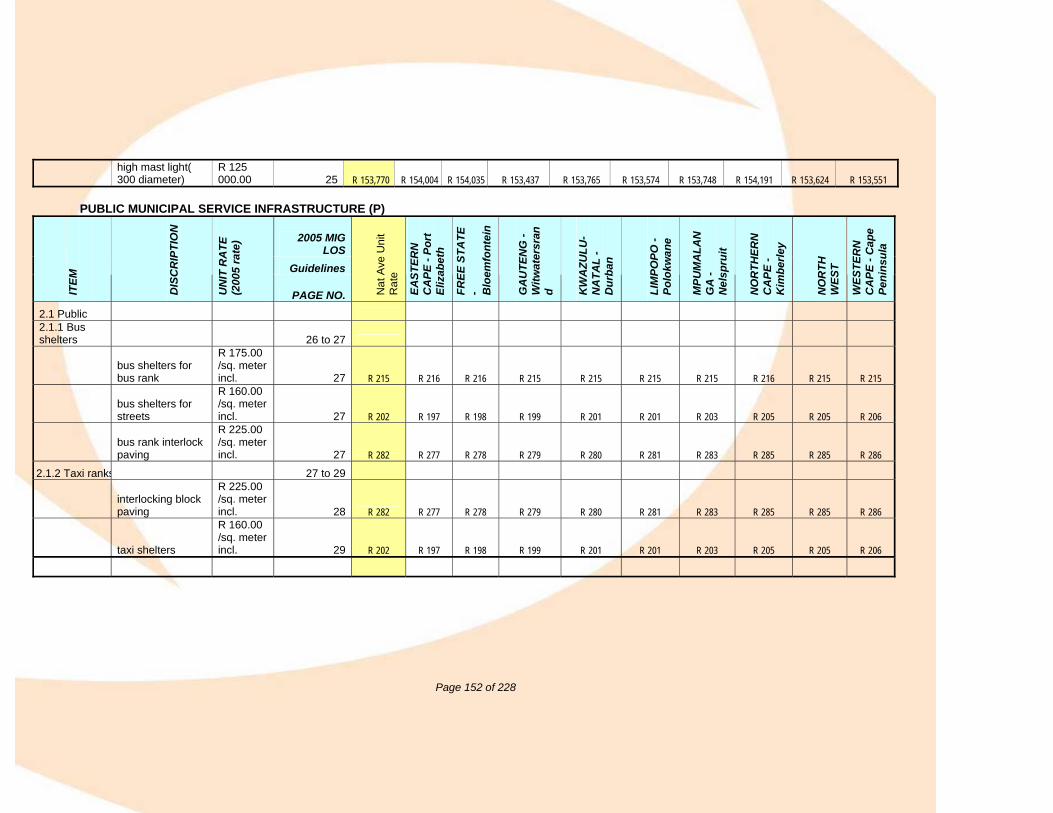
Page 152 of 228
high mast light( 300 diameter)
R 125 000.00 25 R 153,770 R 154,004 R 154,035 R 153,437 R 153,765 R 153,574 R 153,748 R 154,191 R 153,624 R 153,551
PUBLIC MUNICIPAL SERVICE INFRASTRUCTURE (P)
2005 MIG LOS
Guidelines
ITEM
D
ISC
RIP
TIO
N
UN
IT R
ATE
(2
005
rate
) PAGE NO. N
at A
ve U
nit
Rat
e
EAST
ERN
C
APE
- Po
rt
Eliz
abet
h
FREE
STA
TE
- Blo
emfo
ntei
n
GA
UTE
NG
- W
itwat
ersr
and K
WA
ZULU
-N
ATA
L -
Dur
ban
LIM
POPO
- Po
lokw
ane
MPU
MA
LAN
GA
- N
elsp
ruit
NO
RTH
ERN
C
APE
- K
imbe
rley
NO
RTH
W
EST
WES
TER
N
CA
PE -
Cap
e Pe
nins
ula
2.1 Public 2.1.1 Bus shelters 26 to 27
bus shelters for bus rank
R 175.00 /sq. meter incl. 27 R 215 R 216 R 216 R 215 R 215 R 215 R 215 R 216 R 215 R 215
bus shelters for streets
R 160.00 /sq. meter incl. 27 R 202 R 197 R 198 R 199 R 201 R 201 R 203 R 205 R 205 R 206
bus rank interlock paving
R 225.00 /sq. meter incl. 27 R 282 R 277 R 278 R 279 R 280 R 281 R 283 R 285 R 285 R 286
2.1.2 Taxi ranks 27 to 29
interlocking block paving
R 225.00 /sq. meter incl. 28 R 282 R 277 R 278 R 279 R 280 R 281 R 283 R 285 R 285 R 286
taxi shelters
R 160.00 /sq. meter incl. 29 R 202 R 197 R 198 R 199 R 201 R 201 R 203 R 205 R 205 R 206

Page 153 of 228
ITEM
DIS
CR
IPTI
ON
UN
IT R
ATE
(2
005
rate
)
2005 MIG LOS N
at A
ve U
nit
Rat
e
EAST
ERN
C
APE
- Po
rt
Eliz
abet
h
FREE
STA
TE -
Blo
emfo
ntei
n
GA
UTE
NG
- W
itwat
ersr
and
KW
AZU
LU-
NA
TAL
- D
urba
n
LIM
POPO
- Po
lokw
ane
MPU
MA
LAN
GA
- N
elsp
ruit
NO
RTH
ERN
C
APE
- K
imbe
rley
NO
RTH
WES
T
WES
TER
N
CA
PE -
Cap
e Pe
nins
ula
2.1.3 Sidewalks 29
gravel sidewalk
R 40.00 /sq. meter incl. 29 R 49 R 49 R 49 R 49 R 49 R 49 R 49 R 49 R 49 R 49
paved sidewalk
R 105.00 /sq. meter incl. 29 R 129 R 129 R 129 R 129 R 129 R 129 R 129 R 130 R 129 R 129
2.2 Emergency services 29 to 33
2.2.1Provincial DMC
750-1000 sq. meters
R 7.5mil - R 8.5mil incl. 32 R 9,226,199 R 9,240,234 R 9,242,095 R 9,206,238 R 9,225,906 R 9,214,446 R 9,224,898 R 9,251,458 R 9,217,437 R 9,213,076
2.2.2 Metropolitan DMC
350 - 700 sq. meters
R 6.0mil - R 6.5mil incl. 32 R 7,380,960 R 7,392,187 R 7,393,676 R 7,364,991 R 7,380,726 R 7,371,558 R 7,379,919 R 7,401,168 R 7,373,951 R 7,370,463
2.2.3 Large District
350 - 700 sq. meters
R 2.5mil - R 3.65mil incl. 32 R 3,075,403 R 3,080,078 R 3,080,699 R 3,068,748 R 3,075,305 R 3,071,485 R 3,074,970 R 3,083,824 R 3,072,485 R 3,071,032
2.2.4 Mun/small distr/sat.dmc
250 - 350 sq. meters
R 1.5mil - R 1.75mil incl. 32 R 1,766,436 R 1,768,537 R 1,768,817 R 1,763,440 R 1,766,391 R 1,764,673 R 1,766,242 R 1,770,227 R 1,765,124 R 1,764,471

Page 154 of 228
ITEM
DIS
CR
IPTI
ON
UN
IT R
ATE
(2
005
rate
)
2005
MIG
LO
S
Nat
Ave
Uni
t Rat
e
EAST
ERN
CA
PE
- Por
t Eliz
abet
h
FREE
STA
TE -
Blo
emfo
ntei
n
GA
UTE
NG
- W
itwat
ersr
and
KW
AZU
LU-
NA
TAL
- Dur
ban
LIM
POPO
- Po
lokw
ane
MPU
MA
LAN
GA
- N
elsp
ruit
NO
RTH
ERN
C
APE
- K
imbe
rley
NO
RTH
WES
T
WES
TER
N
CA
PE -
Cap
e Pe
nins
ula
2.3 Community services
mortuary mortuary R 2 500.00 /sq. meters 35 R 2,944 R 2,948 R 2,948 R 2,939 R 2,944 R 2,941 R 2,944 R 2,950 R 2,942 R 2,941
mortuary 3 body freezers
R 65 000.00 /3body freezer 35 R 76,545 R 76,637 R 76,649 R 76,416 R 76,543 R 76,469 R 76,537 R 76,710 R 76,488 R 76,460
Multi-Purpose Center / Facility
MPC/SRSA outdoor
R 2 500.00 /sq. meters Ltd 37 R 2,944 R 2,948 R 2,948 R 2,939 R 2,944 R 2,941 R 2,944 R 2,950 R 2,942 R 2,941
MPC/SRSA hall
R 4 000.00 /sq. meter Ltd 37 R 4,710 R 4,716 R 4,717 R 4,702 R 4,710 R 4,706 R 4,710 R 4,721 R 4,707 R 4,705
MPC/SRSA sport & recr. hall
R 6 000.00 /sq. meters Ltd 37 R 7,066 R 7,074 R 7,075 R 7,054 R 7,066 R 7,059 R 7,065 R 7,081 R 7,060 R 7,058
Multi-Purpose
Community Center
MPCC not less than 600 sq. m
R 3 800.00 /sq. meters 38 R 4,475 R 4,480 R 4,481 R 4,467 R 4,475 R 4,470 R 4,474 R 4,485 R 4,472 R 4,470
Cemetery cemetery stock fence 1.2m
R 150.00 /meter 41 R 177 R 177 R 177 R 176 R 177 R 176 R 177 R 177 R 177 R 176
cemetery palisade fence 2.4m
R 750.00 /meter 41 R 883 R 884 R 884 R 882 R 883 R 882 R 883 R 885 R 883 R 882
crematorium crematorium R 3 000.00 /sq. meter 43 R 3,533 R 3,537 R 3,538 R 3,527 R 3,533 R 3,529 R 3,532 R 3,540 R 3,530 R 3,529

Page 155 of 228
ITEM
DIS
CR
IPTI
ON
UN
IT R
ATE
(2
005
rate
)
2005
MIG
LO
S
Nat
Ave
Uni
t Rat
e
EAST
ERN
CA
PE
- Por
t Eliz
abet
h
FREE
STA
TE -
Blo
emfo
ntei
n
GA
UTE
NG
- W
itwat
ersr
and
KW
AZU
LU-
NA
TAL
- Dur
ban
LIM
POPO
- Po
lokw
ane
MPU
MA
LAN
GA
- N
elsp
ruit
NO
RTH
ERN
C
APE
- K
imbe
rley
NO
RTH
WES
T
WES
TER
N C
APE
- C
ape
Peni
nsul
a
Wire fence
2.7m diamond mesh security fence
R 80.00 / meter 43 R 94 R 94 R 94 R 94 R 94 R 94 R 94 R 94 R 94 R 94
Public Prot. 1.9m diamond mesh
R 50.00 / meter 43 R 59 R 59 R 59 R 59 R 59 R 59 R 59 R 59 R 59 R 59
Stock fence 1.2m barbed wire
R 20.00 / meter 43 R 24 R 24 R 24 R 24 R 24 R 24 R 24 R 24 R 24 R 24
concrete fence
1.2m single brick wall
R 261.00 / meter 45 R 307 R 308 R 308 R 307 R 307 R 307 R 307 R 308 R 307 R 307
1.9m double brick wall
R 711.00 / meter 45 R 837 R 838 R 838 R 836 R 837 R 836 R 837 R 839 R 837 R 836
1.9m concrete Palisade fence
R 750.00 / meter 45 R 883 R 884 R 884 R 882 R 883 R 882 R 883 R 885 R 883 R 882
Library library (building & ablution)
R 2 500.00 / sq. meter 45 R 2,944 R 2,948 R 2,948 R 2,939 R 2,944 R 2,941 R 2,944 R 2,950 R 2,942 R 2,941
Solid Waste Disposal Site
solid waste disposal
R 825.00 / household 46
Facilities for Animals
Facilities for animals
R 2 500.00 / sq. meter 47 R 2,944 R 2,948 R 2,948 R 2,939 R 2,944 R 2,941 R 2,944 R 2,950 R 2,942 R 2,941

Appendix 3: Public Municipal Service Infrastructure: Emergency Services

Provincial disaster management centers The MEC of each province who is responsible for disaster risk management must establish institutional capacity for disaster risk management in the province. Such arrangements must be consistent with national arrangements and must provide the appropriate mechanisms to allow for the application of co-operative governance to facilitate both intergovernmental and provincial interdepartmental relations for the purpose of disaster risk management. The PDMC is the primary functional unit for disaster risk management in each province. A key responsibility of the PDMC is to provide support to the NDMC and the metropolitan and district disaster management centers in the province. It must provide the link between national objectives and provincial and municipal disaster risk management activities and priorities. In the event of a significant event or disaster occurring or threatening to occur, the PDMC must provide support and guidance to the relevant MDMC's. In addition, it must mobilize provincial infrastructure and resources to support municipal disaster risk management resources. Key responsibilities of the PDMC The PDMC must maintain a strategic overview of disaster risk management projects and programmes in the province. Key responsibilities in this regard are described below.
Disaster risk reduction The PDMC must:
o submit a disaster risk assessment for the province and disaster plans to the NDMC o identify provincial priorities for disaster risk reduction o facilitate the development and preparation of provincial plans for disaster risk reduction and response and
recovery o monitor progress with the preparation and regular updating of disaster risk reduction plans and strategies
by provincial and municipal organs of state involved in disaster risk management in the province o institute joint standards of practice for disaster risk management in the province that are consistent with
national standards o establish mechanisms to monitor and manage cross-boundary disaster risks within a province (between
districts and between districts and metropolitan areas), as well as between a province and neighbouring provinces and countries, and enter into mutual assistance agreements for the purpose of disaster risk management
o submit copies of its disaster risk management plans to the NDMC, neighbouring PDMC's and, where applicable, disaster risk management entities in neighbouring countries.
Integrated development planning
The PDMC is responsible for:
o monitoring the inclusion of disaster risk management plans in IDP processes o ensuring that IDP budgets make provision for disaster risk management.
Given these functions, it is imperative that the Head of the PDMC serves on the relevant provincial development planning structures and makes inputs into all development projects undertaken by the province.
Capacity building, education, training and research
The PDMC must initiate and co-ordinate disaster risk management capacity building, education, training and research in the province, placing particular emphasis on the development of community awareness programmes and promoting the incorporation of such programmes into school curricula.
Information management and communication
The PDMC must:
o establish an integrated information management and communication system that is consistent with arrangements established by the NDMC
o ensure the establishment of a strategic provincial emergency communication system that is compatible with emergency communication systems used nationally, to enable communication between essential and emergency services for the purposes of incident command and the management of joint operations
o establish a system (including emergency communication mechanisms) for reporting, evaluating and disseminating early warnings on a 24-hour basis to ensure that threatened communities are able to respond appropriately and take risk-avoidance measures when a disaster occurs or is threatening to occur in their areas
o act as a provincial reporting center.

Infrastructural requirements: The basic level of service for a district DMC is discussed in the following paragraphs. The layout of the DMC should accommodate the following activities to be performed by the staff:
• Risk reduction activities: For the day-to-day activities undertaken by the disaster management staff, the following office accommodation is required: -
• Offices for staff. • Small conference room(s). • Ablution facilities, as per the Building Regulations. • Small kitchen. • Relaxation/lounge area. • Dining area (optional). • Sleeping quarters (optional).
• Incident, event and disaster response activities: For incident, event and disaster response management, a
joint operational center is required.
• Operational incident management area: A variety of line functionaries should be accommodated in the Operational Incident Management Area of the DMC, such as, fire services, ambulance services, engineering services, etc. In this area the line functionaries will conduct their day-to-day operational and incident management activities, typically on a uni-disciplinary basis. An Incident Management System, capable of linking with / utilizing the National DMC’s web-based incident reporting facility should also be put in place.
• Tactical disaster management area: The line functionaries that are involved in responding to a major
incident will occupy the Tactical Disaster Management Area, should a major incident occur. A multi-disciplinary response to the major incident can be coordinated in the Tactical Disaster Management Area, as the area will be equipped for that specific purpose. The use of an Incident Management System is also applicable in this environment.
• Organizational disaster management area: The line functionary managers that are involved in the
response to a disaster will occupy the Organizational Disaster Management Area, in the event of a disaster. A multi-disciplinary response to the disaster can be coordinated in the Organizational Disaster Management Area, as the area will be equipped for that specific purpose. This environment is often termed the “war-room”. Inside the “war room”, multi-media facilities should be supplied to present information from a range of information sources for the use of the decision makers present in the “war room”.
A Disaster Management Information System (DMIS) should be put in place to facilitate these activities and to assist with disaster management reporting. These systems should be compatible with each other in the district and province, with the NDMC’s DMIS and with other emergency management systems.
• Media room: An area where officials can communicate with the media and press is required. This area should be out of the way of the other activities.
• Disaster relief activities: In some instances, storage space for disaster relief equipment and materials
should be catered for. • Electronic equipment room: Provision must be made for IT and communications equipment in a secure
room, equipped with the following:
• Fire-retardant, anti-static floor covering. • Fire-retardant wall covering. • Fire-retardant door. • Fire-retardant ceiling. • Smoke detector with alarm system, connected to: • Gas (CO2, or similar) fire extinguisher, to be automatically activated by the fire alarm. • Wall mounted air conditioner with auto-shut down and vent closure ~ air conditioner to be automatically
shut down and the vent to the outside closed by the fire alarm. • Fire proof safe for storage of on-site back-ups. • Cabinets for rack mounted severs, NTU’s, switches, etc. • Filtered power supply i.e. UPS with upstream backup power supply
The facility as a whole should be equipped with the following: • Physical security: -

General access control to the site.
- Security fencing along the perimeter of the site. - Fire proof safe for document storage. - Smoke detectors, with alarm. - Fire hydrants and fire extinguishers.
• Business continuity measures: The following business continuity measures are required:
- UPS to accommodate all the computers on the site for 1/2 hour - Back-up generator, with auto-start feature, as well as sufficient diesel. - Central air conditioning plant to maintain a comfortable environment in the center ~ Server Room to be
excluded from central air conditioning plant. - Potable water storage tank. - Sewerage storage tank. - Waste storage facility. - Food storage facility.
48

Appendix 4a: Public Municipal Service Infrastructure: Community Services

HEALTH SERVICES Suggested layout of community health center’s Description of spaces a) Car parking On-site car parking (25m2 per car) should be allowed for staff in the amount of 1.5 spaces per consulting room, and for patient’s 2.5 spaces per consulting room. Space for maneuvering ambulances should be allowed.
Suggested layout of community health centers.
b) Main entrance
A main entrance should be clearly visible, identifiable and easily accessible to all patients and staff.
c) Reception
The reception staff has to cope with the direction of patients to waiting areas, the making of appointments etc. allow 5.5m2 per receptionist on duty at peak hours.
d) Record storage
Usually associated with reception, but ideally not part of it, is record storage. Assuming that all records (of A4 size) are centralized, allow 1.4m2 per 1000 patients. It is important that the area is out of sight of waiting patients and that it can be extended.
e) Administration
Associated with the record storage are the clerical/administrative area, and the telephone switchboard. In total, 5.5m2 should be allowed for each typist/secretary. In small center’s, the switchboard may be manned by the receptionist, but if separate, allow 7.5m2 per telephonist.
Rooms not visited by the public (E.g. common rooms)
Social worker
Interview treatment
Consulting Chiropody Health Education
PhysiotherapyRadiography
Dental
Waiting Areas
Car Parking Pram
Shelter
Medical Reception & Records
DentalReception & Records
Comment [G1]: If to stay suggest we change to… Example of typical layout of CHC Marlene: tempted to let this go, BUT keep until next draft as per your suggestion EXAMPLE of …

f) Waiting areas
Waiting areas are usually located with the reception desk. In larger center’s, waiting areas can be decentralized, but only when the policy for reception and control of patients is closely identified. It is vital that waiting areas are not part of the circulation pattern. In total 6 seats should be allowed for each consulting room and treatment room which should be 1,4m2 each. Location of ablution facilities and pram parks should be carefully considered in relation to waiting and reception rooms.
g) Consulting rooms Consulting rooms are usually provided for each doctor on a personal basis. Where this results in under-use, there might be advantages in scheduling the use of rooms for other purposes, e.g. hospital consultants, social workers etc. As a general rule allow 17m2 per combined consulting/examination rooms. h) Treatment rooms The treatment rooms are used primarily by nurses performing simple therapeutic techniques. For a room where one nurse treats patients, 17m2 should be allowed. If more than one nurse is to be employed at the same time, treatments may be performed on two patients in one room of 25m2.

Appendix 4b: Public Municipal Service Infrastructure: Community Services

MULTI-PURPOSE COMMUNITY CENTER (MPCC) (GCIS VERSION)
It is a requirement that each MPCC should have a General Service Counter (GSC) at the reception area. The General Service Counter notion creates a one stop counter for citizens to access government and stakeholder’s information and services rendering service in MPCC through a Gateway portal. The use of GSC will assist to enhance the general functioning of MPCC and further
provide citizens with access to government service including self-service facilities though e-government portal and delivering services in an integrated manner. The implementation of GSC will require infrastructure modification when constructing MPCC or rehabilitating an existing structure. The following physical layout is proposed: It is important to note that there is a need to have sufficient space between the counter and entrance door to allow for a waiting area for users to be served by the counter-GSC

Appendix 5: MIG Guidelines Unit Costing - Escalation For Project Types

LABOUR RATES INDICES PER PROVINCE
PROJECT TYPES UNIT OF COSTING ESC FACTOR for CONTRACT
TYPE
EASTERN CAPE –
PE
FREE STATE -
BFN
GAUTENG - WWR
KWAZULU-NATAL - DRN
LIMPOPO -Polokwane
MPUMALANGA - Nelspruit
NORTHERN CAPE -
Kimberley
NORTH WEST
WESTERN CAPE - Cape
Peninsula
Earthworks TYPE 1 0.1790 0.1792 0.1756 0.1776 0.1764 0.1775 0.1801 0.1767 0.1763 General Civil Work TYPE 2 0.2320 0.2323 0.2275 0.2301 0.2286 0.2300 0.2335 0.2290 0.2284 Concrete Work TYPE 3 0.2115 0.2120 0.2025 0.2077 0.2047 0.2074 0.2145 0.2055 0.2043 Roads - Roadwork TYPE 4.1 0.2002 0.2005 0.1957 0.1983 0.1968 0.1982 0.2017 0.1972 0.1966 Roads - Concrete Str TYPE 4.2 0.2115 0.2120 0.2025 0.2077 0.2047 0.2074 0.2145 0.2055 0.2043 Roads - Townships TYPE 4.3 0.2222 0.2225 0.2177 0.2203 0.2188 0.2202 0.2237 0.2192 0.2186 Roads - Surfacing TYPE 4.4 0.2549 0.2551 0.2515 0.2535 0.2523 0.2534 0.2560 0.2526 0.2522 Water and Sewerage TYPE 5 0.2320 0.2323 0.2275 0.2301 0.2286 0.2300 0.2335 0.2290 0.2284 WATER SUPPLY Unit Cost 6,000 6,000 6,000 6,000 6,000 6,000 6,000 6,000 6,000 (per household) Escalation TYPE 5 1,392 1,394 1,365 1,381 1,372 1,380 1,401 1,374 1,370 Current Unit Cost 7,392 7,394 7,365 7,381 7,372 7,380 7,401 7,374 7,370 SANITATION Unit Cost 3,000 3,000 3,000 3,000 3,000 3,000 3,000 3,000 3,000 (per household) Escalation TYPE 5 696 697 682 690 686 690 701 687 685 Current Unit Cost 3,696 3,697 3,682 3,690 3,686 3,690 3,701 3,687 3,685 ROADS Gravel Roads Unit Cost 750,000 750,000 750,000 750,000 750,000 750,000 750,000 750,000 750,000 (per km of road) Escalation TYPE 4.1 150,159 150,345 146,759 148,726 147,580 148,625 151,280 147,878 147,442 Current Unit Cost 900,159 900,345 896,759 898,726 897,580 898,625 901,280 897,878 897,442 Chip and Spray Unit Cost 900,000 900,000 900,000 900,000 900,000 900,000 900,000 900,000 900,000 (per km of road) Escalation TYPE 4.4 229,419 229,586 226,359 228,129 227,097 228,038 230,428 227,366 226,973 Current Unit Cost 1,129,419 1,129,586 1,126,359 1,128,129 1,127,097 1,128,038 1,130,428 1,127,366 1,126,973 Paved/Sealed Unit Cost 1,000,000 1,000,000 1,000,000 1,000,000 1,000,000 1,000,000 1,000,000 1,000,000 1,000,000 (per km of road) Escalation TYPE 4.4 254,909 255,095 251,510 253,476 252,330 253,375 256,031 252,629 252,193 Current Unit Cost 1,254,909 1,255,095 1,251,510 1,253,476 1,252,330 1,253,375 1,256,031 1,252,629 1,252,193

STORMWATER Earth V Unit Cost 130,000 130,000 130,000 130,000 130,000 130,000 130,000 130,000 130,000 (per km of road) Escalation TYPE 1 23,273 23,297 22,831 23,087 22,938 23,074 23,419 22,977 22,920 Current Unit Cost 153,273 153,297 152,831 153,087 152,938 153,074 153,419 152,977 152,920 Concrete Unit Cost 380,000 380,000 380,000 380,000 380,000 380,000 380,000 380,000 380,000 (per km of road) Escalation TYPE 3 80,383 80,571 76,938 78,931 77,769 78,828 81,520 78,072 77,630 Current Unit Cost 460,383 460,571 456,938 458,931 457,769 458,828 461,520 458,072 457,630 Sub soil (pipes) Unit Cost 510,000 510,000 510,000 510,000 510,000 510,000 510,000 510,000 510,000 (per km of road) Escalation TYPE 2 118,336 118,462 116,024 117,361 116,582 117,293 119,099 116,785 116,489 Current Unit Cost 628,336 628,462 626,024 627,361 626,582 627,293 629,099 626,785 626,489 SOLID WASTE Unit Cost 15 15 15 15 15 15 15 15 15 DISPOSAL Escalation TYPE 2 3 3 3 3 3 3 4 3 3 (per household p m) Current Unit Cost 18 18 18 18 18 18 19 18 18 STREET Unit Cost 650 650 650 650 650 650 650 650 650 LIGHTING Escalation TYPE 2 151 151 148 150 149 149 152 149 148 (per household) Current Unit Cost 801 801 798 800 799 799 802 799 798 HIGH MAST Unit Cost 125,000 125,000 125,000 125,000 125,000 125,000 125,000 125,000 125,000 LIGHTING Escalation TYPE 2 29,004 29,035 28,437 28,765 28,574 28,748 29,191 28,624 28,551 (per each) Current Unit Cost 154,004 154,035 153,437 153,765 153,574 153,748 154,191 153,624 153,551 BUS SHELTERS Unit Cost 400 400 400 400 400 400 400 400 400 (per square meter) Escalation TYPE 2 93 93 91 92 91 92 93 92 91 Current Unit Cost 493 493 491 492 491 492 493 492 491 TAXI RANKS Unit Cost 385 385 385 385 385 385 385 385 385 (per square meter) Escalation TYPE 2 89 89 88 89 88 89 90 88 88 Current Unit Cost 474 474 473 474 473 474 475 473 473 SIDE WALKS Unit Cost 40 40 40 40 40 40 40 40 40 UNPAVED Escalation TYPE 2 9 9 9 9 9 9 9 9 9 (per square meter) Current Unit Cost 49 49 49 49 49 49 49 49 49
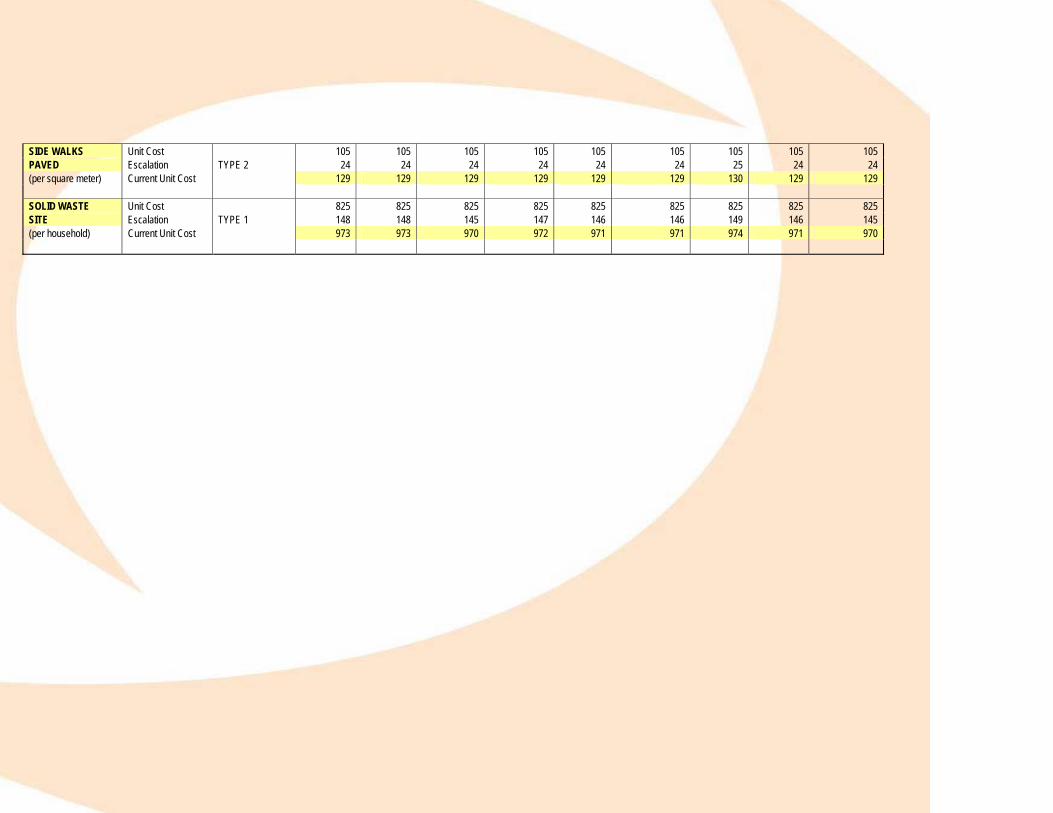
SIDE WALKS Unit Cost 105 105 105 105 105 105 105 105 105 PAVED Escalation TYPE 2 24 24 24 24 24 24 25 24 24 (per square meter) Current Unit Cost 129 129 129 129 129 129 130 129 129 SOLID WASTE Unit Cost 825 825 825 825 825 825 825 825 825 SITE Escalation TYPE 1 148 148 145 147 146 146 149 146 145 (per household) Current Unit Cost 973 973 970 972 971 971 974 971 970

MIG GUIDELINES UNIT COSTING - ESCALATION FACTORS FOR LABOUR, PLANT, MATERIAL AND FUEL LABOUR RATES INDICES PER PROVINCE OTHER INDICES CONTRACT
TYPES CALC's DETAIL
EASTERN CAPE –
PE
FREE STATE -
BFN
GAUTENG - WWR
KWAZULU-
NATAL - DBN
LIMPOPO - Polokwane
MPUMALANGA -
Nelspruit
NORTHERN CAPE - Kimberley
NORTH WEST
WESTERN CAPE -
Cape Peninsul
a
PLANT INDEX
MATERIAL
INDEX
FUEL INDEX
Base Dec 2004 127.4 121.9 125.3 125.9 116.5 124.1 128.0 125.3 124.6 133.1 125.6 145.4
Current Feb 2007 143.1 137.1 137.4 140.0 128.5 137.9 144.9 138.5 137.3 148.3 172.5 203.9
Index Ratio 1.1232 1.1247 1.0966 1.1120 1.1030 1.1112 1.1320 1.1053 1.1019 1.1142 1.3734 1.4023 1. Earthworks (with Culverts and Drainage)
Coefficient 0.15 0.15 0.15 0.15 0.15 0.15 0.15 0.15 0.15 0.50 0.20 0.15
Coef X Ratio 0.1685 0.1687 0.1645 0.1668 0.1655 0.1667 0.1698 0.1658 0.1653 0.5571 0.2747 0.2104 Esc Factor 0.1790 0.1792 0.1756 0.1776 0.1764 0.1775 0.1801 0.1767 0.1763 2. General Civil Engineering Work - 2/3 Earthworks; 1/3 Concrete
Coefficient 0.20 0.20 0.20 0.20 0.20 0.20 0.20 0.20 0.20 0.20 0.55 0.05
Coef X Ratio 0.2246 0.2249 0.2193 0.2224 0.2206 0.2222 0.2264 0.2211 0.2204 0.2228 0.7554 0.0701 Esc Factor 0.2320 0.2323 0.2275 0.2301 0.2286 0.2300 0.2335 0.2290 0.2284 3. Concrete Work Coefficient 0.40 0.40 0.40 0.40 0.40 0.40 0.40 0.40 0.40 0.10 0.45 0.05
Coef X Ratio 0.4493 0.4499 0.4386 0.4448 0.4412 0.4445 0.4528 0.4421 0.4408 0.1114 0.6180 0.0701 Esc Factor 0.2115 0.2120 0.2025 0.2077 0.2047 0.2074 0.2145 0.2055 0.2043
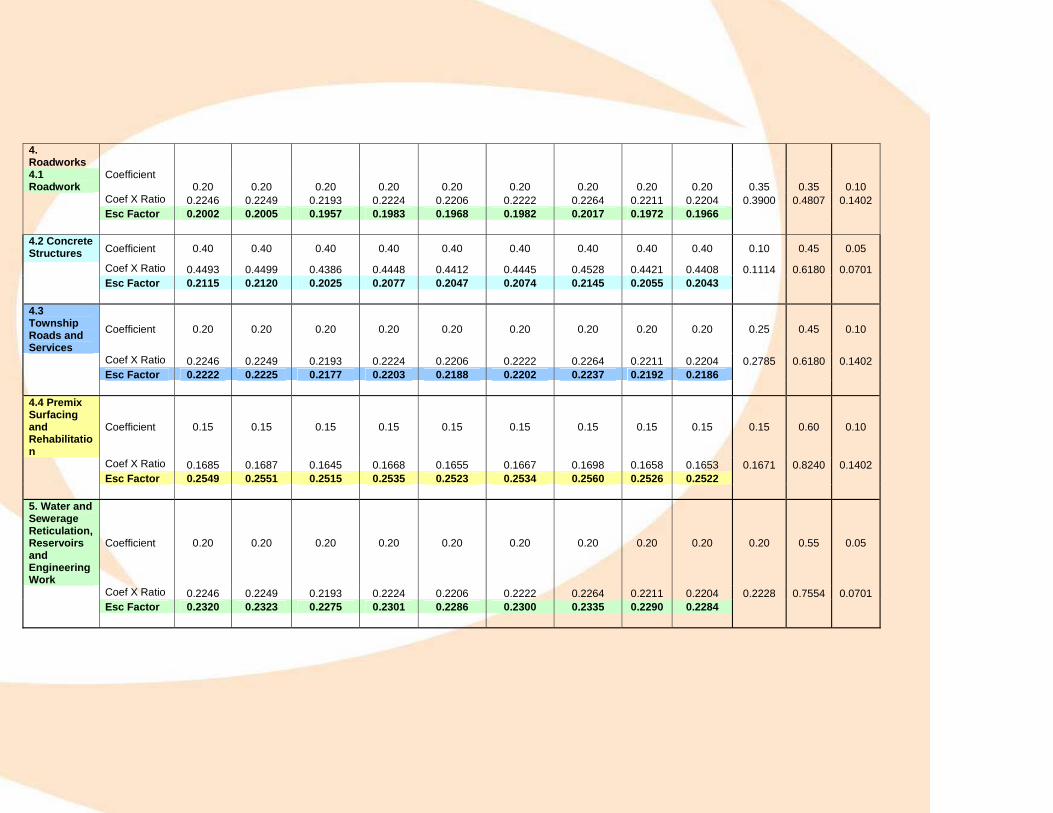
4. Roadworks 4.1 Roadwork
Coefficient 0.20 0.20 0.20 0.20 0.20 0.20 0.20 0.20 0.20 0.35 0.35 0.10
Coef X Ratio 0.2246 0.2249 0.2193 0.2224 0.2206 0.2222 0.2264 0.2211 0.2204 0.3900 0.4807 0.1402 Esc Factor 0.2002 0.2005 0.1957 0.1983 0.1968 0.1982 0.2017 0.1972 0.1966 4.2 Concrete Structures Coefficient 0.40 0.40 0.40 0.40 0.40 0.40 0.40 0.40 0.40 0.10 0.45 0.05
Coef X Ratio 0.4493 0.4499 0.4386 0.4448 0.4412 0.4445 0.4528 0.4421 0.4408 0.1114 0.6180 0.0701 Esc Factor 0.2115 0.2120 0.2025 0.2077 0.2047 0.2074 0.2145 0.2055 0.2043 4.3 Township Roads and Services
Coefficient 0.20 0.20 0.20 0.20 0.20 0.20 0.20 0.20 0.20 0.25 0.45 0.10
Coef X Ratio 0.2246 0.2249 0.2193 0.2224 0.2206 0.2222 0.2264 0.2211 0.2204 0.2785 0.6180 0.1402 Esc Factor 0.2222 0.2225 0.2177 0.2203 0.2188 0.2202 0.2237 0.2192 0.2186 4.4 Premix Surfacing and Rehabilitation
Coefficient 0.15 0.15 0.15 0.15 0.15 0.15 0.15 0.15 0.15 0.15 0.60 0.10
Coef X Ratio 0.1685 0.1687 0.1645 0.1668 0.1655 0.1667 0.1698 0.1658 0.1653 0.1671 0.8240 0.1402 Esc Factor 0.2549 0.2551 0.2515 0.2535 0.2523 0.2534 0.2560 0.2526 0.2522 5. Water and Sewerage Reticulation, Reservoirs and Engineering Work
Coefficient 0.20 0.20 0.20 0.20 0.20 0.20 0.20 0.20 0.20 0.20 0.55 0.05
Coef X Ratio 0.2246 0.2249 0.2193 0.2224 0.2206 0.2222 0.2264 0.2211 0.2204 0.2228 0.7554 0.0701 Esc Factor 0.2320 0.2323 0.2275 0.2301 0.2286 0.2300 0.2335 0.2290 0.2284

Appendix 6: Cost breakdown Example Eastern Cape
(rates & quantities used to calculate price)

EASTERN CAPE Description %/Cost Material 1.00% Plant -6.40% Ready Mix Concrete 18.20% Labour 65.00 Supervision 120.00 Preliminary & General 12.00% Description Unit Qty Rate Prov. % Prov. Rate Sub Total Profit % Total
1 General water supply 1a Stand pipes & Communal taps
1 25 mm Garden tap no 1 160.70 0.01 162.31 162.31 30.00% 211.00 2 150mm x 25mm galv. Threaded pipe no 1 5.50 0.01 5.56 5.56 30.00% 7.22 3 25mm galv Elbow no 2 5.28 0.01 5.33 10.67 30.00% 13.87 4 1200mm x 25mm galv. Threaded pipe no 1 39.90 0.01 40.30 40.30 30.00% 52.39
5 25mm x 32mm compression male adaptor no 2 10.04 0.01 10.14 20.28 30.00% 26.37
6 110mm x 32 mm saddle no 1 82.45 0.01 83.27 83.27 30.00% 108.26 7 50mm PVC trap no 1 19.90 0.01 20.10 20.10 30.00% 26.13 8 50 mm 45 deg elbow no 1 3.45 0.01 3.48 3.48 30.00% 4.53 9 50mm PVC pipe m 3 7.50 0.01 7.58 22.73 30.00% 29.54
10 32mm DHPE pipe m 15 6.93 0.01 7.00 104.99 30.00% 136.49 11 1.2 m 110mm uPVC pipe to standpipe no 1 20.00 0.01 20.20 20.20 30.00% 26.26 12 19mm concrete stone to drain m3 1 165.00 0.01 166.65 166.65 30.00% 216.65 13 Concrete to plinth complete m3 0.2 683.25 0.18 807.60 161.52 30.00% 209.98 14 Bedim to drain m2 6 14.00 0.01 14.14 84.84 30.00% 110.29 15 Excavation to trench and drain m3 1.975 15.00 -0.06 14.04 27.73 30.00% 36.05 16 Labour man days no 3 65.00 65.00 65.00 195.00 30.00% 253.50 17 Supervision no 0.3 120.00 120.00 120.00 36.00 30.00% 46.80
Percentage Total 1,515.30 Preliminary & general % 12.00% 1,697.14 Total Cost 1,697.14 1b Yard tap
1 25 mm Garden tap no 1 160.70 0.01 162.31 162.31 30.00% 211.00 2 150mm x 25mm galv. Threaded pipe no 1 5.50 0.01 5.56 5.56 30.00% 7.22 3 25mm galv Elbow no 2 2.97 0.01 3.00 6.00 30.00% 7.80 4 1200mm x 25mm galv. Threaded pipe no 1 39.90 0.01 40.30 40.30 30.00% 52.39
5 25mm x 32mm compression male adaptor no 2 10.04 0.01 10.14 20.28 30.00% 26.37
6 110mm x 32 mm saddle no 1 82.45 0.01 83.27 83.27 30.00% 108.26 10 32mm DHPE pipe m 15 4.90 0.01 4.95 74.24 30.00% 96.51 11 1.2 m 110mm uPVC pipe to standpipe no 1 52.62 0.01 53.15 53.15 30.00% 69.09 13 Concrete to plinth m3 0.2 683.25 0.18 807.60 161.52 30.00% 209.98 15 Excavation to trench m3 -0.06 0.00 0.00 30.00% 0.00 16 Labour man days no 2 65.00 65.00 65.00 130.00 30.00% 169.00 17 Supervision no 0.25 0.00 120.00 120.00 30.00 30.00% 39.00
Percentage Total 996.60 Preliminary & general % 12.00% 1,116.19 Total Cost 1,116.19

Description Unit Qty Rate Prov. % Prov. Rate Sub Total Profit % Total 1c 5000 l Yard tank
1 25 mm Garden tap no 1 160.70 0.01 162.31 162.31 30.00% 211.00 2 150mm x 25mm galv. Threaded pipe no 1 5.50 0.01 5.56 5.56 30.00% 7.22 3 25mm galv Barrel nipple no 1 2.07 0.01 2.09 2.09 30.00% 2.72 4 5000 l Jojo tank no 1 2,850.00 0.01 2,878.50 2878.50 30.00% 3,742.05 5 Concrete to foundation m3 1.2 683.25 0.18 807.60 969.12 30.00% 1,259.86 6 Concrete bricks to stand no 1100 1.06 0.01 1.07 1177.66 30.00% 1,530.96 7 Brick force m 40 0.60 0.01 0.61 24.24 30.00% 31.51 8 Cement to brickwork no 5 48.00 0.01 48.48 242.40 30.00% 315.12 9 Building sand m3 1.5 280.00 0.01 282.80 424.20 30.00% 551.46
10 Backfill material m3 7.5 85.00 0.01 85.85 643.88 30.00% 837.04 11 Concrete to slab m3 0.6 683.25 0.18 807.60 484.56 30.00% 629.93 12 Reinforcing mesh to slab m2 5.76 22.80 0.01 23.03 132.64 30.00% 172.43 13 Gage 8 galv. Wire to tie down tank. m 38 4.95 0.01 5.00 189.98 30.00% 246.98 14 Excavation to foundation m3 1.2 42.00 -0.06 39.31 47.17 30.00% 61.33 16 Labour man days no 32 65.00 65.00 65.00 2080.00 30.00% 2,704.00 17 Supervision no 8 120.00 120.00 120.00 960.00 30.00% 1,248.00
Percentage Total 13,551.60 Preliminary & general % 12.00% 15,177.79 Total Cost 15,177.79 1e House Connection (Including water meter)
1 15 mm boxed Kent Water meter complete no 1 288.25 0.01 291.13 291.13 30.00% 378.47
2 15mm x 25mm compression male adaptor no 3 7.85 0.01 7.93 23.79 30.00% 30.92
3 75mm x 25 mm saddle no 1 30.70 0.01 31.01 31.01 30.00% 40.31 4 15mm DHPE pipe no 18 2.78 0.01 2.81 50.54 30.00% 65.70 5 25mm Compression end cap. no 1 9.07 0.01 9.16 9.16 30.00% 11.91 6 Excavation to trench and drain m 5 22.00 -0.06 20.59 102.96 30.00% 133.85 7 Labour man days no 2 0.00 65.00 65.00 130.00 30.00% 169.00 8 Supervision no 0.25 0.00 120.00 120.00 30.00 30.00% 39.00
Percentage Total 869.16 Preliminary & general % 12.00% 973.46 Total Cost 973.46 Description Unit Qty Rate Prov. % Prov. Rate Sub Total Profit % Total
2 Bulk Water Supply 2a Cost/m from Municipal supply 110 mm supply Calculated to 1000m
1 Clear & grub m2 2000 1.25 0.00 1.25 2500.00 30.00% 3,250.00 2 Remove topsoil m2 2000 2.35 -0.06 2.20 4399.20 30.00% 5,718.96 3 Trench Excavation (machine) m 1000 23.00 -0.06 21.53 21528.00 30.00% 27,986.40 4 Bedding & Backfill m3 520 48.00 0.00 48.00 24960.00 30.00% 32,448.00 5 160 mm uPVC class 12 pipe m 1000 110.59 0.01 111.70 111695.90 30.00% 145,204.67 6 160 mm 90 deg bend no 4 360.00 0.01 363.60 1454.40 30.00% 1,890.72 7 160 mm 90 deg bend no 4 360.00 0.01 363.60 1454.40 30.00% 1,890.72 8 160 mm Flanged valve (Rsi) no 1 1,991.00 0.01 2,010.91 2010.91 30.00% 2,614.18

9 160mm Flanged adaptors no 7 202.69 0.01 204.72 1433.02 30.00% 1,862.92 10 Bolts & gasket sets no 4 75.00 0.01 75.75 303.00 30.00% 393.90 11 Anchor blocks m3 5 683.25 0.18 807.60 4038.01 30.00% 5,249.41 12 Air valve 50mm double orifice no 1 3,500.00 0.01 3,535.00 3535.00 30.00% 4,595.50 13 160 mm x 50 mm flanged t no 1 351.92 0.01 355.44 355.44 30.00% 462.07 14 1000mm x 50mm galv. Threaded pipe no 1 112.00 0.01 113.12 113.12 30.00% 147.06 15 Air valve chamber no 1 1,481.00 0.01 1,495.81 1495.81 30.00% 1,944.55 16 Valve chamber complete no 1 495.00 0.01 499.95 499.95 30.00% 649.94 17 Testing m 1000 5.00 0.00 5.00 5000.00 30.00% 6,500.00 18 Labour man days no 220 65.00 65.00 65.00 14300.00 30.00% 18,590.00 19 Supervision no 16 0.00 120.00 120.00 1920.00 30.00% 2,496.00
Percentage Total 263,895.00 Preliminary & general % 12.00% 295,562.40 Unit Cost to 1m 295.56 Total Cost 295.56 2a Cost/m from Municipal supply 160 mm supply
1 Clear & grub m2 2000 1.25 0.00 1.25 2500.00 30.00% 3,250.00 2 Remove topsoil m2 2000 2.35 -0.06 2.20 4399.20 30.00% 5,718.96 3 Trench Excavation (machine) m 1000 23.00 -0.06 21.53 21528.00 30.00% 27,986.40 4 Bedding & Backfill m3 520 48.00 0.00 48.00 24960.00 30.00% 32,448.00 5 200 mm uPVC class 12 pipe m 1000 154.26 0.01 155.80 155802.60 30.00% 202,543.38 6 200 mm 90 deg bend no 4 578.55 0.01 584.34 2337.34 30.00% 3,038.54 7 200 mm 90 deg bend no 4 578.55 0.01 584.34 2337.34 30.00% 3,038.54 8 200 mm Flanged valve (Rsi) no 1 3,033.00 0.01 3,063.33 3063.33 30.00% 3,982.33 9 200mm Flanged adaptors no 7 300.85 0.01 303.86 2127.01 30.00% 2,765.11
10 Bolts & gasket sets no 4 95.00 0.01 95.95 383.80 30.00% 498.94 11 Anchor blocks m3 6 683.25 0.18 807.60 4845.61 30.00% 6,299.29 12 Air valve 50mm double orifice no 1 3,500.00 0.01 3,535.00 3535.00 30.00% 4,595.50 13 200 mm x 50 mm flanged T no 1 457.52 0.01 462.10 462.10 30.00% 600.72 14 1000mm x 50mm galv. Threaded pipe no 1 112.00 0.01 113.12 113.12 30.00% 147.06 15 Air valve chamber no 1 1,481.00 0.01 1,495.81 1495.81 30.00% 1,944.55 16 Valve chamber complete no 1 495.00 0.01 499.95 499.95 30.00% 649.94 17 testing m 1000 5.00 0.00 5.00 5000.00 30.00% 6,500.00 18 Labour man days no 220 65.00 65.00 65.00 14300.00 30.00% 18,590.00 19 Supervision no 16 120.00 120.00 120.00 1920.00 30.00% 2,496.00
Percentage Total 327,093.27 Preliminary & general % 12.00% 366,344.46 Unit Cost to 1m 366.34 Total Cost 366.34 Description Unit Qty Rate Prov. % Prov. Rate Sub Total Profit % Total 2a Cost/m from Municipal supply 250 mm supply
1 Clear & grub m2 2000 1.25 0.00 1.25 2500.00 30.00% 3,250.00 2 Remove topsoil m2 2000 2.35 -0.06 2.20 4399.20 30.00% 5,718.96 3 Trench Excavation (machine) m 1000 31.00 -0.06 29.02 29016.00 30.00% 37,720.80 4 Bedding & Backfill m3 680 48.00 0.00 48.00 32640.00 30.00% 42,432.00 5 250 mm uPVC class 12 pipe m 1000 285.00 0.01 287.85 287850.00 30.00% 374,205.00 6 250 mm 90 deg bend no 4 795.00 0.01 802.95 3211.80 30.00% 4,175.34

7 250 mm 90 deg bend no 4 795.00 0.01 802.95 3211.80 30.00% 4,175.34 8 250 mm Flanged valve (Rsi) no 1 5,350.00 0.01 5,403.50 5403.50 30.00% 7,024.55 9 250 mm Flanged adaptors no 7 565.00 0.01 570.65 3994.55 30.00% 5,192.92
10 Bolts & gasket sets no 4 62.50 0.01 63.13 252.50 30.00% 328.25 11 Anchor blocks m3 6 683.25 0.18 807.60 4845.61 30.00% 6,299.29 12 Air valve 50mm double orifice no 1 3,500.00 0.01 3,535.00 3535.00 30.00% 4,595.50 13 250 mm x 50 mm flanged t no 1 610.40 0.01 616.50 616.50 30.00% 801.46 14 1000mm x 50mm galv. Threaded pipe no 1 112.00 0.01 113.12 113.12 30.00% 147.06 15 Air valve chamber no 1 1,481.00 0.01 1,495.81 1495.81 30.00% 1,944.55 16 Valve chamber complete no 1 495.00 0.01 499.95 499.95 30.00% 649.94 17 testing m 1000 5.00 0.00 5.00 5000.00 30.00% 6,500.00 18 Labour man days no 240 65.00 65.00 65.00 15600.00 30.00% 20,280.00 19 Supervision no 18 120.00 120.00 120.00 2160.00 30.00% 2,808.00
Percentage Total 528,248.95 Preliminary & general % 12.00% 591,638.82 Unit Cost to 1m 591.64 Total Cost 591.64 2a Cost/m from Municipal supply 315 mm supply
1 Clear & grub m2 2000 1.25 0.00 1.25 2500.00 30.00% 3,250.00 2 Remove topsoil m2 2000 2.35 -0.06 2.20 4399.20 30.00% 5,718.96 3 Trench Excavation (machine) m 1000 51.52 -0.06 48.22 48222.72 30.00% 62,689.54 4 Bedding & Backfill m3 960 48.00 0.00 48.00 46080.00 30.00% 59,904.00 5 315 mm uPVC class 12 pipe m 1000 382.13 0.01 385.95 385951.30 30.00% 501,736.69 6 315 mm 90 deg bend no 4 2,769.00 0.01 2,796.69 11186.76 30.00% 14,542.79 7 315 mm 90 deg bend no 4 2,769.00 0.01 2,796.69 11186.76 30.00% 14,542.79 8 315 mm Flanged valve (Rsi) no 1 6,057.00 0.01 6,117.57 6117.57 30.00% 7,952.84 9 315 mm Flanged adaptors no 7 562.00 0.01 567.62 3973.34 30.00% 5,165.34
10 Bolts & gasket sets no 4 150.00 0.01 151.50 606.00 30.00% 787.80 11 Anchor blocks m3 12 683.25 0.18 807.60 9691.22 30.00% 12,598.58 12 Air valve 50mm double orifice no 1 2,720.00 0.01 2,747.20 2747.20 30.00% 3,571.36 13 315 mm x 50 mm flanged t no 1 1,980.00 0.01 1,999.80 1999.80 30.00% 2,599.74 14 1000mm x 50mm galv. Threaded pipe no 1 76.20 0.01 76.96 76.96 30.00% 100.05 15 Air valve chamber no 1 1,640.00 0.01 1,656.40 1656.40 30.00% 2,153.32 16 Valve chamber complete no 1 595.00 0.01 600.95 600.95 30.00% 781.24 17 testing m 1000 7.00 0.00 7.00 7000.00 30.00% 9,100.00 18 Labour man days no 240 65.00 65.00 65.00 15600.00 30.00% 20,280.00 19 Supervision no 14 120.00 120.00 120.00 1680.00 30.00% 2,184.00
Percentage Total 729,659.03 Preliminary & general % 12.00% 817,218.12 Unit Cost to 1m 817.22 Total Cost 817.22 Description Unit Qty Rate Prov. % Prov. Rate Sub Total Profit % Total
3 Meters (capital cost) 3a Domestic meters (15 mm)
1 15 mm boxed Kent Water meter complete no 1 288.25 0.01 291.13 291.13 30.00% 378.47
19 Labour man days no 1 65.00 65.00 65.00 65.00 30.00% 84.50 20 Supervision no 0.5 120.00 120.00 120.00 60.00 30.00% 78.00
Percentage Total 540.97

Preliminary & general % 12.00% 605.89 Total Cost 605.89 3a1 Domestic meters (25 mm)
1 25 mm boxed Kent Water meter complete no 1 1,519.00 0.01 1,534.19 1534.19 30.00% 1,994.45
19 Labour man days no 1 65.00 65.00 65.00 65.00 30.00% 84.50 20 Supervision no 0.5 120.00 120.00 120.00 60.00 30.00% 78.00
Percentage Total 2,156.95 Preliminary & general % 12.00% 2,415.78 Total Cost 2,415.78 3a1 Domestic meters Pre paid (15 mm)
1 15 mm Pre paid Kent Water meter no 1 1,587.00 0.01 1,602.87 1602.87 30.00% 2,083.73 19 Labour man days no 2 65.00 65.00 65.00 130.00 30.00% 169.00 20 Supervision no 0.5 120.00 120.00 120.00 60.00 30.00% 78.00
Percentage Total 2,330.73 Preliminary & general % 12.00% 2,610.42 Total Cost 2,610.42 Description Unit Qty Rate Prov. % Prov. Rate Sub Total Profit % Total
2 Bulk Water Supply 2b Boreholes - Shallow 50 m - Semi Rural (100 km radius) 165 mm ID Hole
1 Divine Water - Position of Hole ea 1 Included in Prov. Rate 7,692.31 7692.31 30.00% 10,000.00 2 Drill Hole to 50 m m 50 Included in Prov. Rate 150.00 7500.00 30.00% 9,750.00 3 Supply and Fit Borehole Lining (PVC) m 50 Included in Prov. Rate 192.31 9615.50 30.00% 12,500.15
4 Install Pump, Motor, Cabling, Control Panel ea 1 Included in Prov. Rate 25,000.00 25000.00 30.00% 32,500.00
5 Transport to Site and Return km 200 Included in Prov. Rate 15.00 3000.00 30.00% 3,900.00
6 Labour man days - Included in Drilling Rate no 0 Included in Prov. Rate 0.00 0.00 30.00% 0.00
7 Supervision - Included in Drilling Rate no 0 Included in Prov. Rate 0.00 0.00 30.00% 0.00 Percentage Total 68,650.15 P & G - Included in Prov. Rate above % 0.00% 68,650.15 1,373.00 Total Cost 1,373.00 Description Unit Qty Rate Prov. % Prov. Rate Sub Total Profit % Total 2b Boreholes - Shallow 50 m - Deep Rural (250 km radius) 165 mm ID Hole
1 Divine Water - Position of Hole ea 1 Included in Prov. Rate 7,692.31 7692.31 30.00% 10,000.00 2 Drill Hole to 50 m m 50 Included in Prov. Rate 150.00 7500.00 30.00% 9,750.00 3 Supply and Fit Borehole Lining (PVC) m 50 Included in Prov. Rate 192.31 9615.50 30.00% 12,500.15
4 Install Pump, Motor, Cabling, Control Panel ea 1 Included in Prov. Rate 25,000.00 25000.00 30.00% 32,500.00
5 Transport to Site and Return km 500 Included in Prov. Rate 15.00 7500.00 30.00% 9,750.00
6 Labour man days - Included in Drilling Rate no 0 Included in Prov. Rate 0.00 0.00 30.00% 0.00
7 Supervision - Included in Drilling Rate no 0 Included in Prov. Rate 0.00 0.00 30.00% 0.00 Percentage Total 74,500.15 P & G - Included in Prov. Rate above % 0.00% 74,500.15

1,490.00 Total Cost 1,490.00 Description Unit Qty Rate Prov. % Prov. Rate Sub Total Profit % Total
2b Boreholes - Deep 200 m - Semi Rural (100 km radius)
165 mm ID Hole
1 Divine Water - Position of Hole ea 1 Included in Prov. Rate 7,692.31 7692.31 30.00% 10,000.00 2 Drill Hole to 200 m m 200 Included in Prov. Rate 150.00 30000.00 30.00% 39,000.00 3 Supply and Fit Borehole Lining (PVC) m 200 Included in Prov. Rate 192.31 38462.00 30.00% 50,000.60
4 Install Pump, Motor, Cabling, Control Panel ea 1 Included in Prov. Rate 25,000.00 25000.00 30.00% 32,500.00
5 Transport to Site and Return km 100 Included in Prov. Rate 15.00 1500.00 30.00% 1,950.00
6 Labour man days - Included in Drilling Rate no 0 Included in Prov. Rate 0.00 0.00 30.00% 0.00
7 Supervision - Included in Drilling Rate no 0 Included in Prov. Rate 0.00 0.00 30.00% 0.00 Percentage Total 133,450.60 P & G - Included in Prov. Rate above % 0.00% 133,450.60 667.25 Total Cost 667.25
2b Boreholes - Deep 200 m - Deep Rural (250 km radius)
165 mm ID Hole
1 Divine Water - Position of Hole ea 1 Included in Prov. Rate 7,692.31 7692.31 30.00% 10,000.00 2 Drill Hole to 200 m m 200 Included in Prov. Rate 150.00 30000.00 30.00% 39,000.00 3 Supply and Fit Borehole Lining (PVC) m 200 Included in Prov. Rate 192.31 38462.00 30.00% 50,000.60
4 Install Pump, Motor, Cabling, Control Panel ea 1 Included in Prov. Rate 25,000.00 25000.00 30.00% 32,500.00
5 Transport to Site and Return km 500 Included in Prov. Rate 15.00 7500.00 30.00% 9,750.00
6 Labour man days - Included in Drilling Rate no 0 Included in Prov. Rate 0.00 0.00 30.00% 0.00
7 Supervision - Included in Drilling Rate no 0 Included in Prov. Rate 0.00 0.00 30.00% 0.00 Percentage Total 141,250.60 P & G - Included in Prov. Rate above % 0.00% 141,250.60 706.25 Total Cost 706.25 Description Unit Qty Rate Prov. % Prov. Rate Sub Total Profit % Total
2 Bulk Water Supply 2b Boreholes - Shallow 50 m - Semi Rural (100 km radius) 208 mm ID Hole
1 Divine Water - Position of Hole ea 1 Included in Prov. Rate 7,692.31 7692.31 30.00% 10,000.00 2 Drill Hole to 50 m m 50 Included in Prov. Rate 200.00 10000.00 30.00% 13,000.00 3 Supply and Fit Borehole Lining (PVC) m 50 Included in Prov. Rate 192.31 9615.50 30.00% 12,500.15
4 Install Pump, Motor, Cabling, Control Panel ea 1 Included in Prov. Rate 25,000.00 25000.00 30.00% 32,500.00
5 Transport to Site and Return km 200 Included in Prov. Rate 15.00 3000.00 30.00% 3,900.00
6 Labour man days - Included in Drilling Rate no 0 Included in Prov. Rate 0.00 0.00 30.00% 0.00
7 Supervision - Included in Drilling Rate no 0 Included in Prov. Rate 0.00 0.00 30.00% 0.00 Percentage Total 71,900.15

P & G - Included in Prov. Rate above % 0.00% 71,900.15 1,438.00 Total Cost 1,438.00 2b Boreholes - Shallow 50 m - Deep Rural (250 km radius) 208 mm ID Hole
1 Divine Water - Position of Hole ea 1 Included in Prov. Rate 7,692.31 7692.31 30.00% 10,000.00 2 Drill Hole to 50 m m 50 Included in Prov. Rate 200.00 10000.00 30.00% 13,000.00 3 Supply and Fit Borehole Lining (PVC) m 50 Included in Prov. Rate 192.31 9615.50 30.00% 12,500.15
4 Install Pump, Motor, Cabling, Control Panel ea 1 Included in Prov. Rate 25,000.00 25000.00 30.00% 32,500.00
5 Transport to Site and Return km 500 Included in Prov. Rate 15.00 7500.00 30.00% 9,750.00
6 Labour man days - Included in Drilling Rate no 0 Included in Prov. Rate 0.00 0.00 30.00% 0.00
7 Supervision - Included in Drilling Rate no 0 Included in Prov. Rate 0.00 0.00 30.00% 0.00 Percentage Total 77,750.15 P & G - Included in Prov. Rate above % 0.00% 77,750.15 1,555.00 Total Cost 1,555.00 Description Unit Qty Rate Prov. % Prov. Rate Sub Total Profit % Total
2b Boreholes - Deep 200 m - Semi Rural (100 km radius)
208 mm ID Hole
1 Divine Water - Position of Hole ea 1 Included in Prov. Rate 7,692.31 7692.31 30.00% 10,000.00 2 Drill Hole to 200 m m 200 Included in Prov. Rate 200.00 40000.00 30.00% 52,000.00 3 Supply and Fit Borehole Lining (PVC) m 200 Included in Prov. Rate 192.31 38462.00 30.00% 50,000.60
4 Install Pump, Motor, Cabling, Control Panel ea 1 Included in Prov. Rate 25,000.00 25000.00 30.00% 32,500.00
5 Transport to Site and Return km 100 Included in Prov. Rate 15.00 1500.00 30.00% 1,950.00
6 Labour man days - Included in Drilling Rate no 0 Included in Prov. Rate 0.00 0.00 30.00% 0.00
7 Supervision - Included in Drilling Rate no 0 Included in Prov. Rate 0.00 0.00 30.00% 0.00 Percentage Total 146,450.60 P & G - Included in Prov. Rate above % 0.00% 146,450.60 732.25 Total Cost 732.25
2b Boreholes - Deep 200 m - Deep Rural (250 km radius)
208 mm ID Hole
1 Divine Water - Position of Hole ea 1 Included in Prov. Rate 7,692.31 7692.31 30.00% 10,000.00 2 Drill Hole to 200 m m 200 Included in Prov. Rate 200.00 40000.00 30.00% 52,000.00 3 Supply and Fit Borehole Lining (PVC) m 200 Included in Prov. Rate 192.31 38462.00 30.00% 50,000.60
4 Install Pump, Motor, Cabling, Control Panel ea 1 Included in Prov. Rate 25,000.00 25000.00 30.00% 32,500.00
5 Transport to Site and Return km 500 Included in Prov. Rate 15.00 7500.00 30.00% 9,750.00
6 Labour man days - Included in Drilling Rate no 0 Included in Prov. Rate 0.00 0.00 30.00% 0.00
7 Supervision - Included in Drilling Rate no 0 Included in Prov. Rate 0.00 0.00 30.00% 0.00 Percentage Total 154,250.60 P & G - Included in Prov. Rate above % 0.00% 154,250.60 771.25

Total Cost 771.25
4 Sanitation 4a VIP Latrines or equivalent
1 Concrete bricks no 1580 1.06 0.01 1.07 1691.55 30.00% 2,199.01 2 Mortar sand m3 0.9 280.00 0.01 282.80 254.52 30.00% 330.88 4 Concrete to floors m3 0.6 683.25 0.18 807.60 484.56 30.00% 629.93 5 Cement no 6 46.00 0.01 46.46 278.76 30.00% 362.39 6 Corrugated Iron m2 4.3 51.52 0.01 52.04 223.75 30.00% 290.88 7 Timber m 3.6 12.25 0.01 12.37 44.54 30.00% 57.90 8 Reinforcing Mesh Ref 113 m2 2.1 22.80 0.01 23.03 48.36 30.00% 62.87 9 Steel door frames no 1 246.00 0.01 248.46 248.46 30.00% 323.00
10 Steel doors no 1 232.00 0.01 234.32 234.32 30.00% 304.62 11 Floor slab frame no 1 65.00 0.01 65.65 65.65 30.00% 85.35 12 Breeze bricks no 2 35.00 0.01 35.35 70.70 30.00% 91.91 13 Hinges no 2 24.00 0.01 24.24 48.48 30.00% 63.02 14 Paint oxide l 1 45.00 0.01 45.45 45.45 30.00% 59.09 15 Paint enamel l 1 64.00 0.01 64.64 64.64 30.00% 84.03
Plumbing 1 Precast toilet pedestal no 1 195.00 0.01 196.95 196.95 30.00% 256.04 2 Seat cover no 1 31.60 0.01 31.92 31.92 30.00% 41.49 3 110mm PVC wall brackets no 4 8.16 0.01 8.24 32.97 30.00% 42.86 4 PVC pipe 110 mm m 3 23.40 0.01 23.63 70.90 30.00% 92.17 5 2 way 110mm vent valve no 1 26.74 0.01 27.01 27.01 30.00% 35.11
Labour 1 Labour build & roof no 10.4 65.00 65.00 65.00 676.00 30.00% 878.80 2 Labour found & floor no 4.6 65.00 65.00 65.00 299.00 30.00% 388.70 3 Labour Plumbing no 0.6 65.00 65.00 65.00 39.00 30.00% 50.70 4 Labour paint no 0.46 65.00 65.00 65.00 29.90 30.00% 38.87 5 Supervision no 0.3 120.00 120.00 120.00 36.00 30.00% 46.80
Percentage Total 6,816.40 Preliminary & general % 12.00% 7,634.36 Total Cost 7,634.36 Description Unit Qty Rate Prov. % Prov. Rate Sub Total Profit % Total
4 Sanitation 4b Eco-scan, Urine-diversion Latrines
1 Concrete bricks no 1325 1.06 0.01 1.07 1418.55 30.00% 1,844.11 2 Mortar sand m3 0.8 280.00 0.01 282.80 226.24 30.00% 294.11 4 Concrete to floors m3 0.81 683.25 0.18 807.60 654.16 30.00% 850.40 5 Cement no 6 46.00 0.01 46.46 278.76 30.00% 362.39 6 Corrugated Iron m2 4.3 51.52 0.01 52.04 223.75 30.00% 290.88 7 Timber m 3.6 12.25 0.01 12.37 44.54 30.00% 57.90 8 Reinforcing Mesh Ref 113 m2 2.1 22.80 0.01 23.03 48.36 30.00% 62.87 9 Steel door frames no 1 246.00 0.01 248.46 248.46 30.00% 323.00
10 Steel doors no 1 232.00 0.01 234.32 234.32 30.00% 304.62 11 Floor slab frame no 1 65.00 0.01 65.65 65.65 30.00% 85.35 12 Breeze bricks no 2 35.00 0.01 35.35 70.70 30.00% 91.91 13 Hinges no 2 24.00 0.01 24.24 48.48 30.00% 63.02 14 Paint oxide l 1 45.00 0.01 45.45 45.45 30.00% 59.09

15 Paint enamel l 1 64.00 0.01 64.64 64.64 30.00% 84.03 Plumbing
1 Precast toilet pedestal no 1 195.00 0.01 196.95 196.95 30.00% 256.04 2 Seat cover no 1 31.60 0.01 31.92 31.92 30.00% 41.49 3 110mm PVC wall brackets no 4 8.16 0.01 8.24 32.97 30.00% 42.86 4 PVC pipe 110 mm m 3 23.40 0.01 23.63 70.90 30.00% 92.17 5 25mm DHPE piping m 8 5.55 0.01 5.61 44.84 30.00% 58.30 6 Access Cover no 1 485.00 0.01 489.85 489.85 30.00% 636.81 7 2 way 110mm vent valve no 1 26.74 0.01 27.01 27.01 30.00% 35.11
Labour 1 Labour build & roof no 10.4 65.00 65.00 65.00 676.00 30.00% 878.80 2 Labour found & floor no 4.6 65.00 65.00 65.00 299.00 30.00% 388.70 3 Labour Plumbing no 0.6 65.00 65.00 65.00 39.00 30.00% 50.70 4 Labour paint no 0.46 65.00 65.00 65.00 29.90 30.00% 38.87 5 Supervision no 0.3 120.00 120.00 120.00 36.00 30.00% 46.80
Percentage Total 7,340.31 Preliminary & general % 12.00% 8,221.14 Total Cost 8,221.14 Description Unit Qty Rate Prov. % Prov. Rate Sub Total Profit % Total
4 Sanitation 4e Septic Tank (Full level of service)
1 Concrete bricks no 1430 1.06 0.01 1.07 1530.96 30.00% 1,990.25 2 Mortar sand m3 0.9 280.00 0.01 282.80 254.52 30.00% 330.88 3 Plaster sand m3 0.9 285.00 0.01 287.85 259.07 30.00% 336.78 4 Concrete to floors m3 0.75 683.25 0.18 807.60 605.70 30.00% 787.41 5 Cement no 8 46.00 0.01 46.46 371.68 30.00% 483.18 6 Corrugated Iron m2 4.32 51.52 0.01 52.04 224.79 30.00% 292.23 7 Timber m 3.6 12.25 0.01 12.37 44.54 30.00% 57.90 8 Reinforcing Mesh Ref 113 m2 2.1 22.80 0.01 23.03 48.36 30.00% 62.87 9 Steel door frames no 1 246.00 0.01 248.46 248.46 30.00% 323.00
10 Steel doors no 1 232.00 0.01 234.32 234.32 30.00% 304.62 11 Floor slab frame no 1 65.00 0.01 65.65 65.65 30.00% 85.35 12 Breeze bricks no 2 35.00 0.01 35.35 70.70 30.00% 91.91 13 Hinges no 2 24.00 0.01 24.24 48.48 30.00% 63.02 14 Paint oxide l 1 45.00 0.01 45.45 45.45 30.00% 59.09 15 Paint enamel l 1 64.00 0.01 64.64 64.64 30.00% 84.03
Plumbing Water 1 110 mm Saddle no 1 44.00 0.01 44.44 44.44 30.00% 57.77 2 Plason male adaptor no 2 5.42 0.01 5.47 10.95 30.00% 14.23 3 Galv 15mm bend no 1 1.41 0.01 1.42 1.42 30.00% 1.85 4 Galv 15mm T no 1 1.80 0.01 1.82 1.82 30.00% 2.36 5 Galv 15mm 1700 mm pipe no 1 34.70 0.01 35.05 35.05 30.00% 45.56 6 Galv 15mm 400 mm pipe no 1 7.30 0.01 7.37 7.37 30.00% 9.58 7 15mm brass stop valve no 1 51.30 0.01 51.81 51.81 30.00% 67.36 8 Garden Tap no 1 33.60 0.01 33.94 33.94 30.00% 44.12 9 DHPE pipe m 6 2.76 0.01 2.79 16.73 30.00% 21.74
Plumbing Sewer 1 Cistern no 1 109.00 0.01 110.09 110.09 30.00% 143.12 2 Pan no 1 110.00 0.01 111.10 111.10 30.00% 144.43 3 T/seat no 1 31.66 0.01 31.98 31.98 30.00% 41.57

4 Concrete basin no 1 235.00 0.01 237.35 237.35 5 Ballcock valve no 1 25.90 0.01 26.16 26.16 30.00% 34.01 6 PVC pipe 50 mm m 3 7.50 0.01 7.58 22.73 30.00% 29.54 7 PVC pipe 110 mm m 2.5 23.60 0.01 23.84 59.59 30.00% 77.47 8 2 way 50mm vent valve no 1 15.60 0.01 15.76 15.76 30.00% 20.48 9 PVC bend vent & serv. no 1 37.40 0.01 37.77 37.77 30.00% 49.11 9 Hosebib no 1 33.60 0.01 33.94 33.94 30.00% 44.12
10 Concrete gully no 1 30.00 0.01 30.30 30.30 30.00% 39.39 11 PVC gully no 1 21.50 0.01 21.72 21.72 30.00% 28.23 12 PVC gully trap no 1 38.00 0.01 38.38 38.38 30.00% 49.89 13 110 PVC T no 1 28.11 0.01 28.39 28.39 30.00% 36.91 14 50mm bens no 1 2.55 0.01 2.58 2.58 30.00% 3.35 15 110 mm 45 deg no 1 21.78 0.01 22.00 22.00 30.00% 28.60 16 Rodding eye no 1 21.00 0.01 21.21 21.21 30.00% 27.57 17 110 x 50 red T no 1 27.09 0.01 27.36 27.36 30.00% 35.57
Labour 1 Labour build & roof no 12 65.00 65.00 65.00 780.00 30.00% 1,014.00 2 Labour found & floor no 5 65.00 65.00 65.00 325.00 30.00% 422.50 3 Labour Plumbing no 2 65.00 65.00 65.00 130.00 30.00% 169.00 4 Labour paint no 1 65.00 65.00 65.00 65.00 30.00% 84.50 5 Supervision no 0.5 120.00 120.00 120.00 60.00 30.00% 78.00
Percentage Total 8,218.44 Preliminary & general % 12.00% 9,204.65 Total Cost 9,204.65 Description Unit Qty Rate Prov. % Prov. Rate Sub Total Profit % Total
4 Sanitation 4e Full water-borne sanitation
1 Concrete bricks no 750 1.06 0.01 1.07 802.95 30.00% 1,043.84 2 Mortar sand m3 0.6 280.00 0.01 282.80 169.68 30.00% 220.58 3 Plaster sand m3 0.75 285.00 0.01 287.85 215.89 30.00% 280.65 4 Concrete to floors m3 0.3 683.25 0.18 807.60 242.28 30.00% 314.96 5 Cement no 4 46.00 0.01 46.46 185.84 30.00% 241.59 6 Corrugated Iron m2 4.32 51.52 0.01 52.04 224.79 30.00% 292.23 7 Timber m 3.6 12.25 0.01 12.37 44.54 30.00% 57.90 8 Reinforcing Mesh Ref 113 m2 2.1 22.80 0.01 23.03 48.36 30.00% 62.87 9 Steel door frames no 1 246.00 0.01 248.46 248.46 30.00% 323.00
10 Steel doors no 1 232.00 0.01 234.32 234.32 30.00% 304.62 11 Floor slab frame no 1 65.00 0.01 65.65 65.65 30.00% 85.35 12 Breeze bricks no 2 35.00 0.01 35.35 70.70 30.00% 91.91 13 Hinges no 2 24.00 0.01 24.24 48.48 30.00% 63.02 14 Paint oxide l 1 45.00 0.01 45.45 45.45 30.00% 59.09 15 Paint enamel l 1 64.00 0.01 64.64 64.64 30.00% 84.03
Plumbing Water 0.01 30.00% 1 110 mm Saddle no 1 44.00 0.01 44.44 44.44 30.00% 57.77 2 Plason male adaptor no 2 5.42 0.01 5.47 10.95 30.00% 14.23 3 Galv 15mm bend no 1 1.41 0.01 1.42 1.42 30.00% 1.85 4 Galv 15mm T no 1 1.80 0.01 1.82 1.82 30.00% 2.36 5 Galv 15mm 1700 mm pipe no 1 34.70 0.01 35.05 35.05 30.00% 45.56 6 Galv 15mm 400 mm pipe no 1 7.30 0.01 7.37 7.37 30.00% 9.58 7 15mm brass stop valve no 1 51.30 0.01 51.81 51.81 30.00% 67.36

8 Garden Tap no 1 33.60 0.01 33.94 33.94 30.00% 44.12 9 DHPE pipe m 6 2.76 0.01 2.79 16.73 30.00% 21.74
Plumbing Sewer 1 Cistern no 1 109.00 0.01 110.09 110.09 30.00% 143.12 2 Pan no 1 110.00 0.01 111.10 111.10 30.00% 144.43 3 T/seat no 1 31.66 0.01 31.98 31.98 30.00% 41.57 4 Ballcock valve no 1 25.90 0.01 26.16 26.16 30.00% 34.01 5 PVC pipe 50 mm m 3 7.50 0.01 7.58 22.73 30.00% 29.54 6 PVC pipe 110 mm m 2.5 23.60 0.01 23.84 59.59 30.00% 77.47 7 2 way 50mm vent valve no 1 15.60 0.01 15.76 15.76 30.00% 20.48 8 PVC bend vent & serv. no 1 37.40 0.01 37.77 37.77 30.00% 49.11 9 Hosebib no 1 33.60 0.01 33.94 33.94 30.00% 44.12
10 Concrete gully no 1 30.00 0.01 30.30 30.30 30.00% 39.39 11 PVC gully no 1 21.50 0.01 21.72 21.72 30.00% 28.23 12 PVC gully trap no 1 38.00 0.01 38.38 38.38 30.00% 49.89 13 110 PVC T no 1 28.11 0.01 28.39 28.39 30.00% 36.91 14 50mm bens no 1 2.55 0.01 2.58 2.58 30.00% 3.35 15 110 mm 45 deg no 1 21.78 0.01 22.00 22.00 30.00% 28.60 16 Rodding eye no 1 21.00 0.01 21.21 21.21 30.00% 27.57 17 110 x 50 red T no 1 27.09 0.01 27.36 27.36 30.00% 35.57
Labour 0.00 30.00% 0.00 1 Labour build & roof no 4.5 65.00 65.00 65.00 292.50 30.00% 380.25 2 Labour found & floor no 3 65.00 65.00 65.00 195.00 30.00% 253.50 3 Labour Plumbing no 1 65.00 65.00 65.00 65.00 30.00% 84.50 4 Labour paint no 0.5 65.00 65.00 65.00 32.50 30.00% 42.25 5 Supervision no 0.25 120.00 120.00 120.00 30.00 30.00% 39.00
Percentage Total 5,423.07 Preliminary & general % 12.00% 6,073.84 Total Cost 6,073.84 Description Unit Qty Rate Prov. % Prov. Rate Sub Total Profit % Total
5 Bulk Wastewater Supply 5a Cost/m from Municipal supply 110 mm supply Calculated to 1000m average depth of 1.6m / Manholes @ 60m average
1 Clear & grub m2 2000 1.25 0.00 1.25 2500.00 30.00% 3,250.00 2 Remove topsoil m2 2000 2.35 0.01 2.37 4747.00 30.00% 6,171.10 3 Trench Excavation (machine) m 1000 39.40 0.01 39.79 39794.00 30.00% 51,732.20 4 Bedding & Backfill m3 1105 42.00 0.01 42.42 46874.10 30.00% 60,936.33 5 110 mm PVC sewer pipe m 1000 21.00 0.01 21.21 21210.00 30.00% 27,573.00 6 Concrete to manhole base no 3.4 683.00 0.01 689.83 2345.42 30.00% 3,049.05 7 Concrete to benching no 4.25 683.00 0.01 689.83 2931.78 30.00% 3,811.31 8 Starter ring no 17 350.00 0.01 353.50 6009.50 30.00% 7,812.35 9 1000mm dia x 500 mm m/h ring no 51 450.00 0.01 454.50 23179.50 30.00% 30,133.35
10 Manhole cover no 17 0.00 0.01 0.00 0.00 30.00% 0.00 11 Manhole lid 17 0.00 0.18 0.00 0.00 30.00% 0.00 12 testing m 1000 5.00 0.00 5.00 5000.00 30.00% 6,500.00 13 Labour man days no 220 65.00 65.00 65.00 14300.00 30.00% 18,590.00 14 Supervision no 16 0.00 120.00 120.00 1920.00 30.00% 2,496.00
Percentage Total 222,054.69 Preliminary & general % 12.00% 248,701.25 Unit Cost to 1m 248.70

Total Cost 248.70 5b Cost/m from Municipal supply 160 mm supply Calculated to 1000m average depth of 1.6m / Manholes @ 60m average
1 Clear & grub m2 2000 1.25 0.00 1.25 2500.00 30.00% 3,250.00 2 Remove topsoil m2 2000 2.35 0.01 2.37 4747.00 30.00% 6,171.10 3 Trench Excavation (machine) m 1000 39.40 0.01 39.79 39794.00 30.00% 51,732.20 4 Bedding & Backfill m3 1105 42.00 0.01 42.42 46874.10 30.00% 60,936.33 5 110 mm PVC sewer pipe m 1000 42.00 0.01 42.42 42420.00 30.00% 55,146.00 6 Concrete to manhole base no 3.4 683.00 0.01 689.83 2345.42 30.00% 3,049.05 7 Concrete to benching no 4.25 683.00 0.01 689.83 2931.78 30.00% 3,811.31 8 Starter ring no 17 350.00 0.01 353.50 6009.50 30.00% 7,812.35 9 1000mm dia x 500 mm m/h ring no 51 450.00 0.01 454.50 23179.50 30.00% 30,133.35
10 Manhole cover no 17 220.00 0.01 222.20 3777.40 30.00% 4,910.62 11 Manhole lid 17 115.00 0.18 135.93 2310.81 30.00% 3,004.05 12 testing m 1000 5.00 0.00 5.00 5000.00 30.00% 6,500.00 13 Labour man days no 220 65.00 65.00 65.00 14300.00 30.00% 18,590.00 14 Supervision no 16 0.00 120.00 120.00 1920.00 30.00% 2,496.00
Percentage Total 257,542.36 Preliminary & general % 12.00% 288,447.45 Unit Cost to 1m 288.45 Total Cost 288.45 Description Unit Qty Rate Prov. % Prov. Rate Sub Total Profit % Total 5c Cost/m from Municipal supply 250 mm supply
1 Clear & grub m2 2000 1.25 0.00 1.25 2500.00 30.00% 3,250.00 2 Remove topsoil m2 2000 2.35 0.01 2.37 4747.00 30.00% 6,171.10 3 Trench Excavation (machine) m 1000 39.40 0.01 39.79 39794.00 30.00% 51,732.20 4 Bedding & Backfill m3 1105 42.00 0.01 42.42 46874.10 30.00% 60,936.33 5 110 mm PVC sewer pipe m 1000 132.00 0.01 133.32 133320.00 30.00% 173,316.00 6 Concrete to manhole base no 3.4 683.00 0.01 689.83 2345.42 30.00% 3,049.05 7 Concrete to benching no 4.25 683.00 0.01 689.83 2931.78 30.00% 3,811.31 8 Starter ring no 17 350.00 0.01 353.50 6009.50 30.00% 7,812.35 9 1000mm dia x 500 mm m/h ring no 51 450.00 0.01 454.50 23179.50 30.00% 30,133.35
10 Manhole cover no 17 220.00 0.01 222.20 3777.40 30.00% 4,910.62 11 Manhole lid 17 115.00 0.18 135.93 2310.81 30.00% 3,004.05 12 testing m 1000 5.00 0.00 5.00 5000.00 30.00% 6,500.00 13 Labour man days no 220 65.00 65.00 65.00 14300.00 30.00% 18,590.00 14 Supervision no 16 120.00 120.00 120.00 1920.00 30.00% 2,496.00
Percentage Total 375,712.36 Preliminary & general % 12.00% 420,797.85 Total Cost 420.80
6 Bus Shelters 6a Bus Shelters for bus ranks
1 Bus Shelter m2 1 1,450.00 0.01 1,464.50 1464.50 30.00% 1,903.85 Percentage Total 1,903.85 Preliminary & general % 12.00% 2,132.31 Total Cost 2,132.31
6 Bus Shelters

6b Bus Shelters for streets
1 Bus Shelter for streets m2 1 1,450.00 0.01 1,464.50 1464.50 30.00% 1,903.85 Percentage Total 1,903.85 Preliminary & general % 12.00% 2,132.31 Total Cost 2,132.31
7 Taxi Ranks 7a Paved Sidewalks
1 Paved Sidewalks m2 1 105.00 0.01 106.05 106.05 30.00% 137.87 Percentage Total 137.87 Preliminary & general % 12.00% 154.41 Total Cost 154.41
7 Taxi Ranks 7b Unpaved Sidewalks
1 Gravel sidewalks m2 1 65.00 0.01 65.65 65.65 30.00% 85.35 Percentage Total 85.35 Preliminary & general % 12.00% 95.59 Total Cost 95.59
8 Disaster Management Facilities 8a Offices for staff
1 Offices for staff m2 1 2,700.00 0.01 2,727.00 2727.00 30.00% 3,545.10 Percentage Total 3,545.10 Preliminary & general % 12.00% 3,970.51 Total Cost 3,970.51 8a Small Conference room
1 Small conference room m2 1 2,650.00 0.01 2,676.50 2676.50 30.00% 3,479.45 Percentage Total 3,479.45 Preliminary & general % 12.00% 3,896.98 Total Cost 3,896.98 8a Ablution Facilities
1 Ablution Facilities m2 1 2,900.00 0.01 2,929.00 2929.00 30.00% 3,807.70 Percentage Total 3,807.70 Preliminary & general % 12.00% 4,264.62 Total Cost 4,264.62 8a Small Kitchen
1 Small Kitchen m m2 1 3,150.00 0.01 3,181.50 3181.50 30.00% 4,135.95 Percentage Total 4,135.95 Preliminary & general % 12.00% 4,632.26 Total Cost 4,632.26
9 Health Services 9a Car parking bay
1 Car parking bay Unit 1 5,100.00 0.01 5,151.00 5151.00 30.00% 6,696.30 Percentage Total 6,696.30 Preliminary & general % 12.00% 7,499.86 Total Cost 7,499.86 9b Main Entrance

1 Main Entrance m2 1 4,500.00 0.01 4,545.00 4545.00 30.00% 5,908.50
Percentage Total 5,908.50 Preliminary & general % 12.00% 6,617.52 Total Cost 6,617.52 9c Reception
1 Reception m2 1 4,500.00 0.01 4,545.00 4545.00 30.00% 5,908.50 Percentage Total 5,908.50 Preliminary & general % 12.00% 6,617.52 Total Cost 6,617.52 9d Record storage
1 Record storage m2 1 4,500.00 0.01 4,545.00 4545.00 30.00% 5,908.50 Percentage Total 5,908.50 Preliminary & general % 12.00% 6,617.52 Total Cost 6,617.52 9e Administration
1 Administration m2 1 4,500.00 0.01 4,545.00 4545.00 30.00% 5,908.50 Percentage Total 5,908.50 Preliminary & general % 12.00% 6,617.52 Total Cost 6,617.52 9f Waiting Areas
1 Waiting Areas m2 1 4,500.00 0.01 4,545.00 4545.00 30.00% 5,908.50 Percentage Total 5,908.50 Preliminary & general % 12.00% 6,617.52 Total Cost 6,617.52 9g Consulting rooms
1 Consulting rooms m2 1 4,500.00 0.01 4,545.00 4545.00 30.00% 5,908.50 Percentage Total 5,908.50 Preliminary & general % 12.00% 6,617.52 Total Cost 6,617.52 9h Treatment rooms
1 Treatment rooms m2 1 4,500.00 0.01 4,545.00 4545.00 30.00% 5,908.50 Percentage Total 5,908.50 Preliminary & general % 12.00% 6,617.52 Total Cost 6,617.52
10 Multi Purpose Center/ Facilities
10a Facility (400/600 m2) seating 1200-2500
1 Facility (400/600 m2) seating 1200-2500 Unit 1 2,900,000.00 0.01 2,929,000.00 2929000.00 30.00% 3,807,700.00
Percentage Total 3,807,700.00 Preliminary & general % 12.00% 4,264,624.00 Total Cost 4,264,624.00 10b Outdoor
1 Outdoor Unit 1 2,000,000.00 0.01 2,020,000.00 2020000.00 30.00% 2,626,000.00 Percentage Total 2,626,000.00 Preliminary & general % 12.00% 2,941,120.00 Total Cost 2,941,120.00 10c Hall
1 Outdoor Unit 1 2,500,000.00 0.01 2,525,000.00 2525000.00 30.00% 3,282,500.00

Percentage Total 3,282,500.00 Preliminary & general % 12.00% 3,676,400.00 Total Cost 3,676,400.00 10d Sports and recreation hall
1 Outdoor Unit 1 3,600,000.00 0.01 3,636,000.00 3636000.00 30.00% 4,726,800.00 Percentage Total 4,726,800.00 Preliminary & general % 12.00% 5,294,016.00 Total Cost 5,294,016.00
11 Multi Purpose Community Center
10a Offices for all service providers (12m2)
1 Offices for all service providers (12m2) m2 1 4,500.00 0.01 4,545.00 4545.00 30.00% 5,908.50
Percentage Total 5,908.50 Preliminary & general % 12.00% 6,617.52 Total Cost 6,617.52 11b A community hall/ sports complex.
1 A community hall/ sports complex. Unit 1 5,400,000.00 0.01 5,454,000.00 5454000.00 30.00% 7,090,200.00 Percentage Total 7,090,200.00 Preliminary & general % 12.00% 7,941,024.00 Total Cost 7,941,024.00 11c Reception area with general service counter
1 Reception area with general service counter Unit 1 108,000.00 0.01 109,080.00 109080.00 30.00% 141,804.00
Percentage Total 141,804.00 Preliminary & general % 12.00% 158,820.48 Total Cost 158,820.48 11d A furnished sheltered waiting room for clients
1 A furnished sheltered waiting room for clients Unit 1 102,000.00 0.01 103,020.00 103020.00 30.00% 133,926.00
Percentage Total 133,926.00 Preliminary & general % 12.00% 149,997.12 Total Cost 149,997.12 11e Center managers office
1 Center managers office Unit 1 112,500.00 0.01 113,625.00 113625.00 30.00% 147,712.50 Percentage Total 147,712.50 Preliminary & general % 12.00% 165,438.00 Total Cost 165,438.00 11f Furnished telecommunication/computer center
1 Furnished telecommunication/ computer center Unit 1 750,000.00 0.01 757,500.00 757500.00 30.00% 984,750.00
Percentage Total 984,750.00 Preliminary & general % 12.00% 1,102,920.00 Total Cost 1,102,920.00 11g Boardroom for Mcpc stakeholders meetings
1 Boardroom for Mcpc stakeholders meetings Unit 1 500,000.00 0.01 505,000.00 505000.00 30.00% 656,500.00
Percentage Total 656,500.00 Preliminary & general % 12.00% 735,280.00 Total Cost 735,280.00

11h Parking area paved (600 m2)
1 Parking area paved (600 m2) Unit 1 150,000.00 0.01 151,500.00 151500.00 30.00% 196,950.00 Percentage Total 196,950.00 Preliminary & general % 12.00% 220,584.00 Total Cost 220,584.00
12 Parks and open spaces 12a Earthworks per ha
1 Earthworks per ha ha 1 35,000.00 0.01 35,350.00 35350.00 30.00% 45,955.00 Percentage Total 45,955.00 Preliminary & general % 12.00% 51,469.60 Total Cost 51,469.60 12b Grassing per m2
1 Grassing per m2 m2 1 16.00 0.01 16.16 16.16 30.00% 21.01 Percentage Total 21.01 Preliminary & general % 12.00% 23.53 Total Cost 23.53 12c Irrigation per ha
1 Irrigation per ha ha 1 150,000.00 0.01 151,500.00 151500.00 30.00% 196,950.00 Percentage Total 196,950.00 Preliminary & general % 12.00% 220,584.00 Total Cost 220,584.00 12d Ablution facility m2
1 Ablution facility m2 m2 1 4,500.00 0.01 4,545.00 4545.00 30.00% 5,908.50 Percentage Total 5,908.50 Preliminary & general % 12.00% 6,617.52 Total Cost 6,617.52 12e Fencing (1.8m high concrete palisade fencing/m)
1 Fencing (1.8m high concrete palisade fencing/m) ha 1 450.00 0.01 454.50 454.50 30.00% 590.85
Percentage Total 590.85 Preliminary & general % 12.00% 661.75 Total Cost 661.75
13 Cemeteries 13a Basic level of service
1 Basic level of service Unit 1 1,050,000.00 0.01 1,060,500.00 1060500.00 30.00% 1,378,650.00 Percentage Total 1,378,650.00 Preliminary & general % 12.00% 1,544,088.00 Total Cost 1,544,088.00 13b Higher level of service
1 Higher level of service Unit 1 2,400,000.00 0.01 2,424,000.00 2424000.00 30.00% 3,151,200.00 Percentage Total 3,151,200.00 Preliminary & general % 12.00% 3,529,344.00 Total Cost 3,529,344.00 13c Intermediate level of service Regional cemetery
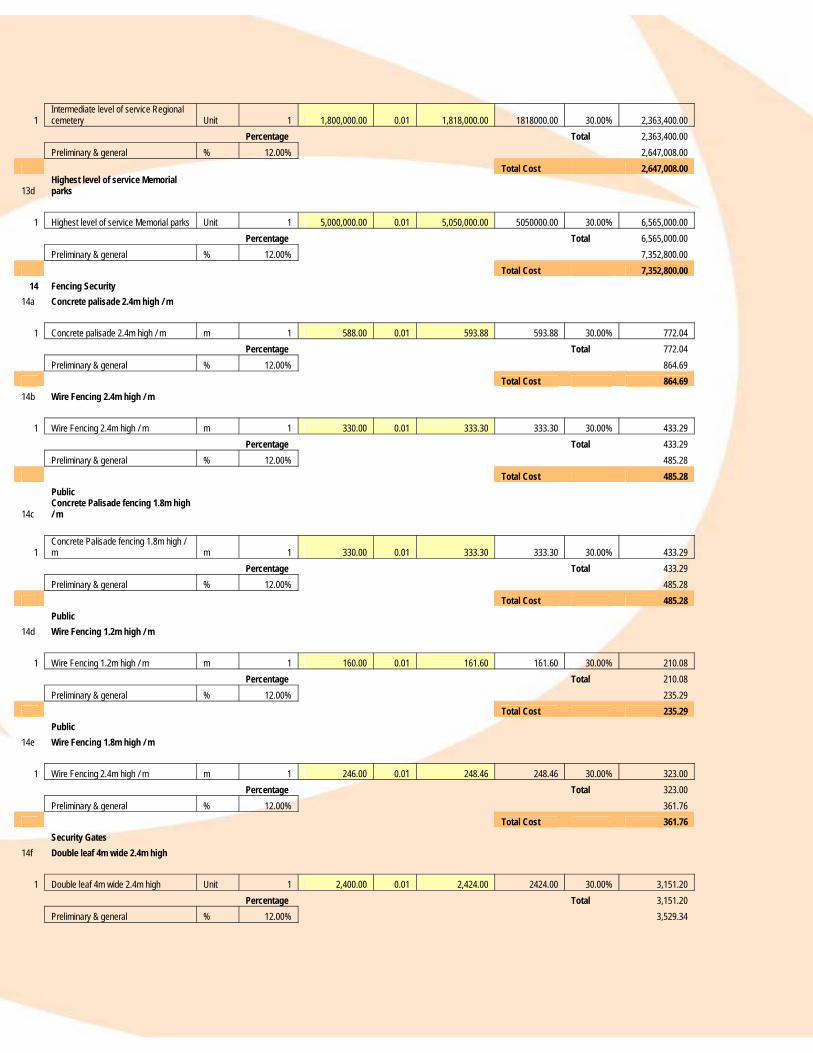
1 Intermediate level of service Regional cemetery Unit 1 1,800,000.00 0.01 1,818,000.00 1818000.00 30.00% 2,363,400.00
Percentage Total 2,363,400.00 Preliminary & general % 12.00% 2,647,008.00 Total Cost 2,647,008.00
13d Highest level of service Memorial parks
1 Highest level of service Memorial parks Unit 1 5,000,000.00 0.01 5,050,000.00 5050000.00 30.00% 6,565,000.00
Percentage Total 6,565,000.00 Preliminary & general % 12.00% 7,352,800.00 Total Cost 7,352,800.00
14 Fencing Security 14a Concrete palisade 2.4m high / m
1 Concrete palisade 2.4m high / m m 1 588.00 0.01 593.88 593.88 30.00% 772.04 Percentage Total 772.04 Preliminary & general % 12.00% 864.69 Total Cost 864.69 14b Wire Fencing 2.4m high / m
1 Wire Fencing 2.4m high / m m 1 330.00 0.01 333.30 333.30 30.00% 433.29 Percentage Total 433.29 Preliminary & general % 12.00% 485.28 Total Cost 485.28 Public
14c Concrete Palisade fencing 1.8m high / m
1 Concrete Palisade fencing 1.8m high / m m 1 330.00 0.01 333.30 333.30 30.00% 433.29
Percentage Total 433.29 Preliminary & general % 12.00% 485.28 Total Cost 485.28 Public 14d Wire Fencing 1.2m high / m
1 Wire Fencing 1.2m high / m m 1 160.00 0.01 161.60 161.60 30.00% 210.08 Percentage Total 210.08 Preliminary & general % 12.00% 235.29 Total Cost 235.29 Public 14e Wire Fencing 1.8m high / m
1 Wire Fencing 2.4m high / m m 1 246.00 0.01 248.46 248.46 30.00% 323.00 Percentage Total 323.00 Preliminary & general % 12.00% 361.76 Total Cost 361.76 Security Gates 14f Double leaf 4m wide 2.4m high
1 Double leaf 4m wide 2.4m high Unit 1 2,400.00 0.01 2,424.00 2424.00 30.00% 3,151.20 Percentage Total 3,151.20 Preliminary & general % 12.00% 3,529.34

Total Cost 3,529.34 Security Gates 14g Double leaf 6m wide
1 Double leaf 6m wide Unit 1 3,200.00 0.01 3,232.00 3232.00 30.00% 4,201.60 Percentage Total 4,201.60 Preliminary & general % 12.00% 4,705.79 Total Cost 4,705.79 Security Gates 14g Single pedestrian 1,0m wide
1 Single pedestrian 1,0m wide Unit 1 1,115.00 0.01 1,126.15 1126.15 30.00% 1,464.00 Percentage Total 1,464.00 Preliminary & general % 12.00% 1,639.67 Total Cost 1,639.67
15 Libraries
1 Libraries m2 m2 1 6,000.00 0.01 6,060.00 6060.00 30.00% 7,878.00 Percentage Total 7,878.00 Preliminary & general % 12.00% 8,823.36 Total Cost 8,823.36
16 Solid waste disposal 16a Landfill Maximum Communal <25
1 Communal<25 Unit 1 2,000,000.00 0.01 2,020,000.00 2020000.00 30.00% 2,626,000.00 Percentage Total 2,626,000.00 Preliminary & general % 12.00% 2,941,120.00 Total Cost 2,941,120.00 16b Small
1 Landfill Maximum Small >25<150 Unit 1 3,000,000.00 0.01 3,030,000.00 3030000.00 30.00% 3,939,000.00 Percentage Total 3,939,000.00 Preliminary & general % 12.00% 4,411,680.00 Total Cost 4,411,680.00 16c Medium
1 Landfill Maximum Medium >150<500 Unit 1 14,000,000.00 0.01 14,140,000.00 14140000.00 30.00% 18,382,000.00 Percentage Total 18,382,000.00 Preliminary & general % 12.00% 20,587,840.00 Total Cost 20,587,840.00 16d Large
1 Landfill Maximum Small >500 Unit 1 24,000,000.00 0.01 24,240,000.00 24240000.00 30.00% 31,512,000.00 Percentage Total 31,512,000.00 Preliminary & general % 12.00% 35,293,440.00 Total Cost 35,293,440.00
16 Wastewater Treatment Plant per ML 16a Preliminary
1 Preliminary ML 1 4,000,000.00 0.01 4,040,000.00 4040000.00 30.00% 5,252,000.00 Percentage Total 5,252,000.00 Preliminary & general % 12.00% 5,882,240.00 Total Cost 5,882,240.00

16b Secondary
1 Preliminary ML 1 5,500,000.00 0.01 5,555,000.00 5555000.00 30.00% 7,221,500.00 Percentage Total 7,221,500.00 Preliminary & general % 12.00% 8,088,080.00 Total Cost 8,088,080.00 16c Tertiary
1 Preliminary ML 1 6,000,000.00 0.01 6,060,000.00 6060000.00 30.00% 7,878,000.00 Percentage Total 7,878,000.00 Preliminary & general % 12.00% 8,823,360.00 Total Cost 8,823,360.00
17 Social Institutions and Micro Enterprises local Economic Development
17a Street trading per unit (4m²) & communal ablution
1 Street trading per unit (4m²) & communal ablution Unit 1 5,750.00 0.01 5,807.50 5807.50 30.00% 7,549.75
Percentage Total 7,549.75 Preliminary & general % 12.00% 8,455.72 Total Cost 8,455.72
17b Markets - per unit brick side walls (6m²) & communal ablution
1 Markets - per unit brick side walls (6m²) & communal ablution Unit 1 19,500.00 0.01 19,695.00 19695.00 30.00% 25,603.50
Percentage Total 25,603.50 Preliminary & general % 12.00% 28,675.92 Total Cost 28,675.92
17d Old-age homes per inhabitant (full service)
1 Old-age homes per inhabitant (full service) Unit 1 90,000.00 0.01 90,900.00 90900.00 30.00% 118,170.00
Percentage Total 118,170.00 Preliminary & general % 12.00% 132,350.40 Total Cost 132,350.40 17e Orphanages per orphan
1 Orphanages per orphan Unit 1 90,000.00 0.01 90,900.00 90900.00 30.00% 118,170.00 Percentage Total 118,170.00 Preliminary & general % 12.00% 132,350.40 Total Cost 132,350.40 17f Churches per m² (Main Hall)
1 Churches per m² (Main Hall) m2 1 6,000.00 0.01 6,060.00 6060.00 30.00% 7,878.00 Percentage Total 7,878.00 Preliminary & general % 12.00% 8,823.36 Total Cost 8,823.36 17g Crèches
1 Crèches m2 1 4,500.00 0.01 4,545.00 4545.00 30.00% 5,908.50 Percentage Total 5,908.50 Preliminary & general % 12.00% 6,617.52 Total Cost 6,617.52 Description Unit Qty Rate Prov. % Prov. Rate Sub Total Profit % Total
9 ROADS 9a Unpaved Gravel Rural :- Stormwater separate; not included. Road width 5m Roadbed

1 Clear and Grub m2 28800 3.17 0.02 3.23 93067.14 Incl. in rate 93,067.14 2 Strip and Remove Topsoil m3 4320 21.08 0.02 21.49 92832.27 Incl. in rate 92,832.27 3 Roadbed preparation and Compaction m3 3240 18.97 0.02 19.34 62655.18 Incl. in rate 62,655.18
4 Rectification, treatment of faulty roadbed
m3 650 40.06 0.02 40.84 26544.16 Incl. in rate 26,544.16
5 Cut to Fill m3 1200 31.62 0.02 32.23 38680.11 Incl. in rate 38,680.11
6 Cut to Spoil (Soft,Medium,Hard,Boulders)
m3 3050 63.74 0.02 64.98 198178.50 Incl. in rate 198,178.50
7 Borrow to Fill from off-site sources m3 4600 26.36 0.02 26.87 123608.37 Incl. in rate 123,608.37 Subbase/Gravel Wearing course m3
1 Construct gravel layers ex borrowpit m3 2900 36.90 0.02 37.62 109085.99 Incl. in rate 109,085.99
2 Constr gravel wearing course ex borrowpit
m3 3200 36.90 0.02 37.62 120370.75 Incl. in rate 120,370.75
3 Mixing, Blending materials ex 2 borrowpits
m3 2500 18.99 0.02 19.36 48396.02 Incl. in rate 48,396.02
4 Overhaul m3/km 15250 6.32 0.02 6.44 98249.77 Incl. in rate 98,249.77 5 Remove oversized material m3 250 40.06 0.02 40.84 10209.29 Incl. in rate 10,209.29
Road Signage 1 Supply and erect road signs as needed ea 26 686.42 0.02 699.74 18193.15 Incl. in rate 18,193.15
Labour man days (included in rates) ea 0 0.00 0.00 0.00 Incl. in rate 0.00
Supervision (included in rates and in P&G) ea 0 0.00 0.00 0.00 0.00
Percentage Total 1,040,070.70 Preliminary & General % 15.50% 1,201,281.66 Total Cost 1,201,281.66 Unit Cost to 1 km R 333,689 Description Unit Qty Rate Prov. % Prov. Rate Sub Total Profit % Total
9 ROADS 9b Unpaved Gravel Urban :- Stormwater separate; not included. Road width 5m Roadbed
1 Clear and Grub m2 65000 0.48 0.03 0.50 32278.90 Incl. in rate 32,278.90 2 Strip and Remove Topsoil m3 4065 18.23 0.03 18.86 76667.50 Incl. in rate 76,667.50 3 Roadbed preparation and Compaction m3 4065 14.24 0.03 14.73 59887.28 Incl. in rate 59,887.28
4 Rectification, treatment of faulty roadbed
m3 50 227.86 0.03 235.74 11786.97 Incl. in rate 11,786.97
5 Cut to Fill m3 300 34.18 0.03 35.36 10608.58 Incl. in rate 10,608.58
6 Cut to Spoil (Soft,Medium,Hard,Boulders)
m3 300 28.48 0.03 29.46 8839.45 Incl. in rate 8,839.45
7 Borrow to Fill m3 100 34.18 0.03 35.36 3536.19 Incl. in rate 3,536.19
Subbase/Gravel Wearing course
1 Construct gravel layers ex comm sources
m3 4065 142.41 0.03 147.33 598914.90 Incl. in rate 598,914.90
Verges 1 Trim, shape and roll verges m2 38818 2.85 0.03 2.95 114456.93 Incl. in rate 114,456.93 2 Topsoiling of verge areas m2 38818 2.85 0.03 2.95 114456.93 Incl. in rate 114,456.93
Road Signage 1 Supply and erect road signs as needed ea 20 854.47 0.03 884.02 17680.35 Incl. in rate 17,680.35
Labour man days (included in rates) ea 0 0.00 0.00 0.00 Incl. in rate 0.00
Supervision (included in rates and in P&G) ea 0 0.00 0.00 0.00 0.00
Percentage Total 1,049,113.99 Preliminary & General % 25.50% 1,316,638.05 Total Cost 1,316,638.05 Unit Cost to 1 km R 264,917 Description Unit Qty Rate Prov. % Prov. Rate Sub Total Profit % Total

9 ROADS 9c Paved Chip and Spray Urban :- Stormwater separate; not included. Road width 6m Roadbed
1 Clear and Grub m2 27000 0.48 0.05 0.50 13604.11 Incl. in rate 13,604.11 2 Strip and Remove Topsoil m3 4049 17.94 0.05 18.83 76249.22 Incl. in rate 76,249.22 3 Roadbed preparation and Compaction m3 2110 16.82 0.05 17.66 37254.06 Incl. in rate 37,254.06 4 Cut to Road Fill m3 4159 35.32 0.05 37.08 154196.61 Incl. in rate 154,196.61
5 Cut to Spoil (Soft,Medium,Hard,Boulders)
m3 2428 20.75 0.05 21.78 52884.94 Incl. in rate 52,884.94
6 Construct Selected Layer m3 2110 119.98 0.05 125.94 265739.74 Incl. in rate 265,739.74 Subbase m3
1 Construct Layer material ex comm sources
m3 2110 129.02 0.05 135.43 285762.14 Incl. in rate 285,762.14
Base m3
1 Construct Layer material ex comm sources
m3 1441 181.66 0.05 190.69 274782.13 Incl. in rate 274,782.13
Asphalt Base and Surfacing 1 Prime Coat Bitumen m2 11696 7.66 0.05 8.04 94044.05 Incl. in rate 94,044.05 2 Chip and Spray m2 11696 41.49 0.05 43.55 509384.81 Incl. in rate 509,384.81
Kerbing 1 Edging strips m 83 88.31 0.05 92.70 7694.02 Incl. in rate 7,694.02 2 Kerbing and Channeling straight m 3459 127.16 0.05 133.48 461706.81 Incl. in rate 461,706.81 3 Kerbing and Channeling curves m 478 147.18 0.05 154.49 73848.54 Incl. in rate 73,848.54
Accommodation of Existing Services
1 Constructing of layer works at services m3 472 168.20 0.05 176.56 83336.10 Incl. in rate 83,336.10 Verges
1 Trim, shape and roll verges m2 16621 5.05 0.05 5.30 88107.67 Incl. in rate 88,107.67 2 Topsoiling of verge areas m2 16621 5.05 0.05 5.30 88107.67 Incl. in rate 88,107.67
Road Signage 1 Supply and erect road signs as needed ea 26 841.02 0.05 882.82 22953.29 Incl. in rate 22,953.29 2 Road safety Barriers ea 68 353.23 0.05 370.79 25213.42 Incl. in rate 25,213.42
Labour man days (included in rates) ea 0 0.00 0.00 0.00 Incl. in rate 0.00
Supervision (included in rates and in P&G) ea 0 0.00 0.00 0.00 0.00
Percentage Total 2,614,869.32 Preliminary & General % 25.50% 3,281,661.00 Total Cost 3,281,661.00 Unit Cost to 1 km R 4,207,258 Description Unit Qty Rate Prov. % Prov. Rate Sub Total Profit % Total
9 ROADS 9d Paved Bitumen Premix Urban :- Stormwater separate; not included. Road width 6m Roadbed
1 Clear and Grub m2 27000 0.48 0.05 0.50 13604.11 Incl. in rate 13,604.11 2 Strip and Remove Topsoil m3 4049 17.94 0.05 18.83 76249.22 Incl. in rate 76,249.22 3 Roadbed preparation and Compaction m3 2110 16.82 0.05 17.66 37254.06 Incl. in rate 37,254.06 4 Cut to Road Fill m3 4159 35.32 0.05 37.08 154196.61 Incl. in rate 154,196.61
5 Cut to Spoil (Soft,Medium,Hard,Boulders) m3 2428 20.75 0.05 21.78 52884.94 Incl. in rate 52,884.94
6 Construct Lower Selected Layer m3 2110 114.94 0.05 120.65 254576.81 Incl. in rate 254,576.81 7 Construct Upper Selected Layer m3 2110 119.98 0.05 125.94 265739.74 Incl. in rate 265,739.74
Subbase

1 Construct Layer material ex comm sources m3 2110 129.35 0.05 135.78 286493.05 Incl. in rate 286,493.05
Base
1 Construct Layer material ex comm sources m3 1441 181.66 0.05 190.69 274782.13 Incl. in rate 274,782.13
Asphalt Base and Surfacing 1 Prime Coat Bitumen m2 11696 7.66 0.05 8.04 94044.05 Incl. in rate 94,044.05 2 Bitumen Premix 40 mm m2 11696 49.04 0.05 51.48 602078.36 Incl. in rate 602,078.36
Kerbing 1 Edging strips m 83 88.31 0.05 92.70 7694.02 Incl. in rate 7,694.02 2 Kerbing and Channeling straight m 3459 127.16 0.05 133.48 461706.81 Incl. in rate 461,706.81 3 Kerbing and Channeling curves m 478 147.18 0.05 154.49 73848.54 Incl. in rate 73,848.54
Accommodation of Existing Services
1 Constructing of layer works at services m3 472 168.20 0.05 176.56 83336.10 Incl. in rate 83,336.10 Verges
1 Trim, shape and roll verges m2 16621 5.05 0.05 5.30 88107.67 Incl. in rate 88,107.67 2 Topsoiling of verge areas m2 16621 5.05 0.05 5.30 88107.67 Incl. in rate 88,107.67
Road Signage 1 Supply and erect road signs as needed ea 26 841.02 0.05 882.82 22953.29 Incl. in rate 22,953.29 2 Road safety Barriers ea 68 353.23 0.05 370.79 25213.42 Incl. in rate 25,213.42
Labour man days (included in rates) ea 0 0.00 0.00 0.00 Incl. in rate 0.00
Supervision (included in rates and in P&G) ea 0 0.00 0.00 0.00 0.00
Percentage Total 2,962,870.59 Preliminary & General % 25.50% 3,718,402.59 Total Cost 3,718,402.59 Unit Cost to 1 km R 4,767,183 Description Unit Qty Rate Prov. % Prov. Rate Sub Total Profit % Total
10 STORMWATER
10a Unlined (Rural) :- Excluding Roadworks
Side Drains
1 Clear and Grub m2 14400 3.23 -0.01 3.19 46005.02 Incl. in rate 46,005.02 2 Strip and Remove Topsoil m3 2160 21.73 -0.01 21.49 46425.19 Incl. in rate 46,425.19
3 Cut to Spoil (Soft,Medium,Hard,Boulders)
m3 2700 65.71 -0.01 64.99 175483.15 Incl. in rate 175,483.15
4 Trimming Side Drains to Profile, Compact m 7200 21.73 -0.01 21.49 154750.63 Incl. in rate 154,750.63
5 Construct Mitre Drains where required m 200 43.47 -0.01 43.00 8599.24 Incl. in rate 8,599.24
6 Construct Scour Protection (steep sections) ea 150 353.82 -0.01 349.96 52494.50 Incl. in rate 52,494.50
7 Leveling Verges m 7200 15.00 -0.01 14.84 106822.80 Incl. in rate 106,822.80 Labour man days (included in rates) ea 0 0.00 0.00 0.00 Incl. in rate 0.00
Supervision (included in rates and in P&G) ea 0 0.00 0.00 0.00 0.00
Percentage Total 590,580.53 Preliminary & General % 15.50% 682,120.51 Total Cost 682,120.51 Unit Cost to 1 km R 189,478 Description Unit Qty Rate Prov. % Prov. Rate Sub Total Profit % Total
10 STORMWATER 10b Lined :- Excluding Roadworks Side Drains

1 Clear and Grub m2 14400 3.02 0.06 3.22 46310.37 Incl. in rate 46,310.37 2 Strip and Remove Topsoil m3 2160 20.10 0.06 21.40 46233.70 Incl. in rate 46,233.70
3 Cut to Spoil (Soft,Medium,Hard,Boulders) m3 2700 60.78 0.06 64.72 174756.48 Incl. in rate 174,756.48
4 Trimming Side Drains to Profile, Compact m 7200 20.10 0.06 21.40 154112.33 Incl. in rate 154,112.33
5 Concrete Lining to Side Drains m2 12960 112.21 0.06 119.49 1548621.88 Incl. in rate 1,548,621.88 6 Construct Mitre Drains where required m 200 154.85 0.06 164.90 32979.95 Incl. in rate 32,979.95 7 Leveling Verges m 7200 14.03 0.06 14.94 107571.94 Incl. in rate 107,571.94
Labour man days (included in rates) ea 0 0.00 0.00 0.00 Incl. in rate 0.00
Supervision (included in rates and in P&G) ea 0 0.00 0.00 0.00 0.00
Percentage Total 2,110,586.65 Preliminary & General % 15.50% 2,437,727.58 Total Cost 2,437,727.58 Unit Cost to 1 km R 677,147 Description Unit Qty Rate Prov. % Prov. Rate Sub Total Profit % Total
10 STORMWATER 10c Pipe Culverts :- 600 mm Class 100 D; single pipe (Excluding Roadworks) Trenches for Pipe Culverts
1 Excavate all Material, backfill and compact m 1238 83.83 0.06 89.27 110516.96 Incl. in rate 110,516.96
2 Excavate unsuitable material and spoil m3 20 215.07 0.06 229.03 4580.56 Incl. in rate 4,580.56 Excavation Ancillaries
1 Make up deficiency in backfill material m3 14 191.41 0.06 203.83 2853.66 Incl. in rate 2,853.66 Particular Item
1 Shore excavated Trench m 24 1,016.22 0.06 1,082.17 25972.14 Incl. in rate 25,972.14 Bedding
1 Supply of Bedding ex commercial source m3 1248 169.68 0.06 180.69 225503.91 Incl. in rate 225,503.91
Pipes 1 Supply and Lay Class 100 D m 1367 554.46 0.06 590.44 807137.57 Incl. in rate 807,137.57
Manholes and Catchpits
1 Manholes and catchpits to particular specs ea 28 11,377.36 0.06 12,115.75 339241.02 Incl. in rate 339,241.02
2 Headwalls to Pipe Culverts m2 12 3,015.70 0.06 3,211.42 38537.03 Incl. in rate 38,537.03 Erosion Protection
1 Gabions, Reno Mattress, Stone Pitching
m2 235 270.64 0.06 288.20 67728.07 Incl. in rate 67,728.07
2 Geotextile m2 114 10.16 0.06 10.82 1233.41 Incl. in rate 1,233.41 Labour man days (included in rates) ea 0 0.00 0.00 0.00 Incl. in rate 0.00
Supervision (included in rates and in P&G) ea 0 0.00 0.00 0.00 0.00
Percentage Total 1,623,304.32 Preliminary & General % 25.50% 2,037,246.92 Total Cost 2,037,246.92 Unit Cost to 1 m R 3,223 Description Unit Qty Rate Prov. % Prov. Rate Sub Total Profit % Total
10 STORMWATER 10d Box Culverts :- 1500 x 1500 mm ; single box chute (Excluding Roadworks) Trenches for Box Culverts
1 Excavate all Material, backfill and compact m 9904 101.08 0.06 107.64 1066067.47 Incl. in rate 1,066,067.47
2 Excavate unsuitable material and spoil m3 20 215.07 0.06 229.03 4580.56 Incl. in rate 4,580.56

Excavation Ancillaries 1 Make up deficiency in backfill material m3 14 191.41 0.06 203.83 2853.66 Incl. in rate 2,853.66
Particular Item 1 Shore excavated Trench m 24 1,016.22 0.06 1,082.17 25972.14 Incl. in rate 25,972.14
Bedding 1 Cast Concrete Blinding m3 3120 860.29 0.06 916.12 2858303.20 Incl. in rate 2,858,303.20
Boxes
1 Supply and Place 1500 x 1500 mm Sections m 1367 2,357.39 0.06 2,510.38 3431695.76 Incl. in rate 3,431,695.76
2 Wingwalls to Box Culverts m2 30 3,015.70 0.06 3,211.42 96342.57 Incl. in rate 96,342.57 Erosion Protection
1 Gabions, Reno Mattress, Stone Pitching
m2 587.5 270.64 0.06 288.20 169320.16 Incl. in rate 169,320.16
2 Geotextile m2 114 10.16 0.06 10.82 1233.41 Incl. in rate 1,233.41 Labour man days (included in rates) ea 0 0.00 0.00 0.00 Incl. in rate 0.00
Supervision (included in rates and in P&G) ea 0 0.00 0.00 0.00 0.00
Percentage Total 7,656,368.94 Preliminary & General % 25.50% 9,608,743.02 Total Cost 9,608,743.02 Unit Cost to 1 m R 15,204 Description Unit Qty Rate Prov. % Prov. Rate Sub Total Profit % Total
10 STORMWATER 10e Low Level Stream Crossings :- Excluding Roadworks (6m roadwidth) Accommodation of Traffic
1 Maintain deviations and Accomm Traffic km 0.3 8,415.90 0.06 8,962.09 2688.63 Incl. in rate 2,688.63
Clearing and Grubbing 1 Clear and Grub ha 0.59 21,560.86 0.06 22,960.16 13546.49 Incl. in rate 13,546.49
Prefabricated Culverts 1 Excavate material m3 74 83.58 0.06 89.00 6586.32 Incl. in rate 6,586.32 2 Backfilling with selected material m3 75 120.63 0.06 128.46 9634.42 Incl. in rate 9,634.42 3 Concrete Pipe Culverts m 30 1,995.59 0.06 2,125.10 63753.11 Incl. in rate 63,753.11 4 Portal Rectangular Culverts m 17.08 9,047.09 0.06 9,634.25 164552.92 Incl. in rate 164,552.92 5 Cast In-situ Concrete incl Formwork m3 60 1,653.61 0.06 1,760.93 105655.76 Incl. in rate 105,655.76 6 Concrete Backfill and slab for culvert m3 25 1,960.20 0.06 2,087.42 52185.42 Incl. in rate 52,185.42 7 Reinforcing Steel ton 1.65 18,094.19 0.06 19,268.50 31793.03 Incl. in rate 31,793.03 8 Precast inlets, Manholes, Catchpits ea 8 4,975.90 0.06 5,298.84 42390.69 Incl. in rate 42,390.69 9 Access and Drainage l sum 1 11,221.20 0.06 11,949.46 11949.46 Incl. in rate 11,949.46
Gabions, Reno Mattresses 1 Excavated Trench m3 20 502.62 0.06 535.24 10704.80 Incl. in rate 10,704.80 2 Prepare Bedding for Gabions m2 90 25.14 0.06 26.77 2409.44 Incl. in rate 2,409.44 3 Gabions m3 87 1,507.85 0.06 1,605.71 139696.72 Incl. in rate 139,696.72 4 Geo Textile (Filter Fabric - Bedim) m2 630 30.16 0.06 32.12 20233.95 Incl. in rate 20,233.95
Road Signs Road Signs ea 6 827.56 0.06 881.27 5287.61 Incl. in rate 5,287.61 Testing of Material
1 Test required by the Engineer Prov S 1 18,702.00 0.06 19,915.76 19915.76 Incl. in rate 19,915.76 Labour man days (included in rates) ea 0 0.00 0.00 0.00 Incl. in rate 0.00
Supervision (included in rates and in P&G) ea 0 0.00 0.00 0.00 0.00
Percentage Total 702,984.54 Preliminary & General % 25.50% 882,245.60

Total Cost 882,245.60 Unit Cost to 1 m R 110,281 Description Unit Qty Rate Prov. % Prov. Rate Sub Total Profit % Total
11 BRIDGES 10d River Crossings Trenches for Box Culverts
1 Excavate all Material, backfill and compact m 9904 108.10 0.06 115.12 1140105.79 Incl. in rate 1,140,105.79
2 Excavate unsuitable material and spoil m3 20 230.00 0.00 230.00 4600.00 Incl. in rate 4,600.00 Excavation Ancillaries
1 Make up deficiency in backfill material m3 14 204.70 0.00 204.70 2865.80 Incl. in rate 2,865.80 Particular Item
1 Shore excavated Trench m 24 1,086.75 0.00 1,086.75 26082.00 Incl. in rate 26,082.00 Bedding
1 Cast Concrete Blinding m3 3120 920.00 0.00 920.00 2870400.00 Incl. in rate 2,870,400.00 Boxes
1 Supply and Place 1500 x 1500 mm Sections m 1367 2,521.00 0.00 2,521.00 3446207.00 Incl. in rate 3,446,207.00
2 Wingwalls to Box Culverts m2 30 3,225.00 0.00 3,225.00 96750.00 Incl. in rate 96,750.00 Erosion Protection
1 Gabions, Reno Mattress, Stone Pitching
m2 587.5 289.42 0.00 289.42 170034.25 Incl. in rate 170,034.25
2 Geotextile m2 114 10.87 0.00 10.87 1239.18 Incl. in rate 1,239.18 Labour man days (included in rates) ea 0 0.00 0.00 0.00 Incl. in rate 0.00
Supervision (included in rates and in P&G) ea 0 0.00 0.00 0.00 0.00
Percentage Total 7,758,284.02 Preliminary & General % 25.50% 9,736,646.45 Total Cost 9,736,646.45 Unit Cost to 1 m R 15,406 Description Unit Qty Rate Prov. % Prov. Rate Sub Total Profit % Total
12 STREET AND COMMUNITY LIGHTING
12a Street Lighting :- Excludes Internal Reticulation (Assume it exist) Overhead Network
1 Struts ea 6 966.41 0.05 1,014.44 6086.64 Incl. in rate 6,086.64
2 Install Bundle Conductors and Equipment ea 298 58.99 0.05 61.92 18452.70 Incl. in rate 18,452.70
3 LV Bundle Conductors m 4309 48.28 0.05 50.68 218378.03 Incl. in rate 218,378.03
4 SIMIL IPC connectors to ESKOM Specs ea 664 52.51 0.05 55.12 36599.51 Incl. in rate 36,599.51
5 Termination of Cables/ABC ea 322 6.04 0.05 6.34 2041.54 Incl. in rate 2,041.54 Excavations
1 Trenches and Poles ea 179 89.33 0.05 93.77 16784.78 Incl. in rate 16,784.78 2 Hard Excavation m3 38 491.66 0.05 516.10 19611.63 Incl. in rate 19,611.63
Street Lighting 1 Mark Positions, Supply and erect pole ea 179 410.34 0.05 430.73 77101.37 Incl. in rate 77,101.37
2 LV pole mounted circuit breaker, brackets ea 322 451.09 0.05 473.51 152469.95 Incl. in rate 152,469.95
3 Luminaries ea 322 1,349.66 0.05 1,416.74 456189.67 Incl. in rate 456,189.67 Labour man days (included in rates) ea 0 0.00 0.00 0.00 Incl. in rate 0.00
Supervision (included in rates and in P&G) ea 0 0.00 0.00 0.00 0.00

Percentage Total 1,003,715.82 Preliminary & General % 15.09% 1,155,176.54 Total Cost 1,155,176.54 Unit Cost per Street Light R 6,454 Description Unit Qty Rate Prov. % Prov. Rate Sub Total Profit % Total
12 STREET AND COMMUNITY LIGHTING
12b High Mast Lighting :- Excludes Internal Reticulation (Assume it exist) High Mast
1 Complete incl foundation and Luminaries ea 1 114,986.30 0.05 120,701.12 120701.12 Incl. in rate 120,701.12
2 Labour to construct and erect m/day 565 71.27 0.05 74.81 42268.85 Incl. in rate 42,268.85 Labour man days (included in rates) ea 0 0.00 0.00 0.00 Incl. in rate 0.00
Supervision (included in rates and in P&G) ea 0 0.00 0.00 0.00 0.00
Percentage Total 162,969.97 Preliminary & General % 7.50% 175,192.71 Total Cost 175,192.71 Unit Cost per High Mast R 175,193 Description Unit Qty Rate Prov. % Prov. Rate Sub Total Profit % Total
13 SIDEWALKS 13a Paved Sidewalks Sidewalk Clear and Remove Topsoil m2 9940 5.61 0.05 5.89 58534.84 Incl. in rate 58,534.84 Prepare sidewalk area and compact m2 4970 28.51 0.05 29.93 148736.93 Incl. in rate 148,736.93 Cut to Fill m3 100 32.79 0.05 34.42 3441.97 Incl. in rate 3,441.97 Cut to Spoil m3 100 27.32 0.05 28.68 2867.78 Incl. in rate 2,867.78 Import selected Fill m3 75 136.61 0.05 143.40 10754.96 Incl. in rate 10,754.96 Paving Construct concrete paving (100 mm) m3 497 874.28 0.05 917.73 456112.66 Incl. in rate 456,112.66 Verges Trim, shape adjacent areas m2 4970 5.61 0.05 5.89 29267.42 Incl. in rate 29,267.42 Labour man days (included in rates) ea 0 0.00 0.00 0.00 Incl. in rate 0.00
Supervision (included in rates and in P&G) ea 0 0.00 0.00 0.00 0.00
Percentage Total 709,716.56 Preliminary & General % 25.50% 890,694.28 Total Cost 890,694.28 Unit Cost to 1 m R 179 Description Unit Qty Rate Prov. % Prov. Rate Sub Total Profit % Total
13 SIDEWALKS 13b Unpaved Sidewalks Sidewalk
1 Clear and Remove Topsoil m2 9940 5.61 0.05 5.89 58534.84 Incl. in rate 58,534.84 2 Prepare sidewalk area and compact m2 4970 28.51 0.05 29.93 148736.93 Incl. in rate 148,736.93 3 Cut to Fill m3 100 32.79 0.05 34.42 3441.97 Incl. in rate 3,441.97 4 Cut to Spoil m3 100 27.32 0.05 28.68 2867.78 Incl. in rate 2,867.78 5 Import selected Fill m3 75 136.61 0.05 143.40 10754.96 Incl. in rate 10,754.96
Gravel Wearing course

1 Construct Gravel Layer ex comm sources m3 497 136.61 0.05 143.40 71269.56 Incl. in rate 71,269.56
Verges 1 Trim, shape adjacent areas m2 4970 5.61 0.05 5.89 29267.42 Incl. in rate 29,267.42
Labour man days (included in rates) ea 0 0.00 0.00 0.00 Incl. in rate 0.00
Supervision (included in rates and in P&G) ea 0 0.00 0.00 0.00 0.00
Percentage Total 324,873.46 Preliminary & General % 25.50% 407,716.19 Total Cost 407,716.19 Unit Cost to 1 m R 82

Appendix 7: Costing of Wastewater Package Plants based on hydraulic duty

DAILY HYDRALIC CAPACITY
PRE- DIGESTION BALANCING BIO-
REACTOR CLARIFIER CHLORINE CONTACT
RETAIL PRICE IN S.A.
CIVILS DELIVERY &
INSTALLATION
TOTAL COST
PRICE PER KL
OPERATION & MAINT.
COST (MONTHLY)
OPERATION &
MAINT. COST
/KL/DAY Yes Yes Yes No Yes 27,000 4,100 31,100 13,500 120 2.00 2000L
No No Yes No Yes 18,000 2,700 20,700 9,000 120 2.00 Yes Yes Yes No Yes 63,000 9,500 72,500 10,500 150 0.83 6000L
No No Yes No Yes 45,000 6,800 51,800 8,128 150 0.83 Yes Yes Yes Yes Yes 103,000 15,500 118,500 8,583 200 0.56 No Yes Yes Yes Yes 84,000 12,600 96,600 7,000 200 0.56 No No Yes Yes Yes 71,000 10,700 81,700 5,917 200 0.56 No No Yes No Yes 58,000 8,700 66,700 4,833 200 0.56 Yes Yes Yes No Yes 91,000 13,700 104,700 7,583 200 0.56
12000L
No Yes Yes No Yes 70,000 10,500 80,500 5,833 200 0.56 Yes Yes Yes Yes Yes 171,000 25,700 196,700 7,125 1,375 1.91 No Yes Yes Yes Yes 129,000 19,400 148,400 5,375 1,375 1.91 No No Yes Yes Yes 108,000 16,200 124,200 4,500 1,375 1.91 No No Yes No Yes 96,000 14,400 110,400 4,000 1,375 1.91 Yes Yes Yes No Yes 158,000 23,700 181,700 6,583 1,375 1.91
24000L
No Yes Yes No Yes 117,000 17,600 134,600 4,875 1,375 1.91 Yes Yes Yes Yes Yes 271,000 40,700 311,700 7,528 1,500 1.39 No Yes Yes Yes Yes 205,000 30,800 235,800 5,694 1,500 1.39 No No Yes Yes Yes 169,000 25,400 194,400 4,694 1,500 1.39 No No Yes No Yes 157,000 23,600 180,600 4,361 1,500 1.39 Yes Yes Yes No Yes 259,000 38,900 297,900 7,194 1,500 1.39
36000L
No Yes Yes No Yes 194,000 29,100 223,100 5,389 1,500 1.39 Yes Yes Yes Yes Yes 342,000 51,300 393,300 7,125 1,700 1.18 No Yes Yes Yes Yes 258,000 38,700 296,700 5,375 1,700 1.18 No No Yes Yes Yes 217,000 32,600 249,600 4,521 1,700 1.18 No No Yes No Yes 191,000 28,700 219,700 3,979 1,700 1.18 Yes Yes Yes No Yes 308,000 46,200 354,200 6,417 1,700 1.18
48000L
No Yes Yes No Yes 233,000 35,000 268,000 4,854 1,700 1.18

DAILY HYDRALIC
DUTY
PRE- DIGESTION BALANCING BIO-
REACTOR CLARIFIER CHLORINE CONTACT
RETAIL PRICE IN S.A.
CIVILS DELIVERY &
INSTALLATION
TOTAL COST
PRICE PER KL
OPERATION & MAINT.
COST (MONTHLY)
OPERATION &
MAINT. COST
/KL/DAY Yes Yes Yes Yes Yes 506,000 75,900 581,900 7,028 2,100 0.97 No Yes Yes Yes Yes 382,000 57,300 439,300 5,306 2,100 0.97 No No Yes Yes Yes 320,000 48,000 368,000 4,444 2,100 0.97 No No Yes No Yes 282,000 42,300 324,300 3,917 2,100 0.97 Yes Yes Yes No Yes 469,000 70,400 539,400 6,514 2,100 0.97
72000L
No Yes Yes No Yes 345,000 51,800 396,800 4,792 2,100 0.97 Yes Yes Yes Yes Yes 639,000 95,900 734,900 6,390 2,600 0.87 No Yes Yes Yes Yes 479,000 71,900 550,900 4,790 2,600 0.87 No No Yes Yes Yes 396,000 59,400 455,400 3,960 2,600 0.87 No No Yes No Yes 348,000 52,200 400,200 3,480 2,600 0.87 Yes Yes Yes No Yes 592,000 88,800 680,800 5,920 2,600 0.87
100000L
No Yes Yes No Yes 431,000 64,700 495,700 4,310 2,600 0.87 Yes Yes Yes Yes Yes 2,893,000 434,000 3,327,000 5,786 5,700 0.38 No Yes Yes Yes Yes 2,106,000 315,900 2,421,900 4,212 5,700 0.38 No No Yes Yes Yes 1,743,000 261,500 2,004,500 3,486 5,700 0.38 No No Yes No Yes 1,520,000 228,000 1,748,000 3,040 5,700 0.38 Yes Yes Yes No Yes 2,652,000 397,800 3,049,800 5,304 5,700 0.38
500000L
No Yes Yes No Yes 1,884,000 282,600 2,166,600 3,768 5,700 0.38 Yes Yes Yes Yes Yes 5,135,000 770,300 5,905,300 5,135 10,400 0.35 No Yes Yes Yes Yes 3,752,000 562,800 4,314,800 3,752 10,400 0.35 No No Yes Yes Yes 3,027,000 454,100 3,481,100 3,027 10,400 0.35 No No Yes No Yes 2,711,000 406,700 3,117,700 2,711 10,400 0.35 Yes Yes Yes No Yes 4,734,000 710,100 5,444,100 4,734 10,400 0.35
1ML
No Yes Yes No Yes 3,371,000 505,700 3,876,700 3,371 10,400 0.35

Appendix 8: Costing of Crematorium

ROOM FUNCTION
ROOM SIZE
m2 OCCUPANCY CLASS
DESIGN POPULATION
NO FIRE POPULATION
REQ.
LIGHTING VENTILATION #
ACOUSTICS USERS DESIGN COST (R3500
/ m2)
Memorial Service
20mx25m 500 Worship - A4 1 person/ 1m2 50 30 min Natural 3.5 ltr/ person Yes Public R 1,750,000.00
Memorial Service
10mx15m 150 Worship - A4 1 person/ 1m2 20 30 min Natural 3.5 ltr/ person Yes Public R 525,000.00
Memorial Service
10mx15m 150 Worship - A4 1 person/ 1m2 20 30 min Natural 3.5 ltr/ person Yes Public R 525,000.00
Family Room 5mx5m 25 Exhibition Hall - C1
1 person/ 10m2
5 60 min Natural 5 ltr/ person Yes Public R 87,500.00
Clerical 5mx3m 15 Offices- G1 1 person/15m2 5 30 min Natural 5 ltr/ person Yes Staff R 52,500.00
Sacristy 3mx3m 9 Offices- G1 1 person/15m2 2 30 min Natural 5 ltr/ person Yes Staff R 31,500.00
Sacristy 3mx3m 9 Offices- G1 1 person/ 15m2
2 30 min Natural 5 ltr/ person Yes Staff R 31,500.00
Clerical 3mx3m 9 Offices- G1 1 person/ 15m2
2 30 min Natural 5 ltr/ person Yes Staff R 31,500.00
Circulation 10mx5m 50 Worship - A4 1 person/ 1m2 20 30 min Natural 3.5 ltr/ person Yes Public R 175,000.00
Circulation 10mx10m 100 Worship - A4 1 person/ 1m2 50 Per table 6
30 min Artificial 3.5 ltr/ person Yes Public R 350,000.00
Ablutions 5mx5m 25 Worship - A4 Per table 6 # # Per table 6
30 min Artificial 25 ltr/ person No Public R 87,500.00
Ablutions 5mx5m 25 Worship - A4 Per table 6 #
# 30 min Artificial 25 ltr/ person No Public R 87,500.00
Disposal Room 10mx10m 100 Moderate Risk Industrial- D2
1 person/ 15m2
4 30 min Natural 7.5 ltr/ person No Staff R 350,000.00
Circulation 10mx5m 50 Moderate Risk Industrial- D2
1 person/ 15m2
2 30 min Natural 7.5 ltr/ person No Staff R 175,000.00
Clerical 3mx3m 9 Offices- G1 1 person/ 15m2
2 30 min Natural 7.5 ltr/ person Yes Staff R 31,500.00

ROOM FUNCTION
ROOM SIZE
m2 OCCUPANCY CLASS
DESIGN POPULATION
NO FIRE POPULATION
REQ.
LIGHTING VENTILATION #
ACOUSTICS USERS DESIGN COST (R3500
/ m2)
Storage 6mx2m 12 Moderate Risk Industrial- D2
1 person/ 50m2
1 60 min Artificial 7.5 ltr/ person No Staff R 42,000.00
Medical Doctor 3mx3m 9 Offices- G1 1 person/ 15m2
2 30 min Artificial 5 ltr/ person Yes Staff R 31,500.00
Refinement of Ashes
2mx2m 4 Low Risk Storage- J3
1 person/ 50m2
2 60 min Artificial 5 ltr/ person Yes Staff R 14,000.00
Storage 2mx2m 4 Low Risk Storage- J3
1 person/ 50m2
1 60 min Artificial 1 ltr/ person No Staff R 14,000.00
Storage 2mx2m 4 Low Risk Storage- J3
1 person/ 50m2
1 Per
table 6
60 min Artificial 1 ltr/ person No Staff R 14,000.00
Ablutions 5mx5m 25 Moderate Risk Industrial- D2
Per table 6 # #Per table 6
30 min Artificial 25 ltr/ person No Staff R 87,500.00
Ablutions 5mx5m 25 Moderate Risk Industrial- D2
Per table 6 # # 30 min Artificial 25 ltr/ person No Staff R 87,500.00
Internment of Ashes
30mx30m 900 Low Risk Storage- J3
1 person/ 50m2
20 60 min Natural 5 ltr/ person Yes Staff R 3,150,000.00
Staff Relaxation 10mx5m 50 Entertain & Public
Assembly-A1
1 person/ 1m2 10 30 min Natural 17.5 ltr/ person Yes Staff R 175,000.00
Services 5mx3m 15 Plant Room- D4
1 person/ 50m2
30 min Artificial 1 ltr/ person Yes Staff R 52,500.00
Services 5mx3m 15 Plant Room- D4
1 person/ 50m2
2 30 min Artificial 1 ltr/ person No Staff R 52,500.00
Services 3mx3m 9 Plant Room- D4
1 person/ 50m2
2 30 min Artificial 1 ltr/ person No Staff R 31,500.00
Services 5mx5m 25 Plant Room- D4
1 person/ 50m2
2 30 min Artificial 1 ltr/ person Yes Staff R 87,500.00
Storage 100 Vehicles
Open Parking None None None None None None Staff & Public
R -

Appendix 9:
Discussion Document: Stakeholder involvement and requirements in the Revision of the 2005 “Units Costs and Service Levels: A Guide to Municipalities

DISCUSSION DOCUMENT:
MIG Guideline Review of “Basic Level of Services and Unit Costs”
Comment on the need to review the concepts and components within the MIG Guideline Document :
“Basic Level of Services and Unit Costs: A Guide for Municipalities”
Issued December 2005”
Submitted by dplg Macro-Control Advisory (MIG) 24 November 2006
TABLE OF CONTENTS 1 Introduction..........................................................................................207
1.1 Preabmle.........................................................................................207 1.2 Adequacy and applicability of the current guideline ........................207
1.2.1 The National MIG Management Unit’s (NMMU) .....................207 1.2.2 Current Environment – South Africa .......................................208 1.2.2.1 Level of service ...................................................................209 1.2.2.2 Unit Costs ...........................................................................212
1.3 Proposed action ..............................................................................218 2 Recommended Evaluation Assignment ............................................218
2.1 Delivery 1: Phase 1 ........................................................................219 2.2 Delivery 2: Phase 2 ........................................................................219 2.3 Delivery 3: Phase 3 ........................................................................219
3 Description of the assignment ...........................................................219 3.1 Phase 1 ...........................................................................................220 3.2 Phase 2 ...........................................................................................221 3.3 Phase 3 ...........................................................................................221
4 Reporting and Deliverables ................................................................222 5 Conclusion ...........................................................................................223

1 Introduction 1.1 Preamble Local Government is mandated and responsible for the provision of services to all people within their municipal borders. The level of these services may vary depending on the affordability and appropriateness of these services within the municipal IDP and services plans, but communities should receive at least the basic level of services. A number of services may be provided, of which the most significant services include: • water supply • sanitation • health and multi-purpose community centers • electricity and other energy sources • roads and stormwater drainage • solid waste disposal • cemeteries, etc
With the introduction of the Municipal Infrastructure Grant (MIG), the use of labour intensive methods for certain types of infrastructure has been made mandatory. This is in line with the Expanded Public Works Programme (EPWP), which aims to maximize job creation through government expenditure. The use of labour intensive methods does not affect the level of service choices of services delivered. The Department of Public Works has issued “Guidelines on the implementation of labour intensive infrastructure projects under the EPWP” and municipalities are required to adhere to these guidelines for projects funded through the MIG. When providing services that require infrastructure, municipalities may choose one of several options to meet the service needs of communities in their areas as quickly and effectively as possible. However, there are a number of factors to be considered before this can be done. The overall aim is improved quality of life for all people and communities in South Africa, particularly the poorest, without compromising the ability to operate and maintain existing services. Probably the most important factor is the level at which the service is provided. The term “service level” relates to the way in which the user experiences the service. The choice of service level is dictated by affordability and by community needs. Convenience may be as important to a particular community as health, environmental and economic factors. However, municipalities are responsible for making the final decision about the level of service to be provided. Such decisions have a critical impact on the long-term viability of the particular service and the municipality as a whole. It should be noted that the MIG is only funding up to a basic level of service. If a municipality opts to provide a higher level of service, the community or municipality must provide counter funding for the difference in cost between a basic level of service and the higher level of service opted for. Viability relates largely to the affordability of the service. Municipalities depend largely on the income received from paying consumers (customers) and this must be sufficient to cover the cost of providing the service. Higher levels of service are generally associated with higher costs, which imply a higher cost to the consumer. In such cases where higher levels of service are not affordable, the ability of a municipality to recover its costs via revenue collection is negatively affected, and will subsequently threaten the financial sustainability and viability of the municipality.”1 In order to assist municipalities (including metropolitan areas and district councils) to apply for Municipal Infrastructure Grant (MIG) funds, the Department of Provincial and Local Government’s Municipal Infrastructure Grant Unit issued a guideline document in December 2005. The document, “The Municipal Infrastructure Grant: Basic Level of Service and Unit Cost - A Guide for Municipalities, December 2005”, provides guidance for municipalities regarding the selection of service levels for basic services, aw well as the associated unit costs. 1.2 Adequacy and applicability of the current guideline 1.2.1 The National MIG Management Unit’s (NMMU)

The main purpose of the guideline document was to provide guidance for municipalities regarding the selection of service levels for basic services. It provides only an outline of the issues concerned, while municipalities still have to consider and decide on the best and most appropriate solution (infrastructure) for its local circumstances. Subsequently, this document also acts as the base comparison document for the National MIG Management Unit’s (NMMU) assessment of the Project Registration Forms (PRF). Since the Guideline’s implementation, concern has been expressed by Municipalities as well as NMMU, that the guideline document and the unit cost values reflected therein, are too static and do not reflect regional market factors and local economic trends. Similarly follows summaries of documented problems experienced, proposed solutions and strategic recommendations. With reference to an extract from the MIG Macro Control Report dated (12 July 2006): • PRFs and business planning are not aligned with the Dec 2005 unit cost guidelines (one of the established
findings)
With reference to an extract from the MIG Macro Control Report (12 July 2006) a long term strategy was recommended as follows: • Update unit costs to reflect realistic and current costs per Province, and calculate a national average for each
level of unit of infrastructure services
With reference to selected extracts from the close-out report for the dplg MIG Support Training (conducted 1-2 October 2006): • Unit cost and service levels and standardized policy or guidelines or guidelines for Roads and Stormwater
was identified as one of critical areas leading to a confusion with MIG practitioners: • General Level of Service (LOS) “unit cost” problems (a documented parking lot issue):
o Currently fixed per province whereas it needs demonstrates variability per province o Need to develop formalized procedures and accountability – determining who has final say in regard to
specific LOS o How and who effects /ensures compliance o Need for “Acceptability” of range of costs, based on motivation o To be updated regularly
• “Upgrading” from basic LOS (a documented parking lot issue): o What happens after basic LOS has been achieved – what is envisaged in terms of the MIG programme
(post-BLOS) • “O&M” sustainability (a documented parking lot issue):
o Capacity of municipalities & communities to deal/cope with such which impacts on the LOS selected and costs
• Specific documented group work outputs:
CHALLENGES/ PROBLEMS/ CONTRAINTS PROPOSED/ SUGGESTED SOLUTIONS/ ACTIONSAssessing PRFS
Unit cost not uniform, especially on roads Reviewed as per province ASAP Always involve the Sector Departments
Understanding Processes Inconsistencies in the application of unit costs as ra
in different provinces. Unit costs are not standardizeproperly documented
Review and publish standardized unit costs biannually A common framework should be used by all officials in ap
unit costs when registering projects Exemptions in applicable unit costs should be clarified
In summary, the following major concerns were raised by the end-users: • Adequacy and applicability of the existing levels of service and the unit costs for the various infrastructure
sub-categories, especially roads and stormwater sub-category, as contained in the current guidelines • Lack of process and procedure in the use of, and in the periodic review and update of, the current guidelines
1.2.2 Current Environment – South Africa Since the problems associated with the adequacy and applicability of the guideline levels of service and unit costs are quite predominant for the Basic Residential Services: Roads and Stormwater sub-category, it will used as an example to further highlight the current problems, and for the purpose of motivating further action.

To assist with the above it is necessary to understand the process and potential impacts effecting levels of service and unit costs. As such there are a number of components which will give effect to the rationale of the current guidelines requiring revision, they are: • Selection of Level of Service • Unit Cost:
o Determining / calculation factors o Direct and indirect factors impacting on unit costs o Economic trends
Each of the components is discussed in greater detail below.
1.2.2.1 Level of service
The project selection criteria used by municipalities in terms of determining the best option (level of service) are: • community acceptance, • affordability, and • funding alternatives for providing a higher level of service other than the basic level of service
An improved guidelines document would allow the municipality to use it as an enabling tool to assist them in making informed decisions. There is currently no policy document that defines a basic level of service for roads and so the MIIF requirement of “all weather access to within 500m of the dwelling” takes precedence, despite the fact that the applicability of the requirement may not be attainable in rural areas with scattered settlements where the MIG funding may be most applicable in terms of the infrastructural backlogs. At a cursory glance, there appears to be insufficient coverage in the guidelines given to the: • scope of the design options/choices for any given project as this could assist with giving clearer definition of
the different levels of service; and • technical description of each of the design options for each level of service
Road construction is by size and nature a large and complex undertaking, and is impacted on by a variable range of factors that have to be taken into consideration. Table 1 provides an example of the broad range of design options and the levels of service that can be anticipated.

Table 1: New Road - Local Distributors and Access Collectors
Road & Stormwater design options
Stormwater options
Layer work options (broad) Pavement layer & width options
Level of Service
EPWP: LIC Potential Context/ Locality Open drains/ channels Culverts
Subsurface piping/ kerbs & catch pits
Sub-base and/or base Earth
natural (in-situ) or stabilized (in-situ) Not "basic" LOS Good Remote Rural Unlined (earth) Pipes (600mm) n/a
Natural Good Modified/stabilized
(cement) Poor Gravel (4,5-6m)
Modified/stabilized (lime)
Basic
Poor/Fair
Rural Unlined (earth or grass) or Lined (stone-pitched) Pipes (600mm) n/a
Stone (crusher run) Not practical Stone (traditional macadam) Good
Emulsion treated Good
Foam Bitumen Good
Interlocking block Good
Concrete (thin reinforced) Fair Macadam (dry sand bound) Good
Macadam (water bound) Good
Macadam (slurry bound) Good
Narrow paved width (+3m)
Concrete (reinforced)
Basic to Intermediate
Not practical
Rural/ Peri-Urban Lined (stone-pitched, grass blocks, hyson
cells, concrete)
Pipes (up to 600mm), Prefabricated box
culverts (block and/or concrete)
Lined open channels to act as an edge restraint, subsoil drains &
catch pits
Stone (crusher run) Stone (traditional macadam)
Emulsion treated Foam Bitumen Interlocking block Concrete (thin reinforced) Macadam (dry sand bound)
Macadam (water bound) Macadam (slurry bound)
Base and/or surfacing
Full paved width (4,5-6m)
Concrete (reinforced)
Intermediate to Full
As with narrow paved width Peri-Urban Lined (grass blocks,
hyson cells, concrete)
Pipes (up to 600mm), Prefabricated box
culverts (brick/block and/or concrete)
Lined open channels to act as an edge restraint, subsoil drains &
catch pits
Otta seal Good
Sand seal Good
Single seal Fair
Bituminous surfacing
Narrow tarred width (+3m)
Double seal
Intermediate to Full
Fair
Peri-Urban/ Urban n/a Pipes (up to 600mm), Prefabricated box
culverts (brick and/or concrete)
Underground pipes/ concrete kerbs & manholes

Koffiemoer (hot slurry) Good
Cape seal Fair
Hot premixed asphalt (continuous graded)
Not practical
Hot premixed asphalt (gap graded)
Not practical
Otta seal Sand seal Single seal Double seal Koffiemoer (hot slurry) Cape seal
Hot premixed asphalt (continuous graded)
Full tarred width (4,5-6m)
Hot premixed asphalt (gap graded)
Full As with narrow tarred width Urban n/a
Pipes (up to 600mm), Prefabricated box
culverts (brick and/or concrete)
Underground pipes/ concrete kerbs & manholes

1.2.2.2 Unit Costs Establishing a Unit Cost
In understanding the basis of the ‘unit cost’ , it is key to understand the process of how it is to be derived (bottom-up approach), and the importance of keeping a record of the project baseline information on completion of each project for the purpose of periodically updating the unit costs:
a) For a chosen project (LOS: road option), a tender document is compiled. The Bill of Quantities in the tender document is used as the basis to calculate the tender price. The tender prices will vary for each submission despite all working with the same project baseline information. An acceptable range of tender prices will be considered (above or below what may be deemed the ‘correct’ price – if known). The tender awarded will become the contract price for the project.
b) The planned total project cost (including VAT) = Contract price…
[Contractors P&G costs, work item Amounts established using Unit Rates (labour, materials, plant/ equipment/tools, fuel/diesel, training, overheads and profit/mark-up), and Contingency]
+ Professional fees
+ Premium (EPWP – if any)
c) The actual total project cost will be determined on completion of the project. Project Unit Cost = Actual total project cost divided by the total length of the road and/or stormwater option
d) The project Unit Cost and the related project baseline information should be placed on municipalities project MIS database
e) The accumulated project baseline information should be used as the basis to establish a trend, and hence would be used to establish an “acceptable range” of unit costs per Province where: Provincial Unit Cost (lower ceiling) = Project Unit Cost (lower ceiling) Provincial Unit Cost (upper ceiling) = Project Unit Cost (upper ceiling) The municipalities and the NMU should prefer the Provincial Unit Cost as the guideline to work with.
f) Should there not be sufficient project baseline information to establish the Provincial Unit Costs (lower and upper ceiling) then there would be recourse to establish an “acceptable range” of unit costs at National level where: National Unit Cost (lower ceiling) = Project Unit Cost (lower ceiling) National Unit Cost (upper ceiling) = Project Unit Cost (upper ceiling)
g) The National Unit Cost (weighted average) should be established and used for budgetary purposes only, or used as a last resort where there is still wholly insufficient or available or accessible project baseline information to work with as indicated in e) and f) above.
The process in establishing the Unit Costs above has been based on the construction of new road infrastructure only, and the established of Unit Costs for rehabilitated or upgraded road infrastructure would have to be considered separately. Factors Impact on Unit Costs The next step is to understand and appreciate the myriad of potential factors that would impact on the Unit Costs (directly and indirectly). See Table 2 below identifies some of the most obvious factors that need to be taken into account.

Table 2 – Potential Factors Affecting the Unit Costs (directly and indirectly)
Item
Factors Affecting the Unit Costs
1 Construction of (MIG funding for basic and/or intermediate level of service): o New road o Rehabilitation of an existing road and/or the associated stormwater provisions (no plan and budget in place for, or little consideration given to, the maintenance of the asset over its design
life) o Upgrading of an existing road and/or the associated stormwater provision/s (for same level of service or for a higher level of service)
2 Sustainability (Municipality funding): o Physical asset - maintenance plan and budget allocation over its design life o Viability of the chosen design option o Funding options/ alternatives o Local socio-economic benefit/s
3 Socio-economic factors: o Infrastructural needs and backlogs o Levels of unemployment and poverty o Existence of local skills o Existence of local businesses (e.g. manufacturers, suppliers, small emerging and sub/specialist contractors, etc.) o Absorptive capacity of local institutions and low-capacity municipalities
Topography Physical features such as: Terrain (slope) – ranging from flat to mountainous and/or combinations thereof – vertical alignment considerations Existing physical features, e.g. natural, infrastructure Route selection & horizontal alignment considerations
Geology and Geotechnical
considerations
Soil characteristics: Soil types – cohesive & non-cohesive Soil conditions – soft to hard, rock Borrow pit/s & spoil/dump/disposal site/s Local/ in-situ materials
Hydrology Drainage characteristics, i.e. sub-surface & surface
Drainage and stormwater requirements Water sources and types of low level water crossings/ bridges
Context/ Locality Accessibility to site – Rural (remoteness) or Urban (built environment)
Working space Security Availability and accessibility of local resources (resource audit) Climate - rain, dust (dry, wind), season (hot, cold)
4 Site
Environment Environmental considerations: Erosion control and rehabilitation measures Borrow pit/s & spoil/dump/disposal site/s

Ecologically sensitive areas/s, traditional site/s, historical zones Protection of water, soils and vegetation
Labour Local audit - availability of local people (unskilled to skilled), local sub-Contractors, and small emerging Contractors
Distance to travel to site, transportation requirements Training requirements (including for EPWP) Task/ production rates for LIC work items Wage schedule 2006-2009 – Civil Engineering Industry Minimum Wage Rates for rural and urban context [Source: SAFCEC] – across the board
annual increases of 8% commencing 1st Monday in September 2006 [See Table 3] Wage rate (unskilled/semi-skilled) for LIC work on EPWP projects – varies anywhere between government gazette and the Industry’s minimum
wage rates respectively – also varies per Province and whether in rural or urban context
Plant, equipment & tools
Contractors investment Local audit – availability and accessibility (local and commercial) Hire rates, repairs, fuel/ diesel, standing time Specialized requirements
Materials Local audit - availability, accessibility and testing of materials with due consideration given to environmental considerations
Water availability and requirements Local and commercial sources and Suppliers Specialized material requirements Ability to deliver timeously
5 Resources
Contract Price Adjustment [Source: SAFCEC]
Contract price adjustment/s (only where provided for in the Contract Data) using the Contract Price Adjustment Formula (CPAF) and following its conditions as set out in the Contract Price Adjustment Schedule in GCC 2004
Rate and price adjustments can occur during the contract, it can occur before the contract commences, and it can be used as a useful tool to forecast trends and update the unit rates and unit costs
Labour, Plant, Materials and Fuel Labour indices for CPAF (extracts from CPI and PPI, STATSSA) - varies per province on a monthly basis per annum; Labour index uses a National weighted average [See Table 4]
Labour, Plant, Materials and Fuel coefficients for CPAF for Works of Civil Engineering (basic guideline) – depends on specific requirements and variations in the different types of contract [See Table 5]
Not applicable for fixed price contracts (up to 12 month duration) Fixed price contracts not permitted where contract period > 12 month contract period & exceeds R10 million in value
6 Management System:
Type of contract - delivery model/ implementation approach/ contractual arrangement
7 Design options/ alternatives and costing considerations (new infrastructure only): Design characteristics and criteria (traffic volume and accommodation, geometrics, pavement options, stormwater and drainage options, appurtenant works options, inter alia) Sustainability over its design life Socio-economic benefits Stand alone infrastructure option or part of a package of services (e.g. housing project, development programme in a ISRDP or URP nodal areas) Choice of service level (affordability, community needs and acceptance) Contract duration and cost trade-off (depending on imposed budget and project constraints)

Economic Trend Factors Finally, an understand and appreciation are required of the indicators that are currently impacting on the position of the construction industry (building and civil sectors) in the national economy - which will again have a critical impact on the final cost of any construction related undertaking and as such on the relevance and applicability of guideline unit cost and levels of service. These factors are as follows [Source: SAFCEC 3rd quarter report 2006]:
Sustained GDP growth at +4% per annum in all sectors of the economy according to SARB An anticipated boom in infrastructure spending expected in coming quarters Growth in residential construction activities by + 20% Confidence levels remain high with annual growth totaling + 30%, despite inflationary pressures
(depreciating exchange rate, volatile oil prices, rising food prices, high levels of consumer spending). These pressures will result in rising interest rates that will have some negative impact on the growing capacity utilization in the domestic economy. Optimism in the sector is founded on the political will of the government to stimulate higher economic growth through increased investment in infrastructure
The value of contract awards have increased by 17% in real terms Average annual employment increased by 20% Civil engineering turnover increased 12% in real terms The Baxter contract price adjustment formula (CPAF) reflects an annual inflation of + 8% in the composite
price index (CPI and PPI) and all four indices (materials, labour, fuel, and plant) have been forecasted to escalate in December 2006 and beyond. Table 3 below clearly shows the growth trend.
Table 3: Forecast Indices
Similarly the forecasted wage schedule in Table 4 indicates consistent growth projections for the next couple of years

Table 4: Wage Schedule 2006 - 2009
Civil Engineering Industry Minimum Wage Rates, per Hour, March 2006 to March 2009 TASK Grade Occupational Group March
2006 March 2007 March 2008 March 2009
Task Grade 1 / Paterson A1
General Worker R10.27 R11.09 12.48 R14.00
Task Grade 1 / Artisan Aid Paterson A2 Construction Hand Grade IV Operator Grade V Checker Chainman
R10.40 R11.23 R12.58 R14.40
Task Grade 3 / Construction Hand Grade III Patterson A3 Operator Grade IV Site Support
R11.00 R11.88 R13.31 R14.80
Task Grade 4 / Construction Hand Grade II Patterson B1 Operator Grade III Driver Grade II Site Support
R11.56 R12.48 R13.86 R15.30
Task Grade 5 / Construction Hand Grade 1 Patterson B2 Operator Grade II Driver Grade I Site Support
R13.87 R14.98 R16.63 R18.30
Task Grade 6 /Patterson B3
Operator Grade I R16.18 R17.47 R18.87 R20.80
Task Grade 7/ Patterson B4
R19.01 R20.53 R22.07 R23.80
Task Grade 8 /Patterson B5
R21.38 R23.09 R24.82 R26.70
Task Grade 9 /Patterson C1
Artisan R24.27 R26.21 R28.05 R30.15
Applicable from 4 September 2006. - The minimum rate for Task Grade 1 for rural areas is R8.45 for 2006 and will increase to R10.27 on 1 March 2007. The across the board increases for the first Monday in September 2006, 2007 and 2008 are 8.00%. Although the indices above indicate national trends, it is important to note that provincial differences also occur, and which if not accounted for could lead to unfair situations where certain areas are prejudiced against if a single national guideline figures were used. Table 5 below, provides an indication of these differences in CPI & PPI, not only on a provincial basis but also on a regional basis.
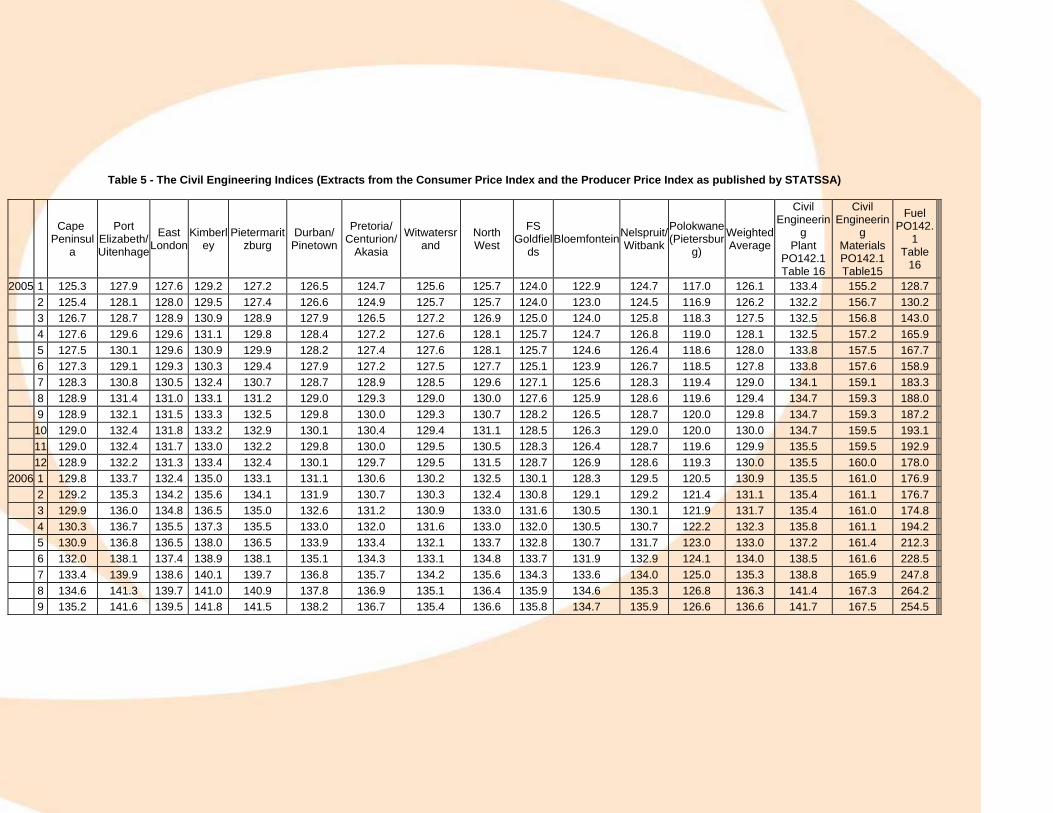
Table 5 - The Civil Engineering Indices (Extracts from the Consumer Price Index and the Producer Price Index as published by STATSSA)
Cape
Peninsula
Port Elizabeth/ Uitenhage
East London
Kimberley
Pietermaritzburg
Durban/Pinetown
Pretoria/Centurion/
Akasia
Witwatersrand
North West
FS Goldfiel
ds Bloemfontein Nelspruit/
Witbank
Polokwane(Pietersbur
g)
WeightedAverage
Civil Engineerin
g Plant
PO142.1Table 16
Civil Engineerin
g MaterialsPO142.1Table15
Fuel PO142.
1 Table
16
2005 1 125.3 127.9 127.6 129.2 127.2 126.5 124.7 125.6 125.7 124.0 122.9 124.7 117.0 126.1 133.4 155.2 128.7 2 125.4 128.1 128.0 129.5 127.4 126.6 124.9 125.7 125.7 124.0 123.0 124.5 116.9 126.2 132.2 156.7 130.2 3 126.7 128.7 128.9 130.9 128.9 127.9 126.5 127.2 126.9 125.0 124.0 125.8 118.3 127.5 132.5 156.8 143.0 4 127.6 129.6 129.6 131.1 129.8 128.4 127.2 127.6 128.1 125.7 124.7 126.8 119.0 128.1 132.5 157.2 165.9 5 127.5 130.1 129.6 130.9 129.9 128.2 127.4 127.6 128.1 125.7 124.6 126.4 118.6 128.0 133.8 157.5 167.7 6 127.3 129.1 129.3 130.3 129.4 127.9 127.2 127.5 127.7 125.1 123.9 126.7 118.5 127.8 133.8 157.6 158.9 7 128.3 130.8 130.5 132.4 130.7 128.7 128.9 128.5 129.6 127.1 125.6 128.3 119.4 129.0 134.1 159.1 183.3 8 128.9 131.4 131.0 133.1 131.2 129.0 129.3 129.0 130.0 127.6 125.9 128.6 119.6 129.4 134.7 159.3 188.0 9 128.9 132.1 131.5 133.3 132.5 129.8 130.0 129.3 130.7 128.2 126.5 128.7 120.0 129.8 134.7 159.3 187.2 10 129.0 132.4 131.8 133.2 132.9 130.1 130.4 129.4 131.1 128.5 126.3 129.0 120.0 130.0 134.7 159.5 193.1 11 129.0 132.4 131.7 133.0 132.2 129.8 130.0 129.5 130.5 128.3 126.4 128.7 119.6 129.9 135.5 159.5 192.9 12 128.9 132.2 131.3 133.4 132.4 130.1 129.7 129.5 131.5 128.7 126.9 128.6 119.3 130.0 135.5 160.0 178.0 2006 1 129.8 133.7 132.4 135.0 133.1 131.1 130.6 130.2 132.5 130.1 128.3 129.5 120.5 130.9 135.5 161.0 176.9 2 129.2 135.3 134.2 135.6 134.1 131.9 130.7 130.3 132.4 130.8 129.1 129.2 121.4 131.1 135.4 161.1 176.7 3 129.9 136.0 134.8 136.5 135.0 132.6 131.2 130.9 133.0 131.6 130.5 130.1 121.9 131.7 135.4 161.0 174.8 4 130.3 136.7 135.5 137.3 135.5 133.0 132.0 131.6 133.0 132.0 130.5 130.7 122.2 132.3 135.8 161.1 194.2 5 130.9 136.8 136.5 138.0 136.5 133.9 133.4 132.1 133.7 132.8 130.7 131.7 123.0 133.0 137.2 161.4 212.3 6 132.0 138.1 137.4 138.9 138.1 135.1 134.3 133.1 134.8 133.7 131.9 132.9 124.1 134.0 138.5 161.6 228.5 7 133.4 139.9 138.6 140.1 139.7 136.8 135.7 134.2 135.6 134.3 133.6 134.0 125.0 135.3 138.8 165.9 247.8 8 134.6 141.3 139.7 141.0 140.9 137.8 136.9 135.1 136.4 135.9 134.6 135.3 126.8 136.3 141.4 167.3 264.2 9 135.2 141.6 139.5 141.8 141.5 138.2 136.7 135.4 136.6 135.8 134.7 135.9 126.6 136.6 141.7 167.5 254.5

The above trends and factors reflect a clear growth scenario, which is not reflected in the current static guideline document’s unit costs. Therefore, to assess current and future project proposals against unit costs (which are increasingly becoming more outdated / irrelevant), can only lead to serious project cost “overruns” during the implementation cycle of the project. Similarly the static unit cost and their applicable relevance could, if used to determine backlog budgets, etc. at a national level, will lead to serious shortfall in budget once implementation stage is reached. The reasons why this has not been given coverage in the current guideline documents can be many, for example:
The budget and timing is not appropriately proportionate to the level of the study required to produce the desired level of detail or information;
The sources for obtaining project information are unreliable, inconsistent or inappropriate, and/or not readily available or easily accessible from the public and private sectors so as to use it to establish the unit costs, and to undertake a quality and informed trend analysis to forecast the unit costs.
1.3 Proposed action Bearing the aforementioned in mind, the following actions have been proposed by the end-users: • Improve on the current guideline document especially as regards levels of service and the unit
costs; • Develop formal processes and procedures for the application of the document and how to make
use of potential/ proposed grant funding options (user/ procedural manual) • Develop a framework and/or mechanism for the periodic review and update of:
o guideline document and its associated unit costs, and o user/ procedural manual.
2 Recommended Evaluation Assignment The subject of this recommended evaluation is to revise the document and its components in terms of the above factors and amend the values or approach where necessary. The envisaged key deliverables of the evaluation are viewed as distinct phases and as such they will be addressed as are as follows: Delivery 1: Phase 1 Produce an improved guideline document with service levels and associated unit costs. Delivery 2: Phase 2 Provide a framework for updating and continued review of the guidelines, the unit costs and the services levels Delivery 3: Phase 3 Provide a conceptual review on options and proposals on how to use the infrastructure grant, if considering that the grant is the main mechanism in providing basic and essential services, and could be a mechanism to provide other services as well, pending circumstances, conditions, and motivations. The main problem the evaluation seeks to address is to identify regional / provincial and sectoral/industry related cost values as well as to allow for national impacts such as variance in rates, petrol cost, etc. The aim therefore is to develop an efficient, sustainable nationwide system of guidance for municipalities and ultimately national government in terms of the provision of weighted basic infrastructure service provision cost values that reflect national and regional impacts. The evaluation also aims to share its experience with other sectors. The overall objective of the evaluation is to provide better guidance in budget determination linked to infrastructure development.

The activities undertaken by the Service Levels and Unit Cost Review are geared towards delivering on the following result areas:
1. Equipping Municipalities and PMU in South Africa’s nine provinces with means of providing more relevant cost estimates;
2. Ensuring that unit cost values reflect the trend of current development and economies in South Africa, and also area specific trends & developments;
3. Equipping the National Treasury with a means of costing infrastructure backlogs that reflects national and regional trends, settlement patterns and economic development impacts, through regular updating
2.1 Delivery 1: Phase 1
Implementation of Phase 1 was structured by around five work stages, consisting of:
1. Approval of TOR and Appointment of Review Team (Section 1.1) - (2 weeks); 2. Compilation of the Inception Report / PEP and DPLG MIG MU’s approval thereof (Section 1.2) - (2
weeks); 3. The collation of outcomes from Stakeholder Mobilization, the initial comprehensive Market / Sector
review and Stakeholder Interview (Sections 1.3, 1.4 & 1.5) - (6 weeks); 4. Compilation of a 1st draft Guideline Document (Sections 1.6 &1.7) - (6 weeks); and 5. Stakeholder Review and finalization of Guideline Document (Sections 1.8 & 1.9) - (5 weeks)
2.2 Delivery 2: Phase 2 It is recommended that Phase 1 be followed by Phase 2, which consists of a series of cycles of bi-annual reviews. The mechanisms for monitoring and reporting include a revised guideline and bi-annual written reports to the Head of the National MIG Management Unit. For the purposes of this terms of reference only one cycle is shown. Phase 2 should be undertaken in the following stages:
• Stage 1: Structure Revision Programme • Stage 2 : 1st Bi-Annual Assessment • Stage 3: 2nd Bi-Annual Assessment • Stage 4: Project Close Out (After 1 cycle of Bi-annual reviews, which is one year
2.3 Delivery 3: Phase 3 Phase 3, being a Grant Options Conceptual Review, will provide a conceptual review of options and proposals on how to use the infrastructure grant. Phase 3 follows Phase 1 and will happen in parallel to Phase 2. Phase 3 should be undertaken in the following stages:
• Stage 1: Compile comments on potential grant options / usage options from previous workshops
• Stage 2 : Identify most appropriate option concepts and actions • Stage 3: Workshop concepts with specific stakeholders, i.e. MIG unit, IMESA, critical
individuals • Stage 4: Confirm outcomes • Stage 5: Finalize and Issue Option Concepts Review (Key deliverable of Phase 3)
3 Description of the assignment
It is suggested that the Evaluation be done by means of a review of available guideline documentation and structured interviews with the relevant actors. It is not envisaged that this will require actual area visits, as it is felt that most of the investigation and interviews can be dealt with through tele-communication or electronic

communication. Interviews will be structured around industry/sector generic questionnaires, specifically to ensure effective comparatives can be made. In line with the framework, each of the existing service level categories and subcomponents will be reviewed in terms of the following criteria:
• Clarity; • Relevance/applicability and • Generic cost criteria (especially improving on the current baseline used for the purposes of
calculating and updating the unit costs per level of service per infrastructure category). Where changes are recommended these will be identified and applied in terms of the thought processes. Cost criteria will be reviewed for each region/province, with input obtained from industry, relevant government bodies and sample municipalities. The main issues to be undertaken during the MIG Infrastructure Levels of Service and Unit Cost Revision are summarized below:
• Appointment & Mobilization:
This component is standard and comprises the development of an agreed to work package, which culminates in the mobilization of the Evaluation Team.
• Development of an Inception Report or Project Execution Plan (PEP), Communication &
Mobilization of Stakeholders: The purpose of the PEP is to formalize the outcomes, define the procedures of communication and reporting.
• Stakeholder Communication:
Included in this section is the identification and mobilization of Stakeholders. Mobilization of Stakeholders entails DPLG drafting a letter to the relevant Stakeholder, informing them of the evaluation and requesting their support and assistance to the evaluation team investigation.
3.1 Phase 1 • Information Review:
This would revolve around reviewing the current guideline documentation and assessing the market or sector factors that impact on the costs, specifically in terms of the unit costs. This makes the assumption that all the relevant baseline documentation and information that were used in the development of the previous ‘Basic Level of Services and Unit Costs documents are readily accessible and available for this Phase 1, as the timeline and costs do not make adequate provision for undertaking this Phase 1 evaluation from ‘zero base first principles’.
• Analysis of Market / Sector Factors:
During this component, the adequacy of current guideline unit costs & underlying assumptions will be reviewed and commented upon. The analysis of current regional, national and LED factors will be undertaken through the:
• Develop Impacts Matrix • Develop Industry / Sectoral Questionnaire
As mentioned before, it is not envisaged that the interviews with relevant industry stakeholders will require actual area visits, as it is felt that most of the investigations and interviews can be dealt with through telecommunication or electronic communication. Interviews will be structured around industry/sector generic questionnaires, specifically to ensure effective comparatives can be made. However, each interview will make provision for regional differentiation. This will also extend to the service description and not just cost factors. The purpose of this is to ensure that regions have sustainable LOS options available that are in relation to their circumstances. i.e. built up urban areas basic LOS for sanitation is not a VIP, but would involve a service level that will not lead to detrimental effects such as high e-coli levels in groundwater that could in itself result in heath problems. As such, aspects such as settlement patterns, geological constraints and socio-political constraints need to be identified and recognized as having significant impact on LOS options. A portion of the interview will also be geared to obtaining from the stakeholders their views on potential grant options / usage options (Phase 3 input).

• Revise and Amend Current Approach in terms of recent and subsequent development outcomes: The current approach and values will be revised in terms of recent and subsequent development outcomes. Current sectoral values per Province and per Weighted National Average (OR Acceptable Range of Unit Costs per LOS) will also be developed which will include a strategy for dealing with assessment in accordance to the PRF and identifying relevant approval authorities for situations where the guideline values or levels of service are exceeded. Furthermore, in developing the national averages, adequate weighting need to be given to relevant regional impacts and options, to ensure that a realistic and representative national averages are being used in budget developments for eradicating backlogs.
• DPLG MIG Unit review: The outcome of the interviews and analysis in terms of Unit Cost and Decision Flow Diagram, will be compiled into a 1st draft Service Level Guideline document. This document will initially be workshopped with the DPLG National MIG Management Unit and with their input amended to form the Draft Service Level Guideline Document. This workshop will also provide for an initial conceptual workshopping session and comments on potential grant options / usage options & condition concepts as per Delivery 3 (Phase 3 input). All team members are to participate in this workshop.
• Key Role-players / Stakeholders Review: The draft Guidelines will be workshopped by the Team Leader with the Key Stakeholders and Role-players, such as IMESA, DWAF, DoT, etc and any changes will be passed on to the team for effecting. This workshop will also provide for a further conceptual workshopping session to gain comments and views on potential grant options / usage options & condition concepts as per Delivery 3 (Phase 3 input). All team members are to participate in this workshop.
• Service Level Guideline Report (Key Deliverable 1 Output): On completing all the amendments a Final Service Level and Unit Cost Guideline will be compiled and issued to the DPLG MIG MU for implementing. This would mark the conclusion of Phase 1, being the review and revision of the current Service Level Guideline document.
3.2 Phase 2
As mentioned, Phase 2 consists of a series of cycles of bi-annual reviews. It is envisaged that this phase can only be finalized once the outcomes of Phase 1 has been achieved, or as a minimum accommodating a minimum overlap in activities. The first aspect of Phase 2 is the structuring of a Revision Programme (1st Key Deliverable of Phase 2). This component includes the identification of the revision requirements and most appropriate action to be undertaken. Based on the outcomes of Phase 1, it will indicate the regularity of reviews required. At this stage the regularity is envisaged to be bi-annual reviews. Included in this component is the development, and agreement of costing of the operational arrangements required for such a revision. Part of this component is also agreement around the number of cycles of the bi-annual reviews to be undertaken. Once the agreement of the revision programme has been achieved, the Revision Programme will be initiated. The mechanisms for monitoring and reporting include a bi-annual written report to the Head of the National MIG Management Unit, which will include, where necessary a revised guideline and unit costs (Interim Deliverables of Phase 2). The conclusion of Phase 2 will in all probability extends past the conclusion of Phase 3 and as such be the last component of this evaluation. It will be concluded with a Close-Out Report, which follows after the last cycle of bi-annual reviews (final Key Deliverable).
3.3 Phase 3
The purpose of Phase 3 is to provide a conceptual review of options and proposals on how to use the infrastructure grant, if considering that the grant is the main mechanism in providing basic and essential services, and could be a mechanism to provide other services as well, pending circumstances, conditions and adequate motivation. The rational for undertaking this aspect is that it is felt that the use MIG funds are often driven by the conditions relating to the costs and appropriate service levels.

During this phase consideration will be given to some options such as: a) Matching grant - where government provides funds matched by the local authority
funds and conditions apply b) Non matching grant - where government provides everything and conditions apply
specific then to provision of a certain level of services, etc c) Closed matching: another option where a Rand is granted for each Rand co-funded
by the local authority.
It is recommended that the approach and thinking are tested with knowledgably and strategic thinkers within IMESA, SAICE, WISA and specific individuals, who will be sourced during drafting of the Phase 1. Aspects of the Phase 1 workshops will provide the basis for the analysis of Phase 3.
Phase 3 will be undertaken in the following stages: • Stage 1: Compile comments on potential grant options / usage options from previous
workshops • Stage 2 : Identify most appropriate option concepts and actions • Stage 3: Workshop concepts with specific stakeholders, i.e. MIG unit, IMESA, critical
individuals • Stage 4: Confirm outcomes • Stage 5: Finalize and Issue Option Concepts Review (Key deliverable of Phase 3)
Attention is drawn to the fact that this review will only be a conceptual document of which the recommendations will still need to be tested against existing policies and legislation of DWAF, dplg, and other relevant sectors and stakeholders. It is recognized that the finding of this review can assist in providing the basis for a more detailed and in depth policy review.
4 Reporting and Deliverables All reporting will need to be done in English, and prepared with MS Office software. Reporting for the Phase 1 component of the Evaluation will comprise the following:
Phase 1 Output Delivery date
No. of copies Recipient(s) Feedback / approval
date 1. Detailed plan of work 2 wks 1 hard copies
1 electronic copy DPLG Nat MIG MU
2 days
2. Outcomes Report on: • Stakeholder Mobilization, • Initial comprehensive Market /
Sector review & • Stakeholder Interviews
2.5 months 1 hard copies 1 electronic copy
DPLG Nat MIG MU
2 days
3. 1st Draft Guideline 4 months 1 hard copies 1 electronic copy
DPLG Nat MIG MU
2 days
4. Final Service Level Guideline Document
5 months 1 hard copies 1 electronic copy
DPLG Nat MIG MU
n/a
Phase 2 Output Delivery date
No. of copies Recipient(s) Feedback /
approval date
1. Structure Revision Programme 6 wks 1 hard copies 1 electronic copy
DPLG Nat MIG MU
2 days
2. 1st Bi-Annual Assessment
6 months 1 hard copies 1 electronic copy
DPLG Nat MIG MU
2 days
3. 2nd Bi-Annual Assessment 12 months 1 hard copies 1 electronic copy
DPLG Nat MIG MU
2 days
4. Project Close Out (After 1 cycle of Bi-annual reviews, which is one year
1 month 1 hard copies 1 electronic copy
DPLG Nat MIG MU
n/a

Phase 3 Output Delivery date
No. of copies Recipient(s) Feedback /
approval date
1. Compile comments on potential grant options / usage options from previous workshops
1.5 wks 1 hard copies 1 electronic copy
DPLG Nat MIG MU
2 days
2. Identify most appropriate option concepts and actions
2.5 wks 1 hard copies 1 electronic copy
DPLG Nat MIG MU
2 days
3. Workshop concepts with specific stakeholders, i.e. MIG unit, IMESA, critical individuals
1 week
4. Confirm outcomes; AND 5. Finalize and Issue Option Concepts
Review (Key Deliverable of Phase 3) 1 week
1 hard copies 1 electronic copy
DPLG Nat MIG MU
n/a
5 Conclusion
The aforementioned motivation serves to give support to- and to reinforce the action of conducting a revision of the concepts and components within and related to the current guideline document, as an effective and applicable response. Essentially the proposed improvement on the current guideline will have to look at 3 key focal areas:
a) The adequacy of its current scope (content) and its current layout (framework), and looking to improve on it to
make it more user-friendly for use by the end-user and for the purpose of undertaking periodic updates
b) The adequacy of the current levels of service in terms of its scope (design options/choices), and the sufficiency of the description of the different levels of service to enable the end-user to have sufficient understanding of the technical content to apply the guidelines as a relevant working document
c) The adequacy and applicability of the current unit costs in terms of macro economic trends and the construction industry factors that impact on the costs over time, and the necessity of periodically updating the unit costs accordingly
It is envisaged that the proposed actions would assist the end-users as follows, with specific reference to the components and in the manner shown:
• Municipalities:
o Facilitate Project Selection in making the best decision for its local circumstances – best option/choice in terms of community need and acceptability, sustainability and affordability of the level of service (i.e., its viability in terms of any additional capital cost and/or the associated operation and/or maintenance cost), and to consider the funding options/ alternatives;
o Facilitate Project Registration in the evaluation and approval of the PRFs, and to disapprove or justify and/or motivate for projects that fall outside the acceptable range of unit costs;
o Creation of a Project database allowing for the recording and submission of all the relevant project information into an electronic project database (an added requirement as part of the Physical Completion stage); and
o Development of Future 3-year Capital/ Business Plans using established costing mechanisms or models to calculate projected budgets for the list of selected and prioritized IDP projects
• National and Provincial Departments:
o Provide National Treasury with the national weighted averages to use in calculating the infrastructure budgets;
o Assist NMU in setting the budgets for the above-mentioned periodic reviews and updates; and o Assist NMU and PPMU – Project Registration in assessing and evaluating the PRFs, submitting
change requests, and the approval of the PRFs.
It is further envisaged and recommended that regular revision and updating of the document should form part of the MIG NMU processes. A means of achieving this is to potentially issue the guideline document as a periodical document. The periodical can be updated from information obtained from the maintained databases

of the municipalities and economic trends and forecasting. This will require the setting up and the maintenance of the municipal databases as a policy condition to be included with and linked to obtaining the MIG grant funding. Funding provision for this action needs to be included or ensured. Finally, it is recommended that this Report be used as a Discussion Document to facilitate and engage the relevant sectors and stakeholders, with the objective of reviewing the current “Guidelines: Services Levels and Unit Costs”.
*******************************************

Appendix 10 Infrastructure Unit Cost As Reflected On A Provincial Basis And As A National Average


Appendix 11 Nfrastructure Unit Costs: Comparative Analysis To Reflect Status Of Revised Costs