The Dryad Repository Application Profile: Groundwork Towards a Metadata Scheme for Scientific Data

Data ConversationsUsing Data to Inform Rapid Transformationand District School Improvement through Data Dialogues
Data Dialogues In Action: An Inside View
1

Data Dialogues: Powerful Data Conversations
Michigan’s statewide system of support, MI Excel, is using a new approach to help school districts diagnose areas of improvement and identify transformational school improvement strategies: Data Dialogues.
This booklet describes this inquiry-based approach and offers a real-life example of how data dialogues were successfully used by one district. That district’s story will demonstrate how the process works and highlight the elements that make data dialogues so effective.
Data dialogues are structured group conversations that:• Help educators understand, develop, and work with
their data through a thoughtful, reflective process that includes district and school leadership teams and multiple data sources;
• Promote openness, build relational trust, and bring positive energy to school teams;
• Guide schools and districts toward a series of big ideas for strategic change that are essential to improved student achievement.
MI Excel supports data conversations by deploying specialists to work with school districts. Each specialist has been trained and employed by Michigan State University’s Office of K–12 Outreach to provide ongoing support at the district level. These specialists, along with school improvement facilitators(SIFs) from local intermediate school districts (ISDs), work with teams consisting of teachers, principals, district-level staff and others identified by the superintendent and other designated leaders.
Data Dialogues: A Three-Phrase Process
Phase One−Activate & Engage: The data dialogue opens with the formation of a well-prepared district and school support team. Before any data is placed into consideration, school and district leaders agree upon team norms, make predictions about what the data will show, and uncover their own underlying assumptions.
Phase Two−Explore & Discover: After setting the groundwork, district and school support team members begin to review the
data. This phase of dialogue involves discovery and prompts teams to remain open to possi-bilities, look for patterns, and observe the real stories in relation to the data. This is a time of exploration, not explanation.
Phase Three−Organize & Integrate: The third phase of the data dialogue will support the transition to causation and action. Teams work together to dig deep, surface causal factors, and to generate powerful big ideas for rapidly improving student learning and achievement.
Adapted with permission from the work of Laura Lipton & Bruce Wellman as published in Got Data? Now What? Creating and Leading Cultures of Inquiry (SolutionTree, 2012)
2

3
Phase One: Activate & Engage
The data dialogues process begins with the formation of a well-prepared team. Before any data is considered, school and district leaders agree upon team norms, make predictions about what the data will show, and uncover their own underlying assumptions.
Sketch of Team Activities:• Identify and select district and school support
team members. • Develop tools and strategies to promote thoughtful conversation.
• Before looking at data, begin talking about what is expected and set norms.
• Identify predictions and assumptions. • Reframe/rethink habits of mind. • Debrief the process and prepare to dig deeper.
Purpose: • Develop team readiness. • Honor team members’ expertise.
Corresponds to MI School Improvement Model Phase:
GATHER
Key Questions: • What do we predict the data will show? Why? • What questions do we have? • What are the possibilities for learning? • What might be missing from the data?
Why Phase One Matters:• When this phase is cut short, teams often find
themselves overwhelmed by data. • By taking all the necessary steps to engage the data dialogue team (without digging too deep), a foundation is built to ensure open-minded, effective problem solving.
3
4
Phase Two: Explore & Discover
After setting the groundwork, team members begin to review the data. This phase of dialogue involves discovery and prompts teams to remain open to possibilities, look for patterns, and observe the real stories in relation to the data. This is a time of exploration, not explanation.
Sketch of Team Activities:
• Focus on a few key pieces of data.• Organize data in large, uncluttered, visually vibrant
displays to facilitate group study.• Develop multiple descriptive statements about what
the data suggest.• Refrain from jumping to conclusions about why the
data look as they do (e.g., “because the teacher was on leave last year”).
• Ask questions and explore further opportunities for inquiry (e.g., “Is there a difference between the various subgroups?” or “How did last year’s group do?”).
• Share and discuss observations, ensuring all team members are included.
• Delve deeply to understand data for each de-scriptive statement and discuss team members’ perspectives until all questions and suggestions are addressed.
• Polish and refine a series of descriptive statements about the data.
• Debrief the process−how did we do?
Corresponds to MI School Improvement Model Phase:
STUDY
Purpose:
• Delve deeply into the data.• Surface possible scenarios, ideas based on what the
data show.
Key Questions:
• What points seem to “pop out”?• What are the patterns, categories, and trends?• What is surprising/unexpected?• Are there other avenues to explore?
Why Phase Two Matters:
• A thoughtful, well-structured exploration of data helps school teams get at the heart of learner performance, achievement gaps, system misalign-ments, and possible opportunities.
• Teams learn to view data through different lenses, ask insightful questions, and pursue lines of inquiry in collaborative ways. Once teams understand the stories being told by their data, they are ready to act.

5
Phase Three: Organize & Integrate
The third phase of the data dialogue supports the transition to causation and action. Teams work together to dig deep, surface causal factors, and generate powerful big ideas, for rapidly improving student learning and achievement.
Big ideas are outcomes-driven strategies for action that emerge from the intensive examination of data trends and stem from theories of causation and action. Big ideas include both broad and deep strategies for transformational change at the district, school, and classroom level. They guide the work of instructional leaders.
Big ideas may identify broad and systemic changes (such as instructional misalignments or organizational opportunities for the allocation of resources). Big ideas may also include deeply focused strategies (content- specific professional learning and classroom practices) that build capacity among those at the very center of teaching and learning.
Sketch of Team Activities:
Stage One: Developing a Theory of Causation
• Generate multiple theories of causation related to key observations made in phase two.
Stage Two: Developing a Theory of Action
• Develop “big ideas,” or theories of action, that address causes and inform future school improvement planning.
• Debrief the first full data conversation.
Purpose:
• Frame challenges to be addressed.• Develop appropriate solutions.• Use additional data sources to confirm and refine
theories.
Corresponds to MI School Improvement Model Phase:
PLAN
Key Questions:
• What inferences/explanations/conclusions might we draw from the data? (causation)
• What additional data sources might we explore to verify our explanations? (confirmation)
• What are some research-based solutions we can explore? (action)
• What additional data will we need to collect? (calibration)
Why Phase Three Matters:
• This phase brings together all the prior data conversations to form theories of action. It transitions the team from problem finding to action planning.

6
Data Dialogues in Action: An Inside View
Background
The following story takes you inside the data dialogue experience of one school district through the eyes of an MSU District Improvement Facilitator, with the permis-sion and input of the district. This real-life example describes his collaboration with district leaders and the technical supports provided. Most importantly, this story reveals how data dialogues were used to engage educators in rich and powerful conversations about student achievement.
Mapping Our Journey
Our journey began with a meeting between the Focus school principal, superintendent, and curriculum director. We started the planning process with the curriculum director. We decided that I would lead a data dialogue with the building administrator and
teacher leaders at an elementary school that had been designated as a Focus school. We also decided to invite representatives of all schools to take part. It would be an opportunity for staff to look at their data in a new way and it would give them an opportunity to get an outside perspective from other educators in the district. This would also give leaders from every building in the district an opportunity to learn about the process.
Preparation
We looked at the building’s Z scores and selected writing as the content focus, since this area had the largest achievement gap. We then planned about three hours to look further into the data and introduce the data dialogue process.
6
7
Phase 1: Getting Started
Phase One: Activate and Engage
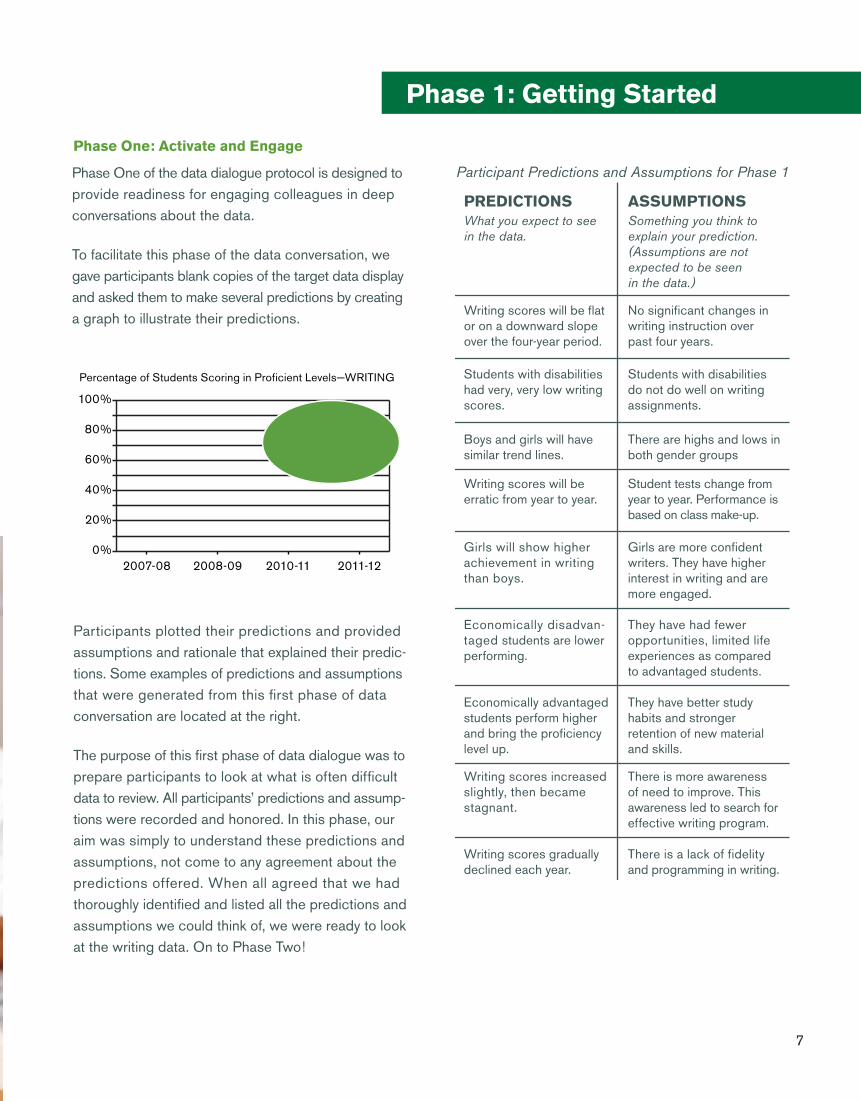
Phase One of the data dialogue protocol is designed to provide readiness for engaging colleagues in deep conversations about the data.
To facilitate this phase of the data conversation, we gave participants blank copies of the target data display and asked them to make several predictions by creating a graph to illustrate their predictions.
Participants plotted their predictions and provided assumptions and rationale that explained their predic-tions. Some examples of predictions and assumptions that were generated from this first phase of data conversation are located at the right.
The purpose of this first phase of data dialogue was to prepare participants to look at what is often difficult data to review. All participants’ predictions and assump-tions were recorded and honored. In this phase, our aim was simply to understand these predictions and assumptions, not come to any agreement about the predictions offered. When all agreed that we had thoroughly identified and listed all the predictions and assumptions we could think of, we were ready to look at the writing data. On to Phase Two!
2008-09 2011-122010-11
Percentage of Students Scoring in Proficient Levels−WRITING
100%
80%
60%
40%
20%
0%2007-08
Draw a graph of what you think the data
will show!
Participant Predictions and Assumptions for Phase 1
PREDICTIONSWhat you expect to seein the data.
ASSUMPTIONSSomething you think toexplain your prediction.(Assumptions are not expected to be seen in the data.)
Writing scores will be flat or on a downward slope over the four-year period.
No significant changes in writing instruction over past four years.
Students with disabilities had very, very low writing scores.
Students with disabilities do not do well on writing assignments.
Boys and girls will have similar trend lines.
There are highs and lows in both gender groups
Writing scores will be erratic from year to year.
Student tests change from year to year. Performance is based on class make-up.
Girls will show higher achievement in writing than boys.
Girls are more confident writers. They have higher interest in writing and are more engaged.
Economically disadvan-taged students are lower performing.
They have had fewer opportunities, limited life experiences as compared to advantaged students.
Economically advantaged students perform higher and bring the proficiency level up.
They have better study habits and stronger retention of new material and skills.
Writing scores increased slightly, then became stagnant.
There is more awareness of need to improve. This awareness led to search for effective writing program.
Writing scores gradually declined each year.
There is a lack of fidelity and programming in writing.
8
Phase 2: Going Deeper
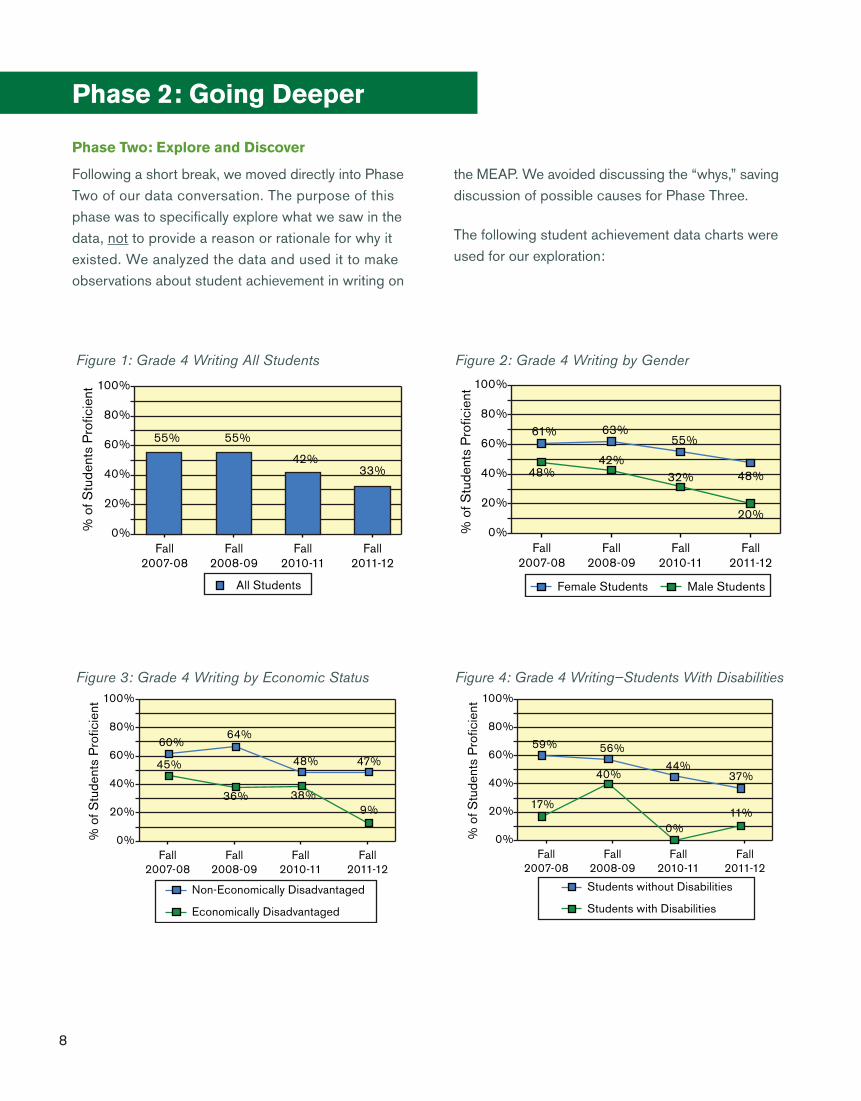
Phase Two: Explore and Discover
Following a short break, we moved directly into Phase Two of our data conversation. The purpose of this phase was to specifically explore what we saw in the data, not to provide a reason or rationale for why it existed. We analyzed the data and used it to make observations about student achievement in writing on
Figure 1: Grade 4 Writing All Students
Fall2008-09
Fall2011-12
Fall2010-11
% o
f Stu
dent
s P
rofic
ient
100%
80%
60%
40%
20%
0%Fall
2007-08
All Students
55% 55%
42%33%
Figure 3: Grade 4 Writing by Economic Status
Fall2008-09
Fall2011-12
Fall2010-11
% o
f Stu
dent
s P
rofic
ient
100%
80%
60%
40%
20%
0%Fall
2007-08
Non-Economically Disadvantaged
Economically Disadvantaged
60%64%
48% 47%45%
36% 38%9%
Fall2008-09
Fall2011-12
Fall2010-11
% o
f Stu
dent
s P
rofic
ient
100%
80%
60%
40%
20%
0%Fall
2007-08
Female Students Male Students
61% 63%55%
48%48%42%
32%
20%
Fall2008-09
Fall2011-12
Fall2010-11
% o
f Stu
dent
s P
rofic
ient
100%
80%
60%
40%
20%
0%Fall
2007-08
59% 56%
44%37%
17%
40%
0%11%
Students without Disabilities
Students with Disabilities
the MEAP. We avoided discussing the “whys,” saving discussion of possible causes for Phase Three.
The following student achievement data charts were used for our exploration:
Figure 2: Grade 4 Writing by Gender
Figure 4: Grade 4 Writing—Students With Disabilities

9
Phase 2—Continued
Participants were encouraged to look at the data and to search for patterns and trends. They were asked to identify rough observations derived from the data and then were asked to refine these into specific narrative statements. Their narrative statements are found below.
This list reflected our conversations up to this point, which concluded the exploring and discovery phase of our dialogue. Then we moved quickly into the most important next steps of the dialogue process−the exploration of possible causes and the development of specific “Big Ideas” for action to rapidly improve student achievement.
Table 1: Narrative Statements Captured in Phase Two
AREA NARRATIVE STATEMENT
Gender The gap in performance between boys and girls consistently widened between 2008 and 2011 moving from 13% to 21% to 23% to 28%.
Economic Status The gap in performance between economically disadvantaged and economically advantaged students is inconsistent ranging from 5% to 38%.
Students with Disabilities There is wide variability in performance for students with disabilities.
Gender On average, females out perform boys by 23% from 2008 to 2012.
Economic Status Over the five year period reviewed, there was a 36% decline in proficiency for the economically disadvantaged cohort.
Students with Disabilities In 2010–11, 44% of the general education population were proficient in writing compared to 0% for students with disabilities.
Economic Status Since Fall 2007–08, there has been a 36% decrease in proficiency for economically disadvantaged students and only a 13% decreased for more advantaged students.
Overall In writing, there was a 9% decrease in students who were proficient in writing in 2010–11 compared to 2011–12.
Gender In Fall 2011–12, 48% of girls were proficient in writing, but only 20% of boys were proficient.
Economic Status From Fall 2010–11 to 2011–12, there was a 29% drop in proficiency for economically disadvantaged students.
Overall The boys’ highest percent proficient (48% in 2007–08) was the same as the girls’ lowest percent proficient (48% in 2011–12).

10
Phase 3: Forming “Big Ideas”
Phase Three: Organizing and Integrating
In Phase Three of the data dialogue, the focus of our discussion transitioned to problem finding and problem solving in which we considered causation and action.
The work in this phase helped us generate multiple theories of causation. We allowed multiple theories to remain open for discussion. We looked for other data to confirm these causal theories, and generated several “Big Ideas” for solutions. We then used the decision-making process to choose the strongest solutions.
For each narrative statement identified in Phase Two, we developed causal theories in five primary categories. They included the areas of infrastructure, curriculum, instruction, teachers, and students. I suggested that we add a sixth area: leadership.
Table 2: Examples of Causal Theories from Phase Three
“Big Ideas” Action Plan
Narrative Statement: From 2010—11 to 2011—12, there was a 9% decrease inwriting proficiency for all students
Second Semester 2012-13
Provide effective professional development to enhance teachers’ skills as writers themselves.
Second Semester 2012–13
Provide effective job embedded professional development to enhance teachers’ pedagogical content knowledge in writing.
Summer 2013 Establish timeline for common writing assessments by grade level.
2013–14 Establish timeline for common writing assessments by grade level.
Summer 2013 Create building-wide rubrics for evaluating writing performance at each grade level, K–5.
2013–14 Implement common writing assessments by grade level.
Teacher-Related Causal Theory Action
Infrastructure-Related Causal Theory Action
ACTION PLAN
NARRATIVE STATEMENT: In Fall 2011—12,48% of girls were proficient in writing, but only 20% of boys were proficient.
Instruction Instruction did not change to meet the changing population.
Students Absence of male writing role models. Deemed too manly to write.
NARRATIVE STATEMENT: From 2010—11to 2011—12, there was a 9% decrease inwriting proficiency for all students
Infrastructure Students are pulled from writing core instruction to address deficits in reading and mathematics.
Curriculum There is not a core K–5 writing program in place.
Teachers Teachers lack training needed to effectively teach writing to all students.
Leadership We have focused on reading and math exclusively.
For each causal theory, a “Big Ideas” action plan was developed, along with a general timeline.
Table 3: Action Plan for One Prioritized Causal Theory

11
Phase 3—continued
Using the Data Dialogue Conversations
District leaders found value in the data conversations and decided to engage educators in deep conversations about student achievement. They decided to use this protocol to engage all teachers in the school improve-ment process. Elementary and middle school teacher leaders were identified in five content areas: reading, writing, math, science, and social studies. These teachers worked together with me to learn the data dialogue process in order to build further capacity in the district to facilitate data dialogue conversations. We spent a day learning how to analyze the data and how to use the protocol. The district dedicated two half-day professional development in-services to launch the work.
In the first, session, teachers from all three elementary schools were assigned to one of the five content area teams. The same was done at the middle-school level. The teacher leaders conducted the data conversations and their work was recorded and sent to me. I synthesized the work, and facilitated additional training for Phase Three. The second in-service engaged all teacher teams in the Phase Three data conversation. Again, all work was collected and sent to me. After I synthesized this work, I organized and facilitated a teacher leader meeting. Building principals and the district’s curriculum coordinator took part. A synthesis of the data conversations is listed below.
Table 4: Prioritized Issues from District Wide Exploration
DISTRICT AND BUILDING LEVEL SCHOOL IMPROVEMENT ISSUES
Curriculum – Establish • Develop documents which indicate essential standards given course/grade level.guaranteed viable curriculum • Ensure vertical alignment of curricular documents.for all students. • Develop and implement common assessments.
• Increase the level of critical thinking at each course/grade level.
Instruction – Increase rigor and effectiveness of daily instruction.
• Increase the level of rigor for teaching to critical thinking and problem-solving.• Provide ongoing support and training for the implementation of differentiated instruction.
Teachers – Establish collective responsibility and reflective techniques to increase instructional effectiveness.
• Explore issues of beliefs concerning all students including students with disabilities.• Help teachers self-regulate and self-reflect on their instructional practices.• Recognize and respond to the issues arising from the new and future teacher evaluation
protocols.
Leadership – Establish a • Solicit teacher input regarding curricular decisions.stronger vision for narrowing • Leadership needs to monitor fidelity of curriculum delivery.the achievement gap and • Establish accountability for expectations.academic success for all • Encourage out-of-box thinking.students. • Build trust and utilize strengths of existing staff.
Infrastructure – Examine • Establish [more] uninterrupted instructional time for all subjects.systems that reinforce strong • Examine the scheduling system and class size issues.academic performance by • Revise the infrastructure for students with disabilities.all students. • Examine the individual and collective philosophy regarding students with disabilities.
• Implement job embedded professional development to support instructional practice.
Students – Recognize • Instill confidence, motivation, critical thinking, and responsibility in all students.and respond to issues that • Recognize that some students lack support at home.affect some of our student • Help students self-regulate, make interpersonal connections, and develop life skills.population. • Decrease the level of bullying that occurs for some children.
12
College of EducationO�ce of K-12 Outreach
Final Thoughts
The district director of curriculum remarked:
“Our district used the data dialogue process to analyze MEAP data. This process gave all teachers a voice. Teachers had time for reflection and were engaged, energized, and focused. Teachers felt they were listened to and had input in the process. All of this resulted in a strong and transparent school improvement plan for 2013–14.”
The district continues to use this work, having engaged all teachers and administrators not only from the Focus school, but from the district’s three elementary schools and one middle school in the school improvement process. Building and district teams are now using this work to establish district and building level school improvement plans for 2013–14.
How Can Your District Learn More?
Schedule a one-on-one consultation with your MI Excel team members to learn more about data dialogues and other supports that are available to your school district.
Contact the Michigan State University Office of K–12 Outreach at (517) 353-8950 or find us online at: http://education.msu.edu/k12/