Midwest Mechanical Services & Solutions · Midwest Mechanical Services & Solutions ... AMMONIA &...
39
Midwest Mechanical Services & Solutions Midwest Mechanical Services & Solutions
-
Upload
phungquynh -
Category
Documents
-
view
225 -
download
3
Transcript of Midwest Mechanical Services & Solutions · Midwest Mechanical Services & Solutions ... AMMONIA &...
Midwest MechanicalServices & Solutions
Midwest MechanicalServices & Solutions
Owner
2324 Centerline Industrial Drive - St. Louis, MO 63146 - 314-707-7655 - www.midweststl.com

Refrigeration
Understanding Relationships
Page 3
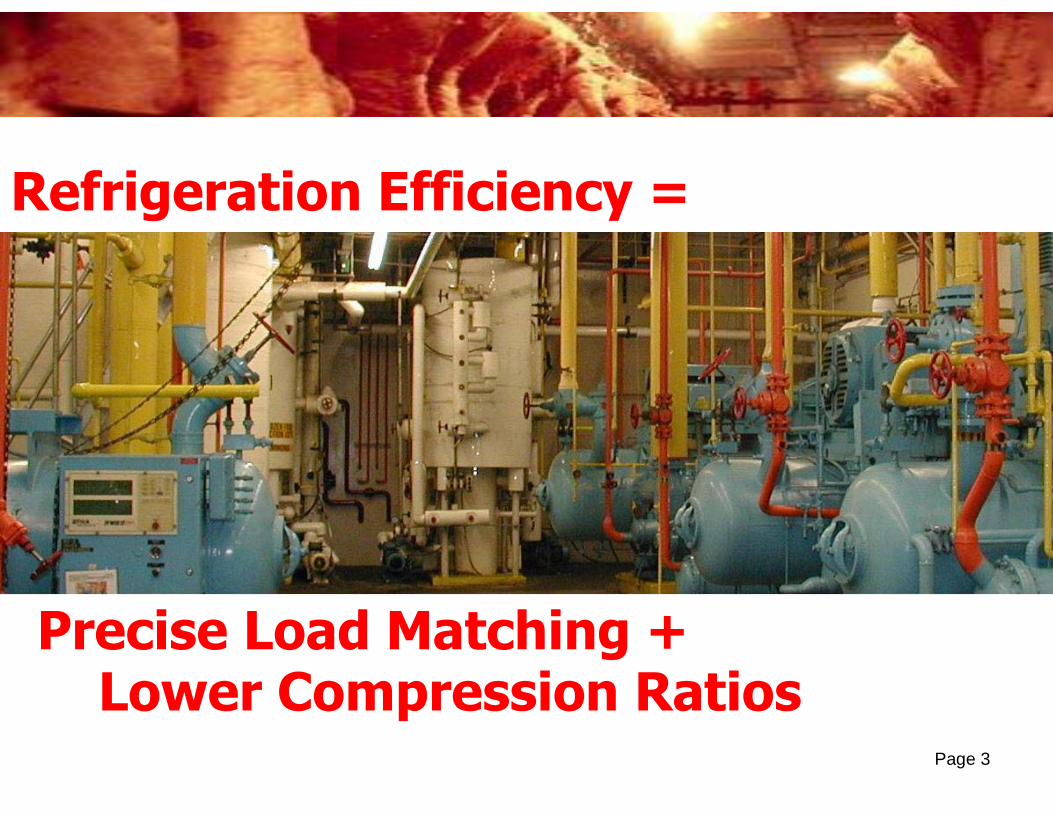
Refrigeration Efficiency =
Precise Load Matching +Lower Compression Ratios
Page 4
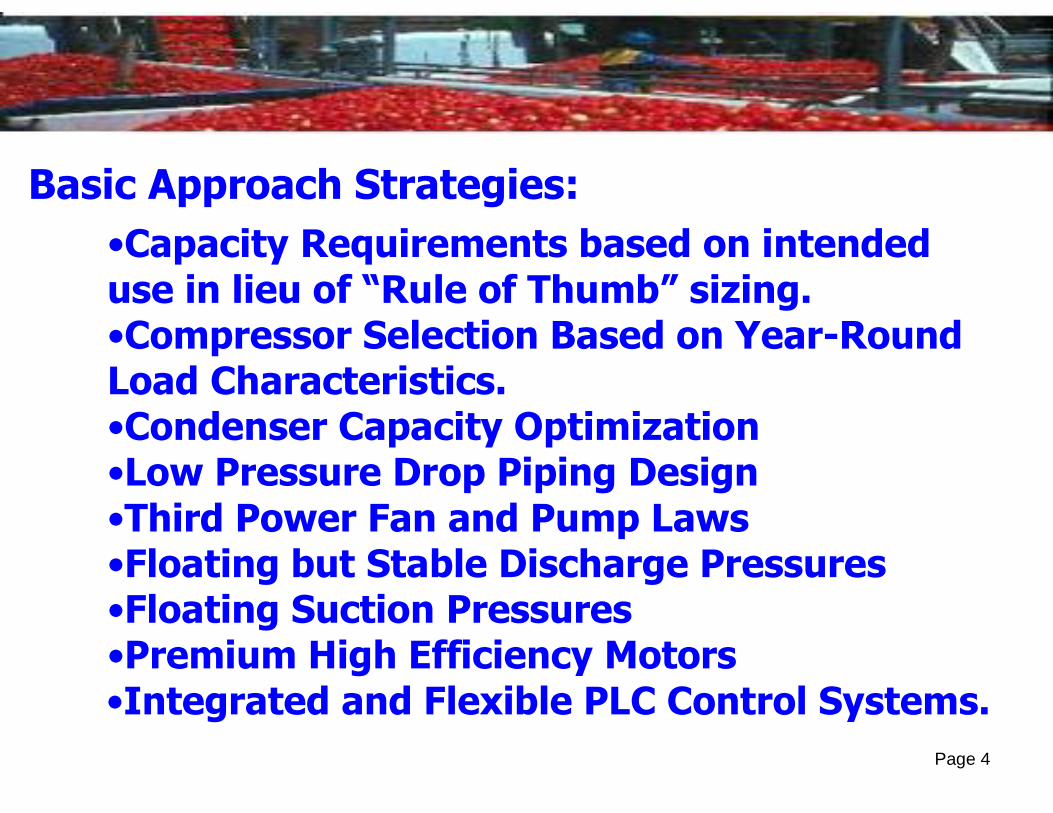
Basic Approach Strategies:•Capacity Requirements based on intended use in lieu of “Rule of Thumb” sizing.•Compressor Selection Based on Year-Round Load Characteristics.•Condenser Capacity Optimization•Low Pressure Drop Piping Design•Third Power Fan and Pump Laws•Floating but Stable Discharge Pressures•Floating Suction Pressures•Premium High Efficiency Motors•Integrated and Flexible PLC Control Systems.

Page 5
How We Can Save You Money:•Improved Production•Increased “Up Time”•Reduction in Energy Costs•Demand Cost Avoidance•Lower Maintenance Costs•FREE Mechanical Risk Index (MRI)•Records of Performance•Increased Profits and Customer Satisfaction•Improved Utilization of Resources
Owner
CONTACTS: MIKE CASSANO - INDUSTRIAL REFRIGERATION MANAGER E-Mail: [email protected] MATT RICHARDSON - VICE PRESIDENT OF OPERATIONS E-Mail: [email protected]
Owner
MIDWEST MECHANICAL WANTS TO EARN YOUR REFRIGERATION BUSINESS: - SERVICE - PARTS - UPGRADES - NEW PROJECTS
Owner
AMMONIA & FREON REFRIGERATION SYSTEMS

Page 6
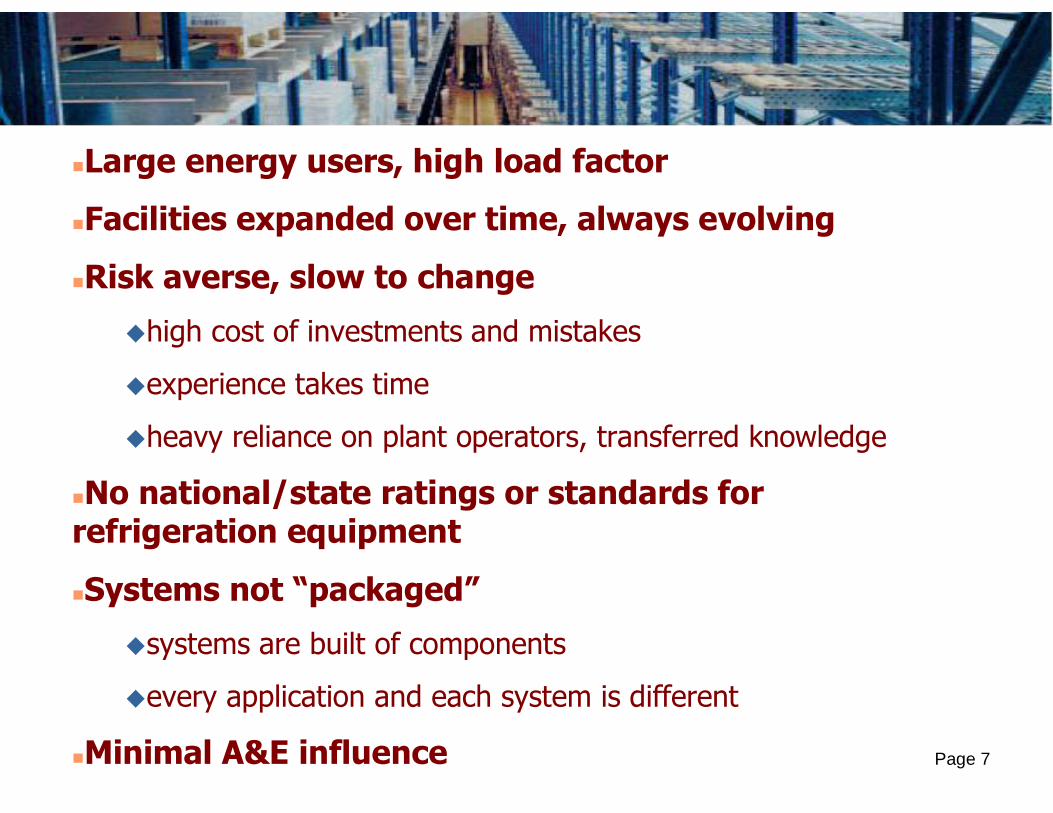
Refrigeration industry characteristics
Page 7
Large energy users, high load factor
Facilities expanded over time, always evolving
Risk averse, slow to change
high cost of investments and mistakes
experience takes time
heavy reliance on plant operators, transferred knowledge
No national/state ratings or standards for refrigeration equipment
Systems not “packaged”
systems are built of components
every application and each system is different
Minimal A&E influence

Page 8
Industrial refrigeration systemsthemes that impact energy efficiency

Page 9
Large difference in design vs. average load
Systems operated at fixed settings
Characteristically difficult to controlRelatively unstable due to low circuit mass
Slide valve losses are a large inefficiency
Multiple compressor sequencing challenges
Typical over-control (hunting) vs. actual load needs
Manual sequence control is common
No well developed methodology or control theory
25%+ savings potential (actual vs. ideal)
Page 10
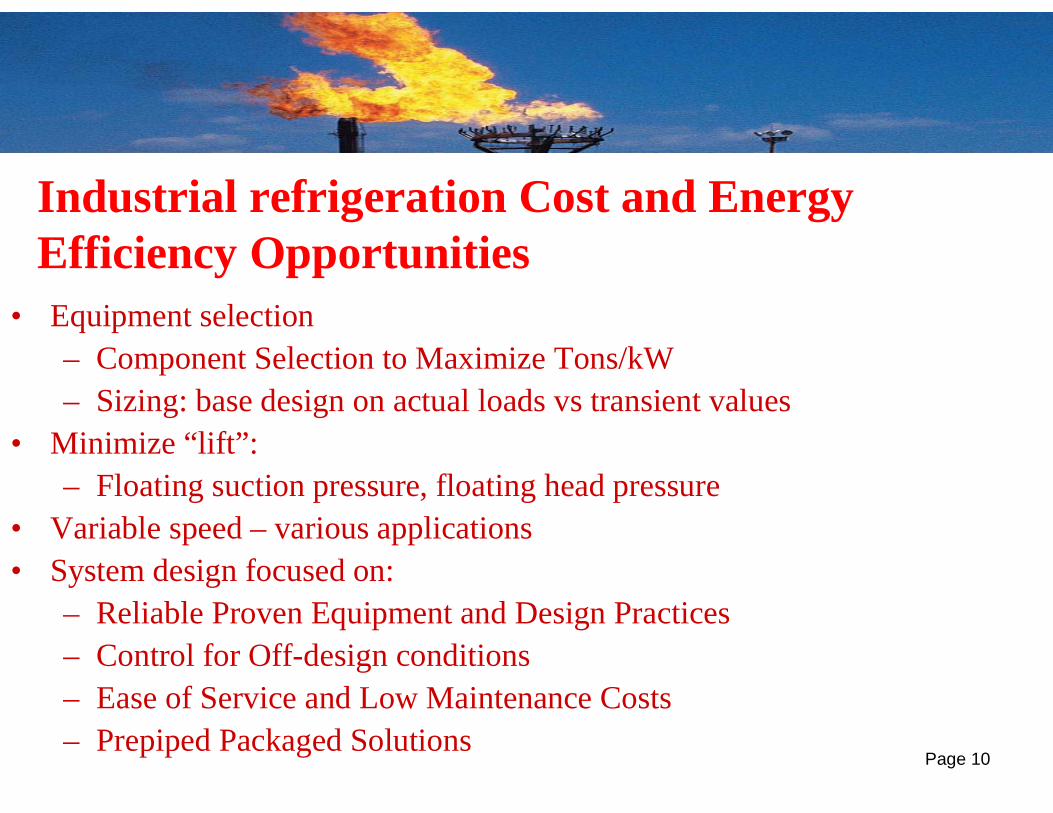
• Equipment selection– Component Selection to Maximize Tons/kW– Sizing: base design on actual loads vs transient values
• Minimize “lift”:– Floating suction pressure, floating head pressure
• Variable speed – various applications• System design focused on:
– Reliable Proven Equipment and Design Practices– Control for Off-design conditions– Ease of Service and Low Maintenance Costs– Prepiped Packaged Solutions
Industrial refrigeration Cost and EnergyEfficiency Opportunities
Page 11
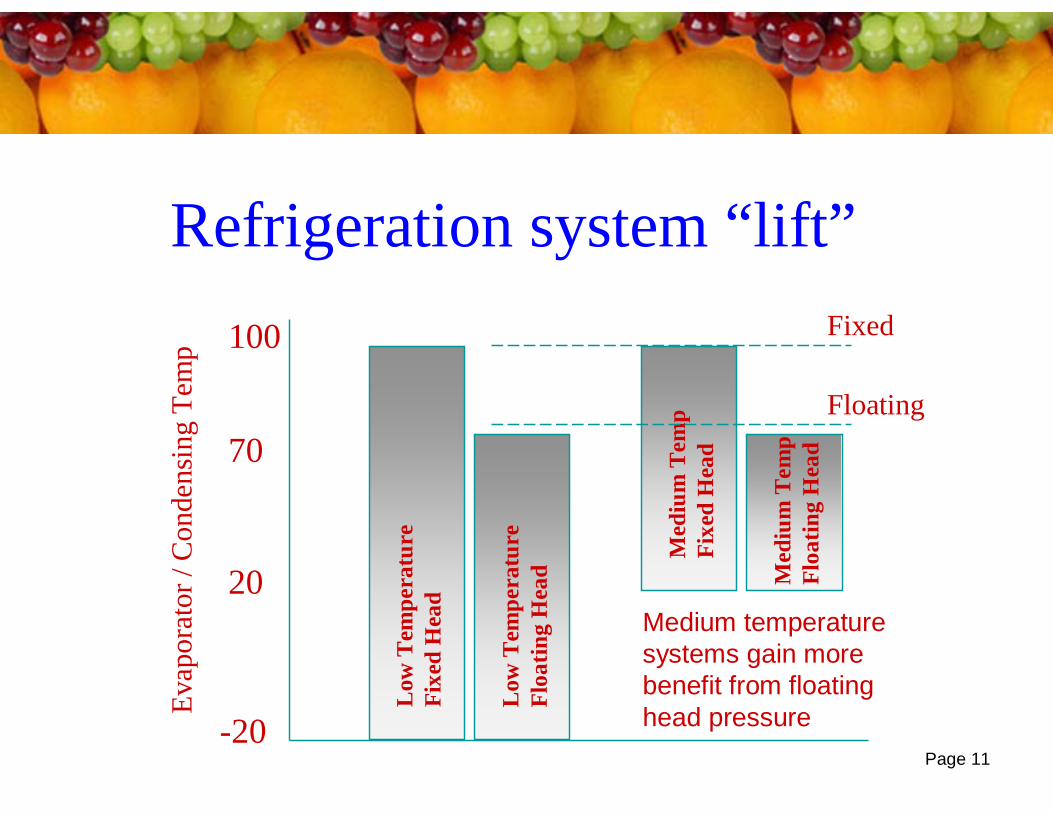
Refrigeration system “lift”E
vapo
rato
r / C
onde
nsin
g T
emp
-20
100
70
20
Low
Tem
pera
ture
Fix
ed H
ead
Low
Tem
pera
ture
Flo
atin
g H
ead
Med
ium
Tem
pF
ixed
Hea
d
Med
ium
Tem
pF
loat
ing
Hea
d
Fixed
Floating
Medium temperature systems gain more benefit from floating head pressure

Page 12
Condensers –design and selection practice
Nominal sizes stem from HVAC practiceAir cooled condensers
capacity varies with ambient Dry Bulb Temppast practice driven by limiting maximum pressuressizing TD of 10 F (LT) to 15 F (MT) unchanged for yearsbut, big range in motor size
Evap cooled condenserscapacity varies with Wet Bulb Temppast industry practice based on first cost (95 F SCT)TD declining over time: 25° >> 16° >> 10°(?)big range in fan power
Wide range of catalog efficiencies
Page 13
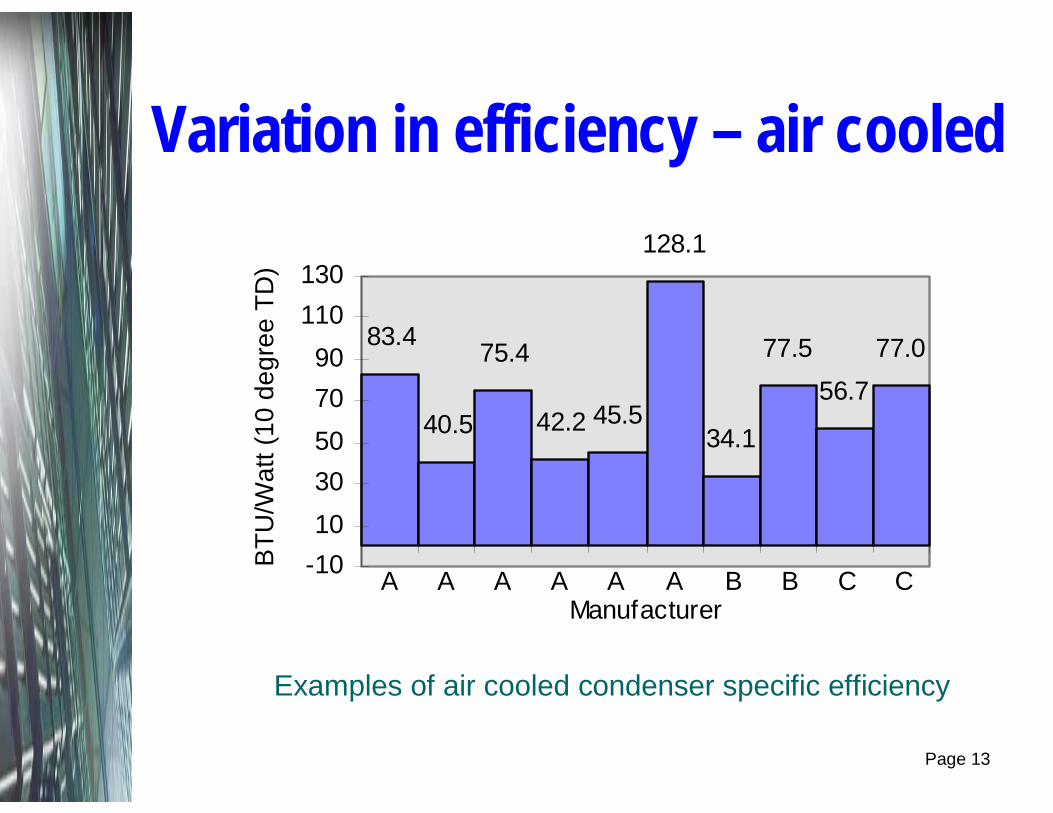
Variation in efficiency – air cooled
83.4
40.5
75.4
42.2 45.5
128.1
34.1
77.5
56.7
77.0
-10
10
30
50
70
90
110
130
A A A A A A B B C CManufacturer
BT
U/W
att (
10 d
egre
e T
D)
Examples of air cooled condenser specific efficiency

Page 14
Variation in efficiency – evap cooled
Examples of evap cooled condenser specific efficiency
151.7
213.3
130.2
310.6
115.3
161.8117.7
250.5
0
50
100
150
200
250
300
A A-R A A B B C CManufacturer
BT
U/W
att (
90 S
CT
, 72
WB
T)

Page 15
Heat Rejection Control:Floating Head Pressure and Variable Speed Application

Page 16
Fixed head pressure
0102030405060708090
100
Jan Feb Mar Apr May Jun Jly Aug Sep Oct Nov Dec
Ambient DBT Condensing Temperature

Page 17
Floating head pressure
0102030405060708090
100
Jan Feb Mar Apr May Jun Jly Aug Sep Oct Nov Dec
Ambient DBT Condensing Temperature

Page 18
Variable speed fan control –third power relationship
0 %
1 0 %
2 0 %
3 0 %
4 0 %
5 0 %
6 0 %
7 0 %
8 0 %
9 0 %
1 0 0 %
0 % 1 0 % 2 0 % 3 0 % 4 0 % 5 0 % 6 0 % 7 0 % 8 0 % 9 0 % 1 0 0 %
F a n S p e e d %
Fan
Po
wer
%
Capacity varies directly with change in airflow
Fan power varies with cube of change in airflow
80% speed = 51% power
50% speed = 12% power
Page 19
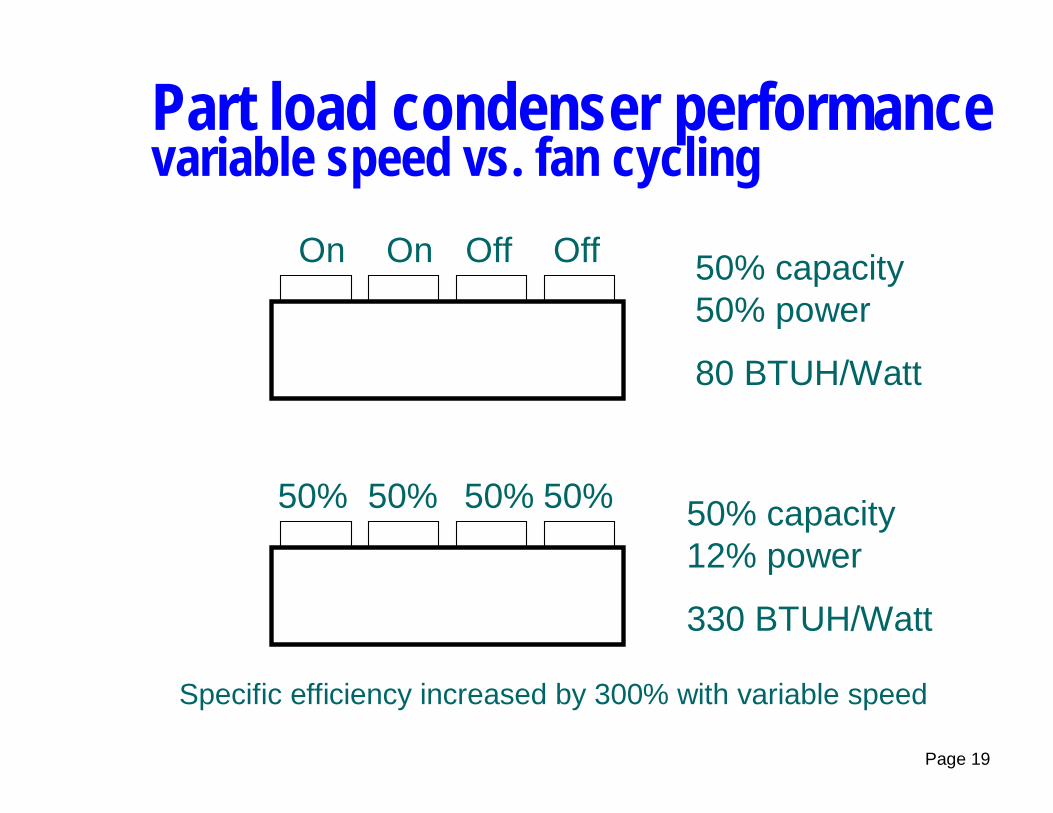
Part load condenser performancevariable speed vs. fan cycling
50% capacity 50% power
80 BTUH/Watt
50% capacity 12% power
330 BTUH/Watt
On On Off Off
50% 50% 50% 50%
Specific efficiency increased by 300% with variable speed
Page 20
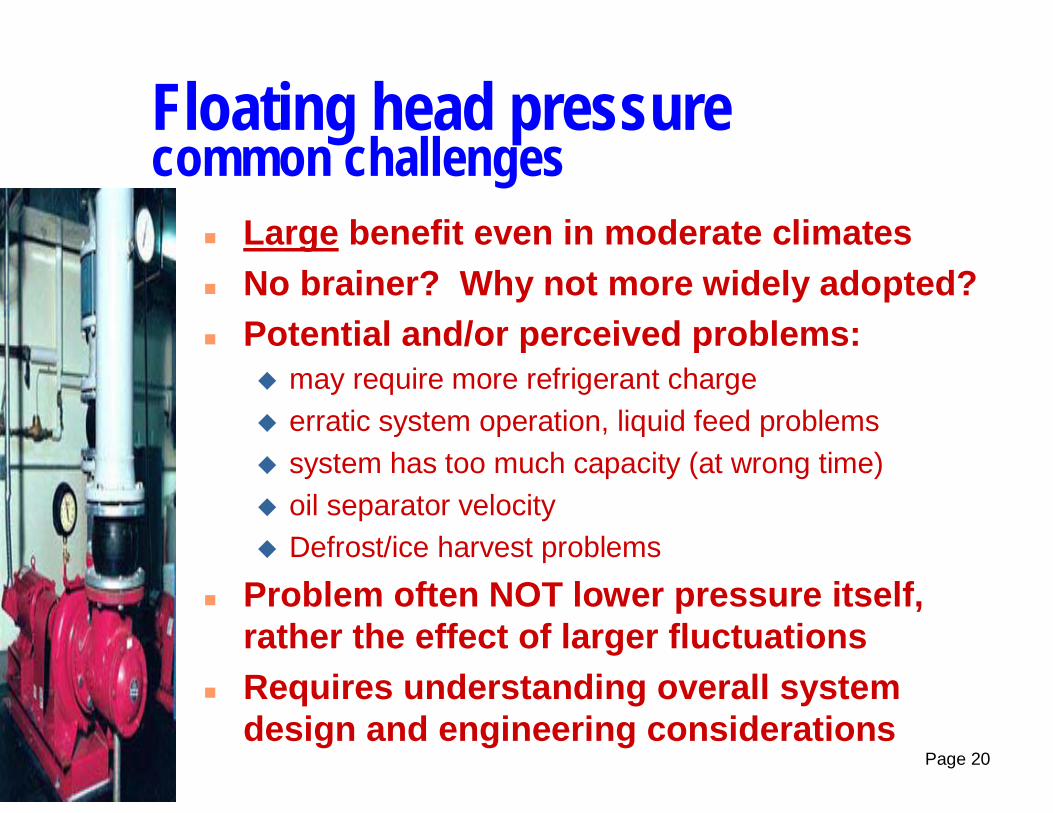
Floating head pressurecommon challenges
Large benefit even in moderate climatesNo brainer? Why not more widely adopted?Potential and/or perceived problems:
may require more refrigerant chargeerratic system operation, liquid feed problemssystem has too much capacity (at wrong time)oil separator velocityDefrost/ice harvest problems
Problem often NOT lower pressure itself, rather the effect of larger fluctuationsRequires understanding overall system design and engineering considerations

Page 21
Integrated heat rejection control –floating head pressure successfully
Condenser fan control, including:variable speed fanvariable setpoint control (change setpoint with weather)
Floating head pressuresavings with lower head pressuresavings with steady head pressure
Standardized approach consistent hardware configurationconsistent strategyconsistent back-up operation
Must be serviceable and understandable
Page 22
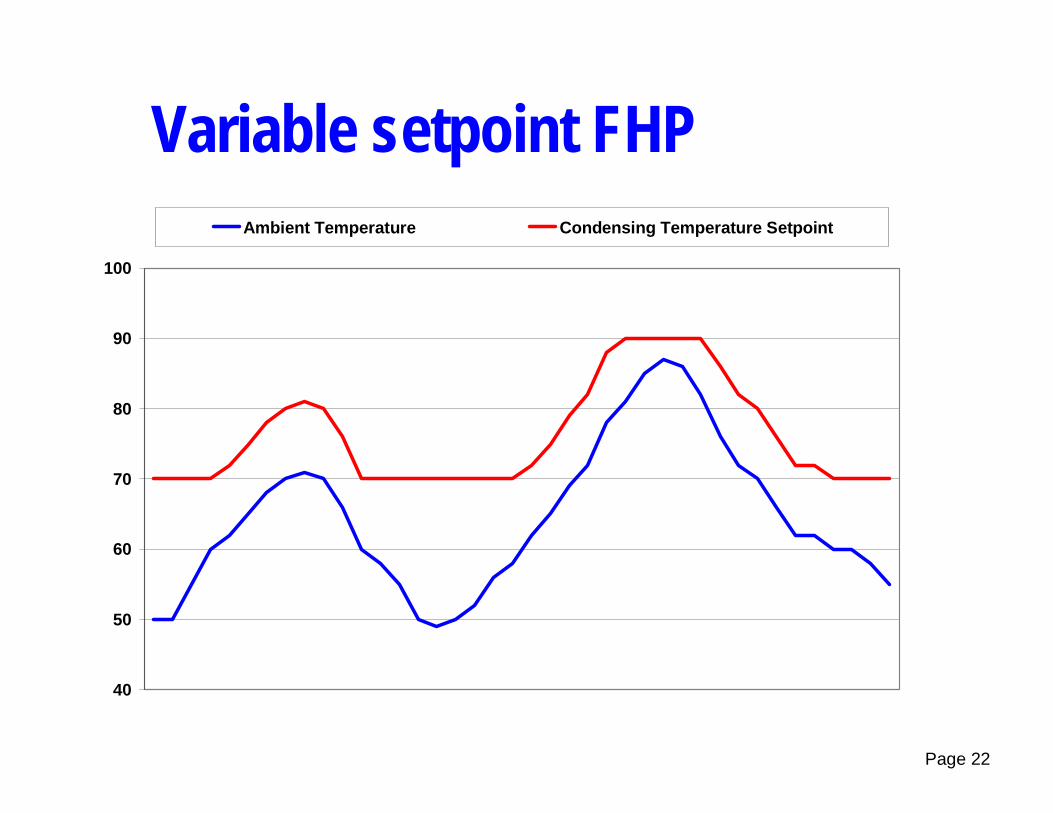
Variable setpoint FHP
40
50
60
70
80
90
100
Ambient Temperature Condensing Temperature Setpoint

Page 23
Air Unit Capacity Control
Page 24
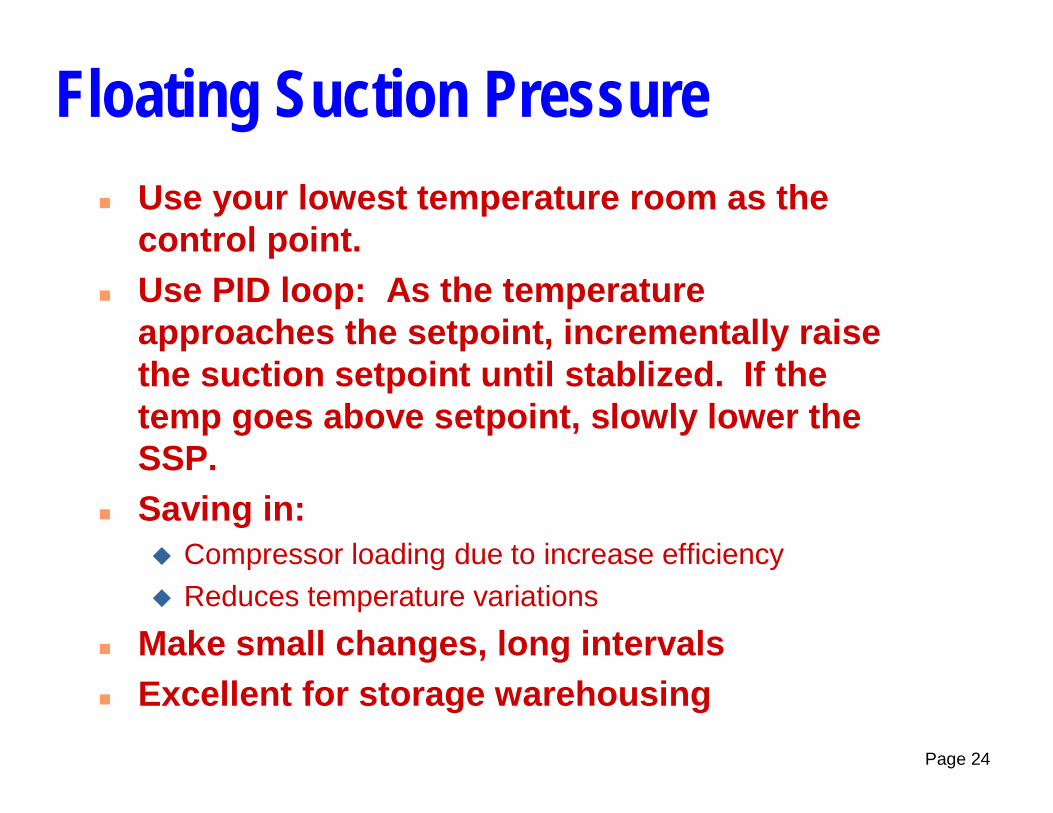
Floating Suction PressureUse your lowest temperature room as the control point.Use PID loop: As the temperature approaches the setpoint, incrementally raise the suction setpoint until stablized. If the temp goes above setpoint, slowly lower the SSP.Saving in:
Compressor loading due to increase efficiencyReduces temperature variations
Make small changes, long intervalsExcellent for storage warehousing
Page 25
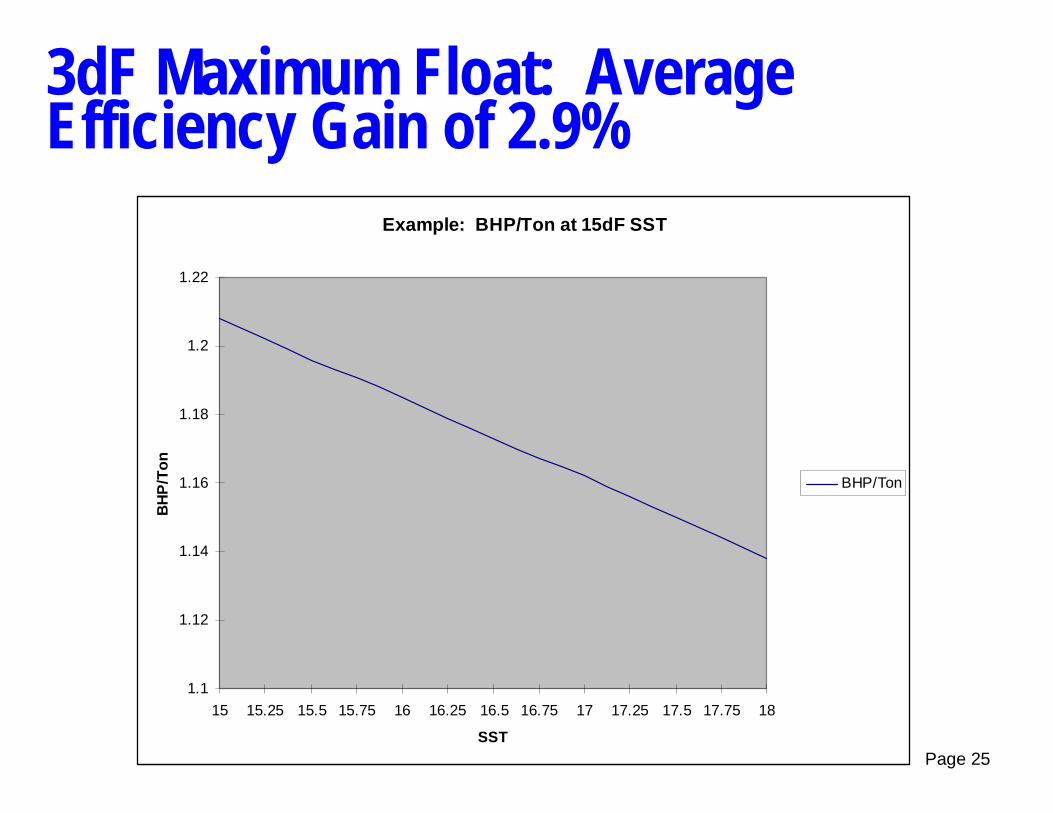
Example: BHP/Ton at 15dF SST
1.1
1.12
1.14
1.16
1.18
1.2
1.22
15 15.25 15.5 15.75 16 16.25 16.5 16.75 17 17.25 17.5 17.75 18
SST
BH
P/T
on
BHP/Ton
3dF Maximum Float: Average Efficiency Gain of 2.9%

Page 26
Variable volume variable temperature air unit control
Vary fan speed in freezers and coolers as primary means of temperature controlSaving in:
Fan energyRefrigeration cooling load (at high kW/Ton)
Third power rule applies to fan powerReduce speed to 60-70% then float suctionTypical concerns and response:
Motors burn up: use right motor, don’t run too slowAir falls on the floor: education, don’t run too slowCoils won’t feed, won’t defrost: don’t run too slow, try itNot good for rooms with high product pulldown req.

Page 27
Variable Speed Screw Compressor Capacity Control
Page 28
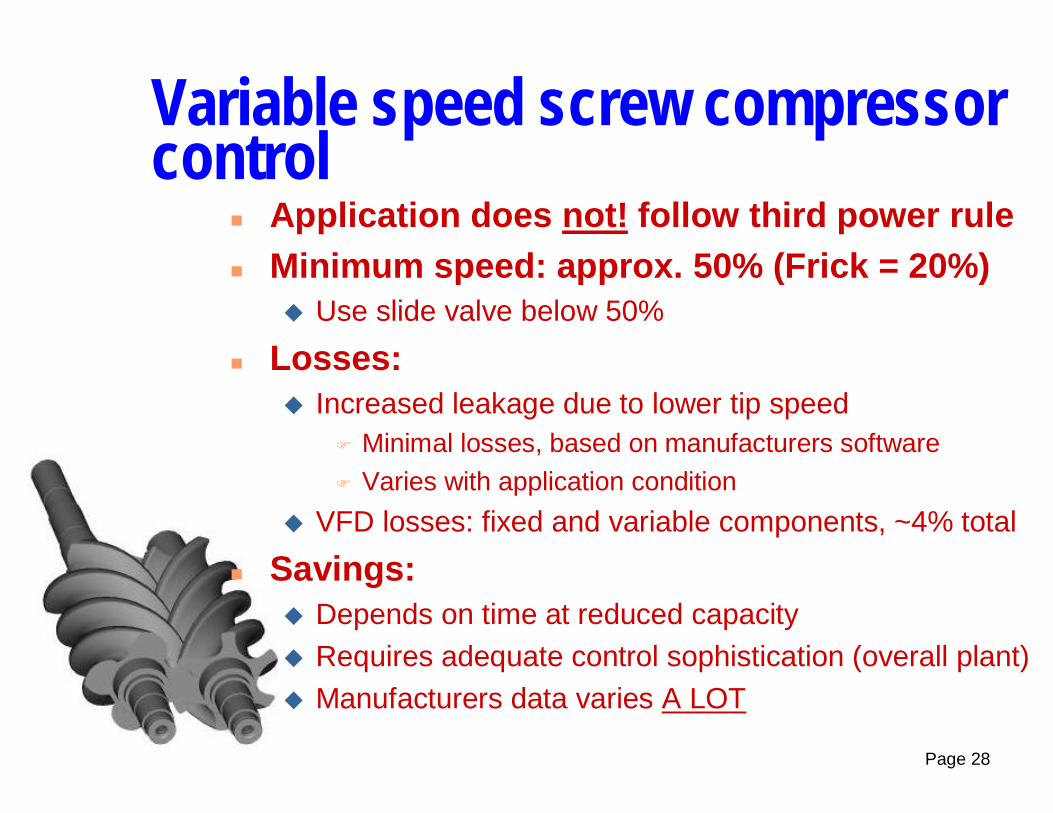
Variable speed screw compressor control
Application does not! follow third power ruleMinimum speed: approx. 50% (Frick = 20%)
Use slide valve below 50%
Losses:Increased leakage due to lower tip speed
Minimal losses, based on manufacturers software
Varies with application condition
VFD losses: fixed and variable components, ~4% total
Savings:Depends on time at reduced capacity Requires adequate control sophistication (overall plant)Manufacturers data varies A LOT
Page 29
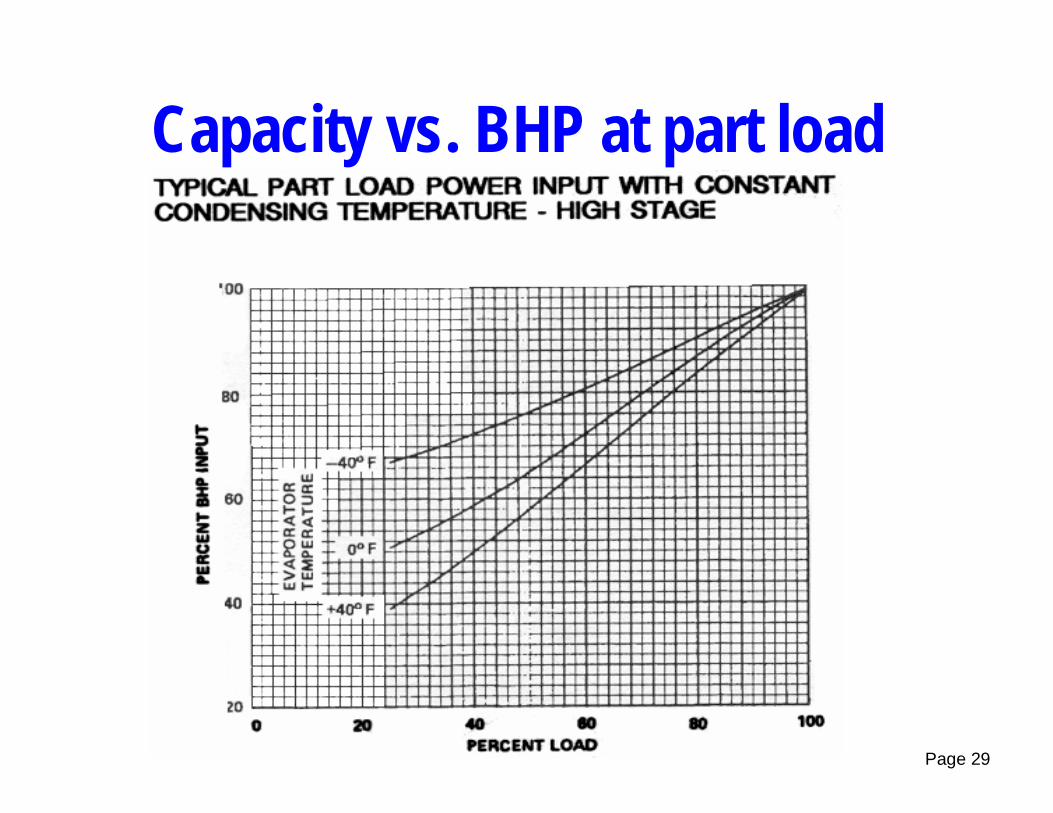
Capacity vs. BHP at part load

Page 30
Medium temp VFD vs. slide valve
9% improvement at 50%

Page 31
Low temp VFD vs. slide valve
12% improvement at 50%

Page 32
LT booster VFD vs. slide valve
45% improvement at 50%
Page 33
Compressor Control Strategies
Study the capacities and efficiencies of each compressor on a suction group.Bring on compressors that result in the smallest increment of capacity while maintaining 80% slide valve or more on the running compressorsUnload in the same fashionIn high demand areas, use offset suction pressure during the day, lower at night

Page 34
Demand Control in Industrial Refrigeration
Page 35
• Lower consumption (kWh) lowers demand (kW) passively.• Active Demand Control will likely increase consumption.• Dollar Savings Opportunities primarily during Peak
Demand.• Demand Costs vary by Utility and Rate Structure.• Primary Benefit during Summer Months (June-October).• Requires Active Schedule Change or Multiple Dated
Control Screens.• Demand Shifting vs Demand Control• Some Experimentation Involved.• User Specific. Must be Customized.• Not Everyone can Benefit.
Demand Management Issues
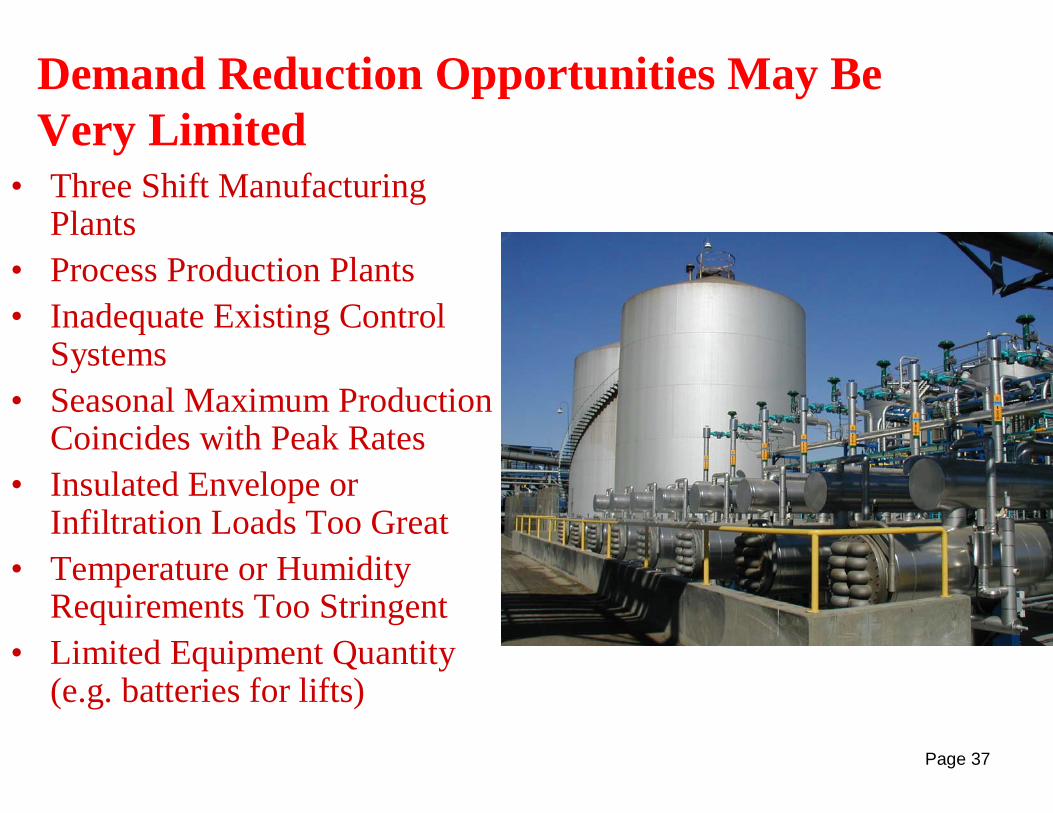
Page 37
Demand Reduction Opportunities May Be Very Limited
• Three Shift Manufacturing Plants
• Process Production Plants• Inadequate Existing Control
Systems• Seasonal Maximum Production
Coincides with Peak Rates• Insulated Envelope or
Infiltration Loads Too Great• Temperature or Humidity
Requirements Too Stringent• Limited Equipment Quantity
(e.g. batteries for lifts)

Page 45
Calculations:
Simple spreadsheet to estimate savings, generally, within 10%.
Page 46
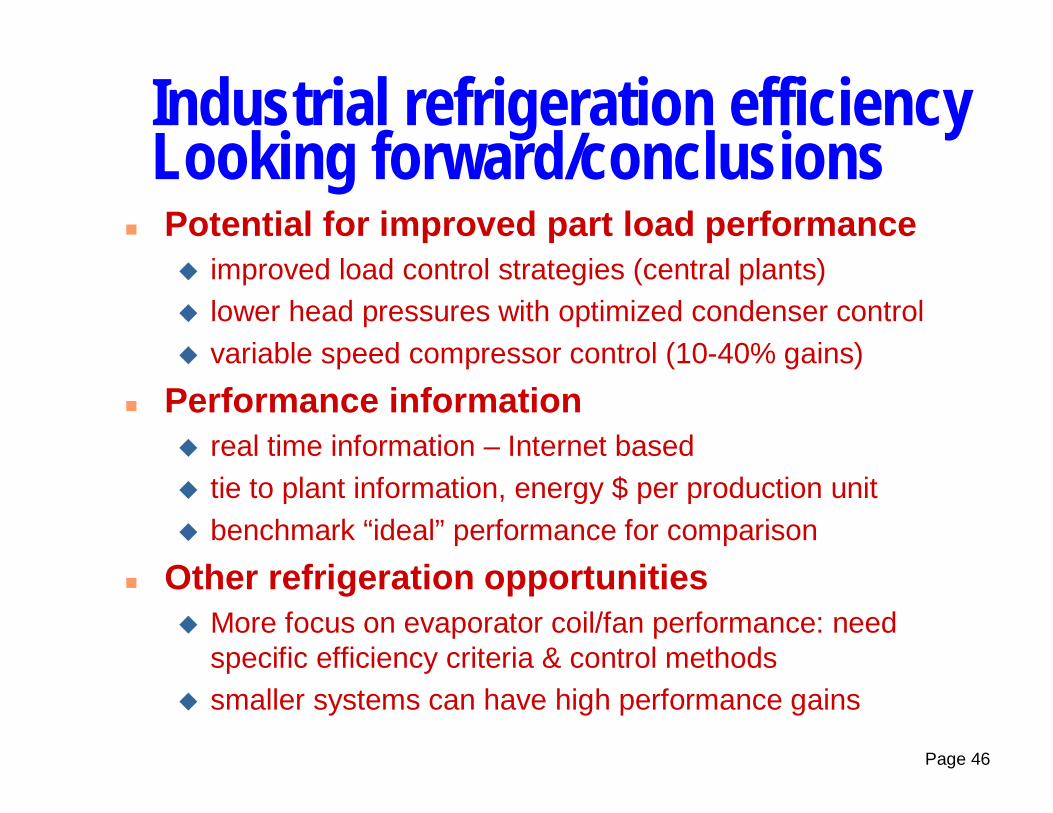
Industrial refrigeration efficiencyLooking forward/conclusionsPotential for improved part load performance
improved load control strategies (central plants)lower head pressures with optimized condenser controlvariable speed compressor control (10-40% gains)
Performance informationreal time information – Internet basedtie to plant information, energy $ per production unitbenchmark “ideal” performance for comparison
Other refrigeration opportunities More focus on evaporator coil/fan performance: need specific efficiency criteria & control methodssmaller systems can have high performance gains

Page 47
Giving you what you want:Improved control and record keeping of refrigeration and temperature for OSHA, EPA, and USDA review.Reduction in plant maintenance due to lower speeds, lower compression ratios.
Reduced Operating Expense = MORE PROFIT!