MIDLOTHIAN, TEXAS AMBIENT AIR COLLECTION … Ambient Air Collection and Chemical Analysis Group A...
52
Midlothian Ambient Air Collection and Chemical Analysis Group A – Project Management Quality Assurance Project Plan Revision No. 3 Page 1 of 16 February 9, 2009 MIDLOTHIAN, TEXAS AMBIENT AIR COLLECTION AND CHEMICAL ANALYSIS QUALITY ASSURANCE PROJECT PLAN Prepared for: Texas Commission on Environmental Quality 12100 Park 35 Circle Austin, TX 78753 Prepared by: URS Corporation 9400 Amberglen Boulevard Austin, TX 78729 Approvals: TCEQ Project Manager ______________________________________________________ Tracie Phillips Signature Date URS Project Manager ______________________________________________________ Al Hendler Signature Date URS Project QA Coordinator ________________________________________________ Don Burrows Signature Date ERG Laboratory Project Manager _______________________________________________ Julie L. Swift Signature Date
Transcript of MIDLOTHIAN, TEXAS AMBIENT AIR COLLECTION … Ambient Air Collection and Chemical Analysis Group A...
Midlothian Ambient Air Collection and Chemical Analysis Group A – Project Management
Quality Assurance Project Plan
Revision No. 3 Page 1 of 16 February 9, 2009
MIDLOTHIAN, TEXAS AMBIENT AIR COLLECTION AND CHEMICAL ANALYSIS
QUALITY ASSURANCE PROJECT PLAN
Prepared for:
Texas Commission on Environmental Quality 12100 Park 35 Circle
Austin, TX 78753
Prepared by:
URS Corporation 9400 Amberglen Boulevard
Austin, TX 78729
Approvals:
TCEQ Project Manager ______________________________________________________
Tracie Phillips Signature Date
URS Project Manager ______________________________________________________
Al Hendler Signature Date
URS Project QA Coordinator ________________________________________________
Don Burrows Signature Date
ERG Laboratory Project Manager _______________________________________________
Julie L. Swift Signature Date

Midlothian Ambient Air Collection and Chemical Analysis Group A – Project Management
Quality Assurance Project Plan
Revision No. 3 Page 2 of 16 February 9, 2009
A2 Table of Contents
Group/Element Page
A Project Management .................................................................................................. 1 of 16
A1 Title and Approval Sheet ............................................................................... 1 of 16
A2 Table of Contents ........................................................................................... 2 of 16
A3 Distribution List ............................................................................................. 4 of 16
A4 Project Organization ...................................................................................... 4 of 16
A5 Problem Definition/Background .................................................................... 6 of 16
A6 Project Description and Schedule .................................................................. 7 of 16
A7 Quality Objectives and Criteria ................................................................... 13 of 16
A8 Special Training ........................................................................................... 15 of 16
A9 Documents and Records .............................................................................. 15 of 16
B Data Generation and Acquisition ............................................................................... 1 of 30
B1 Sampling Design ............................................................................................ 1 of 30
B2 Sampling Methods ....................................................................................... 14 of 30
B2.1 Sampling Equipment ........................................................................ 14 of 30
B2.2 Sampling Procedures ....................................................................... 15 of 30
B3 Sample Handling and Custody ..................................................................... 16 of 30
B4 Analytical Methods ...................................................................................... 20 of 30
B5 Quality Control ............................................................................................ 21 of 30
B5.1 Field Quality Control ....................................................................... 21 of 30
B5.2 Analytical Quality Control ............................................................... 21 of 30
B6 Instrument/Equipment Testing, Inspection and Maintenance ..................... 27 of 30
B7 Instrument/Equipment Calibration and Frequency ...................................... 27 of 30
B8 Instrument/Acceptance of Supplies and Consumables ................................ 29 of 30
B9 Non-direct Measurements ............................................................................ 29 of 30
B10 Data Management ........................................................................................ 29 of 30
C Assessment and Oversight ........................................................................................... 1 of 1
C1 Assessment and Response Action .................................................................... 1 of 1
C2 Reports to Management ................................................................................... 1 of 1
D Data Validation and Usability ...................................................................................... 1 of 4
D1 Data Review, Verification, and Validation ...................................................... 1 of 4
D2 Verification and Validation Methods ............................................................... 3 of 4
D3 Reconciling with User Requirements .............................................................. 4 of 4
E References .................................................................................................................... 1 of 1

Midlothian Ambient Air Collection and Chemical Analysis Group A – Project Management
Quality Assurance Project Plan
Revision No. 3 Page 3 of 16 February 9, 2009
List of Tables
A6-1 List of Core Target Compounds, Analytical Methods, and Reporting Units ............ 9 of 16
A6-2 Task Descriptions and Completion Dates ................................................................ 10 of 16
A7-1 Measurement Data Quality Objectives .................................................................... 14 of 16
A7-2 Measurement Data Quality Objectives for Meteorological Parameters .................. 15 of 16
B1-1 Sampling Sites ........................................................................................................... 3 of 30
B1-2 Number of Samples Scheduled at Each Site .............................................................. 3 of 30
B2-1 Sampling Methods ................................................................................................... 14 of 30
B2-2 Sampling Design ...................................................................................................... 15 of 30
B2-3 Specifications for Sample Collection ....................................................................... 15 of 30
B2-4 Generic Site Visit Schedule ..................................................................................... 16 of 30
B3-1 Sample Preservation and Holding Time Requirements ........................................... 17 of 30
B4-1 Analytical Methods .................................................................................................. 20 of 30
B5-1 TO-15 (VOCs) Laboratory Quality Control ............................................................ 22 of 30
B5-2 IO-3.5 (Metals) Laboratory Quality Control ........................................................... 24 of 30
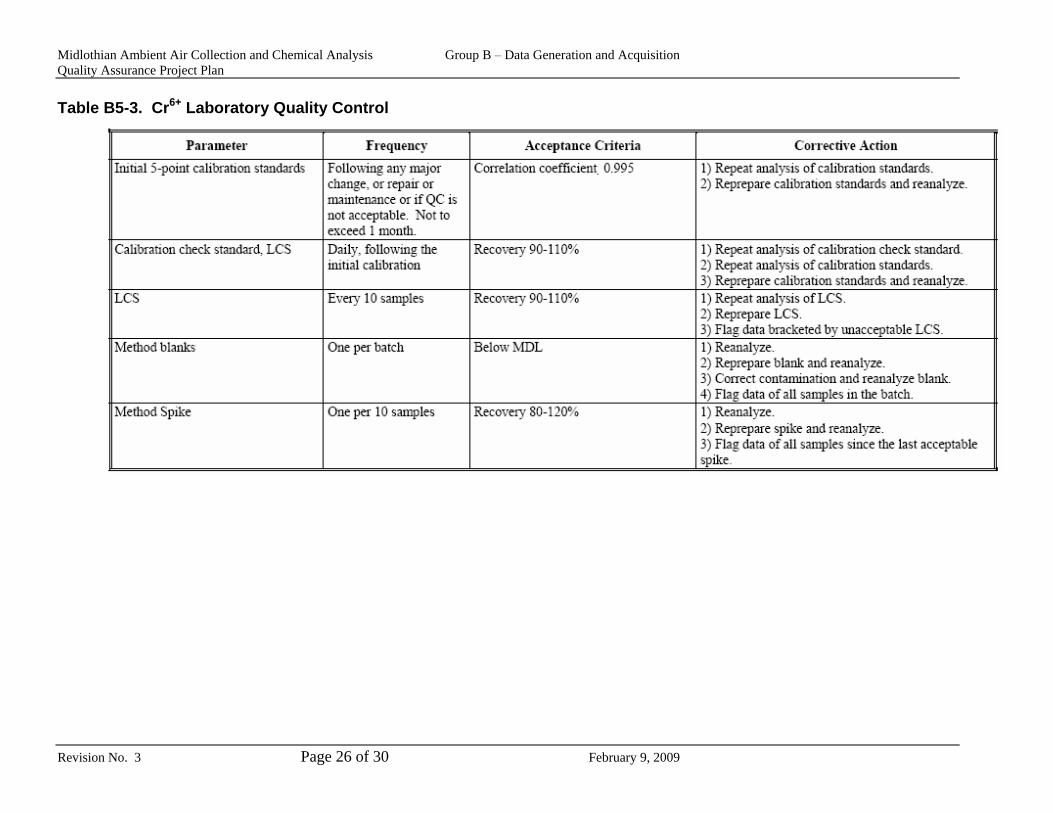
B5-3 Cr6+
Laboratory Quality Control .............................................................................. 26 of 30
B7-1 Meteorological Equipment Performance Checks .................................................... 28 of 30
D1-1 Laboratory Data Flags .................................................................................................. 1 of 4
D1-2 Chain of Custody Flags ................................................................................................ 2 of 4
D1-3 Field Operations and Maintenance Flags ..................................................................... 3 of 4
List of Figures
A4-1 Organizational Chart .................................................................................................. 5 of 16
A6-1 Fixed Sampling Sites and Stationary Emissions Sources ........................................ 11 of 16
A6-2 Temporary Sampling Sites ....................................................................................... 12 of 16
B1-1 Street Level Map ad Aerial Photo of Site 1 (CAMS 52) ........................................... 5 of 28
B1-2 Street Level Map ad Aerial Photo of Site 2 (Wyatt Rd.) ........................................... 6 of 28
B1-3 Street Level Map ad Aerial Photo of Site 3a (Triangle Park) .................................... 7 of 28
B1-4 Street Level Map ad Aerial Photo of Site 3b (Mountain Peak Elem..) ...................... 8 of 28
B1-5 Street Level Map ad Aerial Photo of Site 3c (Vitovsky Elem.) ................................. 9 of 28
B1-6 Street Level Map ad Aerial Photo of Site 3d (Midlothian H.S.).............................. 10 of 28
B1-7 Street Level Map ad Aerial Photo of Site 4 (Jaycee Park) ...................................... 11 of 28
B1-8 Street Level Map ad Aerial Photo of Site 5 (Water Treatment Facility) ................. 12 of 28
B3-1 TO-15 Canister Chain of Custody Form .................................................................. 18 of 28
B3-2 Cr6+ Filter Sample Chain of Custody Form ............................................................ 19 of 28

Midlothian Ambient Air Collection and Chemical Analysis Group A – Project Management
Quality Assurance Project Plan
Revision No. 3 Page 4 of 16 February 9, 2009
A3 Distribution List
Electronic copies of this QAPP and any subsequent revisions shall be distributed to the
following:
Texas Commission on Environmental Quality
12100 Park 35 Circle
Austin, TX 78753
Tracie Phillips, Project Manager
Michael Honeycutt
URS Corporation
9400 Amberglen Blvd.
Austin, TX 78729
Al Hendler, Project Manager
Don Burrows, Project QA Officer
Randy Stephens, Sample Collector
ERG
601 Keystone Park Drive, Suite 700
Durham, NC 27713
Julie L. Swift, Project Manager
Sample analysts
A4 Project Organization
The organizational structure of the Midlothian, Texas Ambient Air Collection and
Chemical Analysis Project is shown on Figure A4-1. The Texas Commission on Environmental
Quality (TCEQ) is the project sponsor and will be the primary data user. URS Corporation
(URS), as the prime contractor, will install and operate the sampling equipment, and report
validated measurement results to TCEQ. Eastern Research Group (ERG), as a subcontractor to
URS, will provide all the laboratory analytical services and sampling media. The specific roles
and responsibilities of each key team member are given below.

Midlothian Ambient Air Collection and Chemical Analysis Group A – Project Management
Quality Assurance Project Plan
Revision No. 3 Page 5 of 16 February 9, 2009
Figure A4-1. Organizational Chart
TCEQ:
Establishes the project objectives and experimental design (e.g., number and general
location of sampling stations, sampling frequency, air contaminants of interest, and
measurement methods)
Approves specific sampling sites
Determines uses of the measurement data
Al Hendler, URS Project Manager:
Responsible for implementing the contracted scope of work
Responsible for cost and schedule control
Responsible for deploying experienced field staff and sufficient equipment resources
Primary point of contact between the URS/ERG project team and TCEQ
Responsible for the quality and timeliness of all project deliverables
Lead report writer
TCEQ Project Manager
Tracie Phillips
Tracie Phillips
URS Project Manager
Al Hendler
Laboratory Support Task
Leader
Julie Swift, ERG
Sample Collector
Randy Stephens, URS
Quality Assurance Coordinator
Don Burrows, URS
Laboratory Analysts
Midlothian Ambient Air Collection and Chemical Analysis Group A – Project Management
Quality Assurance Project Plan
Revision No. 3 Page 6 of 16 February 9, 2009
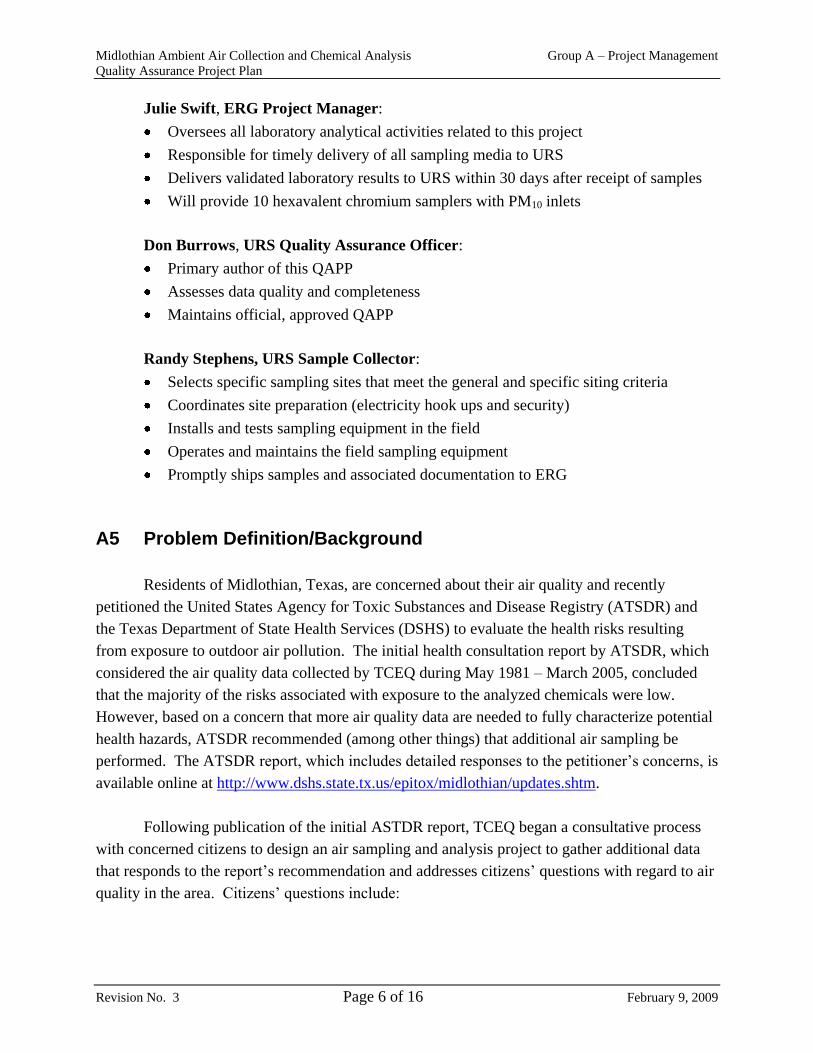
Julie Swift, ERG Project Manager:
Oversees all laboratory analytical activities related to this project
Responsible for timely delivery of all sampling media to URS
Delivers validated laboratory results to URS within 30 days after receipt of samples
Will provide 10 hexavalent chromium samplers with PM10 inlets
Don Burrows, URS Quality Assurance Officer:
Primary author of this QAPP
Assesses data quality and completeness
Maintains official, approved QAPP
Randy Stephens, URS Sample Collector:
Selects specific sampling sites that meet the general and specific siting criteria
Coordinates site preparation (electricity hook ups and security)
Installs and tests sampling equipment in the field
Operates and maintains the field sampling equipment
Promptly ships samples and associated documentation to ERG
A5 Problem Definition/Background
Residents of Midlothian, Texas, are concerned about their air quality and recently
petitioned the United States Agency for Toxic Substances and Disease Registry (ATSDR) and
the Texas Department of State Health Services (DSHS) to evaluate the health risks resulting
from exposure to outdoor air pollution. The initial health consultation report by ATSDR, which
considered the air quality data collected by TCEQ during May 1981 – March 2005, concluded
that the majority of the risks associated with exposure to the analyzed chemicals were low.
However, based on a concern that more air quality data are needed to fully characterize potential
health hazards, ATSDR recommended (among other things) that additional air sampling be
performed. The ATSDR report, which includes detailed responses to the petitioner’s concerns, is
available online at http://www.dshs.state.tx.us/epitox/midlothian/updates.shtm.
Following publication of the initial ASTDR report, TCEQ began a consultative process
with concerned citizens to design an air sampling and analysis project to gather additional data
that responds to the report’s recommendation and addresses citizens’ questions with regard to air
quality in the area. Citizens’ questions include:

Midlothian Ambient Air Collection and Chemical Analysis Group A – Project Management
Quality Assurance Project Plan
Revision No. 3 Page 7 of 16 February 9, 2009
How are industries in Midlothian affecting air quality?
Does the TCEQ every 6th
day monitoring site provide an accurate representation of
daily air concentrations?
What is the air quality close to schools and parks in Midlothian?
What percentage of total chromium does hexavalent chromium (Cr6+
) represent in
Midlothian?
The outcome of that consultative process was an experimental design for acquiring new
measurement data that specifies the air pollutants to be measured, number and general locations
of the sampling sites, sampling frequency and duration, and measurement methods. The
experimental design calls for measurements of 13 volatile organic compounds (VOCs) that may
be present in ambient air as well as 22 metals that may be suspended in air as particulate matter
in the PM10 size fraction, including Cr6+
. The plan calls for air sampling to be conducted in the
predominantly downwind direction from local stationary emissions sources and in several city
parks. Standard EPA measurement methods are to be used, with sample integration over 24-hour
periods (the same as samples collected by TCEQ at its Midlothian air monitoring station (CAMS
52).
A6 Project Description and Schedule
The levels of 13 VOCs and 22 metals (as PM10) that may be present in ambient air will be
measured in air samples collected periodically at multiple sites over a period of one year. The
samples will be analyzed offsite by a NELAC accredited laboratory under the Texas laboratory
accreditation program using U.S. Environmental Protection Agency (EPA) methods or EPA
referenced methods. Wind speed, wind direction, outdoor temperature, atmospheric pressure,
and rainfall will be monitored continuously at each site during each sampling episode to aid in
the data interpretation. Table 6A-1 lists the chemicals of interest and the respective
measurement methods.
Once each calendar quarter, air samples will be collected at five sampling stations during
five consecutive 24-hour periods (except during extended periods of rainfall or wind stagnation).
Four fixed sampling stations will remain in place long enough to sample during four consecutive
quarters. The fixed sampling sites will be roughly oriented in the predominantly downwind
direction from local stationary emissions sources. Another sampling station will be moved at the
end of each quarter so that it eventually samples for one 5-day sequence at each of four centrally
located city parks. Figures A6-1 and A6-2 show the general locations of the fixed and temporary
sampling sites, respectively.

Midlothian Ambient Air Collection and Chemical Analysis Group A – Project Management
Quality Assurance Project Plan
Revision No. 3 Page 8 of 16 February 9, 2009
The measurement results will be reported in three interim (quarterly) and one final report.
Quarterly reports and data sets (in spreadsheet format) will be delivered to TCEQ within 45 days
after the first, second, and third 5-day sampling episode. A final report and data delivery will
combine all the data from the entire project into a single document and spreadsheet, respectively.
Draft and final versions of the cumulative report will be delivered by July 31, 2009 and August
31, 2009, respectively. Each report will give the sampling dates, general weather conditions
(wind speed, wind direction, and measurable precipitation) during the sampling period, daily
wind roses, measurement results, and a series of tables and charts designed to facilitate the
analysis of spatial and temporal variability. Additionally, each report will include notes of field
and lab observations that may be helpful toward interpreting the measurement results,
particularly regarding circumstances or events that might jeopardize the representativeness or
validity of the data (e.g. dust from an adjacent unpaved area, nearby road construction, or an
unusually large number of vehicles idling or parking directly upwind). The report will also
contain any associated audit information (including meteorological field checks and laboratory
audits) with explanations of potential impacts on data quality and corrective actions.
The first 5-day sampling sequence will take place during the fourth quarter of 2008. The
major tasks associated with this project and scheduled completion dates are summarized in Table
6A-2.

Midlothian Ambient Air Collection and Chemical Analysis Group A – Project Management
Quality Assurance Project Plan
Revision No. 3 Page 9 of 16 February 9, 2009
Table A6-1. List of Target Compounds, Analytical Methods and Reporting Units
Target Compounds Sampling/Analysis Methods Reporting Units
Benzene
1,3-Butadiene
Carbon tetrachloride
Chloroform
1,2-Dibromoethane
1,2-Dichloroethane
Methylene chloride
1,1,2,2-Tetrachloroethane
1,1,2-Trichloroethane
1,2,4-Trimethylbenzene
1,3,5-Trimethylbenzene
Vinyl chloride
m&p-Xylene
EPA Compendium Method TO-15:
whole air sampling in passivated
stainless steel canister with analysis
using gas chromatography with
mass spectrometry detection
(GC/MS)
parts per billion by volume
(ppb-v)
Hexavalent chromium Modified CARB Method 039:
particle collection on NaHCO3-
impregnated cellulose filters using a
low volume sampler equipped with
a Teflon® coated PM10 cyclone
inlet; analysis is by ion
chromatography (IC)
nanograms per cubic meter
(ng/m3)
Antimony
Arsenic
Beryllium
Cadmium
Chromium
Cobalt
Lead
Manganese
Mercury
Nickel
Selenium
Aluminum
Barium
Copper
Molybdenum
Silver
Thallium
Thorium
Uranium
Vanadium
Zinc
EPA Compendium Method IO-3.5:
Particle collection on quartz fiber
filters using high volume samplers
equipped with PM10 inlets; analysis
is by inductively coupled
plasma/mass spectrometry
(ICP/MS)
ng/m3

Midlothian Ambient Air Collection and Chemical Analysis Group A – Project Management
Quality Assurance Project Plan
Revision No. 3 Page 10 of 16 February 9, 2009
Table A6-2. Task Descriptions and Completion Dates
Task Name Task Description Completion Date
Work Plan and QAPP URS will prepare a Work Plan
and QAPP for review and
approval by TCEQ
Draft due Sept. 5, 2008 (14 days
after contract signature by
TCEQ); revised within 3
business days after receiving
TCEQ comments on drafts
Mobilization URS will: (1) select specific
sampling sites (subject to TCEQ
approval); (2) acquire or
construct, and test, sampling
systems; (3) have sites prepared
with electricity service and
security fencing; and (4) install
sampling equipment
November 21, 2008
Field Sampling URS will collect samples
according the sampling methods
referenced and described in this
QAPP, and promptly ship the
samples to ERG for analysis
Sampling will be conducted
during four discrete episodes,
once per calendar quarter, the
last of which to be completed no
later than the first week of July
2009
Laboratory Analysis ERG will supply sampling
media and analyze the collected
samples according to the
methods referenced and
described in this QAPP
Quarterly data packages will be
sent to URS within 30 after the
end of each 5-day sampling
sequence; the last data package
will be sent no later than July
21, 2009
Reporting URS will report validated
measurement results to TCEQ in
quarterly intervals; Text reports
will describe the measurement
methods, general weather
conditions during the sampling
periods, measured
concentrations, and any
problems encountered during the
reporting period; data
spreadsheets will also be
provided
Interim reports will be provided
to TCEQ within 45 days after
the end of the first, second, and
third quarterly sampling
sequences. Draft Final and
Final reports will be delivered,
respectively, by July 31, 2009
and August 31, 2009
Shutdown Sampling stations will be
disassembled and the sites
restored to original conditions
August 31, 2009

Midlothian Ambient Air Collection and Chemical Analysis Group A – Project Management
Quality Assurance Project Plan
Revision No. 3 Page 11 of 16 February 9, 2009
Figure A6-1. Fixed Sampling Sites (Squares) and Stationary Emissions Sources (Circles)

Midlothian Ambient Air Collection and Chemical Analysis Group A – Project Management
Quality Assurance Project Plan
Revision No. 3 Page 12 of 16 February 9, 2009
Figure A6-2. Temporary Sampling Sites

Midlothian Ambient Air Collection and Chemical Analysis Group A – Project Management
Quality Assurance Project Plan
Revision No. 3 Page 13 of 16 February 9, 2009
A7 Quality Objectives and Criteria for Measurement Data
The key elements of the experimental design (e.g., the number and locations of the
sampling sites, sampling frequency and duration, total number of samples, target air pollutants,
and measurement methods) were developed through a consultative processing involving TCEQ
and concerned citizens of Midlothian. Specific measurement quality objectives (MQOs), which
are listed in Table A7-1, will serve as benchmarks for assessing whether the levels of data
quality expected from using the prescribed measurement methods and sampling locations are
achieved. The MQOs for air pollutant concentrations are defined in terms of the following data
quality indicators:
Precision - a measure of agreement among repeated measurements of the same
property usually under identical or substantially similar conditions. Measurement
precision will be assessed by collecting collocated samples (i.e., two side-by-side
samples collected at the same site over the same 24-hour period) once each calendar
quarter. Precision for each of the measured chemicals will be estimated by the
average relative percent difference between collocated measurement results.
Bias - the systematic or persistent distortion of a measurement process which causes
error in one direction. Bias for VOC measurements will be assessed before the start
of the sampling program by collecting samples of humidified calibration gas
standards drawn through each sampler. Bias for each VOC, expressed as a
percentage of the calibration gas standard concentration, will be estimated by
comparing the concentration measured in the collected sample to the known standard
concentration. Bias for metals measurements will be estimated from the results of
annual performance audits of the ERG laboratory by EPA.
Representativeness - a qualitative term that expresses the degree to which data
accurately and precisely represent an environmental condition. Measurement data for
this project are to be representative of the air quality and meteorological conditions
within a few city blocks of the general locations prescribed by the experimental
design. This is sometimes referred to as middle scale representativeness.
Detection Limits - the minimum concentration that can reliably be measured by an
instrument or laboratory.
Completeness - a measure of the amount of valid data needed to be obtained from a
measurement system (relative to the amount that was expected to be obtained based
on the experimental design and schedule).
Comparability - a qualitative term that expresses the measure of confidence with
which one data set can be compared to another. Measurement data for this project are
to be comparable to measurements routinely made by TCEQ at CAMS 52 and other
air quality monitoring sites in Texas.
More detailed descriptions of these MQOs and how they will be used to control and
assess measurement uncertainty are described in other elements of this QAPP.

Midlothian Ambient Air Collection and Chemical Analysis Group A – Project Management
Quality Assurance Project Plan
Revision No. 3 Page 14 of 16 February 9, 2009
Table A7-1. Measurement Quality Objectives
Parameter Units Precision Accuracy Representativeness Comparability/
Method Selection
Method Detection
Limit Completeness
Benzene ppb-v 30 % ±30 % Middle Scale TO-15 0.004 ppbv > 75%
1,3-Butadiene ppb-v 30 % ±30 % Middle Scale TO-15 0.005 ppbv > 75%
Carbon tetrachloride ppb-v 30 % ±30 % Middle Scale TO-15 0.004 ppbv > 75%
Chloroform ppb-v 30 % ±30 % Middle Scale TO-15 0.007 ppbv > 75%
1,2-Dibromoethane ppb-v 30 % ±30 % Middle Scale TO-15 0.007 ppbv > 75%
1,2-Dichloroethane ppb-v 30 % ±30 % Middle Scale TO-15 0.009 ppbv > 75%
Methylene chloride ppb-v 30 % ±30 % Middle Scale TO-15 0.018 ppbv > 75%
1,1,2,2-Tetrachloroethane ppb-v 30 % ±30 % Middle Scale TO-15 0.009 ppbv > 75%
1,1,2-Trichloroethane ppb-v 30 % ±30 % Middle Scale TO-15 0.008 ppbv > 75%
Cr+6 µg/m3 30 % ±30 % Middle Scale Modified CARB 039 0.0065 ng/m3 > 75%
Antimony µg/m3 20 % ±20 % Middle Scale IO-3.5 0.0061 ng/m3 > 75%
Arsenic µg/m3 20 % ±20 % Middle Scale IO-3.5 0.0102 ng/m3 > 75%
Beryllium µg/m3 20 % ±20 % Middle Scale IO-3.5 0.0124 ng/m3 > 75%
Cadmium µg/m3 20 % ±20 % Middle Scale IO-3.5 0.0076 ng/m3 > 75%
Chromium µg/m3 20 % ±20 % Middle Scale IO-3.5 0.1785 ng/m3 > 75%
Cobalt µg/m3 20 % ±20 % Middle Scale IO-3.5 0.0088 ng/m3 > 75%
Lead µg/m3 20 % ±20 % Middle Scale IO-3.5 0.1066 ng/m3 > 75%
Manganese µg/m3 20 % ±20 % Middle Scale IO-3.5 0.0214 ng/m3 > 75%
Mercury µg/m3 20 % ±20 % Middle Scale IO-3.5 0.0241 ng/m3 > 75%
Nickel µg/m3 20 % ±20 % Middle Scale IO-3.5 0.1103 ng/m3 > 75%
Selenium µg/m3 20 % ±20 % Middle Scale IO-3.5 0.0240 ng/m3 > 75%
Aluminum µg/m3 20 % ±20 % Middle Scale IO-3.5 0.0081 ng/m3 > 75%
Barium µg/m3 20 % ±20 % Middle Scale IO-3.5 0.0814 ng/m3 > 75%
Copper µg/m3 20 % ±20 % Middle Scale IO-3.5 0.0081 ng/m3 > 75%
Molybdenum µg/m3 20 % ±20 % Middle Scale IO-3.5 0.0163 ng/m3 > 75%
Silver µg/m3 20 % ±20 % Middle Scale IO-3.5 0.0081 ng/m3 > 75%
Thallium µg/m3 20 % ±20 % Middle Scale IO-3.5 0.0081 ng/m3 > 75%
Thorium µg/m3 20 % ±20 % Middle Scale IO-3.5 0.0081 ng/m3 > 75%
Uranium µg/m3 20 % ±20 % Middle Scale IO-3.5 0.0081 ng/m3 > 75%
Vanadium µg/m3 20 % ±20 % Middle Scale IO-3.5 0.0081 ng/m3 > 75%
Zinc µg/m3 20 % ±20 % Middle Scale IO-3.5 0.0325 ng/m3 > 75%

Midlothian Ambient Air Collection and Chemical Analysis Group A – Project Management
Quality Assurance Project Plan
Revision No. 3 Page 15 of 16 February 9, 2009
Table A7.2 Measurement Quality Objectives for Meteorological Parameters
Measurement
Parameter Measurement Method Precision Criteria
Accuracy
Criteria
Completeness
Criteria
Wind Direction Vane/ Potentiometer Not Assessed 5 azimuthc >90%
Wind Speed Anemometer (3-cup)/
Pulse Frequency
Counter
Not Assessed 1.12 miles per
hourc
>90%
Ambient Temperature Aspirated Thermistor Not Assessed 1.8 Fahrenheitc >90%
Rainfall Tipping Bucket Not Assessed 10 % of readingc >90%
Barometric Pressure Pressure Transducer Not Assessed 0.30 in.Hg >90%
aPrecision of meteorological systems is typically not assessed, nor is it prescribed by EPA. cRepresents total error for the measurement, taking into account sensor and data logger bias contributions
A8 Special Training
No special training is required for this project. All the field and laboratory personnel
supporting this project have many years experience using the equipment and procedures of this
project. The analytical laboratory must have NELAP accreditation through the State of Texas.
A9 Documents and Records
Data will be reported to TCEQ as part of text reports, saved in Microsoft Word or Adobe
Acrobat formats, and in Microsoft Excel spreadsheets. Every data package delivered to TCEQ
will include the following information for each measurement value:
Sample date
Sampling site
Sample identification number assigned by the laboratory
Date of analysis
Chemical name
Measurement value
Quality assurance flag
Sample-specific detection limit
Unit of measure.
Written reports, in addition to presenting measurement results, will describe the general
weather conditions during each sampling period, any problems encountered, and corrective
actions. Meteorological data (measurements of wind speed, wind direction, temperature,

Midlothian Ambient Air Collection and Chemical Analysis Group A – Project Management
Quality Assurance Project Plan
Revision No. 3 Page 16 of 16 February 9, 2009
pressure, and rainfall) will be reported as 1-hour averages in text reports and as both 5-minute
and 1-hour averages in spreadsheet files.
URS will maintain field operation records, including copies of the site visit logbooks,
sampler flow rate calibrations and quality control checks, chain-of-custody records, and sample
shipping forms in the project file for a minimum of 10 years. Copies of these records will be
made available to TCEQ upon request.
ERG has a structured records management retrieval system that allows for the efficient
archive and retrieval of records. The data collected in the laboratory will be included in this
system. Each laboratory archives the data from the computer systems on a compact disk (CD) or
flash drive. All data are then stored on location in a temperature-controlled environment for up
to five years after the close of each contract. The laboratory paper copies of all analyses are
stored on site in a secured temperature-controlled laboratory area for easy retrieval. ERG will
maintain all laboratory notes and raw data for at least 5 years from the date of the end of the
closed project. However, if any litigation, claim, negotiation, audit or other action involving the
records has been started before the expiration of the 5-year period, the records will be retained
until completion of the action and resolution of all issues which arise from it, or until the end of
the regular 5-year period, whichever is later.
Updates to this QAPP will be distributed by the URS Project Manager to the individual
listed in A3 via email.

Midlothian Ambient Air Collection and Chemical Analysis Group B – Data Generation and Acquisition
Quality Assurance Project Plan
Revision No. 3 Page 1 of 30 February 9, 2009
B DATA GENERATION AND ACQUISITION
B1 Sampling Design
Air sampling for selected air contaminants will be conducted during four separate five-
day periods (sampling episodes). One sampling episode will take place per calendar quarter for
four consecutive quarters, beginning with the fourth quarter of 2008. The sampling episodes
may take place at any time within a calendar quarter as long as: (1) each episode begins at least
21 days after the end of the previous episode and (2) at least one 24-hour period during the
episode coincides with a scheduled TCEQ sampling day at CAMS 52. URS will schedule each
sampling episode at least one week in advance after consulting with TCEQ and considering both
staff availability and the long-range weather forecast (periods of persistent rainfall or stagnation
will be avoided). A tentative Sampling Schedule is given below.

Midlothian Ambient Air Collection and Chemical Analysis Group B – Data Generation and Acquisition
Quality Assurance Project Plan
Revision No. 3 Page 2 of 30 February 9, 2009
During each sampling episode, 24-hour integrated samples will be collected, starting at
midnight, on five consecutive days except during periods of excessive rainfall or stagnation.
Any sampling episode may be temporarily suspended due to forecasted or current weather
conditions so that no more than 25% of the samples will be collected under the following
conditions:
Stagnant wind conditions, defined as no wind movement for 25% or more of the
scheduled sampling period (i.e., no more than six hours per 24-hour sample and no
more than 30 hours per 120 total hours). The standard for ―no wind movement‖ is
wind speed less than three miles per hour (3 mph).
Significant rain event, defined as measureable rainfall occurring for 25% or more of
the scheduled sampling period (i.e., no more than six hours per 24-hour sample and
no more than 30 hours per 120 total hours).
During each sampling episode, samples will be collected at five sites. Four sites will be
fixed for the entire project. That is, samples will be collected during all four 5-day sampling
episodes. Another four sites will be temporary. Samples will be collected at each temporary site
during only one sampling episode. The following general criteria were used to select sampling
sites:
One fixed site will be collocated with TCEQ Continuous Air Monitoring Station
(CAMS) 52 (samples will be collected at fixed sites during four consecutive calendar
quarters)
One fixed site will be located in the predominantly downwind direction from the
Gerdau Ameristeel facility near the intersection of Highway 67 and Wyatt Road
Temporary sites will be located near Civic Center Park, Kimmel Park, Triangle Park,
and Hawkins Spring Park (samples will be collected at each temporary site during
one calendar quarter)
One fixed site will be located near Jaycee Park
One fixed site will be located north (predominantly downwind) of the Ash Grove
Texas, LP facility.
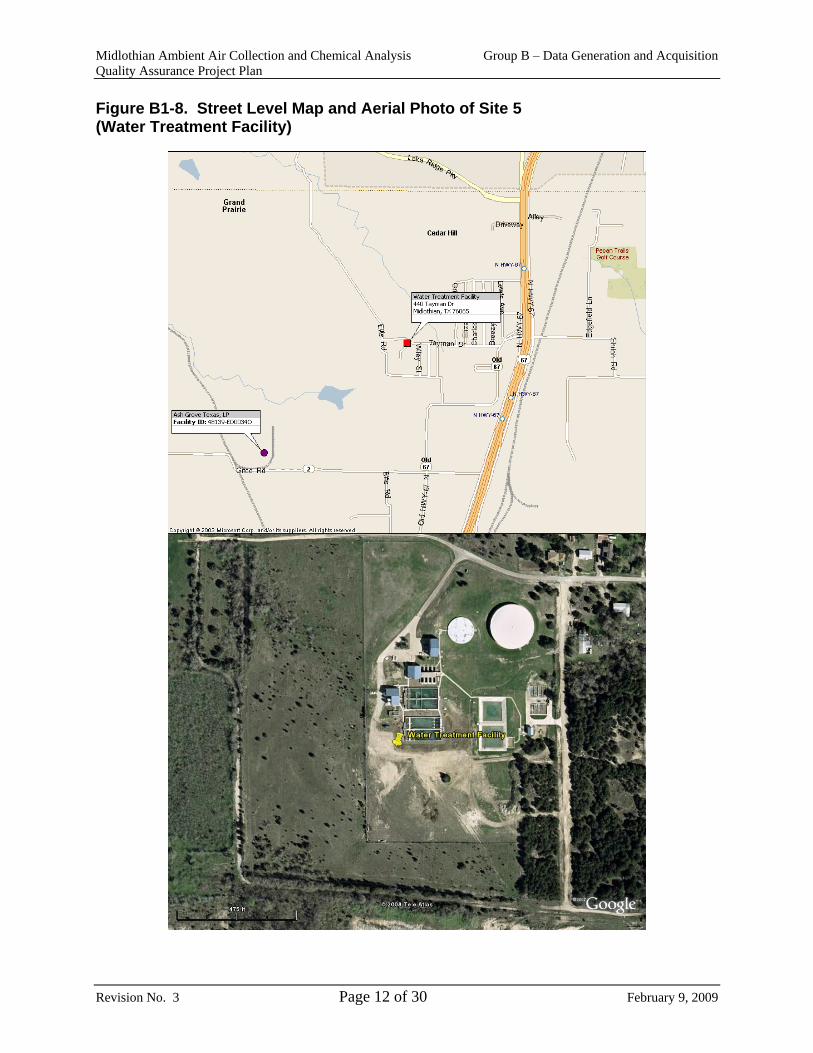
The latitude/longitude coordinates and nearest street address of each sampling site are
given in Table B1-1. Street level maps and aerial photos showing the locations of each site are
given in Figures B1-1 through B1-8. Note that Site 5, Midlothian Water Treatment Facility is
northeast – not north – of the Ash Grove Texas LP facility. This alternate location was chose
because no reasonably secure location with readily accessible electricity service was available
within 1 – 2 miles directly north of the cement manufacturing facility.

Midlothian Ambient Air Collection and Chemical Analysis Group B – Data Generation and Acquisition
Quality Assurance Project Plan
Revision No. 3 Page 3 of 30 February 9, 2009
Table B1-1. Sampling Sites
Site No. Site Name Street Address Latitude Longitude
Fixed Sites
1 CAMS 52 Collocated 2725 Old Fort Worth Rd. 32.4822 -97.0269
2 Wyatt Rd.(N. of Gerdau
Ameristeel)
1291 E. Wyatt Rd. 32.4696 97.0372
4 Jaycee Park 1711 Meadow Ln. 32.5030 -96.9976
5 Water Treatment Plant (N.
of Ash Grove)
440 Tayman Dr. 32.5301 -96.9918
Temporary Sites
Site 3a Triangle Park 200 E Ave. G 32.4823 -96.9917
Site 3b Mountain Peak Elem. Sch. 5201 FM 663 32.42897 -97.0014
Site 3c Vitovsky Elem. Sch. 333 Church St. 32.50068 -96.9922
Site 3d Midlothian H.S. 923 South 9th St. 32.4732 -96.9964
Table B1-2. Number of Samples Scheduled at Each Site
Site No. Site Name Number of Samples
PM10 Cr6+
VOC
Fixed Sites
1 CAMS 52 Collocated 20 20 20
2 Wyatt Road 20 20 0
4 Jaycee Park 20 20 20
5 Water Treatment Plant 20 20 20
Temporary Sites
Site 3a Triangle Park 5 5 5
Site 3b Mountain Peak Elem. Sch. 5 5 5
Site 3c Vitovsky Elem. Sch. 5 5 5
Site 3d Midlothian H.S. 5 5 5
Midlothian Ambient Air Collection and Chemical Analysis Group B – Data Generation and Acquisition
Quality Assurance Project Plan
Revision No. 3 Page 4 of 30 February 9, 2009
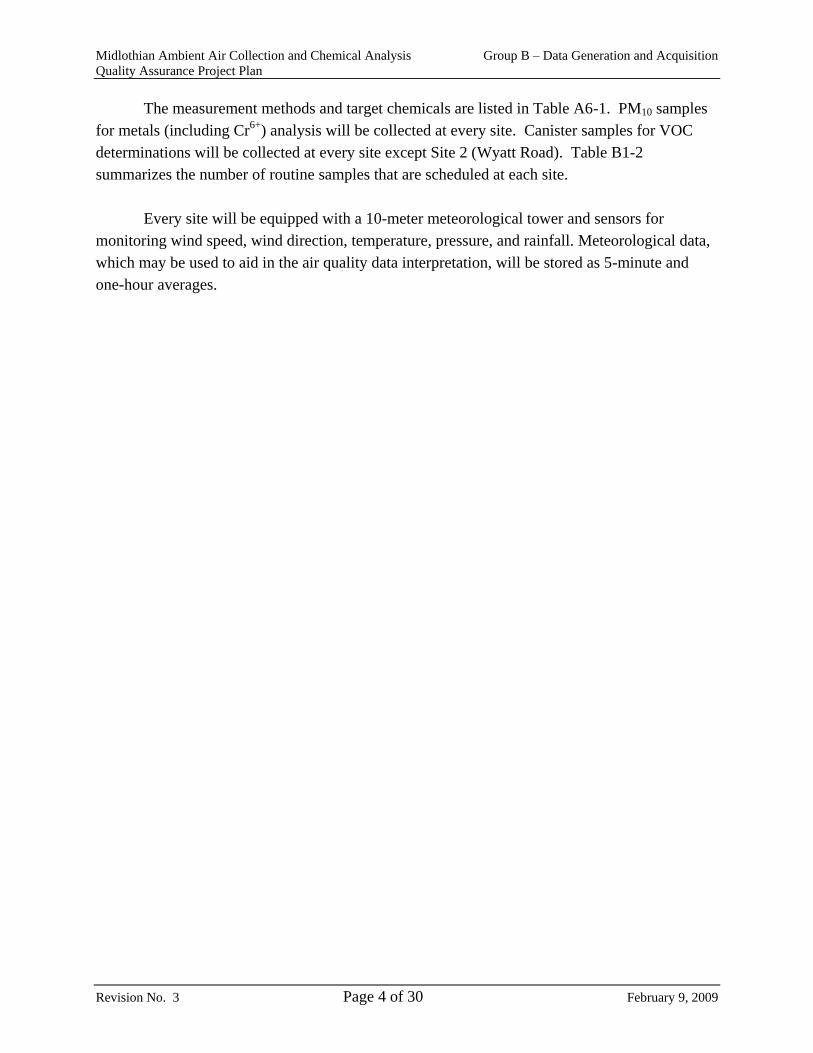
The measurement methods and target chemicals are listed in Table A6-1. PM10 samples
for metals (including Cr6+
) analysis will be collected at every site. Canister samples for VOC
determinations will be collected at every site except Site 2 (Wyatt Road). Table B1-2
summarizes the number of routine samples that are scheduled at each site.
Every site will be equipped with a 10-meter meteorological tower and sensors for
monitoring wind speed, wind direction, temperature, pressure, and rainfall. Meteorological data,
which may be used to aid in the air quality data interpretation, will be stored as 5-minute and
one-hour averages.

Midlothian Ambient Air Collection and Chemical Analysis Group B – Data Generation and Acquisition
Quality Assurance Project Plan
Revision No. 3 Page 5 of 30 February 9, 2009
Figure B1-1. Street Level Map and Aerial Photo of Site 1 (CAMS 52)

Midlothian Ambient Air Collection and Chemical Analysis Group B – Data Generation and Acquisition
Quality Assurance Project Plan
Revision No. 3 Page 6 of 30 February 9, 2009
Figure B1-2. Street Level Map and Aerial Photo of Site 2 (Wyatt Rd.)

Midlothian Ambient Air Collection and Chemical Analysis Group B – Data Generation and Acquisition
Quality Assurance Project Plan
Revision No. 3 Page 7 of 30 February 9, 2009
Figure B1-3. Street Level Map and Aerial Photo of Site 3a (Triangle Park)

Midlothian Ambient Air Collection and Chemical Analysis Group B – Data Generation and Acquisition
Quality Assurance Project Plan
Revision No. 3 Page 8 of 30 February 9, 2009
Figure B1-4. Street Level Map and Aerial Photo of Site 3b (Mountain Peak Elem.)

Midlothian Ambient Air Collection and Chemical Analysis Group B – Data Generation and Acquisition
Quality Assurance Project Plan
Revision No. 3 Page 9 of 30 February 9, 2009
Figure B1-5. Street Level Map and Aerial Photo of Site 3c (Vitovsky Elem.)

Midlothian Ambient Air Collection and Chemical Analysis Group B – Data Generation and Acquisition
Quality Assurance Project Plan
Revision No. 3 Page 10 of 30 February 9, 2009
Figure B1-6. Street Level Map and Aerial Photo of Site 3d (Midlothian H.S.)

Midlothian Ambient Air Collection and Chemical Analysis Group B – Data Generation and Acquisition
Quality Assurance Project Plan
Revision No. 3 Page 11 of 30 February 9, 2009
Figure B1-7. Street Level Map and Aerial Photo of Site 4 (Jaycee Park)
Midlothian Ambient Air Collection and Chemical Analysis Group B – Data Generation and Acquisition
Quality Assurance Project Plan
Revision No. 3 Page 12 of 30 February 9, 2009
Figure B1-8. Street Level Map and Aerial Photo of Site 5 (Water Treatment Facility)

Midlothian Ambient Air Collection and Chemical Analysis Group B – Data Generation and Acquisition
Quality Assurance Project Plan
Revision No. 3 Page 13 of 30 February 9, 2009
B2 Sampling Methods
B2.1 Sampling Equipment
Particulate matter samples in the PM10 size fraction (for the determination of metals other
than Cr6+
) will be collected on 8‖ x 10‖ quartz fiber filters using conventional federal reference
method PM10 high-volume samplers with volumetric flow control, operated at their design flow
rates. Two samplers will be installed at each site and programmed to run sequentially for 24-
hour periods on alternating days so that samples can be collected consecutively without any
interruption for changing filters. A third PM10 high-volume sampler will be installed at one site
for collecting field duplicates. The PM10 samplers will be calibrated and operated according to
40 CFR Part 50, Appendix J (Reference Method for the Determination of Particulate Matter as
PM10 in the Atmosphere).
Filter samples (sodium bicarbonate coated cellulose fiber) for measuring hexavalent
chromium will be collected using samplers built by ERG initially to support the EPA National
Air Toxics Trends Stations (NATTS) network and Urban Air Toxics Monitoring Program
(UATMP). The Cr6+
samplers will be modified for sampling the PM10 size fraction by the
adding Teflon coated cyclones upstream of the filters. The cyclones are manufactured by URG,
Chapel Hill, NC (URG-2000-ENB). The samplers will also be modified to allow sequential
sampling for two consecutive 24-hour periods. The Cr6+
samplers will be operated according to
the ERG Standard Operating Procedure, ERG-MOR-013 Revision Number 2.
Canister samples for measuring VOCs by TO-15 will be collected using sampling
systems custom-designed and built for the Midlothian project by URS. Each sampler will meet
TO-15 design specifications and have additional features for added quality control such as
continuous monitoring of canister pressure and flow rate. Each sampler will have at least two
channels so that samples may be collected over sequential 24-hour periods, midnight to
midnight, with no interruption for changing canisters. Samples will be collected in 6-L SUMMA
canisters filled to sub-atmospheric pressures.
Wind speed, wind direction, temperature, and barometric pressure will be monitored
using sensors manufactured by MetOne. The wind direction vane and cup anemometers will be
mounted at 10-meters above the ground on vertical towers. The meteorological data will be
stored as 5-minute and 1-hour averages.
Tables B2-1 summarizes the sampling methods. Tables B2-2 and B2-3 give the number
of samples to be collected at each site and the sample collection specifications, respectively. The
specific compounds of interest are given in Table A6-1.

Midlothian Ambient Air Collection and Chemical Analysis Group B – Data Generation and Acquisition
Quality Assurance Project Plan
Revision No. 3 Page 14 of 30 February 9, 2009
Table B2-1. Sampling Methods
Parameter Group Method Equipment References
Volatile Organic
Compounds
TO-15
―Determination Of Volatile
Organic
Compounds (VOCs) In Air
Collected In
Specially-Prepared Canisters
And
Analyzed By Gas
Chromatography/
Mass Spectrometry
(GC/MS)‖
URS-built VOC sampler
compliant w/ TO-15
specifications
Compendium of Methods
for the Determination of
Toxic Organic
Compounds in Ambient
Air (EPA/625/R-96/010b)
Metals as PM10
(except Cr6+)
40 CFR 50, App. J
―Reference Method for the
Determination of Particulate
Matter as PM10in the
Atmosphere‖
Tisch Environmental, Inc.
TE-6070V PM10 High
Volume Air Sampler
Code of Federal
Regulations,
Title 40--Protection of
Environment,
Chapter I—
Environmental Protection
Agency,
Subchapter C—Air
Programs,
Part 50--―National
Primary and Secondary
Ambient Air Quality
Standards‖
Compendium of Methods
for the Determination of
Inorganic Compounds
in Ambient Air
(EPA/625/R-96/010a)
Hexavalent
Chromium as PM10
CARB Method 039 and
ERG-MOR-013, Field
Procedure for Collecting
Ambient Air Hexavalent
Chromium Samples Using the
ERG:CR6 Sampling System
Eastern Research Group
ERG:CR6 Sampling
System with Teflon-
coated PM10 cyclone
head.
California Air Resources
Board.
EPA Technical
Assistance Document for
the National Ambient Air
Toxics Trends and
Assessment Program, and
Eastern Research Group
(ERG) Engineering and
Science Division

Midlothian Ambient Air Collection and Chemical Analysis Group B – Data Generation and Acquisition
Quality Assurance Project Plan
Revision No. 3 Page 15 of 30 February 9, 2009
Table B2-2. Sampling Design
Number of Samples to be Collected per Calendar Quarter
Sample Type Sampling
Period
No. of Routine
Samples per Site a
No. of Field
Blanks b
No. of Field
Duplicates b
No. of Analytical
Replicates b
VOCs
Canister
24 ±1
hour 5 1 1 1
Metals
(except Cr6+)
Quartz Filter
24 ±1
hour 5 1 1 1
Cr6+
Cellulose Filter
24 ±1
hour 5 1 1 1
a VOC samples will be collected at every site except at CAMS 302.
b Blanks and duplicates will be collected at only one site per quarter.
Table B2-3. Specifications for Sample Collection
Equipment Specification
Volatile Organic Compounds
Sample Collection Media 6-liter spherical, passivated SUMMA or glass-
lined electro-polished stainless steel canister
Sampler Flow Rate 3-4 mL/min
Sampling Period 24 ± 1 hours
Metals
Sample Collection Media 8.5in. x 11in. Quartz Fiber Filter
0.50 mm thickness
Sampler Flow Rate 1.13 m3/min
Sampling Period 24 ± 1 hours
Hexavalent Chromium
Sample Collection Media 47-mm Grade 41 Whatman cellulose filters
impregnated with sodium bicarbonate in Teflon
filter holders
Sampler Flow Rate 15.0 L/min
Sampling Period 24 ± 1 hours
B2.2 Sampling Procedures
The Sample Collector will visit each site the day before each 5-day episode to audit the
meteorological sensors, test the sampling equipment, install fresh particulate matter filters and
TO-15 canisters, and program the samplers to run sequentially on the next two days. The
Sample Collector will return to each site every day for the next six days to complete up to 3 tasks
as given in Table B2-4. Each sample will be shipped to ERG for analysis within 24-hours after
collection, along with associated documentation and chain of custody papers. Hexavalent
chromium samples will be shipped in insulated, chilled containers.
Spare equipment and/or parts will be available to facilitate efficient corrective actions in
response to malfunctioning instrumentation.

Midlothian Ambient Air Collection and Chemical Analysis Group B – Data Generation and Acquisition
Quality Assurance Project Plan
Revision No. 3 Page 16 of 30 February 9, 2009
Table B2-4. Generic Site Visit Schedule
Day Task 1 Task 2 Task 3
0 Test samplers Check meteorological sensors Install Days 1 and 2 filters and canisters
1 Check Day 1 samples
2 Retrieve Day 1 samples Check Day 2 samples Install Day 3 filters and canisters
3 Retrieve Day 2 samples Check Day 3 samples Install Day 4 filters and canisters
4 Retrieve Day 3 samples Check Day 4 samples Install Day 5 filters and canisters
5 Retrieve Day 4 samples Check Day 5 samples
6 Retrieve Day 5 samples Check meteorological sensors Secure sites
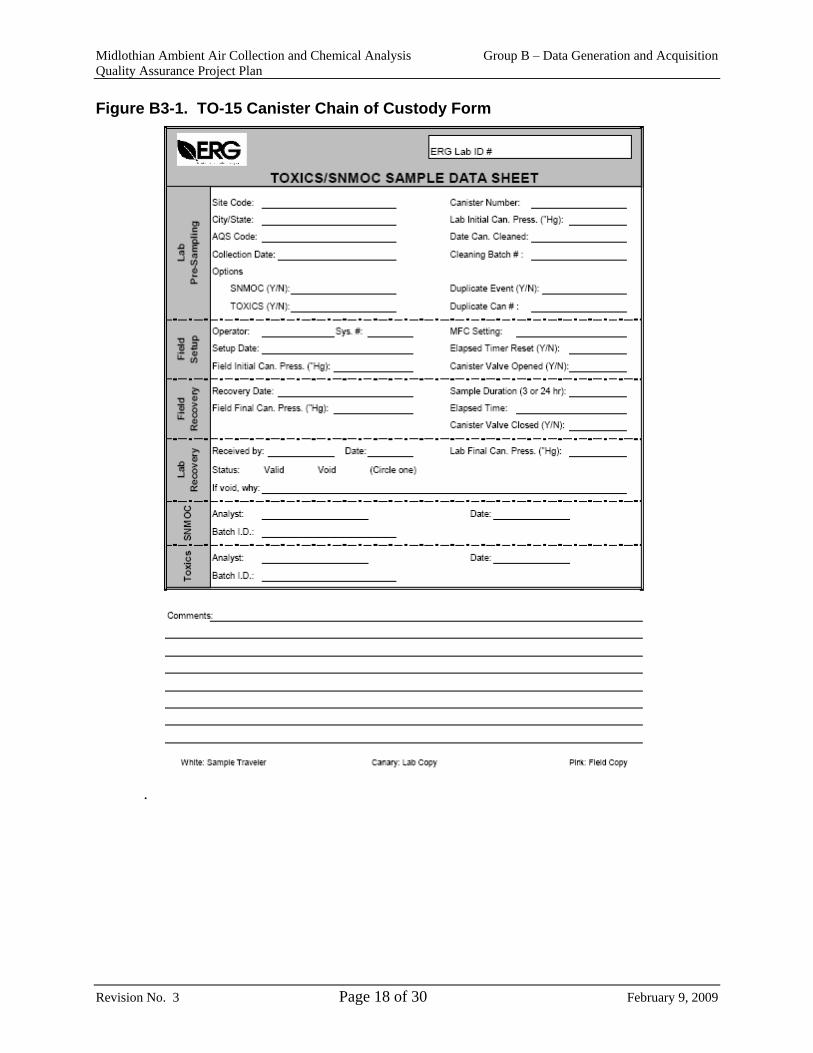
B3 Sample Handling and Custody
Standardized chain of custody forms will be used to track TO-15 canisters and particulate
matter filters from the laboratory to the sampling sites, and back to the laboratory. An example
of the chain of custody form for TO-15 canisters is shown in Figure B3-1. It is the same color-
coded, three-copy form that ERG uses in support of the Urban Air Toxics Monitoring Program
(UATMP) and other EPA-sponsored national air sampling projects. The top section of the form,
which will be completed in the laboratory before the canister is sent to the sampling site,
identifies the sampling site, date, canister identification number, and initial canister pressure
(after cleaning and evacuation). The rest of the form is used to track the canister chain of
custody and canister pressure through various stages of the sampling and analysis process.
One copy of the chain of custody form will be retained by the site operator and the other
copies will be returned to the laboratory with the canister. Back in the laboratory, the sample
canister pressure will be compared with the pressure recorded in the field as a check on whether
any leakage into the canister occurred during transport. The information from the chain of
custody form is then entered into the laboratory database. The sample is given a unique
identification (ID) number and tagged with the site name and the sample collection date.
Similar chain of custody forms will be used to track filter samples (see, for example,
Figure B3-2). Canisters and filters will be sent to and from the sampling sites via FedEx.
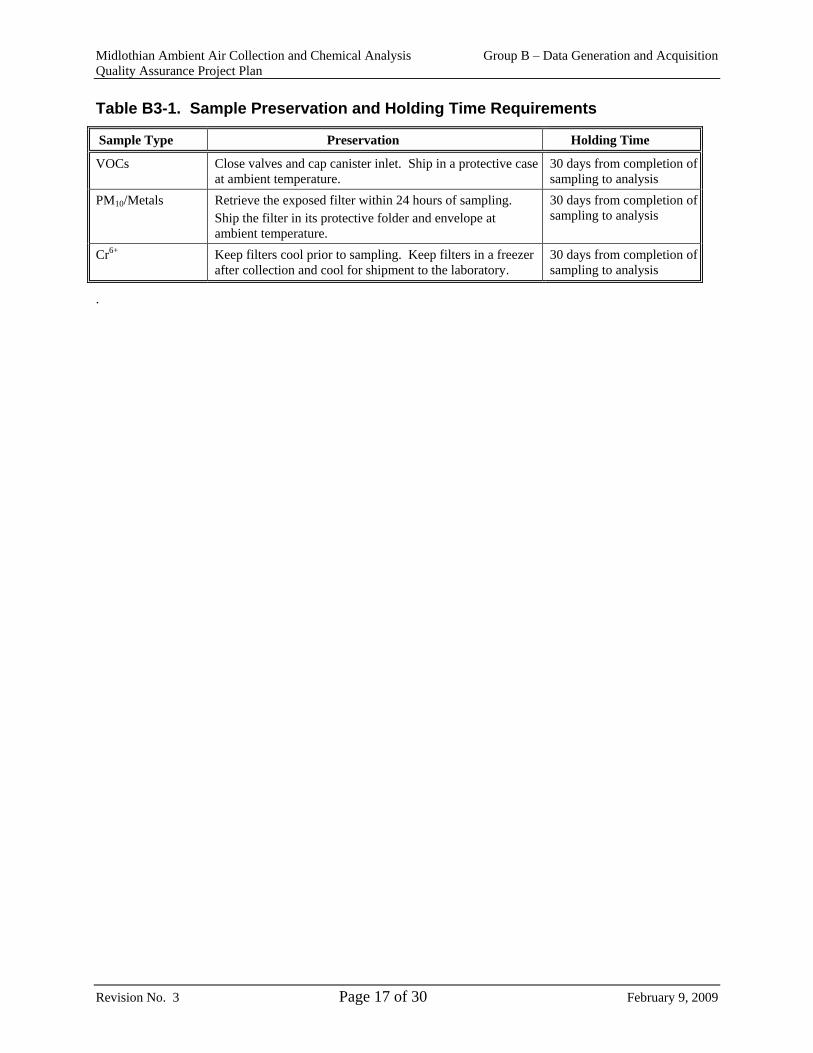
Requirements for sample preservation are given in Table B3-1. All sample hold times will be
limited by the 30-days from sample collection reporting requirement.
Midlothian Ambient Air Collection and Chemical Analysis Group B – Data Generation and Acquisition
Quality Assurance Project Plan
Revision No. 3 Page 17 of 30 February 9, 2009
Table B3-1. Sample Preservation and Holding Time Requirements
Sample Type Preservation Holding Time
VOCs Close valves and cap canister inlet. Ship in a protective case
at ambient temperature.
30 days from completion of
sampling to analysis
PM10/Metals Retrieve the exposed filter within 24 hours of sampling.
Ship the filter in its protective folder and envelope at
ambient temperature.
30 days from completion of
sampling to analysis
Cr6+ Keep filters cool prior to sampling. Keep filters in a freezer
after collection and cool for shipment to the laboratory. 30 days from completion of
sampling to analysis
.
Midlothian Ambient Air Collection and Chemical Analysis Group B – Data Generation and Acquisition
Quality Assurance Project Plan
Revision No. 3 Page 18 of 30 February 9, 2009
Figure B3-1. TO-15 Canister Chain of Custody Form
.

Midlothian Ambient Air Collection and Chemical Analysis Group B – Data Generation and Acquisition
Quality Assurance Project Plan
Revision No. 3 Page 19 of 30 February 9, 2009
Figure B3-2. Cr6+ Filter Sample Chain of Custody Form

Midlothian Ambient Air Collection and Chemical Analysis Group B – Data Generation and Acquisition
Quality Assurance Project Plan
Revision No. 3 Page 20 of 30 February 9, 2009
B4 Analytical Methods
Samples will be analyzed by the ERG Laboratory in RTP, North Carolina, according to
the reference methods cited in Table B4-1. Detailed descriptions of the equipment and
procedures are provided in the ERG QAPP for support of the EPA national monitoring
programs, which is accessible online to EPA, States, Local, and Tribal agencies at the ERG web
address: http://www.ergweb2.com/uatmp/index.htm.
For permission to access this information, please contact:
Julie L. Swift
Program Manager/Chemist
ERG
phone: 919-468-7924
fax: 919-468-7803
Table B4-1. Analytical Methods
Parameter Group Method Reference
Volatile Organic
Compounds
(GC/MS)
TO-15
―Determination Of
Volatile Organic
Compounds (VOCs)
In Air Collected In
Specially-Prepared
Canisters And
Analyzed By Gas
Chromatography/
Mass Spectrometry
(GC/MS)‖
Compendium of Methods for the Determination of Toxic Organic
Compounds in Ambient Air (EPA/625/R-96/010b)
Metals
(ICP/MS)
IO-3.5
―Determination of
Metals in Ambient
Particulate Matter
Using Inductively
Coupled Plasma/Mass
Spectrometry
(ICP/MS)‖
Compendium of Methods for the Determination of Inorganic
Compounds in Ambient Air (EPA/625/R-96/010a)
Hexavalent
Chromium
(Ion
Chromatography)
Modified CARB-039
―Standard Operating
Procedure for Analysis
of Hexavalent
Chromium at Ambient
Atmospheric Levels
by Ion
Chromatography‖
http://www.epa.gov/ttn/amtic/files/ambient/airtox/hexchromsop.pdf

Midlothian Ambient Air Collection and Chemical Analysis Group B – Data Generation and Acquisition
Quality Assurance Project Plan
Revision No. 3 Page 21 of 30 February 9, 2009
B5 Quality Control
B5.1 Field Quality Control
The Sample Collector will perform and document a series of quality control (QC) checks
at specified frequencies, and will take appropriate corrective action if results of the field quality
control checks are outside acceptable ranges. All activities and results of QC checks will be
recorded in a logbook before the Sample Collector leaves the site. The QC activities include the
following:
URS Sample Collector will maintain a file of site information that will include site
visit logs, calibration data, and sample chain-of-custody forms. Copies of this
documentation will be forwarded to the Program Manager at the end of each quarterly
sampling episode, and these items will be retained in the project files.
Field duplicate (collocated) samples will be collected at a rate of 1 per quarterly
sampling episode for VOCs, metals and hexavalent chromium at one of the sites that
is equipped with duplicate sampling ports. The duplicate samples will be designated
on the chain-of-custody form for laboratory duplicate analysis as well (nested
duplicates).
Field blank samples will be collected once per quarterly sampling episode for VOCs,
metals and hexavalent chromium.
A chain-of-custody record, indicating sample identification number, sampling
location, and all required data particular to the sample will accompany each filter or
canister during shipment to and from the field.
Sampler flow rate checks will be performed during each quarterly sampling episode
for the PM10 samplers.
While on site, the Sample Collector will download the TO-15 flow rate and canister
pressure data to a laptop computer and examine the time series for confirmation that
the previous day’s canister collected air at a uniform rate over the 24-hour period.
Prior to sampling, the pressure inside each canister will be measured in the field and
compared with the initial pressure recorded by the laboratory.
Canister sampling system leak checks will be performed each time canisters are
loaded in the sampler for sample collection.
Upon receipt of Cr6+
sample filters from ERG, URS staff will immediately remove
the unused sample media from the shipping cooler and place materials in a clean,
uncontaminated freezer.
Meteorological data will be checked on each sampling day for reasonableness with
respect to observed conditions and site-to-site agreement.
B5.2 Analytical Quality Control
Summaries of laboratory quality control measures are in Tables B5-1 through B5-3.
Midlothian Ambient Air Collection and Chemical Analysis Group B – Data Generation and Acquisition
Quality Assurance Project Plan
Revision No. 3 Page 22 of 30 February 9, 2009
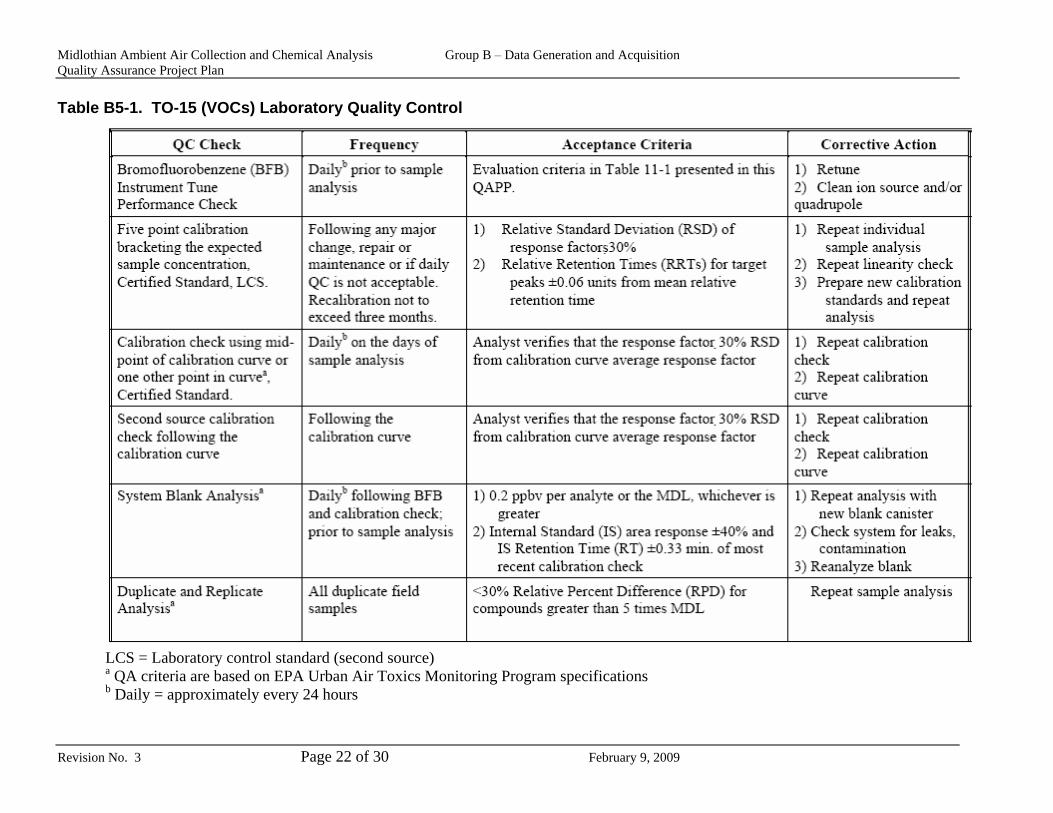
Table B5-1. TO-15 (VOCs) Laboratory Quality Control
LCS = Laboratory control standard (second source)
a QA criteria are based on EPA Urban Air Toxics Monitoring Program specifications
b Daily = approximately every 24 hours

Midlothian Ambient Air Collection and Chemical Analysis Group B – Data Generation and Acquisition
Quality Assurance Project Plan
Revision No. 3 Page 23 of 30 February 9, 2009
Table B5-1. continued
LCS = Laboratory control standard (second source)
a QA criteria are based on EPA Urban Air Toxics Monitoring Program specifications
b Daily = approximately every 24 hours

Midlothian Ambient Air Collection and Chemical Analysis Group B – Data Generation and Acquisition
Quality Assurance Project Plan
Revision No. 3 Page 24 of 30 February 9, 2009
Table B5-2. IO-3.5 (Metals) Laboratory Quality Control

Midlothian Ambient Air Collection and Chemical Analysis Group B – Data Generation and Acquisition
Quality Assurance Project Plan
Revision No. 3 Page 25 of 30 February 9, 2009
Table B5-2. continued
Midlothian Ambient Air Collection and Chemical Analysis Group B – Data Generation and Acquisition
Quality Assurance Project Plan
Revision No. 3 Page 26 of 30 February 9, 2009
Table B5-3. Cr6+ Laboratory Quality Control

Midlothian Ambient Air Collection and Chemical Analysis Group B – Data Generation and Acquisition
Quality Assurance Project Plan
Revision No. 3 Page 27 of 30 February 9, 2009
B6 Instrument/Equipment Testing, Inspection and Maintenance
All the canister samplers will be blank checked and challenged by ERG with humidified
zero air and a calibration standard, respectively, consistent with TO-15 prior to installation at the
sampling sites. The blank test is passed when no greater than 0.2 ppbv of any target compound
is detected in the humidified zero air sample drawn through the sampling system. Samplers will
undergo repeated purge and test cycles until the blank test is passed. No pass/fail threshold is
specified for testing the samplers with humid calibration standards; however, recoveries in the
range of 90% to 110% of the known concentrations are expected according to TO-15. The
canister samplers will be constructed just before the start of this project and with only periodic
use during this project no particular preventative maintenance will be required before the end of
the approximately one-year study. The accuracy of the canister pressure transducers relative to
the laboratory gauges will be checked as part of the sampler certification. Sampler pressure
transducers reading outside a range of ±5% of the laboratory gauge will be adjusted.
The high volume particulate matter samplers will be inspected by the Sample Collector
prior to installation to verify that inlets are clean, motor housings are installed tightly, electrical
wiring and flow tubing are in good condition, and all gaskets and fasteners have no signs of
failure. Any parts that appear to be near failure will be replaced. Periodic maintenance of the
PM10 samplers such as motor brush replacement, motor replacement, and cleaning will be
performed as needed. Spare samplers will be available from the URS equipment inventory in
Austin.
B7 Instrument/Equipment Calibration and Frequency
All sampling and analytical equipment will be calibrated against reference standards prior
to use. Analytical instrumentation will be calibrated in accordance with the referenced methods
and the ERG QAPP for support of the EPA national programs.
Calibration of the high-volume samplers (for PM10 and metals) consists of an
independent measurement of the ability of the sampler flow orifice to maintain the desired flow
rate of 1.13 m3/minute within 10% at a measurement accuracy of 7%. A variable flow orifice
traceable to a primary standard Rootsmeter is installed in place of the filter cassette, and a
manometer is used to measure pressure differential within the orifice. Adjusting the resistance of
the orifice simulates a series of 4 flow rates within the sampler operating range. The sampler
calibration relationship is expressed by a linear regression, which is used to generate sampler
flow rate ―Look-Up‖ tables. The Look-Up tables allow the user to determine sampler flow rate
quickly under the expected range of ambient temperature and pressure conditions during each
sampling episode. This calibration and linear regression are performed upon installation of the

Midlothian Ambient Air Collection and Chemical Analysis Group B – Data Generation and Acquisition
Quality Assurance Project Plan
Revision No. 3 Page 28 of 30 February 9, 2009
samplers before samples are taken, and are repeated whenever the result from a monthly
calibration check indicates the need for revision. The monthly calibration check is accomplished
using the same technique as for the initial calibration, but only one flow rate is measured by the
office and compared to the Look-Up table.
Sample collection for the VOC samplers is controlled using a mass flow controller that is
calibrated against a reference Dri-Cal flow meter. The sample volume is determined from
laboratory measurements of the canister vacuum taken before and after sampling using a vacuum
gauge capable of measuring vacuum (–100 to 0 kPa or 0 to - 30 in Hg).
Prior to each quarter sampling episode, the Sample Collector will verify that the wind
direction vane is aligned to true north (i.e., accounting for magnetic declination), check wind
direction and wind speed initial torque response, and verify the temperature and atmospheric
pressure responses against NIST-traceable audit equipment. The performance criteria for the
meteorological equipment are given in Table B7-1.
Table B7-1. Meteorological Equipment Performance Checks
Parameter How Measured Criteria
Wind Direction Verify alignment to true north using a
certified transit
± 2º
Wind Speed Verify response at five points ranging
from 0 to 54 mph using a certified
rotational drive
± 0.4 mph
Temperature Comparison of ambient reading with
certified thermometer
± 1.8ºF
Atmospheric Pressure Comparison of ambient reading with
certified barometer
± 7.6 mmHg
Rainfall Standard volume ± 10% of Reading
B8 Inspection/Acceptance of Supplies and Consumables
All consumables and supplies used for sample analysis, including sampling media used
for sample collection, will be inspected and accepted according to the procedures and criteria
given in the ERG QAPP for support of the EPA national programs. Tracking and quality
verification of supplies and consumables, according to the ERG QAPP, have two main
components. The first is the need of the end user of the supply or consumable to have an item of
the required quality. The second need is for the purchasing department to accurately track goods
received so that payment or credit of invoices can be approved. In order to address these two
issues, the following procedures outline the proper tracking and documentation procedures to
follow:

Midlothian Ambient Air Collection and Chemical Analysis Group B – Data Generation and Acquisition
Quality Assurance Project Plan
Revision No. 3 Page 29 of 30 February 9, 2009
Receiving personnel will perform a rudimentary inspection of the packages as they are
received from the courier or shipping company.
Note any obvious problems with a receiving shipment such as crushed box or wet
cardboard.
The package will be opened, inspected, and contents compared against the packing slip.
If there is a problem with the equipment/supply, note it on the packing list and notify the
Purchasing Agent who will immediately call the vendor.
If the equipment/supplies appear to be complete and in good condition, sign and date the
packing list and sent to the Purchasing Agent so that payment can be made in a timely
manner.
Notify appropriate personnel that equipment/supplies are available. For items such as the
filters, it is critical to notify the laboratory manager of the weigh room so sufficient time
for processing of the filters can be allowed.
Stock equipment/supplies in appropriate pre-determined area
B9 Non-direct Measurements
This program involves only direct measurements based on sampling and analysis.
B10 Data Management
The ERG procedures for laboratory data recording, validation, transformation,
transmittal, reduction, analysis, management, storage, and retrieval are given in the ERG QAPP
for support of the EPA national programs. Within 30 days after the end of each 5-day sampling
sequence, ERG will transmit the processed measurement results in a spreadsheet format to URS
via email. Each data record will include the following fields:
Sample date
Sampling site
Sample identification number assigned by the laboratory
Date of analysis
Chemical name
Measurement value
Quality assurance flag
Sample-specific detection limit
Unit of measure
.

Midlothian Ambient Air Collection and Chemical Analysis Group B – Data Generation and Acquisition
Quality Assurance Project Plan
Revision No. 3 Page 30 of 30 February 9, 2009
URS will perform final review and validation of the measurement results and maintain
the official project database in a protected Excel spreadsheet. Final data review and validation
will be performed according to the procedures given in Group D of this QAPP.

Midlothian Ambient Air Collection and Chemical Analysis Group C – Assessment and Oversight
Quality Assurance Project Plan
Revision No. 3 Page 1 of 1 February 9, 2009
C ASSESSMENT AND OVERSIGHT
C1 Assessment and Response Action
The QA Coordinator or Project Manager will internally assess the data after each
quarterly sampling episode. This will be done during the 15-day period between reporting the
measurement results by ERG to URS and delivery of the validated data to TCEQ. The internal
assessment will include estimations of measurement precision based on collocated sample
results, evaluations of field blank data, review of the data set for unusual patterns or outliers, and
review of field notes and diagnostic data for signs of recurring or persistent equipment problems.
Signs that any of the MQOs listed in Table A7-1 are not being met will be discussed with field or
laboratory staff and appropriate corrective actions will be identified and implemented. Such
actions may include:
Recalibration of equipment flow controllers
Replacement of equipment components or entire samplers
More frequent monitoring of data quality indicators and instrument performance
Review of laboratory QC data
Laboratory confirmation of reported results
The ERG laboratory is audited by EPA once per year to assess ERG’s quality procedures
and verify compliance with its QAPP. Accuracy assessments of the laboratory metals analyses
performed by EPA during the period of this study will be included in the final report. ERG’s
response plan is described in the ERG QAPP for support of the national programs.
No external assessment or oversight of field sampling activities is planned for this
project; however, an independent assessment of the meteorological parameters will be performed
by setting one sampling station within a few meters of the TCEQ CAMS 52 station and
comparing the side-by-side measurements for consistency. URS will accommodate TCEQ
should the agency elect to audit the field sites and sampling procedures.
C2 Reports to Management
Any deficiencies or defects identified by project staff will be brought to the immediate
attention of the URS Project Manager. The problems will be documented and tracked to ensure
satisfactory resolution of the problem. The impact on measurement data and project objectives
will be assessed and included in quarterly reports to TCEQ along with a description of corrective
actions.

Midlothian Ambient Air Collection and Chemical Analysis Group D – Data Validation and Usability
Quality Assurance Project Plan
Revision No. 3 Page 1 of 4 February 9, 2009
D DATA VALIDATION AND USABILITY
D1 Data Review, Verification, and Validation
Upon completion of sample collection, the Sample Collector will review the sample
collection data to verify that samples collected were valid. The Sample Collector will verify that
the sampling equipment operated properly, starting and stopping at the correct times and
collecting specified sample volumes. Sample media will be inspected to verify that there is no
damage that would compromise sample integrity. Any issues affecting sample validity will be
documented in the field logbook and communicated immediately to the Project Manager, and
project QA officer. Data will be declared invalid whenever documented evidence exists
demonstrating that a sampler was not collecting data under representative conditions or was
malfunctioning.
ERG will perform a second tier of data validation in accordance with its EPA QAPP by
taking account of laboratory QC checks and chain of custody documentation provided by URS,
and will apply appropriate data quality flags (Tables D1-1 through D1-3) as needed.
Table D1-1. Laboratory Data Flags

Midlothian Ambient Air Collection and Chemical Analysis Group D – Data Validation and Usability
Quality Assurance Project Plan
Revision No. 3 Page 2 of 4 February 9, 2009
Table D1-2. Chain of Custody Flags

Midlothian Ambient Air Collection and Chemical Analysis Group D – Data Validation and Usability
Quality Assurance Project Plan
Revision No. 3 Page 3 of 4 February 9, 2009
Table D1-3. Field Operations and Maintenance Flags
D2 Verification and Validation Methods
The Project Manager or QA Officer will use graphical techniques including time series
charts and scatter plots to identify suspicious patterns and data outliers. Data will never be
declared invalid solely because they appear anomalous, but may be flagged as suspect and
subjected to further review until the cause for the apparent anomaly is determined. Evidence of
overwhelming measurement bias, external influences on the representativeness of the data, or

Midlothian Ambient Air Collection and Chemical Analysis Group D – Data Validation and Usability
Quality Assurance Project Plan
Revision No. 3 Page 4 of 4 February 9, 2009
lack of reproducibility of the measurement data (e.g., from field blank or duplicate measurement
results) may be cause for the data to be judged invalid.
D3 Reconciling with User Requirements
If the sample collection, analysis, and QC procedures written in the QAPP are followed,
and the sites are representative of the conditions for which they were selected, then the
measurement results are expected to meet the user requirements. URS is contractually obligated
to achieve the 75% completeness objective and will collect supplemental samples at the end of
any 5-day sampling sequence, if needed Failure to achieve any of the other MQOs given in
Table A7-1 does not mean the affected measurement results are not useable. Any signs that
particular MQOs were not achieved will be described in the quarterly and final reports to TCEQ
and recommendations on the usability of the affected measurement results will be addressed on a
case by case basis.

E REFERENCES
Quality Assurance Handbook for Air Pollution Measurement Systems, Volume IV. U.S.
Environmental Protection Agency, March 1995.
Quality Assurance Handbook for Air Pollution Measurement Systems, Volume II, Section 20.11.
U.S. Environmental Protection Agency.
Ambient Monitoring Guidelines for the Prevention of Significant Deterioration. U.S.
Environmental Protection Agency.
Method TO-15 ―Determination Of Volatile Organic Compounds (VOCs) In Air Collected In
Specially-Prepared Canisters And Analyzed By Gas Chromatography/Mass Spectrometry
(GC/MS),‖ Compendium of Methods for Determination of Toxic Organic Compounds in Ambient
Air. U.S. Environmental Protection Agency 625/R-96/101b, Research Triangle Park, North
Carolina, January 1999.
Method IO-2.1, ―Sampling of Ambient Air for Total Suspended Particulate Matter and PM10
Using High Volume Sampler,‖ Compendium of Methods for Determination of Inorganic
Compounds in Ambient Air. U.S. Environmental Protection Agency 625/R-96/101b, Research
Triangle Park, North Carolina, June 1999.
Method IO-3.5, ―Determination of Metals in Ambient Particulate Matter Using Inductively
Coupled Plasma/Mass Spectrometry (ICP/MS),‖ Compendium of Methods for Determination of
Inorganic Compounds in Ambient Air. U.S. Environmental Protection Agency 625/R-96/101b,
Research Triangle Park, North Carolina, June 1999.
CARB-MLD039, ―Standard Operating Procedure for Analysis of Hexavalent Chromium at
Ambient Atmospheric Levels by Ion Chromatography,‖ California Environmental Protection
Agency, California Air Resources Board.
ERG-MOR-013, ―Field Procedure for Collecting Ambient Air Hexavalent Chromium Samples
Using the ERGLCR6 Sampling System,‖ Environmental Research Group, Engineering and
Science Division, May 2004.
―Draft Technical Assistance Document for the National Ambient Air Toxics Trends and
Assessment Program,‖ Emissions, Monitoring and Analysis Division (C339-02) Office of Air
Quality Planning and Standards U.S. Environmental Protection Agency Research Triangle Park,
NC, June 2003.