NATURAL CLIMATIC FORCING - LTRR Climatic Forcing... · NATURAL CLIMATIC FORCING ... …

Midlatitude Forcing Mechanisms for Glacier Mass Balance
Investigated Using General Circulation Models
B. K. REICHERT AND L. BENGTSSON
Max Planck Institute for Meteorology, Hamburg, Germany
J. OERLEMANS
Institute for Marine and Atmospheric Research Utrecht, Utrecht, Netherlands
Accepted to Journal of Climate
Corresponding author address:
Bernhard K. Reichert, Max Planck Institute for Meteorology,
Bundesstrasse 55, 20146 Hamburg, Germany. E-mail: [email protected]
ISSN 0937 - 1060

Reichert et al.: Midlatitude forcing mechanisms for glacier mass balance 1
ABSTRACT
A process-oriented modeling approach is applied in order to simulate glacier mass
balance for individual glaciers using statistically downscaled general circulation
models (GCMs). Glacier specific Seasonal Sensitivity Characteristics based on a
mass balance model of intermediate complexity are used to simulate mass balances
of Nigardsbreen (Norway) and Rhonegletscher (Switzerland). Simulations using
reanalyses (ECMWF) for the period 1979-1993 are in good agreement with in situ
mass balance measurements for Nigardsbreen. The method is applied to
multi-century integrations of coupled (ECHAM4/OPYC) and mixed-layer
(ECHAM4/MLO) GCMs excluding external forcing. A high correlation between
decadal variations in the North Atlantic Oscillation (NAO) and mass balance of the
glaciers is found. The dominant factor for this relationship is the strong impact of
winter precipitation associated with the NAO. A high NAO phase means enhanced
(reduced) winter precipitation for Nigardsbreen (Rhonegletscher), typically leading
to a higher (lower) than normal annual mass balance. This mechanism, entirely due
to internal variations in the climate system, can explain observed strong positive
mass balances for Nigardsbreen and possibly other maritime Norwegian glaciers
within the period 1980-1995. It can also partly be responsible for recent strong
negative mass balances of Alpine glaciers.
Reichert et al.: Midlatitude forcing mechanisms for glacier mass balance 2
1. Introduction
Observed (or reconstructed) glacier fluctuations provide important information on
natural climate variability and are also key elements for the early detection of climate
change and possible anthropogenic impacts on climate. They result from changes in
the mass and energy balance at the earth’s surface and therefore represent valuable
climatic proxy data. Due to the typical properties of a melting ice or snow surface,
glaciers represent highly sensitive climate indicators. The glacierization of the
well-documented European Alps, for example, has lost roughly 30 to 40% in surface
area and about 50% of its original volume since the middle of the last century, the
end of the so-called “Little Ice Age”. Since 1980, a remarkable loss of 10 to 20% of
ice volume has been observed (Haeberli and Beniston, 1998).
Changes in glacier mass balance (defined as the annual mass gain or loss at the
surface; Paterson, 1994) can be viewed as the direct, undelayed reaction of a glacier
to climatic variations, whereas variations in glacier length are the indirect, delayed,
filtered, and strongly enhanced response. Cumulative glacier mass changes lead to
changes in ice thickness which then influence the dynamic redistribution of mass by
glacier flow (Haeberli, 1995). Monitoring glacier mass balance is therefore a direct
way to reconstruct climatic variations. However, the available mass balance records
are relatively short (usually less than 50 years) compared to relatively long records of
glacier length (e.g. the record of Untere Grindelwaldgletscher, Switzerland begins in
1534).
General Circulation Models (GCMs) can be used in order to investigate the
behavior of glaciers under specific climatic conditions. Natural glacier fluctuations
Reichert et al.: Midlatitude forcing mechanisms for glacier mass balance 3
exclusively due to internal variations in the climate system can be simulated. A
major advantage of using GCMs is having the opportunity to investigate underlying
physical mechanisms responsible for glacier fluctuations inherent to the climate
system. If desired, specific external forcings such as, for example, changing
greenhouse gas concentrations, can be included.
In this study, we propose a process-oriented modeling approach for the simulation
of mass balance of individual glaciers using downscaled GCMs. This approach has
two main characteristic features.
Firstly, we simulate the mass balance of individual glaciers using a process-based
and glacier-specific mass balance model. We apply glacier-specific seasonal
sensitivity characteristics calculated from a mass balance model of intermediate
complexity. Although several attempts have been made to use one equation to
describe a large number of glaciers or even all glaciers on earth (e.g. Wigley and
Raper, 1993; Oerlemans, 1989), the response of individual glaciers to a climatic
signal can vary enormously due to their different geometries or their location in
different climatic regimes, leading to entirely different energy-balance
characteristics. Climate sensitivity may generally vary at least over one order of
magnitude for single glaciers, depending to a large extent on precipitation
(Oerlemans and Fortuin, 1992). We therefore concentrate on individual glaciers;
nevertheless, they will to some extent be representative for glaciers with comparable
characteristic features in the same region.
Secondly, we apply a statistical downscaling approach in order to obtain local
conditions from GCM output. Glacier volume has been calculated using regional
temperature patterns from the direct coarse grid point output of a GCM (Gregory and
Reichert et al.: Midlatitude forcing mechanisms for glacier mass balance 4
Oerlemans, 1998) in which the impact of precipitation has not been considered.
However, climate sensitivity of glaciers depends on local temperature and
precipitation. The direct use of coarse GCM grid points (typical resolution, e.g. about
2.8° x 2.8°) naturally results in a poor representation of the local climate, especially
for precipitation which is highly dependant on local orographic conditions. In this
study, both temperature as well as precipitation are therefore downscaled (section 2)
using daily European Centre for Medium-Range Weather Forecasts (ECMWF)
reanalyses (Gibson et al., 1996) and local station data. Downscaled temperature and
precipitation are then used as input for the mass balance modeling approach
(section 3).
For validation of the entire approach including downscaling and mass balance
modeling, we simulate glacier mass balance directly using ECMWF reanalyses for
comparison with in situ mass balance measurements (section 4). This is an important
basis for the application of the method to various GCM experiments (section 5). The
process-oriented modeling approach is particularly interesting since it enables us to
investigate forcing mechanisms for glacier mass gain or loss of individual glaciers.
As an example, the relationship between the North Atlantic Oscillation (NAO) and
the behavior of specific European glaciers will be investigated for Nigardsbreen
glacier (Norway) and Rhonegletscher (Switzerland) considering the individual
seasonal impact of temperature and precipitation (section 6). On the basis of the
obtained results, we will furthermore discuss the recent development of observed
glacier mass balances, including the observed strong positive mass balances of
Nigardsbreen during recent decades (section 7).
Reichert et al.: Midlatitude forcing mechanisms for glacier mass balance 5
2. Statistical Downscaling Approach
A comparison of three methods of downscaling (Cubasch et al., 1996) shows that
direct interpolation of GCM grid points to a local site results in a poor representation
of the local climate and that statistical downscaling is an appropriate and inexpensive
tool for regions with sufficient observational data to train the model.
a. Method
The statistical downscaling approach used in the present study is based on daily
operational weather station data in the vicinity of the glacier sites to be investigated
and on an extensive set of potential daily large-scale predictors obtained from
ECMWF reanalyses. The ECMWF reanalyses consist of a validated and reasonably
consistent global data set of assimilated data for the period 1979-1993 (Gibson et al.,
1997). Robust statistical relationships between the large-scale flow obtained from
reanalyses and local variables are developed in order to be applied to the output of
the European Center/Hamburg (ECHAM) GCM experiments.
A detailed description of the downscaling approach (including model validation,
investigation of the role of near-surface predictors, spatial homogeneity of the model,
seasonal-specific relationships, the impact of spatiotemporal resolution of predictors,
etc.) can be found in Reichert et al. (1999). In the following, the performance of the
statistical model for the areas of interest in this study will be briefly described.
Reichert et al.: Midlatitude forcing mechanisms for glacier mass balance 6
b. Downscaling for Rhonegletscher
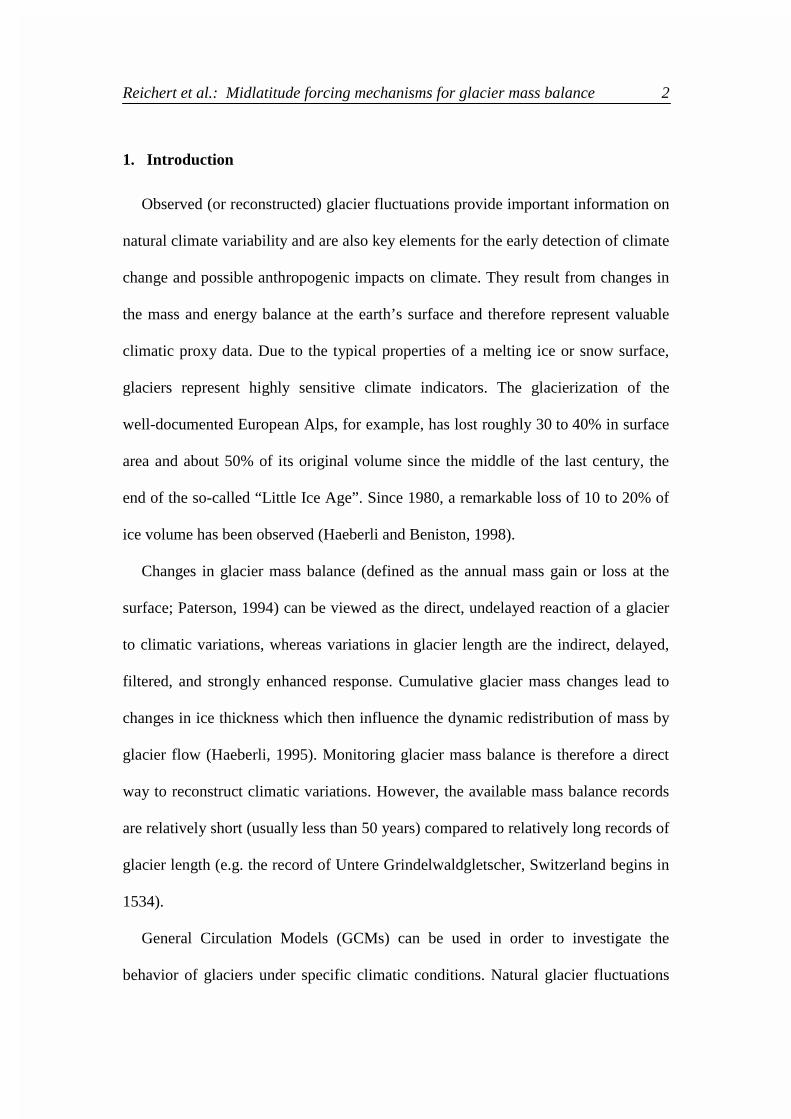
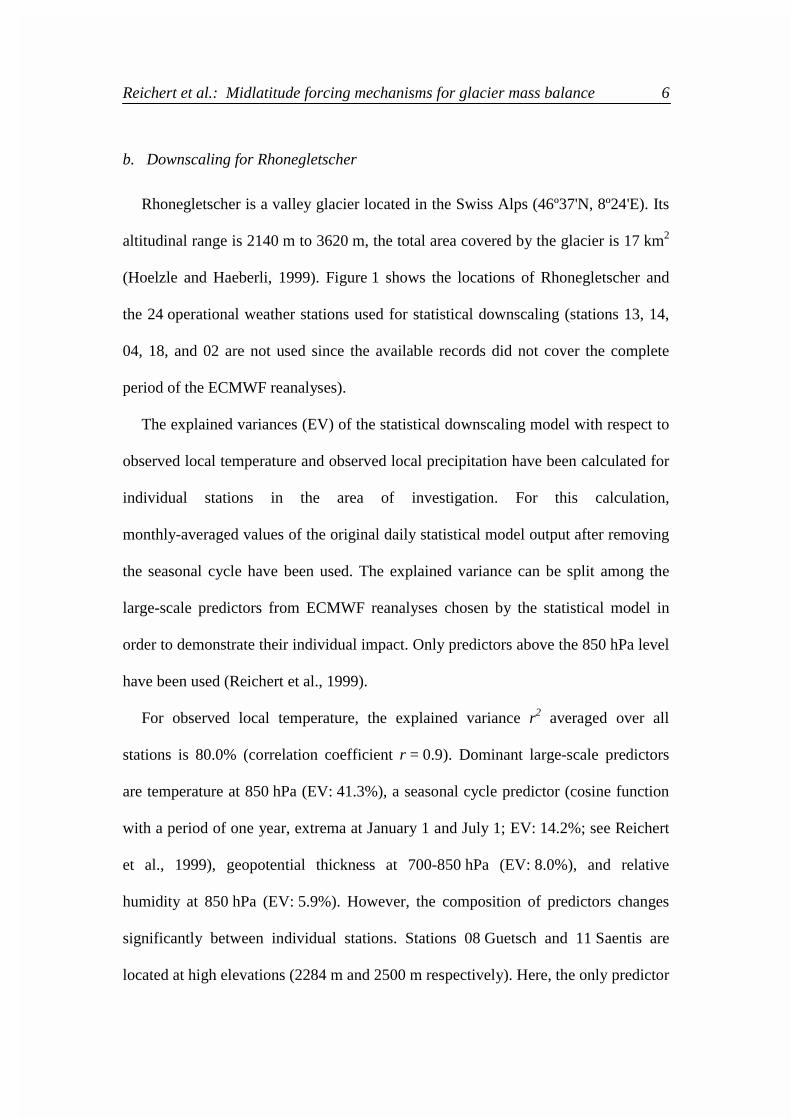
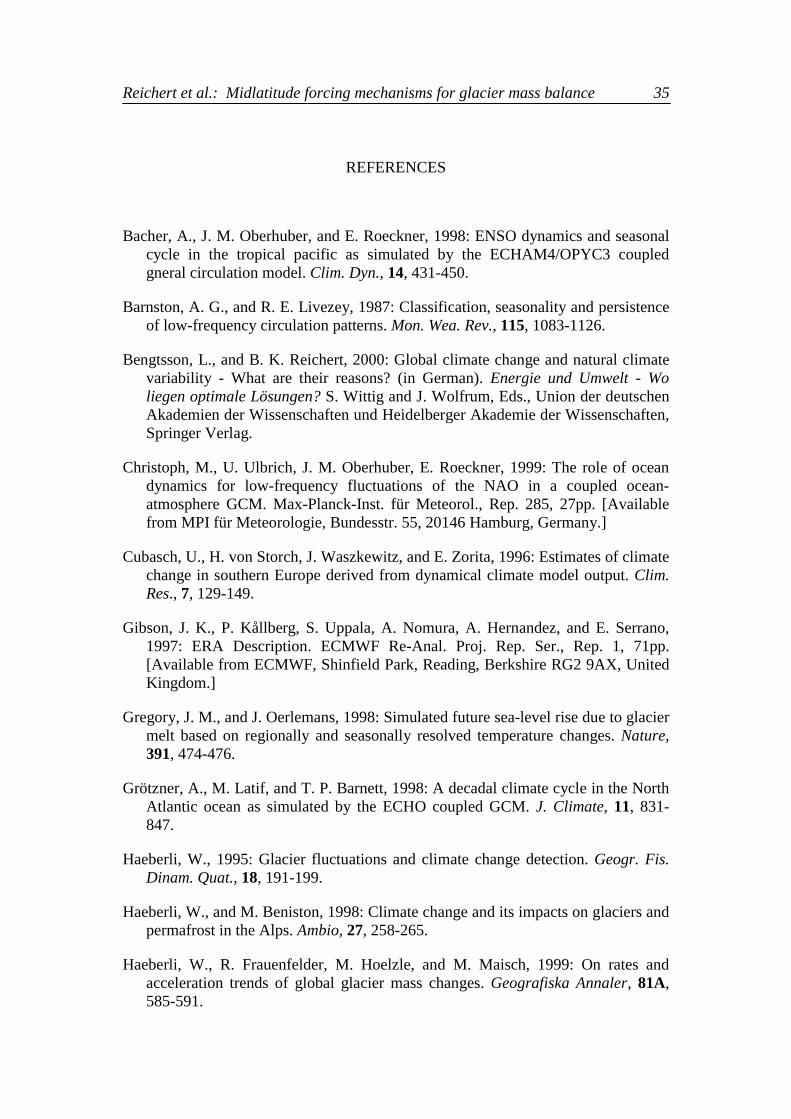
Rhonegletscher is a valley glacier located in the Swiss Alps (46º37'N, 8º24'E). Its
altitudinal range is 2140 m to 3620 m, the total area covered by the glacier is 17 km2
(Hoelzle and Haeberli, 1999). Figure 1 shows the locations of Rhonegletscher and
the 24 operational weather stations used for statistical downscaling (stations 13, 14,
04, 18, and 02 are not used since the available records did not cover the complete
period of the ECMWF reanalyses).
The explained variances (EV) of the statistical downscaling model with respect to
observed local temperature and observed local precipitation have been calculated for
individual stations in the area of investigation. For this calculation,
monthly-averaged values of the original daily statistical model output after removing
the seasonal cycle have been used. The explained variance can be split among the
large-scale predictors from ECMWF reanalyses chosen by the statistical model in
order to demonstrate their individual impact. Only predictors above the 850 hPa level
have been used (Reichert et al., 1999).
For observed local temperature, the explained variance r2 averaged over all
stations is 80.0% (correlation coefficient r = 0.9). Dominant large-scale predictors
are temperature at 850 hPa (EV: 41.3%), a seasonal cycle predictor (cosine function
with a period of one year, extrema at January 1 and July 1; EV: 14.2%; see Reichert
et al., 1999), geopotential thickness at 700-850 hPa (EV: 8.0%), and relative
humidity at 850 hPa (EV: 5.9%). However, the composition of predictors changes
significantly between individual stations. Stations 08 Guetsch and 11 Saentis are
located at high elevations (2284 m and 2500 m respectively). Here, the only predictor

Reichert et al.: Midlatitude forcing mechanisms for glacier mass balance 7
chosen by the model is geopotential thickness at 700-850 hPa, explaining more than
95% of the monthly-averaged local temperature. For station 21 Jungfrau (elevation:
3576 m) the predictors are geopotential thickness at 500-850 hPa and at 400-500 hPa
together explaining 94% of the observed values. The predominant predictor for all
other stations (elevations below 1700 m) is generally large-scale temperature at
850 hPa.
For observed local precipitation, both the explained variance as well as the spatial
homogeneity of predictors are generally lower than for temperature, as can be
expected. The characteristic composition of predictors is dependent on the
meridional location of the stations within the area of investigation. Stations located
more in the south of the Alps (stations 01, 03, 05, 06, 07, 19, 20, and 28) show a
more uniform composition of predictors than other stations. The averaged explained
variance in this area is 60%, predominant predictors are vorticity at 700 hPa (EV
about 15%), zonal wind at 700 hPa (EV: 15-20%), and vertical velocity at 500 hPa
(EV: 10-15%). For stations located in the north (stations 09-12, 16, 22, 23, 31) and
the central parts of the Alps (stations 08, 21, 24-27, 29, 30), vertical velocity at
850 hPa plays as important role (EV: 15-25% for some stations) in addition to
vorticity at 700 hPa (EV: up to 15%). Also meridional wind at 850 hPa (EV: 5-15%)
and at 700 hPa (particularly for stations 10, 12, and 16; EV: 10-15%) may have a
considerable additional impact, dependant on the local setting of the stations.
Among all stations, station 08 Guetsch (46º39'N, 8º37'E) is the closest station to
Rhonegletscher (Figure 1) and also its altitude (2284 m asl) lies within the altitudinal
range of the glacier. This station is therefore used to represent the local climate of the
glacier site for the simulation of glacier fluctuations. The explained variance for

Reichert et al.: Midlatitude forcing mechanisms for glacier mass balance 8
observed local temperature is 97% while the explained variance with respect to the
month-to-month variability of local precipitation is below the average over all
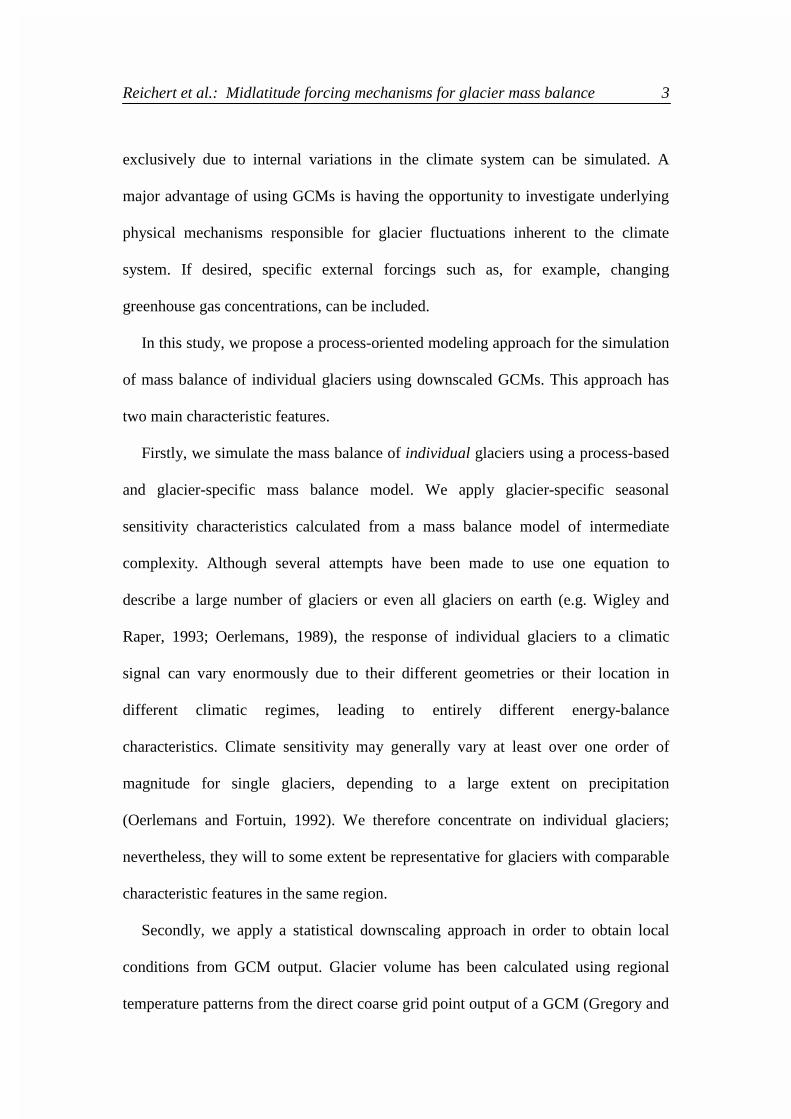
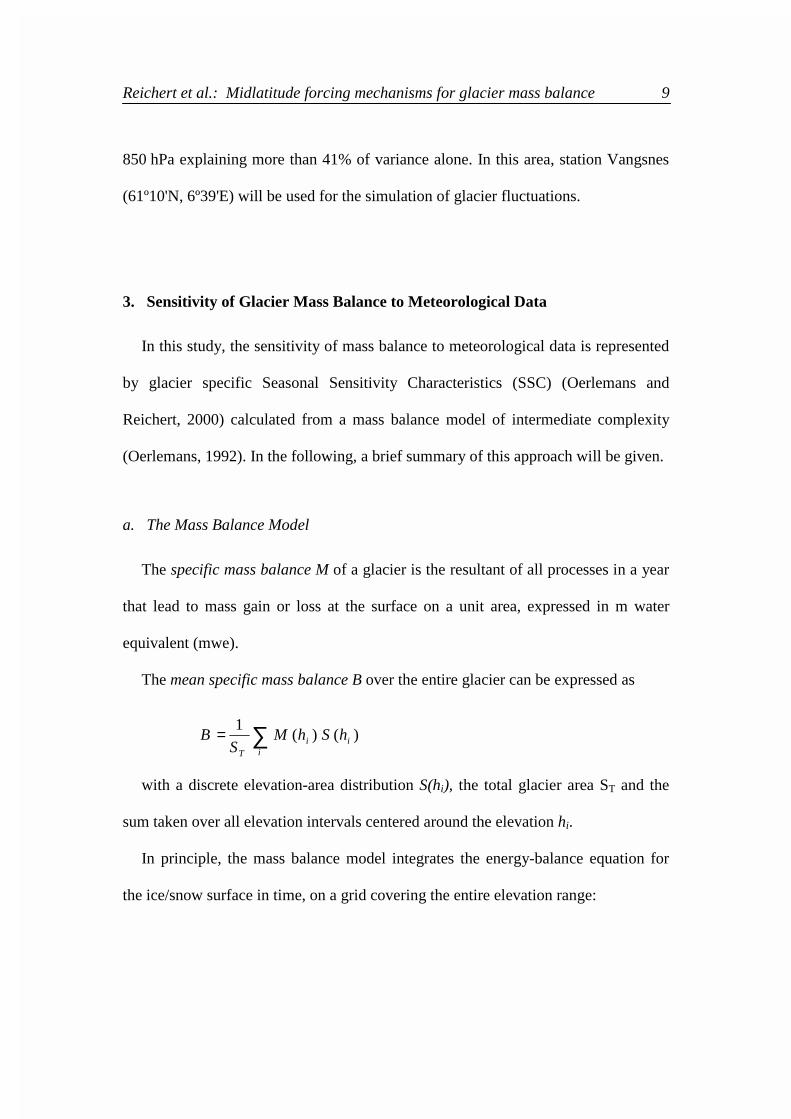
stations (51%). However, as Figure 2 demonstrates, the simulated climatology of
precipitation for the period 1979-1993, which will be most important for the
Seasonal Sensitivity Characteristic (SSC) of the glacier (section 3.c), is improved
substantially compared to direct ECMWF reanalyses, and is in good agreement with
the observed climatology (correlation coefficient r = 0.82; 95% significant for
r � 0.57). The statistical model was validated using independent data as described in
Reichert et al. (1999).
c. Downscaling for Nigardsbreen
Nigardsbreen is an outlet glacier of Jostedalsbreen, the largest ice cap of the
European continent. It is located in Norway (61º43'N, 7º08'E), its elevation ranges
from 295 m to 1950 m above sea level. The total area of the glacier is 47 km2
(Hoelzle and Haeberli, 1999).
The location of stations for Nigardsbreen and the complete application of the
downscaling approach used in this study is described in Reichert et al. (1999). The
explained variance for local temperature averaged over 17 stations in the vicinity of
the glacier (79%) is comparable to the average for Rhonegletscher. The explained
variance for local precipitation is however higher (65%) in comparison with
Rhonegletscher. This is due to the fact that for the Nigardsbreen area, local
precipitation is already rather well determined by large-scale vertical velocity at
Reichert et al.: Midlatitude forcing mechanisms for glacier mass balance 9
850 hPa explaining more than 41% of variance alone. In this area, station Vangsnes
(61º10'N, 6º39'E) will be used for the simulation of glacier fluctuations.
3. Sensitivity of Glacier Mass Balance to Meteorological Data
In this study, the sensitivity of mass balance to meteorological data is represented
by glacier specific Seasonal Sensitivity Characteristics (SSC) (Oerlemans and
Reichert, 2000) calculated from a mass balance model of intermediate complexity
(Oerlemans, 1992). In the following, a brief summary of this approach will be given.
a. The Mass Balance Model
The specific mass balance M of a glacier is the resultant of all processes in a year
that lead to mass gain or loss at the surface on a unit area, expressed in m water
equivalent (mwe).
The mean specific mass balance B over the entire glacier can be expressed as
with a discrete elevation-area distribution S(hi), the total glacier area ST and the
sum taken over all elevation intervals centered around the elevation hi.
In principle, the mass balance model integrates the energy-balance equation for
the ice/snow surface in time, on a grid covering the entire elevation range:
∑=i
iiT
hShMS
B )()(1

Reichert et al.: Midlatitude forcing mechanisms for glacier mass balance 10
Here, the energy balance ψ is expressed in terms of the absorbed solar radiation
(albedo α, global radiation G), the incoming and outgoing longwave fluxes (Iin and
Iout) and the turbulent fluxes of sensible and latent heat (Hs and Hl ). As soon as the
energy balance becomes positive, melting occurs at the surface.
The specific mass balance M can then be written as
with L as the latent heat of melting, f as the fraction of meltwater that refreezes
and does not contribute to mass loss, and P* as the accumulation rate at which solid
precipitation is added to the surface.
The albedo α represents a major problem due to significant feed-backs and strong
variations in space and time depending on the melt and accumulation history itself.
The model generates the albedo internally using a simple scheme, so that main
features broadly match available data from valley glaciers. A “background albedo
profile” is empirically developed so that typical albedo patterns of a valley glacier at
the end of the ablation season are matched. This profile, snow depth, and an
age-independent snow albedo is then used for the calculation of the glacier albedo.
Refreezing (meltwater does not run off, but penetrates into the snowpack) is
considered in the model, specifying the relationship between the fraction of melt
energy involved in run-off and the snow/ice temperature (Oerlemans, 1992).
lsoutin HHIIG ++++−=Ψ )1( α
∫ +Ψ−−= −
yeartPLfM d]);0(min)1([ *1
Reichert et al.: Midlatitude forcing mechanisms for glacier mass balance 11
b. Seasonal Sensitivity Characteristic (SSC)
In order to quantify the climate sensitivity of the mean specific balance B of a
glacier and to apply it to downscaled GCM output, a Seasonal Sensitivity
Characteristic (SSC) is used in this study (Oerlemans and Reichert, 2000). It
represents the dependence of B on monthly perturbations in temperature and
precipitation, and has been calculated from the mass balance model described above.
������������ ����B of the mean specific balance B are expressed as
with the sum taken over all months of the year. Here, Tk and Pk represent monthly
temperature and precipitation, Tref, k and Pref, k are climatological means of monthly
values, and H represents nonlinear terms (which can be neglected for glaciers
considered in this study; Oerlemans and Reichert, 2000).
The coefficients
have been determined by the mass balance model and represent the 24 values of
the SSC. They quantify the change in mass balance resulting from a change in
monthly temperature (unit of cT,k is mwe/K) and from a relative change in monthly
precipitation (unit of cP,k is mwe) respectively.
The differences between using SSCs to reconstruct a mass balance series and
using the full mass balance model itself have been tested and are found to be small
(Oerlemans and Reichert, 2000). They are therefore not relevant for the purpose of
the present study.
∑=
++−=∆12
1,,,, )]/()([
kkrefkkPkrefkkT HPPcTTcB
)/(and
,,,
krefkkP
kkT PP
Bc
T
Bc
∂∂=
∂∂=
Reichert et al.: Midlatitude forcing mechanisms for glacier mass balance 12
c. Sensitivity of Nigardsbreen and Rhonegletscher
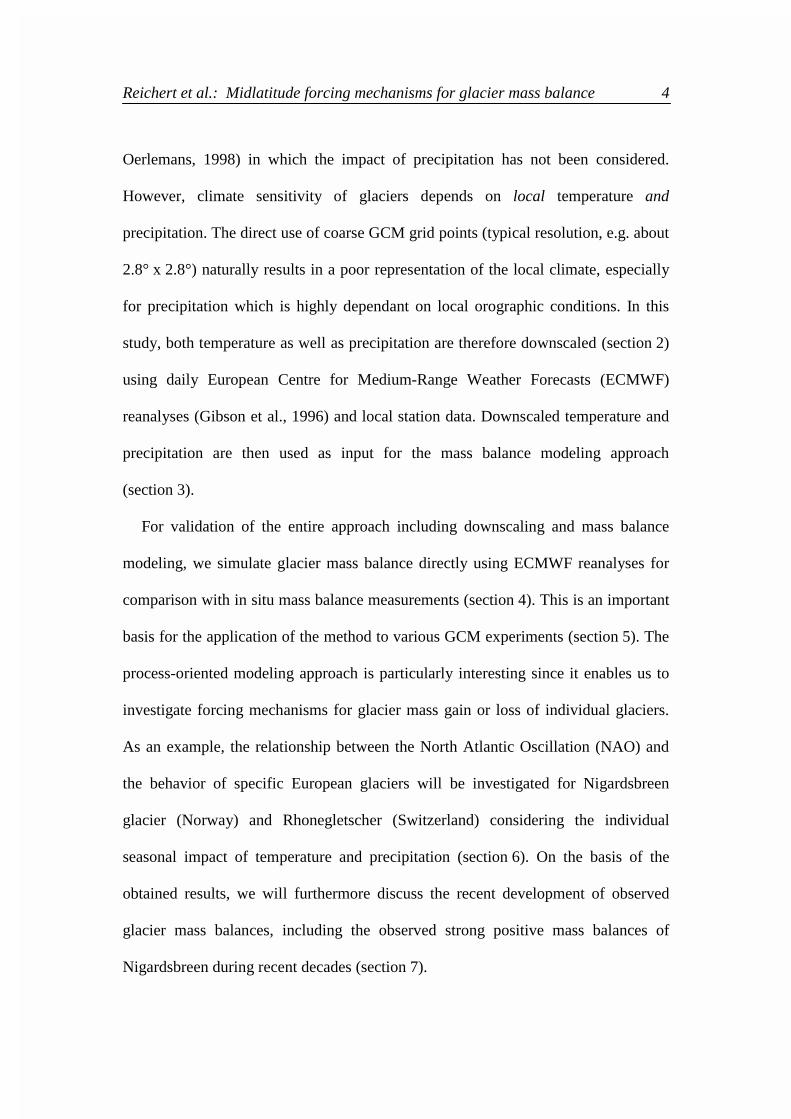
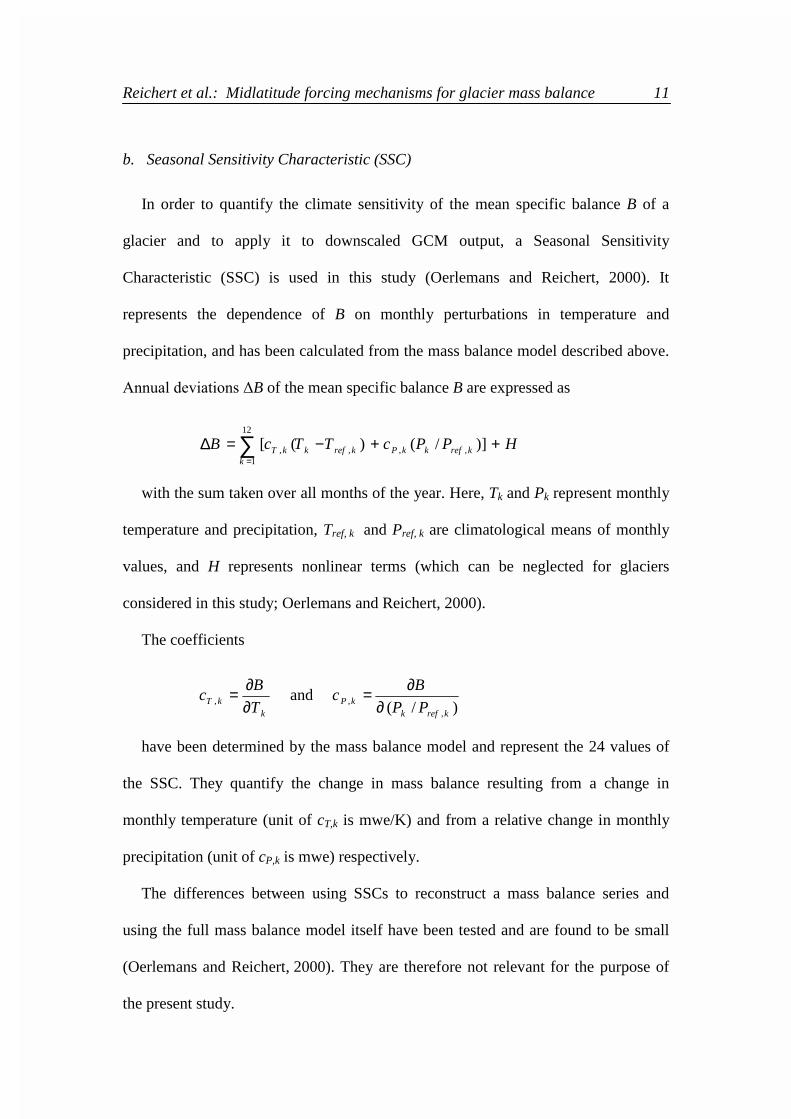
The specific SSCs for Nigardsbreen and Rhonegletscher with respect to
temperature and precipitation are shown in Figure 3.
Nigardsbreen (Figure 3a) can be identified having maritime character. The melt
season especially on the lower parts of the glacier is long, the sensitivity cT,k to
changes in temperature remains high from May to October (-0.08 to -0.11 mwe/K).
Temperature anomalies during these months therefore lead to a strong response in
mass balance. On the other hand, a temperature change in winter (December,
January, February (DJF)) has almost no effect since melting hardly occurs. The
sensitivity of mass balance to relative changes in precipitation is very low in summer
(June, July, August (JJA)) compared to the winter values. The reason is that summer
precipitation falls as rain over most parts of the glacier. An increase in precipitation
has therefore only a marginal effect compared to the enhancement of mass balance in
winter when precipitation mainly falls as snow and can be added to the surface.
The accumulation area of Rhonegletscher (Figure 3b) is located at higher altitudes
(2140 m to 3620 m) compared to Nigardsbreen (295 m to 1950 m). As a
consequence, also summer precipitation (with a large fraction falling as snow at these
altitudes) has a considerable effect on the annual mass balance, the sensitivity is in
fact only slightly lower than in winter. With respect to changes in monthly
temperature, Rhonegletscher is less sensitive (-0.07 mwe/K in summer) than
Nigardsbreen (-0.11 mwe/K in summer).
Reichert et al.: Midlatitude forcing mechanisms for glacier mass balance 13
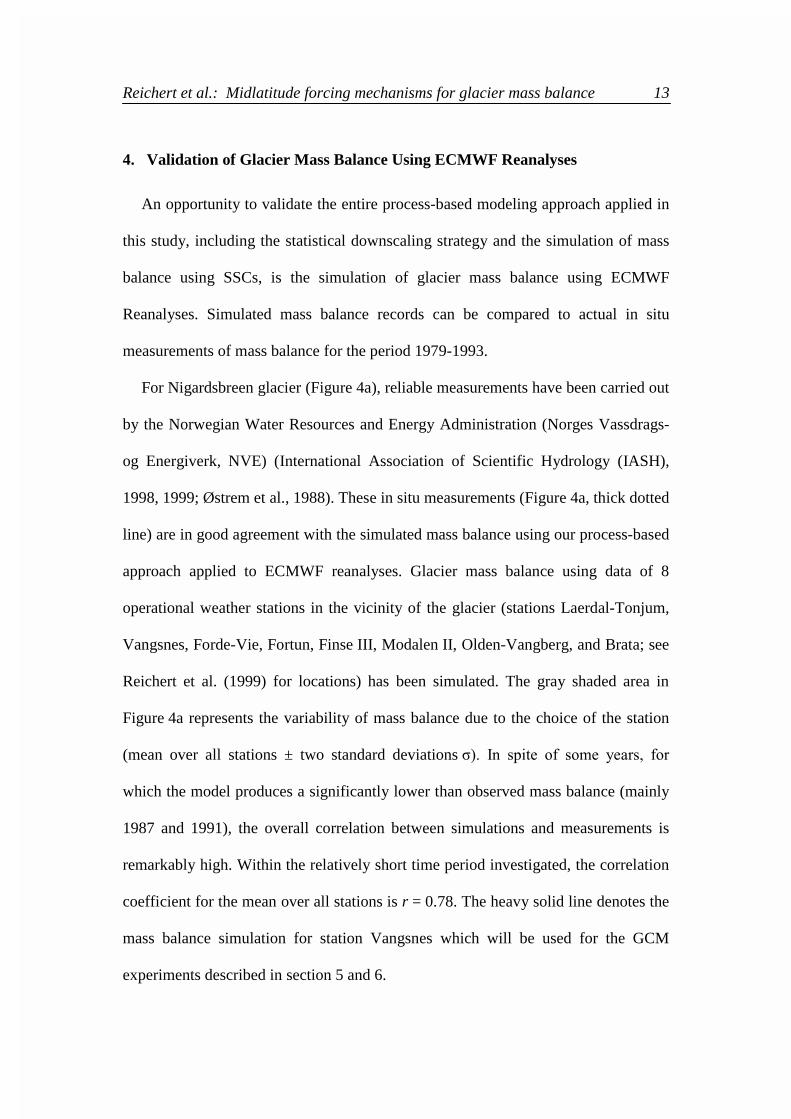
4. Validation of Glacier Mass Balance Using ECMWF Reanalyses
An opportunity to validate the entire process-based modeling approach applied in
this study, including the statistical downscaling strategy and the simulation of mass
balance using SSCs, is the simulation of glacier mass balance using ECMWF
Reanalyses. Simulated mass balance records can be compared to actual in situ
measurements of mass balance for the period 1979-1993.
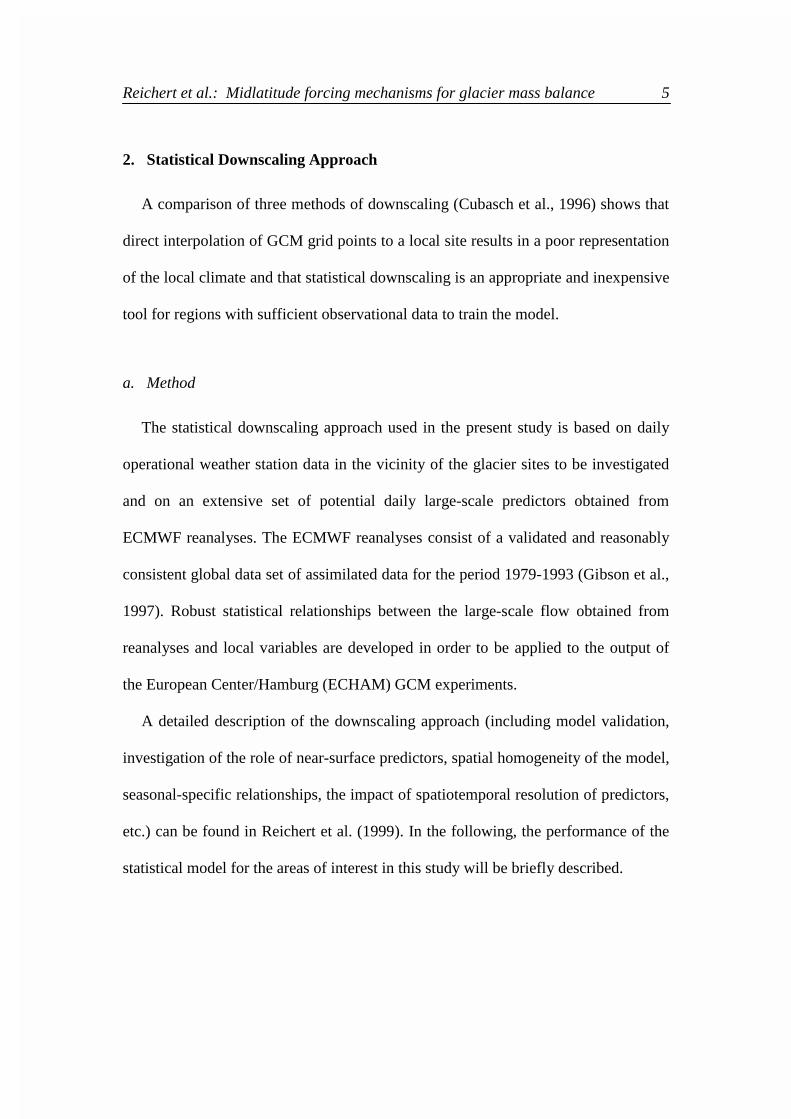
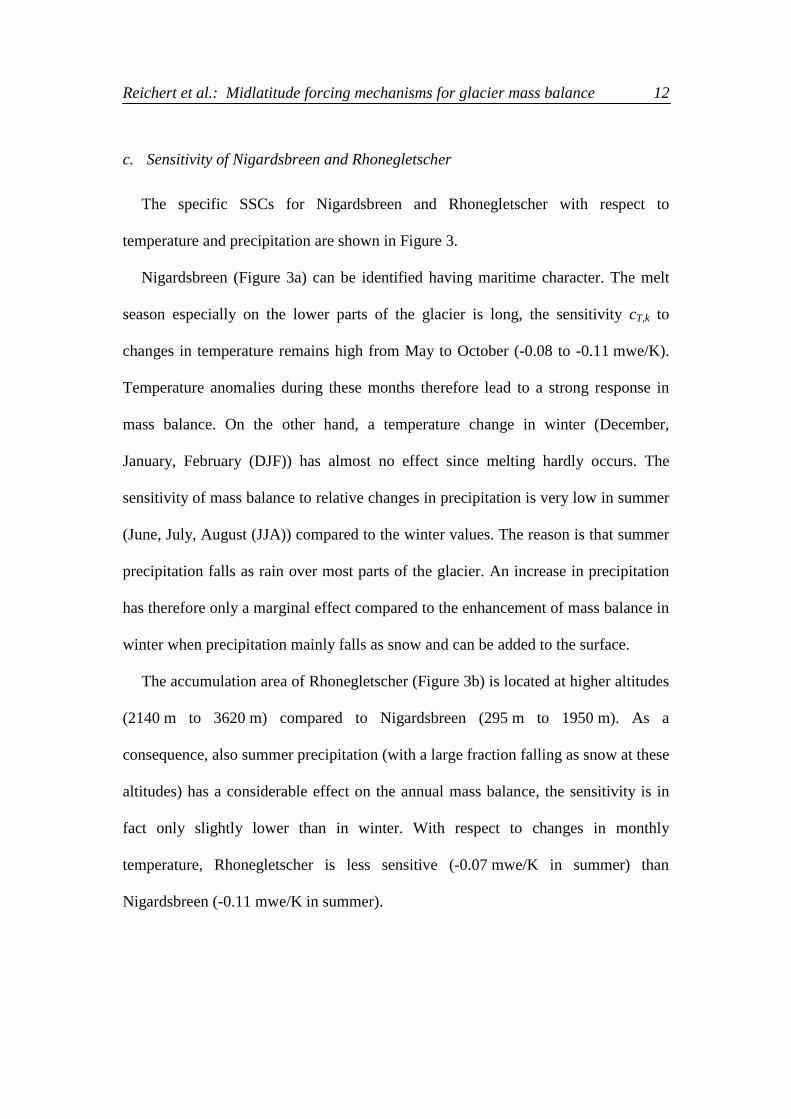
For Nigardsbreen glacier (Figure 4a), reliable measurements have been carried out
by the Norwegian Water Resources and Energy Administration (Norges Vassdrags-
og Energiverk, NVE) (International Association of Scientific Hydrology (IASH),
1998, 1999; Østrem et al., 1988). These in situ measurements (Figure 4a, thick dotted
line) are in good agreement with the simulated mass balance using our process-based
approach applied to ECMWF reanalyses. Glacier mass balance using data of 8
operational weather stations in the vicinity of the glacier (stations Laerdal-Tonjum,
Vangsnes, Forde-Vie, Fortun, Finse III, Modalen II, Olden-Vangberg, and Brata; see
Reichert et al. (1999) for locations) has been simulated. The gray shaded area in
Figure 4a represents the variability of mass balance due to the choice of the station
(mean over all stations ± two standard deviations ���� ��� ����� �� � �� ������ � ��
which the model produces a significantly lower than observed mass balance (mainly
1987 and 1991), the overall correlation between simulations and measurements is
remarkably high. Within the relatively short time period investigated, the correlation
coefficient for the mean over all stations is r = 0.78. The heavy solid line denotes the
mass balance simulation for station Vangsnes which will be used for the GCM
experiments described in section 5 and 6.

Reichert et al.: Midlatitude forcing mechanisms for glacier mass balance 14
For Rhonegletscher (Figure 4b), exact measurements of mass balance are not
available. However, for the recent variability of mass balance of this glacier, a
standard deviation of about 0.6 m water equivalent (mwe) can be inferred according
to numerous mass balance measurements in the central Alps (IASH, 1998). The
standard deviation of the simulated mass balance using station Guetsch (solid line) is
0.62 mwe. Due to the relatively short time period of the ECMWF reanalyses this
agreement is not representative, it shows however that the variability of simulations
for this glacier is generally comparable to measurements. Station Guetsch will be
used for the GCM experiments in section 5 and 6. The approach has again been
applied to 8 stations (stations Guetsch, Piotta, Disentis, Interlaken, San Bernadino.
Chur-Ems, and Vaduz; see Figure 1 for locations) in order to get an insight into the
spatial homogeneity of mass balance (Figure 4b, gray shaded area). The standard
deviation exclusively due to spatial inhomogeneity between all 8 stations, averaged
over the entire time period is 0.18 mwe. For Nigardsbreen, we find 0.26 mwe for this
quantity. Both values clearly demonstrate the considerable impact on glacier mass
balance when using different stations in the vicinity of the glaciers.
The above experiments have enabled the validation of the process-oriented
modeling approach applied in this study against observations. This is an important
basis for the application to GCM experiments discussed in the following.
Reichert et al.: Midlatitude forcing mechanisms for glacier mass balance 15
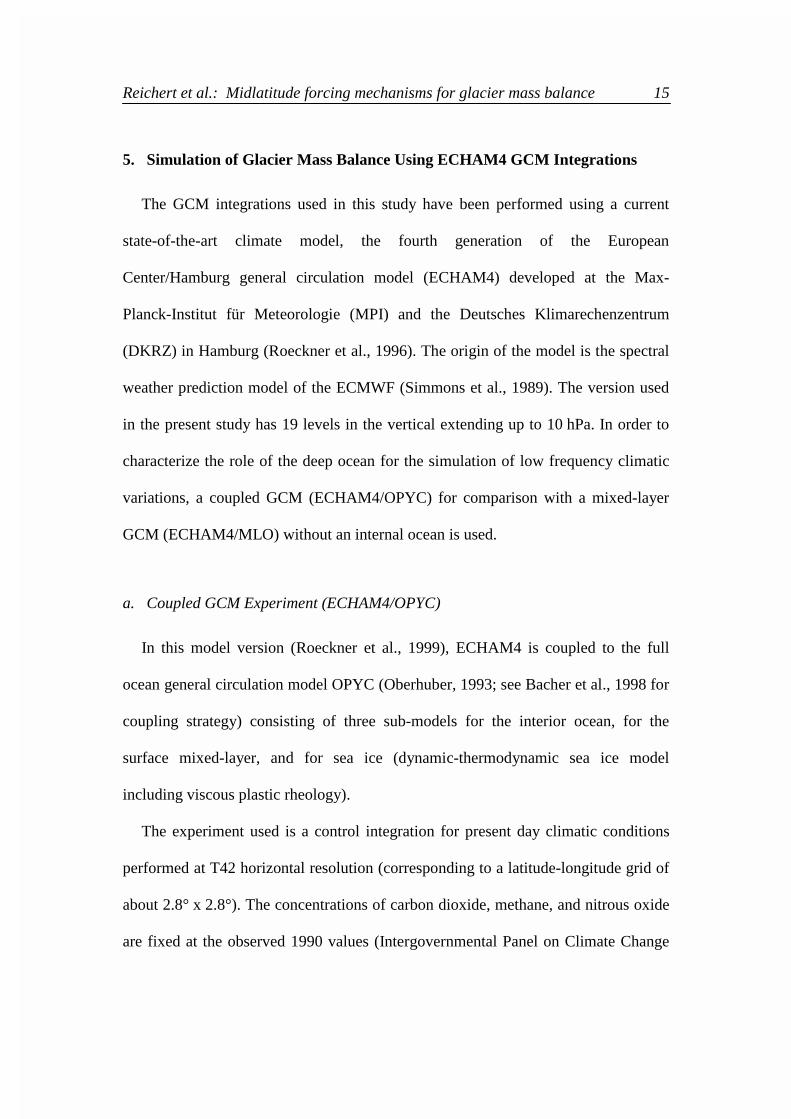
5. Simulation of Glacier Mass Balance Using ECHAM4 GCM Integrations
The GCM integrations used in this study have been performed using a current
state-of-the-art climate model, the fourth generation of the European
Center/Hamburg general circulation model (ECHAM4) developed at the Max-
Planck-Institut für Meteorologie (MPI) and the Deutsches Klimarechenzentrum
(DKRZ) in Hamburg (Roeckner et al., 1996). The origin of the model is the spectral
weather prediction model of the ECMWF (Simmons et al., 1989). The version used
in the present study has 19 levels in the vertical extending up to 10 hPa. In order to
characterize the role of the deep ocean for the simulation of low frequency climatic
variations, a coupled GCM (ECHAM4/OPYC) for comparison with a mixed-layer
GCM (ECHAM4/MLO) without an internal ocean is used.
a. Coupled GCM Experiment (ECHAM4/OPYC)
In this model version (Roeckner et al., 1999), ECHAM4 is coupled to the full
ocean general circulation model OPYC (Oberhuber, 1993; see Bacher et al., 1998 for
coupling strategy) consisting of three sub-models for the interior ocean, for the
surface mixed-layer, and for sea ice (dynamic-thermodynamic sea ice model
including viscous plastic rheology).
The experiment used is a control integration for present day climatic conditions
performed at T42 horizontal resolution (corresponding to a latitude-longitude grid of
about 2.8° x 2.8°). The concentrations of carbon dioxide, methane, and nitrous oxide
are fixed at the observed 1990 values (Intergovernmental Panel on Climate Change
Reichert et al.: Midlatitude forcing mechanisms for glacier mass balance 16
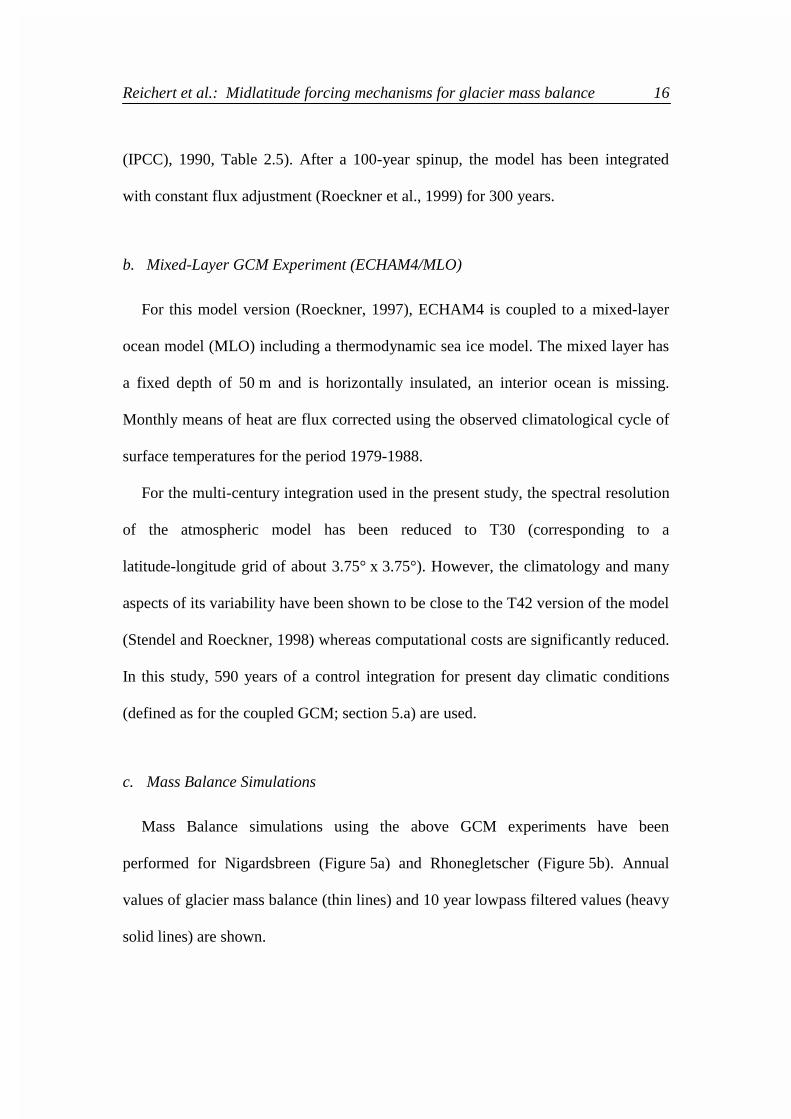
(IPCC), 1990, Table 2.5). After a 100-year spinup, the model has been integrated
with constant flux adjustment (Roeckner et al., 1999) for 300 years.
b. Mixed-Layer GCM Experiment (ECHAM4/MLO)
For this model version (Roeckner, 1997), ECHAM4 is coupled to a mixed-layer
ocean model (MLO) including a thermodynamic sea ice model. The mixed layer has
a fixed depth of 50 m and is horizontally insulated, an interior ocean is missing.
Monthly means of heat are flux corrected using the observed climatological cycle of
surface temperatures for the period 1979-1988.
For the multi-century integration used in the present study, the spectral resolution
of the atmospheric model has been reduced to T30 (corresponding to a
latitude-longitude grid of about 3.75° x 3.75°). However, the climatology and many
aspects of its variability have been shown to be close to the T42 version of the model
(Stendel and Roeckner, 1998) whereas computational costs are significantly reduced.
In this study, 590 years of a control integration for present day climatic conditions
(defined as for the coupled GCM; section 5.a) are used.
c. Mass Balance Simulations
Mass Balance simulations using the above GCM experiments have been
performed for Nigardsbreen (Figure 5a) and Rhonegletscher (Figure 5b). Annual
values of glacier mass balance (thin lines) and 10 year lowpass filtered values (heavy
solid lines) are shown.

Reichert et al.: Midlatitude forcing mechanisms for glacier mass balance 17
Pronounced mass balance fluctuations on time scales of years to decades have
been simulated in the experiments. The variability in mass balance is exclusively due
to internal variations in the climate system since GCM integrations excluding
external forcings such as solar irradiation changes, volcanic or anthropogenic effects
are used. In order to compare the variability of the simulated time series, the standard
����� ����� � �� � ��� ��� ��������� ���� ��� ��� �ar lowpass filtered mass balance
time series have been computed.
For both glaciers, the interannual variability for the mixed-layer GCM experiment
(MLO) is higher (significant at 95% confidence level) in comparison with the
coupled run (OPYC). For Nigardsb���� �� ����� �Nig,MLO = 0.69 mwe (MLO)
� ������ � � �Nig,OPYC = 0.61 mwe (OPYC). For Rhonegletscher, we have
�Rho,MLO = 0.91 ��� � ������ � � �Rho,OPYC = 0.79 mwe. A further investigation
shows that the main reason is the different variability in simulated precipitation in the
two model versions (see section 6.b for the impact of precipitation on mass balance).
Although the total amount of simulated annual precipitation averaged over the full
time period of the experiments is comparable in both models, the standard deviation
of precipitation for Nigardsbreen (Rhonegletscher) is by 14% (12%) higher in the
mixed-layer GCM relative to the coupled GCM. We assume that this model-specific
feature is at least partly related to a different (and in comparison with observations
more unrealistic) representation of the pattern of precipitation associated with the
NAO in the mixed-layer model.
The standard variations of the 10 year lowpass filtered time series are not
significantly different in the two model versions. They read as follows:
�Nig,MLO = 0.30 ���� �Nig,OPYC = 0.28 ���� �Rho,MLO = 0.31 mwe, and
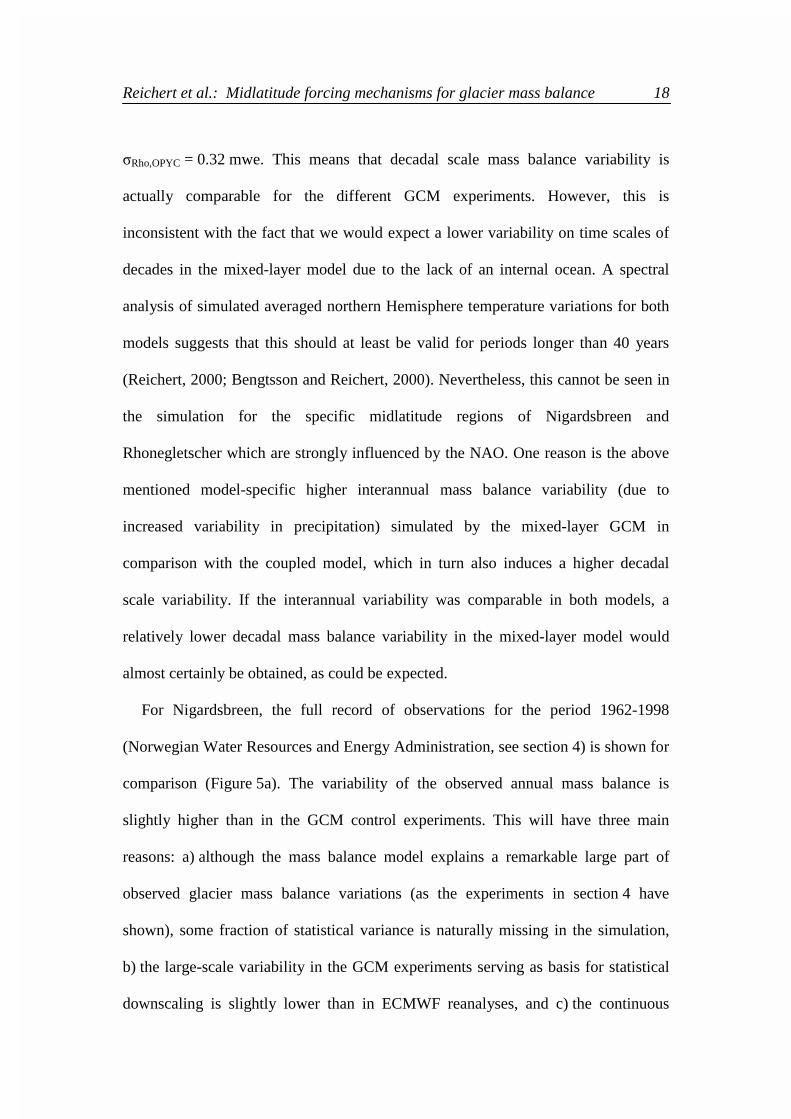
Reichert et al.: Midlatitude forcing mechanisms for glacier mass balance 18
�Rho,OPYC = 0.32 mwe. This means that decadal scale mass balance variability is
actually comparable for the different GCM experiments. However, this is
inconsistent with the fact that we would expect a lower variability on time scales of
decades in the mixed-layer model due to the lack of an internal ocean. A spectral
analysis of simulated averaged northern Hemisphere temperature variations for both
models suggests that this should at least be valid for periods longer than 40 years
(Reichert, 2000; Bengtsson and Reichert, 2000). Nevertheless, this cannot be seen in
the simulation for the specific midlatitude regions of Nigardsbreen and
Rhonegletscher which are strongly influenced by the NAO. One reason is the above
mentioned model-specific higher interannual mass balance variability (due to
increased variability in precipitation) simulated by the mixed-layer GCM in
comparison with the coupled model, which in turn also induces a higher decadal
scale variability. If the interannual variability was comparable in both models, a
relatively lower decadal mass balance variability in the mixed-layer model would
almost certainly be obtained, as could be expected.
For Nigardsbreen, the full record of observations for the period 1962-1998
(Norwegian Water Resources and Energy Administration, see section 4) is shown for
comparison (Figure 5a). The variability of the observed annual mass balance is
slightly higher than in the GCM control experiments. This will have three main
reasons: a) although the mass balance model explains a remarkable large part of
observed glacier mass balance variations (as the experiments in section 4 have
shown), some fraction of statistical variance is naturally missing in the simulation,
b) the large-scale variability in the GCM experiments serving as basis for statistical
downscaling is slightly lower than in ECMWF reanalyses, and c) the continuous

Reichert et al.: Midlatitude forcing mechanisms for glacier mass balance 19
increase of greenhouse gas concentrations not considered in the model runs
(equilibrium state with constant greenhouse gas concentrations) affects climatic
variability (this will be investigated in another study using transient coupled GCM
experiments).
However, periods of generally strong positive mass balances, comparable to
observed mass balances for Nigardsbreen during the 1980s and the first half of the
1990s (Figure 5a, observed 1962-1998 record; see Figure 13 for larger illustration),
do appear in the GCM simulations exclusively due to internal variations in the
climate system. A comparable positive mass balance “event” has, for example, been
simulated by the coupled ECHAM4/OPYC GCM at around year 50, denoted as year
340 in Figure 5a (particularly evident for the 10 year lowpass filtered time series). It
should also be mentioned that in longer coupled GCM integrations, the sampling
problem would be reduced and a larger number of simulated “events” of this type
could be expected. In the following, it will be demonstrated that such “events” can be
related to the NAO (section 6 and 7). A link to the NAO has been proposed in earlier
studies (Hurrel, 1995; Nesje, 2000) but can now be investigated in detail, including
the responsible mechanisms using multi-century GCM experiments.
6. The Role of the NAO for Glacier Mass Balance
In this section, physical mechanisms in the climate system responsible for mass
balance variations of the above simulated glaciers are examined. This leads to an
investigation of possible relationships with the North Atlantic Oscillation (NAO) as a
Reichert et al.: Midlatitude forcing mechanisms for glacier mass balance 20
major source of atmospheric variability. The individual impact of temperature and
precipitation on mass balance variations is examined, considering individual seasons
which may have a distinct impact according to the glacier specific Seasonal
Sensitivity Characteristics (SSCs) discussed in section 3.
a. NAO Index and Glacier Mass Balance
The North Atlantic Oscillation (Walker and Bliss, 1932; van Loon and Rogers,
1978; Kushnir and Wallace, 1989; Kushnir, 1994; Hurrel, 1995; Visbeck et al., 1998)
can be associated with variations in the strength of the westerlies over the North
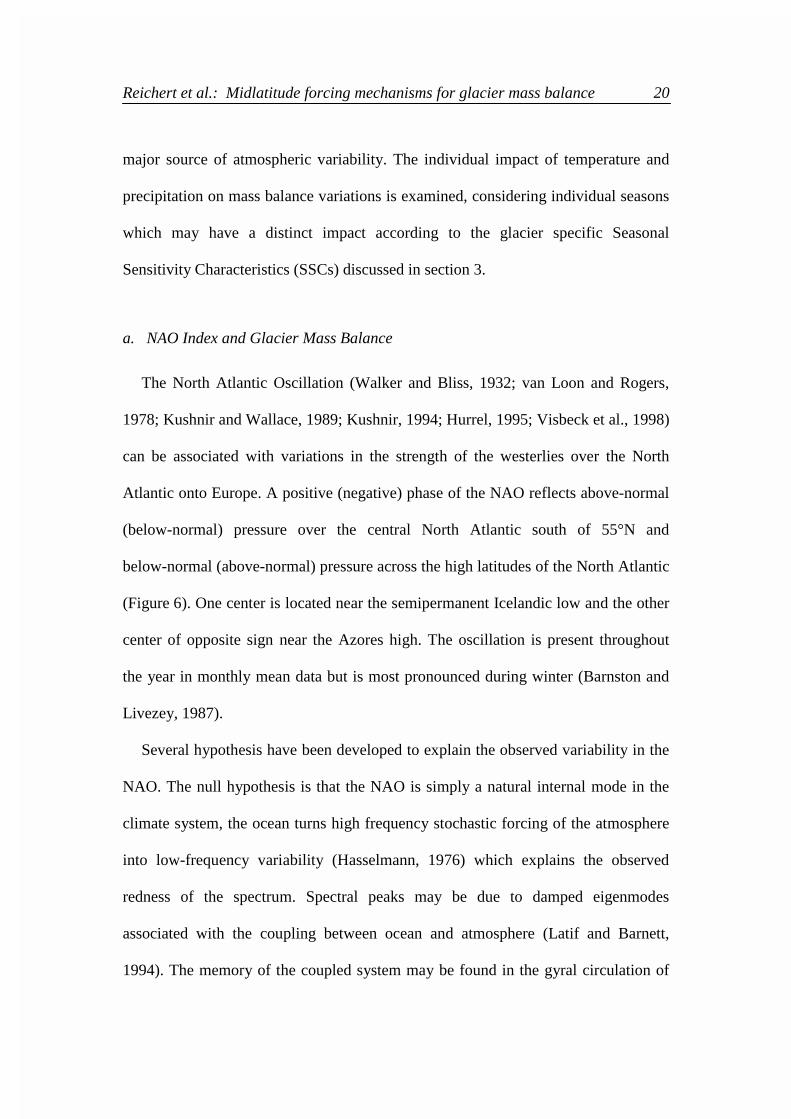
Atlantic onto Europe. A positive (negative) phase of the NAO reflects above-normal
(below-normal) pressure over the central North Atlantic south of 55°N and
below-normal (above-normal) pressure across the high latitudes of the North Atlantic
(Figure 6). One center is located near the semipermanent Icelandic low and the other
center of opposite sign near the Azores high. The oscillation is present throughout
the year in monthly mean data but is most pronounced during winter (Barnston and
Livezey, 1987).
Several hypothesis have been developed to explain the observed variability in the
NAO. The null hypothesis is that the NAO is simply a natural internal mode in the
climate system, the ocean turns high frequency stochastic forcing of the atmosphere
into low-frequency variability (Hasselmann, 1976) which explains the observed
redness of the spectrum. Spectral peaks may be due to damped eigenmodes
associated with the coupling between ocean and atmosphere (Latif and Barnett,
1994). The memory of the coupled system may be found in the gyral circulation of
Reichert et al.: Midlatitude forcing mechanisms for glacier mass balance 21
the ocean (Grötzner et al., 1998) and the thermohaline circulation (Timmermann et
al., 1998).
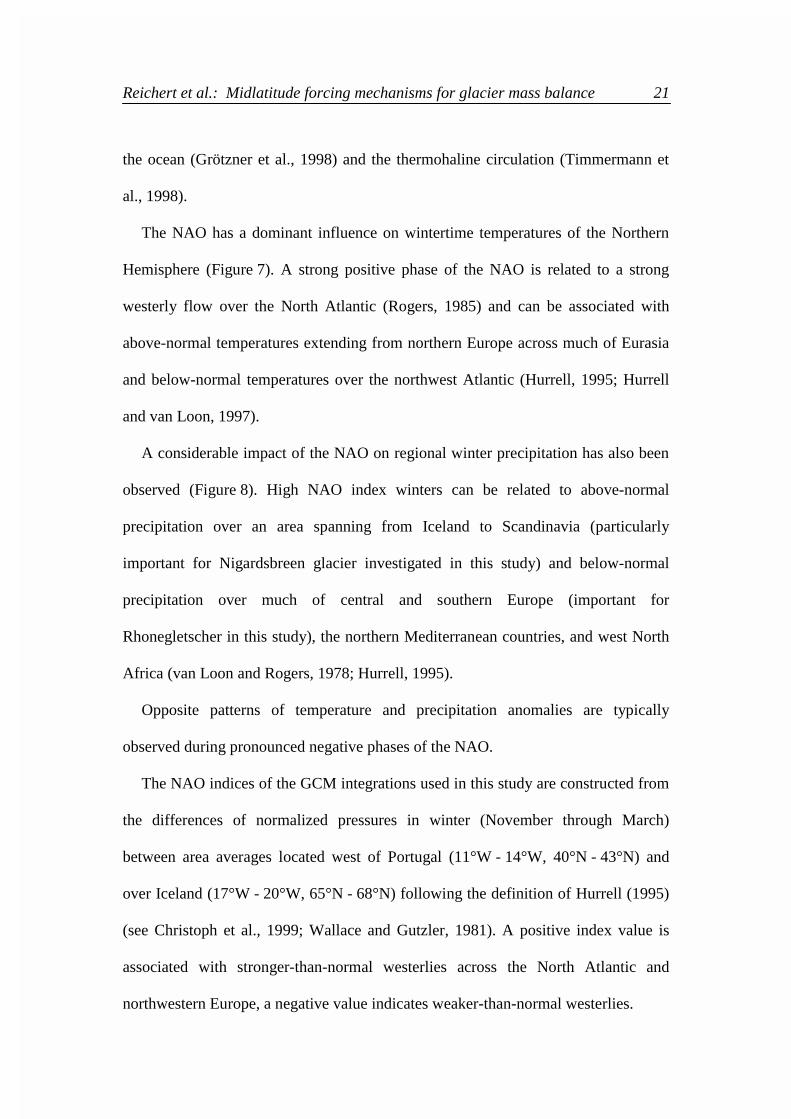
The NAO has a dominant influence on wintertime temperatures of the Northern
Hemisphere (Figure 7). A strong positive phase of the NAO is related to a strong
westerly flow over the North Atlantic (Rogers, 1985) and can be associated with
above-normal temperatures extending from northern Europe across much of Eurasia
and below-normal temperatures over the northwest Atlantic (Hurrell, 1995; Hurrell
and van Loon, 1997).
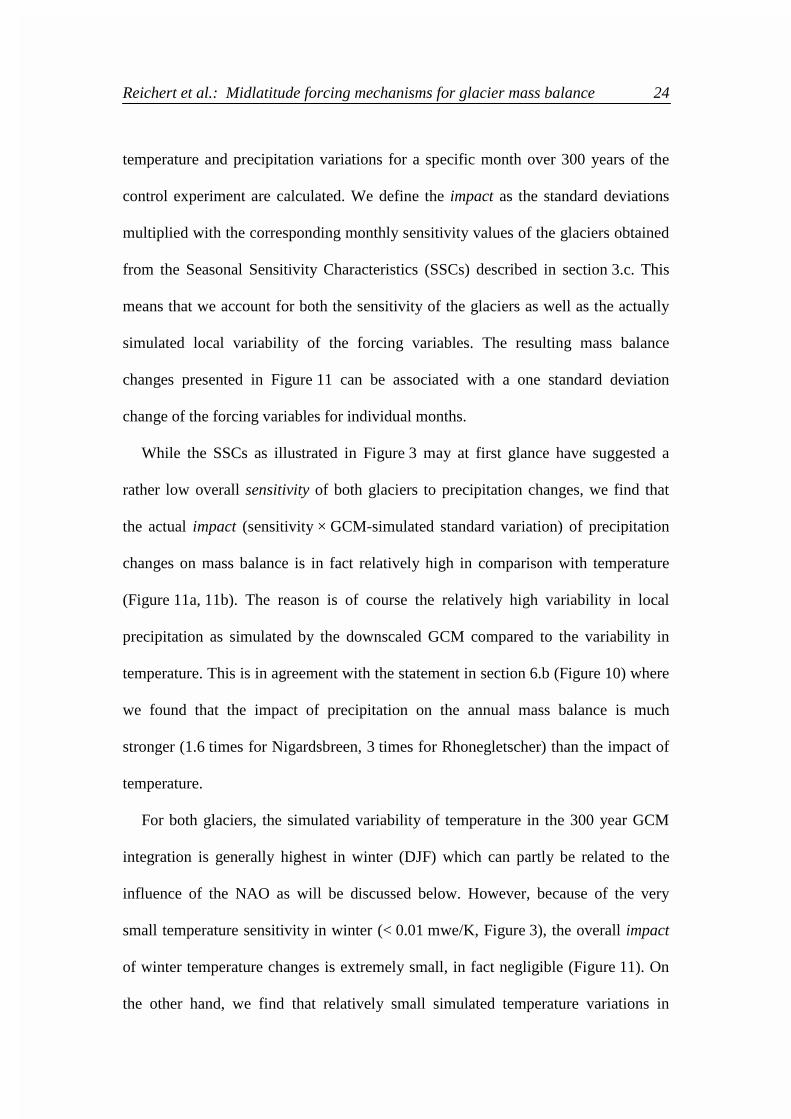
A considerable impact of the NAO on regional winter precipitation has also been
observed (Figure 8). High NAO index winters can be related to above-normal
precipitation over an area spanning from Iceland to Scandinavia (particularly
important for Nigardsbreen glacier investigated in this study) and below-normal
precipitation over much of central and southern Europe (important for
Rhonegletscher in this study), the northern Mediterranean countries, and west North
Africa (van Loon and Rogers, 1978; Hurrell, 1995).
Opposite patterns of temperature and precipitation anomalies are typically
observed during pronounced negative phases of the NAO.
The NAO indices of the GCM integrations used in this study are constructed from
the differences of normalized pressures in winter (November through March)
between area averages located west of Portugal (11°W - 14°W, 40°N - 43°N) and
over Iceland (17°W - 20°W, 65°N - 68°N) following the definition of Hurrell (1995)
(see Christoph et al., 1999; Wallace and Gutzler, 1981). A positive index value is
associated with stronger-than-normal westerlies across the North Atlantic and
northwestern Europe, a negative value indicates weaker-than-normal westerlies.

Reichert et al.: Midlatitude forcing mechanisms for glacier mass balance 22
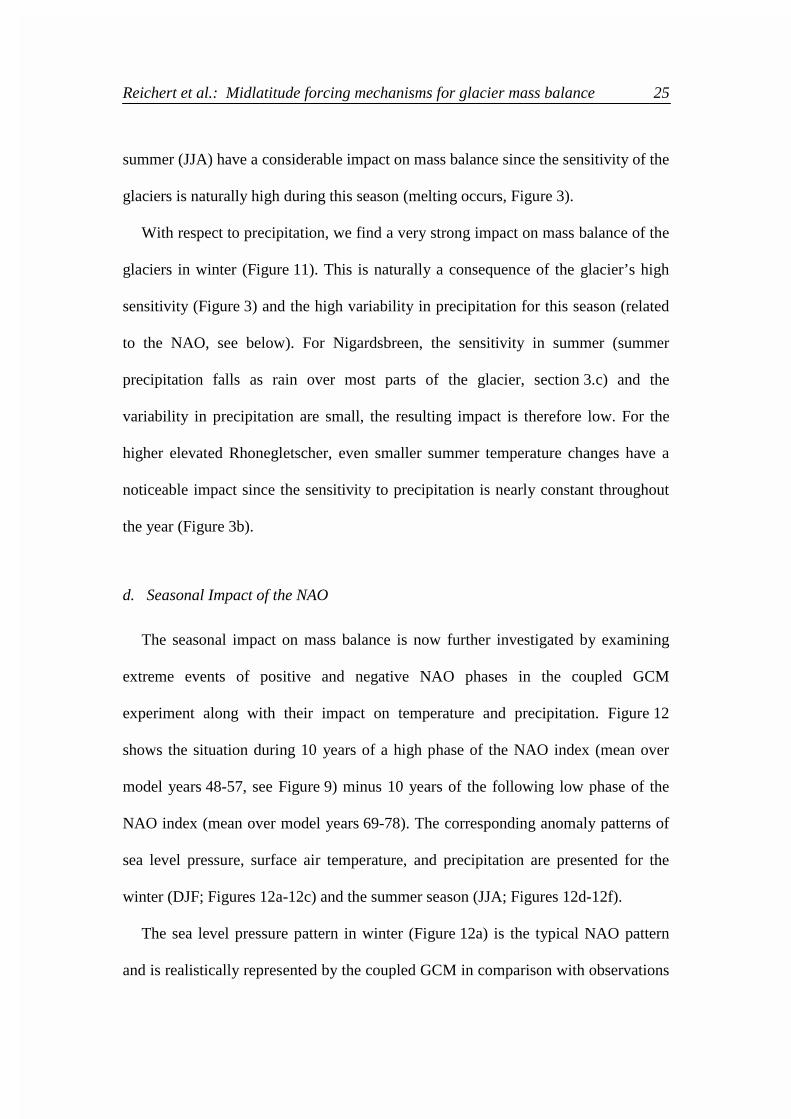
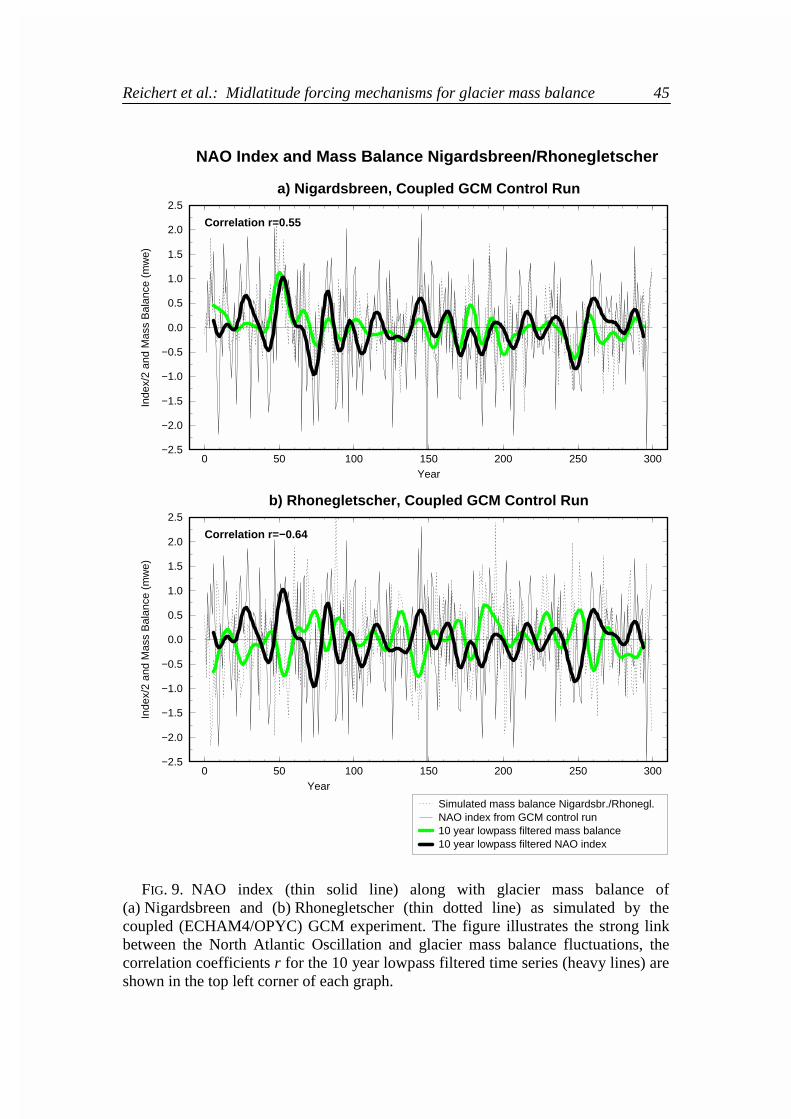
Figure 9 shows the unfiltered (solid thin lines) and 10 year lowpass filtered time
series (solid heavy lines) of the NAO index for 300 years of the coupled
(ECHAM4/OPYC) GCM integration. Glacier mass balance for Nigardsbreen
(Figure 9a, dotted line) and Rhonegletscher (Figure 9b, dotted line) as simulated by
the experiment (see section 5 for description) along with the 10 year lowpass filtered
versions (heavy shaded lines) are shown for comparison. For both glaciers, a well
pronounced correlation between the lowpass filtered NAO index of the model and
mass balance is found. The correlation coefficient for Nigardsbreen is r = 0.55. For
Rhonegletscher, an anti-correlation of r = -0.64 is found (both significant at 99%
confidence level). This demonstrates the strong link between decadal variations in
the North Atlantic Oscillation and decadal variability in glacier mass balance
controlled by temperature and precipitation. In the following, the individual role of
temperature and precipitation within this relation will be further investigated.
b. Individual Impact of Temperature and Precipitation on Mass Balance
The individual impact of temperature and precipitation on mass balance of each
glacier is illustrated in Figure 10. 10 year lowpass filtered mass balance for
Nigardsbreen (Figure 10a) and Rhonegletscher (Figure 10b) as simulated by the
coupled GCM using exclusively either precipitation (BP, dashed shaded lines) or
temperature (BT, dashed solid lines) have been calculated. For both glaciers, the mass
balance variability due to precipitation (standard deviation �Bp) is by far higher than
the variability due to temperature (�Bt). For Nigardsbreen, we find �Bp = 0.27 mwe
and �Bt = 0.17 mwe, for Rhonegletscher we have �Bp = 0.32 mwe and

Reichert et al.: Midlatitude forcing mechanisms for glacier mass balance 23
�Bt = 0.10 mwe. This means that the individual impact of precipitation on
Nigardsbreen glacier mass balance is about 1.6 times higher than the impact of
temperature. For Rhonegletscher it is about 3 times higher.
It can furthermore be inferred that for both glaciers, changes in mass balance due
to precipitation are very closely linked to the NAO (Figure 10, solid lines). The
correlation coefficient between BP and the NAO index is r = 0.75 (Nigardsbreen) and
r = -0.65 (Rhonegletscher). On the other hand, mass balance variations due to
temperature are not significantly correlated with the NAO (95% confidence level),
we find r = -0.20 (Nigardsbreen) and r = -0.17 (Rhonegletscher). This suggests that
for both glaciers, precipitation is by far the dominant factor for the close relationship
between glacier mass balance variations and the NAO.
For the mixed-layer GCM experiment (not shown), the standard deviations �Bt of
mass balance due to temperature are comparable to the coupled GCM. The standard
deviations �Bp due to precipitation are slightly higher (e.g. for Rhonegletscher
0.36 mwe relative to 0.32 mwe) due to the model-specific increased variability in
simulated precipitation. As mentioned in section 5.c, this is connected to the different
representation of the pattern of precipitation associated with the NAO in the
mixed-layer model.
c. Seasonal Impact on Mass Balance
The actual impact of temperature and precipitation on glacier mass balance for
individual months of the year as simulated by the downscaled coupled GCM may
now be investigated. For each glacier site, the standard deviations of the simulated
Reichert et al.: Midlatitude forcing mechanisms for glacier mass balance 24
temperature and precipitation variations for a specific month over 300 years of the
control experiment are calculated. We define the impact as the standard deviations
multiplied with the corresponding monthly sensitivity values of the glaciers obtained
from the Seasonal Sensitivity Characteristics (SSCs) described in section 3.c. This
means that we account for both the sensitivity of the glaciers as well as the actually
simulated local variability of the forcing variables. The resulting mass balance
changes presented in Figure 11 can be associated with a one standard deviation
change of the forcing variables for individual months.
While the SSCs as illustrated in Figure 3 may at first glance have suggested a
rather low overall sensitivity of both glaciers to precipitation changes, we find that
the actual impact (sensitivity × GCM-simulated standard variation) of precipitation
changes on mass balance is in fact relatively high in comparison with temperature
(Figure 11a, 11b). The reason is of course the relatively high variability in local
precipitation as simulated by the downscaled GCM compared to the variability in
temperature. This is in agreement with the statement in section 6.b (Figure 10) where
we found that the impact of precipitation on the annual mass balance is much
stronger (1.6 times for Nigardsbreen, 3 times for Rhonegletscher) than the impact of
temperature.
For both glaciers, the simulated variability of temperature in the 300 year GCM
integration is generally highest in winter (DJF) which can partly be related to the
influence of the NAO as will be discussed below. However, because of the very
small temperature sensitivity in winter (< 0.01 mwe/K, Figure 3), the overall impact
of winter temperature changes is extremely small, in fact negligible (Figure 11). On
the other hand, we find that relatively small simulated temperature variations in
Reichert et al.: Midlatitude forcing mechanisms for glacier mass balance 25
summer (JJA) have a considerable impact on mass balance since the sensitivity of the
glaciers is naturally high during this season (melting occurs, Figure 3).
With respect to precipitation, we find a very strong impact on mass balance of the
glaciers in winter (Figure 11). This is naturally a consequence of the glacier’s high
sensitivity (Figure 3) and the high variability in precipitation for this season (related
to the NAO, see below). For Nigardsbreen, the sensitivity in summer (summer
precipitation falls as rain over most parts of the glacier, section 3.c) and the
variability in precipitation are small, the resulting impact is therefore low. For the
higher elevated Rhonegletscher, even smaller summer temperature changes have a
noticeable impact since the sensitivity to precipitation is nearly constant throughout
the year (Figure 3b).
d. Seasonal Impact of the NAO
The seasonal impact on mass balance is now further investigated by examining
extreme events of positive and negative NAO phases in the coupled GCM
experiment along with their impact on temperature and precipitation. Figure 12
shows the situation during 10 years of a high phase of the NAO index (mean over
model years 48-57, see Figure 9) minus 10 years of the following low phase of the
NAO index (mean over model years 69-78). The corresponding anomaly patterns of
sea level pressure, surface air temperature, and precipitation are presented for the
winter (DJF; Figures 12a-12c) and the summer season (JJA; Figures 12d-12f).
The sea level pressure pattern in winter (Figure 12a) is the typical NAO pattern
and is realistically represented by the coupled GCM in comparison with observations
Reichert et al.: Midlatitude forcing mechanisms for glacier mass balance 26
(see Figure 6). As mentioned earlier (section 6.a) the NAO is not well pronounced
during summer which can also clearly be seen in the GCM experiment (Figure 12d).
1) Seasonal impact of precipitation
Positive anomalies in winter precipitation associated with the NAO (Figure 12c)
can be found from Iceland to Scandinavia with a maximum anomaly of about
40 mm/month near the Norwegian coast. The pattern is in good agreement with
observations (Figure 8). Negative anomalies occur over western and southern Europe
with the largest reductions in precipitation (more than 60 mm/month) near the
northwestern coast of the Iberian peninsula. The Alps experience a reduction of
about 20 mm in monthly precipitation.
Nigardsbreen glacier (61º43'N, 7º08'E) is located near the maximum anomaly
(40 mm/month) in winter precipitation associated with the NAO. As has been shown
above, the glacier is most sensitive to winter precipitation anomalies (Figure 11a).
This demonstrates that the strong impact of precipitation on mass balance (as shown
in Figure 10a and 11a) can to a great extent be explained by the strong influence of
the NAO. During summer, both the precipitation anomaly due to the NAO
(Figure 12f) as well as the sensitivity of the glacier are low, the effect on mass
balance is consequently very small.
For the region of Rhonegletscher (46º37'N, 8º24'E), we find a reduction in winter
precipitation of about 20 mm/month (Figure 12c) exerting a strong impact on the
annual mass balance of the glacier (as shown in Figure 10b and 11b). Although the
precipitation sensitivity of Rhonegletscher is roughly constant throughout the year,

Reichert et al.: Midlatitude forcing mechanisms for glacier mass balance 27
the summer precipitation anomaly associated with the NAO (Figure 12f) is low and
its impact is therefore rather restricted.
2) Seasonal impact of temperature
Positive anomalies of more than 1ºC in surface air winter temperature associated
with the NAO (Figure 12b) occur over Scandinavia and other parts of northern
Europe extending eastwards across much of Eurasia. Negative anomalies can be
found over Greenland and parts of the northwest Atlantic.
For the region of Nigardsbreen, we find a considerable winter temperature
anomaly of about 2ºC associated with the NAO. However, the sensitivity to winter
temperature changes is low (Figure 3a), the impact on the annual glacier mass
balance is therefore in fact negligible (Figure 11a). This is also true for
Rhonegletscher (Figure 11b) which experiences only a small winter temperature
anomaly associated with the NAO (Figure 12b). In summer a rather strong impact of
temperatures could be expected due to the relatively high sensitivity of the glaciers
during this season. However, the simulated temperature anomalies associated with
the NAO are low for both glaciers (Figure 12e), their overall impact on the annual
mass balance therefore still remains smaller compared to the impact of precipitation.
In summary, it has been shown that for both glaciers, 1) the overall impact of
precipitation changes on annual mass balance variations is by far higher than the
impact of temperature, and 2) mass balance changes of the glaciers are to a large
extent caused by variations in winter precipitation associated with the NAO. A high
phase of the NAO means clearly enhanced winter precipitation for the region of
Reichert et al.: Midlatitude forcing mechanisms for glacier mass balance 28
Nigardsbreen, typically leading to a higher than normal positive mass balance over
the year. For Rhonegletscher, a high NAO phase typically means reduced winter
precipitation leading to a lower than normal mass balance. The opposite is valid for a
low phase of the NAO.
7. Recently Observed Positive Mass Balances of Norwegian Glaciers
The net mass balance averaged over available observational data from 32
worldwide glaciers in 10 mountain ranges shows a considerable worldwide glacier
mass loss on the order of a few decimeters per year for the period 1980-1997 (IASH,
1999; Haeberli et al., 1999). In this global context, strong positive mass balances as
observed for Nigardsbreen and other maritime glaciers in southwestern Norway over
the same time period may appear rather exceptional. With respect to the results
obtained above, it is now interesting to discuss these positive mass balances in more
detail.
It has already been mentioned (section 5.c) that periods of generally strong
positive mass balances, comparable to the observed mass balances for Nigardsbreen
within the period 1980-1995 (Figure 13, thin dashed line), appear in the GCM
simulations exclusively due to internal climate variations (Figure 5a). It has been
shown that a comparable positive mass balance “event” has, for example, been
simulated by the coupled ECHAM4/OPYC GCM at around year 50 (denoted as year
340 in Figure 5a). With respect to the NAO index as presented in Figure 9 it has now
become evident that this simulated “event” of positive mass balances can clearly be
Reichert et al.: Midlatitude forcing mechanisms for glacier mass balance 29
associated with a strong positive phase of the NAO in the model (Figure 9a, heavy
solid line, around year 50).
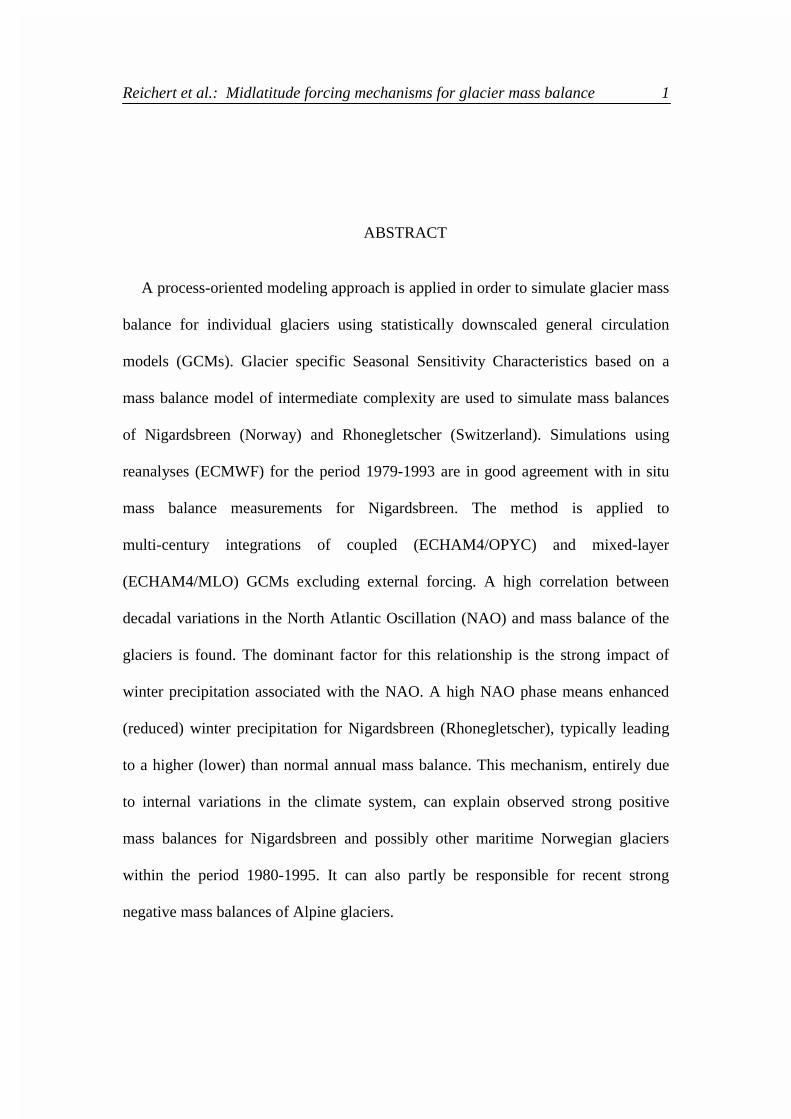
This is in agreement with observational data illustrated in Figure 13. The observed
annual mass balances for Nigardsbreen within the period 1962-1998 (dashed lines)
along with the NAO index for the period 1950-1999 (thin solid line) are shown. It is
immediately evident that mass balance and NAO index are remarkably well
correlated, the correlation coefficient for annual data is r = 0.58 (95% significance
level at r � 0.29) within the period 1962-1998. For the period 1966-1998, the
correlation coefficient even increases to r = 0.71 (95% significance level for
r � 0.30). The 10 year lowpass filtered time series (thick lines) indicate that also the
decadal trends are comparable for the last three decades.
The investigation of the individual seasonal impact of temperature and
precipitation in the GCM experiments (section 6.b-d) showed that this link between
mass balance and the NAO is mainly established through winter precipitation
variations associated with the NAO exerting a strong impact on the annual mass
balance of the glacier.
The GCM experiments and investigation of the forcing factors for glacier mass
balance in this study therefore provide evidence for the assumption that generally
positive mass balance tendencies as recently observed for Nigardsbreen can be
related to enhanced precipitation in winter associated with a positive phase of the
NAO. The observed strong positive glacier mass balances within 1980-1995 can thus
be seen as a consequence of the corresponding observed persistent positive phase of
the NAO within this time period. This mechanism is also likely to be valid for other
Reichert et al.: Midlatitude forcing mechanisms for glacier mass balance 30
maritime Norwegian glaciers which have also shown strong positive mass balances
within this period (IASH, 1999).
8. Summary and Conclusions
A process-based modeling approach has been applied in order to simulate glacier
mass balance records for Nigardsbreen (Norway) and Rhonegletscher (Switzerland)
using downscaled GCM experiments.
Statistical downscaling of GCM output is based on the large-scale flow obtained
from daily ECMWF reanalyses and local station data in the vicinity of the glaciers.
On average, 79% of variance for observed monthly temperatures in the region of
Nigardsbreen, and 80% of variance in the region of Rhonegletscher are explained
using reanalyses. For local precipitation, the explained variances are 65% and 51%
respectively. The composition of large-scale predictors and their individual impact
(especially on precipitation) vary considerably for individual stations within the areas
of investigation.
The sensitivity of glacier mass balance to local temperature and precipitation is
represented by glacier specific Seasonal Sensitivity Characteristics (SSCs) calculated
from a mass balance model of intermediate complexity. The sensitivity of
Rhonegletscher to changes in precipitation is almost constant throughout the year
whereas for Nigardsbreen, a change in summer precipitation (mainly falling as rain
due to the lower elevation) has only a marginal effect. The sensitivity to changes in
summer temperatures (when melting occurs) is higher for Nigardsbreen relative to
Reichert et al.: Midlatitude forcing mechanisms for glacier mass balance 31
Rhonegletscher. A temperature change in winter has almost no effect on mass
balance for both glaciers.
The process-based mass balance modeling approach and the statistical
downscaling strategy is validated against observations by simulating glacier mass
balance using ECMWF reanalyses. In situ measurements of mass balance for
Nigardsbreen are found to be in good agreement with simulations for the period
1979-1993. A considerable impact on mass balance is found when using different
stations in the vicinity of the glaciers for downscaling.
Mass balance fluctuations for Nigardsbreen and Rhonegletscher are simulated
using multi-century coupled (ECHAM4/OPYC) and mixed-layer (ECHAM4/MLO)
GCM integrations excluding external forcings. The experiments show that periods of
generally strong positive mass balances, comparable to observed mass balances for
Nigardsbreen during the 1980s and the first half of the 1990s do appear in the GCM
integrations, suggesting that such periods may be explained by internal variations in
the climate system. For Nigardsbreen (Rhonegletscher), a high correlation
(anti-correlation) between decadal variations in the North Atlantic Oscillation and
glacier mass balance in the model experiments is found. The correlation coefficients
for the relation between the NAO index and mass balance are r = 0.55 and r = -0.64
for Nigardsbreen and Rhonegletscher respectively.
The actual impact of temperature (precipitation) as simulated by the downscaled
GCM experiments on mass balance variations of the glaciers is defined as the
product of glacier sensitivity and one standard deviation of simulated temperature
(precipitation) variability for individual months. In the coupled GCM experiment, the
overall impact of precipitation changes on glacier mass balance variations is
Reichert et al.: Midlatitude forcing mechanisms for glacier mass balance 32
1.6 times and 3 times higher for Nigardsbreen and Rhonegletscher, respectively,
compared to the impact of temperature. Furthermore, precipitation is the dominant
factor for the link between mass balance and the NAO. Mass balance changes of the
glaciers due to precipitation are to a great extent caused by variations in winter
precipitation associated with the NAO. A high phase of the NAO means clearly
enhanced winter precipitation for the region of Nigardsbreen, typically leading to a
higher than normal positive mass balance over the year. For Rhonegletscher, a high
NAO phase typically means reduced winter precipitation leading to a lower than
normal mass balance.
This mechanism, established using multi-century coupled GCM experiments, can
explain the observed strong positive mass balances for Nigardsbreen and possibly
other maritime Norwegian glaciers within the period 1980-1995. It has been shown
that observed annual glacier mass balances and the observed NAO index are
remarkably well correlated within the period 1962-1998. The experiments in this
study provide evidence for the assumption that the generally positive mass balance
tendencies recently observed for Nigardsbreen can be related to enhanced
precipitation in winter associated with a positive phase of the NAO. The observed
strong positive glacier mass balances within 1980-1995 can thus be seen as a
consequence of the corresponding observed persistent positive NAO phase.
Glacier mass balances of Alpine glaciers have been strongly negative during the
decade 1980-1990. The average mass balance value has been -0.65 mwe (Haeberli et
al., 1999) resulting in an estimated loss of 10 to 20% of ice volume since 1980
(Haeberli and Beniston, 1998). The results of the present study indicate that this loss
of mass balance can (at least as has been demonstrated for Rhonegletscher) partly be
Reichert et al.: Midlatitude forcing mechanisms for glacier mass balance 33
explained by the strong positive phase of the NAO within this time period. However,
it is of course necessary to account for the general positive temperature trend
observed in this region, extremely warm temperatures have affected the Alpine
region considerably within 1980-1990 (Beniston et al., 1994). Mass balance changes
due to precipitation associated with the NAO are in this region therefore
superimposed by changes due to the anomalous warm temperatures which occurred
in this period.
The mass balance records simulated by the method described in this study will
serve as basis for the simulation of glacier length records using a dynamic ice flow
model. This will enable a comparison between simulated glacier length fluctuations
and long observed or reconstructed records of glacier length in order to further
investigate natural climate variability as indicated by glaciers.
Reichert et al.: Midlatitude forcing mechanisms for glacier mass balance 34
Acknowledgments. The authors would like to thank E. Roeckner, H. Graßl,
D. Dommenget, J. Jones, and A. Tompkins for their valuable scientific support. We
thank N. Noreiks for help on graphic representation. Glacier mass balance data were
obtained from the World Glacier Monitoring Service (WGMS), the ECMWF
provided meteorological reanalyses, and the Swedish Meteorological and
Hydrological Institute (SMHI) contributed operational weather station data. The
study was supported by the European Commission under contract
ENV4-CT95-0072. Model simulations were performed at the German Climate
Computing Center (DKRZ) in Hamburg.
Reichert et al.: Midlatitude forcing mechanisms for glacier mass balance 35
REFERENCES
Bacher, A., J. M. Oberhuber, and E. Roeckner, 1998: ENSO dynamics and seasonal cycle in the tropical pacific as simulated by the ECHAM4/OPYC3 coupled gneral circulation model. Clim. Dyn., 14, 431-450.
Barnston, A. G., and R. E. Livezey, 1987: Classification, seasonality and persistence of low-frequency circulation patterns. Mon. Wea. Rev., 115, 1083-1126.
Bengtsson, L., and B. K. Reichert, 2000: Global climate change and natural climate variability - What are their reasons? (in German). Energie und Umwelt - Wo liegen optimale Lösungen? S. Wittig and J. Wolfrum, Eds., Union der deutschen Akademien der Wissenschaften und Heidelberger Akademie der Wissenschaften, Springer Verlag.
Christoph, M., U. Ulbrich, J. M. Oberhuber, E. Roeckner, 1999: The role of ocean dynamics for low-frequency fluctuations of the NAO in a coupled ocean-atmosphere GCM. Max-Planck-Inst. für Meteorol., Rep. 285, 27pp. [Available from MPI für Meteorologie, Bundesstr. 55, 20146 Hamburg, Germany.]
Cubasch, U., H. von Storch, J. Waszkewitz, and E. Zorita, 1996: Estimates of climate change in southern Europe derived from dynamical climate model output. Clim. Res., 7, 129-149.
Gibson, J. K., P. Kållberg, S. Uppala, A. Nomura, A. Hernandez, and E. Serrano, 1997: ERA Description. ECMWF Re-Anal. Proj. Rep. Ser., Rep. 1, 71pp. [Available from ECMWF, Shinfield Park, Reading, Berkshire RG2 9AX, United Kingdom.]
Gregory, J. M., and J. Oerlemans, 1998: Simulated future sea-level rise due to glacier melt based on regionally and seasonally resolved temperature changes. Nature, 391, 474-476.
Grötzner, A., M. Latif, and T. P. Barnett, 1998: A decadal climate cycle in the North Atlantic ocean as simulated by the ECHO coupled GCM. J. Climate, 11, 831-847.
Haeberli, W., 1995: Glacier fluctuations and climate change detection. Geogr. Fis. Dinam. Quat., 18, 191-199.
Haeberli, W., and M. Beniston, 1998: Climate change and its impacts on glaciers and permafrost in the Alps. Ambio, 27, 258-265.
Haeberli, W., R. Frauenfelder, M. Hoelzle, and M. Maisch, 1999: On rates and acceleration trends of global glacier mass changes. Geografiska Annaler, 81A, 585-591.

Reichert et al.: Midlatitude forcing mechanisms for glacier mass balance 36
Hasselmann, K., 1976: Stochastic Climate Models I: Theory. Tellus, 28, 473-485.
Hoelzle, M., and W. Haeberli, 1999: World glacier monitoring service, world glacier inventory. Digital data available from the National Snow and Ice Data Center, [email protected], Univ. of Colorado, Boulder.
Hurrel, J. W., 1995: Decadal trends in the North Atlantic Oscillation: regional temperatures and precipitation. Science, 269, 676-679.
Hurrel, J. W., 1996: Influence of variations in extratropical wintertime teleconnections on Northern Hemisphere temperature. Geoph. Res. Let., 23, 665-668.
Hurrel, J. W., and H. van Loon, 1997: Decadal variations in climate associated with the North Atlantic Oscillation. Clim. Change, 36, 301-326.
Intergovernmental Panel on Climate Change (IPCC), 1990: Climate Change, The IPCC Scientific Assessment. J. T. Houghton and Coauthors, Eds., Cambridge Univ. Press.
International Association of Scientific Hydrology (IASH), 1967, 1973, 1977, 1985, 1988, 1993, 1998: Fluctuations of Glaciers, International Commission of Snow and Ice (ICSI), Volumes I-VII. UNESCO, Paris.
International Association of Scientific Hydrology (IASH)/UNEP/UNESCO, 1999: Glacier Mass Balance Bulletin No. 5. W. Haeberli and Coauthors, Eds., World Glacier Monitoring Service, University and ETH Zurich.
Jones, P. D., T. Jonsson and D. Wheeler, 1997: Extension to the North Atlantic Oscillation using early instrumental pressure observations from Gibraltar and South-West Iceland. Int. J. Climatol., 17, 1433-1450.
Kushnir, Y., 1994: Interdecadal variations in the North Atlantic sea surface temperature and associated atmospheric conditions. J. Climate, 7, 141-157.
Kushnir, Y., and J. M. Wallace, 1989: Low Frequency variability in the northern hemisphere winter: geographical distribution, structure and time-scale dependance. J. Atmos. Sci., 46, 3122-3141.
Latif, M., and T. P. Barnett, 1994: Causes of decadal climate variability over the North Pacific and North America. Science, 266, 634-637.
Nesje, A., Øyvind, L., and S. O. Dahl, 2000: Is the North Atlantic Oscillation reflected in Scandinavian glacier mass balance records? J. Quatern. Science, 15, in press.
Reichert et al.: Midlatitude forcing mechanisms for glacier mass balance 37
Oberhuber, J. M., 1993: Simulation of the Atlantic circulation with a coupled sea ice - mixed layer - isopycnal general circulation model. Part I: Model description. J. Phys. Oceanogr., 22, 808-829.
Oerlemans, J., 1989: A projection of future sea level. Clim. Change, 15, 151-174.
Oerlemans, J., 1992: Climate sensitivity of glaciers in southern Norway: application of an energy-balance model to Nigardsbreen, Helstugubreen and Alfotbreen. J. Glaciol., 38, 223-232.
Oerlemans, J., and J. P. F. Fortuin, 1992: Sensitivity of glaciers and small ice caps to greenhouse warming. Science, 258, 115-117.
Oerlemans, J., and B. K. Reichert, 2000: Relating glacier mass balance to meteorological data by using a seasonal sensitivity characteristic. J. Glaciol., 46, 1-6.
Osborn, T. J., K. R. Briffa, S. F. B. Tett, P. D. Jones and R. M. Trigo, 1999: Evaluation of the North Atlantic Oscillation as simulated by a coupled climate model. Clim. Dyn., 15, 685-702.
Østrem, G., K. D. Selvig, and K. Tandberg, 1988: Atlas over breer i Sør-Norge, Norges Vassdrags- og Energiverk, Hydrologisk Avdeling, Meddelelse, Norway.
Paterson, W. S. B., 1994: The Physics of Glaciers, 3rd ed., Pergamon, New York.
Reichert, B. K., L. Bengtsson, and O. Åkesson, 1999: A statistical modeling approach for the simulation of local paleoclimatic proxy records using general circulation model output. J. Geophys. Res., 104, 19071-19083.
Reichert, B. K., 2000: Quantification of natural climate variability in paleoclimatic proxy data using general circulation models: application to glacier systems, Ph.D. thesis, Max-Planck-Inst. für Meteorol., Examensarbeit 72, 124 pp. [Available from MPI für Meteorologie, Bundesstr. 55, 20146 Hamburg, Germany.]
Roeckner, E., and Coauthours, 1996: The atmospheric general circulation model ECHAM-4: Model description and simulation of present-day climate, Max-Planck-Inst. für Meteorol., Rep. 218, 90pp. [Available from MPI für Meteorologie, Bundesstr. 55, 20146 Hamburg, Germany.]
Roeckner, E., 1997: Climate sensitivity experiments with the MPI/ECHAM4 model coupled to a slab ocean (abstract). Euroclivar Workshop on Cloud Feedbacks and Climate Change, C. A. Senior and J. F. B. Mitchell, Eds, 50pp. [Available from Hadley Cent. for Clim. Predict. and Res., Bracknell, England.]
Roeckner, E., L. Bengtsson, J. Feichter, J. Lelieveld and H. Rodhe, 1999: Transient climate change simulations with a coupled atmosphere-ocean GCM including the tropospheric sulfur cycle. J. Climate, 12, 3004-3032.
Reichert et al.: Midlatitude forcing mechanisms for glacier mass balance 38
Rogers, J. C., 1985: Atmospheric circulation changes with the warming over the Northern North Atlantic in the 1920s. J. Clim. Appl. Meteorol., 24, 1303-1310.
Simmons, A. J., D. M. Burridge, M. Jarraud, C. Girard, and W. Wergen, 1989: The ECMWF medium-range prediction models: development of the numerical formulations and the impact of increased resolution. Meteorol. Atmos. Phys., 40, 28-60.
Stendel, M., and E. Roeckner, 1998: Impacts of horizontal resolution on simulated climate statistics in ECHAM4. Max-Planck-Inst. für Meteorol., Rep. 253. [Available from MPI für Meteorologie, Bundesstr. 55, 20146 Hamburg, Germany.]
Timmermann, A., M. Latif, R. Voss, and A. Grötzner, 1998: North Atlantic interdecadal variability: a coupled air-sea mode. J. Climate, 11, 1906-1931.
van Loon, H., and J. C. Rogers, 1978: The seesaw in winter temperatures between Greenland and Northern Europe. Part I, General description. Mon. Wea. Rev., 106, 296-310.
Visbeck, M., and Coauthors, 1998: Atlantic climate variability experiment prospectus. Proceedings, Workshop Dallas, February 1998 and Workshop Florence, May 1998, Lamont-Doherty Earth Observatory of Columbia Univ., New York, 49pp.
Walker, G. T., and E. W. Bliss, 1932: World weather V. Mem. R. Meteorol. Soc., 4, 53-84.
Wallace, J. M., and D. S. Gutzler, 1981: Teleconnections in the geopotential height field during the northern hemisphere winter. Mon. Wea. Rev., 109, 784-812.
Wigley, T. M. L., and S. C. B. Raper, 1993: Future changes in global mean temperature and sea level. Climate and sea level change: observations, projections and implications, R. A. Warrick, E. M. Barrow, and T. M. L. Wigley, Eds., Cambridge University Press, 111-133.
Reichert et al.: Midlatitude forcing mechanisms for glacier mass balance 39
0 4000Height in m
8˚
8˚
9˚
9˚
10˚
10˚
45˚ 45˚
46˚ 46˚
47˚ 47˚
48˚ 48˚
01 Torino
02 Milano/Linate
03 Milano/Malpensa
04 Pian Rosa05 Lugano
06 Locarno/Monti 07 Locarno/Magadino
08 Guetsch
09 Vaduz
10 Wynau 11 Saentis
12 Zurich
13 Laegern14 Zurich-Kloten
16 Konstanz
18 Bergamo
19 Bisbino
20 Cimetta
21 Jungfrau
22 Feldkirch
23 Bregenz
24 Piotta
25 Disentis
26 Altdorf 27 Chur-Ems
28 Stabio
29 San Bernardino
30 Interlaken
31 Saint Gallen
Rhonegletscher
FIG. 1. Location of Rhonegletscher (46º37'N, 8º24'E) and operational weather stations used for statistical downscaling. Local temperature and precipitation are simulated from GCM output on the basis of daily large-scale predictors obtained from ECMWF reanalyses and daily station data in the vicinity of the glacier.
Reichert et al.: Midlatitude forcing mechanisms for glacier mass balance 40
J F M A M J J A S O N DMonth
40
60
80
100
120
140
160
Precip. (mm/mo) 1979-1993
Direct Reanalyses Observed DataStatistical Simulation
r=0.82
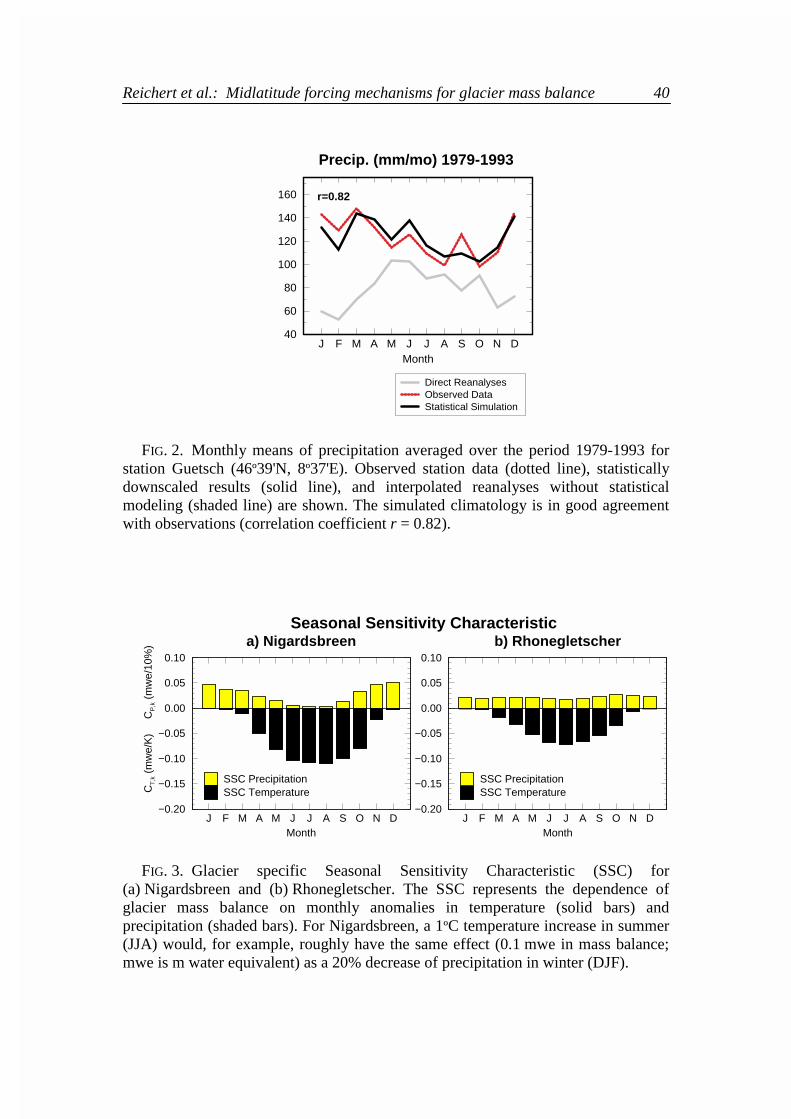
FIG. 2. Monthly means of precipitation averaged over the period 1979-1993 for station Guetsch (46º39'N, 8º37'E). Observed station data (dotted line), statistically downscaled results (solid line), and interpolated reanalyses without statistical modeling (shaded line) are shown. The simulated climatology is in good agreement with observations (correlation coefficient r = 0.82).
J F M A M J J A S O N DMonth
−0.20
−0.15
−0.10
−0.05
0.00
0.05
0.10
CT
,k (
mw
e/K
)
CP
,k (
mw
e/10
%)
Seasonal Sensitivity Characteristica) Nigardsbreen
SSC Precipitation SSC Temperature SSC Temperature
J F M A M J J A S O N DMonth
−0.20
−0.15
−0.10
−0.05
0.00
0.05
0.10
b) Rhonegletscher
SSC Precipitation
FIG. 3. Glacier specific Seasonal Sensitivity Characteristic (SSC) for (a) Nigardsbreen and (b) Rhonegletscher. The SSC represents the dependence of glacier mass balance on monthly anomalies in temperature (solid bars) and precipitation (shaded bars). For Nigardsbreen, a 1ºC temperature increase in summer (JJA) would, for example, roughly have the same effect (0.1 mwe in mass balance; mwe is m water equivalent) as a 20% decrease of precipitation in winter (DJF).
Reichert et al.: Midlatitude forcing mechanisms for glacier mass balance 41
1980 1982 1984 1986 1988 1990 1992Year
−2.0
−1.0
0.0
1.0
2.0
3.0
4.0
Mas
s B
alan
ce (
mw
e) Mass Balance Simulated Using Reanalyses
a) Nigardsbreen
Simulated +− 1σ (8 Stations)Simulated +− 2σ (8 Stations)Simulated Station VangsnesObserved Massbalance (NVA)
1980 1982 1984 1986 1988 1990 1992Year
−2.0
−1.0
0.0
1.0
2.0
b) Rhonegletscher
Simulated +− 1σ (8 Stations)Simulated +− 2σ (8 Stations)Simulated Station Guetsch
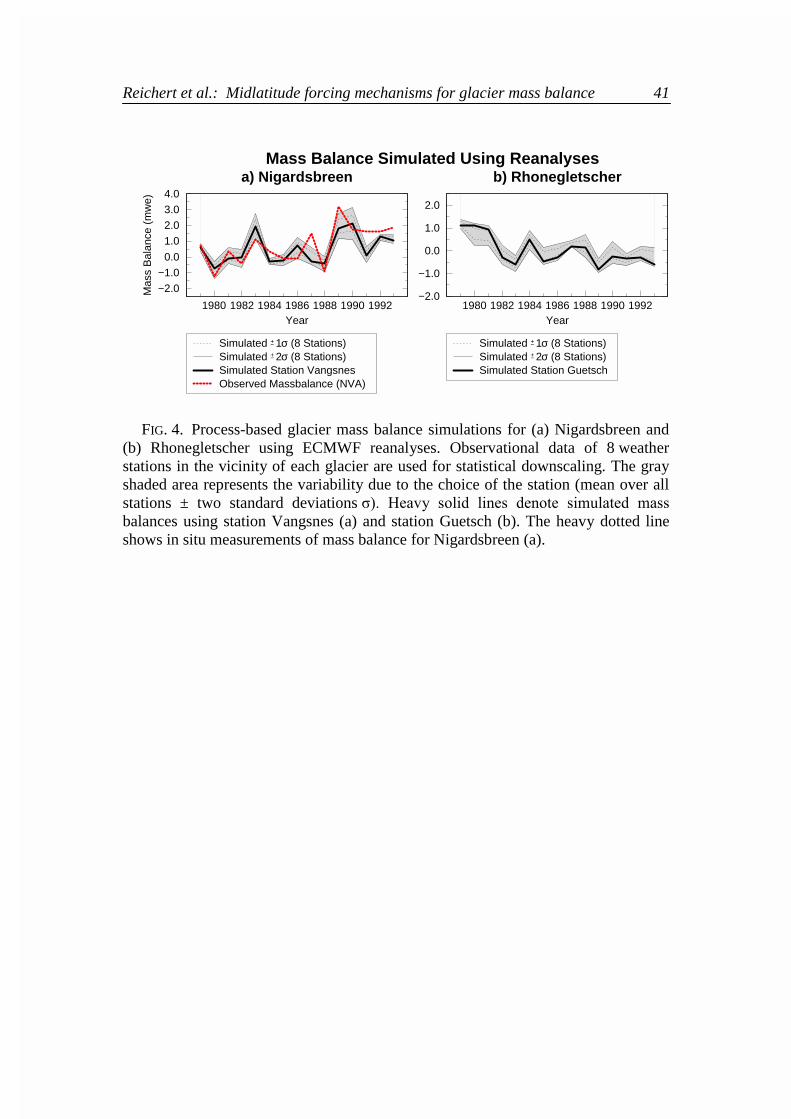
FIG. 4. Process-based glacier mass balance simulations for (a) Nigardsbreen and (b) Rhonegletscher using ECMWF reanalyses. Observational data of 8 weather stations in the vicinity of each glacier are used for statistical downscaling. The gray shaded area represents the variability due to the choice of the station (mean over all stations ± two standard deviations ���� ���� � ���� ����� �� �� ��������� �����
balances using station Vangsnes (a) and station Guetsch (b). The heavy dotted line shows in situ measurements of mass balance for Nigardsbreen (a).
Reichert et al.: Midlatitude forcing mechanisms for glacier mass balance 42
0 100 200 300 400 500 600(Model) Year
−2.0
−1.0
0.0
+1.0
−1.0
0.0
+1.0
+2.0
Mas
s B
alan
ce (
mw
e)
b) Simulated Mass Balance Rhonegletscher
annual mass balance10 year lowpass filtered
ECHAM4/MLO
ECHAM4/OPYC
0 100 200 300 400 500 600(Model) Year
−2.0
−1.0
0.0
+1.0
−1.0
0.0
+1.0
+2.0
Mas
s B
alan
ce (
mw
e)a) Simulated Mass Balance Nigardsbreen
annual mass balance10 year lowpass filtered
Observed
ECHAM4/MLO
ECHAM4/OPYC
1962−1998
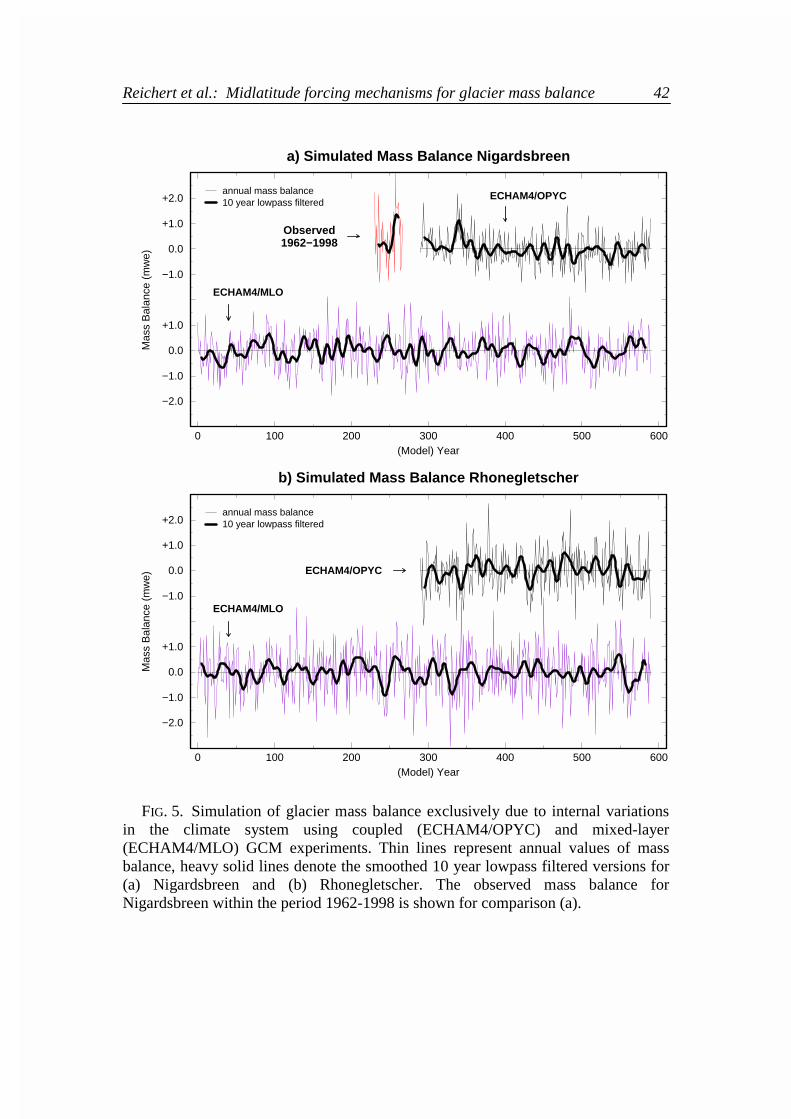
FIG. 5. Simulation of glacier mass balance exclusively due to internal variations in the climate system using coupled (ECHAM4/OPYC) and mixed-layer (ECHAM4/MLO) GCM experiments. Thin lines represent annual values of mass balance, heavy solid lines denote the smoothed 10 year lowpass filtered versions for (a) Nigardsbreen and (b) Rhonegletscher. The observed mass balance for Nigardsbreen within the period 1962-1998 is shown for comparison (a).
Reichert et al.: Midlatitude forcing mechanisms for glacier mass balance 43
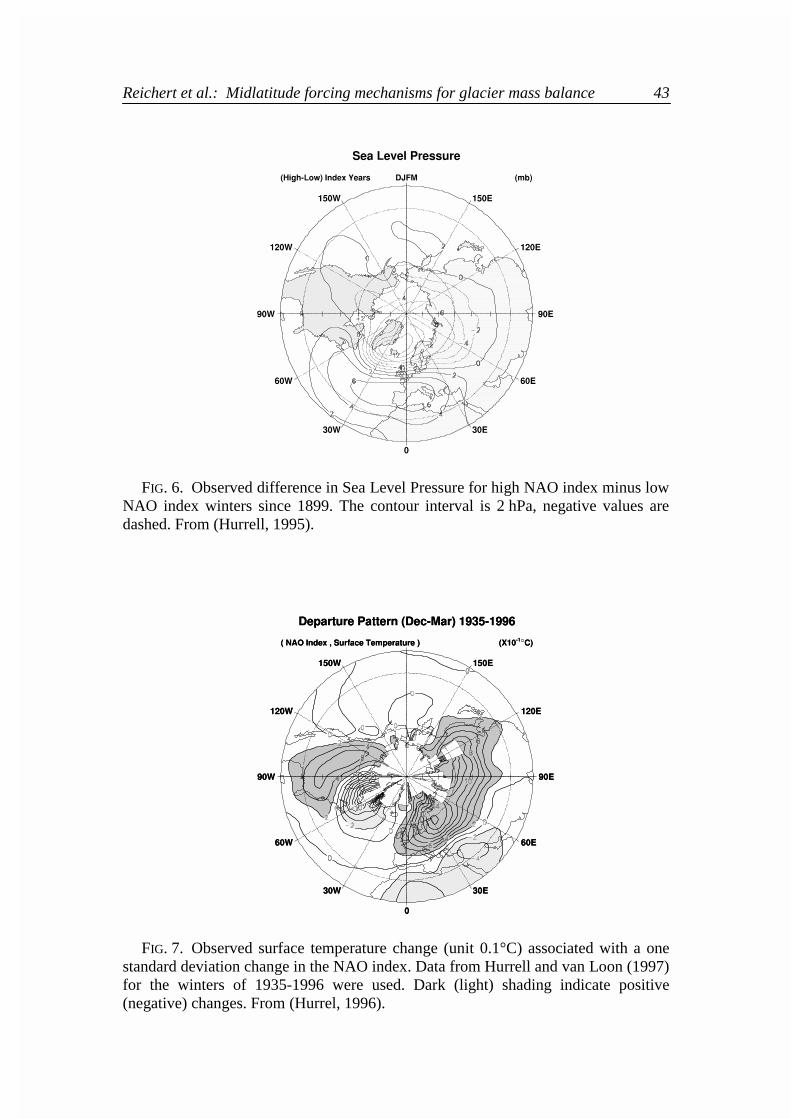
FIG. 6. Observed difference in Sea Level Pressure for high NAO index minus low NAO index winters since 1899. The contour interval is 2 hPa, negative values are dashed. From (Hurrell, 1995).
FIG. 7. Observed surface temperature change (unit 0.1°C) associated with a one standard deviation change in the NAO index. Data from Hurrell and van Loon (1997) for the winters of 1935-1996 were used. Dark (light) shading indicate positive (negative) changes. From (Hurrel, 1996).

Reichert et al.: Midlatitude forcing mechanisms for glacier mass balance 44
FIG. 8. Precipitation anomalies associated with the NAO. Evaporation minus precipitation is plotted for high NAO index minus normal or low NAO index winters, computed as a residual of the atmospheric moisture budget using ECMWF global analyses. From (Hurrell, 1995).
Reichert et al.: Midlatitude forcing mechanisms for glacier mass balance 45
0 50 100 150 200 250 300Year
−2.5
−2.0
−1.5
−1.0
−0.5
0.0
0.5
1.0
1.5
2.0
2.5
Inde
x/2
and
Mas
s B
alan
ce (
mw
e)
b) Rhonegletscher, Coupled GCM Control Run
Simulated mass balance Nigardsbr./Rhonegl. NAO index from GCM control run10 year lowpass filtered mass balance10 year lowpass filtered NAO index
0 50 100 150 200 250 300Year
−2.5
−2.0
−1.5
−1.0
−0.5
0.0
0.5
1.0
1.5
2.0
2.5
Inde
x/2
and
Mas
s B
alan
ce (
mw
e)
a) Nigardsbreen, Coupled GCM Control Run
Correlation r=0.55
Correlation r=−0.64
NAO Index and Mass Balance Nigardsbreen/Rhonegletscher
FIG. 9. NAO index (thin solid line) along with glacier mass balance of (a) Nigardsbreen and (b) Rhonegletscher (thin dotted line) as simulated by the coupled (ECHAM4/OPYC) GCM experiment. The figure illustrates the strong link between the North Atlantic Oscillation and glacier mass balance fluctuations, the correlation coefficients r for the 10 year lowpass filtered time series (heavy lines) are shown in the top left corner of each graph.

Reichert et al.: Midlatitude forcing mechanisms for glacier mass balance 46
0 50 100 150 200 250 300Year
−1.2
−1.0
−0.8
−0.6
−0.4
−0.2
0.0
0.2
0.4
0.6
0.8
1.0
1.2
Inde
x/2
and
Mas
s B
alan
ce (
mw
e)
b) Rhonegletscher, Coupled GCM Control Run
BP (simulated mass balance due to precip. only) BT (simulated mass balance due to temp. only)NAO index (10 year lowpass filtered)
r (BT and NAO) = −0.17r (BP and NAO) = −0.65
r (BP+BT and NAO) =−0.64
0 50 100 150 200 250 300Year
−1.2
−1.0
−0.8
−0.6
−0.4
−0.2
0.0
0.2
0.4
0.6
0.8
1.0
1.2
Inde
x/2
and
Mas
s B
alan
ce (
mw
e)
a) Nigardsbreen, Coupled GCM Control Run
r (BT and NAO) =−0.20r (BP and NAO) = 0.75
r (BP+BT and NAO) = 0.55
Impact of Temperature and Precipitation on Mass Balance
FIG. 10. Individual impact of temperature and precipitation on glacier mass balance for (a) Nigardsbreen and (b) Rhonegletscher as simulated by the coupled GCM (ECHAM4/OPYC). 10 year lowpass filtered mass balance BP simulated using exclusively precipitation (shaded dashed lines), the mass balance BT exclusively due to temperature (solid dashed lines), and the NAO index (solid lines) are presented. Correlation coefficients between the NAO index on one hand and BP, BT, and BP + BT (resulting total mass balance as in Figure 9) respectively on the other hand are shown in the top right corner of each graph.
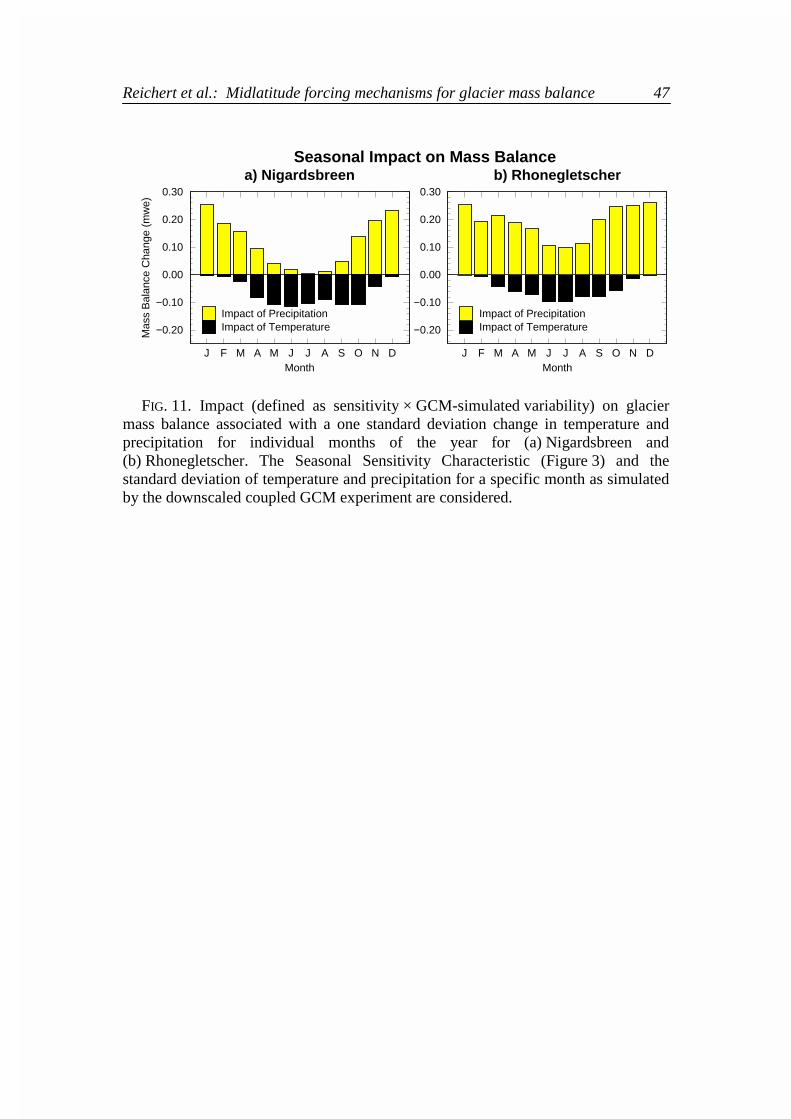
Reichert et al.: Midlatitude forcing mechanisms for glacier mass balance 47
J F M A M J J A S O N DMonth
−0.20
−0.10
0.00
0.10
0.20
0.30
Mas
s B
alan
ce C
hang
e (m
we)
Seasonal Impact on Mass Balancea) Nigardsbreen
Impact of Precipitation Impact of Temperature Impact of Temperature
J F M A M J J A S O N DMonth
−0.20
−0.10
0.00
0.10
0.20
0.30
b) Rhonegletscher
Impact of Precipitation
FIG. 11. Impact (defined as sensitivity × GCM-simulated variability) on glacier mass balance associated with a one standard deviation change in temperature and precipitation for individual months of the year for (a) Nigardsbreen and (b) Rhonegletscher. The Seasonal Sensitivity Characteristic (Figure 3) and the standard deviation of temperature and precipitation for a specific month as simulated by the downscaled coupled GCM experiment are considered.
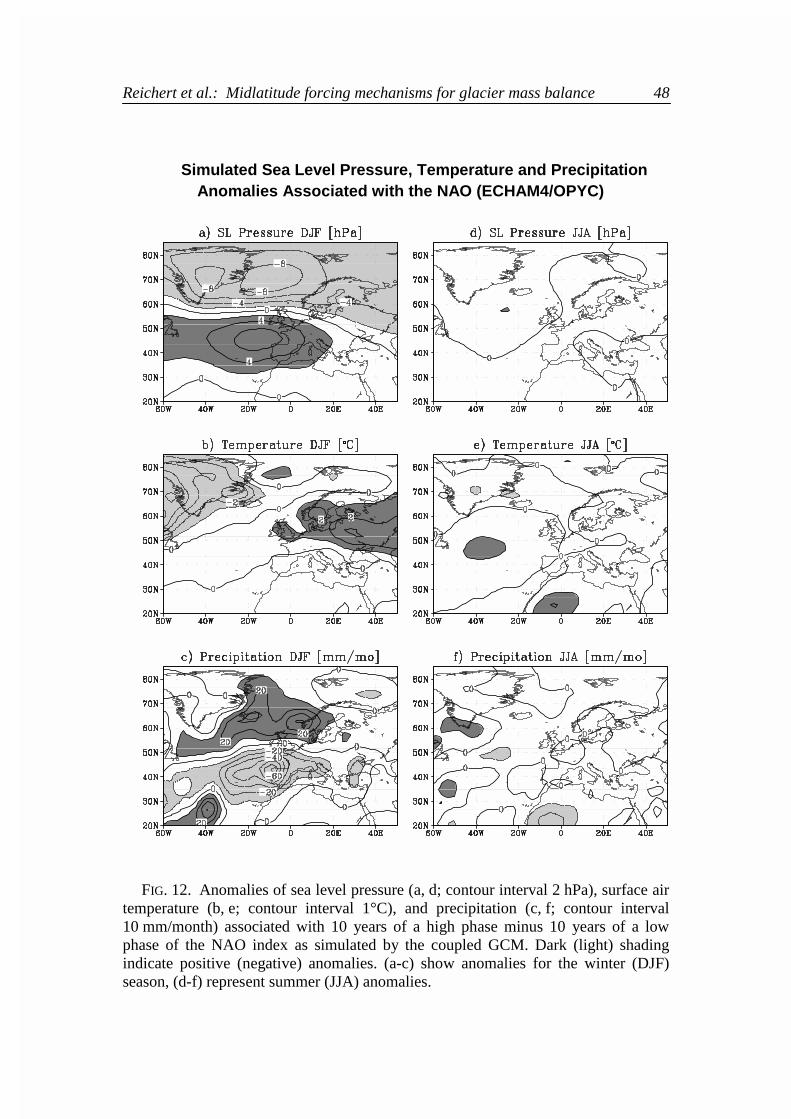
Reichert et al.: Midlatitude forcing mechanisms for glacier mass balance 48
Simulated Sea Level Pressure, Temperature and Precipitation Anomalies Associated with the NAO (ECHAM4/OPYC)
FIG. 12. Anomalies of sea level pressure (a, d; contour interval 2 hPa), surface air temperature (b, e; contour interval 1°C), and precipitation (c, f; contour interval 10 mm/month) associated with 10 years of a high phase minus 10 years of a low phase of the NAO index as simulated by the coupled GCM. Dark (light) shading indicate positive (negative) anomalies. (a-c) show anomalies for the winter (DJF) season, (d-f) represent summer (JJA) anomalies.
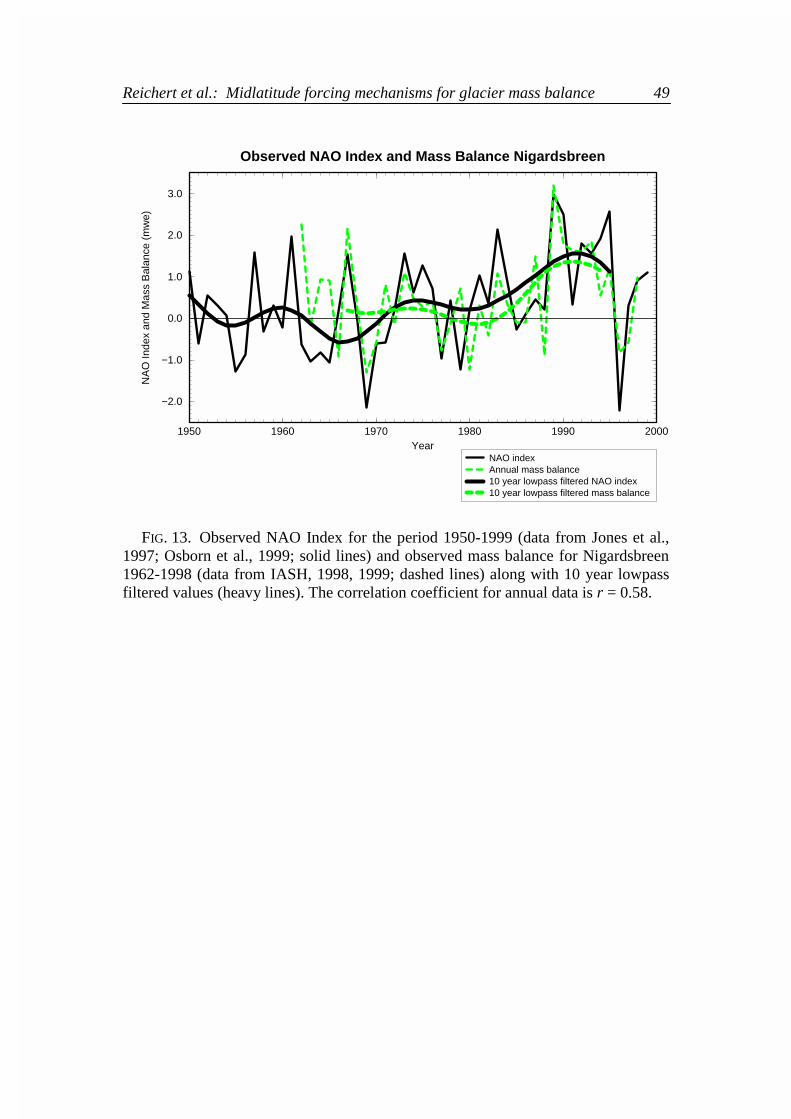
Reichert et al.: Midlatitude forcing mechanisms for glacier mass balance 49
1950 1960 1970 1980 1990 2000Year
−2.0
−1.0
0.0
1.0
2.0
3.0
NA
O In
dex
and
Mas
s B
alan
ce (
mw
e)Observed NAO Index and Mass Balance Nigardsbreen
NAO indexAnnual mass balance10 year lowpass filtered NAO index10 year lowpass filtered mass balance
FIG. 13. Observed NAO Index for the period 1950-1999 (data from Jones et al., 1997; Osborn et al., 1999; solid lines) and observed mass balance for Nigardsbreen 1962-1998 (data from IASH, 1998, 1999; dashed lines) along with 10 year lowpass filtered values (heavy lines). The correlation coefficient for annual data is r = 0.58.

Reichert et al.: Midlatitude forcing mechanisms for glacier mass balance 50
MPI-Report-Reference *Reprinted in
Report 1-263
Please order the reference list from MPI for Meteorology, Hamburg
Report No. 264 July 1998
How representative are recent temperature trends? Martin Stendel, John R. Christy, Lennart Bengtsson * Journal of Climate, 1998 (submitted)
Report No. 265 July 1998
MPI-Workshop on conservative transport schemes 2-3 June 1997 Bennert Machenhauer
Report No.266 July 1998
Transient climate change simulations with a coupled atmosphere-ocean GCM including the tropospheric sulfur cycle E. Roeckner, L. Bengtsson, J. Feichter, J. Lelieveld, H. Rodhe * Journal of Climate, 1998 (submitted)
Report No. 267 July 1998
On the Predictability of Decadal Changes in the North Pacific Stephan Venzke, Matthias Münnich, Mojib Latif * Climate Dynamics, 1998 (submitted)
Report No. 268 July 1998
A New Theory for Tropical Instability Waves Matthias Münnich, Mojib Latif * Science, 1998 (submitted)
Report No. 269 July 1998
Volcanic Plume Simulation on Large Scales Josef M. Oberhuber, Michael Herzog, Hans-F. Graf, Karsten Schwanke * Journal of Volcanology and Geothermal Research, 1998 (accepted)
Report No. 270 July 1998
The Effect of Phase Changes of Water on the Development of Volcanic Plumes Michael Herzog, Hans-F. Graf, Christiane Textor, Josef M. Oberhuber * Journal of Volcanology and Geothermal Research, 1998 (accepted)
Report No. 271 August 1998
Portrayal of the Indian summer monsoon in the land-ocean-atmosphere system of a coupled GCM Lydia Dümenil
Report No. 272 August 1998
Detecting the Nonstationary Response of ENSO to Greenhouse Warming Axel Timmmermann * Journal of Atmospheric Sciences, 1998 (submitted)
Report No. 273 August 1998
Decadal Coupling of the Northern Mid-Latitude and Equatorial Pacific Ocean via the Thermocline ? Niklas Schneider, Stephan Venzke, Arthur J. Miller, David W. Pierce, Timothy P. Barnett, Clara Deser, Mojib Latif * Nature, 1998 (submitted)
Report No. 274 August 1998
A Statistical-Dynamical Modeling Approach for the Simulation of Local Paleo Proxy Records using GCM Output Bernhard K. Reichert, Lennart Bengtsson, Ove Åkesson * Journal of Geophysical Research, 104, 19071-19083, 1999
Report No. 275 October 1998
Validation and Analysis of Regional Present-day Climate and Climate Change Simulations over Europe Bennert Machenhauer, Martin Windelband, Michael Botzet, Jens Hesselbjerg-Christensen, Michel Déqué, Richard G. Jones, Paolo Michele Ruti, Guido Visconti
Report No. 276 September 1998
The Role of Indian Ocean Sea Surface Temperature in Forcing East African Climate Anomalies Mojib Latif, Dietmar Dommenget, Mihai Dima * Journal of Climate, 1998 (submitted)
MPI-Report-Reference *Reprinted in
Report No. 277 September 1998
Interannual to Decadal Variability in the Tropical Atlantic Dietmar Dommenget, Mojib Latif * Journal of Climate, 1998 (submitted)
Report No. 278 October 1998
Application of a grid-scale lateral discharge model in the BALTEX region Stefan Hagemann, Lydia Dümenil * Nordic Hydrology, 30 (3), 209-230, 2000
Report No. 279 October 1998
Cyclostationary Circulation Estimation with a Global Ocean Assimilation System Detlev Müller, Ralf Giering, Uwe Mikolajewicz, Ernst Maier-Reimer * Journal of Geophysical Research, 1998 (submitted)
Report No. 280 October 1998
A coarse grid three dimensional global inverse model of the atmospheric transport 1. Adjoint Model and Jacobian Matrix 2. Inversion of the transport of CO2 in the 1980s Thomas Kaminski, Martin Heimann, Ralf Giering * Journal of Geophysical Research, 1998 (submitted)
Report No. 281 November 1998
Paleonutrient Data Analysis of the Glacial Atlantic using an Adjoint Ocean General Circulation Model Arne M. E. Winguth, David Archer, Ernst Maier-Reimer, Uwe Mikolajewicz
Report No. 282 November 1998
The Effect of Environmental Conditions on Volcanic Plume Rise Hans-F. Graf, Michael Herzog, Josef M. Oberhuber, Christiane Textor * Journal of Geophysical Research, 1998 (submitted)
Report No. 283 December 1998
Model Simulations of the Changing Distribution of Ozone and its Radiative Forcing of Climate: Past, Present and Future Geert-Jan Roelofs, Jos Lelieveld, Johann Feichter
Report No. 284 December 1998
Predicting the Number of Cloud Droplets in the ECHAM GCM Ulrike Lohmann, Johann Feichter, Catherine C. Chuang, Joyce E. Penner * Journal of Geophysical Research - Atmospheres, 1998 (accepted)
Report No. 285 December 1998
The Role of Ocean Dynamics for Low-Frequency Fluctuations of the NAO in a Coupled Ocean-Atmosphere GCM Michael Christoph, Uwe Ulbrich, Josef M. Oberhuber, Erich Roeckner
Report No. 286 January 1999
Formation of nitrous acid: Parameterisation and comparison with observations Gerhard Lammel
Report No. 287 Februar 1999
Natürliche Senken und Quellen des atmosphärischen Kohlendioxids: Stand des Wissens und Optionen des Handelns Martin Heimann, Christine Weber, Jan C. Duinker, Arne Körtzinger, Ludger Mintrop, Nina Buchmann, Ernst-Detlef Schulze, Michaela Hein, Alberte Bondeau, Wolfgang Cramer, Marcus Lindner, Gerd Esser
Report No. 288 March 1999
Large-eddy simulation of a nocturnal stratocumulus-topped marine atmospheric boundary layer: An uncertainty analysis Andreas Chlond, Andreas Wolkau Boundary-Layer Meteorology, 1999 (submitted)
Report No. 289 March 1999
Deriviation of global GCM boundary conditions from 1 km land use satellite data Stefan Hagemann, Michael Botzet, Lydia Dümenil, Bennert Machenhauer
Report No. 290 June 1999
A nonlinear impulse response model of the coupled carbon cycle-ocean-atmosphere climate system Georg Hooss, Reinhard Voss, Klaus Hasselmann, Ernst Maier-Reimer, Fortunat Joos

MPI-Report-Reference *Reprinted in
Report No. 291 June 1999
Rapid algorithms for plane-parallel radiative transfer calculations Vassili Prigarin
Report No. 292 June 1999
Oceanic Control of Decadal North Atlantic Sea Level Pressure Variability in Winter Mojib Latif, Klaus Arpe, Erich Roeckner * Geophysical Research Letters, 1999 (submitted)
Report No. 293 July 1999
A process-based, climate-sensitive model to derive methane emissions from natural wetlands: Application to 5 wetland sites, sensitivity to model parameters and climate Bernadette P. Walter, Martin Heimann * Global Biogeochemical Cycles, 1999 (submitted)
Report No. 294 August 1999
Possible Changes of δ18O in Precipitation Caused by a Meltwater Event in the North Atlantic Martin Werner, Uwe Mikolajewicz, Georg Hoffmann, Martin Heimann * Journal of Geophysical Research - Atmospheres, 1999 (in press)
Report No. 295 August 1999
Borehole versus Isotope Temperatures on Greenland: Seasonality Does Matter Martin Werner, Uwe Mikolajewicz, Martin Heimann, Georg Hoffmann * Geophysical Research Letters, 1999 (in press)
Report No. 296 August 1999
Numerical Modelling of Regional Scale Transport and Photochemistry directly together with Meteorological Processes Bärbel Langmann * Atmospheric Environment, 1999 (submitted)
Report No. 297 August 1999
The impact of two different land-surface coupling techniques in a single column version of the ECHAM4 atmospheric model Jan-Peter Schulz, Lydia Dümenil, Jan Polcher * Journal of Applied Meteorology, 1999 (submitted)
Report No. 298 September 1999
Long-term climate changes due to increased CO2 concentration in the coupled atmosphere-ocean general circulation model ECHAM3/LSG Reinhard Voss, Uwe Mikolajewicz * Climate Dynamics, 1999 (submitted)
Report No. 299 October 1999
Tropical Stabilisation of the Thermohaline Circulation in a Greenhouse Warming Simulation Mojib Latif, Erich Roeckner * Journal of Climate, 1999 (submitted)
Report No. 300 October 1999
Impact of Global Warming on the Asian Winter Monsoon in a Coupled GCM Zeng-Zhen Hu, Lennart Bengtsson, Klaus Arpe * Journal of Geophysical Research-Atmosphere, 105, 4607-4624, 2000
Report No. 301 December 1999
Impacts of Deforestation and Afforestation in the Mediterranean Region as Simulated by the MPI Atmospheric GCM Lydia Dümenil Gates, Stefan Ließ
Report No. 302 December 1999
Dynamical and Cloud-Radiation Feedbacks in El Niño and Greenhouse Warming Fei-Fei Jin, Zeng-Zhen Hu, Mojib Latif, Lennart Bengtsson, Erich Roeckner
Report No. 303 December 1999
The leading variability mode of the coupled troposphere-stratosphere winter circulation in different climate regimes Judith Perlwitz, Hans-F. Graf, Reinhard Voss * Journal of Geophysical Research, 105, 6915-6926, 2000
MPI-Report-Reference *Reprinted in
Report No. 304 January 2000
Generation of SST anomalies in the midlatitudes Dietmar Dommenget, Mojib Latif * Journal of Climate, 1999 (submitted)
Report No. 305 June 2000
Tropical Pacific/Atlantic Ocean Interactions at Multi-Decadal Time Scales Mojib Latif * Geophysical Research Letters, 2000 (submitted)
Report No. 306 June 2000
On the Interpretation of Climate Change in the Tropical Pacific Mojib Latif * Journal of Climate, 2000 (submitted)
Report No. 307 June 2000
Observed historical discharge data from major rivers for climate model validation Lydia Dümenil Gates, Stefan Hagemann, Claudia Golz
Report No. 308 July 2000
Atmospheric Correction of Colour Images of Case I Waters - a Review of Case II Waters - a Review D. Pozdnyakov, S. Bakan, H. Grassl * Remote Sensing of Environment, 2000 (submitted)
Report No. 309 August 2000
A Cautionary Note on the Interpretation of EOFs Dietmar Dommenget, Mojib Latif * Journal of Climate, 2000 (submitted)
Report No. 310 September 2000
Midlatitude Forcing Mechanisms for Glacier Mass Balance Investigated Using General Circulation Models Bernhard K. Reichert, Lennart Bengtsson, Johannes Oerlemans * Journal of Climate, 2000 (submitted)


ISSN 0937-1060