MidIT Salary Survey · • Hiring is expected to resume in the late 3 rd quarter of this year –...
31
Transcript of MidIT Salary Survey · • Hiring is expected to resume in the late 3 rd quarter of this year –...

Victor
Sample

IT Salary Survey Mid-Year 2020
1 © 2020 Janco Associates, Inc. – ALL RIGHTS RESERVED – https://www.e-janco.com & http://www.eJobdescription.com
Table of Contents
METHODOLOGY ..................................................................................................................................................... 3 SAMPLE STATISTICS ............................................................................................................................................... 5 STUDY SUMMARY .................................................................................................................................................. 6
CIO Tenure ......................................................................................................................................................... 7 Median Age of IT Pros ........................................................................................................................................ 8 Fringe Benefits Summary ................................................................................................................................... 9 Compensation and IT Job Market Trends ......................................................................................................... 10 BLS IT Compensation Analysis .......................................................................................................................... 11 Mean Compensation IT Executives .................................................................................................................. 12
Large Enterprises – Executive Salaries ................................................................................................................ 12 Mid-Sized Enterprises – Executive Salaries ......................................................................................................... 13
US Federal Government Compensation Cap .................................................................................................... 14 Highly Paid CIOs ............................................................................................................................................... 15
NATIONAL DATA – U.S. ........................................................................................................................................ 16 National Unemployment Rate ......................................................................................................................... 16 Labor Participation Rate .................................................................................................................................. 17 IT Job Market Analysis ..................................................................................................................................... 18 IT Job Market Size 2019 versus 2020 ................................................................................................................ 18
DEMAND FOR IT PROFESSIONALS ........................................................................................................................ 19 JOB DESCRIPTIONS............................................................................................................................................... 20
IT Job Description HandiGuide ......................................................................................................................... 30 Job Families ..................................................................................................................................................... 31
IT Job Family Classification ................................................................................................................................. 31 Job Description Structure ................................................................................................................................. 32
SUMMARY SALARY SURVEY DATA ....................................................................................................................... 35 STATISTICS PRESENTED BY CITY ........................................................................................................................... 45
Large Enterprises ............................................................................................................................................. 47 Mid-Size Enterprises ........................................................................................................................................ 70
NATIONAL IT SALARY ANALYSIS BY POSITION ...................................................................................................... 93
Not available in the Individual City versions of the Salary Survey
Executive Management Positions .................................................................................................................... 95 Middle Management Positions ...................................................................................................................... 104 Staff Positions ................................................................................................................................................ 137

IT Salary Survey Mid-Year 2020
3 © 2020 Janco Associates, Inc. – ALL RIGHTS RESERVED – https://www.e-janco.com & http://www.eJobdescription.com
Methodology
The Compensation Study utilized data from Janco Associates Compensation Database for Information Technology professionals. This database contains compensation information on many firms across the United States and Canada. The database is classified by normalized job position, considering similarities in job function and responsibilities, rather than merely job title. From this database, compensation benchmark ranges are established for each normalized job position. In analyzing the study data, the upper and lower quartiles are eliminated to determine Janco’s Benchmark Ranges. The benchmark ranges are then used to assess the alignment of a company’s actual compensation to the marketplace for each job function. The results can be assessed using the following guidelines: BELOW BENCHMARK RANGE: Highly impacted by forces of the marketplace. WITHIN BENCHMARK RANGE: Subject to the normal forces of the marketplace for similar job function(s) and responsibilities. ABOVE BENCHMARK RANGE: Not subject to the forces of the marketplace. The Janco Benchmark 1 represents our assessment of the compensation level required for organizations to remain competitive and minimize the risk of losing employees to other organizations. Reviews were conducted from the standpoint of a comparison of base salary and, when appropriate, from the additional standpoint of total compensation. Total compensation is determined by adding the budgetary bonus amounts and an equivalent cash value for “above-standard” compensation to an individual’s base salary. The Compensation Study data was divided into two categories. Large companies are companies whose gross revenues are equal to or greater than $500 MM or more than 1,000 total employees. Mid-sized companies are companies whose gross revenues are less than $500 MM and less than 1,000 employees All salaries are normalized to a national standard, considering the cost of living in the metropolitan areas presented. Note some metro areas may not have enough data points to be statistically accurate to plus or minus 5%. However, all the national numbers are statistically valid for plus or minus 1.2%. The Information Technology Compensation Study was compiled by Janco Associates Inc. (Janco) and eJobDescription.com (a division of Janco Associates) in January 2012. A survey form was sent to a representative number of businesses throughout the United States and Canada in a variety of different industries. Janco’s survey and extensive internet-based polling, allow us to include a substantial number of data points from outside of Janco’s traditional information base. The historical data is generated from prior studies created by Janco and its principals.
1 The Benchmark is typically the top quartile paid to the job position. Based on or analysis that is the amount that an enterprise would have to pay to hire a new top-level performer in that role.

IT Salary Survey Mid-Year 2020
4 © 2020 Janco Associates, Inc. – ALL RIGHTS RESERVED – https://www.e-janco.com & http://www.eJobdescription.com
The survey responses were entered into Janco’s compensation database along with pertinent salary information from other prominent salary surveys that focus on the Information Technology area, as well as normalized data from previous years’ studies. Using all of the available data, the Benchmark Compensation Ranges were determined. The lower and upper quartiles of the survey data were eliminated when determining the Janco Benchmark Compensation Ranges. Individuals whose compensation is below the Janco Benchmark Ranges are subject to the forces of the marketplace and other conditions, which are unique to an individual’s terms of employment or experience level. Individuals whose compensation is above the Benchmark Ranges are the least impacted by market forces. However, because of their seniority, they are likely candidates for more senior IS management positions at other companies if career advancement is perceived to be limited in their present environment. Individuals whose compensation is within the Benchmark Ranges are compensated relative to their specialty and are normally not subject to the forces of the marketplace. The Janco Total Benchmark Compensation Range has been split into three groups; top-level positions, mid-level positions, and staff positions. Total compensation includes estimated bonus amounts, “perks,” and the fair value of supplemental compensation such as additional time off, education cost reimbursements, special business trips, car allowances, stock options, etc. The methodology and classification for a number of positions have changed. If the reader uses this information in conjunction with earlier Janco Studies some positions will not be comparable to those in prior periods. Please refer to the position descriptions in Janco’s
Internet and Information Position Description HandiGuide®
https://www.e-janco.com/Job_Book.htm or the
PREMIUM Edition Job Description Bundle
https://www.e-janco.com/session/add_product.aspx?catalog=21 for the detailed definition of the job content.
Victor
Sample

IT Salary Survey Mid-Year 2020
5 © 2020 Janco Associates, Inc. – ALL RIGHTS RESERVED – https://www.e-janco.com & http://www.eJobdescription.com
Sample Statistics The shutdown due to Covid-19 impacted the total number of organizations and positions that where surveyed The Compensation Database of competitive compensation statistics for the Information Technology Mid-Year 2020 Compensation Study includes the following: LARGE COMPANIES
ORGANIZATIONS RESPONDING
Positions Surveyed: 73 Number of Enterprises: 88 Population Size: 55,232 Mean Salary: $97,696 MID-SIZE COMPANIES
ORGANIZATIONS RESPONDING
Positions Surveyed: 73 Number of Enterprises 253 Population Size: 56,187 Mean Salary: $91,7628 The study includes most positions in a typical IS organization for a mid-size to large-size companies. This update includes data gathered from Janco’s polling, as well as a “survey of surveys” including data from across the United States and Canada 2. INDUSTRY TYPES:
Aerospace Agriculture Distribution Education Executive Search Financial Services Food Services Health Care Government Grocery/Supermarket Insurance Manufacturing Mortgage Banking Publishing Pharmaceutical Software Development Telecommunications Utility
2 All the data for Canada in this survey is shown in Canadian dollars.
IT Salary Survey Mid-Year 2020
6 © 2020 Janco Associates, Inc. – ALL RIGHTS RESERVED – https://www.e-janco.com & http://www.eJobdescription.com
Study Summary
Mean Compensation for all IT Pros for the first two quarters of 2020 is $94,729 up by 0.21% from January – Over 100,000 IT positions were eliminated
Our observations for the Mid-Year 2020 IT Salary Survey are as follow:
• 116,000 IT professionals were laid-off or terminated in April and May due to the Covid-19 shut-down
• In June, the loss of IT jobs was halted • Hiring is expected to resume in the late 3rd quarter of this year – Salaries are expected to
increase at that point • Between January 2020 and June, the total mean compensation for all IT Professionals
increased from $94,535 to $94,729 or 0.21%. • Most of the increases were at the executive management levels • Hiring has all but stopped for all IT positions. • Consultants who augment IT Staff have all but been eliminated • Demand has remained highest for IT professionals who support Work From Home (WFH) and
e-commerce • KPI metrics are the focus of C-Level management to understand and manage WFH employees..
Victor
Sample
IT Salary Survey Mid-Year 2020
7 © 2020 Janco Associates, Inc. – ALL RIGHTS RESERVED – https://www.e-janco.com & http://www.eJobdescription.com
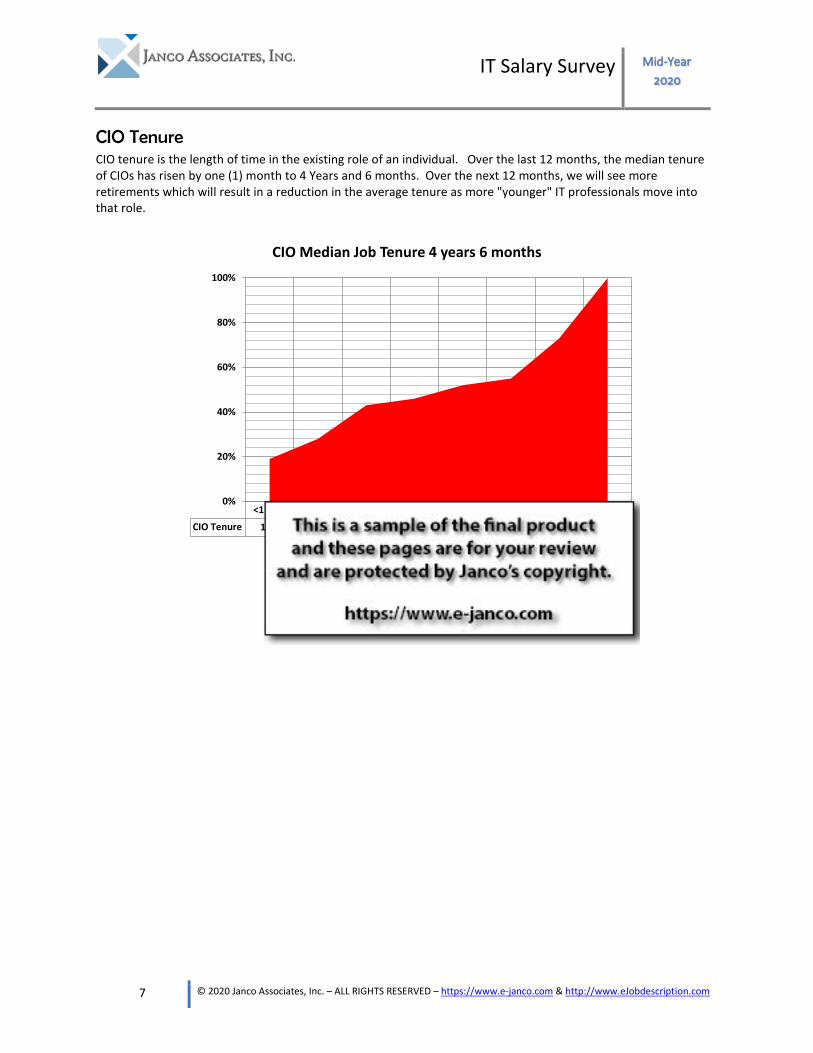
CIO Tenure CIO tenure is the length of time in the existing role of an individual. Over the last 12 months, the median tenure of CIOs has risen by one (1) month to 4 Years and 6 months. Over the next 12 months, we will see more retirements which will result in a reduction in the average tenure as more "younger" IT professionals move into that role.
<1 year <2 years <3 years <4 years <5 years <6 years <7 years >7 years
CIO Tenure 19% 28% 43% 46% 52% 55% 73% 100%
0%
20%
40%
60%
80%
100%
© 2020 Janco Associates, Inc. -- www.e-janco.com
CIO Median Job Tenure 4 years 6 months
Victor
Sample
IT Salary Survey Mid-Year 2020
8 © 2020 Janco Associates, Inc. – ALL RIGHTS RESERVED – https://www.e-janco.com & http://www.eJobdescription.com
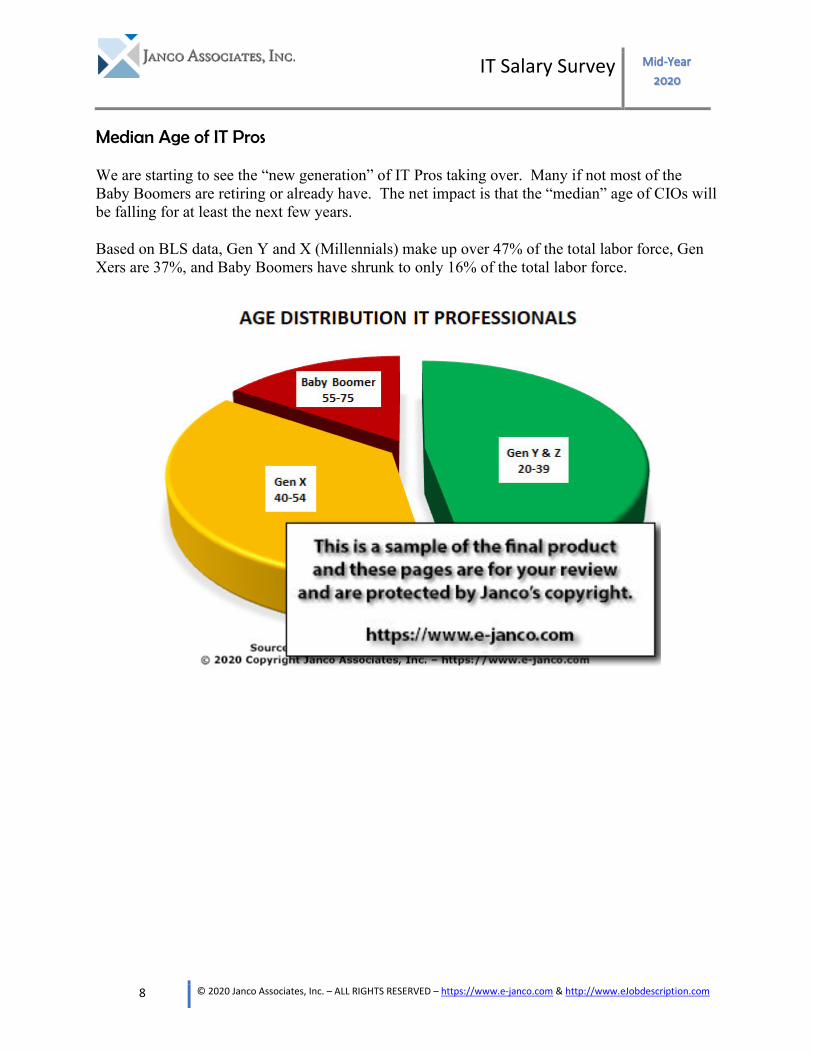
Median Age of IT Pros
We are starting to see the “new generation” of IT Pros taking over. Many if not most of the Baby Boomers are retiring or already have. The net impact is that the “median” age of CIOs will be falling for at least the next few years.
Based on BLS data, Gen Y and X (Millennials) make up over 47% of the total labor force, Gen Xers are 37%, and Baby Boomers have shrunk to only 16% of the total labor force.
Victor
Sample
IT Salary Survey Mid-Year 2020
10 © 2020 Janco Associates, Inc. – ALL RIGHTS RESERVED – https://www.e-janco.com & http://www.eJobdescription.com
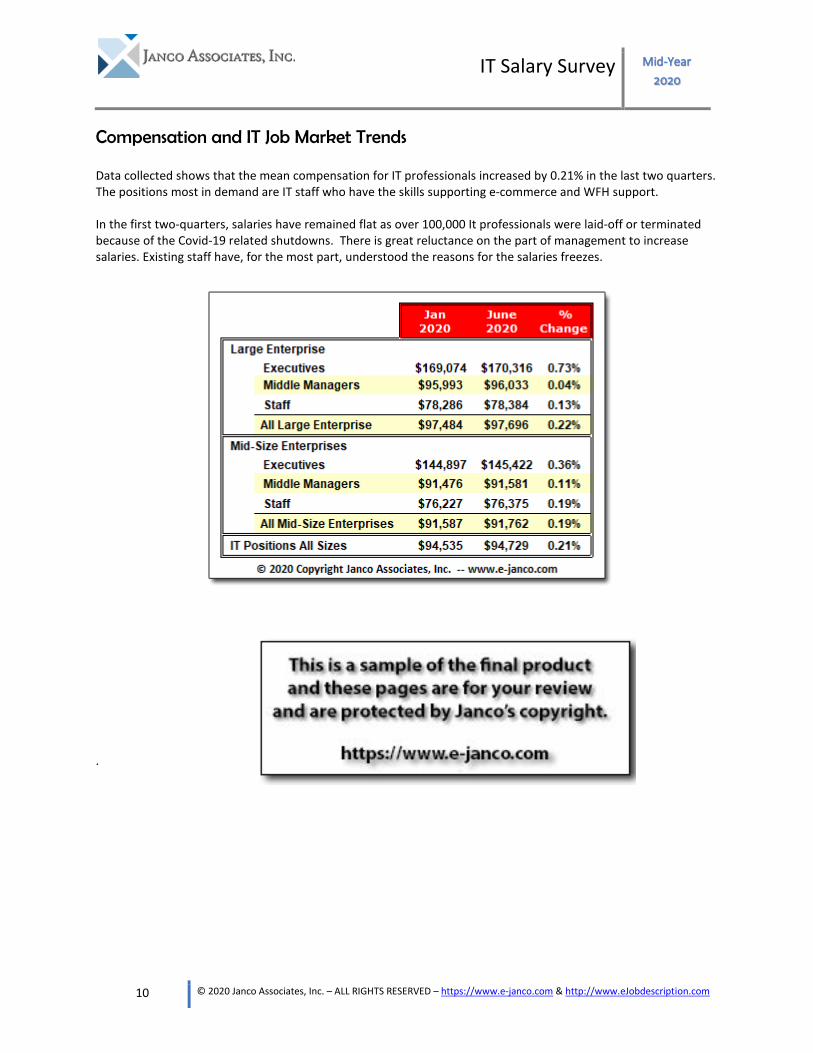
Compensation and IT Job Market Trends
Data collected shows that the mean compensation for IT professionals increased by 0.21% in the last two quarters. The positions most in demand are IT staff who have the skills supporting e-commerce and WFH support. In the first two-quarters, salaries have remained flat as over 100,000 It professionals were laid-off or terminated because of the Covid-19 related shutdowns. There is great reluctance on the part of management to increase salaries. Existing staff have, for the most part, understood the reasons for the salaries freezes.
.
Victor
Sample

IT Salary Survey Mid-Year 2020
11 © 2020 Janco Associates, Inc. – ALL RIGHTS RESERVED – https://www.e-janco.com & http://www.eJobdescription.com
BLS IT Compensation Analysis High-tech industries matter to the U.S. economy because they produce a large share of total output, and from a workforce standpoint, they employ large numbers of skilled workers and provide higher wages for all types of workers. There are various ways that high-tech industries can be defined, and those definitions can have an impact on analyses. In an article, the BLS defined high-tech industries as those having high concentrations of workers in STEM (Science, Technology, Engineering, and Mathematics) occupations.
Title Job Summary Education
Median Pay Ranges January
2020
Computer and Information Research
Scientist
Invents and designs new approaches to computing technology and finds innovative uses for existing technology.
Master's degree
$114,520 to $119,013
Computer Network Architect
Designs and builds data communication networks, including local area networks (LANs), wide area networks (WANs), and Intranets.
Bachelor's degree
$98,996 to $104,650
Computer programmer Writes and tests code that allows computer applications and software programs to function properly.
Bachelor's degree
$82,240 to $93,623
Computer support specialists
Provides help and advice to computer users and organizations.
Associate degree
Optional
$52,810 to $64,897
Computer Systems Analyst
Studies an organization’s current computer systems and procedures, and designs solutions to help the organization operate more efficiently and effectively.
Bachelor's degree
$86,124 to $88,270
Database administrator Uses specialized software to store and organize data, such as financial information and customer shipping records.
Bachelor's degree
$87,020 to $101,960
Information Security Analyst
Plans and carries out security measures to protect an organization’s computer networks and systems.
Bachelor's degree
$95,510 to $99,152
Network and Computer Systems Administrator
Responsible for the day-to-day operation of enterprise networks
Bachelor's degree
$74,957 to $81,100
Software Developer
Some develop the applications that allow people to do specific tasks on a computer or another device. Others develop the underlying systems that run the devices or that control networks.
Bachelor’s degree
$101,813 to $103,560
Web Developer Design and create websites. Associate degree
$67,990 to $73,554
Source BLS and Janco Associates, Inc. – https://www.e-janco.com
Victor
Sample

IT Salary Survey Mid-Year 2020
12 © 2020 Janco Associates, Inc. – ALL RIGHTS RESERVED – https://www.e-janco.com & http://www.eJobdescription.com
Mean Compensation IT Executives Compensation has just reached the levels of where it was in January 2008. We can see the median compensation for IT executives (leaders and staff IT professionals) once reaching the peak of 2008, remains stagnant.
Large Enterprises – Executive Salaries
Compensation for Information Technology executives in large enterprises has not changed much in the first 2 quarters of 2020. It has increased by 0.73%, going from to $169,074 to $170,316. Much of those increases are due to individual and organizational performance bonuses. The total compensation for IT executives is shown in the table below.
Victor
Sample

IT Salary Survey Mid-Year 2020
13 © 2020 Janco Associates, Inc. – ALL RIGHTS RESERVED – https://www.e-janco.com & http://www.eJobdescription.com
Mid-Sized Enterprises – Executive Salaries
Compensation for Information Technology executives in SMB has stalled as a result of Covid-19 shutdown. The total compensation for these individuals has increased in the first two quarters by 0.36%, going from $144,897 to $145,422. The total compensation for those is as shown in the table below.
Victor
Sample

IT Salary Survey Mid-Year 2020
16 © 2020 Janco Associates, Inc. – ALL RIGHTS RESERVED – https://www.e-janco.com & http://www.eJobdescription.com
National Data – U.S.
National Unemployment Rate The national unemployment rate was at a record low of 3.5% before the shutdowns. It then jumped to 14.7% at it peak. before slowly moving down.
To see current data go to https://www.e-janco.com/career/employmentdata.html
Victor
Sample
IT Salary Survey Mid-Year 2020
17 © 2020 Janco Associates, Inc. – ALL RIGHTS RESERVED – https://www.e-janco.com & http://www.eJobdescription.com
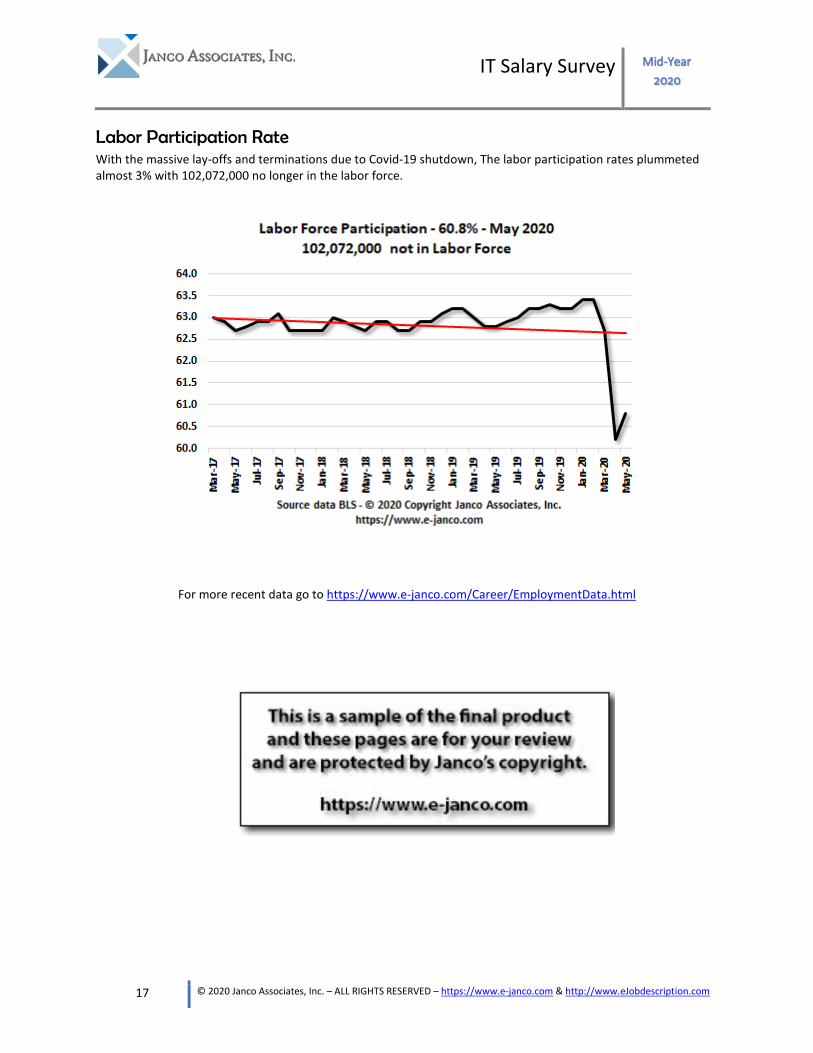
Labor Participation Rate With the massive lay-offs and terminations due to Covid-19 shutdown, The labor participation rates plummeted almost 3% with 102,072,000 no longer in the labor force.
For more recent data go to https://www.e-janco.com/Career/EmploymentData.html
Victor
Sample
IT Salary Survey Mid-Year 2020
18 © 2020 Janco Associates, Inc. – ALL RIGHTS RESERVED – https://www.e-janco.com & http://www.eJobdescription.com
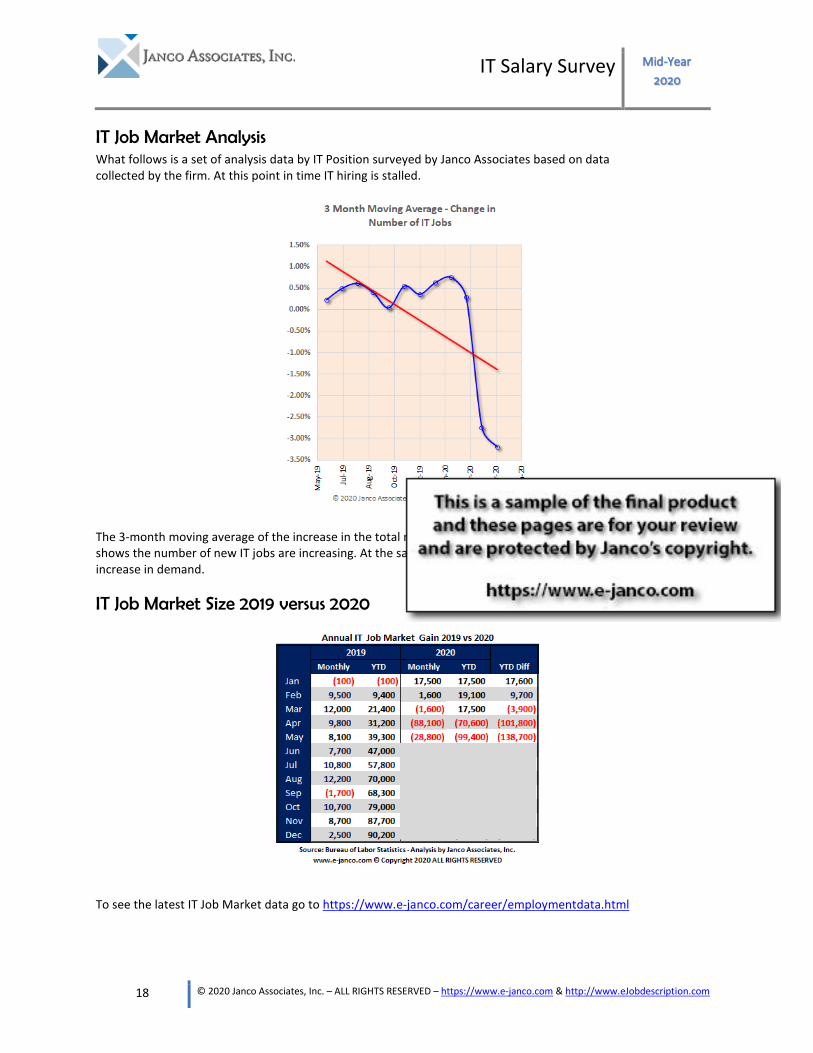
IT Job Market Analysis What follows is a set of analysis data by IT Position surveyed by Janco Associates based on data collected by the firm. At this point in time IT hiring is stalled.
The 3-month moving average of the increase in the total number of new jobs, as of December 2018 shows the number of new IT jobs are increasing. At the same time hiring by enterprises reflect the increase in demand.
IT Job Market Size 2019 versus 2020
To see the latest IT Job Market data go to https://www.e-janco.com/career/employmentdata.html
Victor
Sample
IT Salary Survey Mid-Year 2020
20 © 2020 Janco Associates, Inc. – ALL RIGHTS RESERVED – https://www.e-janco.com & http://www.eJobdescription.com
Job Descriptions
The following position descriptions have been adapted from Internet and Information Technology Position Description HandiGuide®, published by Janco Associates, Inc., expressly for inclusion in this publication. They are copyright © 1995-2009 by Janco Associates Inc. and are not to be utilized for any purpose other than use with this Compensation Study.
Full job descriptions can be ordered at https://www.e-janco.com/session/add_product.aspx?catalog=962
Vice President - Chief Information Officer
The Chief Information Officer (CIO) is accountable for directing the information and data integrity of the enterprise and its groups and for all Information Service functions of the enterprise, including all data centers, technical service centers, production scheduling functions, help desks, communication networks (voice and data), computer program development, and computer systems operations. He or she is responsible for maintaining the integrity of all electronic and optical books and records of the enterprise including a review of computerized and manual systems; information processing equipment and software for acquisition, storage and retrieval; and definition of the strategic direction of all information processing and communication systems and operations. He or she provides overall management and definition of all computer and communication Activities within the enterprise including responsibility for providing a leadership role in the data to day operations of the Information Services function as well as providing direction as the enterprise grows through internal growth and external acquisition.
Vice President – Chief Security Officer
The Chief Security Officer (CSO) is responsible for overall direction of all security functions associated with Information Technology applications, communications (voice and data), and computing services within the enterprise. At the same time, the CSO must be aware of the implications of legislated requirements that impact security for the enterprise. This includes but is not limited to Sarbanes Oxley Section 404 requirements. The CSO has the responsibility for global and enterprise-wide information security; he/she is also responsible for the physical security, protection services and privacy of the corporation and its employees. The CSO oversees and coordinates security efforts across the enterprise, including information technology, human resources, communications, legal, facilities management and other groups, to identify security initiatives and standards. The CSO works closely with the chief information officer and must have strong working knowledge of information technology.
Vice President - Administration
The Vice President Administration is accountable for providing administrative direction and support systems as well as communication of performance and inter-enterprise billings between the Information Services organization and its internal and external users. This includes all Information Service functions of the enterprise, including all data centers, technical service centers, production scheduling functions, help desks, communication networks (voice and data), computer program development, computer systems operations. He or she is responsible for maintaining the integrity of the books and records of Information Services and the office of the Chief Information Officer including computerized and manual systems. He or she provides overall support in management and definition of all computer and communication activities within the enterprise.
Vice President - Consulting Services
The Vice President Consulting Services is accountable for directing the business and operational application of information and data in the enterprise and its groups including reviews of applications including computerized and manual systems; software acquisition, storage and retrieval approaches; and definition of the strategic direction of all information processing and communication systems and operations. He or she provides overall management and definition of all computer and communication business and operation activities within the enterprise.
IT Salary Survey Mid-Year 2020
30 © 2020 Janco Associates, Inc. – ALL RIGHTS RESERVED – https://www.e-janco.com & http://www.eJobdescription.com
IT Job Description HandiGuide
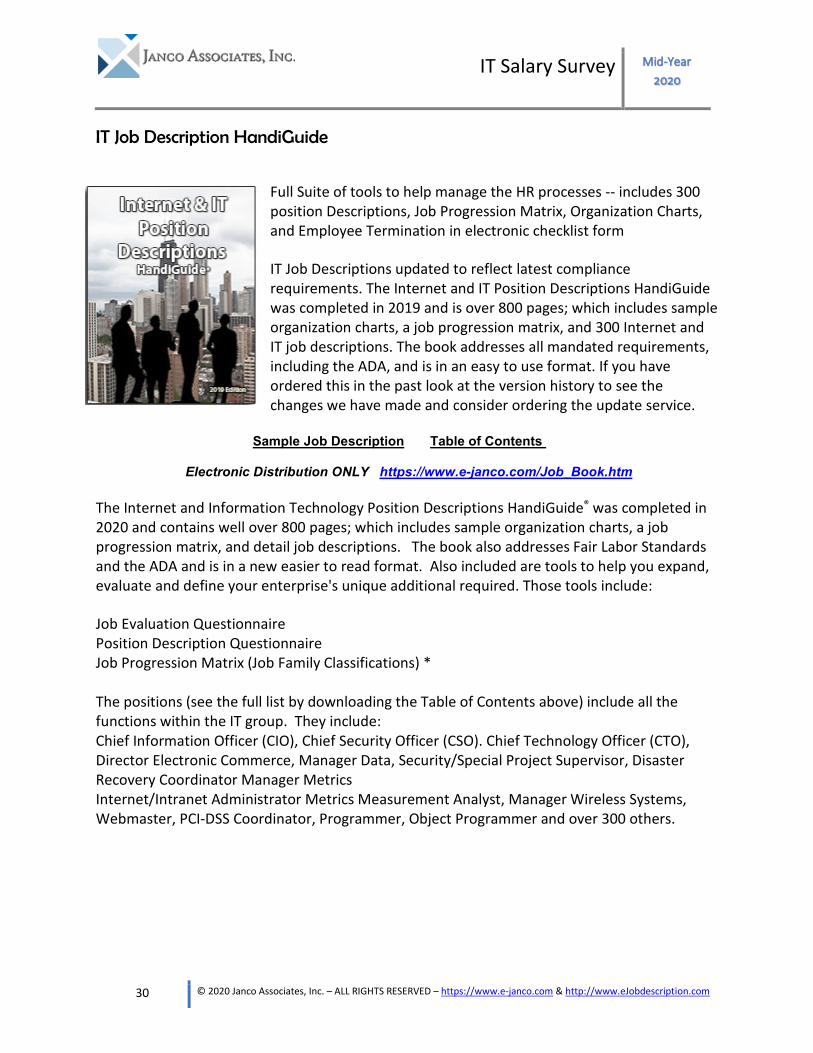
Full Suite of tools to help manage the HR processes -- includes 300 position Descriptions, Job Progression Matrix, Organization Charts, and Employee Termination in electronic checklist form
IT Job Descriptions updated to reflect latest compliance requirements. The Internet and IT Position Descriptions HandiGuide was completed in 2019 and is over 800 pages; which includes sample organization charts, a job progression matrix, and 300 Internet and IT job descriptions. The book addresses all mandated requirements, including the ADA, and is in an easy to use format. If you have ordered this in the past look at the version history to see the changes we have made and consider ordering the update service.
Sample Job Description Table of Contents
Electronic Distribution ONLY https://www.e-janco.com/Job_Book.htm
The Internet and Information Technology Position Descriptions HandiGuide® was completed in 2020 and contains well over 800 pages; which includes sample organization charts, a job progression matrix, and detail job descriptions. The book also addresses Fair Labor Standards and the ADA and is in a new easier to read format. Also included are tools to help you expand, evaluate and define your enterprise's unique additional required. Those tools include:
Job Evaluation Questionnaire Position Description Questionnaire Job Progression Matrix (Job Family Classifications) * The positions (see the full list by downloading the Table of Contents above) include all the functions within the IT group. They include: Chief Information Officer (CIO), Chief Security Officer (CSO). Chief Technology Officer (CTO), Director Electronic Commerce, Manager Data, Security/Special Project Supervisor, Disaster Recovery Coordinator Manager Metrics Internet/Intranet Administrator Metrics Measurement Analyst, Manager Wireless Systems, Webmaster, PCI-DSS Coordinator, Programmer, Object Programmer and over 300 others.
IT Salary Survey Mid-Year 2020
31 © 2020 Janco Associates, Inc. – ALL RIGHTS RESERVED – https://www.e-janco.com & http://www.eJobdescription.com
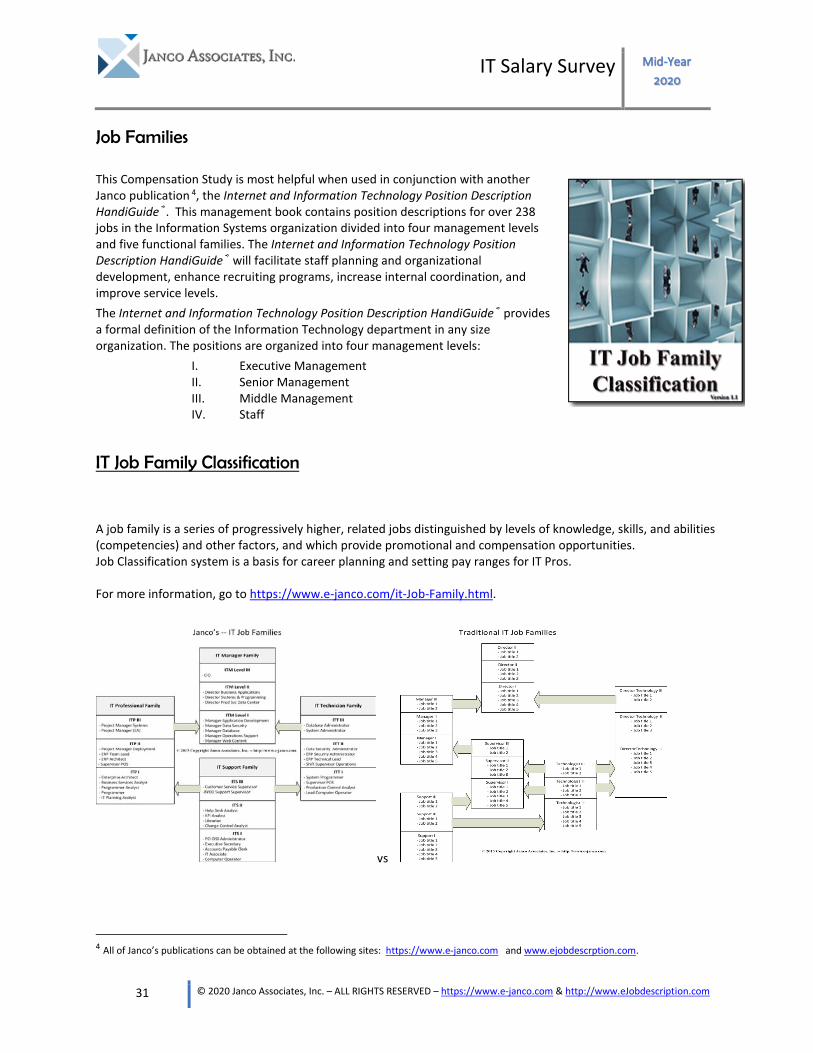
Job Families
This Compensation Study is most helpful when used in conjunction with another Janco publication 4, the Internet and Information Technology Position Description HandiGuide®. This management book contains position descriptions for over 238 jobs in the Information Systems organization divided into four management levels and five functional families. The Internet and Information Technology Position Description HandiGuide® will facilitate staff planning and organizational development, enhance recruiting programs, increase internal coordination, and improve service levels. The Internet and Information Technology Position Description HandiGuide® provides a formal definition of the Information Technology department in any size organization. The positions are organized into four management levels:
I. Executive Management II. Senior Management III. Middle Management IV. Staff
IT Job Family Classification
A job family is a series of progressively higher, related jobs distinguished by levels of knowledge, skills, and abilities (competencies) and other factors, and which provide promotional and compensation opportunities. Job Classification system is a basis for career planning and setting pay ranges for IT Pros. For more information, go to https://www.e-janco.com/it-Job-Family.html.
vs
4 All of Janco’s publications can be obtained at the following sites: https://www.e-janco.com and www.ejobdescrption.com.
IT Salary Survey Mid-Size Enterprises
Mid-Year 2020
36 © 2020 Janco Associates, Inc. – ALL RIGHTS RESERVED – https://www.e-janco.com & http://www.eJobdescription.com
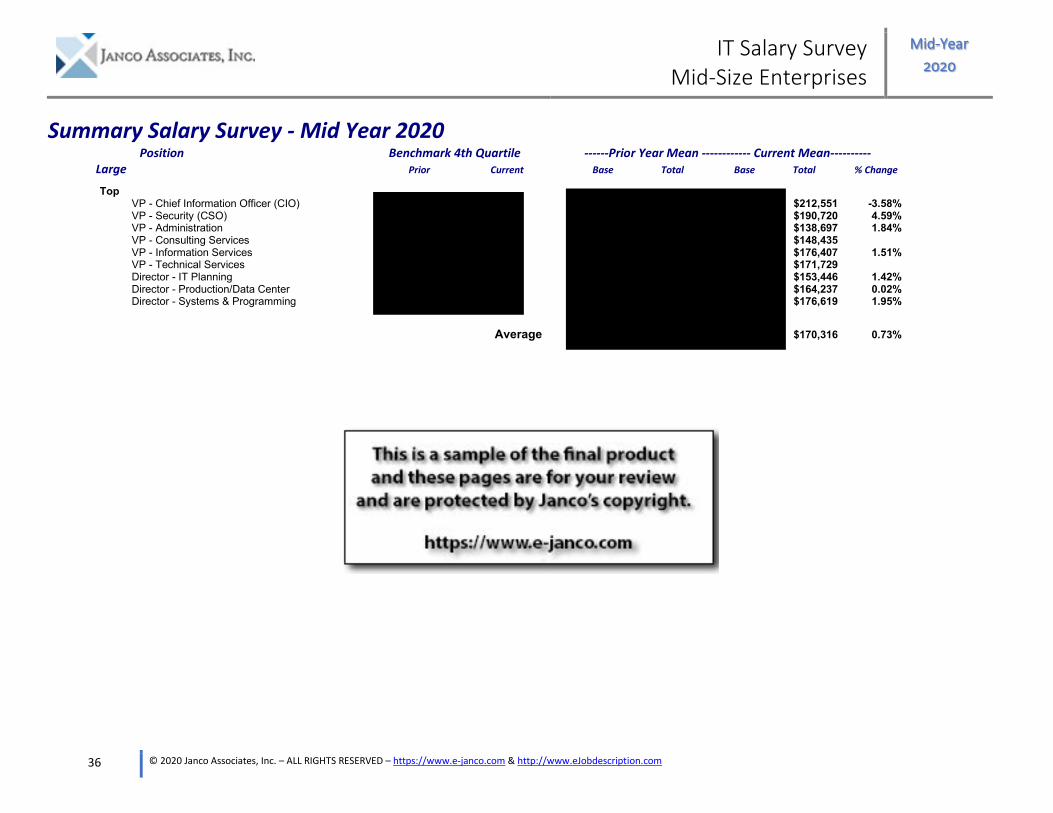
Summary Salary Survey - Mid Year 2020Position Benchmark 4th Quartile ------Prior Year Mean ------------ Current Mean----------
Large Prior Current Base Total Base Total % Change
TopVP - Chief Information Officer (CIO) $212,551 -3.58%VP - Security (CSO) $190,720 4.59%VP - Administration $138,697 1.84%VP - Consulting Services $148,435VP - Information Services $176,407 1.51%VP - Technical Services $171,729Director - IT Planning $153,446 1.42%Director - Production/Data Center $164,237 0.02%Director - Systems & Programming $176,619 1.95%
Average $170,316 0.73%
Victor
Sample
IT Salary Survey
Mid-Size Enterprises Mid-Year 2020
37 © 2020 Janco Associates, Inc. – ALL RIGHTS RESERVED – https://www.e-janco.com & http://www.eJobdescription.com
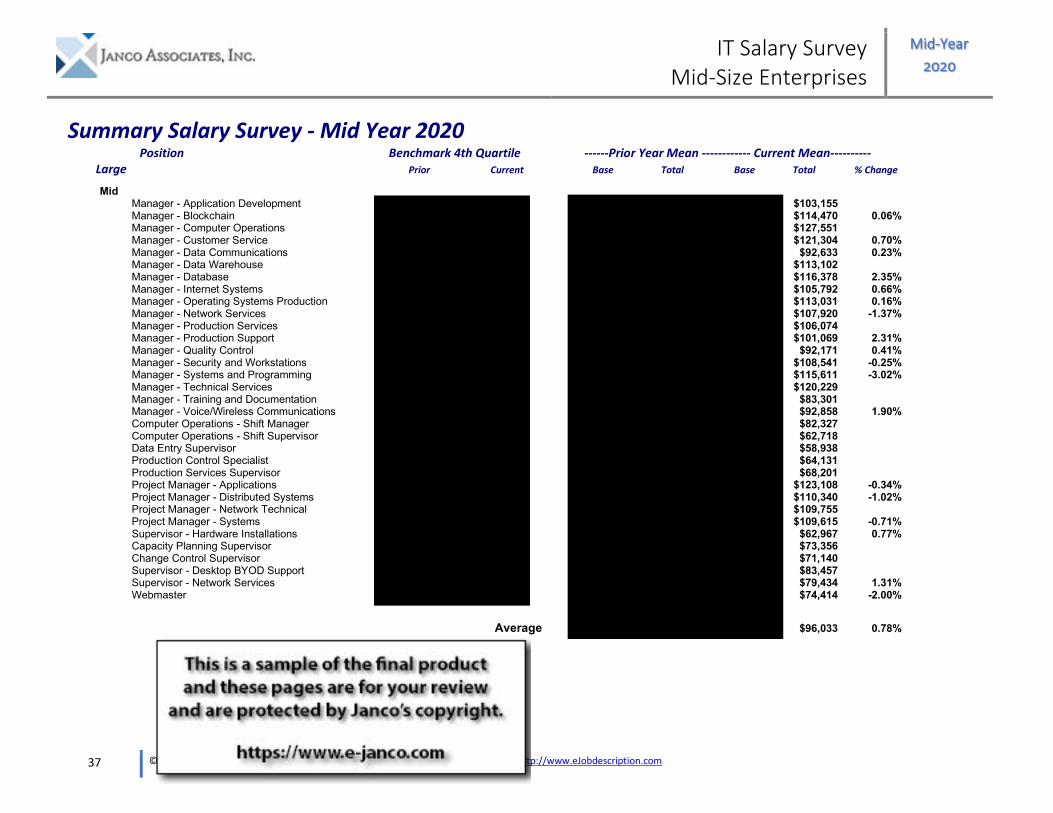
Summary Salary Survey - Mid Year 2020 Position Benchmark 4th Quartile ------Prior Year Mean ------------ Current Mean---------- Large Prior Current Base Total Base Total % Change Mid Manager - Application Development $103,155 Manager - Blockchain $114,470 0.06% Manager - Computer Operations $127,551 Manager - Customer Service $121,304 0.70% Manager - Data Communications $92,633 0.23% Manager - Data Warehouse $113,102 Manager - Database $116,378 2.35% Manager - Internet Systems $105,792 0.66% Manager - Operating Systems Production $113,031 0.16% Manager - Network Services $107,920 -1.37% Manager - Production Services $106,074 Manager - Production Support $101,069 2.31% Manager - Quality Control $92,171 0.41% Manager - Security and Workstations $108,541 -0.25% Manager - Systems and Programming $115,611 -3.02% Manager - Technical Services $120,229 Manager - Training and Documentation $83,301 Manager - Voice/Wireless Communications $92,858 1.90% Computer Operations - Shift Manager $82,327 Computer Operations - Shift Supervisor $62,718 Data Entry Supervisor $58,938 Production Control Specialist $64,131 Production Services Supervisor $68,201 Project Manager - Applications $123,108 -0.34% Project Manager - Distributed Systems $110,340 -1.02% Project Manager - Network Technical $109,755 Project Manager - Systems $109,615 -0.71% Supervisor - Hardware Installations $62,967 0.77% Capacity Planning Supervisor $73,356 Change Control Supervisor $71,140 Supervisor - Desktop BYOD Support $83,457 Supervisor - Network Services $79,434 1.31% Webmaster $74,414 -2.00%
Average $96,033 0.78%
Victor
Sample
IT Salary Survey
Mid-Size Enterprises Mid-Year 2020
38 © 2020 Janco Associates, Inc. – ALL RIGHTS RESERVED – https://www.e-janco.com & http://www.eJobdescription.com
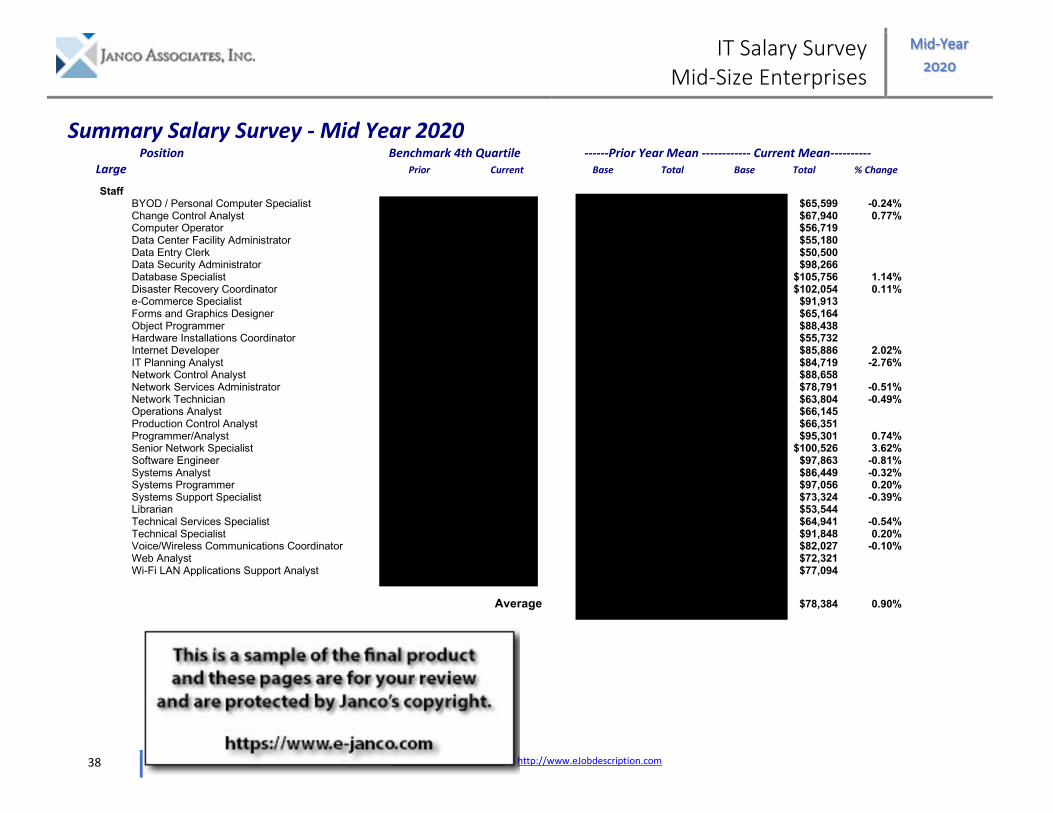
Summary Salary Survey - Mid Year 2020 Position Benchmark 4th Quartile ------Prior Year Mean ------------ Current Mean---------- Large Prior Current Base Total Base Total % Change Staff BYOD / Personal Computer Specialist $65,599 -0.24% Change Control Analyst $67,940 0.77% Computer Operator $56,719 Data Center Facility Administrator $55,180 Data Entry Clerk $50,500 Data Security Administrator $98,266 Database Specialist $105,756 1.14% Disaster Recovery Coordinator $102,054 0.11% e-Commerce Specialist $91,913 Forms and Graphics Designer $65,164 Object Programmer $88,438 Hardware Installations Coordinator $55,732 Internet Developer $85,886 2.02% IT Planning Analyst $84,719 -2.76% Network Control Analyst $88,658 Network Services Administrator $78,791 -0.51% Network Technician $63,804 -0.49% Operations Analyst $66,145 Production Control Analyst $66,351 Programmer/Analyst $95,301 0.74% Senior Network Specialist $100,526 3.62% Software Engineer $97,863 -0.81% Systems Analyst $86,449 -0.32% Systems Programmer $97,056 0.20% Systems Support Specialist $73,324 -0.39% Librarian $53,544 Technical Services Specialist $64,941 -0.54% Technical Specialist $91,848 0.20% Voice/Wireless Communications Coordinator $82,027 -0.10% Web Analyst $72,321 Wi-Fi LAN Applications Support Analyst $77,094
Average $78,384 0.90%
Victor
Sample
IT Salary Survey
Mid-Size Enterprises Mid-Year 2020
39 © 2020 Janco Associates, Inc. – ALL RIGHTS RESERVED – https://www.e-janco.com & http://www.eJobdescription.com
Summary Salary Survey - Mid Year 2020 Position Benchmark 4th Quartile ------Prior Year Mean ------------ Current Mean---------- Large Prior Current Base Total Base Total % Change Average by $97,696 0.22%
Victor
Sample

IT Salary Survey
Mid-Size Enterprises Mid-Year 2020
40 © 2020 Janco Associates, Inc. – ALL RIGHTS RESERVED – https://www.e-janco.com & http://www.eJobdescription.com
Summary Salary Survey - Mid Year 2020 Position Benchmark 4th Quartile ------Prior Year Mean ------------ Current Mean---------- Mid-Size Prior Current Base Total Base Total % Change Top VP - Chief Information Officer (CIO) $188,168 1.14% VP - Security (CSO) $144,356 -0.28% VP - Administration $115,651 1.04% VP - Consulting Services $163,456 -0.81% VP - Information Services $148,641 1.20% VP - Technical Services $156,801 Director - IT Planning $114,705 0.20% Director - Production/Data Center $127,504 0.42% Director - Systems & Programming $149,520 0.41%
Average $145,422 1.26%
Victor
Sample
IT Salary Survey
Mid-Size Enterprises Mid-Year 2020
41 © 2020 Janco Associates, Inc. – ALL RIGHTS RESERVED – https://www.e-janco.com & http://www.eJobdescription.com
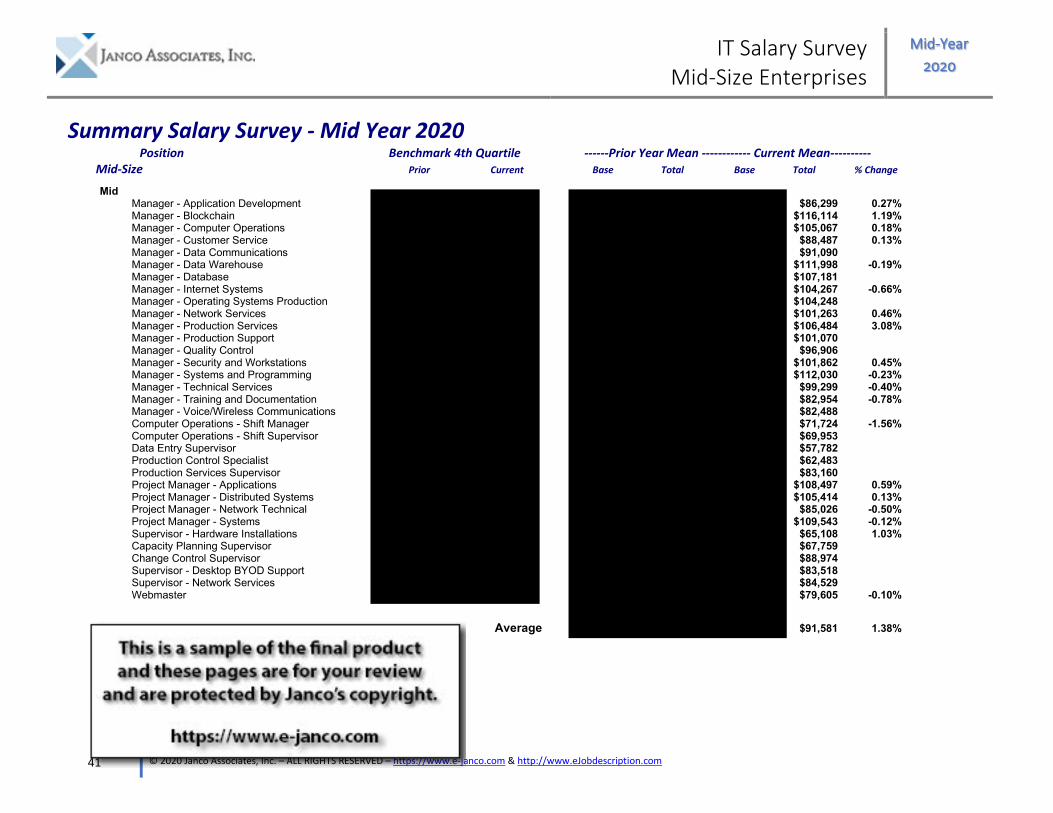
Summary Salary Survey - Mid Year 2020 Position Benchmark 4th Quartile ------Prior Year Mean ------------ Current Mean---------- Mid-Size Prior Current Base Total Base Total % Change Mid Manager - Application Development $86,299 0.27% Manager - Blockchain $116,114 1.19% Manager - Computer Operations $105,067 0.18% Manager - Customer Service $88,487 0.13% Manager - Data Communications $91,090 Manager - Data Warehouse $111,998 -0.19% Manager - Database $107,181 Manager - Internet Systems $104,267 -0.66% Manager - Operating Systems Production $104,248 Manager - Network Services $101,263 0.46% Manager - Production Services $106,484 3.08% Manager - Production Support $101,070 Manager - Quality Control $96,906 Manager - Security and Workstations $101,862 0.45% Manager - Systems and Programming $112,030 -0.23% Manager - Technical Services $99,299 -0.40% Manager - Training and Documentation $82,954 -0.78% Manager - Voice/Wireless Communications $82,488 Computer Operations - Shift Manager $71,724 -1.56% Computer Operations - Shift Supervisor $69,953 Data Entry Supervisor $57,782 Production Control Specialist $62,483 Production Services Supervisor $83,160 Project Manager - Applications $108,497 0.59% Project Manager - Distributed Systems $105,414 0.13% Project Manager - Network Technical $85,026 -0.50% Project Manager - Systems $109,543 -0.12% Supervisor - Hardware Installations $65,108 1.03% Capacity Planning Supervisor $67,759 Change Control Supervisor $88,974 Supervisor - Desktop BYOD Support $83,518 Supervisor - Network Services $84,529 Webmaster $79,605 -0.10%
Average $91,581 1.38%
Victor
Sample
IT Salary Survey
Mid-Size Enterprises Mid-Year 2020
42 © 2020 Janco Associates, Inc. – ALL RIGHTS RESERVED – https://www.e-janco.com & http://www.eJobdescription.com
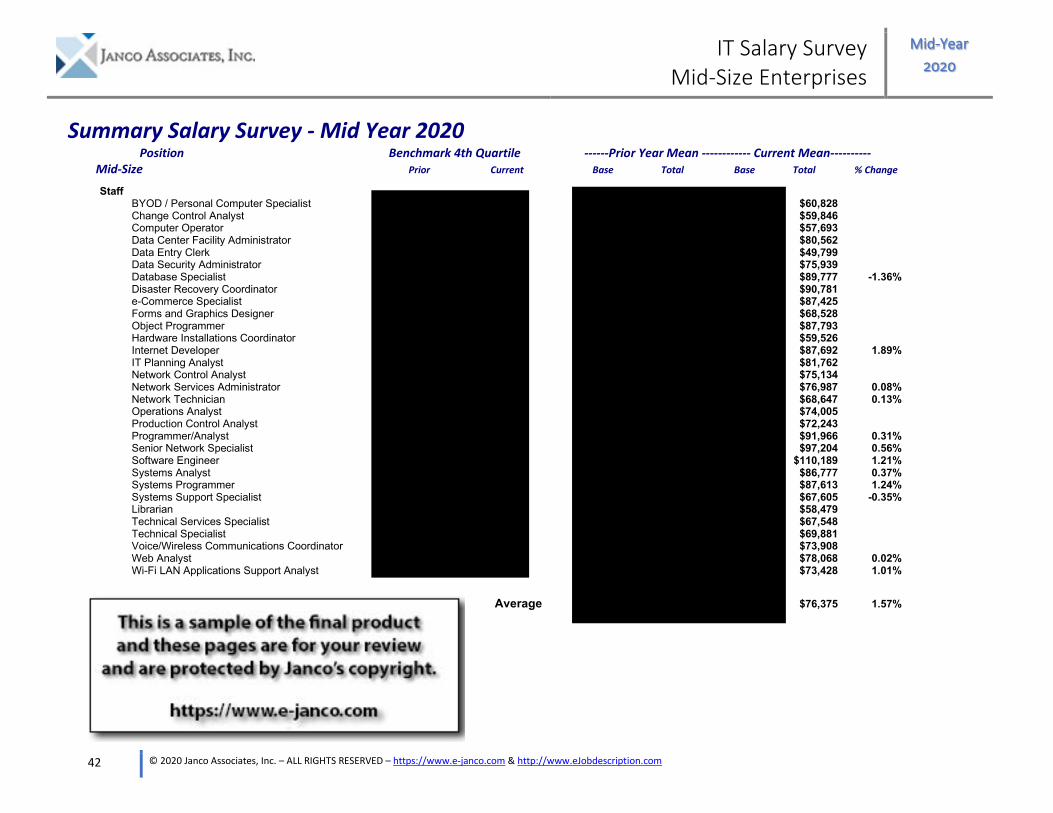
Summary Salary Survey - Mid Year 2020 Position Benchmark 4th Quartile ------Prior Year Mean ------------ Current Mean---------- Mid-Size Prior Current Base Total Base Total % Change Staff BYOD / Personal Computer Specialist $60,828 Change Control Analyst $59,846 Computer Operator $57,693 Data Center Facility Administrator $80,562 Data Entry Clerk $49,799 Data Security Administrator $75,939 Database Specialist $89,777 -1.36% Disaster Recovery Coordinator $90,781 e-Commerce Specialist $87,425 Forms and Graphics Designer $68,528 Object Programmer $87,793 Hardware Installations Coordinator $59,526 Internet Developer $87,692 1.89% IT Planning Analyst $81,762 Network Control Analyst $75,134 Network Services Administrator $76,987 0.08% Network Technician $68,647 0.13% Operations Analyst $74,005 Production Control Analyst $72,243 Programmer/Analyst $91,966 0.31% Senior Network Specialist $97,204 0.56% Software Engineer $110,189 1.21% Systems Analyst $86,777 0.37% Systems Programmer $87,613 1.24% Systems Support Specialist $67,605 -0.35% Librarian $58,479 Technical Services Specialist $67,548 Technical Specialist $69,881 Voice/Wireless Communications Coordinator $73,908 Web Analyst $78,068 0.02% Wi-Fi LAN Applications Support Analyst $73,428 1.01%
Average $76,375 1.57%
Victor
Sample
IT Salary Survey
Mid-Size Enterprises Mid-Year 2020
43 © 2020 Janco Associates, Inc. – ALL RIGHTS RESERVED – https://www.e-janco.com & http://www.eJobdescription.com
Summary Salary Survey - Mid Year 2020 Position Benchmark 4th Quartile ------Prior Year Mean ------------ Current Mean---------- Mid-Size Prior Current Base Total Base Total % Change Average by $91,762 0.19%
Victor
Sample

IT Salary Survey
Mid-Size Enterprises Mid-Year 2020
45 © 2020 Janco Associates, Inc. – ALL RIGHTS RESERVED – https://www.e-janco.com & http://www.eJobdescription.com
Statistics Presented by City
The following pages present the numerical results of Janco’s Compensation Study in a tabular fashion. Shown are the normalized minimum and maximum for the base salary, as well as the total compensation (including supplemental compensation) for each position, as well as Janco’s own benchmark. The remaining columns show figures for 78 typical United States metro areas, as well as 24 selected metro areas in Canada, with adjustments made on the basis of such factors as cost of living, local economic indicators, and regional industry forecasts. City data includes perks. US cities data is in US dollars and Canadian cities data is in Canadian Dollars. The city data is the median.
The cities listed are:
US Cities
Akron Albuquerque Allentown Anchorage Atlanta Atlantic City Austin Baltimore Bellingham Boise Boston Buffalo Charleston Charlotte Cheyenne Chicago Cincinnati Cleveland Colorado Springs Columbus Dallas Denver Des Moines Detroit Duluth Gary Grand Rapids Green Bay Honolulu Houston Indianapolis Kansas City, Missouri Las Vegas Lexington Little Rock Los Angeles Louisville Madison Memphis Miami Milwaukee Minneapolis Nashville New Orleans New York Oakland Oklahoma City Olympia Omaha Orange County CA Orlando Peoria Philadelphia Phoenix Pittsburgh Portland. Maine Portland, Oregon Provo/Orem Raleigh-Durham Rockford Sacramento Salt Lake City San Antonio San Diego San Francisco San Jose Seattle Sioux Falls St. Louis Stamford Syracuse Toledo Topeka Tucson Tulsa Washington Wichita Winston-Salem
Canadian Cities 5
Calgary AB Charlotte PE Edmonton AB Fredericton NB Guelph ON Halifax NS Hamilton ON Hull QC London ON Montreal QC Niagara Falls ON Ottawa ON Québec City QC Regina SK Saskatoon SK Sault Ste. Marie ON St. John’s NF Sudbury ON Toronto ON Vancouver BC Victoria BC Whitehorse YT Windsor ON Winnipeg MB
5 On the tables that follow and in the Excel files (if you have purchased that option) the only dollars which are in Canadian Dollars are the mean dollars for the Canadian cities. All other values are in US Dollars only.
Victor
Sample

IT Salary Survey
Mid-Size Enterprises Mid-Year 2020
47 © 2020 Janco Associates, Inc. – ALL RIGHTS RESERVED – https://www.e-janco.com & http://www.eJobdescription.com
Large Enterprises
Compensation for positions in cities in the United States and Canada The Compensation Study data was divided into two categories. Large companies are companies whose gross revenues are equal to or greater than $500 MM or more than 1,000 total employees. Mid-sized companies are companies whose gross revenues are less than $500 MM and less than 1,000 employees All salaries are normalized to a national standard, considering the cost of living in the metropolitan areas presented. Note some metro areas may not have enough data points to be statistically accurate to plus or minus 5%. However, all the national numbers are statistically valid for plus or minus 1.2%
Victor
Sample

IT Salary Survey
Mid-Size Enterprises Mid-Year 2020
48 © 2020 Janco Associates, Inc. – ALL RIGHTS RESERVED – https://www.e-janco.com & http://www.eJobdescription.com
Title Min Base Max Base Max Total Min Total Mean Base Mean Total Benchmark Akron Albuquerque Allentown
VP - Chief Information Officer (CIO) $212,551 VP - Security (CSO) $190,720 VP - Administration $138,697 VP - Consulting Services $148,435 VP - Information Services $176,407 VP - Technical Services $171,729 Director - IT Planning $153,446 Director - Production/Data Center $164,237 Director - Systems & Programming $176,619 Manager - Application Development $103,155 Manager - Blockchain $114,470 Manager - Computer Operations $127,551 Manager - Customer Service $121,304 Manager - Data Communications $92,633 Manager - Data Warehouse $113,102 Manager - Database $116,378 Manager - Internet Systems $105,792 Manager - Operating Systems Production $113,031 Manager - Network Services $107,920 Manager - Production Services $106,074 Manager - Production Support $101,069 Manager - Quality Control $92,171 Manager - Security and Workstations $108,541 Manager - Systems and Programming $115,611 Manager - Technical Services $120,229 Manager - Training and Documentation $83,301 Manager - Voice Wireless Communication $92,858 Computer Operations - Shift Manager $82,327 Computer Operations - Shift Supervisor $62,718 Data Entry Supervisor $58,938 Production Control Specialist $64,131 Production Services Supervisor $68,201 Project Manager - Applications $123,108 Project Manager - Distributed Systems $110,340 Project Manager - Network Technical Services $109,755 Project Manager - Systems $109,615 Supervisor - Hardware Installations $62,967
Victor
Sample
IT Salary Survey
Mid-Year 2020
93 © 2020 Janco Associates, Inc. – ALL RIGHTS RESERVED – https://www.e-janco.com & http://www.eJobdescription.com
National IT Salary Analysis by Position
Only available with the full version of the IT Salary Survey
Victor
Sample

VP - Chief Information Officer (CIO)
Benchmark Range
Base:
Total:
$138,885 - $469,649
$149,479 - $526,721
Sample Statistics
Organizations: 88
Total Sample: 2190
Base
Mini: $86,407
Mean: $191,362
Max: $747,936
Total
$107,597
$212,551
$862,081
Total
Base
61 161 261 361 461 561
Compensation ($ '000)
Large
Benchmark Range
Base:
Total:
$111,214 - $395,025
$121,913 - $535,025
Sample Statistics
Organizations: 293
Total Sample: 396
Base
Mini: $55,659
Mean: $166,769
Max: $623,280
Total
$77,058
$188,168
$903,280
Total
Base
26 126 226 326 426 526
Compensation ($ '000)
Mid-Size
95 © 2020 Janco Associates, Inc. – ALL RIGHTS RESERVED – https://www.e-janco.com & http://www.eJobdescription.com
Victor
Sample