Middle Park State School Queensland State School Reporting ... · monitoring processes, outcomes...
15
Middle Park State School Queensland State School Reporting 2014 School Annual Report Postal address Cnr Sumners Road & Macfarlane Street Middle Park 4074 Phone (07) 3712 9888 Fax (07) 3712 9800 Email [email protected] Webpages Additional reporting information pertaining to Queensland state schools is located on the My School website and the Queensland Government data website. Contact person Mrs Anne Kitchin (Principal). Principal’s foreword Introduction The school Annual Report is provided for your information and reports on the achievements and activities at the assessment, The Quadrennial School Review and monitoring processes, outcomes from the National Assessment (NAPLAN) and highlights achievements and activities undertaken by students throughout the year. Middle Park State School is an Independent Public School situated in the western suburbs of Brisbane in the Centenary area. This means that our school community’s hard work has been recognised and that we could manage our school in a way that would allow us to cut red tape and remove layers of management within the system to allow our community a greater say in decision making have more freedom to work and make decisions that best meet the our needs and achieve the best outcomes for students. We are still very proudly a Queensland State School. Our enrolment has grown to 604 students . Our students display a wide range of achievements. Outstanding academic, musical and athletic achievement have been recognised on a regional and state level over the past year. We have a diverse population and 34% per cent of students receive support to scaffold or extend through the whole school support strategies or have Individual Support Plans. 2.5% of students identify as Aboriginal or Torres Strait, 20% students backgrounds where English is not their first language. To extend students there are a range of activities such as the , Science Club, Technology Club, Keys (Brain ways program available to fast learners), Choirs, Bands, Dance Troupe, Interschool Sports and University of NSW tests. In 2014 we had numerous achievements, some of which are listed within this report. They have come about through the collaboration between staff, students, parents and the community. This collaboration ensures that we will continue to deliver quality education. Our Parents’ and Citizens’ Association and associated committees are extremely active in all aspects of our school. We welcome and embrace their commitment. School progress towards its goals in 2014
Transcript of Middle Park State School Queensland State School Reporting ... · monitoring processes, outcomes...
Middle Park State School Queensland State School Reporting 2014 School Annual Report
Postal address Cnr Sumners Road & Macfarlane Street Middle Park 4074
Phone (07) 3712 9888
Fax (07) 3712 9800
Email [email protected]
Webpages Additional reporting information pertaining to Queensland state schools is located on the My School website and the Queensland Government data website.
Contact person Mrs Anne Kitchin (Principal).
Principal’s foreword
Introduction
The school Annual Report is provided for your information and reports on the achievements and activities at the assessment, The Quadrennial School Review and monitoring processes, outcomes from the National Assessment (NAPLAN) and highlights achievements and activities undertaken by students throughout the year. Middle Park State School is an Independent Public School situated in the western suburbs of Brisbane in the Centenary area. This means that our school community’s hard work has been recognised and that we could manage our school in a way that would allow us to cut red tape and remove layers of management within the system to allow our community a greater say in decision making have more freedom to work and make decisions that best meet the our needs and achieve the best outcomes for students. We are still very proudly a Queensland State School.
Our enrolment has grown to 604 students . Our students display a wide range of achievements.
Outstanding academic, musical and athletic achievement have been recognised on a regional and state level over the past year. We have a diverse population and
34% per cent of students receive support to scaffold or extend through the whole school support strategies or have Individual Support Plans.
2.5% of students identify as Aboriginal or Torres Strait,
20% students backgrounds where English is not their first language.
To extend students there are a range of activities such as the , Science Club, Technology Club, Keys (Brain ways program available to fast learners), Choirs, Bands, Dance Troupe, Interschool Sports and University of NSW tests.
In 2014 we had numerous achievements, some of which are listed within this report. They have come about through the collaboration between staff, students, parents and the community. This collaboration ensures that we will continue to deliver quality education. Our Parents’ and Citizens’ Association and associated committees are extremely active in all aspects of our school. We welcome and embrace their commitment.
School progress towards its goals in 2014

Australian
Curriculum
Implementation
The Curriculum Framework has been revised and updated to align with Australian curriculum and staff took part in a variety of workshops to familiarise and gain mastery over key learning areas.
Heads of Teaching and Learning led sessions to expand on the current assessment overview to reflect targets and recording procedures.
Every class within the school has instigated Guided Reading for four days per week supported by teacher aides. Intervention and extension groups are functioning across year levels using Fountas and Pinnel -Levelled Literacy Intervention
Maths intervention and extension groups are embedded within each year level
Staff have undertaken various forms of writing workshops e.g. ”Reading to Learn” and “The Seven Steps of Writing”
Consistent Classroom Pedagogical Practices
Implementing and managing consistent classroom pedagogical practices has been the main area of improvement for staff in 2014. Explicit teaching has been the key focus and The Art and Science of Teaching (Marzano) has been the vehicle that staff have used to reflect on current practices. Differentiation and moderation sessions have been facilitated for each year level in the school.
We have implemented a whole school pedagogical assessment and data collection for staff members. Staff have agreed on the practices set out in the Pedagogical Framework and Leadership team members have reinforced these through feedback sessions for teachers.
Our school has achieved its goal to have systems in place to continuously monitor student achievement. Year levels meet to discuss student achievement using data from the C2C units and the distance travelled is monitored via data walls using benchmarking instruments. Learning goals for each student have been generated and reported upon.
The focus on high quality teaching practices has been supported by the creation of Head of Pedagogy who gives staff feedback on the principals of Explicit teaching, The Art and Science of Teaching, and agreed writing expectations.
Teachers have been provided with release time for observation and feedback in order to develop and manage collaborative teaching practices. Curriculum teams are facilitating and providing input to the procurement of professional development sessions
Key personnel have developed an action plan designed to improve all domains of the Teaching & Learning Audit
Using Data To inform teaching practice
The practice of using appropriate data has been embedded into all decision making within the school. All intervention and extension practices are based on internal and national testing data and are used as selection criteria as appropriate to elect best choice candidates for a various groups.
The Heads of Teaching and Learning have embedded a five weekly planning and data collection process within the staff meeting agenda to encourage analysis and inform teaching. Discussion and moderation are an integral part of the planning procedures across each year level. Distance travelled for each student is monitored by Heads of Teaching and Learning via Oneschool mark books.
School Leaders are driving an explicit and detailed
Staff have familiarised themselves with the lesson observation feedback sheet using the principals of Fleming and Marzano to produce feedback from coaches.
Processes where staff regularly discuss their teaching with the School leaders have been included in year level meetings. This has set the stage for individual meetings where teachers use Dashboard and class data to discuss student outcomes.

Every staff member has taken part in developing a Professional Development Plan to address areas of opportunity for growth. These were documented and reported on during the final session of the cycle.
A school council has been implemented in order to bring representatives into the school who are in a position to give input and feedback on initiatives. There are six members on the council( three parents, two teachers, principal)
Working parties have been initiated on the P&C for the Performing Arts, HPE, Senior students, Culture team so that parents, school leaders and teachers work together in a mutually supportive way to foster school pride and a sense of belonging
Cluster links have been strengthened through the promotion of professional development opportunities within the Centenary Learning Alliance of State Schools. These have been highly successful and forged the way for future staff development and moderation sessions across the whole alliance.
Work has begun to collect feedback for the staff and community for strengths and opportunities for improvement in our current Responsible Behaviour plan. This has been collated and has put us in a very strong position to upgrade our plan in 2015. The “You Can Do It” program is still strongly promoted throughout the school.
Productive Partnerships with school Community Stakeholders
The new asset replacement plan and facilities maintenance plan has been developed and embedded within the school.
The Emergency Management plan has been updated and published. Every term there is the fire/lockdown procedure drill and feedback is used to address any perceived issues.
Improving School Performance
Our English Curriculum Team has formulated actions to improve writing. Professional development on writing and follow up feedback for teachers takes place for staff on a regular basis. The English team also investigated “Ready To Read” which incorporates a writing component for future development of staff.
Heads of Teaching and learning have identified and acquired appropriate diagnostic tools to inform intervention processes. The intervention tools of Pat Maths and Reading as well as LLI are used across the whole school. Heads of Teaching and Learning are working on appropriate formats for teachers and leaders to interrogate the data.
We have worked towards our goal of having a school-wide approach to the teaching of comprehension. Professional Development for QAR comprehension has been postponed until 2015.
The practice of twice yearly target setting for all students has been put into place and Individual Learning Goals for each student are formulated and reported to parents twice yearly.
Implementation of classroom coaching and feedback for teachers was successfully instigated in Prep to Year Two classes. Teachers have received feedback on pedagogy and classroom management.
Year 7 to High School Transition
The transition of Year seven to high school was a seamless move. This is attributed to the collaborative planning within the cluster. Parent information sessions were held at our school and opportunities provided for parents to speak with representatives and visit the high school. Support was also given to our senior teacher who transitioned to the high school setting.
Future outlook
Australian Curriculum Implementation:
Implementation of the Australian Curriculum will be achieved by Heads of Teaching and Learning by updating the school frameworks and working closely with teachers to ensure Australian Curriculum is taught , assessed and moderated.
Consistent Classroom Pedagogical Practices Teachers will embed the assessment framework in teaching practices. Professional Development sessions will be conducted to embed the principals of The Art and Science Of Teaching and explicit teaching. Reading to Learn participation will continue for selected key staff. Using Data to Inform Teaching Practice Intervention and extension groups to be facilitated for Maths and English using NAPLAN and internal testing data. Five weekly data collection and analysis sessions will take place to inform teaching practices as well as moderation sessions across year levels. Differentiation of instruction to be used to scaffold and extend students. Distance travelled by all students to be monitored via one school collection of data. School leaders Driving Explicit and Detailed School Improvement Agenda The school will continue to provide Feedback to all members of the community. Regular discussion of class data and teaching strategies will take place between the leadership team and Staff. PDP to be developed for all staff members. Productive Partnerships with School Community Stakeholders School council to continue to implement agreed actions and increase the number of members. Working parties on P&C to be implemented to reflect curriculum i.e. -Performing Arts, HPE Mathletics, Ready Reader, Reading Eggs, Lexile, Reading to Learn parent workshops are to be facilitated by the leadership team. Cluster Staff Links will be promoted through joint PD and subsequent collegial visits. The responsible Behaviour Plan will be updated to include suggestions from the Discipline Audit and staff input. The “You Can Do It” program will continue to be implemented throughout the school. Workplace Health and Safety procedures will be updated and published to the whole school community. Improving School Performance Our school will continue to provide feedback to all members of the community. Student goals implemented and progress reported to parents. Students and Parents will receive regular feedback from teachers. The Leadership Team will work together to provide various forms of feedback. Coaches will continue to give feedback on classroom procedures. A core group of teachers will be trained to use Reading to Learn framework. Master Teacher will provide support for these teachers. Professional Development in problem solving skills and strategies for differentiation will be provided to staff. Year 6 to high school transition

Collaborative planning with Cluster group will occur to ensure smooth transition of year six to high school in 2016
Our school at a glance
School Profile
Coeducational or single sex: Coeducational
Year levels offered in 2014: Prep Year - Year 6
Total student enrolments for this school:
Total Girls Boys
Enrolment Continuity
(Feb – Nov)
2012 584 276 308 95%
2013 594 286 308 95%
2014 617 298 319 97%
Student counts are based on the Census (August) enrolment collection.
Characteristics of the student body:
Middle Park has a very supportive school environment. We have twenty per cent of the population
who have English as a second language and those with high needs are supported by a EAL/D teacher.
Two percent of our population identify as Indigenous and their progress is monitored via individual
learning plans. Three per cent of our population have been verified as a student with a disability and
are supported by our teacher aides and inclusion teacher
Average class sizes
Phase
Average Class Size
2012 2013 2014
Prep – Year 3 19 19 20
Year 4 – Year 7 Primary 26 22 27
School Disciplinary Absences
Disciplinary Absences
Count of Incidents
2012 2013 2014*
Short Suspensions - 1 to 5 days 19 25 47
Long Suspensions - 6 to 20 days 0 1 0
Exclusions# 0 0 0
# Exclusion is an abbreviated title which reflects suspensions with recommendations for exclusion, which may result in an exclusion or be set aside
through an appeals process.
* Caution should be used when comparing 2014 data with previous years SDA data as amendments to the disciplinary provisions in the Education
(General Provisions) Act 2006, passed in late 2013, created a time series break.
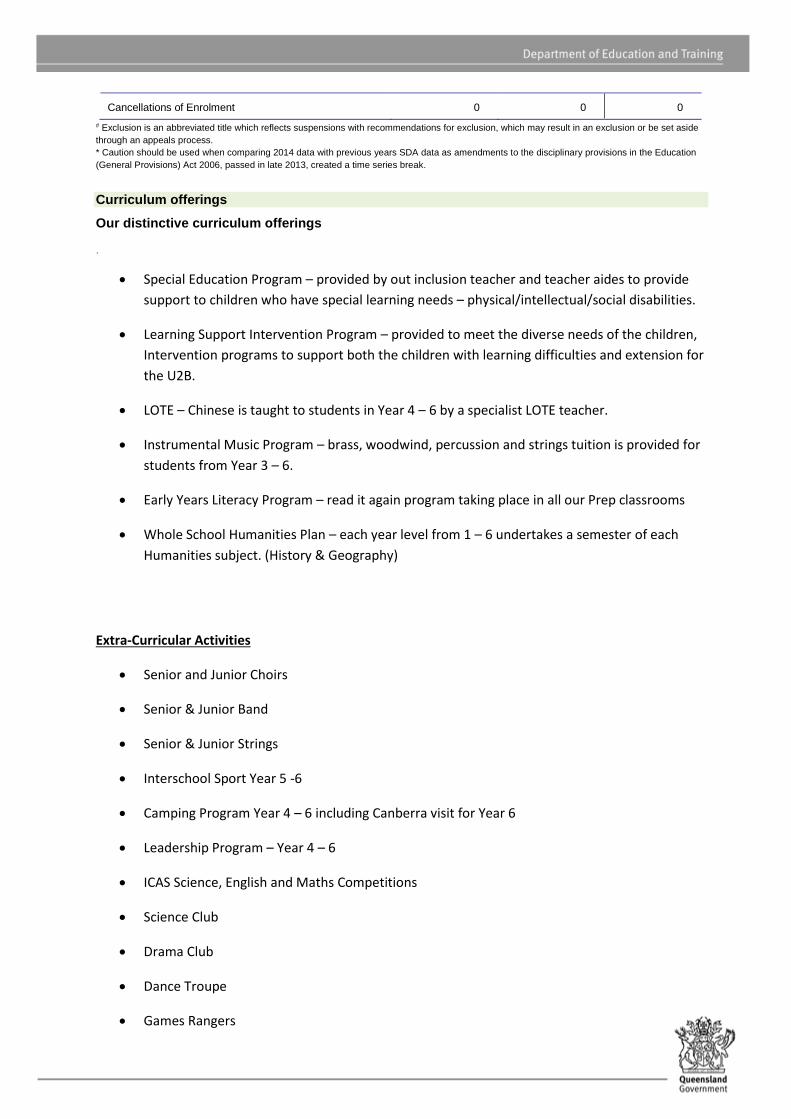
Curriculum offerings
Our distinctive curriculum offerings
.
Special Education Program – provided by out inclusion teacher and teacher aides to provide
support to children who have special learning needs – physical/intellectual/social disabilities.
Learning Support Intervention Program – provided to meet the diverse needs of the children,
Intervention programs to support both the children with learning difficulties and extension for
the U2B.
LOTE – Chinese is taught to students in Year 4 – 6 by a specialist LOTE teacher.
Instrumental Music Program – brass, woodwind, percussion and strings tuition is provided for
students from Year 3 – 6.
Early Years Literacy Program – read it again program taking place in all our Prep classrooms
Whole School Humanities Plan – each year level from 1 – 6 undertakes a semester of each
Humanities subject. (History & Geography)
Extra-Curricular Activities
Senior and Junior Choirs
Senior & Junior Band
Senior & Junior Strings
Interschool Sport Year 5 -6
Camping Program Year 4 – 6 including Canberra visit for Year 6
Leadership Program – Year 4 – 6
ICAS Science, English and Maths Competitions
Science Club
Drama Club
Dance Troupe
Games Rangers
Cancellations of Enrolment 0 0 0

Active School Travel
How Information and Communication Technologies are used to assist learning:
2014 saw our school embarking on a 1:1 iPad trial class in Year 2 with this 1:1 model to be gradually rolled out across the school in future years. IPads were also used in Prep as a motivating tool for learning and a mobile pod of iPads were available for class loan across the school. Additionally, iPads were used by our Students with Disabilities to aid social and communication skills and sets of iPads were also used in our LOTE and ESL departments.
Our classrooms were each allocated a pod of laptops which were used in small groups or combined across the block to make a whole class set. In addition, each classroom also had access to PCs along with the Computer Lab’s 30 PCs for whole class activities. A variety of other technologies were also used in classrooms such as interactive whiteboards, point-to-view cameras, still/video cameras, robotics kits, digital microscopes, microphones etc. These devices enabled teachers to present topics of work in motivating ways and enabled students to develop 21st century skills whilst promoting hands-on learning.
Social Climate
Middle Park has a very supportive school environment. We have twenty per cent of the population
who have English as a second language and those with high need are supported by a EAL/D teacher.
Two percent of our population identify as Indigenous and their progress is monitored via individual
learning plans. Three per cent of our population have been verified as a student with a disability and
are supported by our teacher aides and inclusion teacher. Ninety-eight per cent of parents who
responded to the opinion survey feel that this school treats their child fairly. Ninety-three per cent of
students feel that they are being treated fairly.
The Middle Park Staff work on the principals of:
High Expectations,
Informed Teaching and Learning
Positive Relationships
Middle Park State School values:
People and Relationships:
All students, staff and members of the community are treated with dignity and respect.
Learning:
We monitor students’ progress, give feedback and improve on learning outcomes for all.

Excellence:
"Each to Succeed" by improving their personal best and pursuing excellence.
Partnerships:
Our school community has determined that when students leave Middle Park State School at the end
of their primary school education our aim is that they are positive, ethical individuals who value their
own happiness, and that of others, in order to lead a fulfilling life.
Our school community has identified the following school rules to teach and promote our high
standards of responsible behaviour:
Behaviour expectations for all students are applied consistently and proactive approaches for
addressing inappropriate student behaviour are employed as outlined in the Middle Park State School
Responsible Behaviour Plan for Students.
At Middle Park State School we actively encourage community engagement with events such as
ANZAC Ceremony, Remembrance Day Ceremony, Musical Evening, special assemblies and Centenary
Learning Alliance of State Schools (C.L.A.S.S.) events.
The Parents and Citizens Association is highly active and contributes significantly to the school by way of provision of resources. Parents/Caregivers are involved in a wide range of school activities including rostered help in classrooms, on excursions/camps, sports coaching and our perceptual motor program.
Parent, student and staff satisfaction with the school
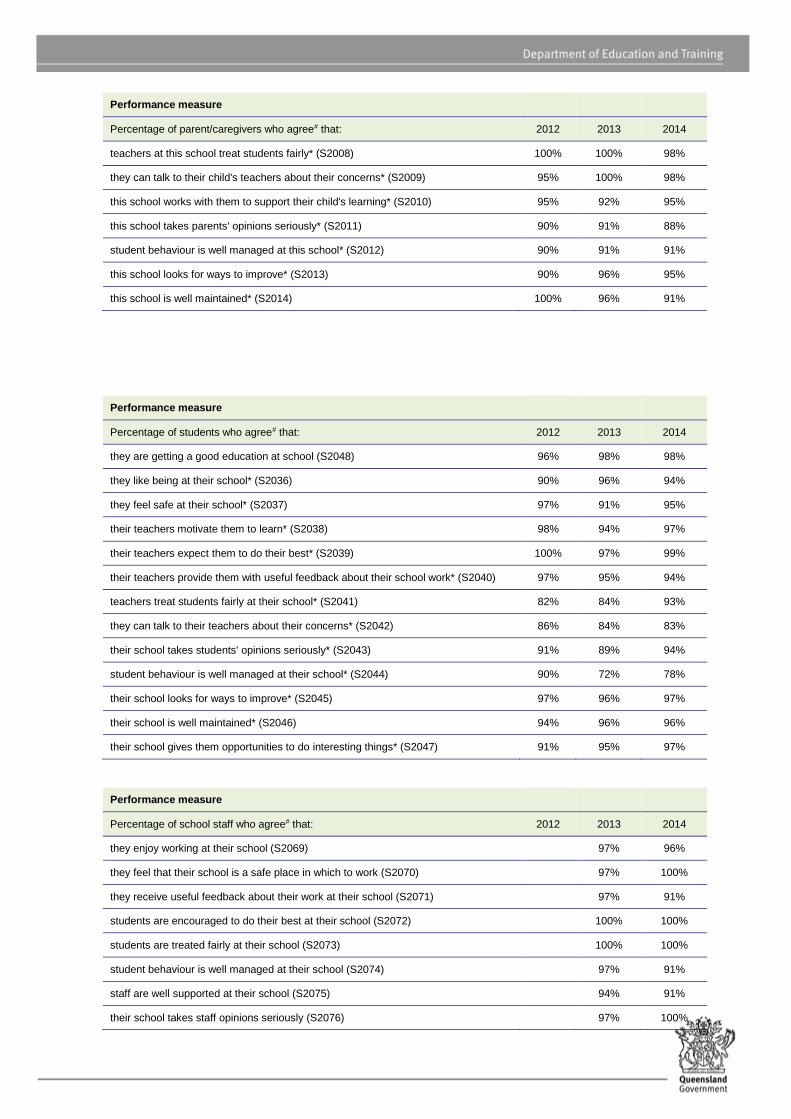
Performance measure
Percentage of parent/caregivers who agree# that: 2012 2013 2014
their child is getting a good education at school (S2016) 95% 96% 96%
this is a good school (S2035) 95% 96% 96%
their child likes being at this school* (S2001) 100% 92% 100%
their child feels safe at this school* (S2002) 100% 100% 98%
their child's learning needs are being met at this school* (S2003) 90% 92% 97%
their child is making good progress at this school* (S2004) 90% 88% 96%
teachers at this school expect their child to do his or her best* (S2005) 100% 92% 98%
teachers at this school provide their child with useful feedback about his or her school work* (S2006)
95% 100% 97%
teachers at this school motivate their child to learn* (S2007) 100% 92% 100%
Performance measure
Percentage of parent/caregivers who agree# that: 2012 2013 2014
teachers at this school treat students fairly* (S2008) 100% 100% 98%
they can talk to their child's teachers about their concerns* (S2009) 95% 100% 98%
this school works with them to support their child's learning* (S2010) 95% 92% 95%
this school takes parents' opinions seriously* (S2011) 90% 91% 88%
student behaviour is well managed at this school* (S2012) 90% 91% 91%
this school looks for ways to improve* (S2013) 90% 96% 95%
this school is well maintained* (S2014) 100% 96% 91%
Performance measure
Percentage of students who agree# that: 2012 2013 2014
they are getting a good education at school (S2048) 96% 98% 98%
they like being at their school* (S2036) 90% 96% 94%
they feel safe at their school* (S2037) 97% 91% 95%
their teachers motivate them to learn* (S2038) 98% 94% 97%
their teachers expect them to do their best* (S2039) 100% 97% 99%
their teachers provide them with useful feedback about their school work* (S2040) 97% 95% 94%
teachers treat students fairly at their school* (S2041) 82% 84% 93%
they can talk to their teachers about their concerns* (S2042) 86% 84% 83%
their school takes students' opinions seriously* (S2043) 91% 89% 94%
student behaviour is well managed at their school* (S2044) 90% 72% 78%
their school looks for ways to improve* (S2045) 97% 96% 97%
their school is well maintained* (S2046) 94% 96% 96%
their school gives them opportunities to do interesting things* (S2047) 91% 95% 97%
Performance measure
Percentage of school staff who agree# that: 2012 2013 2014
they enjoy working at their school (S2069) 97% 96%
they feel that their school is a safe place in which to work (S2070) 97% 100%
they receive useful feedback about their work at their school (S2071) 97% 91%
students are encouraged to do their best at their school (S2072) 100% 100%
students are treated fairly at their school (S2073) 100% 100%
student behaviour is well managed at their school (S2074) 97% 91%
staff are well supported at their school (S2075) 94% 91%
their school takes staff opinions seriously (S2076) 97% 100%
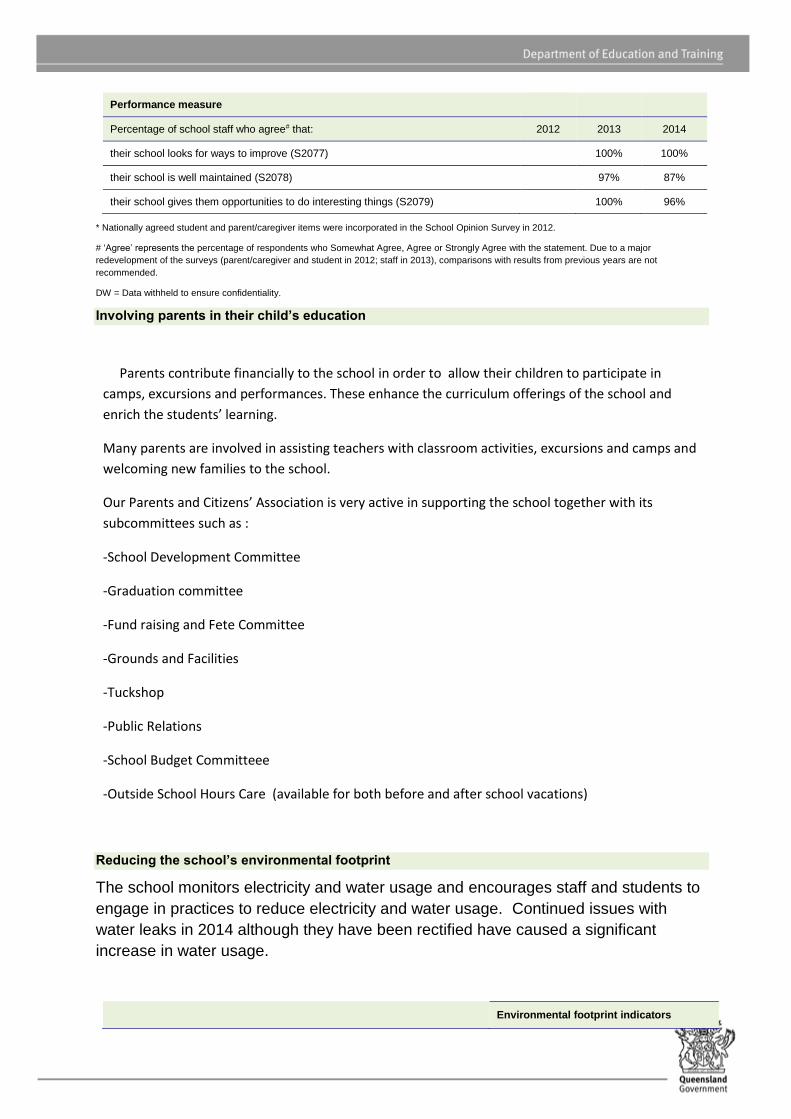
Performance measure
Percentage of school staff who agree# that: 2012 2013 2014
their school looks for ways to improve (S2077) 100% 100%
their school is well maintained (S2078) 97% 87%
their school gives them opportunities to do interesting things (S2079) 100% 96%
* Nationally agreed student and parent/caregiver items were incorporated in the School Opinion Survey in 2012.
# ‘Agree’ represents the percentage of respondents who Somewhat Agree, Agree or Strongly Agree with the statement. Due to a major
redevelopment of the surveys (parent/caregiver and student in 2012; staff in 2013), comparisons with results from previous years are not
recommended.
DW = Data withheld to ensure confidentiality.
Involving parents in their child’s education
Parents contribute financially to the school in order to allow their children to participate in
camps, excursions and performances. These enhance the curriculum offerings of the school and
enrich the students’ learning.
Many parents are involved in assisting teachers with classroom activities, excursions and camps and
welcoming new families to the school.
Our Parents and Citizens’ Association is very active in supporting the school together with its
subcommittees such as :
-School Development Committee
-Graduation committee
-Fund raising and Fete Committee
-Grounds and Facilities
-Tuckshop
-Public Relations
-School Budget Committeee
-Outside School Hours Care (available for both before and after school vacations)
Reducing the school’s environmental footprint
The school monitors electricity and water usage and encourages staff and students to
engage in practices to reduce electricity and water usage. Continued issues with
water leaks in 2014 although they have been rectified have caused a significant
increase in water usage.
Environmental footprint indicators

Years Electricity
kWh Water kL
2011-2012 0 0
2012-2013 170,473 7,407
2013-2014 234,232 5,069
The consumption data is compiled from sources including ERM, Ergon reports and utilities data entered into OneSchool by each school. The data provides an indication of the consumption trend in each of the utility categories which impact on the school’s environmental footprint.
Our staff profile
Staff composition, including Indigenous staff
2014 Workforce Composition Teaching Staff* Non-teaching
Staff Indigenous Staff
Headcounts 40 23 0
Full-time equivalents 33 14 0
Expenditure on and teacher participation in professional development
The total funds expended on teacher professional development in 2014 were $380298.97
The major professional development initiatives are as follows:
One Note Training
CPI Nonviolent Intervention
Fierce Conversations
Beginning Teaching Teachers Workshop
BSM Budget Session
Challenge LPI PD
Cleaners Training Workshop
Cleaners Workshop
SBMAQ Conference
CPR Training
Customer Service
DR ROSE Workshop
HPE Conference
IASE Conference
IPAD Conference
IPAD PD
Leadership Coaching
LOTE
Reading to Learn
Principal Forum
Seminar Guidance Officer
ASOT-The Art & Science of Teaching

Training for Chaplain
Peer Coaching
Average staff attendance 2012 2013 2014
Staff attendance for permanent and temporary staff and school leaders. 95% 96% 96%
Proportion of staff retained from the previous school year
From the end of the previous school year, 94% of staff was retained by the school for the entire 2014 school year.
School income broken down by funding source
School income broken down by funding source is available via the My School website at http://www.myschool.edu.au/.
To access our income details, click on the My School link above. You will then be taken to the My School website with the following ‘Find a school’ text box.
Where it says ‘Search by school name’, type in the name of the school you wish to view, and select <GO>. Read and follow the instructions on the next screen; you will be asked to accept the Terms of Use and Privacy Policy before being given access to the school’s My School entry webpage.
School financial information is available by selecting ‘School finances’ in the menu box in the top left corner of the school’s entry webpage. If you are unable to access the internet, please contact the school for a paper copy of income by funding source.
Performance of our students
Key student outcomes
Student attendance 2012 2013 2014
The overall attendance rate for the students at this school (shown as a percentage). 94% 94% 95%
The overall attendance rate in 2014 for all Queensland Primary schools was 92%.

Student attendance rate for each year level (shown as a percentage)
Year 1 Year 2 Year 3 Year 4 Year 5 Year 6 Year 7 Year 8 Year 9 Year 10
Year 11
Year 12
2012 94% 94% 95% 94% 91% 94% 94%
2013 94% 94% 95% 94% 94% 94% 96%
2014 94% 95% 95% 94% 95% 94% 94%
DW = Data withheld to ensure confidentiality.
Student attendance distribution
The proportions of students by attendance range.
*The method for calculating attendance changed in 2013 – care should be taken when comparing data after 2012 to that of previous years.
Description of how non-attendance is managed by the school
Non-attendance is managed in state schools in line with the DETE policies, SMS-PR-029: Managing
Student Absences and SMS-PR-036: Roll Marking in State Schools, which outline processes for
managing and recording student attendance and absenteeism.
To comply with Education Regulations, parents/guardians are expected to provide a note of
explanation if a child is absent or has to leave school early. At Middle Park it was decided that verbal
messages are not sufficient, except in cases of emergency and parents are requested to send a note
to the class teacher stating the reasons. It is vital to child’s education that attendance be as regular
as possible. If a pattern of absences has been identified the class teacher, deputy principal or the
principal contacts the parent and discuss the reasons for absences by the student. EQ’s brochure on
“Every day counts” has been a valuable discussion point at these meetings.
National Assessment Program – Literacy and Numeracy (NAPLAN) results – our reading,
writing, spelling, grammar and punctuation, and numeracy results for the Years 3, 5, 7, and 9.
Our reading, writing, spelling, grammar and punctuation, and numeracy results for the Years 3, 5, 7 and 9 are available via the My
School website at http://www.myschool.edu.au/.
8
7
6
9
10
8
29
25
29
54
58
57
0% 20% 40% 60% 80% 100%
2012
* 2013
2014
Proportion of Students
Attendance Rate: 0% to <85% 85% to <90% 90% to <95% 95% to 100%
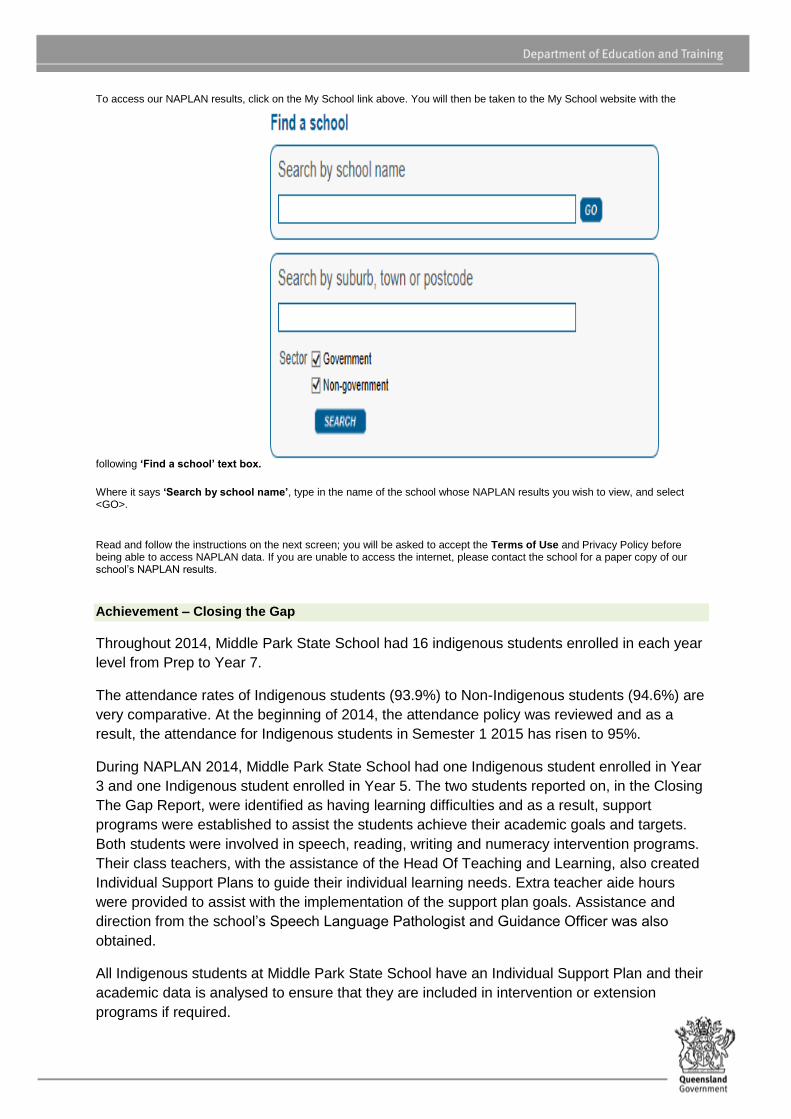
To access our NAPLAN results, click on the My School link above. You will then be taken to the My School website with the
following ‘Find a school’ text box.
Where it says ‘Search by school name’, type in the name of the school whose NAPLAN results you wish to view, and select <GO>.
Read and follow the instructions on the next screen; you will be asked to accept the Terms of Use and Privacy Policy before being able to access NAPLAN data. If you are unable to access the internet, please contact the school for a paper copy of our school’s NAPLAN results.
Achievement – Closing the Gap
Throughout 2014, Middle Park State School had 16 indigenous students enrolled in each year
level from Prep to Year 7.
The attendance rates of Indigenous students (93.9%) to Non-Indigenous students (94.6%) are
very comparative. At the beginning of 2014, the attendance policy was reviewed and as a
result, the attendance for Indigenous students in Semester 1 2015 has risen to 95%.
During NAPLAN 2014, Middle Park State School had one Indigenous student enrolled in Year
3 and one Indigenous student enrolled in Year 5. The two students reported on, in the Closing
The Gap Report, were identified as having learning difficulties and as a result, support
programs were established to assist the students achieve their academic goals and targets.
Both students were involved in speech, reading, writing and numeracy intervention programs.
Their class teachers, with the assistance of the Head Of Teaching and Learning, also created
Individual Support Plans to guide their individual learning needs. Extra teacher aide hours
were provided to assist with the implementation of the support plan goals. Assistance and
direction from the school’s Speech Language Pathologist and Guidance Officer was also
obtained.
All Indigenous students at Middle Park State School have an Individual Support Plan and their
academic data is analysed to ensure that they are included in intervention or extension
programs if required.