
Middle East, North Africa, Afghanistan, and Pakistan ·...
46
1 International Monetary Fund | October 2016 Oil exporters Oil importers Population, millions (2015) GDP per capita, U.S. dollars (2015) Sources: IMF Regional Economic Outlook database; and Microsoft Map Land. Note: The country names and borders on this map do not necessarily reflect the IMF’s official positions. The gray area on the map denotes disputed territory. Middle East, North Africa, Afghanistan, and Pakistan Syria Somalia Morocco 33.5 3,003 Mauritania 3.7 1,312 Algeria 40.0 4,175 Libya 6.3 6,277 Tunisia 11.1 3,923 Jordan 7.6 4,947 Lebanon 4.6 11,157 Egypt 89.0 3,710 Sudan 38.4 2,119 Saudi Arabia 31.4 20,583 Djibouti 1.0 1,788 Iraq 35.2 4,696 Iran 79.5 4,908 Kuwait 4.1 27,756 Yemen 28.3 1,334 Oman 3.8 16,699 Afghanistan 32.0 615 Qatar 2.4 68,940 Pakistan 189.9 ··· United Arab Emirates 9.6 38,650 Bahrain 1.3 24,058 Middle East, North Africa, Afghanistan, and Pakistan
Transcript of Middle East, North Africa, Afghanistan, and Pakistan ·...

1International Monetary Fund | October 2016
Oil exporters
Oil importers
Population, millions (2015)GDP per capita, U.S. dollars (2015)
Sources: IMF Regional Economic Outlook database; and Microsoft Map Land.Note: The country names and borders on this map do not necessarily reflect the IMF’s official positions. The gray area on the map denotes disputed territory.
Middle East, North Africa, Afghanistan, and Pakistan
Syria
Somalia
Morocco33.53,003
Mauritania3.7
1,312
Algeria40.04,175
Libya6.3
6,277
Tunisia11.13,923
Jordan7.6
4,947
Lebanon4.6
11,157
Egypt89.0
3,710
Sudan38.4
2,119
Saudi Arabia31.4
20,583
Djibouti1.0
1,788
Iraq35.2
4,696
Iran79.5
4,908
Kuwait4.1
27,756
Yemen28.3
1,334
Oman3.8
16,699
Afghanistan32.0615
Qatar2.4
68,940
Pakistan189.9
···
United Arab Emirates9.6
38,650
Bahrain1.3
24,058
Middle East, North Africa, Afghanistan, and Pakistan


3International Monetary Fund | October 2016
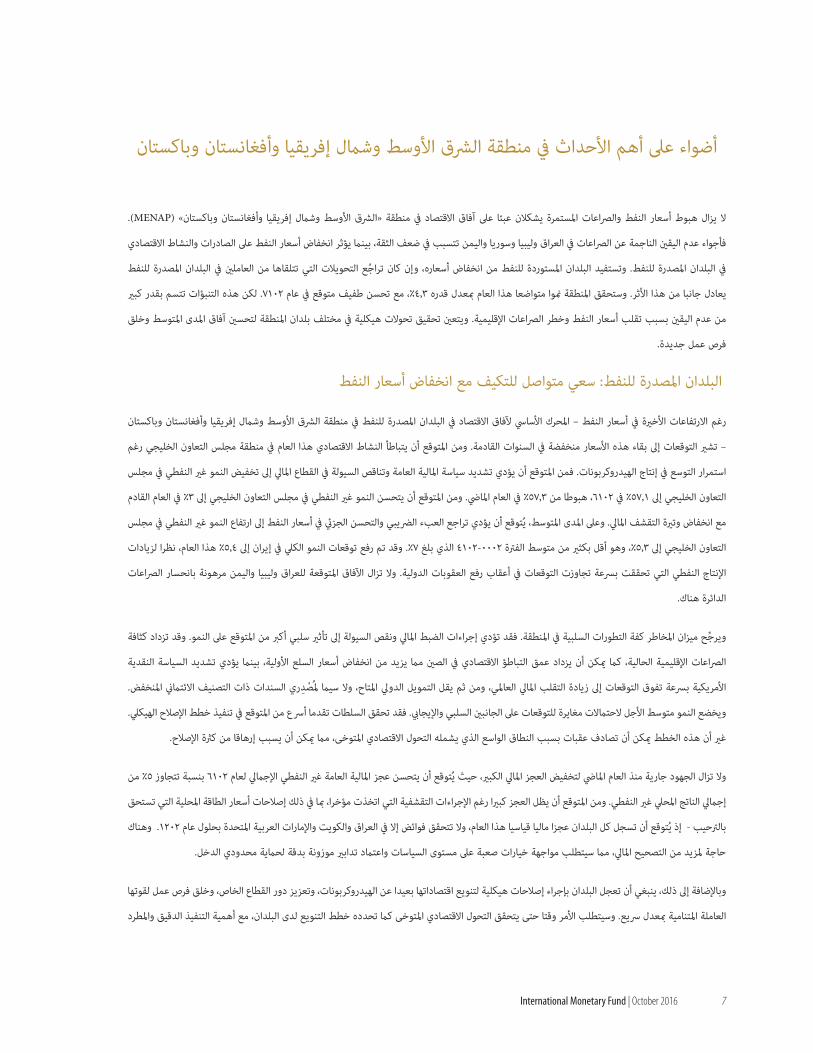
The slump in oil prices and ongoing conflicts continue to weigh on MENAP’s economic outlook. Uncertainties arising from conflicts in Iraq, Libya, Syria, and Yemen are weakening confidence and lower oil prices are taking a toll on exports and economic activity in oil exporters. Oil importers are benefiting from lower oil prices, although declining remittances from oil exporters are partly offsetting these benefits. MENAP growth will be modest at 3½ percent this year, with little improvement expected in 2017. Considerable uncertainty surrounds these forecasts, however, because of the fluctuation in oil prices and the threat of regional conflicts. Structural transformations are needed across the region to raise medium-term prospects and create jobs.
Oil Exporters: Ongoing Adjustment to Cheaper OilDespite recent increases, oil prices—the key driver of the outlook for MENAP oil exporters—are projected to remain low over the coming years. Economic activity in the GCC region is projected to slow this year despite continued expansion in hydrocarbon output. Fiscal tightening and declining liquidity in the financial sector are projected to reduce non-oil growth in the GCC to 1¾ percent in 2016, down from 3¾ percent last year. GCC non-oil growth is projected to pick up to 3 percent next year as the pace of fiscal consolidation eases. Over the medium term, less fiscal drag and a partial recovery in oil prices are projected to raise GCC non-oil growth to 3½ percent, well below the 7 percent average during 2000–14. Headline growth in Iran has been revised up to 4½ percent this year, owing to faster-than-expected increases in oil production following the removal of sanctions. The outlook for Iraq, Libya, and Yemen remains predicated on an easing of conflicts in those countries.
Risks are to the downside. The negative impact of fiscal consolidation and tightening liquidity on growth could be larger than anticipated. Regional conflicts could intensify. A deeper slowdown in China could further weaken commodity prices, while a faster-than-expected U.S. monetary tightening could increase global financial volatility, thereby reducing the availability of international financing, especially for lower-rated issuers. Risks to medium-term growth are double-sided. Authorities could make faster-than-expected progress in implementing structural reform plans. However, considering the scope of the envisaged economic transformation, such plans could run into obstacles, which could lead to reform fatigue.
The significant deficit-reduction efforts which began last year are continuing, with the aggregate 2016 non-oil fiscal deficit expected to improve by more than 5 percent of non-oil GDP. Despite recent consolidation measures, including welcome reforms to domestic energy prices, deficits are projected to remain large—all countries are anticipated to record fiscal deficits this year, and only Iraq, Kuwait, and the United Arab Emirates are set to post surpluses by 2021. Further fiscal adjustment is needed, which will require difficult policy choices and the adoption of well-calibrated measures to protect the vulnerable.
Additionally, countries need to accelerate structural reforms to diversify their economies away from hydrocarbons, boost the role of the private sector, and create jobs for their rapidly growing labor forces. The envisaged economic transformation, as reflected in country diversification plans, will take time. Careful and steady implementation will be key to success. As economic diversification proceeds, new skills will be required for new and existing workers to succeed. Upgrades to education and training programs should focus on reducing skill mismatches, while anticipating future needs of the private sector.
MENAP Region Highlights

4
REGIONAL ECONOMIC OUTLOOK: MIDDLE EAST AND CENTRAL ASIA
International Monetary Fund | October 2016
Oil Importers: Striving to Foster Inclusive Growth in a Challenging EnvironmentRecent reforms and lower oil prices have helped improve macroeconomic stability in the oil-importing countries in the region. Yet growth remains weak and fragile, projected to be 3½ percent this year before strengthening to 4¼ percent in 2017. Continued progress in reforms, lower fiscal drag, and stronger external demand, especially from the euro area, are expected to support the recovery. However, amid lingering structural impediments, medium-term growth is likely to remain too low to tackle high unemployment and improve inclusiveness.
Furthermore, risks cloud this outlook. Slow improvement in job creation and living standards could aggravate sociopolitical frictions, and setbacks to political transitions and reform implementation could undermine the recovery. Escalation of regional conflicts could intensify adverse spillovers. Tighter global financial conditions—amid China’s rebalancing, the normalization of U.S. interest rates, and/or the fallout from Brexit—could reduce the availability of financing. On the upside, exports could rise faster if, for example, more progress is made on
trade pacts with the European Union. China’s rebalancing may also expand opportunities for consumption-oriented exports.
Stepping up reform momentum is crucial in this challenging environment. Energy subsidy reforms and revenue-enhancing initiatives have created more room for spending on infrastructure, health, and education, as well as targeted social assistance. Yet investment and productivity growth are still too low to boost growth, fiscal space is limited by high debt service costs and large wage bills, and, in some cases, external vulnerabilities are still high. Continued fiscal consolidation is needed to improve public debt profiles and strengthen buffers. It can focus on targeted revenue measures—eliminating tax exemptions, making income taxes more progressive, and strengthening tax collection—as well as the continued reprioritization of spending from general energy subsidies toward targeted social assistance, investment, and other growth-enhancing areas. Greater exchange rate flexibility would help enhance competitiveness. Structural reforms—especially in the areas of business, trade, and labor and financial markets—are needed to foster private sector expansion and job creation.

5
MENAP REGION HIGHLIGHTS
International Monetary Fund | October 2016
MENAP Region: Selected Economic Indicators, 2000–17(Percent of GDP, unless otherwise indicated)
ProjectionsAverage
2012 2013 2014 2015 2016 2017MENAP1
Real GDP (annual growth) 5.2 2.4 2.7 2.3 3.4 3.4Current Account Balance 9.2 10.1 5.1 –4.0 –4.6 –2.6Overall Fiscal Balance 2.8 0.0 –2.9 –8.8 –8.5 –6.0Inflation, p.a. (annual growth) 6.8 10.0 6.9 5.9 5.6 6.1
MENAP Oil Exporters
Real GDP (annual growth) 5.4 2.0 2.7 1.6 3.3 2.9Current Account Balance 13.4 15.1 8.3 –3.8 –4.4 –1.8Overall Fiscal Balance 6.7 4.3 –0.7 –9.5 –9.2 –6.2Inflation, p.a. (annual growth) 7.5 10.4 5.8 5.5 4.7 4.2
Of which: Gulf Cooperation Council (GCC)
Real GDP (annual growth) 5.1 3.1 3.3 3.4 1.7 2.3Current Account Balance 17.0 21.4 13.6 -2.4 -3.7 -0.5Overall Fiscal Balance 10.8 10.8 3.1 -9.4 -9.8 -6.9Inflation, p.a. (annual growth) 2.8 2.8 2.6 2.5 3.6 2.6
MENAP oil importers
Real GDP (annual growth) 4.6 3.2 2.9 3.8 3.6 4.2Current Account Balance –2.5 –5.1 –4.4 –4.5 –4.8 –4.7Overall Fiscal Balance –5.2 –9.4 –7.8 –7.3 –7.0 –5.8Inflation, p.a. (annual growth) 5.5 9.1 9.4 6.6 7.4 9.8
MENA1
Real GDP (annual growth) 5.3 2.2 2.6 2.1 3.2 3.2Current Account Balance 10.0 10.9 5.6 –4.4 –5.0 –2.8Overall Fiscal Balance 3.7 0.9 –2.7 –9.3 –9.1 –6.4Inflation, p.a. (annual growth) 6.6 10.3 6.8 6.1 6.0 6.2
MENA oil importers
Real GDP (annual growth) 4.6 2.9 2.3 3.8 3.1 3.8Current Account Balance –3.2 –7.1 –5.9 –6.2 –6.7 –6.3Overall Fiscal Balance –5.7 –10.2 –9.5 –8.6 –8.6 –7.1Inflation, p.a. (annual growth) 4.1 10.1 9.9 8.0 9.9 12.3
Sources: National authorities; and IMF staff calculations and projections.Note: Data refer to the fiscal year for the following countries: Afghanistan (March 21/March 20) until 2011, and December 21/December 20 thereaf-ter, Iran (March 21/March 20), and Egypt and Pakistan (July/June). MENAP oil exporters: Algeria, Bahrain, Iran, Iraq, Kuwait, Libya, Oman, Qatar, Saudi Arabia, the United Arab Emirates, and Yemen. GCC countries: Bahrain, Kuwait, Oman, Qatar, Saudi Arabia, and the United Arab Emirates. MENAP oil importers: Afghanistan, Djibouti, Egypt, Jordan, Lebanon, Mauritania, Morocco, Pakistan, Sudan, Syria, and Tunisia. MENA: MENAP excluding Afghani-stan and Pakistan. 12011–17 data exclude Syrian Arab Republic.

7
International Monetary Fund | October 2016
.)MENAP( »النفط والرصاعات املستمرة يشكالن عبئا عىل آفاق االقتصاد يف منطقة »الرشق األوسط وشامل إفريقيا وأفغانستان وباكستان ال يزال هبوط أسعار
فأجواء عدم اليقني الناجمة عن الرصاعات يف العراق وليبيا وسوريا واليمن تتسبب يف ضعف الثقة، بينام يؤثر انخفاض أسعار النفط عىل الصادرات والنشاط االقتصادي
يف البلدان املصدرة للنفط. وتستفيد البلدان املستوردة للنفط من انخفاض أسعاره، وإن كان تراجع التحويالت التي تتلقاها من العاملني يف البلدان املصدرة للنفط
يعادل جانبا من هذا األثر. وستحقق املنطقة منوا متواضعا هذا العام مبعدل قدره 4.3%، مع تحسن طفيف متوقع يف عام 7102. لكن هذه التنبؤات تتسم بقدر كبري
من عدم اليقني بسبب تقلب أسعار النفط وخطر الرصاعات اإلقليمية. ويتعني تحقيق تحوالت هيكلية يف مختلف بلدان املنطقة لتحسني آفاق املدى املتوسط وخلق
فرص عمل جديدة.
البلدان املصدرة للنفط: سعي متواصل للتكيف مع انخفاض أسعار النفط
رغم االرتفاعات األخرية يف أسعار النفط – املحرك األسايس آلفاق االقتصاد يف البلدان املصدرة للنفط يف منطقة الرشق األوسط وشامل إفريقيا وأفغانستان وباكستان
– تشري التوقعات إىل بقاء هذه األسعار منخفضة يف السنوات القادمة. ومن املتوقع أن يتباطأ النشاط االقتصادي هذا العام يف منطقة مجلس التعاون الخليجي رغم
استمرار التوسع يف إنتاج الهيدروكربونات. فمن املتوقع أن يؤدي تشديد سياسة املالية العامة وتناقص السيولة يف القطاع املايل إىل تخفيض النمو غري النفطي يف مجلس
التعاون الخليجي إىل 57.1% يف 6102، هبوطا من 57.3% يف العام املايض. ومن املتوقع أن يتحسن النمو غري النفطي يف مجلس التعاون الخليجي إىل 3% يف العام القادم
مع انخفاض وترية التقشف املايل. وعىل املدى املتوسط، يتوقع أن يؤدي تراجع العبء الرضيبي والتحسن الجزيئ يف أسعار النفط إىل ارتفاع النمو غري النفطي يف مجلس
التعاون الخليجي إىل 5.3%، وهو أقل بكثري من متوسط الفرتة 0002-4102 الذي بلغ 7%. وقد تم رفع توقعات النمو الكيل يف إيران إىل 5.4% هذا العام، نظرا لزيادات
اإلنتاج النفطي التي تحققت برسعة تجاوزت التوقعات يف أعقاب رفع العقوبات الدولية. وال تزال اآلفاق املتوقعة للعراق وليبيا واليمن مرهونة بانحسار الرصاعات
الدائرة هناك.
ح ميزان املخاطر كفة التطورات السلبية يف املنطقة. فقد تؤدي إجراءات الضبط املايل ونقص السيولة إىل تأثري سلبي أكرب من املتوقع عىل النمو. وقد تزداد كثافة ويرج
الرصاعات اإلقليمية الحالية، كام ميكن أن يزداد عمق التباطؤ االقتصادي يف الصني مام يزيد من انخفاض أسعار السلع األولية، بينام يؤدي تشديد السياسة النقدية
األمريكية برسعة تفوق التوقعات إىل زيادة التقلب املايل العاملي، ومن ثم يقل التمويل الدويل املتاح، وال سيام ملصدري السندات ذات التصنيف االئتامين املنخفض.
ويخضع النمو متوسط األجل الحتامالت مغايرة للتوقعات عىل الجانبني السلبي واإليجايب. فقد تحقق السلطات تقدما أرسع من املتوقع يف تنفيذ خطط اإلصالح الهيكيل.
غري أن هذه الخطط ميكن أن تصادف عقبات بسبب النطاق الواسع الذي يشمله التحول االقتصادي املتوخى، مام ميكن أن يسبب إرهاقا من كرثة اإلصالح.
وال تزال الجهود جارية منذ العام املايض لتخفيض العجز املايل الكبري، حيث يتوقع أن يتحسن عجز املالية العامة غري النفطي اإلجاميل لعام 6102 بنسبة تتجاوز 5% من
إجاميل الناتج املحيل غري النفطي. ومن املتوقع أن يظل العجز كبريا رغم اإلجراءات التقشفية التي اتخذت مؤخرا، مبا يف ذلك إصالحات أسعار الطاقة املحلية التي تستحق
بالرتحيب - إذ يتوقع أن تسجل كل البلدان عجزا ماليا قياسيا هذا العام، وال تتحقق فوائض إال يف العراق والكويت واإلمارات العربية املتحدة بحلول عام 1202. وهناك
حاجة ملزيد من التصحيح املايل، مام سيتطلب مواجهة خيارات صعبة عىل مستوى السياسات واعتامد تدابري موزونة بدقة لحامية محدودي الدخل.
وباإلضافة إىل ذلك، ينبغي أن تعجل البلدان بإجراء إصالحات هيكلية لتنويع اقتصاداتها بعيدا عن الهيدروكربونات، وتعزيز دور القطاع الخاص، وخلق فرص عمل لقوتها
العاملة املتنامية مبعدل رسيع. وسيتطلب األمر وقتا حتى يتحقق التحول االقتصادي املتوخى كام تحدده خطط التنويع لدى البلدان، مع أهمية التنفيذ الدقيق واملطرد
أضواء عىل أهم األحداث يف منطقة الرشق األوسط وشامل إفريقيا وأفغانستان وباكستان

8
REGIONAL ECONOMIC OUTLOOK: MIDDLE EAST AND CENTRAL ASIA
International Monetary Fund | October 2016
كمفتاح للنجاح. ومع التقدم يف تنويع االقتصاد، ستظهر الحاجة ملهارات جديدة تهيئ سبيل النجاح للعاملة الجديدة والحالية. وعند تحديث برامج التعليم والتدريب
ينبغي الرتكيز عىل الحد من عدم اتساق املهارات مع متطلبات سوق العمل، مع استرشاف االحتياجات املستقبلية للقطاع الخاص.
البلدان املستوردة للنفط: سعي حثيث لتعزيز النمو االحتوايئ يف بيئة محفوفة بالتحديات
ساعدت اإلصالحات وانخفاض أسعار النفط مؤخرا عىل تحسني استقرار االقتصاد الكيل يف البلدان املستوردة للنفط يف املنطقة. لكن النمو ال يزال ضعيفا وهشا، حيث
يتوقع أن يبلغ 5.3% هذا العام ثم يرتفع إىل 52.4% يف 7102. ومن املتوقع أن يتعزز التعايف الجاري بدعم من التقدم املستمر يف اإلصالحات املخططة، وانخفاض العبء
الرضيبي، وزيادة الطلب الخارجي، وخاصة من منطقة اليورو. غري أن املعوقات الهيكلية الباقية من املرجح أن تبقي النمو منخفضا عىل املدى املتوسط بدرجة ال تساعد
عىل معالجة البطالة املرتفعة وتعزيز احتوائية النمو.
وباإلضافة إىل ذلك، تخيم عىل اآلفاق بعض املخاطر. فبطء التحسن يف خلق فرص العمل ومستويات املعيشة ميكن أن يفاقم االحتكاكات االجتامعية-السياسية، كام
ميكن أن يضعف التعايف الجاري إذا حدثت نكسات يف عمليات التحول السيايس ومسرية تنفيذ اإلصالحات. وقد يتسبب احتدام الرصاعات اإلقليمية يف تكثيف التداعيات
املعاكسة. كذلك ميكن أن ينخفض التمويل املتاح بسبب ضيق األوضاع املالية العاملية – يف سياق جهود الصني الستعادة توازن النمو، وعودة أسعار الفائدة األمريكية
إىل مستوياتها الطبيعية، و/أو تداعيات خروج بريطانيا من االتحاد األورويب. ومن حيث احتامالت تجاوز التوقعات، ميكن أن تزداد الصادرات برسعة أكرب من املتوقع
إذا ما حدث تقدم يف املعاهدات التجارية مع االتحاد األورويب عىل سبيل املثال. وقد تتسع أيضا فرص التصدير املوجه لالستهالك مع استعادة توازن النمو يف الصني.
ومن الرضوري تعجيل زخم اإلصالح يف هذه البيئة املليئة بالتحديات. وقد أتاحت إصالحات دعم الطاقة ومبادرات زيادة اإليرادات مساحة أكرب لإلنفاق عىل البنية
يزال النمو، وال بدعم أبطأ مام يسمح تزال االستثامر واإلنتاجية ال زيادة لكن للمستحقني. املوجهة االجتامعية املساعدات إىل باإلضافة والتعليم، التحتية والصحة
الحيز املايل محدودا بسبب ارتفاع تكاليف خدمة الدين وضخامة فاتورة األجور، كام أن مواضع االنكشاف للمخاطر الخارجية ال تزال كبرية يف بعض الحاالت. وهناك
حاجة لضبط أوضاع املالية العامة من أجل تحسني مواصفات الدين العام وتعزيز االحتياطيات الوقائية. وميكن الرتكيز يف هذا السياق عىل اإلجراءات املوجهة املتعلقة
باإليرادات – إلغاء اإلعفاءات الرضيبية، وزيادة تصاعدية رضائب الدخل، وتعزيز التحصيل الرضيبي – إىل جانب االستمرار يف إعادة ترتيب أولويات اإلنفاق بتحويل
الرتكيز من دعم الطاقة املعمم إىل املساعدات االجتامعية املوجهة للمستحقني واالستثامرات وغريها من املجاالت الداعمة للنمو. ومن شأن زيادة مرونة أسعار الرصف
أن تساعد يف دعم التنافسية. وهناك حاجة أيضا إلجراء إصالحات هيكلية – وخاصة يف مجاالت األعامل والتجارة وسوق العمل واألسواق املالية – لتشجيع توسع القطاع
الخاص وخلق فرص العمل.

9
MENAP REGION HIGHLIGHTS
International Monetary Fund | October 2016
منطقة الرشق األوسط وشامل إفريقيا وأفغانستان وباكستان: مؤرشات اقتصادية مختارة، 1702-0002
)% من إجاميل الناتج املحيل، ما مل يذكر خالف ذلك(
توقعاتمتوسط
2000-201220132014201520162017
منطقة الرشق األوسط وشامل إفريقيا وأفغانستان وباكستان1
5.22.42.72.33.43.4إجاميل الناتج املحيل الحقيقي )النمو السنوي(
2.6-4.6-4.0-9.210.15.1رصيد الحساب الجاري
6.0-8.5-8.8-2.9-2.80.0رصيد املالية العامة الكيل
6.810.06.95.95.66.1التضخم، متوسط سنوي )النمو السنوي(
البلدان املصدرة للنفط يف الرشق األوسط وشامل إفريقيا وأفغانستان وباكستان
5.42.02.71.63.32.9إجاميل الناتج املحيل الحقيقي )النمو السنوي(
1.8-4.4-3.8-13.415.18.3رصيد الحساب الجاري
6.2-9.2-9.5-0.7-6.74.3رصيد املالية العامة الكيل
7.510.45.85.54.74.2التضخم، متوسط سنوي )النمو السنوي(
منها: دول مجلس التعاون الخليجي
5.13.13.33.41.72.3إجاميل الناتج املحيل الحقيقي )النمو السنوي(
0.5-3.7-2.4-17.021.413.6رصيد الحساب الجاري
6.9-9.8-9.4-10.810.83.1رصيد املالية العامة الكيل
2.82.82.62.53.62.6التضخم، متوسط سنوي )النمو السنوي(
البلدان املستوردة للنفط يف الرشق األوسط وشامل إفريقيا وأفغانستان وباكستان
4.63.22.93.83.64.2إجاميل الناتج املحيل الحقيقي )النمو السنوي(
4.7-4.8-4.5-4.4-5.1-2.5-رصيد الحساب الجاري
5.8-7.0-7.3-7.8-9.4-5.2-رصيد املالية العامة الكيل
5.59.19.46.67.49.8التضخم، متوسط سنوي )النمو السنوي(
منطقة الرشق األوسط وشامل إفريقيا1
5.32.22.62.13.23.2إجاميل الناتج املحيل الحقيقي )النمو السنوي(
2.8-5.0-4.4-10.010.95.6رصيد الحساب الجاري
6.4-9.1-9.3-2.7-3.70.9رصيد املالية العامة الكيل
6.610.36.86.16.06.2التضخم، متوسط سنوي )النمو السنوي(
البلدان املستوردة للنفط يف الرشق األوسط وشامل إفريقيا
6.3-6.7-6.2-5.9-7.1-3.2-رصيد الحساب الجاري
7.1-8.6-8.6-9.5-10.2-5.7-رصيد املالية العامة الكيل
4.110.19.98.09.912.3التضخم، متوسط سنوي )النمو السنوي(
املصادر: السلطات الوطنية، وحسابات وتوقعات خرباء صندوق النقد الدويل.
1 بيانات 1102-7102 ال تتضمن الجمهورية العربية السورية.
ملحوظة: تشري البيانات إىل السنة املالية لكل من البلدان التالية: أفغانستان )12 مارس/02 مارس( حتى عام 1102، و12 ديسمرب/02 ديسمرب بعد ذلك، وإيران )12 مارس/ 02 مارس(، ومرص وباكستان )يوليو/يونيو(.
البلدان املصدرة للنفط يف الرشق األوسط وشامل إفريقيا وأفغانستان وباكستان تشمل: الجزائر والبحرين وإيران والعراق والكويت وليبيا وعامن وقطر واململكة العربية السعودية واإلمارات العربية املتحدة واليمن.
دول مجلس التعاون الخليجي تشمل: البحرين والكويت وعامن وقطر واململكة العربية السعودية واإلمارات العربية املتحدة.
البلدان املستوردة للنفط يف الرشق األوسط وشامل إفريقيا وأفغانستان وباكستان تشمل: أفغانستان وجيبويت ومرص واألردن ولبنان وموريتانيا واملغرب وباكستان والسودان وسوريا وتون
)MENA( : .بلدان الرشق األوسط وشامل إفريقيا، باستثناء أفغانستان وباكستان
)MENAP( : .مجموعة البلدان التي تضم بلدان الرشق األوسط وشامل إفريقيا وأفغانستان وباكستان


11International Monetary Fund | October 2016
La chute des prix du pétrole et les conflits en cours continuent de peser sur les perspectives économiques de la région MOANAP. Les incertitudes découlant des conflits en Iraq, en Libye, en Syrie et au Yémen minent la confiance et les bas prix du pétrole ont des conséquences néfastes sur les exportations et l’activité économique des pays exportateurs de pétrole. Les pays importateurs profitent, quant à eux, des possibilités offertes par le faible coût du pétrole, bien que la baisse des envois de fonds originaires des pays exportateurs annule en partie leurs gains. La croissance de la région MOANAP sera modeste cette année, à 3½ %, et elle ne devrait guère progresser en 2017. Des incertitudes importantes entourent, toutefois, ces prévisions en raison des fluctuations des prix du pétrole et des menaces que représentent les conflits régionaux. Des transformations structurelles dans toute la région sont nécessaires afin d’améliorer les perspectives à moyen terme et de créer des emplois.
Pays exportateurs de pétrole : s’adapter à un pétrole moins cher Malgré de récentes augmentations, le prix du pétrole — principal déterminant des perspectives des pays exportateurs de la région MOANAP — devrait se maintenir à un niveau faible dans les prochaines années. L’activité économique des pays du CCG devrait ralentir cette année en dépit d’une hausse constante de la production d’hydrocarbures. Le rééquilibrage budgétaire et l’assèchement de la liquidité dans le secteur financier devraient faire baisser la croissance hors pétrole dans ces pays à 1¾ % en 2016, contre 3¾ % l’année dernière. Elle devrait rebondir à 3 % l’an prochain avec le ralentissement du rythme de l’assainissement budgétaire. À moyen terme, la modération du frein budgétaire et un redressement partiel des prix du pétrole devraient porter la croissance hors pétrole des pays du CCG à 3½ %, bien en deçà du taux moyen de 7 % observé sur la période 2000-14. La croissance globale en Iran a été révisée à la hausse et devrait atteindre 4½ % cette année, en raison de l’augmentation plus rapide que prévue de la production de pétrole suite à la levée des sanctions. Les perspectives pour l’Iraq, la Libye et le Yémen restent tributaires d’un apaisement des conflits qui sévissent dans ces pays.
Les risques sont de nature baissière. L’effet négatif de l’assainissement des finances publiques et du resserrement de la liquidité sur la croissance pourrait être plus important qu’escompté. Les conflits régionaux pourraient s’intensifier. En outre, un ralentissement plus marqué de l’activité économique en Chine pourrait faire baisser davantage le prix des produits de base, tandis qu’un durcissement de la politique monétaire aux États-Unis plus rapide que prévu pourrait amplifier la volatilité financière mondiale, et ainsi limiter l’accès au financement international, en particulier pour les émetteurs moins bien notés. Quant aux risques à moyen terme, ils sont à la fois baissiers et haussiers. Les autorités pourraient accomplir des progrès plus rapides dans la mise en œuvre de leurs plans de réformes structurelles. Toutefois, étant donné la portée de la transformation économique prévue, ces plans pourraient rencontrer des obstacles, ce qui risquerait d’entraîner une forme de lassitude à l’égard des réformes.
Les efforts considérables de réduction des déficits déployés depuis l’an dernier se poursuivent et le déficit budgétaire hors pétrole global pour 2016 devrait s’améliorer de plus de 5 % du PIB non pétrolier. Malgré les récentes mesures d’assainissement, dont les réformes salutaires des prix intérieurs de l’énergie, les déficits devraient rester élevés : tous les pays devraient enregistrer des déficits budgétaires cette année, et seuls l’Iraq, le Koweït et les Émirats arabes unis devraient afficher un excédent d’ici 2021. La poursuite du rééquilibrage budgétaire est nécessaire; elle suppose des choix politiques difficiles et l’adoption de mesures bien calibrées pour protéger les populations les plus vulnérables.
Région MOANAP : Principaux points

12
REGIONAL ECONOMIC OUTLOOK: MIDDLE EAST AND CENTRAL ASIA
International Monetary Fund | October 2016
En outre, les pays doivent accélérer leurs réformes structurelles afin de diversifier leur économie pour la rendre moins dépendante des hydrocarbures, renforcer le rôle du secteur privé et créer des emplois pour leur main-d’œuvre en croissance rapide. La transformation économique prévue, telle qu’elle apparaît dans les plans de diversification, prendra du temps. Une mise en œuvre rigoureuse et continue sera un facteur déterminant de réussite. Au fur et à mesure que l’économie se diversifiera, de nouvelles compétences seront nécessaires dans l’intérêt des nouveaux travailleurs et des travailleurs existants. L’amélioration des programmes d’éducation et de formation devrait viser prioritairement à réduire l’inadéquation des qualifications tout en anticipant les besoins futurs du secteur privé.
Pays importateurs de pétrole : promouvoir une croissance inclusive dans une conjoncture délicate Les récentes réformes et le repli des cours du pétrole ont permis aux pays importateurs de pétrole de la région de renforcer leur stabilité macroéconomique. Toutefois, la croissance reste faible et fragile : elle devrait atteindre 3½ % cette année avant de se redresser à 4¼ % en 2017. L’avancement continu des réformes, la modération du frein budgétaire et l’accroissement de la demande extérieure, en particulier de la zone euro, devraient accompagner la reprise. Néanmoins, dans un contexte marqué par la persistance d’obstacles structurels, la croissance à moyen terme restera vraisemblablement trop faible pour remédier au chômage élevé et renforcer l’inclusivité.
En outre, des risques assombrissent ces perspectives. La lenteur des créations d’emploi et de l’amélioration des conditions de vie pourrait aggraver les tensions sociopolitiques, et les revers des transitions politiques et de la mise en œuvre des réformes pourraient compromettre la reprise. L’aggravation des conflits régionaux pourrait amplifier les répercussions négatives. Enfin, le durcissement des conditions financières mondiales, dans un contexte marqué par le rééquilibrage de la Chine, la normalisation des taux d’intérêt aux États-Unis et les retombées du Brexit, pourrait limiter l’accès au financement. En revanche, les exportations pourraient augmenter plus rapidement si, par exemple, davantage de progrès étaient accomplis en matière d’accords commerciaux avec l’Union européenne. Le rééquilibrage de l’économie chinoise pourrait en outre élargir les débouchés pour les exportations de biens de consommation.
L’intensification de la dynamique des réformes est cruciale dans cette conjoncture difficile. Les réformes des subventions énergétiques et les mesures en faveur de l’accroissement des recettes ont donné plus de latitude aux pouvoirs publics pour réaliser des dépenses dans les infrastructures, la santé et l’éducation ainsi que pour mettre en place des politiques d’aide sociale ciblées. Cependant, l’investissement et la croissance de la productivité sont trop faibles pour stimuler la croissance, la marge de manœuvre budgétaire est limitée par le coût élevé du service de la dette et le poids de la masse salariale et dans certains cas les vulnérabilités externes restent fortes. Il est nécessaire de poursuivre l’assainissement des finances publiques afin d’améliorer le profil de la dette publique et de renforcer la marge de manœuvre disponible. Cet assainissement peut mettre l’accent sur des mesures ciblées en matière de recettes — suppression des exonérations fiscales, progressivité accrue des impôts sur le revenu et renforcement du recouvrement de l’impôt — ainsi que sur la poursuite de la redéfinition des priorités en matière de dépenses, en délaissant les subventions énergétiques universelles au profit de l’aide sociale ciblée, de l’investissement et d’autres domaines porteurs de croissance. Une plus grande flexibilité des taux de change permettrait de renforcer la compétitivité. Enfin, des réformes structurelles, en particulier dans les domaines de l’entreprise, du commerce et des marchés du travail et de la finance, sont nécessaires pour favoriser l’expansion du secteur privé et la création d’emploi.

13
MENAP REGION HIGHLIGHTS
International Monetary Fund | October 2016
Région MOANAP : principaux indicateurs économiques, 2000–17(Pourcentage du PIB, sauf indication contraire)
Moyenne Projections2000–12 2013 2014 2015 2016 2017
MOANAP1
PIB réel (croissance annuelle) 5.2 2.4 2.7 2.3 3.4 3.4
Solde des transactions courantes 9.2 10.1 5.1 –4.0 –4.6 –2.6
Solde budgétaire global 2.8 0.0 –2.9 –8.8 –8.5 –6.0
Inflation (progression annuelle) 6.8 10.0 6.9 5.9 5.6 6.1
Exportateurs de pétrole de la région MOANAP
PIB réel (croissance annuelle) 5.4 2.0 2.7 1.6 3.3 2.9
Solde des transactions courantes 13.4 15.1 8.3 –3.8 –4.4 –1.8
Solde budgétaire global 6.7 4.3 –0.7 –9.5 –9.2 –6.2
Inflation (progression annuelle) 7.5 10.4 5.8 5.5 4.7 4.2
Dont : Conseil de coopération du Golfe (CCG)
PIB réel (croissance annuelle) 5.1 3.1 3.3 3.4 1.7 2.3
Solde des transactions courantes 17.0 21.4 13.6 –2.4 –3.7 –0.5
Solde budgétaire global 10.8 10.8 3.1 –9.4 –9.8 –6.9
Inflation (progression annuelle) 2.8 2.8 2.6 2.5 3.6 2.6
Importateurs de pétrole de la région MOANAP
PIB réel (croissance annuelle) 4.6 3.2 2.9 3.8 3.6 4.2
Solde des transactions courantes –2.5 –5.1 –4.4 –4.5 –4.8 –4.7
Solde budgétaire global –5.2 –9.4 –7.8 –7.3 –7.0 –5.8
Inflation (progression annuelle) 5.5 9.1 9.4 6.6 7.4 9.8
MOAN1
PIB réel (croissance annuelle) 5.3 2.2 2.6 2.1 3.2 3.2
Solde des transactions courantes 10.0 10.9 5.6 –4.4 –5.0 –2.8
Solde budgétaire global 3.7 0.9 –2.7 –9.3 –9.1 –6.4
Inflation (progression annuelle) 6.6 10.3 6.8 6.1 6.0 6.2
Importateurs de pétrole de la région MOAN
PIB réel (croissance annuelle) 4.6 2.9 2.3 3.8 3.1 3.8
Solde des transactions courantes –3.2 –7.1 –5.9 –6.2 –6.7 –6.3
Solde budgétaire global –5.7 –10.2 –9.5 –8.6 –8.6 –7.1
Inflation (progression annuelle) 4.1 10.1 9.9 8.0 9.9 12.3
Sources : autorités nationales; calculs et projections des services du FMI.1Les données relatives à la période 2011-17 excluent la République arabe syrienne.Note : Les données se rapportent aux exercices pour les pays suivants : Afghanistan (21 mars/20 mars jusqu’en 2011 et 21 décembre/20 décembre par la suite), Iran (21 mars/20 mars) et Égypte et Pakistan (juillet/juin).Pays exportateurs de pétrole de la région MOANAP : Algérie, Arabie saoudite, Bahreïn, Émirats arabes unis, Iran, Iraq, Koweït, Libye, Oman, Qatar et Yémen.Pays du CCG : Arabie saoudite, Bahreïn, Émirats arabes unis, Koweït, Oman et Qatar.Pays importateurs de pétrole de la région MOANAP : Afghanistan, Djibouti, Égypte, Jordanie, Liban, Maroc, Mauritanie, Pakistan, Soudan, Syrie et Tunisie.


15International Monetary Fund | October 2016
Middle East, North Africa, Afghanistan, and Pakistan (MENAP) oil exporters continue to face an excep-tionally challenging environment as low oil prices and conflicts continue to weigh on economic activity, fiscal and external balances, and the financial sector. Many have made progress in fiscal consolidation, yet sustained efforts will be required over the medium term to place public finances on a sound footing. Plans to diversify economies away from oil and create jobs for the rapidly growing populations have also been announced. Such economic transformation will take time. Careful and steady imple-mentation of the diversification plans will be key to their success. In addition, policymakers need to remain vigilant about the financial stability risks, especially tightening liquidity and the risk of deteriorating asset quality.
Moderate Oil Price RecoveryOil prices remain the key driver of the outlook for MENAP oil exporters given their high dependence on hydrocarbon budget revenues and exports. Having hit a 10-year low of less than $30 a barrel in January, oil prices have staged a partial recovery to about $40–$50 a barrel, supported by lower output from high-cost oil fields and supply disruptions in Canada and Nigeria, which have outweighed substantial production increases in Iran and Iraq.
However, despite this rebound, the oil market outlook has not fundamentally changed since the April 2016 Regional Economic Outlook: Middle East and Central Asia Update (MCD REO Update) Oil prices are assumed to average $43 a barrel in 2016 and $51 a barrel in 2017. Over the medium term, any further oil price recovery is expected to be limited, with futures markets suggesting prices will remain below $60 by 2021 (Figure 1.1). However, considerable uncertainty surrounds
Prepared by Bruno Versailles (lead author), Mariana Colacelli, Pilar Garcia-Martinez, and Juan Treviño under the supervision of Martin Sommer. Yufei Cai, Sebastian Herrador, Brian Hiland, and Amir Sadeghi provided research assistance.
the oil price outlook on both the downside and upside, resulting from the global growth risks, sharp swings in the amount of oil supply outages, and ongoing consolidation and efficiency gains in the U.S. shale oil industry.1
Weak Growth Outlook, Muted Price PressuresOverall GDP growth is projected to remain weak, with little change since the April 2016 MCD REO Update—higher-than-expected oil prices will result in smaller budget and external deficits rather than stronger spending. Economic activity in the Gulf Cooperation Council (GCC) region is projected to slow this year despite continued
1Husain and others (2015) discuss the fundamental forces driving the oil price outlook and their global implications.
CurrentApril 2016 MCD REO updateApril 2015 MCD REO updateOctober 2014 MCD REO
0
20
40
60
80
100
120
2009 11 13 15 17 19 21
Sources: Bloomberg, L.P.; and IMF staff calculations.Note: MCD REO = Regional Economic Outlook: Middle East and Central Asia.1Average of U.K. Brent, Dubai Fateh, and West Texas Intermediate crude oil prices.
Figure 1.1. Oil Price1
(U.S. dollars a barrel)
1. MENAP Oil Exporters: Adjustment to Cheaper Oil Continuing

16
REGIONAL ECONOMIC OUTLOOK: MIddLE EAsT ANd CENTRAL AsIA
International Monetary Fund | October 2016
expansion in hydrocarbon output. Non-oil growth is expected to dip from 3¾ percent last year to 1¾ percent in 2016 (Figure 1.2), owing to fiscal consolidation (Box 1.1) and credit constraints due to slowing deposit growth. Next year, non-oil growth is forecast to pick up to 3 percent as the pace of fiscal consolidation eases. Over the medium term, decelerating fiscal consolidation and a partial recovery in oil prices should modestly boost average non-oil growth to about 3½ percent, still well below the 7 percent growth during 2000–14. This sluggish performance will keep a lid on overall growth given the expectations of slow expansion in the hydrocarbon sector. In Algeria, the overall growth slowdown in 2016 will be countered by higher natural gas output, but non-oil growth will remain well below historical norms over the medium term.
Iran’s headline growth has been revised up to 4½ percent this year, owing to faster-than-expected increases in oil production and exports following the unwinding of sanctions. Oil output has risen to 3.6 million barrels per day, resulting in positive spillovers to the non-oil economy, although the recovery in oil output is expected to taper sharply next year as production approaches pre-sanctions levels. The growth dividend from the lifting of sanctions is materializing only gradually, with investors remaining cautious, and reintegration into global financial markets and domestic reforms proceeding slowly.
The outlook for countries in conflict (Iraq, Libya, Yemen) remains predicated on an easing of these conflicts (Box 2.1).2 Despite the recent reduction in ISIL-held territories in Iraq, the medium-term outlook for oil production has been revised down to reflect lower investments in a difficult budget environment and continued security challenges. The recognition by the international community of the Government of National Accord in Libya is yet to translate into improved economic prospects. And a resolution of the conflict in Yemen remains elusive despite ongoing talks.
2Rother and others (2016) discuss the macroeconomic implica-tions of regional conflicts.
The subdued growth prospects will keep underlying inflation low in the GCC region. Although energy price reforms are expected to temporarily push up headline inflation to about 3½ percent this year, inflation is expected to drop back to 2½ percent in 2017. In Algeria, price pressures are projected to increase further this year, owing in part to the weaker dinar and higher domestic energy prices, before moderating. Iran is making further headway in its disinflation program, bringing consumer price increases to single digits for the first time since 2000. Inflation in Iraq will remain low. Shortages, currency depreciation, and monetization of the fiscal deficit have pushed up inflation in both Libya and Yemen.
Overall, growth risks remain tilted to the downside. In particular, the negative impact of fiscal consolidation and tightening liquidity on growth could be greater than expected (see Box 1.1). Regional conflicts and related adverse spillovers could intensify. A substantial growth
Non-oilOilTotal
–15
–10
–5
0
5
10
15
2015 16 17–21
GCC countries
Figure 1.2. Contributions to Real GDP Growth(Percentage change)
Algeria Iran Conflict countries1
15 17–2116 15 17–2116 15 17–2116
Sources: Country authorities; and IMF staff calculations.Note: GCC = Gulf Cooperation Council.1Conflict countries include Iraq, Syria, and Yemen. Libya is excluded from conflictcountries.

17
1. MENAP OIL ExPORTERs: AdjUsTMENT TO ChEAPER OIL CONTINUING
International Monetary Fund | October 2016
slowdown in China would further reduce commodity prices (Chapter 4), while faster-than-expected tightening by the Federal Reserve could increase global financial market volatility, reducing the availability of international financing, especially for the lower-rated oil exporters. Brexit—the June 2016 U.K. referendum result in favor of leaving the European Union—could worsen these effects through an increase in global risk aversion, even though market reaction has generally been contained (Box 1.2). There is also a double-sided risk to growth over the medium term. Authorities could make faster-than-expected progress in implementing structural reform plans. However, considering the scope of the envisaged economic transformation, such plans could run into domestic obstacles, which could, in turn, lead to reform fatigue.
Further Fiscal Adjustment NeededDespite higher oil prices and the adoption of consolidation measures, projected fiscal deficits remain large in both the short and medium term (Figure 1.3). Taking into account announced
fiscal policy measures, all countries are expected to record fiscal deficits this year, and only Iraq, Kuwait, and the United Arab Emirates are projected to post surpluses by 2021. This year’s hydrocarbon budget revenues are projected to be lower by $400 billion compared with 2014. Cumulative fiscal deficits during 2016–21 are forecast to be about $765 billion, down from $1.1 trillion in the April 2016 REO Update.
The significant deficit-reduction efforts which began last year are continuing, with the 2016 non-oil fiscal deficit expected to improve by more than 5 percent of non-oil GDP. Fiscal consolidation is particularly fast in Oman and Saudi Arabia, where non-oil deficits are projected to fall by more than 10 percentage points of non-oil GDP. In 2017, the pace of consolidation is expected to ease to about 1½ percent of non-oil GDP.
To help address the large budget deficits, policymakers have adopted a mix of spending cuts and revenue-raising measures. In particular, they have demonstrated resolve in addressing the politically difficult issue of low domestic fuel prices—all GCC countries, for example, have hiked energy prices over the past couple of years (Box 1.3). Some countries have also started—or are planning—to take measures to rein in the public sector wage bill, including through hiring freezes (Algeria, Iraq, Oman) and streamlining benefits (Oman, Saudi Arabia).3
Despite the remarkable progress so far, most oil exporters face increasingly difficult policy choices to achieve the significant medium-term fiscal adjustment their economies still need. Eliminating this year’s budget deficit would demand an average spending cut of 25 percent. In all MENAP oil exporters, medium-term fiscal balances will fall well short of the levels needed to ensure that an adequate portion of the income from exhaustible oil and gas reserves is saved for future generations (as indicated in Figure 1.4 by the estimated distance to the intergenerationally neutral fiscal balance in 2021). Non-hydrocarbon revenues
3Sommer and others (2015, 2016) discuss the adopted deficit- reduction measures in detail.
GCC (current)
GCC (April 2016MCd REO Update)
Non-GCC (current)
Non-GCC (April 2016MCd REO Update)
Figure 1.3. Overall Fiscal Balance(Percent of GDP)
–15
–10
–5
0
5
10
15
source: IMF staff calculations.Note: GCC = Gulf Cooperation Council; MCd REO = Regional Economic Outlook:Middle East and Central Asia.
211917152013 211917152013–15
–10
–5
0
5
10
15

18
REGIONAL ECONOMIC OUTLOOK: MIddLE EAsT ANd CENTRAL AsIA
International Monetary Fund | October 2016
have the potential to be increased across the region, especially in GCC countries that continue working toward introducing a value-added tax, having already raised some fees, charges, and excises. Iraq aims to broaden the tax base.4 Other policy priorities include additional streamlining of current expenditures, including the public sector wage bill, increasing the efficiency of public investment (Albino-War and others 2014, Sommer and others 2015, 2016), and additional energy price reforms, all while protecting the socially vulnerable.
To reduce any adverse impact on growth, countries should phase in these additional deficit-reduction measures gradually. In addition, they should be embedded in a well-defined, medium-term fiscal framework to ensure steady implementation (IMF 2015a).5 A successful launch
4Jewell and others (2015) identify fairness-enhancing revenue- raising options for MENAP countries.
5More broadly, Lledo and Poplawski-Ribeiro (2013) find that higher quality of fiscal institutions is associated with better imple-mentation of fiscal policy plans.
of complex projects such as the value-added tax will require enhancements to local capacity. A number of MENAP oil exporters are developing or enhancing their policy frameworks, while improving other aspects of their fiscal institutions. Examples include the establishment of macro-fiscal units in Kuwait, Oman, Qatar, and Saudi Arabia, consolidated medium-term expenditure frameworks for health care and education in the United Arab Emirates, the creation of a debt management and liquidity committee in Oman, and a debt management office in Saudi Arabia, as well as enhancing the capacity of the debt management office in Bahrain. As fiscal consolidation proceeds, policymakers are likely to face headwinds given the high rigidity of public expenditures—for example, public wages account for more than a third of total spending in a number of oil exporters. Countries in the top-right quadrant of Figure 1.5 face the biggest challenge as they are not only planning the largest fiscal adjustment, but also facing a high rigidity of spending.
Deficit-financing options—discussed in more detail in Chapter 5—generally include the
Decrease in spending needed to balance 2016 budget(percent change, lhs)Distance to intergenerationally neutral fiscal balance(2021, percent of non-oil GDP, rhs)1
0
5
10
15
20
25
30
35
40
45
50
Figure 1.4. Illustrative Measures of Fiscal Adjustment
Source: IMF staff calculations.Note: Country abbreviations are International Organization for Standardization (ISO) country codes. GCC = Gulf Cooperation Council; lhs = left-hand side; rhs = right-hand side.1This is the gap between the projected nonhydrocarbon primary balance and thedesirable fiscal balance based on a permanent income hypothesis, using oilprices based on futures markets.
0
5
10
15
20
25
BHR KWT OMN QAT SAU UAE ALG IRN IRQ
GCC countries
Algeria
Bahrain
Iran
Iraq
Kuwaitsaudi Arabia
Oman
Qatar
UAE
Yemen
Congo, Rep.
higher rigidity/
Larger
adjustment
Gabon
Indonesia
sudanTrinidad andTobago
Venezuela
–100 60555045403530252015105 65
–5
0
5
10
15
20
25
30
Proj
ecte
d ch
ange
in n
on-o
il pr
imar
y ba
lanc
e 20
15–2
1(P
erce
nt o
f non
-oil
GdP)
Wage bill(Percent of total expenditure and net lending, 2013–15 average)1
Figure 1.5. Fiscal Plans and Fiscal Rigidity
source: IMF staff calculations.Note: The vertical and horizontal lines dividing the chart into four quadrantscorrespond to the median of the respective variables.1For Bahrain and the United Arab Emirates (UAE), the concept used is totalexpense rather than total expenditure and net lending.

19
1. MENAP OIL ExPORTERs: AdjUsTMENT TO ChEAPER OIL CONTINUING
International Monetary Fund | October 2016
drawdown of government financial assets and issuance of domestic and foreign debt. After a significant withdrawal of financial buffers last year, a larger portion of the 2016 fiscal deficits (which amount to about $200 billion) is likely to be covered by issuing debt (Figure 1.6). Bahrain, Oman, Qatar, Saudi Arabia, and the United Arab Emirates (Abu Dhabi) have issued bonds and/or obtained syndicated loans in international markets this year. Such diversification of financing sources is appropriate given the greater absorptive capacity of international markets. This strategy will also help ease pressure on domestic banks to finance the deficits. International financing conditions remain broadly favorable for now, but the risks involved with international financing will need to be managed carefully.
Financing Current Account DeficitsThe oil price drop has brought about large export losses—oil-related receipts are projected to fall by about $435 billion this year compared with 2014. Consequently, the aggregate current account balance is projected to turn from a surplus of 8¼ percent of GDP in 2014 to deficits of 4½ percent of GDP in 2016 and 1¾ percent of GDP in 2017. In the GCC countries, the external adjustment to low oil prices should be accomplished through fiscal consolidation given the long-standing currency pegs and relatively undiversified economies. Countries with a more flexible exchange rate regime can attain some of the external adjustment through exchange rate depreciation, particularly diversified oil exporters.
Last year, Algeria and Saudi Arabia used extensive reserves to finance their current account deficits, while some others drew assets from their sovereign wealth funds (Figure 1.7). Conflict countries also drew down their reserves. The increasing international sovereign debt issuance this year, together with the tapping of international markets by government-related entities and the private sector, will help fund the current account shortfalls. Privatization and
structural reforms to increase participation by foreign investors in the region would further support capital inflows. Saudi Arabia has announced its intention to sell a stake in Aramco, the world’s most valuable oil and gas company, while accelerating capital market reforms to ease access for foreign investors. Oman has drafted a foreign investment law to attract investors. Iraq recently secured official financing from the IMF and other international partners.
Challenging Environment for the Financial SectorThe financial sector has remained resilient following the drop in oil prices, but liquidity has tightened and asset quality is likely to deteriorate. Domestic deposit growth—especially by the government—has slowed significantly, reflecting primarily lower hydrocarbon receipts. The gap between sluggish domestic deposits and robust credit growth has been closed through higher foreign funding, including wholesale. In
Asset drawdown Domestic debt accumulation
Foreign debt accumulation Total deficit
BHR IRQIRNALGKWT1SAUUAEQATOMN LBY
–10%
57%
0
5
10
15
20
Source: IMF staff calculations.Note: Country abbreviations are International Organization for Standardization(ISO) country codes; GCC = Gulf Cooperation Council.1Borrowing beyond the size of the deficit implies that the authorities are buildingbuffers.
Figure 1.6. Projected Financing of Fiscal Deficits(Percent of GDP, 2016)
GCC countries

20
REGIONAL ECONOMIC OUTLOOK: MIddLE EAsT ANd CENTRAL AsIA
International Monetary Fund | October 2016
several GCC countries, rapidly growing foreign liabilities have been the key source of financing for continued credit expansion (Figure 1.8). In Saudi Arabia, robust credit growth has been funded by drawing down excess liquidity held at the Saudi Arabian Monetary Agency and running down foreign assets. Short-term interbank rates have generally increased more than in the United States—the key reference point given the exchange rate pegs or close ties of regional currencies to the U.S. dollar. The slowdown in domestic deposits is likely to constrain credit supply over time and thus undermine the private sector’s ability to pick up the slack from a downsizing public sector, with negative consequences for growth and jobs (Box 1.1). Meanwhile, banks remain well capitalized, although profitability pressures have emerged as economic growth is slowing and provisioning for nonperforming loans increases.
Policymakers have adopted diverse responses to tightening domestic liquidity, such as increasing the loan-to-deposit ratio and placing government entity deposits in commercial banks (Saudi Arabia), relaxing reserve requirements (Algeria,
Oman), and strengthening capacity to manage and forecast liquidity (Algeria). To help boost liquidity where needed, governments could consider transferring some of their foreign financial assets into the local banking system, while continuing to raise budget-deficit financing from international markets.
In the short term, policies should continue to be geared toward mitigating liquidity and credit risks where necessary. Of particular need is ensuring coherence in fiscal and monetary operations to avoid further tightening of domestic liquidity, improving liquidity-forecasting capabilities at central banks, ensuring effective liquidity-assistance frameworks, enforcing open-position limits, and ensuring appropriate loan classification and provisioning. Sufficient capital buffers need to be maintained to manage high-concentration risks, especially since low oil prices can put balance sheets under additional pressure (see IMF 2014 and Lukonga and Souissi 2015 for details). Many countries would benefit from further enhancing their financial sector surveillance, including more frequent and rigorous stress testing. Macroprudential frameworks should
Financial & capital account (net), includingerrors & omissions ('+' is outflow)4
Change in reserves ('+' is increase)
Current account
2014 1415141514151415 15
–10
–25
5
–15
0
15
–20
–5
10
20
Figure 1.7. External Balances(Percent of GDP)
Surpluscountries1
Conflictcountries2
Algeria Bahrain &Oman3
SaudiArabia
Deficit countries
Sources: Country authorities; and IMF staff calculations.1Iran, Kuwait, Qatar, and United Arab Emirates.2Iraq, Libya, and Yemen.3Weighted average.4Includes transactions by sovereign wealth funds.
Deposits, government Deposits, private Liabilities, foreign
EquitiesCredit to private sector
BHR SAU1QATOMNKWT UAE
–10
5
–15
0
15
–5
10
Sources: National authorities; and IMF staff calculations.Note: Country abbreviations are International Organization for Standardization(ISO) country codes.1In Saudi Arabia, government deposits are mostly placed at the central bank.
Figure 1.8. Trends in Commercial Banking Sector, 2014–15(Changes in percent of GDP)
21
1. MENAP OIL ExPORTERs: AdjUsTMENT TO ChEAPER OIL CONTINUING
International Monetary Fund | October 2016
continue to be enhanced where necessary by clarifying mandates for macro-financial stability, strengthening interagency coordination, formalizing and refining of the policy toolkit, and developing the market infrastructure for effective policy implementation (IMF 2015b). On the regulatory front, the continued progress in the implementation of Basel regulations across the region is welcome.
Accelerating Diversification and Private Sector DevelopmentIn light of the new oil market realities and the downsizing of the public sector, countries need to accelerate structural reforms to diversify their economies away from hydrocarbons and boost the role of the private sector. These reforms—that will inevitably take time to implement successfully—will also be crucial for securing employment opportunities given the rapidly growing labor force.
Most oil exporters have formulated strategic development plans, including Saudi Arabia’s recent Vision 2030. These plans typically anticipate that several strategic sectors such as logistics, tourism, energy, financial services, health care, and manufacturing will help generate the much-needed private sector jobs and growth. Policymakers have made some progress in increasing the role of the private sector, including through public-private partnerships (PPPs) in Kuwait and Oman; other countries (for example, Saudi Arabia) are expected to follow. Several countries are developing privatization plans (ongoing in Iran, while Kuwait, Oman, and Saudi Arabia are in the planning stages). Small and medium enterprises (SMEs) have been promoted for job-creation potential across the GCC. Moreover, several countries are modernizing their investment and labor laws (Algeria, Bahrain, Oman, Qatar, and Saudi Arabia). Foreign direct investment inflows have been decreasing in recent years; reducing red tape and stronger institutional quality would help attract more foreign investments (IMF 2016).
All of these plans need to be developed into actionable measures, sequenced, and implemented. Importantly, risks and unintended consequences of reforms need to be identified and addressed. For example, the PPPs should be supported by robust regulatory frameworks that ensure cost-effectiveness and limited fiscal risks, with monitoring to ensure service delivery. A strong legal and institutional framework for privatization would ensure a transparent and competitive environment. Increasing the role of credit bureaus would strengthen lenders’ ability to properly monitor the credit risk of SMEs. Upgrades to labor regulations should include feedback from the private sector.
Despite this progress, further measures to improve business environments and to diversify and expand the role of the private sector are urgently needed.6 The successful cases of Indonesia, Malaysia, and Mexico suggest that reducing commodity dependence takes time (Cherif, Hasanov, and Zhu 2016). In the GCC region, the United Arab Emirates has had some success in diversifying its export base through financial, transport, and business services, as well as through tourism, while Bahrain has increased the roles of financial services and food processing (Figure 1.9).
Labor market policies deserve special attention, with the large youth population facing the biggest challenge, given the expected slowdown in public sector hiring that has traditionally been the employer of first resort for nationals. A focus on labor market policies is particularly important in the GCC region, where businesses consistently rank restrictive labor regulations and inadequately educated workforces as their biggest barriers.7 These challenges have prevented the private sector from significantly expanding its national workforce at a time when the growth of nationals employed by the public sector has been slowing (Figure 1.10). The ongoing reforms include
6Mitra and others (2016) identify three policy areas to boost MENAP’s growth prospects: improving the business environment, enhancing workers’ talent, and developing financial markets.
7See, for example, the Global Competitiveness Index (World Economic Forum 2015).

22
REGIONAL ECONOMIC OUTLOOK: MIddLE EAsT ANd CENTRAL AsIA
International Monetary Fund | October 2016
public sector hiring freezes (Iraq, Oman), plans for greater mobility of foreign workers among employers (Qatar, Saudi Arabia), and increases in fees on foreign work visas (Bahrain, Oman, Saudi Arabia). Narrowing the gap between public and private sector wages would make private sector employment more attractive for nationals. Complementary active labor market policies, in place throughout the region, have been found, when well designed, to improve labor market outcomes (Box 2.2 discusses what makes such programs successful).
Training programs are particularly important as they help make growth more inclusive, thus helping to alleviate social pressures (see Box 2.2). As diversification accelerates and the economy shifts away from hydrocarbon industries, new skills will be needed to succeed in the private sector, for new and existing workers alike. Upgrades to education, training, and retraining programs should focus on reducing skill mismatches, taking into account the upcoming private sector needs.8
8Malaysia’s successful diversification, for example, was accom-panied by government programs that provided continuous skill upgrades for workers, while Mexico’s success in the automobile industry was helped by the local training of engineers, combined with government incentives for firms to provide further training for workers abroad.
0 8060
2012–14 average
4020 100
20
80
0
60
100
40
ALG
AZE
BhRECU
IdN
IRN
IRQ
KAZ
KWT
MYs
MEx NOR
QAT
RUs
sAUsdN
TTO
TKMVEN
YMN
hist
oric
al p
eak
(sin
ce 1
970
or w
hen
oil p
rodu
ctio
n st
arte
d/da
ta b
ecam
e av
aila
ble)
sources: Country authorities; and IMF staff calculations.Note: Countries underlined saw oil production decline by more than 30 percentover the past 10 years. Country abbreviations are International Organization forstandardization (IsO) country codes. 1ssA is the average of Angola, Republic of the Congo, Equatorial Guinea, Gabon,and Nigeria.2Excludes re-exports.
ssA1
UAE2
OMN2
Figure 1.9. Diversification of Exports(Oil exports as percent of total exports)
Private employment Public employment
Real GdP growth rate (rhs)
2006–10 11–1306–1014–1511–13 14–15
1
5
0
4
7
3
2
6
2
10
0
8
14
6
4
12
saudi Arabia GCC (excl. sAU and UAE)
sources: Country authorities; IMF staff calculations.Note: GCC = Gulf Cooperation Council; sAU = saudi Arabia; UAE = United ArabEmirates; rhs = right-hand side.
Figure 1.10. Employment of GCC Nationals(Contributions to employment growth)

23
1. MENAP OIL ExPORTERs: AdjUsTMENT TO ChEAPER OIL CONTINUING
International Monetary Fund | October 2016
Most Middle East, North Africa, Afghanistan, and Pakistan (MENAP) oil-exporting countries have begun to adjust budget policies to the new reality of persistently low oil prices. Deficit-reduction measures have been particularly significant in the Gulf Cooperation Council (GCC)—the average non-oil deficit is projected to fall by about 20 percent of non-oil GDP during 2014–16. While fiscal consolidation is needed to ensure fiscal sustainability, attain intergenerational equity, and rebuild buffers, it will inevitably weigh on growth.
How much could growth slow? The GCC’s non-oil growth is projected to halve from 5½ percent in 2014 to 1¾ percent this year, while Saudi Arabia’s non-oil growth has recently turned negative on a year-over-year basis for two consecutive quarters. Lower public consumption and investment may subtract more than 2 percentage points from the estimated GCC growth outturn in 2015 and projections for 2016 (Figure 1.1.1). Last year, this drag was largely offset by resilient private consumption and investment, as well as by higher hydrocarbon production.1 This year, however, the adverse growth impact will be felt more strongly, although higher exports—especially due to stronger-than-expected petrochemical output in Saudi Arabia—and lower imports will partly soften the drag.
An econometric model of GCC growth suggests that there is a large degree of uncertainty about the central forecasts (Figure 1.1.2).2 Growth could be either stronger or weaker than currently projected. On the downside, an adverse feedback loop between budget spending cuts and tightening credit conditions could reduce the private sector’s ability to pick up the slack created by the shrinking public sector. On the upside, growth headwinds could be smaller than projected if the composition of fiscal consolidation is favorable.
To boost the growth outlook and create jobs, the fiscal adjustment should be implemented in a growth-friendly way and accompanied by these supporting policies:
• Use appropriate fiscal measures. Spending cuts should be targeted toward expenditures with the smallest adverse impact on growth, such as those resulting mostly in lower imports and savings. However, the adverse impact of spending cuts on growth could increase over time as governments run out of “low-hanging fruit” and confront the need to curb core expenditures, such as the public sector wage bill, which might reduce consumption. Introducing a value-added tax and property taxes, eliminating exemptions, and increasing excises are
Prepared by Martin Sommer, Armand Fouejieu, and Amir Sadeghi, with support from Yufei Cai and Sebastian Herrador.1Fiscal consolidation has been fastest in Oman and Saudi Arabia—about 25 percent of non-oil GDP during 2014–16. In Oman,
smaller defense-related imports and an automatic reduction in on-budget energy subsidies due to lower international oil prices have accounted for nearly one-half of this adjustment. In Saudi Arabia, reduced purchases of land for infrastructure projects have contributed significantly. All these measures likely have zero or a very small direct impact on growth.
2The model includes real non-oil GDP, fiscal expenditures, oil prices, credit growth, and controls for the global financial crisis and the post-Arab Spring period. A fixed-effect panel regression is estimated using data for all six GCC countries during 1990–2015.
2014 1615
6
4
2
0
–2
–4
8
InventoryImportsExports
Private consumption and investmentPublic consumption and investmentReal GdP
Figure 1.1.1. GCC: Contributions to Real GDPGrowth, 2014–16 (Percentage points of GDP)
sources: National authorities; and IMF staff estimates.
Box 1.1. GCC Countries: How Sharp Will the Growth Slowdown Be?

24
REGIONAL ECONOMIC OUTLOOK: MIddLE EAsT ANd CENTRAL AsIA
International Monetary Fund | October 2016
likely to carry a smaller adverse growth impact than other alternatives.
• Avoid sharp cuts. Spreading deficit-reduction measures over time would be desirable, to allow the private sector to adjust.
• Keep bank credit flowing. Policymakers can ease the risk of a double whammy from tighter fiscal policies and credit conditions by ensuring adequate liquidity in the financial system; for instance, by reducing required reserves and increasing the loan-to-deposit ratio, where appropriate.
• Look for new growth opportunities. Deep structural reforms would, over time, support private sector activity and attract foreign investment, thus weaning the GCC economies off their over-reliance on oil and public spending. In Oman, for example, a focused development plan, the prioritization of public investment, and the draft foreign investment law have all helped to boost private sector confidence. In Bahrain, the upcoming expansions of an aluminum smelter and oil refinery are expected to support growth.
95% CI 90% CI 68% CI
Actual dataIMF projections
Model in-sample fitModel centralforecast
2000 105 15–10
10
5
0
–5
15
Source: IMF staff calculations.Note: CI = confidence interval for the model forecast;GCC = Gulf Cooperation Council; PPP = purchasing powerparity.
Figure 1.1.2. GCC: Real Non-Oil GDP Growth(Percent, PPP weighted)
Box 1.1. (continued)

25
1. MENAP OIL ExPORTERs: AdjUsTMENT TO ChEAPER OIL CONTINUING
International Monetary Fund | October 2016
Brexit, the June 2016 U.K. referendum result in favor of leaving the European Union (EU), has so far had a limited impact on the Middle East, North Africa, Afghanistan, and Pakistan (MENAP) and Caucasus and Central Asia (CCA) regions. The regions’ financial markets weakened immediately after the Brexit result, in line with global developments. This included a 5 percent drop in oil prices. Stock markets posted losses of 1–5 percent (Figure 1.2.1; Egypt, GCC, Kazakhstan, Pakistan) and five-year credit default swap spreads wid-ened by 10–25 basis points. Currencies weakened only marginally (by 1½ percent in Algeria, Kazakhstan, and Morocco, and by 5 percent in Georgia) and there was no significant impact on forward currency spreads in the GCC, which peg to the U.S. dollar.
However, Brexit has increased uncertainty about global economic prospects. Quantifying the economic impact of Brexit is challenging at this stage, not least because of considerable uncertainty about the nature of future trade arrangements between the United Kingdom and the EU, and the likelihood of any cascading effects from Brexit on the willingness of other countries to remain in the EU. Negotiations between the United Kingdom and the EU are expected to be protracted, raising economic, political, and institutional uncertainty.
This is likely to take a toll on confidence and investment, with repercussions on trade and financial market conditions—particularly in advanced Europe—and key commodity prices (Box 1, July 2016 World Economic Outlook Update).
Bilateral economic linkages between most MENAP and CCA countries and the United Kingdom are limited—including through trade (Figure 1.2.2), remittances, the banking system (Figure 1.2.3), and foreign direct investment (FDI). An exception is the reliance of some banks in Bahrain, Egypt, Qatar, and the United Arab Emirates on wholesale borrowing from the United Kingdom, which may become an issue in the event of a spike in funding costs.
A sharp increase in global risk aversion could push up external financing costs for MENAP and CCA countries and banks. Countries with vulnerable fiscal positions (Egypt) or those expected to tap international markets in the coming months to finance their budget deficits (for example, Egypt, Pakistan, and Saudi Arabia), as well as banks relying on offshore funding (especially in Bahrain and the United Arab Emirates), are also vulnerable through this channel. Cross-border exposures to European banks are sizable for Morocco and Tunisia.
A growth slowdown in the euro area stemming from Brexit would also have a significant impact on the MENAP and CCA regions. Ties to the euro area are strong through trade, remittances, FDI, and tourism, especially for MENAP oil importers in the Maghreb region (Morocco, Tunisia) and the CCA.
Prepared by Pritha Mitra and Juan Trevino, with research assistance from Hong Yang.
–8 –2–4–6 0
Figure 1.2.1. Stock Market Response toBrexit Vote (Percent change, June 23–26, 2016)
sources: Bloomberg, L.P; haver Analytics.
Emerging markets
United KingdomUnited states
IranEuro area
BahrainLebanon
jordanOman
MoroccoKuwait
saudi ArabiaTunisia
QatarAbu dhabi
Pakistandubai
EgyptKazakhstan
Box 1.2. The Impact of Brexit on MENAP and the CCA

26
REGIONAL ECONOMIC OUTLOOK: MIddLE EAsT ANd CENTRAL AsIA
International Monetary Fund | October 2016
A further decline in oil prices owing to slower global growth is another key channel through which the MENAP and CCA regions could be affected—especially the oil exporters. The decline in exports could further deteriorate fiscal balances and ultimately reduce growth prospects. Oil importers in the MENAP and CCA regions could be affected because of decreased import demand or remittances from oil exporters in the region (especially the GCC) or Russia.
Dollar appreciation, triggered by safe haven flows amid increased global risk aversion, is likely to weaken export competitiveness, especially for countries with diversified (non-commodity) exports whose currencies have limited flexibility against the dollar. Dollar appreciation would also raise the servicing cost of external dollar-denominated debt, particularly for the CCA. International reserves and investment portfolios of sovereign wealth funds will be affected by valuation changes.
All in all, Brexit could weaken the outlook for the MENAP and CCA regions to the extent that it increases global risk aversion and reduces global growth and commodity prices.
Imports from United Kingdom Imports from euro areaExports to euro areaExports to United Kingdom
GCC CCAOIMENAPOINon-GCC CCAOE0
5
10
20
15
30
25
source: IMF, direction of Trade database.Note: CCA = Caucasus and Central Asia; GCC = GulfCooperation Council; MENAP = Middle East, North Africa,Afghanistan, and Pakistan; OE = oil exporters; OI = oilimporters.
Figure 1.2.2. Trade with the United Kingdomand the Euro Area, 2012–14(Percent of total exports or imports, respectively)
0
10
20
50
40
30
70
60
Bahr
ain
UAE
Mor
occo
Qata
rOm
anTu
nisi
aAr
men
iaEg
ypt
Leba
non
saud
i Ara
bia
Kuw
ait
Geor
gia
Mau
ritan
iaAz
erba
ijan
jord
anAl
geria
Paki
stan
djib
outi
Yem
enKa
zakh
stan
source: Bank for International settlements.Note: Countries that have less than 1 percent exposureare excluded (Afghanistan, Iraq, Kyrgyz Republic, Libya,sudan, Tajikistan, and Turkmenistan). UAE = United Arab Emirates.
Figure 1.2.3. Claims on United Kingdom andEuropean Banks, 2016:Q1(Percent of recipients’ GDP)
United Kingdom banks
Other European banks
Box 1.2. (continued)

27
1. MENAP OIL ExPORTERs: AdjUsTMENT TO ChEAPER OIL CONTINUING
International Monetary Fund | October 2016
Faced with dwindling oil revenues, the GCC region has been implementing energy price reforms as a means of reducing spending. All of the GCC countries have seen an increase in energy prices; most increases have occurred since oil prices began dropping in mid-2014, although the depth and breadth of the reforms have varied significantly across countries. The 2016 January–July average prices for diesel in the United Arab Emirates and Oman, and for natural gas in Bahrain and Oman, are very close to or above U.S. price levels (Table 1.3.1). Saudi Arabia initiated substantial energy price reforms in late 2015, and plans to gradually raise domestic prices further over the next five years. Qatar has also started price reforms, but in both Qatar and Saudi Arabia, domestic prices are still well below international levels. In Kuwait, a significant increase in gasoline prices took effect in September this year, and electricity prices are also expected to increase next year (Table 1.3.4). Besides energy price reforms, many GCC countries have begun to implement policies to improve energy efficiency and are exploring the feasibility of generating electricity through renewable sources.
Higher energy prices will help slow the region’s rapid growth in energy consumption and will support fiscal adjustment. Energy consumption per capita in the GCC is not only high, but is also rising rapidly (in Qatar, Saudi Arabia, and the United Arab Emirates, in particular). The average estimated implicit cost of low energy prices for the six GCC countries based on 2016 prices ranges from 0.8 percent of GDP for the United Arab Emirates to over 7 percent of GDP for Kuwait (Table 1.3.2). The explicit cost of energy subsidies in the budget for the GCC region varies considerably across countries, but averages about 1 percent of GCC GDP (Table 1.3.3). The recent energy price reforms will support fiscal adjustment through the reduction in budget costs from explicit energy subsidies and/or through higher revenues from the domestic sale of energy products.
The GCC countries need to continue to ensure the success and sustainability of their energy price reforms. To this end, effective communication campaigns would be important to explain the rationale, objectives, and benefits of these reforms, inform the public of the pace of price increases, and introduce clear and transparent compensation measures to offset the impact of price increases on low-income households. A 2013 IMF study
Prepared by Malika Pant.
Table 1.3.1. Prices for Energy Products: GCC and the United States(Average January–July 2016 or latest available)
Gasoline Diesel Natural Gas Electricity(U.S. dollars per
liter)(U.S. dollars per
MMBtu)(U.S. dollars per
KWh)Bahrain 0.38 0.32 2.75 0.04Kuwait 0.19 0.39 1.50 0.01Oman 0.42 0.43 3.00 0.04Qatar 0.35 0.37 0.75 0.05saudi Arabia 0.22 0.10 1.50 0.10United Arab Emirates 0.41 0.43 0.75 0.12
GCC average 0.33 0.34 1.71 0.06GCC maximum 0.42 0.43 3.00 0.12U.s. prices 0.51 0.45 2.18 0.10
Sources: Prices for GCC countries come from country authorities and are averages for 90 and 95 octane gasoline. U.S. gasoline (average for mid and high grade) and diesel prices come from the U.S. Energy Information Agency (EIA) and are adjusted for taxes. Natural gas price for the United States is the Henry Hub spot price. Electricity tariffs for the United States include taxes and come from EIA. Note: GCC = Gulf Cooperation Council; MMBtu = 1 million British thermal unit; KWh = kilowatt hour.
Box 1.3. Progress in GCC Energy Price Reforms

28
REGIONAL ECONOMIC OUTLOOK: MIddLE EAsT ANd CENTRAL AsIA
International Monetary Fund | October 2016
covering major energy price reform episodes (during the period from early 1990s to 2010s) finds that, in most of these cases, countries relied on mitigating measures to protect the poor: targeted cash transfers or an expansion of existing social programs. In Armenia, Indonesia, and Jordan, transfer programs helped gain support for the reforms. Mitigating measures to help the productive sector included a gradual adjustment in prices (for instance, for natural gas in Bahrain), and financial support to selected enterprises to reduce energy intensity (Iran). Once prices have been raised, the introduction of an automatic pricing formula—as seen in Oman, the United Arab Emirates, and, more recently, Qatar, and, as announced, in Kuwait—may reduce the risk of the reforms being unwound while ensuring that changes in international prices are reflected in domestic prices in a timely manner.
Table 1.3.2. GCC Implicit Energy Cost Estimates1
(Percent of GDP)
2014 2015 2016Bahrain 7.4 5.4 3.6Kuwait 7.5 8.0 7.2Oman 7.1 4.6 2.8Qatar 5.0 4.5 3.5saudi Arabia 9.3 7.3 4.2United Arab Emirates 2.4 1.3 0.8
GCC 6.7 5.3 3.4
Source: GlobalPetrolPrices.com; GCC countries’ government agen-cies; International Energy Agency; U.S. Energy Information Admin-istration; World Bank Commodity Price data; IMF staff calculations.Note: GCC = Gulf Cooperation Council.1 The implicit cost of energy products—including gasoline, diesel, natural gas, and electricity—is estimated using the price gap methodology (2016 prices are averages for January–July 2016 or latest available) IMF (2015).
Table 1.3.3. GCC Explicit Energy Cost Estimates in the Budget1
Billions of U.S. dollars
Percent of GDP
Bahrain 1.1 3.5Kuwait 7.8 6.8Oman 0.8 1.3Qatar 1.2 0.7saudi Arabia 0.0 0.0United Arab Emirates … …
GCC2 10.9 1.1
Sources: Country authorities; and IMF staff estimates.Note: GCC = Gulf Cooperation Council.1 2016 budget numbers are used for Bahrain and Oman; 2015 budget numbers are used for others. For Qatar, 2015 staff esti-mates are based on historical data.2 GCC total excludes United Arab Emirates.
Box 1.3 (continued)

29
1. MENAP OIL ExPORTERs: AdjUsTMENT TO ChEAPER OIL CONTINUING
International Monetary Fund | October 2016
Table 1.3.4. Recent Updates on Energy Price Reforms in the GCCPre-oil price drop (before mid-2014) Post-oil price drop (after mid-2014)
Bahrain The gas price for existing industrial customers was increased by 50 percent, starting in january 2012, from $1.50 to $2.25 per MMBtu, while the price for new industrial customers remained at $2.50 per MMBtu (prices for new customers were increased from $1.30 to $2.50 in April 2010).
In March 2015, the authorities announced annual increases of $0.25 per MMBtu in the gas price for industrial users starting on April 1, 2015, until the price reaches $4 per MMBtu by April 2021. In March 2015, the authorities increased the fuel price in marine stations. The electricity and water tariff structure was adjusted for non-domestic users, increasing tariffs for higher consumption levels (October 2013). In january 2016, the authorities raised the retail price of gasoline by nearly 60 percent. Price increases for diesel, kerosene, liquified propane gas, and electricity and water tariffs are being phased in gradually by 2019. Bakeries and fishermen are exempt from the diesel and kerosene price increase, while a majority of Bahraini households and small businesses are exempt from higher electricity and water tariffs.
Kuwait … Kuwait doubled the price of diesel in january 2015. Authorities have approved and announced an increase in gasoline prices of about 70 percent, on average, effective september 2016. Additionally, a government committee will revise the new gasoline prices every three months depending on international oil prices. A law was recently passed by parliament to reform water and electricity subsidies. The new tariffs will become effective in May 2017.
Oman In january 2015, the industrial price for natural gas doubled, following a 2013 agreement.
In 2016, the authorities implemented fuel subsidy reform, linking prices to international ones, with monthly revisions to consumer prices. Water tariffs were increased in March 2016 for government, commercial, and industrial users. There is also a proposal to increase electricity tariffs for these users.
Qatar Qatar raised the pump prices of gasoline by 25 percent and of diesel by 30 percent in january 2011. diesel prices were again raised in May 2014, by 50 percent.
In October 2015, water and electricity prices were raised and tiered according to consumption. In january 2016, gasoline prices were increased again by 30 percent. Authorities have set up a committee that makes recommendations on whether prices should be adjusted, based on global markets and regional developments, and prices were increased again slightly by 4 percent in August.
saudi Arabia saudi Arabia increased the average price of electricity sold to non-individual users by more than 20 percent on july 1, 2010.
In december 2015, the authorities announced an increase in fuel prices (ranging from 10 percent to 134 percent increase) across most major energy and water products for businesses or households.
Source: Country authorities.Note: MMBtu = 1 million British thermal units.
Box 1.3 (continued)

30
REGIONAL ECONOMIC OUTLOOK: MIddLE EAsT ANd CENTRAL AsIA
International Monetary Fund | October 2016
Pre-oil price drop (before mid-2014) Post-oil price drop (after mid-2014)
United Arab Emirates The United Arab Emirates increased gasoline prices in 2010 to the highest level in the Gulf Cooperation Council. dubai raised water and electricity tariffs by 15 percent in early 2011.
In August 2015, the United Arab Emirates reformed its fuel pricing policy by adopting a mechanism to adjust monthly gasoline and diesel prices against international prices. With this reform, gasoline prices were increased by 25 percent and diesel prices were reduced by 29 percent. Abu dhabi is developing a comprehensive electricity and water consumption strategy, which led to an increase in tariffs in january 2015 (by 170 percent for water and by 40 percent for electricity). Water and electricity tariffs were increased again by 14–17 percent in january 2016. The authorities are planning to gradually phase out the remaining electricity, water, and gas subsidies, while protecting lower-tier consumers.
Source: Country authorities.Note: MMBtu = 1 million British thermal units.
Box 1.3 (continued)

31
1. MENAP OIL ExPORTERs: AdjUsTMENT TO ChEAPER OIL CONTINUING
International Monetary Fund | October 2016
ReferencesAlbino-War, M., S. Cerovic, F. Grigoli, J. Flores, J. Kapsoli, H.
Qu, Y. Said, B. Shukurov, M. Sommer, and S. Yoon. 2014. “Making the Most of Public Investment in MENA and CCA Oil-Exporting Countries.” Staff Discussion Note 14/10, International Monetary Fund, Washington, DC.
Cherif, R., F. Hasanov, and M. Zhu (eds). 2016. Breaking the Oil Spell. Washington: International Monetary Fund.
Husain, A., R. Arezki, P. Breuer, V. Haksar, T. Helbling, P. Medas, and M. Sommer. 2015. “Global Implications of Lower Oil Prices.” Staff Discussion Note 15/15, International Monetary Fund, Washington, DC.
International Monetary Fund (IMF). 2014. “Assessing Concentration Risks in GCC Banks.” Paper presented at the Annual Meeting of GCC Ministers of Finance and Central Bank Governors. Kuwait City, October 25.
———. 2015a. Fiscal Monitor. Washington, April.
———. 2015b. “Oil Prices, Financial Stability, and the Use of Countercyclical Macroprudential Policies in the GCC.” Paper presented at the Annual Meeting of GCC Ministers of Finance and Central Bank Governors. Doha, November 10.
———. 2016. Fiscal Monitor. Washington, April.
Jewell, A., M. Mansour, P. Mitra, and C. Sdralevich. 2015. “Fair Taxation in the Middle East and North Africa.” Staff Discussion Note 15/16, International Monetary Fund, Washington, DC.
Lledo, V., and M. Poplawski-Ribeiro. 2013. “Fiscal Policy Implementation in Sub-Saharan Africa.” World Development 46: 79–91.
Lukonga, I., and M. Souissi. 2015. “How Might the Sustained Decline in Oil Prices Affect MENA and CCA Banking Systems?” Chapter 6 in Regional Economic Outlook, Middle East and Central Asia. Washington: International Monetary Fund.
Mitra, P., A. Hosny, G. Minasyan, G. Abajyan, and M. Fischer. 2016. “Avoiding the New Mediocre: Raising Potential Growth in the Middle East and Central Asia.” Middle East and Central Asia Departmental Paper 16/1, International Monetary Fund, Washington, DC.
Rother, B., G. G. Pierre, D. Lombardo, R. Herrala, P. Toffano, E. Roos, G. Auclair, and K. Manasseh. Forthcoming. “The Economic Impact of Conflicts and the Refugee Crisis in the Middle East and North Africa.” Staff Discussion Note, International Monetary Fund, Washington, DC.
Sommer, M., G. Auclair, S. Quayyum, A. Tiffin, and B. Versailles. 2015. “Fiscal Adjustment to Lower Oil Prices in MENA and CCA Oil Exporters.” Chapter 4 in Regional Economic Outlook: Middle East and Central Asia. Washington: International Monetary Fund.
Sommer, M., G. Auclair, A. Fouejieu, I. Lukonga, S. Quayyum, A. Sadeghi, G. Shbaikat, A. Tiffin, J. Trevino, and B. Versailles. 2016. “Learning to Live with Cheaper Oil.” Middle East and Central Asia Departmental Paper 16/3, International Monetary Fund, Washington, DC.
World Economic Forum. 2015. The Global Competitiveness Report 2015–16. Geneva: World Economic Forum.

32
REGIONAL ECONOMIC OUTLOOK: MIddLE EAsT ANd CENTRAL AsIA
International Monetary Fund | October 2016
MENAP Oil Exporters: Selected Economic IndicatorsProjections
Average 2011–12 2013 2014 2015 2016 2017
Real GDP Growth 5.4 2.0 2.7 1.6 3.3 2.9(Annual change; percent)
Algeria 3.7 2.8 3.8 3.9 3.6 2.9Bahrain 5.1 5.4 4.4 2.9 2.1 1.8Iran, I.R. of 4.3 –1.9 4.3 0.4 4.5 4.1Iraq … 7.6 –0.4 –2.4 10.3 0.5Kuwait 5.5 0.4 0.6 1.1 2.5 2.6Libya 7.1 –13.6 –24.0 –6.4 –3.3 13.7Oman 3.8 3.2 2.9 3.3 1.8 2.6Qatar 12.4 4.6 4.0 3.7 2.6 3.4saudi Arabia 4.3 2.7 3.6 3.5 1.2 2.0United Arab Emirates 5.0 4.7 3.1 4.0 2.3 2.5Yemen 3.0 4.8 –0.2 –28.1 –4.2 12.6
Consumer Price Inflation 7.5 10.4 5.8 5.5 4.7 4.2(Year average; percent)
Algeria 3.8 3.3 2.9 4.8 5.9 4.8Bahrain 1.5 3.3 2.7 1.8 3.6 3.0Iran, I.R. of 16.3 34.7 15.6 11.9 7.4 7.2Iraq 17.0 1.9 2.2 1.4 2.0 2.0Kuwait 3.2 2.7 2.9 3.2 3.4 3.8Libya 5.4 2.6 2.8 14.1 14.2 12.5Oman 2.8 1.2 1.0 0.1 1.1 3.1Qatar 4.5 3.1 3.4 1.8 3.0 3.1saudi Arabia 2.1 3.5 2.7 2.2 4.0 2.0United Arab Emirates 4.5 1.1 2.3 4.1 3.6 3.1Yemen 11.6 11.0 8.2 39.4 5.0 18.0
General Gov. Overall Fiscal Balance 6.7 4.3 –0.7 –9.5 –9.2 –6.2(Percent of GDP)
Algeria 3.9 –0.9 –8.0 –16.8 –13.3 –9.5Bahrain1 0.0 –5.4 –5.8 –15.1 –14.7 –11.7Iran, I.R. of2 1.9 –2.2 –1.2 –2.0 –1.1 –1.0Iraq … –5.8 –5.6 –13.7 –14.1 –5.1Kuwait1 28.5 34.3 28.1 1.5 –3.6 3.2Libya 12.7 –4.0 –40.3 –52.5 –56.6 –43.8Oman1 9.2 4.7 –1.1 –16.5 –13.5 –10.3Qatar 9.3 22.2 15.0 5.4 –7.6 –10.1saudi Arabia 8.2 5.8 –3.4 –15.9 –13.0 –9.5United Arab Emirates3 11.1 10.4 5.0 –2.1 –3.9 –1.9Yemen –2.7 –6.9 –4.1 –10.6 –11.3 –5.5
Current Account Balance 13.4 15.1 8.3 –3.8 –4.4 –1.8(Percent of GDP)
Algeria 13.5 0.4 –4.4 –16.5 –15.1 –13.7Bahrain 6.3 7.4 4.6 –3.1 –4.7 –3.8Iran, I.R. of 4.9 7.0 3.8 2.1 4.2 3.3Iraq … 1.4 –0.8 –7.2 –10.8 –3.6Kuwait 32.8 39.9 33.3 5.2 3.6 8.4Libya 24.4 13.5 –27.8 –42.1 –47.4 –36.9Oman 9.1 6.7 5.7 –17.5 –21.3 –17.6Qatar 20.0 29.9 23.5 8.2 –1.8 0.0saudi Arabia 16.7 18.2 9.8 –8.3 –6.6 –2.6United Arab Emirates 12.5 19.1 10.0 3.3 1.1 3.2Yemen 0.2 –3.1 –1.7 –5.5 –6.1 –2.8
sources: National authorities; and IMF staff estimates and projections.Note: Variables reported on a fiscal year basis for Iran (March 21/March 20).1Central government. 2Central government and National development Fund excluding Targeted subsidy Organization.3Consolidated accounts of the federal government and the emirates Abu dhabi, dubai, and sharjah.

33International Monetary Fund | October 2016
Macroeconomic stabilization is advancing on the heels of recent energy subsidy reforms and low oil prices. Yet growth remains weak and fragile amid ongoing regional conflicts, lingering structural impediments, and subdued external demand. Over the medium term, growth is set to remain too low to address persistently high unem-ployment and low economic inclusiveness. Fiscal space is limited by high debt service costs and large wage bills and, in some cases, external vulnerabilities are still high. To boost private sector growth and employment, deeper structural reforms are needed to lower business costs, improve access to finance and export markets, and enhance worker talent. Greater exchange rate flexibility would also help improve competitiveness in some cases.
Subdued Economic ActivityRecent progress in reforms, a gradual recovery in the euro area, and lower oil prices have improved confidence and macroeconomic stability. This year, growth is expected to be 3.6 percent and, assuming continued progress in reforms, 4.2 percent in 2017. Persistent regional conflicts and social tensions, low competitiveness, and deep-rooted structural impediments continue to hamper efforts to boost economic activity. Growth of 3–4 percent since the Arab Spring has been too low and not inclusive enough to address high unemployment (11 percent), especially among the young (25 percent).
Recent structural reforms and monetary easing are set to boost investment, which is expected to become an increasingly important driver of growth (Figure 2.1). Improvements in the business environment, including initial efforts to tackle corruption (Afghanistan, Egypt), better electricity provision to industries (Pakistan), progress in simplifying regulations and improved investor protection (Egypt, Jordan, Morocco), and
Prepared by Pritha Mitra, with research assistance from Gohar Abajyan and Sebastian Herrador.
monetary easing (Jordan, Pakistan) are helping boost private investment and private sector credit growth. Public investment has benefited from recent subsidy reforms.
Strong consumption continues to be underpinned by large public wage bills. Remittances, mostly from Europe and the Gulf Cooperation Council (GCC), have also traditionally supported consumption, although they have started to decline because of slowing economic activity in the GCC (Figure 2.2). Consumer confidence and spending have also been supported by the pass-through of lower oil prices. However, a recent partial recovery in the crude oil price is expected to erode these gains somewhat, albeit with a lag, as increases over recent months have not yet been passed on to consumers by retailers. In Morocco, weak production in the
ExportsConsumption
Public investmentImports
Private investmentReal GDP growth
Figure 2.1. Contributions to Growth: Sustained by Consumption and Advanced by Investment(Percent change, 2014–171)
–3
–2
–1
3
2
1
0
4
5
6
7
2014 15 16 17
Sources: National authorities; and IMF staff calculations.1MENAP aggregate excludes Sudan.
2. MENAP Oil Importers: Striving to Foster Inclusive Growth in a Challenging Environment

34
REGIONAL ECONOMIC OUTLOOK: MIddLE EAsT ANd CENTRAL AsIA
International Monetary Fund | October 2016
agricultural sector (employing more than one-third of the population) weighed on incomes and consumption this year, although a rebound is expected next year.
External activity has been subdued partly because of weak external demand and low competitiveness. Exports and tourism have declined sharply in recent months (Figure 2.2), in part due to slowing GCC growth. In Mauritania, low iron ore prices (largely owing to China’s rebalancing) have reduced exports and, in Sudan, low oil prices had a similar effect. A mild rebound of the region’s exports is expected in 2017, as they benefit from increased external demand from advanced economies. In particular, the euro area’s domestic demand (the Maghreb’s largest trading partner) is expected to rise, notwithstanding risks from Brexit—the June 2016 U.K. referendum result in favor of leaving the European Union (Box 1.2). Nevertheless, weak competitiveness (Figure 2.3)—explained also by an appreciation of the U.S. dollar, to which many of the region’s
currencies are tied, and despite recent exchange rate depreciation (Egypt, Tunisia)—is anticipated to continue depressing export shares (Egypt, Mauritania, Tunisia; Figure 2.4). Imports will continue to rise across the region in line with increased investment. The resolution of foreign currency shortages in Egypt will also contribute to this pickup and support investment and production.
Spillovers from regional conflicts are also holding back economic activity. Challenging security conditions, including recent terrorist attacks in Afghanistan, Egypt, Pakistan, and Tunisia hamper confidence (Figure 2.5) and hurt tourism (Figure 2.2). Accommodating growing numbers of refugees (Jordan, Lebanon, Tunisia) adds to pressures on infrastructure, health, and education services.
Despite recent progress, structural impediments to growth persist. Poor transport and telecommunications infrastructure and shortages of electricity, fuel, and water continue to hamper economic activity. Small and medium enterprises (SMEs) still struggle with the availability of bank
Exports (3MMA)Tourist arrivals
Remittances (U.S. dollars)Remittances (National currency)
Figure 2.2. Declining Exports, Tourism, and Remittances(Index values, January 2013 = 100)
Sources: Bloomberg, L.P.; national authorities; and IMF staff calculations.Note: Exports and remittances are measured in U.S. dollars. Exports are expressed in constant January 2010 exchange rates. 3MMA = three-month moving average.
80
100
90
110
120
130
140
Jan-2013 Jan-14 Jan-15 Jan-16
EGYLBN
PAKSDN
JORMAR
TUNMRT
Figure 2.3. REER Index(January 2010 = 100)
Sources: National authorities; and IMF staff calculations.Note: Country abbreviations are International Organization for Standardization (ISO) country codes. REER = real effective exchange rate.
80
110
100
90
120
130
140
150
Jan-
2012
Apr-
12
Jul-1
2
Oct-
12
Jan-
13
Apr-
13
Jul-1
3
Oct-
13
Jan-
14
Apr-
14
Jul-1
4
Oct-
14
Jan-
15
Apr-
15
Jul-1
5
Oct-
15
Jan-
16
Apr-
16
Jul-1
6

35
2. MENAP OIL IMPORTERs: sTRIvING TO FOsTER INCLUsIvE GROwTh IN A ChALLENGING ENvIRONMENT
International Monetary Fund | October 2016
credit as banks mainly finance government and large state-owned enterprises (SOEs). Confidence is also being influenced by the mixed progress of structural reforms, which have been relatively steady in some (Jordan, Morocco, Pakistan), more varied in others (Egypt, Mauritania, Tunisia), and slowed by a lack of political cohesion elsewhere (Lebanon).
Inflation is expected to gather speed next year. At 7.4 percent in 2016, inflation is almost 1 percent higher than last year and is expected to rise to 9.8 percent next year, driven largely by the inflation rate in Egypt. So far, persistently large output gaps, low global food and energy prices (where pass-through has been allowed), and currency appreciation against major import partners (China and the euro area with 15 percent and 25 percent of imports, respectively) have put downward pressures on inflation. These pressures have been offset by energy subsidy phase-outs, increased food prices, and, in some cases, currency depreciations (Egypt, Tunisia), monetization of fiscal deficits, and accommodative monetary policies. Next year, the region will face additional upward pressures from rising global energy prices, further electricity and water subsidy phase-outs
(Egypt, Tunisia), and increased domestic demand from increased large-scale public and private investment (Egypt).
Lackluster Medium-Term ProspectsMedium-term growth prospects remain insufficient to reduce unemployment, raise incomes, and improve economic inclusiveness. Weak productivity growth and slow capital accumulation are keeping potential growth weak, and the region is falling further behind its global peers in terms of its medium-term economic prospects (Figure 2.6), especially in per capita terms given the region’s fast-growing population. Although economic growth has picked up in recent years, it has not yet made a dent in unemployment (Figure 2.7). The low sensitivity of unemployment to growth suggests that unemployment is mostly structural and due, in particular, to mismatches in job skills. On current
2010 2015
Figure 2.4. Share of Exports to the World(Percent of total world exports)
Sources: National authorities; and IMF staff calculations.Note: Country abbreviations are International Organization for Standardization (ISO) country codes.
0.00
0.05
0.10
0.15
0.20
0.25
EGY PAK MAR TUN JOR AFGDJIMRTLBNSDN
2006–072015–16
DEVASIA (2015–16)LAC (2015–16)CEE (2015–16)
Figure 2.5. The High Business Cost of Terrorism(Indicator,1–7; 7 being the highest cost)1
Sources: World Economic Forum, The Global Competitiveness Report 2015–16; and IMF staff calculations.Note: Country abbreviations are International Organization for Standardization (ISO) country codes. CEE = central and eastern Europe; DEVASIA = developing Asia; and LAC = Latin America and the Caribbean.1The business cost of terrorism is a survey-based indicator that asks respondents the extent to which the threat of terrorism imposes costs on businesses.
0
1
2
3
4
5
MAR JOR MRT PAKEGYLBNTUN

36
REGIONAL ECONOMIC OUTLOOK: MIddLE EAsT ANd CENTRAL AsIA
International Monetary Fund | October 2016
medium-term growth projections of slightly more than 5 percent, the unemployment rate of nearly 11 percent is anticipated to decline by only 3 percentage points to 8 percent by 2021.
Rising Downside RisksDomestic and external downside risks have increased. A worsening of security conditions or social tensions, reform fatigue, increased spillovers from regional conflicts, and/or slower euro area growth (perhaps triggered by Brexit uncertainties) could undermine economic growth. The rebalancing in China could translate into lower-than-expected infrastructure financing for the region (Djibouti, Pakistan), slower emerging market growth prospects, and lower commodity export prices (Mauritania, Pakistan). A withdrawal of correspondent bank relationships could catalyze reductions in financial services by global or regional banks (Djibouti, Sudan) or closer banking scrutiny (Lebanon). Risk premiums may rise sharply—raising financing costs for governments and banks (and, in turn, reducing their profitability)—if global financial conditions were to tighten more than expected amid China’s
rebalancing and slowdown, the normalization of U.S. interest rates, and/or the fallout from Brexit. Investors’ flight to safety could strengthen the U.S. dollar, resulting in a greater loss of competitiveness for those countries that peg to the dollar but export largely to China and the euro area.
On the upside, exports could rise as Iran reintegrates into the regional economy (see October 2015 Regional Economic Outlook: Middle East and Central Asia) and progress is made on trade pacts with the European Union (Jordan). The rebalancing in China may also provide opportunities for an increase in consumption-related exports (Chapter 4).
Vulnerable Fiscal and External PositionsDespite recent improvements, significant fiscal vulnerabilities remain. Subsidy and revenue reforms are expected to reduce fiscal deficits in most Middle East, North Africa, Afghanistan, and Pakistan (MENAP) oil importers by 0.3 percentage point to 7 percent of GDP in 2016 and further to 5.8 percent in 2017, stabilizing
2008–15EMDC 2008–15
2003–07EMDC 2003–07
Figure 2.6. Potential Growth and Productivity, Capital, and Labor Growth (Percentage points)
0
1
5
4
3
2
6
7
8
9
Potential Productivity Capital Labor
Source: Mitra and others (2016).Note: EMDC = emerging markets and developing countries.
Real GDP growth Unemployment rate
Figure 2.7. Unemployment and Real GDP Growth Rates, 2010–15(Percent)
Sources: National authorities; and IMF staff calculations.
2 2
3
4
5
6
7
8
9
10
Unem
ploy
men
t rat
e
11
12
3
4
Real
GDP
gro
wth
rate
5
2010 11 12 14 1513

37
2. MENAP OIL IMPORTERs: sTRIvING TO FOsTER INCLUsIvE GROwTh IN A ChALLENGING ENvIRONMENT
International Monetary Fund | October 2016
public debt. These reforms also created space (Figure 2.8) for increased spending on education, health care, and targeted social assistance. This targeted spending will have the dual effect of softening some of the near-term adverse impact of fiscal consolidation on economic activity while also supporting long-term growth. Further growth-enhancing spending on infrastructure and social sectors is needed to address supply bottlenecks and improve growth prospects. However, there is little scope for increased spending given the weakness of state revenues, large public wage bills, and high debt service—especially in Egypt, Jordan, and Lebanon, where debt ranges from 90 percent to 145 percent of GDP. The recent partial recovery in oil prices will support fuel tax revenues, but for those countries yet to complete energy subsidy reforms, they will increase government subsidy spending (Egypt, Sudan, Tunisia) or SOE imbalances (particularly in the electricity sector), raising debt pressures in most countries.
External positions have pockets of weakness as well. International reserves currently average six months of imports across the region but are below three months in Egypt and Sudan. In
particular, for Sudan, the withdrawal of foreign bank correspondent relationships and the reduction of trade financing activities have slowed trade, remittances, and foreign investment—increasing pressure on reserves. So far, the region’s weak exports have been largely offset by low energy import bills. As oil prices partially recover, coupled with increased investment-related imports, import bills and balance of payments pressures will rise. In some cases, reduced oil dependence (Jordan’s shift from expensive, short-term oil contracts to cost-effective, long-term natural gas contracts), increased foreign direct investment (Morocco, Pakistan), and external public financing inflows (possible sovereign debt issues in Egypt, Pakistan, and Tunisia) will help.
The financial sector is stable but needs improvements to be safeguarded. Banking systems remain healthy with generally well-capitalized, liquid, and profitable banks (Figure 2.9)—given solid deposit growth, despite the recent pickup in credit. Nonperforming loans are high but gradually declining. Regulatory and supervisory frameworks—as well as corporate insolvency and bankruptcy regimes, and, in some cases, deposit insurance schemes—need to be strengthened.
CapitalWages
SubsidiesInterest
Other currentRevenue
Figure 2.8. Subsidy Reforms Create Space forGrowth-Enhancing Social Spending1 (Percent of GDP, change from prior year)
Sources: National authorities; and IMF staff calculations.1Excluding Djibouti, Lebanon, and Pakistan.
–1.0
–0.5
0.0
0.5
1.0
2010–13 2014–15 2016–17
Deposits (rhs)NPLs
Credit (rhs)Profits (ROA)
Figure 2.9. Banks Remain Healthy: Private Credit, Deposits,Nonperforming Loans, Return on Assets(Percent, year-over-year monthly growth for credit and deposits)
0
2
4
6
8
10
0
2
4
6
8
10
12
14
Jan-2013 Jul-13 Jan-14 Jul-14 Jan-15 Jul-15 Jan-16
Sources: National authorities; and IMF staff calculations.Note: NPL = nonperforming loans; rhs = right-hand side; ROA = return on assets.

38
REGIONAL ECONOMIC OUTLOOK: MIddLE EAsT ANd CENTRAL AsIA
International Monetary Fund | October 2016
Implementing Fiscal, Monetary, and Structural Reforms Achieving fiscal sustainability over the medium term, while supporting economic activity in the near term, demands careful fiscal policy choices. Carefully designed and clearly communicated medium-term plans, in particular, can help sustain an easier fiscal stance in the near term without upward pressure on borrowing rates. The key components of such plans could include the following:
• On the revenue side, the recent reduction of exemptions and loopholes (Morocco and Pakistan; those planned in Egypt, Jordan, and Tunisia), better tax administration, and rationalization of customs processes (Pakistan) support revenues, inclusiveness, and growth by leveling the playing field for companies, and reducing compliance costs. Revenue measures targeting higher-income earners or greater use of technology in tax collection also increase equity (Jewell and others 2015). Policies that will also play important roles are the introduction of a value-added tax (Egypt), revised income tax thresholds (Jordan, Tunisia), and higher excises.
• On the spending side, increased funding for infrastructure, health care, education, and social services (including active labor market policies, Box 2.2) will support employment and growth. Measures to reduce SOE losses (including automatic pricing mechanisms for energy companies) would cut their arrears to the government and private sector. Spending efficiency can also be improved by strong evaluation, prioritization, and implementation of large projects. Public sector wage bills should be contained and plans for their gradual rationalization would ultimately create space for more growth-enhancing spending. Morocco’s recent pension reforms are a step in that direction. In contrast, Tunisia has raised wages in efforts to soothe social tensions.
Reforming public debt financing would reduce financing risks while improving the business environment. With global financial conditions tightening, policymakers are likely to continue relying mainly on domestic bank financing. More regular domestic bond issuance with longer maturities, market-determined yields, and a broader investor base would reduce rollover risks, deepen financial markets, encourage financing of public-private partnerships, and reduce banking system risks from high public sector loan concentration. A more balanced mix of domestic and external borrowing would reduce the crowding out of bank loans to the private sector. Privatization of SOEs would improve government finances and create better incentives for efficiency, although the near-term job losses would need to be carefully managed.
Accommodative monetary policy and greater exchange rate flexibility would help support growth and macroeconomic stability. Where competitiveness is deteriorating, nominal exchange rate pressures are rising (for example, growing gaps between official and unofficial exchange rates), and balance sheet mismatches are limited, a faster transition to more flexible exchange rate systems is needed to avoid a more difficult macroeconomic adjustment later on. Greater flexibility needs to be complemented by building central bank independence (recent progress in Morocco, Pakistan, and Tunisia is welcome), determining an alternative nominal anchor, building institutional capacity, addressing fiscal dominance, developing deeper and more liquid foreign exchange markets, and strengthening banking supervision and regulation. For countries in which inflation is expected to remain moderate, accommodative monetary policy could be used to mitigate the adverse effects of fiscal consolidation. In countries pursuing exchange rate flexibility, this approach needs to be balanced against inflationary pressures from depreciation. Central banks must remain vigilant to any signs of increasing financial stress, stepping up supervisory actions as necessary.

39
2. MENAP OIL IMPORTERs: sTRIvING TO FOsTER INCLUsIvE GROwTh IN A ChALLENGING ENvIRONMENT
International Monetary Fund | October 2016
Raising economic potential and creating jobs require higher productivity growth and the building of physical capital. Despite recent progress, the pace of reforms in the region is still slower than in its global peers—MENAP oil importers’ relative rankings have even been declining in key areas such as infrastructure (where all but Morocco’s rankings fell), education, the regulatory environment, corruption, finance, and trade (Figure 2.10). Together with other analyses (for example, Mitra and others 2016 as well as IMF 2014), these rankings point to areas where reform efforts can have the largest impact on raising capital and productivity growth, taking into account capacity constraints. Building the region’s physical capital hinges on infrastructure investment and financial market development. For the latter, the establishment and wider use of credit bureaus would ease access to finance (especially for SMEs)—facilitating private capital accumulation, business expansion, and job
creation. Reducing the cost of doing business through stronger investor protection, and fewer and less burdensome regulations would support productivity growth. Shrinking the economic dominance of SOEs would also be important to level the playing field and enhance economic efficiency. Nurturing worker talent through education and vocational training that aligns skills with job market needs, leveraging the talent and knowledge of diasporas, and raising female labor force participation are also critical to raising productivity. Increased trade openness could enable countries to join job-creating global manufacturing supply chains.
International SupportSupport from the international community can facilitate the transition to higher growth, better living standards, and more jobs while shoring up macroeconomic stability. Bilateral and multilateral official financing can help create fiscal space for growth-enhancing social spending and catalyze additional private financing, especially for countries that are already moving forward with challenging macroeconomic and structural reforms. International support is especially needed in countries coping with growing numbers of refugees, as they are providing a global public good (Box 2.1) and raising their debt levels to do so. However, absent sound reforms, financing only delays the unwinding of underlying imbalances—which may be abrupt and more painful in the future. Current IMF arrangements in MENAP oil-importing economies—committing more than $20 billion in Afghanistan, Egypt, Jordan, Morocco (a credit line against external shocks), and Tunisia—aim to support countries’ reform efforts and macroeconomic adjustment. The arrangements have been characterized by flexibility (in financing amounts and program conditionality) in responding to unexpected shocks, especially in Jordan and Tunisia. The international community can also provide support through technical advice, other capacity-building initiatives, and enhanced access to export markets for the region’s products and services.
Worse
Better
Trad
e
Corr
uptio
n
Infra
stru
ctur
e
Regu
latio
ns
Educ
atio
n
Fina
nce
Figure 2.10. Falling Behind Global Peers in Key Reform Areas(Arrows begin at 2007 ranking and end at 2016 ranking)
MAR,JOR
TUN
EGY
PAK
JOR,TUN MAR JOR
EGY
TUN
TUNEGY
JORMAR
PAK
PAK,TUN
JOR
Sources: International Country Risk Guide; The PRS Group; World Bank (only finance indicator); World Economic Forum; and IMF staff calculations.Note: The vertical axis shows the ranking of a country’s performance relative to the performance of their global peers defined as emerging markets and developing countries (EMDCs). The 100 ranking reflects the top ranking among EMDCs; an 80 ranking means a country is performing among the top 80 percent of EMDCs, and so on. The arrows demonstrate changes in rankings that reflect changes in countries’ own performance and/or performance of their global peers (defined as EMDCs). Countries without a substantial change in rankings relative to global peers are not shown. Sources of structural indicators were chosen based on data availability. Results are robust to using alternative sources. Country abbreviations are International Organization for Standardization (ISO) country codes.

40
REGIONAL ECONOMIC OUTLOOK: MIddLE EAsT ANd CENTRAL AsIA
International Monetary Fund | October 2016
During the second half of the past century, the Middle East, North Africa, Afghanistan, and Pakistan (MENAP) region experienced more frequent and more severe conflicts than any other part of the world. With conflicts having recently intensified, the region faces new challenges. Violent non-state actors have emerged as significant political and military powers, holding large areas of sovereign territory. A refugee crisis on a scale not seen since the end of World War II is affecting not only the MENAP region but also Europe, with attendant economic and social implications.
Violent conflicts not only destroy human, social, and economic capital—with severe consequences for growth potential—they also pose major and immediate challenges to economic policymaking. Countries most exposed to conflict (Afghanistan, Iraq, Libya, Somalia, Syria, Yemen) face, to varying degrees, deep recessions, high inflation, worsened fiscal and financial positions, and damaged institutions. Economic spillovers to neighboring MENAP countries and other regions, notably Europe, are also large, including the challenges of hosting large numbers of refugees, weaker confidence and security, and declining social cohesion (Figure 2.1.1).
The experience with recent MENAP conflicts shows that, even in the context of ongoing violence, policymakers need to both ensure the continuity of government and minimize harm to the public and economic activity. Three priorities stand out: (1) protecting institutions from becoming inoperative or corrupt; (2) prioritizing public spending to protect human life, limiting fiscal deficits, and preserving economic potential; and (3) stabilizing macroeconomic and financial developments through effective monetary and exchange rate policy.
Protecting institutions has been difficult at a time when political systems are disintegrating. The experience with MENAP conflicts stresses the importance of keeping core government institutions—such as fiscal agents and central banks—functioning amid difficult operational challenges, including the threat of corruption. Policymakers may be tempted to “capture” government institutions for personal benefit: financial flows may be redirected to the political constituencies of those in power; regulations may be biased in favor of a privileged few; and the collection of revenue may be aimed at political foes.
Prioritizing spending is also critical, as conflicts in the MENAP region have been typically associated with increased fiscal pressures. While conflict often brings urgent spending needs, fiscal space is squeezed by
declining revenue collection and reduced access to external financing. The end result has often been ballooning fiscal deficits. The magnitudes can be dramatic. In Yemen, for example, preliminary data on the 2015 outturn suggest that central government revenue fell by as much as 60 percent—reflecting the combined effect of the sharp fall in oil prices and the shutdown of oil production facilities in the wake of the escalation of the
Prepared by Risto Herrala.
Per 1,000 inhabitants (rhs)Registered refugees (lhs)
0
10
20
30
40
50
60
70
80
90
100
PAK
LBN
IRN
JOR
SDN
IRQ
YEM
AFG
EGY
DZA
MRT SYR
DJI
LBY
SOM
MAR
0
200
400
600
800
1,000
1,200
1,400
1,600
1,800
Sources: United Nations High Commissioner for RefugeesStatistics database; and IMF staff calculations.Note: These are the sixteen MENAP countries with themost registered refugees. Estimates of inhabitants(including refugees) are from the UN Population Division.Country abbreviations are International Organization forStandardization (ISO) country codes. lhs = left-hand side;rhs = right-hand side.
Figure 2.1.1. Refugees, Many EscapingConflict, Hosted in MENAP Countries(Thousands)
183
Box 2.1. Economic Policies During Conflict

41
2. MENAP OIL IMPORTERs: sTRIvING TO FOsTER INCLUsIvE GROwTh IN A ChALLENGING ENvIRONMENT
International Monetary Fund | October 2016
conflict. Donor support has been an unreliable source of funding for conflict-ridden countries. In West Bank and Gaza, donor financing for the budget decreased by one-third in 2015, despite an upturn in violence and persistently high security-related expenditure needs.
Stabilization is particularly challenging, as conflicts push central banks into a greater role in financing government activities. In 2015, governments in Iraq and Yemen financed part of their budgets via their central banks. To safeguard the continuation of government activities, central banks have sometimes been forced to take on very broad mandates. In Libya, the central bank has become the fiscal agent responsible for operating government finances, and has also played a key role in negotiating export contracts. Monetary policy toolkits have often been augmented through increased recourse to administrative measures to control domestic credit allocation and foreign exchange flows. For example, Libya has tightened foreign exchange controls to curb a thriving parallel market; and Yemen took measures to channel domestic funding toward policy priorities.
Box 2.1. (continued)

42
REGIONAL ECONOMIC OUTLOOK: MIddLE EAsT ANd CENTRAL AsIA
International Monetary Fund | October 2016
In the context of weak labor market outcomes, active labor market policies (ALMPs) have become increas-ingly popular across the world. ALMPs work through enhancing the employability of job seekers, more aptly connecting workers and jobs, and promoting job creation and labor force participation. If designed appro-priately, these policies can improve individual labor market outcomes and contribute to reducing poverty and improving equity. ALMPs are part of the policy mix to address labor market deficiencies, together with passive labor market, social, and demand-side policies.
ALMPs can help address some of the labor market deficiencies in the MENAP and CCA regions. There are five main types of ALMPs—from expensive training programs to relatively low-cost employment services (Table 2.2.1). Training programs are most popular and common in the region. All other types are also used, to varying degrees. The main challenges in establishing successful ALMPs in the region relate to their target audience—beneficiaries are usually selected from the pool of the unemployed, few of whom are registered—and capacity for being implemented. For example, although intermediation services are offered in many countries, they are largely ineffective and rarely used. Very few programs in the region are monitored or evaluated, even in the oil-exporting countries, which have greater means and stronger implementation capacity.
While evaluations from the region are scarce, large-scale meta-analyses of studies from advanced economies provide useful insights on the impact of ALMPs on the income and employment of beneficiaries:
• Employment. Training programs have long-term positive impacts. In the short term, public employment services can be very successful in helping job seekers find work. Public works programs have negligible or even negative effects on beneficiaries. A recent inventory of youth interventions shows that about one-third of reviewed programs had increased employment or earnings. At the aggregate level, higher spending on ALMPs is most often associated with a reduction in cyclical and long-term unemployment.
• Skills improvement. Even when ALMPs are not found to have a positive measurable effect on earning and employment, they can have other desirable effects, such as increasing the well-being of beneficiaries through maintaining social contacts, attachment to the labor market, and improving soft and technical skills.
Inclusive growth can also be fostered. Public works programs can help with anti-poverty goals. ALMPs that include a stipend, or some form of paid work, can support incomes, especially in countries that do not have unemployment benefits or assistance. When targeted at the most vulnerable groups, they can reduce inequity. However, it is not clear if ALMPs are a superior way of addressing inclusive growth objectives, compared with social safety nets.
Prepared by Gaëlle Pierre.
Table 2.2.1. Typology of Active Labor Market Policies
Program Type Goal
Training and retraining programs
Improve the employability of workers through providing skills
Intermediation services Reduce information asymmetries in the labor market
wage or employment subsidies
Foster the employment of individuals with lower productivity
Public works programs Provide temporary employment with a training element
self-employment programs Provide technical and financial support to unemployed persons to set up their own businesses
Source: Author.
Box 2.2. Active Labor Market Policies: What Can MENAP and the CCA Learn from Others?

43
2. MENAP OIL IMPORTERs: sTRIvING TO FOsTER INCLUsIvE GROwTh IN A ChALLENGING ENvIRONMENT
International Monetary Fund | October 2016
The impact of ALMPs depends on how services are chosen and delivered. It is undermined if program beneficiaries simply replace other workers, if programs find positions for workers who would have found a job regardless, or when the most promising candidates are selected. Beneficiaries can also end up being stigmatized and negatively viewed by employers.
Based on extensive international experience, the following best practices can be identified:
• ALMPs work best when they are integrated with other policies, including passive labor market and social policies. This can be a complex requirement in countries with limited capacities, but avoiding system fragmentation can help avoid duplications. Effectiveness can be improved by combining services that respond to the different needs of participants. For example, successful youth programs include multiple components and intensive implementation (Job Corps in the United States and New Deal for Young People in the United Kingdom).
• Since ALMPs require significant institutional capacity, countries can scale down their goals to have manageable programs, and can involve private sector providers.
• Program design, which is crucial for success, involves several key dimensions: setting clear goals, setting up adequate targeting, favoring demand-driven approaches, including exit strategies (graduation), emphasizing human capital accumulation, and ensuring relevance. For example, youth programs in Latin America combine in-classroom activities with on-the-job training, and closely involve the private sector, thereby providing marketable skills. When using private providers, it is important to put in place proper certification, incentive systems, and monitoring.
• Finally, establishing monitoring and evaluation regimes helps inform decisions about improving and fine-tuning ALMPs. For example, this is done in the Organisation for Economic Co-operation and Development, which recently proposed a new framework to improve the effectiveness of ALMPs.
Box 2.2. (continued)

44
REGIONAL ECONOMIC OUTLOOK: MIddLE EAsT ANd CENTRAL AsIA
International Monetary Fund | October 2016
ReferencesInternational Monetary Fund (IMF). 2014. “Toward New
Horizons: Arab Economic Transformation Amid Political Transitions.” Middle East and Central Asia Department Paper, Washington, DC.
Jewell, A., M. Mansour, P. Mitra, and C. Sdralevich. 2015. “Fair Taxation in the Middle East and North Africa.” Staff Discussion Note 15/16, International Monetary Fund, Washington, DC.
Mitra, P., A. Hosny, G. Abajyan, and M. Fischer. 2015. “Estimating Potential Growth in the Middle East and Central Asia.” Working Paper 15/62, International Monetary Fund, Washington, DC.
Mitra, P., A. Hosny, G. Minasyan, G. Abajyan, and M. Fischer. 2016. “Avoiding the New Mediocre: Raising Potential Growth in the Middle East and Central Asia.” Middle East and Central Asia Departmental Paper 16/1, International Monetary Fund, Washington, DC.

45
2. MENAP OIL IMPORTERs: sTRIvING TO FOsTER INCLUsIvE GROwTh IN A ChALLENGING ENvIRONMENT
International Monetary Fund | October 2016
MENAP Oil Importers: Selected Economic IndicatorsProjections
Average 2011–12 2013 2014 2015 2016 2017
Real GDP Growth 4.6 3.2 2.9 3.8 3.6 4.2(Annual change; percent)
Afghanistan, Rep. of … 3.9 1.3 0.8 2.0 3.4djibouti 3.7 5.0 6.0 6.5 6.5 7.0Egypt 4.5 2.1 2.2 4.2 3.8 4.0Jordan 5.6 2.8 3.1 2.4 2.8 3.3Lebanon 4.6 2.5 2.0 1.0 1.0 2.0Mauritania 4.6 6.1 5.4 1.2 3.2 4.3Morocco 4.6 4.5 2.6 4.5 1.8 4.8Pakistan 4.4 3.7 4.1 4.0 4.7 5.0sudan1 5.9 5.2 1.6 4.9 3.1 3.5syrian Arab Republic2 4.3 … … … … …Tunisia 3.9 2.4 2.3 0.8 1.5 2.8west Bank and Gaza3 4.2 2.2 -0.2 3.5 3.3 3.5
Consumer Price Inflation 5.5 9.1 9.4 6.6 7.4 9.8(Year average; percent)
Afghanistan, Rep. of … 7.4 4.7 –1.5 4.5 6.0djibouti 3.6 2.4 2.9 2.1 3.0 3.5Egypt 3.3 9.5 10.1 10.4 14.0 17.3Jordan 3.9 4.8 2.9 –0.9 –0.5 2.3Lebanon 3.1 4.8 1.9 –3.7 –0.7 2.0Mauritania 6.1 4.1 3.8 0.5 1.3 4.2Morocco 1.7 1.9 0.4 1.5 1.3 1.3Pakistan 8.5 7.4 8.6 4.5 2.9 5.2sudan1 11.8 36.5 36.9 16.9 13.5 16.1syrian Arab Republic2 4.9 … … … … …Tunisia 3.1 5.8 4.9 4.9 3.7 3.9west Bank and Gaza3 3.8 1.7 1.7 1.4 1.1 1.2
General Gov. Overall Fiscal Balance –5.2 –9.4 –7.8 –7.3 –7.0 –5.8(Percent of GDP)
Afghanistan, Rep. of4 … –0.6 –1.7 –1.4 0.1 0.0djibouti –1.9 –5.9 –12.2 –15.7 2.1 3.3Egypt –7.4 –13.4 –12.9 –11.5 –12.0 –9.7Jordan5 –4.7 –11.1 –10.3 –5.4 –3.8 –2.6Lebanon4 –11.9 –8.7 –6.0 –7.4 –8.1 –9.5Mauritania4,6 –2.6 –0.8 –3.3 –3.4 –0.4 –1.8Morocco4 –4.0 –5.2 –4.9 –4.4 –3.5 –3.0Pakistan7 –4.4 –8.4 –4.9 –5.2 –4.4 –3.6sudan1 –1.2 –2.3 –1.4 –1.9 –2.0 –2.1syrian Arab Republic2 … … … … … …Tunisia8 –2.7 –7.4 –3.9 –5.1 –4.5 –3.6west Bank and Gaza3 –24.1 –12.6 –12.5 –11.4 –9.6 –9.3
sources: National authorities; and IMF staff estimates and projections. Note: variables reported on a fiscal year basis for Afghanistan (March 21/March 20) until 2011, and december 21/december 20 thereafter, and Egypt and Pakistan (July/June), except inflation.1data for 2011 exclude south sudan after July 9. data for 2012 and onward pertain to the current sudan.22011–17 data exclude syria due to the uncertain political situation.3west Bank and Gaza is not a member of the IMF and is not included in any of the aggregates.4Central government. For Jordan, includes transfers to electricity company.5Overall fiscal balance includes the transfers to the electricity company NEPCO until the end of 2014. From 2015 transfers were stopped.6Includes oil revenue transferred to the oil fund.7Including grants.8Includes bank recapitalization costs and arrears payments.
(continues)

46
REGIONAL ECONOMIC OUTLOOK: MIddLE EAsT ANd CENTRAL AsIA
International Monetary Fund | October 2016
MENAP Oil Importers: Selected Economic Indicators (continued)Projections
Average 2011–12 2013 2014 2015 2016 2017
Current Account Balance –2.5 –5.1 –4.4 –4.5 –4.8 –4.7(Percent of GDP)
Afghanistan, Rep. of … 8.7 2.4 4.7 4.5 1.1djibouti –7.9 –23.3 –25.6 –30.7 –17.2 –14.4Egypt –0.4 –2.2 –0.8 –3.7 –5.8 –5.2Jordan –5.8 –10.3 –6.8 –9.0 –9.0 –8.9Lebanon –14.7 –26.7 –28.1 –21.0 –20.4 –20.6Mauritania –14.8 –28.6 –33.3 –27.0 –21.9 –24.9Morocco –3.0 –7.6 –5.7 –1.9 –1.2 –1.4Pakistan –1.3 –1.1 –1.3 –1.0 –0.9 –1.5sudan1 –5.3 –8.7 –7.0 –7.8 –5.9 –4.9syrian Arab Republic2 –0.4 … … … … …Tunisia –3.8 –8.4 –9.1 –8.8 –8.0 –6.9west Bank and Gaza3 –17.8 –12.3 –7.4 –13.5 –13.4 –11.4
sources: National authorities; and IMF staff estimates and projections. Note: variables reported on a fiscal year basis for Afghanistan (March 21/March 20) until 2011, and december 21/december 20 thereafter, and Egypt and Pakistan (July/June), except inflation.1data for 2011 exclude south sudan after July 9. data for 2012 and onward pertain to the current sudan.22011–17 data exclude syria due to the uncertain political situation.3west Bank and Gaza is not a member of the IMF and is not included in any of the aggregates.4Central government. For Jordan, includes transfers to electricity company.5Overall fiscal balance includes the transfers to the electricity company NEPCO until the end of 2014. From 2015 transfers were stopped.6Includes oil revenue transferred to the oil fund.7Including grants.8Includes bank recapitalization costs and arrears payments.


