MIDAS Pilot Study Final Report Project title: Using Non ...aarti/pubs/flureport.pdf · MIDAS Pilot...
14
MIDAS Pilot Study Final Report Project title: Using Non-Local Connectivity Information to Identify Nascent Disease Outbreaks Tongbo Huang, James Sharpnack and Aarti Singh Carnegie Mellon University 1 Specific Aims A recent innovation in the modeling of the spread of epidemics is the use of crude and unreliable indicators such as web search queries, school absenteeism, or thermometer sales that are easily monitored in human populations. However, most state-of-the-art disease outbreak detection meth- ods use the gravity model to fuse data from local nearby regions [8, 15, 13, 17, 11, 14] to boost the signal-to-noise ratio of such indicators. This pilot study was aimed at investigating the use of non-local connectivity information, such as air-traffic data, to detect epidemics like influenza in their nascent stages. Specifically, we targeted the following two goals: 1) Identify the occurrence of an influenza out- break in its nascent stages by exploiting the structure of the non-local connectivity graph between geographically disparate regions. 2) Learn the non-local connectivity graph which influences spread of the influenza virus between different locations. In this project, we focused on detecting influenza outbreaks using ILI (Influenza like illness) rates based on Google search queries. Our results indicate that air traffic networks can be exploited to perform detection of influenza outbreaks earlier than gravity based models. Furthermore, we attempted to learn the network of dependency between ILI counts at different cities from data and it was found to be very similar to the air traffic graph, again emphasizing the role that non-local connectivity plays in spread of a disease. As part of this study, we also developed two tools that effectively visualize and summarize data about disease intensity at US cities in general, and more specifically Google flu trend data and live Twitter feeds. 2 Studies and Results 2.1 Introduction Disease outbreaks such as the seasonal influenza epidemics, have a signicant impact on public health. Seasonal influenza accounted for an average of 41,400 death per year within the US from 1979 to 2001 with high variability (a 95% confidence interval of 27,100 to 55,700) [9]. Influenza has a mild effect on most individuals, but for high-risk individuals, influenza may cause complications such as pneumonia, bronchitis, sinus infections and ear infections. The center for disease control’s (CDC) most recommended preventative measure for influenza is a yearly flu-vaccine. It would clearly be advantageous to preempt a severe influenza outbreak by timely detection in order to 1
Transcript of MIDAS Pilot Study Final Report Project title: Using Non ...aarti/pubs/flureport.pdf · MIDAS Pilot...
MIDAS Pilot Study Final Report
Project title: Using Non-Local Connectivity Information
to Identify Nascent Disease Outbreaks
Tongbo Huang, James Sharpnack and Aarti SinghCarnegie Mellon University
1 Specific Aims
A recent innovation in the modeling of the spread of epidemics is the use of crude and unreliableindicators such as web search queries, school absenteeism, or thermometer sales that are easilymonitored in human populations. However, most state-of-the-art disease outbreak detection meth-ods use the gravity model to fuse data from local nearby regions [8, 15, 13, 17, 11, 14] to boostthe signal-to-noise ratio of such indicators. This pilot study was aimed at investigating the useof non-local connectivity information, such as air-traffic data, to detect epidemics like influenza intheir nascent stages.
Specifically, we targeted the following two goals: 1) Identify the occurrence of an influenza out-break in its nascent stages by exploiting the structure of the non-local connectivity graph betweengeographically disparate regions. 2) Learn the non-local connectivity graph which influences spreadof the influenza virus between different locations.
In this project, we focused on detecting influenza outbreaks using ILI (Influenza like illness)rates based on Google search queries. Our results indicate that air traffic networks can be exploitedto perform detection of influenza outbreaks earlier than gravity based models. Furthermore, weattempted to learn the network of dependency between ILI counts at different cities from data andit was found to be very similar to the air traffic graph, again emphasizing the role that non-localconnectivity plays in spread of a disease. As part of this study, we also developed two tools thateffectively visualize and summarize data about disease intensity at US cities in general, and morespecifically Google flu trend data and live Twitter feeds.
2 Studies and Results
2.1 Introduction
Disease outbreaks such as the seasonal influenza epidemics, have a signicant impact on publichealth. Seasonal influenza accounted for an average of 41,400 death per year within the US from1979 to 2001 with high variability (a 95% confidence interval of 27,100 to 55,700) [9]. Influenza hasa mild effect on most individuals, but for high-risk individuals, influenza may cause complicationssuch as pneumonia, bronchitis, sinus infections and ear infections. The center for disease control’s(CDC) most recommended preventative measure for influenza is a yearly flu-vaccine. It wouldclearly be advantageous to preempt a severe influenza outbreak by timely detection in order to
1
strategically take preventative measures and to prepare for influenza complications. We concernourselves with all illnesses that have influenza symptoms, ILIs. Thus, our analysis includes notonly seasonal influenza but also pandemic influenza such as H1N1.
It is very difficult to obtain directly ILI rate measurements in real time. As an alternative, newstrategies have been developed that use measurements of related quantities, such as search querieson Google, school absenteeism, or thermometer sales. Google search queries have been monitoredfor health-seeking behavior, which has been proven to be associated with published ILI rates, asmeasured by the CDC as the percentage of patient visits with ILI symptoms [10].
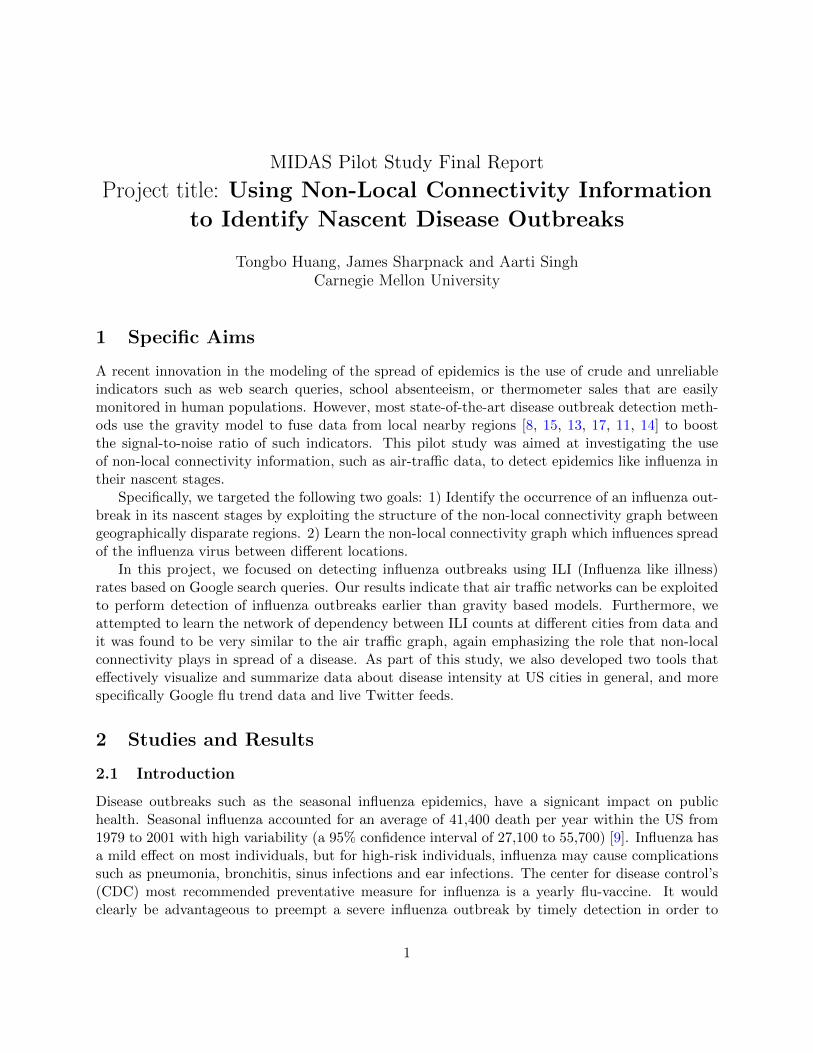
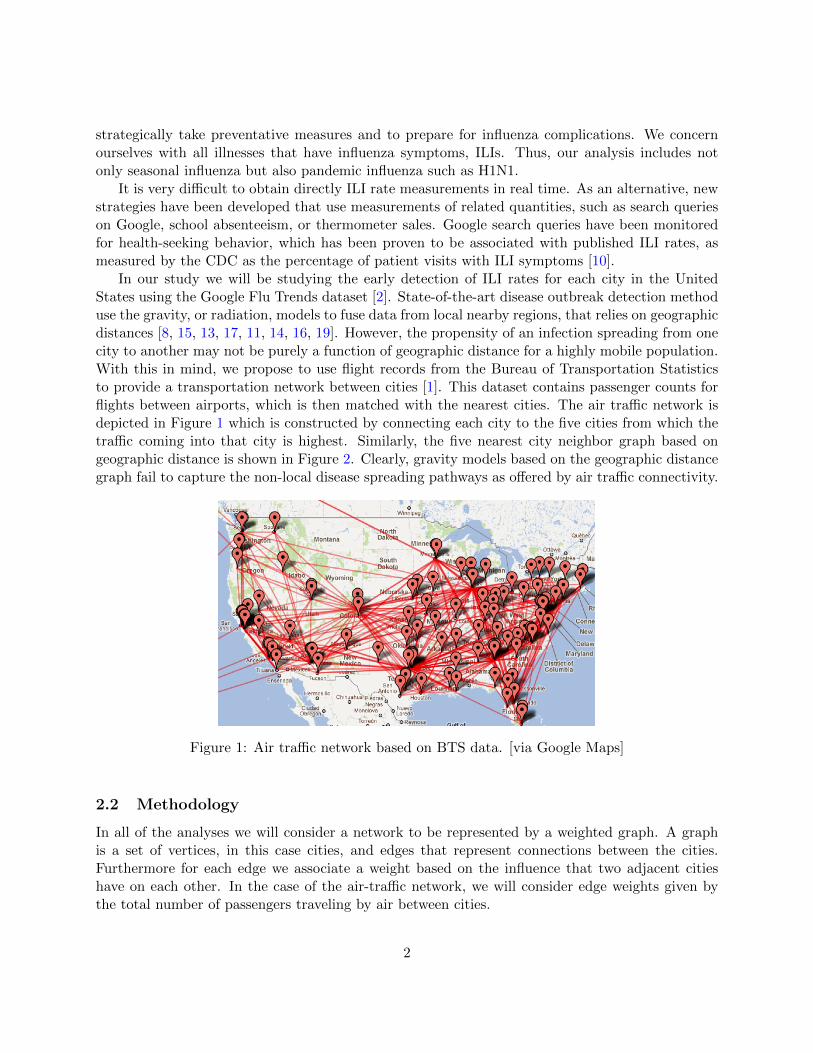
In our study we will be studying the early detection of ILI rates for each city in the UnitedStates using the Google Flu Trends dataset [2]. State-of-the-art disease outbreak detection methoduse the gravity, or radiation, models to fuse data from local nearby regions, that relies on geographicdistances [8, 15, 13, 17, 11, 14, 16, 19]. However, the propensity of an infection spreading from onecity to another may not be purely a function of geographic distance for a highly mobile population.With this in mind, we propose to use flight records from the Bureau of Transportation Statisticsto provide a transportation network between cities [1]. This dataset contains passenger counts forflights between airports, which is then matched with the nearest cities. The air traffic network isdepicted in Figure 1 which is constructed by connecting each city to the five cities from which thetraffic coming into that city is highest. Similarly, the five nearest city neighbor graph based ongeographic distance is shown in Figure 2. Clearly, gravity models based on the geographic distancegraph fail to capture the non-local disease spreading pathways as offered by air traffic connectivity.
Figure 1: Air traffic network based on BTS data. [via Google Maps]
2.2 Methodology
In all of the analyses we will consider a network to be represented by a weighted graph. A graphis a set of vertices, in this case cities, and edges that represent connections between the cities.Furthermore for each edge we associate a weight based on the influence that two adjacent citieshave on each other. In the case of the air-traffic network, we will consider edge weights given bythe total number of passengers traveling by air between cities.
2
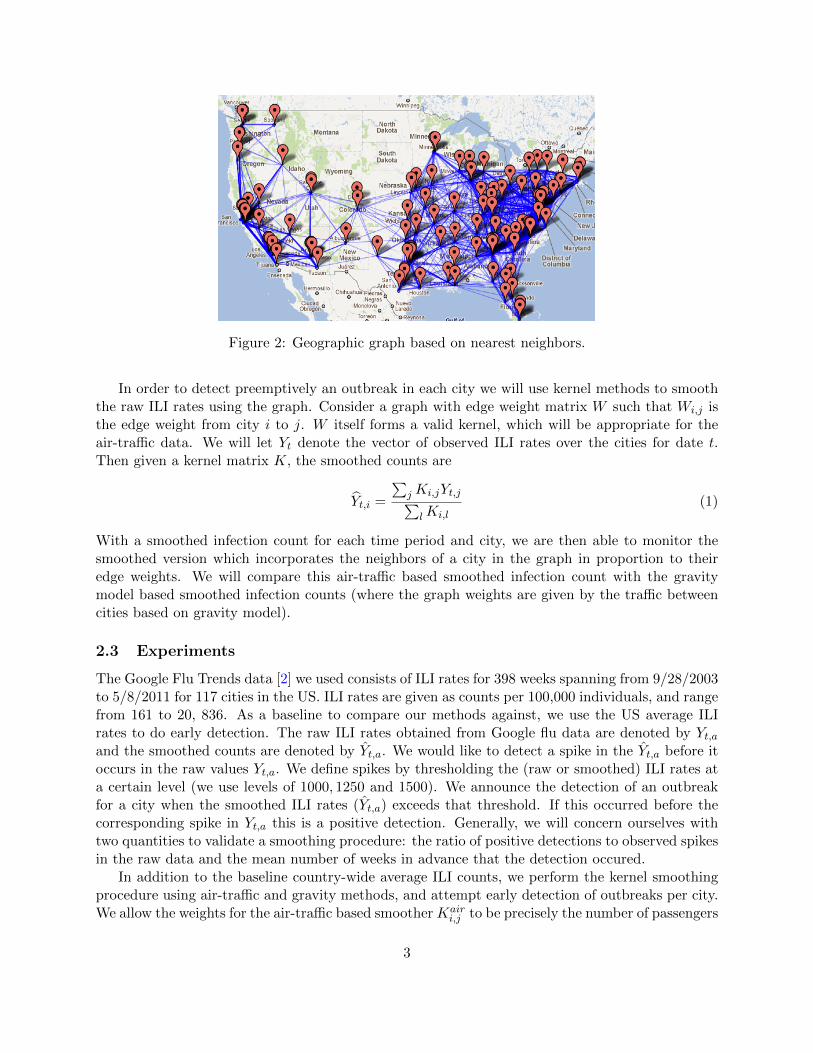
Figure 2: Geographic graph based on nearest neighbors.
In order to detect preemptively an outbreak in each city we will use kernel methods to smooththe raw ILI rates using the graph. Consider a graph with edge weight matrix W such that Wi,j isthe edge weight from city i to j. W itself forms a valid kernel, which will be appropriate for theair-traffic data. We will let Yt denote the vector of observed ILI rates over the cities for date t.Then given a kernel matrix K, the smoothed counts are
Yt,i =
∑jKi,jYt,j∑lKi,l
(1)
With a smoothed infection count for each time period and city, we are then able to monitor thesmoothed version which incorporates the neighbors of a city in the graph in proportion to theiredge weights. We will compare this air-traffic based smoothed infection count with the gravitymodel based smoothed infection counts (where the graph weights are given by the traffic betweencities based on gravity model).
2.3 Experiments
The Google Flu Trends data [2] we used consists of ILI rates for 398 weeks spanning from 9/28/2003to 5/8/2011 for 117 cities in the US. ILI rates are given as counts per 100,000 individuals, and rangefrom 161 to 20, 836. As a baseline to compare our methods against, we use the US average ILIrates to do early detection. The raw ILI rates obtained from Google flu data are denoted by Yt,aand the smoothed counts are denoted by Yt,a. We would like to detect a spike in the Yt,a before itoccurs in the raw values Yt,a. We define spikes by thresholding the (raw or smoothed) ILI rates ata certain level (we use levels of 1000, 1250 and 1500). We announce the detection of an outbreakfor a city when the smoothed ILI rates (Yt,a) exceeds that threshold. If this occurred before thecorresponding spike in Yt,a this is a positive detection. Generally, we will concern ourselves withtwo quantities to validate a smoothing procedure: the ratio of positive detections to observed spikesin the raw data and the mean number of weeks in advance that the detection occured.
In addition to the baseline country-wide average ILI counts, we perform the kernel smoothingprocedure using air-traffic and gravity methods, and attempt early detection of outbreaks per city.We allow the weights for the air-traffic based smoother Kair
i,j to be precisely the number of passengers
3

that traveled by air from city i to city j. Then we calculate the air-traffic based smoothed ILI ratesby equation (1). We compare the performance of the air-traffic kernel to that of a geographicdistance based kernel. We utilize the gravity model to estimate ground traffic between populationsand determine a kernel matrix Kgrav for geographic distances. We allow the elements of Kgrav tobe proportionate the estimated amount of ground traffic by,
Kgravi,j = C
Nαi N
γj
f(di,j)
where Ni, Nj is the populations of cities i and j and di,j is the geographic distance between thecities. The exact specifications of α, γ, f and C are given in [7]. Then equation (1) is used to obtaingravity smoothed ILI rates.
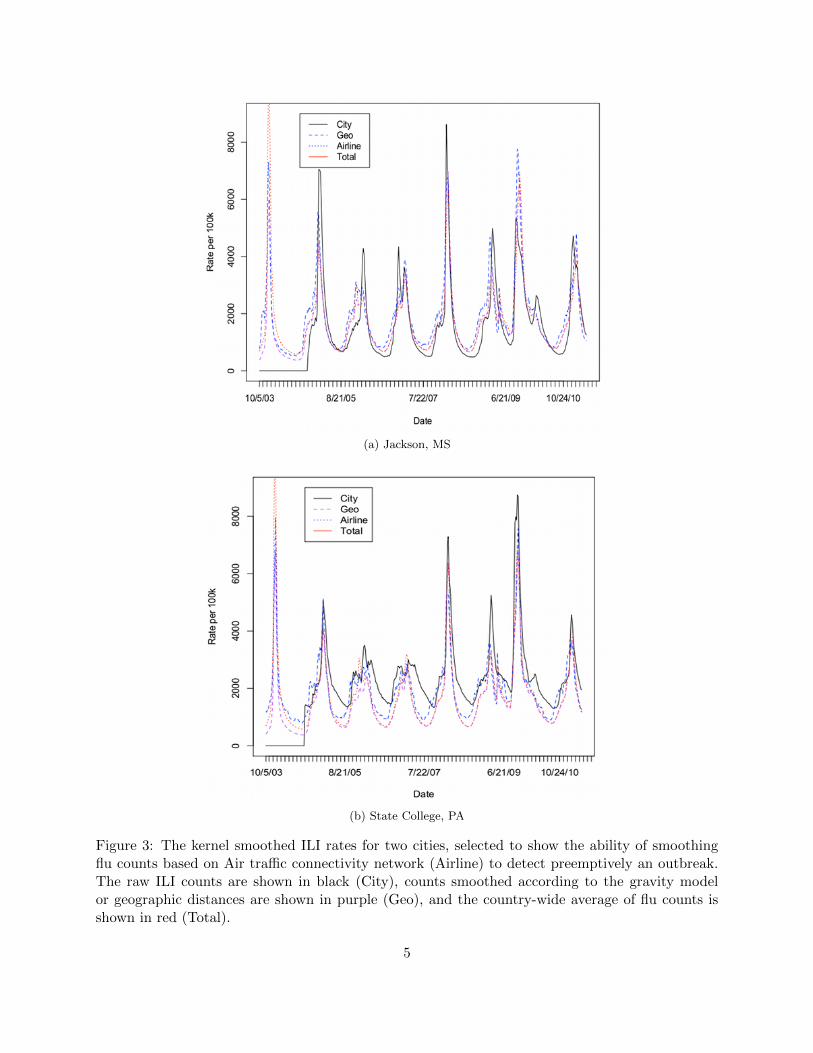
Figure 3 show the raw time series observations (‘City’), air-traffic smoothed ILI rates (‘Airline’),and geographically smoothed ILI rates (‘Geo’) for two representative cities - Jackson, MS and StateCollege, PA. Also, shown are the global ILI rates (‘Total’). Notice that every tick mark on thex-axis represents a 5-week period. We observe that for many cities (such as Jackson, MS shownhere) the Airline smoothed counts lead the raw city counts, geographically averaged counts as wellas total counts by 2-3 weeks. For some other cities (such as State College, PA shown here) theairline smoothed counts may not lead significantly but are usually not worse than the other counts.This suggests that monitoring air-traffic smoothed counts can often lead to early detection of fluoutbreak.
We study this phenomena quantitatively in more detail. Table 1 gives the percentages ofinfection spikes that are detected by different smoothing techniques by the weeks prior to raw ILIcounts exceeding the same threshold, averaged across all cities. The ‘US’ column corresponds tocountry-wide average, the ‘air’ column corresponds to air traffic smoothed counts, and the ‘gravity’column corresponds to smoothing using gravity-model based weights. We also consider a smoother‘AG’ that uses combination of traffic information from air-traffic and gravity-model based trafficcounts i.e. simply the average of air and ground traffic counts. For every smoothing technique,the table also lists the mean number of weeks in advance that it can predict if the raw counts areexpected to exceed the threshold, as well as the accuracy (the percentage of times the techniqueis able to predict earlier). We see that at low ILI rate epidemic threshold, the air-traffic smootherperforms better than both the US average and the gravity model. Since low ILI rates correspondto the outbreak being in its nascent stages, this is the most useful regime in pre-empting epidemics.Thus, air traffic based smoothing can help preempt outbreaks by more than 3 weekson average for low ILI rates. As the ILI threshold increases, the advantage due to air-trafficsmoother decreases. When the ILI rates become high enough, the flu activity can now be detectedin global US average, and thus it starts performing better than air traffic smoothing (as expected).This indicates that air-traffic is able to detect an outbreak in its nascent stages, but is not effectiveas an indicator when the epidemic has already exceeded large ILI rates. The ability of the gravitymodel to detect an epidemic increases with ILI threshold, however it never performs better thanthe air-traffic based smoother or even the global smoother. The estimator ‘AG’ which uses bothair traffic and gravity model together doesn’t yield any performance gains over air-traffic alone.We believe this might be because the gravity based traffic estimate between two cities is very highcompared to the air traffic between two cities, and thus biases the combined estimate to the gravitymodel leading to worse performance.
4
(a) Jackson, MS
(b) State College, PA
Figure 3: The kernel smoothed ILI rates for two cities, selected to show the ability of smoothingflu counts based on Air traffic connectivity network (Airline) to detect preemptively an outbreak.The raw ILI counts are shown in black (City), counts smoothed according to the gravity modelor geographic distances are shown in purple (Geo), and the country-wide average of flu counts isshown in red (Total).
5

ILI thresh 1000 1250 1500weeks US air gravity AG US air gravity AG US air gravity AG0 39.1(%) 30.9 41.8 37.9 42.4 36 46.2 37.4 39.8 47.6 44.6 44.81 10.5 11 11.6 9.2 10.4 12 10.7 12.6 7.9 12.1 7.2 8.32 9.9 8.6 12.2 11.5 11.3 11.7 8.2 12.3 8.7 8.9 9.2 7.93 9.1 10.8 7.3 10.7 6.2 8 6.5 7.7 7.3 8.7 5 8.74 8.6 10.4 6.2 7.6 4.5 7.6 2.7 6.3 4.9 5.8 4.4 3.95 4.5 8 2.3 4.2 3 2.4 3.3 2 4.6 3.8 4 3.66 2.2 3.1 2.6 2.3 2.7 3.2 2.8 3.3 2.9 3.2 3.2 2.97 3.2 2.5 2 2.2 2.4 2.6 2.3 2.4 3.9 2.4 2.6 3.28 1.4 1.2 2 2.3 1.7 2.4 2.2 2 2.3 2.2 3 1.89 0.9 2.6 0.9 1.2 2.6 1.8 1.6 1.8 3.2 1.9 2.6 2.310 1.9 1 2.2 1.4 1.9 1.6 2.1 1.9 3.2 1.9 3.9 2.211 2.7 2.6 2.6 2.4 2.1 1.5 2.7 1.5 2.5 0.8 3.3 2.912 2.2 1.9 2.2 2.7 2.1 3.1 2.8 2.8 3.4 0.3 2.7 3.513 1.4 2.5 1.6 2.3 2.8 2.4 2.7 2.4 2 0.1 1.7 2.214 1.1 1.6 1.2 0.8 2.1 2.4 1.2 2.4 2.2 0.1 1.4 1.115 1.5 1.4 1.5 1.2 1.8 1.4 2.2 1.1 1.2 0.1 1.3 0.8mean 2.99 3.47 2.83 3.07 3.15 3.28 3.06 3.15 3.57 2.05 3.31 3.09accuracy 61(%) 69 58 62 58 64 54 63 60 52 55 55
Table 1: ILI spikes are defined as increase of ILI rates above the outbreak threshold(1000, 1250, 1500). We report the percentages of epidemic detections by weeks prior to infection,the mean weeks in advance, and the percent of epidemics detected in advance (accuracy). Theresults are given for prediction with the US average (US), the air traffic smoothing (air), gravitymodel smoothing (gravity), and the combined estimates (AG).
In the analysis presented above, the smoothed ILI counts at each city are obtained by a weightedaverage of all other cities. This might make the smoothed ILI rates more similar to the US average.As a possible remedy, we also considered truncating the kernel or weights such that only the k-nearest neighbors (kNN) to a city are non-zero. Namely, if the kernel matrix is K and the k-thlargest observation in row i is Ki,(k) then we set
Kknni,j =
{Ki,j , if Ki,j ≥ Ki,(k)
0, otherwise
The results of air-traffic and gravity based smoothing using this nearest-neighbor procedure arelisted in tables 2 and 3 for two different values of k = 5, 10. However, the performance with k = 5is slightly worse. Also, notice that one cannot distinguish between the air-traffic results for the 10-nearest neighbors graph and the original air-traffic kernel smoother in Table 1. The mean weeks inadvance for both these methods using an ILI threshold of 1000 for the air-traffic network smoothersis 3.47 weeks.
2.4 Learning the dependency graph
To verify the role of air traffic connectivity on disease spread further, we attempted to learn thegraph of dependencies between the ILI counts at different cities. Towards this end, we used a
6
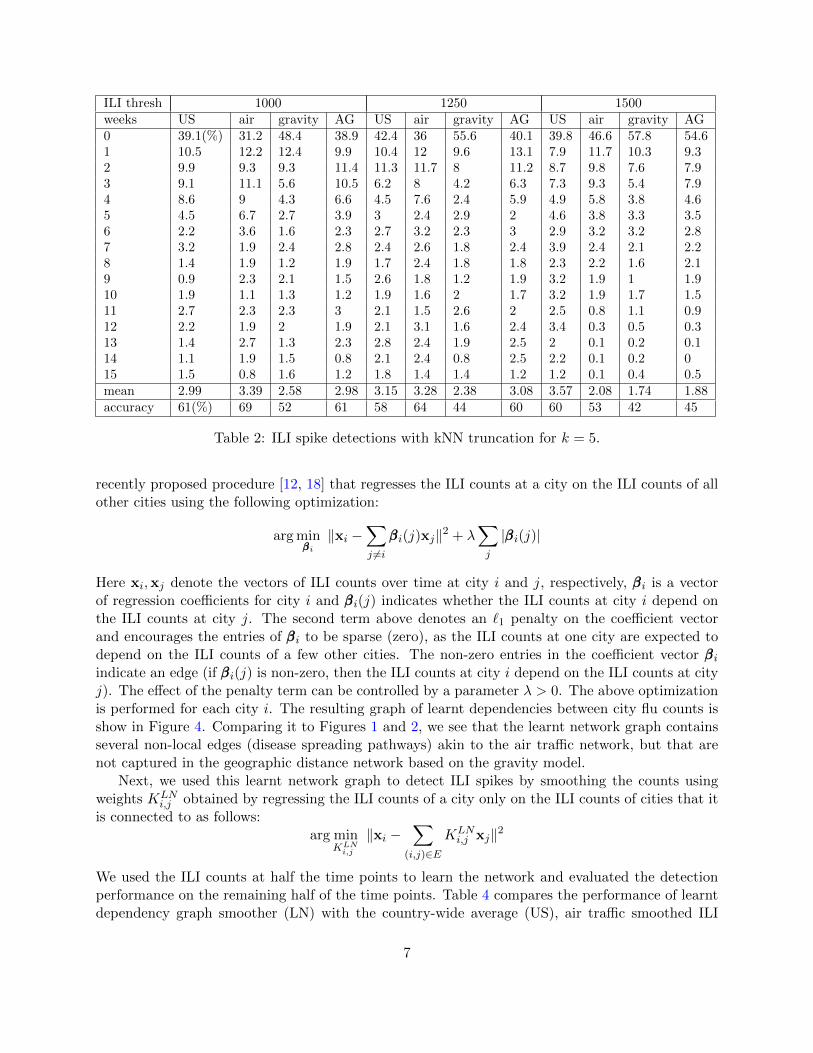
ILI thresh 1000 1250 1500weeks US air gravity AG US air gravity AG US air gravity AG0 39.1(%) 31.2 48.4 38.9 42.4 36 55.6 40.1 39.8 46.6 57.8 54.61 10.5 12.2 12.4 9.9 10.4 12 9.6 13.1 7.9 11.7 10.3 9.32 9.9 9.3 9.3 11.4 11.3 11.7 8 11.2 8.7 9.8 7.6 7.93 9.1 11.1 5.6 10.5 6.2 8 4.2 6.3 7.3 9.3 5.4 7.94 8.6 9 4.3 6.6 4.5 7.6 2.4 5.9 4.9 5.8 3.8 4.65 4.5 6.7 2.7 3.9 3 2.4 2.9 2 4.6 3.8 3.3 3.56 2.2 3.6 1.6 2.3 2.7 3.2 2.3 3 2.9 3.2 3.2 2.87 3.2 1.9 2.4 2.8 2.4 2.6 1.8 2.4 3.9 2.4 2.1 2.28 1.4 1.9 1.2 1.9 1.7 2.4 1.8 1.8 2.3 2.2 1.6 2.19 0.9 2.3 2.1 1.5 2.6 1.8 1.2 1.9 3.2 1.9 1 1.910 1.9 1.1 1.3 1.2 1.9 1.6 2 1.7 3.2 1.9 1.7 1.511 2.7 2.3 2.3 3 2.1 1.5 2.6 2 2.5 0.8 1.1 0.912 2.2 1.9 2 1.9 2.1 3.1 1.6 2.4 3.4 0.3 0.5 0.313 1.4 2.7 1.3 2.3 2.8 2.4 1.9 2.5 2 0.1 0.2 0.114 1.1 1.9 1.5 0.8 2.1 2.4 0.8 2.5 2.2 0.1 0.2 015 1.5 0.8 1.6 1.2 1.8 1.4 1.4 1.2 1.2 0.1 0.4 0.5mean 2.99 3.39 2.58 2.98 3.15 3.28 2.38 3.08 3.57 2.08 1.74 1.88accuracy 61(%) 69 52 61 58 64 44 60 60 53 42 45
Table 2: ILI spike detections with kNN truncation for k = 5.
recently proposed procedure [12, 18] that regresses the ILI counts at a city on the ILI counts of allother cities using the following optimization:
arg minβββi
‖xi −∑j 6=i
βββi(j)xj‖2 + λ∑j
|βββi(j)|
Here xi,xj denote the vectors of ILI counts over time at city i and j, respectively, βββi is a vectorof regression coefficients for city i and βββi(j) indicates whether the ILI counts at city i depend onthe ILI counts at city j. The second term above denotes an `1 penalty on the coefficient vectorand encourages the entries of βββi to be sparse (zero), as the ILI counts at one city are expected todepend on the ILI counts of a few other cities. The non-zero entries in the coefficient vector βββiindicate an edge (if βββi(j) is non-zero, then the ILI counts at city i depend on the ILI counts at cityj). The effect of the penalty term can be controlled by a parameter λ > 0. The above optimizationis performed for each city i. The resulting graph of learnt dependencies between city flu counts isshow in Figure 4. Comparing it to Figures 1 and 2, we see that the learnt network graph containsseveral non-local edges (disease spreading pathways) akin to the air traffic network, but that arenot captured in the geographic distance network based on the gravity model.
Next, we used this learnt network graph to detect ILI spikes by smoothing the counts usingweights KLN
i,j obtained by regressing the ILI counts of a city only on the ILI counts of cities that itis connected to as follows:
arg minKLN
i,j
‖xi −∑
(i,j)∈E
KLNi,j xj‖2
We used the ILI counts at half the time points to learn the network and evaluated the detectionperformance on the remaining half of the time points. Table 4 compares the performance of learntdependency graph smoother (LN) with the country-wide average (US), air traffic smoothed ILI
7
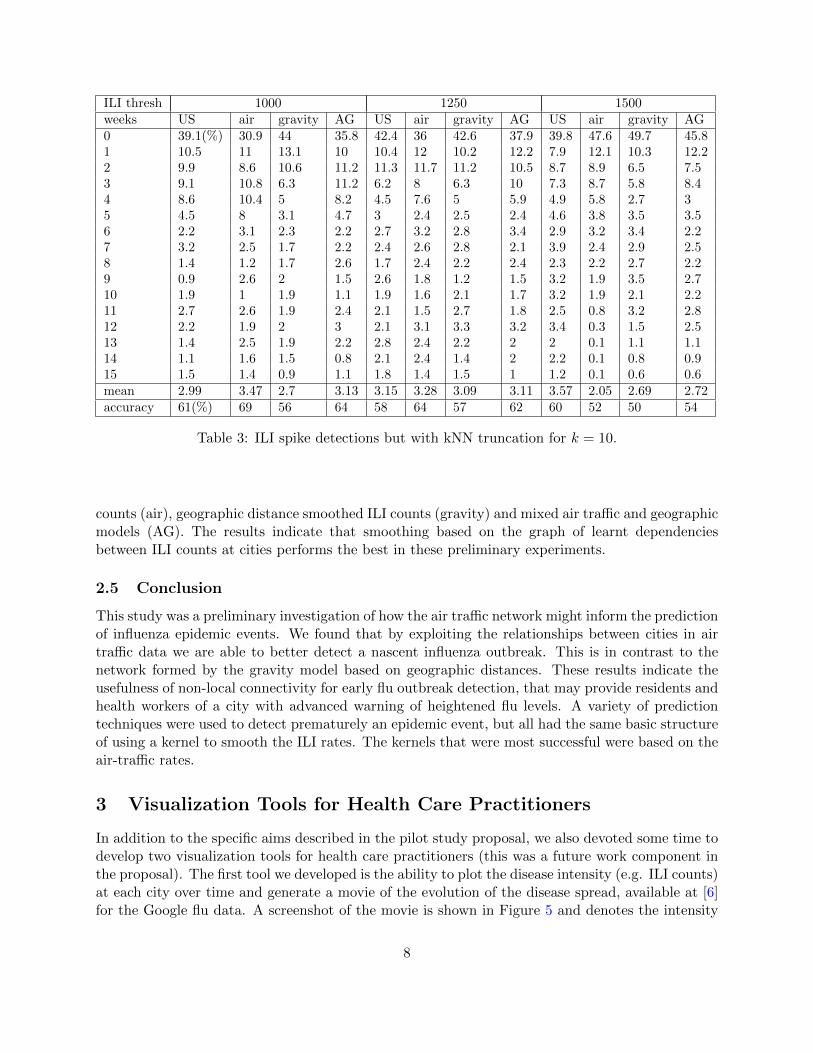
ILI thresh 1000 1250 1500weeks US air gravity AG US air gravity AG US air gravity AG0 39.1(%) 30.9 44 35.8 42.4 36 42.6 37.9 39.8 47.6 49.7 45.81 10.5 11 13.1 10 10.4 12 10.2 12.2 7.9 12.1 10.3 12.22 9.9 8.6 10.6 11.2 11.3 11.7 11.2 10.5 8.7 8.9 6.5 7.53 9.1 10.8 6.3 11.2 6.2 8 6.3 10 7.3 8.7 5.8 8.44 8.6 10.4 5 8.2 4.5 7.6 5 5.9 4.9 5.8 2.7 35 4.5 8 3.1 4.7 3 2.4 2.5 2.4 4.6 3.8 3.5 3.56 2.2 3.1 2.3 2.2 2.7 3.2 2.8 3.4 2.9 3.2 3.4 2.27 3.2 2.5 1.7 2.2 2.4 2.6 2.8 2.1 3.9 2.4 2.9 2.58 1.4 1.2 1.7 2.6 1.7 2.4 2.2 2.4 2.3 2.2 2.7 2.29 0.9 2.6 2 1.5 2.6 1.8 1.2 1.5 3.2 1.9 3.5 2.710 1.9 1 1.9 1.1 1.9 1.6 2.1 1.7 3.2 1.9 2.1 2.211 2.7 2.6 1.9 2.4 2.1 1.5 2.7 1.8 2.5 0.8 3.2 2.812 2.2 1.9 2 3 2.1 3.1 3.3 3.2 3.4 0.3 1.5 2.513 1.4 2.5 1.9 2.2 2.8 2.4 2.2 2 2 0.1 1.1 1.114 1.1 1.6 1.5 0.8 2.1 2.4 1.4 2 2.2 0.1 0.8 0.915 1.5 1.4 0.9 1.1 1.8 1.4 1.5 1 1.2 0.1 0.6 0.6mean 2.99 3.47 2.7 3.13 3.15 3.28 3.09 3.11 3.57 2.05 2.69 2.72accuracy 61(%) 69 56 64 58 64 57 62 60 52 50 54
Table 3: ILI spike detections but with kNN truncation for k = 10.
counts (air), geographic distance smoothed ILI counts (gravity) and mixed air traffic and geographicmodels (AG). The results indicate that smoothing based on the graph of learnt dependenciesbetween ILI counts at cities performs the best in these preliminary experiments.
2.5 Conclusion
This study was a preliminary investigation of how the air traffic network might inform the predictionof influenza epidemic events. We found that by exploiting the relationships between cities in airtraffic data we are able to better detect a nascent influenza outbreak. This is in contrast to thenetwork formed by the gravity model based on geographic distances. These results indicate theusefulness of non-local connectivity for early flu outbreak detection, that may provide residents andhealth workers of a city with advanced warning of heightened flu levels. A variety of predictiontechniques were used to detect prematurely an epidemic event, but all had the same basic structureof using a kernel to smooth the ILI rates. The kernels that were most successful were based on theair-traffic rates.
3 Visualization Tools for Health Care Practitioners
In addition to the specific aims described in the pilot study proposal, we also devoted some time todevelop two visualization tools for health care practitioners (this was a future work component inthe proposal). The first tool we developed is the ability to plot the disease intensity (e.g. ILI counts)at each city over time and generate a movie of the evolution of the disease spread, available at [6]for the Google flu data. A screenshot of the movie is shown in Figure 5 and denotes the intensity
8

Figure 4: ILI count dependency graph (dark edges) between cities learnt from Google flu trenddata.
of flu both by the color and size of circles centered at each city. One can get detailed values byhovering mouse over the circle as shown in the Figure. This helps us visualize how geographicallydisparate cities such as Chicago, New York, Houston and Los Angeles tend to experience diseaseoutbreaks at the same time as they are connected by heavy air traffic.
The second tool we developed relies on twitter data instead of the Google flu trend data.Inspired by the Now Trending Health Challenge [5] announced by US Office of ASPR (AssistantSecretary for Preparedness and Response), we investigated the use of twitter data for identifyingwhich illnesses are trending, i.e. are either starting to spread or becoming of concern to people, atany point in time. We developed a preliminary web-based live application tool [3] that demonstratesthe results of this investigation and is available to health-care practitioners online. As shown inFigure 6, the tool currently depicts the percentage of tweets related to a particular illness prior tothe query time in various formats. The user can specify which illnesses are of interest. We hopeto augment this tool to also declare early detection of an outbreak by using the detection methodswe investigated in this study that exploit connectivity between regions. As a first step towardsthis, we are making the analysis be region and duration specific using geo-tags and time stamps inthe twitter data. For example, a snapshot of tweets using 20 miles around Pittsburgh as region ofinterest and querying on ”west nile virus” results in the tweets shown in Figure 6.
4 Summary of Contributions
The contributions of this pilot study can be summarized as follows.
• In this pilot study we investigated whether non-local connectivity information can play a rolein identifying nascent disease outbreaks. Specifically, in the context of influenza like illnesses,our results indicate that using air traffic connectivity information performs better than simplyusing local traffic information as predicted by the commonly used gravity model, and can helppreempt flu outbreaks by more than 3 weeks on average.
9

ILI th 1000 1250 1500weeks US air grav. AG LN US air grav. AG LN US air grav. AG LN0 39.9 33.6 39.2 35.6 26.6 42.3 39.6 48 39.2 20.5 40 47.4 46.7 47.9 191 8.4 6.7 8.6 6.6 1.1 10.8 10.8 8.8 12.5 4.1 7.4 12.8 6.2 8.1 3.42 9.3 8.8 11.3 10 0 9.2 11.7 5.9 10.7 2.9 8 9.4 8.4 8.3 5.73 9.3 11.5 8 10.6 2.1 4.6 5 7.2 7.5 6.4 7.4 8.3 5.5 7.3 7.94 8.7 8.2 7.4 8.2 0 6.5 7.1 2.7 6.1 7 6.1 5.2 4.1 3.5 8.85 3.9 7.6 3.9 7.3 2.1 3 3.2 3.5 2.7 7 4.3 4.9 5.1 4.7 6.26 2.1 3.9 3.3 2.7 0 2.7 3.2 2.9 3.4 10.5 4.1 4.2 3.5 3.7 5.77 3.6 3.3 1.2 3 2.1 2.2 2.3 1.9 1.8 5.3 4.3 3.1 2.9 4.3 7.48 1.5 1.2 3 2.1 1.1 1.9 2.5 2.9 1.8 4.1 1.6 2 2.9 1.4 6.59 0.9 3 0.9 2.1 7.4 3.8 2.3 1.6 2.3 3.5 2.5 0.9 2.7 1.4 4.810 2.1 0.9 2.7 0.6 7.4 1.6 1.6 1.9 2.3 4.1 3.7 0.9 3.5 1.4 3.711 2.1 2.7 1.5 2.7 4.3 1.1 0.7 2.1 0.7 3.5 2.9 0.7 3.3 1.6 5.712 3.3 1.5 2.7 2.4 6.4 2.2 2.7 3.8 2 3.5 3.9 0.2 2.5 3.5 4.813 1.8 2.7 2.4 3.3 11.7 3.8 3 3.5 2.9 2.3 2 0 1.2 1.6 414 1.2 2.4 1.8 0.9 16 3.3 3.2 1.6 3.2 4.7 1 0 1 1 2.515 1.8 1.8 2.4 1.8 11.7 1.1 1.1 1.6 0.9 10.5 0.8 0 0.4 0.4 4mean 3.2 3.7 3.3 3.5 8.6 3.3 3.3 3.2 3.1 6.3 3.5 1.9 3.1 2.7 5.9acc. 60 66 61 64 73 58 60 52 61 80 60 53 53 52 81
Table 4: ILI spike detection rates as in Table 1 but including the results of smoothing using thelearnt dependency network (LN). The numbers for previous estimators (US, air, gravity and AG)look different than Table 1 because the evaluation is performed on only half the data. The remaininghalf of data was used to learn the dependency graph.
• We also learnt the graph of dependency between ILI counts at different cities from data and itwas found to be very similar to the air traffic graph, again emphasizing the role that non-localconnectivity plays in spread of a disease.
• As part of this study, two visualization tools were developed that can be used by healthcarepractitioners. One provides the ability to visualize disease intensity over time at each city inthe United States. The other is an online tool that provides a summary of diseases gaininginterest in the community based on live Twitter feeds.
• From an educational perspective, the project trained an undergraduate student on applyingmachine learning methods for a healthcare application, and developing user-friendly toolsthat can be used by practitioners. The student decided to pursue graduate studies and isnow enrolled as a Masters student in Computer Science at Carnegie Mellon.
5 Future Plans
In the future, we plan to extend this study in the following directions. This study does not explicitlyincorporate the known models of infection spread when performing detection. In particular, thereis no temporal modeling of the epidemic, but the results focus on processing time cross-sectionsof the data individually. Modelling epidemics as stochastic processes has a rich history, while thetheory of epidemics over networks is a relatively new direction of research. We intend to extendour methods to some reasonable infection models over graphs while maintaining computational
10
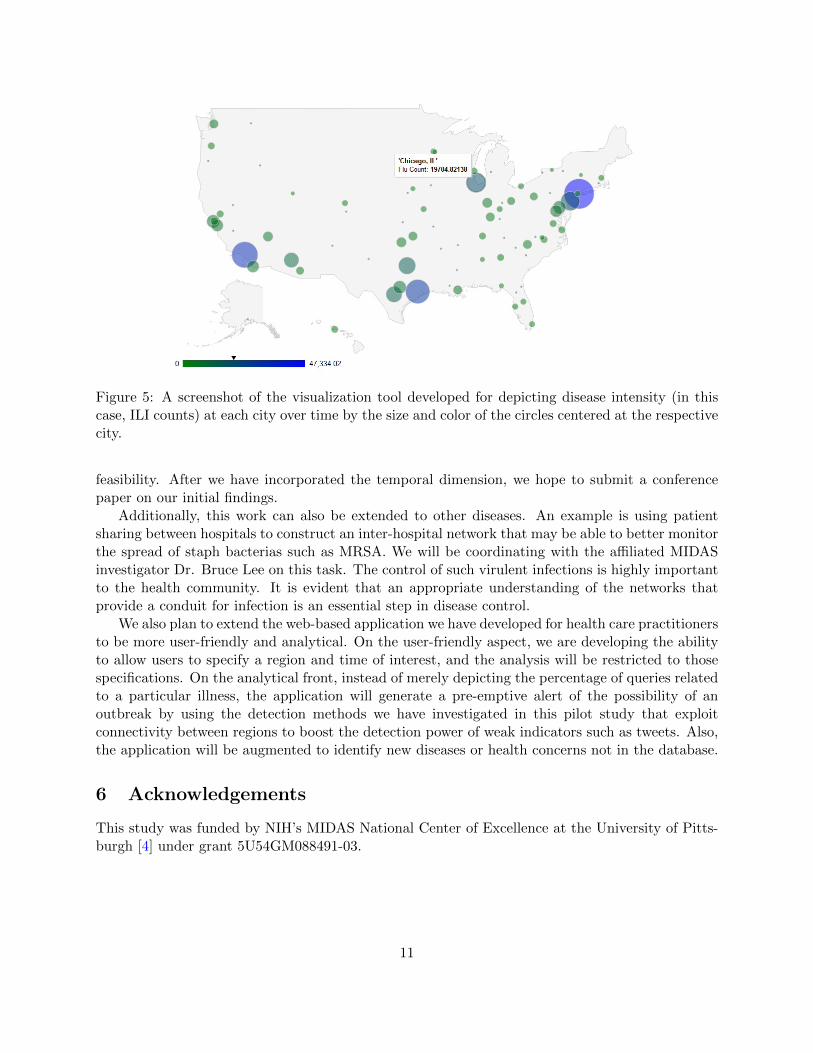
Figure 5: A screenshot of the visualization tool developed for depicting disease intensity (in thiscase, ILI counts) at each city over time by the size and color of the circles centered at the respectivecity.
feasibility. After we have incorporated the temporal dimension, we hope to submit a conferencepaper on our initial findings.
Additionally, this work can also be extended to other diseases. An example is using patientsharing between hospitals to construct an inter-hospital network that may be able to better monitorthe spread of staph bacterias such as MRSA. We will be coordinating with the affiliated MIDASinvestigator Dr. Bruce Lee on this task. The control of such virulent infections is highly importantto the health community. It is evident that an appropriate understanding of the networks thatprovide a conduit for infection is an essential step in disease control.
We also plan to extend the web-based application we have developed for health care practitionersto be more user-friendly and analytical. On the user-friendly aspect, we are developing the abilityto allow users to specify a region and time of interest, and the analysis will be restricted to thosespecifications. On the analytical front, instead of merely depicting the percentage of queries relatedto a particular illness, the application will generate a pre-emptive alert of the possibility of anoutbreak by using the detection methods we have investigated in this pilot study that exploitconnectivity between regions to boost the detection power of weak indicators such as tweets. Also,the application will be augmented to identify new diseases or health concerns not in the database.
6 Acknowledgements
This study was funded by NIH’s MIDAS National Center of Excellence at the University of Pitts-burgh [4] under grant 5U54GM088491-03.
11

Figure 6: A snapshot of the web-based application tool that depicts trending illnesses based onlive twitter feeds. The first two figure show types of data summaries returned and the last oneshows sample of tweets pulled up when querying for ”west nile virus” with a 20 mile radius aroundPittsburgh as region of interest. 12
References
[1] Bureau of transportation statistics. http://www.bts.gov.
[2] Google flu trends dataset. http://www.google.org/flutrends/.
[3] Live application tool to identify trending illnesses based on twitter data.http://quaker.pc.cs.cmu.edu:8000/now trending/map.
[4] MIDAS (Models of Infectious Disease Agent Study) National Center of Excellence at Universityof Pittsburgh. https://www.midas.pitt.edu/.
[5] Now Trending Health in My Community Challenge. http://www.nowtrendingchallenge.com/.
[6] U.S. Major Cities Flu Outbreak Data Visualization .http://www.cs.cmu.edu/ aarti/FluVisualization/flu visualization.avi.
[7] D. Balcan, V. Colizza, B. Goncalves, H. Hu, J. Ramasco, and A. Vespignani. Multiscalemobility networks and the spatial spreading of infectious diseases. Proceedings of the NationalAcademy of Sciences, 106(51):21484, 2009.
[8] M. Besculides, R. Heffernan, F. Mostashari, and D. Weiss. Evaluation of school absenteeismdata for early outbreak detection, new york city. BMC Public Health, 5:105, 2005.
[9] J. Dushoff, J. Plotkin, C. Viboud, D. Earn, and L. Simonsen. Mortality due to influenza in theunited statesan annualized regression approach using multiple-cause mortality data. AmericanJournal of Epidemiology, 163(2):181, 2006.
[10] J. Ginsberg, M. Mohebbi, R. Patel, L. Brammer, M. Smolinski, and L. Brilliant. Detectinginfluenza epidemics using search engine query data. Nature, 457(7232):1012–1014, 2008.
[11] X. Jiang and G. F. Cooper. A recursive algorithm for spatial cluster detection. AMIA AnnuSymp Proc., pages 369–373, 2007.
[12] N. Meinshausen and P. Buhlmann. High dimensional graphs and variable selection with thelasso. Annals of Statistics, 34(3):1436–1462, 2006.
[13] D. B. Neill, A. W. Moore, and G. F. Cooper. A bayesian spatial scan statistic. In Advancesin Neural Information Processing Systems, 2005.
[14] J. Que and F.-C. Tsui. A multi-level spatial clustering algorithm for detection of diseaseoutbreaks. AMIA Annu Symp Proc., pages 611–615, 2008.
[15] M. R. Sabhnani, D. B. Neill, A. W. Moore, F.-C. Tsui, M. M. Wagner, and J. U. Espino.Detecting anomalous patterns in pharmacy retail data. In Proceedings of the KDD 2005Workshop on Data Mining Methods for Anomaly Detection, 2005.
[16] F. Simini, M. C. Gonzalez, A. Maritan, and A.-L. Barabasi. A universal model for mobilityand migration patterns. Preprint available at http://arxiv.org/abs/1111.0586v1, 11 2011.
13

[17] S. Speakman and D. B. Neill. Fast graph scan for scalable detection of arbitrary connected clus-ters. In Proceedings of the International Society for Disease Surveillance Annual Conference2009.
[18] M. Wainwright, P. Ravikumar, and J. D. Lafferty. High-dimensional graphical model selectionusing `1-regularized logistic regression. In Advances in Neural Information Processing Systems(NIPS), 2006.
[19] Y. Xia, O. Bjørnstad, B. Grenfell, et al. Measles metapopulation dynamics: a gravity modelfor epidemiological coupling and dynamics. American Naturalist, 164(2):267–281, 2004.
14