Fiscal year ended September 2020 Financial Results & Mid ...

MID YEAR
FISCAL POSITION REPORT -2008-
Ministry of Finance and Planning Sri Lanka
MMIIDD-- YYEEAARR
FFIISSCCAALL PPOOSSIITTIIOONN RREEPPOORRTT
22000088
......
Issued under Section 10 of the Fiscal Management (Responsibility) Act No. 03 of 2003.
Mahinda Rajapaksa President and Minister of Finance and Planning.

1
Mid Year Fiscal Position Report
Issued by the Hon. Minister of Finance
Under Section 10 of the Fiscal Management (Responsibility) Act No.03 of 2003
In terms of Section 10 of the Fiscal Management (Responsibility) Act No.03 of 2003 the Minister of Finance is requested to present the mid- year fiscal position report to the public by the last day of June in the year and thereafter lay before the parliament. The purpose of this report is to provide updated information on the Government’s fiscal performance as per the fiscal strategy of the Government. The report contains the performance of Government revenue, expenditure, cash flow operations and borrowings during the first four months in year 2008. The report also provides updated information, depending on the availability of information, relating to macro economic performance, price development, foreign aid, Government debt, and balance of payments, money and credit development.

2
Chapter 1
Fiscal Developments An Overview.
• Fiscal development during the first four months of 2008 recorded a 24 percent growth in Government revenue with tax revenue recording a growth of 22 percent. An accelerated growth in Government expenditure by 24 percent influenced by higher capital expenditure, increased cost of the fertilizer subsidy, higher salaries and pensions and enhanced interest costs is also observed in comparison with the corresponding period of last year.
• During the first four months of the year, 23 percent of the total provision of capital expenditure has been utilized, compared to 21 percent in the same period in 2007. Current expenditure accounted for 32 percent of the total allocation in 2008, compared with 33 percent in the first four months in 2007. Revenue generated during this period accounted for 28 percent of estimated revenue in comparison with the same ratios in the corresponding period in 2007. Reflecting higher recurrent expenditure mainly on fertilizer subsidy and interest revenue deficit amounted to Rs. 18.8 billion during the first four months in 2008 compared to Rs. 15.3 billion in the corresponding period in 2007. The overall deficit increased to Rs. 93.4 billion from Rs. 74.3 billion due to increased public investments.
• As a percentage of GDP, the revenue collected for the first four months was 4.8 percent compared to 4.7 percent in the corresponding period in 2007 while the total expenditure as a percentage of GDP was at 6.9 percent compared to 6.8 last year. With these developments the revenue deficit and budget deficit was 0.4 and 2.1 percent respectively in the first four months of 2008 which were same as the corresponding period in 2007.

3
• In the context of increased demand for resources, the Treasury
Operations gave priority for providing resources to development programs and other essential expenditure while minimizing funding for non priority expenditure programs to make budgetary operations complementing with monetary policy operation of the Central Bank.
Table - 1.1
Summary of the Budget (Jan-April)- Economic Classification Rs. Mn. Source: Department of Fiscal Policy * Includes foreign investment of Treasury Bonds.
2007 2008 Revenue 170,374 210,427
Tax 153,945 187,584
Non-Tax 16,429 22,843 Expenditure 244,638 303,847
Current 185,675 229,236
Public Investment 63,775 78,878
Other -4,812 -4,267 Revenue Account -15,302 -18,809 Overall Deficit -74,264 -93,420 Financing 74,264 93,420
Grant 10,878 3,585
Foreign Loans* 25,826 15,170
Domestic Financing 37,560 74,665
Non Bank 64,873 56,276
Bank -27,313 18,389
Revenue/ GDP(%) 4.7 4.8
Current Expenditure/GDP (%) 5.2 5.2
Public Investment/GDP (%) 1.8 1.8
Revenue Deficit/GDP (%) 0.4 0.4
Overall Budget Deficit/GDP (%) 2.1 2.1

4
Government Revenue
• Government revenue generated Rs. 261.4 billion during January- May 2008, a 23 percent growth over the same period of 2007. Additional revenue collected between the 2 periods amounted to Rs. 49 billion. As a percentage of GDP it increased to 5.9 percent while the tax revenue was 5.4 percent. However, the growth in revenue was not enough and fell short by about Rs. 8 billion to meet cash flow requirements.
• The revenue policy measures taken in the last 3 years to augment revenue coupled with further measures introduced in the 2008 Budget with a view to broaden the tax base and strengthen administration contributed to this revenue enhancement. The timely enactment of the necessary legislations for the forth consecutive year complimented the revenue enhancing effort. This performance in the tax revenue was achieved despite a significant drop in vehicle imports liable for excise taxes, sales declines in liquor and cigarettes in conjunction with Government polices and the impact of the granting of duty concessions for motor vehicles for public servants .

5
Table 1.2
Revenue Performance – (Jan- May)
Rs. Mn.
2007
2008 Growth %
Tax Revenue 192,322 235,971 23 Income Tax 39,296 41,143 25
VAT 71,758 85,524 19
Excise Tax 37,375 41,502 11
Cess 5,181 9,315 65
Port & Airport Development Levy 9,850 12,996 32
Import duty 22,807 23,031 1
Other 1,970 10,494* - Non Tax Revenue 19,845 25,397 28 Total Revenue 212,167 261,368 23
Source: Department of Fiscal Policy
* Includes Rs 6,311 Million collected as Special Commodity Levy.
Chart 1.1
Component of Government Revenue Jan-May
Income Tax, 19
VAT, 33Excise
Duty, 16
Import Duty, 9
PAL, 5
Other, 9
Non-tax, 10
(%)

6
Income Tax Total revenue from corporate profits tax, personal income tax, tax on interest income and Economic Service Charge (ESC) at Rs. 49,270 million showed a 25 percent increase during the first five months of 2008 over the corresponding period of 2007. This enhanced performance is noteworthy in the backdrop of the significant achievement of income taxes of reaching 3 percent of GDP in 2007.
In addition to the policy measures implemented in last 3 years several measures were introduced in the 2008 Budget with a view to further broaden the income tax base and its administration while extending concessions and exemptions for development activities to give impetus to the economic growth. The measures include: To broaden the tax base:
• Tax holidays that are already granted will not be extended further after the expiry of each tax holiday granted.
• A tax holiday which commences after 1.4.2008 will be not be more
then three years maximum other than for investments in strategic development and regional development projects.
• Income tax calculation of non citizen individuals employed in Sri
Lanka will be same as that of citizen of Sri Lanka. • If an employer has undertaken to pay income tax on the employment
income of an employee, the deduction to the employer will be restricted to the amount of income tax actually payable by the employer in inspect of such employment income.
• Any loss from the business of leasing could only be set off against
profits from such business.
7
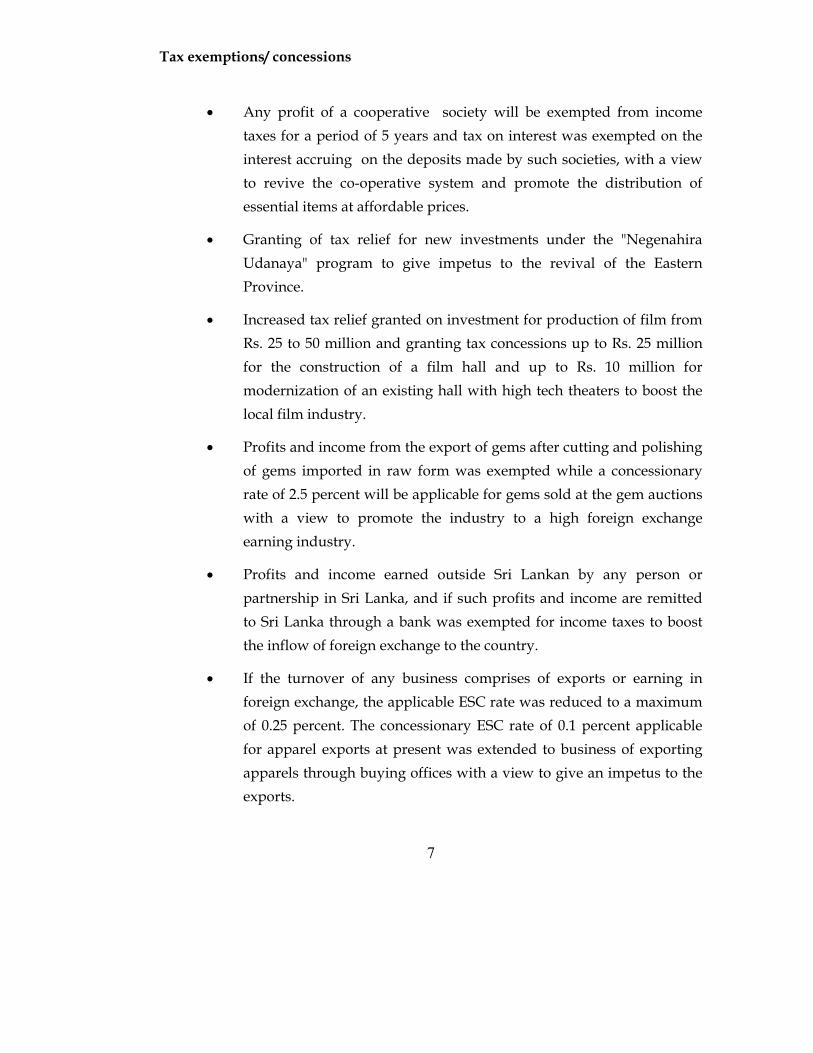
Tax exemptions/ concessions
• Any profit of a cooperative society will be exempted from income taxes for a period of 5 years and tax on interest was exempted on the interest accruing on the deposits made by such societies, with a view to revive the co-operative system and promote the distribution of essential items at affordable prices.
• Granting of tax relief for new investments under the "Negenahira Udanaya" program to give impetus to the revival of the Eastern Province.
• Increased tax relief granted on investment for production of film from Rs. 25 to 50 million and granting tax concessions up to Rs. 25 million for the construction of a film hall and up to Rs. 10 million for modernization of an existing hall with high tech theaters to boost the local film industry.
• Profits and income from the export of gems after cutting and polishing of gems imported in raw form was exempted while a concessionary rate of 2.5 percent will be applicable for gems sold at the gem auctions with a view to promote the industry to a high foreign exchange earning industry.
• Profits and income earned outside Sri Lankan by any person or partnership in Sri Lanka, and if such profits and income are remitted to Sri Lanka through a bank was exempted for income taxes to boost the inflow of foreign exchange to the country.
• If the turnover of any business comprises of exports or earning in foreign exchange, the applicable ESC rate was reduced to a maximum of 0.25 percent. The concessionary ESC rate of 0.1 percent applicable for apparel exports at present was extended to business of exporting apparels through buying offices with a view to give an impetus to the exports.

8
Value Added Tax (VAT) Revenue VAT revenue up to May 2008 amounted to Rs. 85, 524 million, an increase of 19 percent over the corresponding period of last year. Decline in motor vehicles imports, impact of the concessionary duty schemes implemented for public servants, decline in production of hard liquor, drop in cigarette sales and import of essential commodities liable for a VAT coming under a unified tax contributed to the moderate growth in the VAT revenue collection. Also this performance should be viewed with the exemptions granted to import and supply of machines and equipment for thrust industries to boost such industries.
Table 1.3
Performance of VAT – (Jan. – May)
Rs. Mn.
Tax Base 2007 2008 Growth %
Domestic
Import
Gross revenue
Refunds
Net Revenue
35,471
40,519
75,990
4,232
71,758
46,442
42,599
89,041
3,517
85,524
30.9
5.1
17.2
-16.9
19.2
Refunds as % of Gross Revenue 5.6 3.9
Source: Department of Fiscal Policy
Further to the exemption already in place with respect to sectors several development oriented VAT exemption were granted with effect from 1st January 2008.
• Co-operative societies and co-operative rural banks were exempted as a part of the relief granted on this sector.
• Reduction of VAT rate from 15 percent to 5 percent on certain film and tele-drama related equipments to give an impetus to the industry.

9
• Importation of plant and machinery for business purposes by enterprises qualified for tax holiday under the "Negenahira Udaynaya" program were exempted to boost investment in the Eastern Province.
• Milk products made out of milk produced in Sri Lanka, locally produced rice products out of rice produced in Sri Lanka, locally manufactured sugar, import of yarn for textile industry were given VAT exemption to encourage local value added production.
• VAT on petrol was reduced from 15 to 5 percent. Excise taxes
• Revenue from excise taxes on liquor, cigarettes petroleum products, motor vehicles and selected consumer durables increased to Rs. 41,502 million by 11 percent in the first five months in 2008.
• A marginal decline in hard liquor production compared to a 9 percent increase in the corresponding period of last year, cigarette sales volumes reducing by 6 percent, decline in vehicle imports which are liable for excise duties, impact of the concessionary duty scheme for motor vehicles for public servants contributed adversely for the excise duty revenue despite the high excise duty structure that is applicable presently. The motor cars and van imports under the normal excise duty regime has reduced by 20 percent in the first five months of 2008 compared to same period of 2007.

10
Table 1.4 Excise Tax Performance – (Jan. - May)
Rs. Mn. Item 2007 2008 Growth % Liquor 9,766 11,411 17 Cigarettes 12,131 14,322 18 Petroleum & Motor vehicles 14,069 12,605 -10 Other 1,409 3,164 125 Total 37,375 41,502 11
Source: Department of Fiscal Policy
Excise duty rate changes
• Duty rates applicable on liquor were increased in October while the rates on cigarettes were revised in October and December in 2007. Duties on cigarettes were further revised in March 2008.
Table 1.5
Excise Duty Rate Revision on Cigarettes
per 1,000 cigarettes
2007 June
2007 Oct
2007 Nov
2008 March
Increased (*) (%)
Benson
7,588 8,588 8,868 9,840 30
Gold leaf
7,283 8,086 8,314 8,850 17
Viceroy
6,183 6,986 7,219 7,219 17
Other
3,722 3,722 3,722 4,520 21
Source: Department of Fiscal Policy * Percentage increase of excise duty per 1,000 cigarettes during the period June 2007to March 2008.

11
• Excise duty rate applicable on selected non essential imports was increased from 10-15 percent with effect from 8.11.2007.
• Excise duty applicable on motor vehicles was revised between 5-10 percent with effect from 8.11.2007.
• Exemption granting of duty rates on importation of vehicles by public servants was continued up to end March 2008. 7,240 of such vehicles were imported in 2008 where the revenue forgone by the Government was around Rs. 11,000 million.
Import Duty
• Import duty revenue increased marginally to Rs. 23,031 million in the first five months of 2008. The slowdown in motor vehicles imports, application of a unified tax for essential commodities mainly contributed to the slow growth in import duties. The unified tax on essential commodities which includes the custom duty generated Rs. 6,311 million in the first five months of 2008.
• Although a unified tax is applicable on essential commodities this tax
rates are not fully compensating the effective duty rates under different taxes previously held. These unified rates have not been revised after their commencement from 1st January 2008 considering the high cost living that prevailed during this period. With the present international prices on these essential items the revenue forgone up to May 2008 is around Rs. 5,000 million.

12
Table 1.6
Revenue Foregone (Jan-May 2008)
Item Applicable Duty (Special Commodity
Levy per/kg (Rs)
Revenue forgone (Rs. Mn.)
Milk Powder 5 2,635 Potatoes 15 430 B'onions 20 261 Peas 15 269 Chickpeas 15 116 Green gram 13 4 Lentils 6 875 Chilies 30 180 Canned Fish 25 162 White Sugar 14 38 Total 4,970
Source: Department of Trade Tariff and Investment Policy
• Government removed the duty waiver of Rs. 20 on petrol imports effective from 24 May 2008 with a view to cross subsidize the diesel use for public transportation.
Other Taxes
• Revenue from Port and Airport Development Tax (PAL) generated Rs. 12,996 million in Jan-May 2008 period a 32 percent increase, compared Rs. 9,850 million in the same period of 2007, a mainly due to the high turnover of imports. This improvement in PAL collection has taken place despite the exemption granted for imports that are used for export and concessionary rates applicable on certain machinery and medicines.
• Cess revenue amounted to Rs. 9,315 million during the period under review compared to Rs. 5,181 million in the same period of 2007. Scaling up of Cess rates and imposing Cess on certain imports which are effectively manufactured in Sri Lanka.

13
Non Tax Revenue.
Non tax revenue collected during the first five months of 2008 amounted to Rs. 25, 397 million which include Rs. 8,000 million as Central Bank profit transfers. The increases recorded in sub sectors such as interest, rent, sales and charges, social security contributions contributed to the enhanced non tax revenue collection.
Table 1.7 Fiscal Measures-2008
Import tariff 08.11.2007 RPO 4/2007 Gazette No.1522/19 of 07.11.2007
-Custom duty changes based on the budget proposals and recommendations made by the Trade and Tariff Cluster
Excise Duty 07.11.2007 Excise (Special Provisions )Act No.13 of 1989(Gazette
Notification No.1522/17 of 07.11.2007)-Increase of excise duty applicable for certain motor vehicles and upward revision of Excise duty on selected consumer durables
03.12.2007 Excise Ordinance(Gazette Notification No.1526/1 of 03.12.2008) -Reduction of the Excise duty applicable to Ethyl alcohol used for industrial purposes from Rs.200/lt to Rs.100/lt
14.03.2008 Excise (Special Provisions )Act No.13 of 1989(Gazette Notification No.1540/15 of 14.03.2008)-Increase the Cigarette Duty rates
10.04.2008 Section 32 of Excise Ordinance(Gazette Notification No.1544/17 of 10.04.2008) Increase the liquor Duty rates
Special Commodity Levy 09.01.2008 Special Commodity levy Act no. 48 of 2007 (Gazette
Notification No.1531/13 of 09.01.2008) -Imposition of Special Levy for 10 essential Commodities
01.05.2008 Special Commodity levy Act no. 48 of 2007 (Gazette Notification No.1547/19 of 30.04.2008) -Imposition of Special Levy for 11 essential Commodities including milk powder.
14
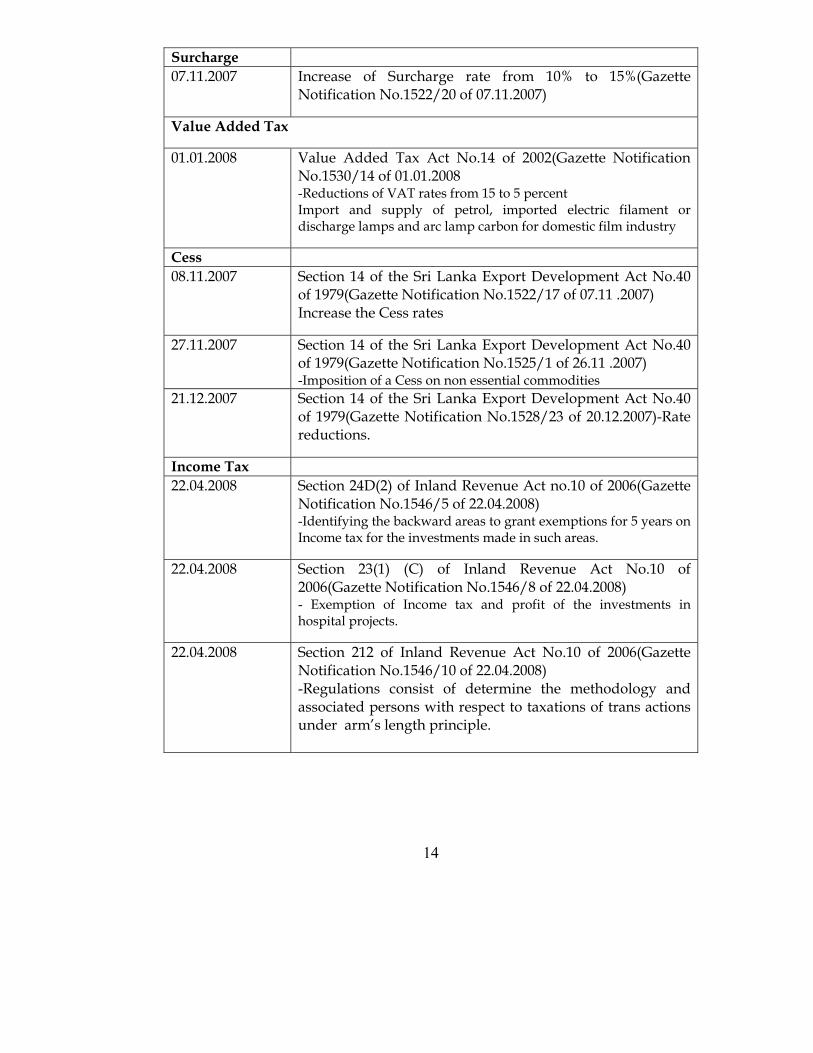
Surcharge 07.11.2007 Increase of Surcharge rate from 10% to 15%(Gazette
Notification No.1522/20 of 07.11.2007)
Value Added Tax 01.01.2008 Value Added Tax Act No.14 of 2002(Gazette Notification
No.1530/14 of 01.01.2008 -Reductions of VAT rates from 15 to 5 percent Import and supply of petrol, imported electric filament or discharge lamps and arc lamp carbon for domestic film industry
Cess 08.11.2007 Section 14 of the Sri Lanka Export Development Act No.40
of 1979(Gazette Notification No.1522/17 of 07.11 .2007) Increase the Cess rates
27.11.2007 Section 14 of the Sri Lanka Export Development Act No.40 of 1979(Gazette Notification No.1525/1 of 26.11 .2007) -Imposition of a Cess on non essential commodities
21.12.2007 Section 14 of the Sri Lanka Export Development Act No.40 of 1979(Gazette Notification No.1528/23 of 20.12.2007)-Rate reductions.
Income Tax 22.04.2008 Section 24D(2) of Inland Revenue Act no.10 of 2006(Gazette
Notification No.1546/5 of 22.04.2008) -Identifying the backward areas to grant exemptions for 5 years on Income tax for the investments made in such areas.
22.04.2008 Section 23(1) (C) of Inland Revenue Act No.10 of 2006(Gazette Notification No.1546/8 of 22.04.2008) - Exemption of Income tax and profit of the investments in hospital projects.
22.04.2008 Section 212 of Inland Revenue Act No.10 of 2006(Gazette Notification No.1546/10 of 22.04.2008) -Regulations consist of determine the methodology and associated persons with respect to taxations of trans actions under arm’s length principle.

15
Economic Service Charge 22.04.2008 Section 12 of Economic Service Charge Act No. 13 of
2006(Gazette Notification No.1546/9 of 22.04.2008)-Amendments to the definition of turnover related to gem , garment and for exports on NFE basis.
Other tax measures 01.01.2008 Stamp Duty (Special Provisions )Act No.12 of 2006(Gazette
Notification No.1530/13 of 01.01.2008)-Rate revision 01.01.2008 Finance Act No. 11 of 1963(Gazette Notification No.1530/16
of 01.01.2008) -Land transfer tax exemptions for foreigners who invest not less than US $ 2 million on IT related training institutions, educational institutions and BPO industry.
01.01.2008 Debit Tax Act No.16 of 2002(Gazette Notification No.1530/17 of 01.01.2008) -Exemptions as mentioned in Budget 2008
01.01.2008 Finance Act No. 11 of 2002(Gazette Notification No.1530/18 of 01.01.2008) -Exemption of PAL on purchase of ships registered under Sri Lankan Flag
22.04.2008 Section 5 of Stamp Duty(Special Provisions)Act No.12 of 2006(Gazette Notification No.1546/7 of 22.04.2008) -Exemption of stamp duty on any deed of mortgage of aircraft and ships
Other Measures 14.01.2008 Revision of Petroleum Prices 15.03.2008 Revision of Electricity Tariff 01.04.2008 Suspend the scheme on granting duty concessions for
import of vehicles for public officers. 25.05.2008 Revision of Petroleum Prices 25.05.2008 Removing of the import duty waiver of Rs. 20 per liter on
Petrol 25.05.2008 Increase of bus fare 01.06.2008 Increase of train fare 10.06.2008 Import & Export Control Act No. 01 of 1969-the minimum
F.O.B price of a metric ton of rice exported from Sri Lanka should be Rs. 100,000

16
Box 1.1
Finance & Revenue related Legislations (2007 Nov- 2008 June)
Statute Objective
Value Added Tax(Amendment)Act No.15 of 2008
To grant the exemptions and rate reductions as mentioned in budget 2008
Finance (Amendment)Act No.7 of 2008
To extend the 10 percent Cellular mobile telephone subscribers levy presently imposed on mobile phones to cover the codeless telephones.
Finance (Amendment)Act No.8 of 2008
To revise the Social Responsibility Levy (SRL) rate from 1 percent to 1.5 percent and remove SRL charged on personal income tax.
Inland Revenue(Amendment)Act No.9 of 2008
To implement proposals in budget 2008.
Stamp Duty(Special Provision)(Amendment)Act No.10 of 2008
To make the tax system simplify and to fall in line with the existing mechanism adopted by Provincial Councils, stamp duty payable on leases and mortgages could be done either by affixing the receipt proving such payment to a bank or affixing the stamp.
Economic Service Charge(Amendment)Act No. 11 of 2008
To enable the ESC rate not to exceed 0.25 percent if the turnover of any business comprises of export earnings in foreign exchange and to increase the rate with respect to the turnover of liquor and motor vehicle sales to 1 percent from 0.5 percent. Also amendments have been done to rectify the existing anomalies.
Regional Infrastructure Development Levy(Amendment)Act No. 12 of 2008
Increase the Regional Infrastructure Development Levy by 2.5 percent.
Butchers Ordinance(Amendment)Act
To prohibit slaughtering of lactating cows and

17
No.13 of 2008 imposing a fine of Rs 50,000 or an imprisonment
for a period not exceeding three years, for not
adhering to the prohibition.
Strategic Development Project Act No.14 of 2008
This act will enable to grant tax free period/concessions for identified Strategic Development Projects.
Environment Conservation Levy Act No.26 of 2008
This act will enable imposing a levy on items imported , domestically manufactured and on a service provided within Sri Lanka which is likely to have a harmful impact on the environment.
Policy Thrust to Rationalize Public Expenditure
• Several Policy measures were implemented in line with the fiscal consolidation with a view to rationalize growth in recurrent expenditure while enhance funds were channeled to new rural development initiatives and national infrastructure development program.
• Leave encashment granted to public servants was terminated with effect from 2008 in view of its cost as well as administrative complexities, while the cap on cost of living allowance at Rs. 375 per month for public servants and Rs. 187.50 for pensioners for inflation was continued.
• In the context of rising oil prices, administrated prices of petroleum
products were raised by the Ceylon Petroleum Corporation (CPC) in January and May 2008, placing the domestic petrol prices on commercial rates thereby eliminating the subsidy , while diesel and kerosene is sold at a price less than the cost.

18
Table 1.8 Domestic Petroleum Prices Adjustments.
Source: Department of Fiscal Policy.
• With the Domestic petroleum price adjustments the Sri Lanka
Transport Board increased bus fares by 19 percent while a rate revision was introduced on railway fares. The last railway fares revision was in August 2005. It is estimated that with these revision the SLCTB will generate additional revenue of Rs. 719 million while SL Railways Rs 875 million which in turn will reduce the burden on the Budget.
• In line with the petroleum price increases, electricity tariffs were also adjusted in March 2008 with a 40 percent increase in rates.
• Government borrowing program was managed through the use of least cost borrowing instruments through selection of an appropriate mix between domestic and foreign debt. After the successful debut international bond issue the Government was able to raise US $ 150 million through a syndicate loan from foreign banks. The facility extended to the foreigners to invest in treasury bonds was expanded to treasury bills and capital account has been opened up to 10 percent. These measures helped to ease the pressure on exchange rate and reduced crowding out of domestic funds by the Government.
Domestic Prices Item Jan 14 May 25
Formula Prices May 2008
Petrol 127.00 157.00 156.83 Diesel 80.00 110.00 130.54 Kerosene 70.00 80.00 127.38 Fuel Oil 1500 61.70 71.70 Fuel Oil 3500 56.65 66.65
19
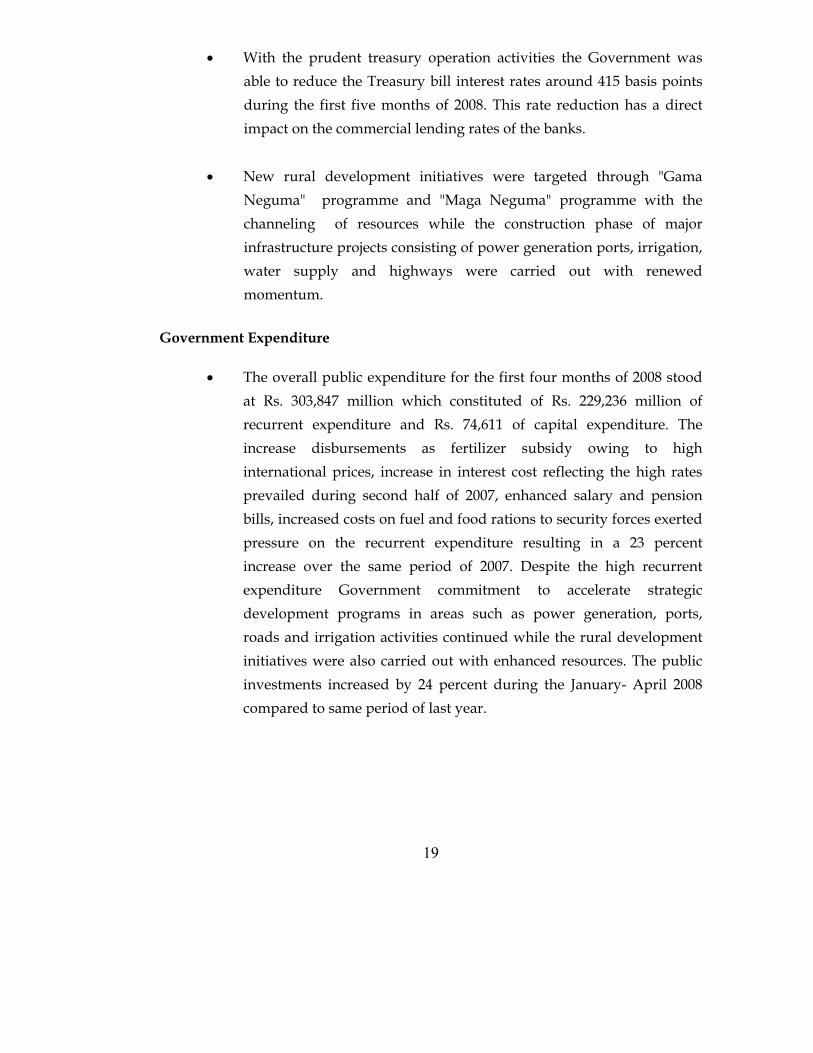
• With the prudent treasury operation activities the Government was able to reduce the Treasury bill interest rates around 415 basis points during the first five months of 2008. This rate reduction has a direct impact on the commercial lending rates of the banks.
• New rural development initiatives were targeted through "Gama
Neguma" programme and "Maga Neguma" programme with the channeling of resources while the construction phase of major infrastructure projects consisting of power generation ports, irrigation, water supply and highways were carried out with renewed momentum.
Government Expenditure
• The overall public expenditure for the first four months of 2008 stood at Rs. 303,847 million which constituted of Rs. 229,236 million of recurrent expenditure and Rs. 74,611 of capital expenditure. The increase disbursements as fertilizer subsidy owing to high international prices, increase in interest cost reflecting the high rates prevailed during second half of 2007, enhanced salary and pension bills, increased costs on fuel and food rations to security forces exerted pressure on the recurrent expenditure resulting in a 23 percent increase over the same period of 2007. Despite the high recurrent expenditure Government commitment to accelerate strategic development programs in areas such as power generation, ports, roads and irrigation activities continued while the rural development initiatives were also carried out with enhanced resources. The public investments increased by 24 percent during the January- April 2008 compared to same period of last year.
20
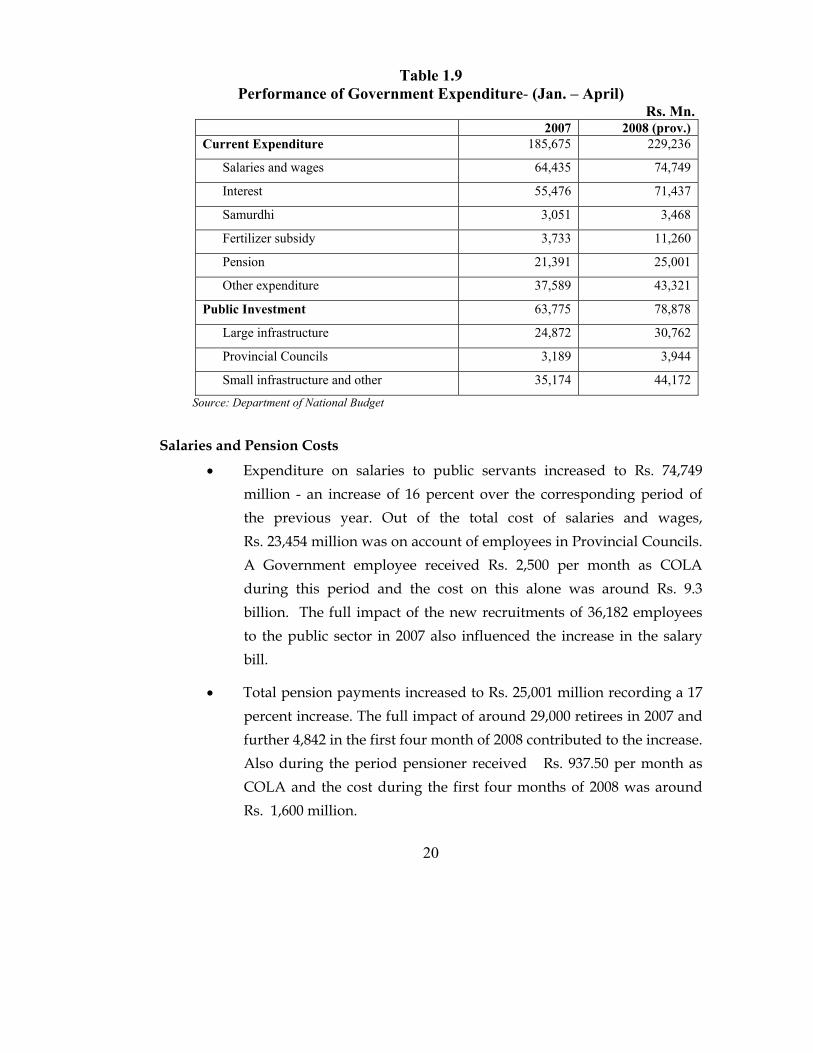
Table 1.9
Performance of Government Expenditure- (Jan. – April) Rs. Mn.
2007 2008 (prov.) Current Expenditure 185,675 229,236
Salaries and wages 64,435 74,749
Interest 55,476 71,437
Samurdhi 3,051 3,468
Fertilizer subsidy 3,733 11,260
Pension 21,391 25,001
Other expenditure 37,589 43,321
Public Investment 63,775 78,878
Large infrastructure 24,872 30,762
Provincial Councils 3,189 3,944
Small infrastructure and other 35,174 44,172
Source: Department of National Budget
Salaries and Pension Costs
• Expenditure on salaries to public servants increased to Rs. 74,749 million - an increase of 16 percent over the corresponding period of the previous year. Out of the total cost of salaries and wages, Rs. 23,454 million was on account of employees in Provincial Councils. A Government employee received Rs. 2,500 per month as COLA during this period and the cost on this alone was around Rs. 9.3 billion. The full impact of the new recruitments of 36,182 employees to the public sector in 2007 also influenced the increase in the salary bill.
• Total pension payments increased to Rs. 25,001 million recording a 17 percent increase. The full impact of around 29,000 retirees in 2007 and further 4,842 in the first four month of 2008 contributed to the increase. Also during the period pensioner received Rs. 937.50 per month as COLA and the cost during the first four months of 2008 was around Rs. 1,600 million.

21
Interest Cost
• Interest payments on foreign and domestic debt amounted to Rs. 71,437 million registering a 29 percent increase mainly reflecting the high domestic interest rates that prevailed especially in the second half of 2007. A noteworthy development is the reduction of the treasury bill interest rate by around 410 basis points up to May 2008, from the rates prevailed in December 2007.
• Adopting a better debt management mechanism and alternative financing arrangements has helped to a certain extent to reduce the domestic interest rates.
Table 1. 10
Behavior of Yield Rates (%) - 2008 Year Treasury Bills Treasury Bonds
91 days 182 days 364 days 2 year 3 year 4 year 5 year
2007 May 16.91 16.39 16.57 - 14.10 - 14.22
2007 Dec 21.30 19.99 19.96 15.50 15.99 14.32 15.56
2008 Jan 19.98 19.59 19.55 18.58 16.79 - 15.55
2008 Feb 18.91 19.16 19.29 18.57 17.06 14.32 15.55
2008 Mar 18.40 18.95 19.01 - 17.10 - 15.60
2008 Apr 18.57 18.97 19.01 18.00 17.55 - 15.49
2008 May
(4th week)
17.14 18.50 18.65 17.92 17.00 - 15.55
Change
Dec-2007-
May-2008
-4.16
-1.49
-1.31
2.42
1.01
-
-0.01
Source: Department of Treasury Operations

22
Welfare payments and social safety net on vulnerable Groups
• The expenditure on welfare assistance provided in support of the poorer segments of the society, displaced persons, differently abled soldiers and vulnerable groups amounted to Rs. million 9,421 up to May 2008 compared to Rs. million 7,827 million in the corresponding period of 2007.
• The programs to provide nutritional food to expectant mothers and school children continued with enhanced cost. School Nutritional Food Program cost Rs. 582 million in the first five months of 2008, other nutritional programs such as infant milk subsidy, Poshana malla, Triposha Programs was continued at a cost of Rs. 379 million.
• The cost on other welfare programs such as free school text books,
uniforms, bursaries and scholarships school season tickets and free dharma school text books targeting students was Rs. 1,497.
Table 1.11
Welfare payment and subsidies- (Jan.-May)
Source: Department of National Budget
Rs. Mn. Item 2007 2008
Children Infant Milk Food Subsidy 32 20 Poshana Malla 33 131 Triposha Programme 115 228 Free Text Books & Uniforms 575 1,198 School Season Tickets 190 250 Dharma School Text Books & Uniforms 34 39 School Nutrional Foods 389 582 Agriculture Interest Subsidy for Agricultural Loans etc 35 44 Fertilizer Subsidy 6,600 14,900 Welfare Payments Samurdhi Relief 3,850 4,330 Assistance to Disabled Soldiers 3,400 3,451 WFP food Assistance 520 1,596 Flood and Drought Relief 57 44

23
• The fertilizer subsidy targeting small holder agriculture with a view to assist low income farmers continued in 2008. Despite the high fertilizer prices in the international markets all varieties of fertilizer were provided at Rs. 350 per 50 kg bag for paddy agriculture.
• The fertilizer subsidy was implemented with the Government bearing
80 percent of the cost and with the new prices the share of the Government has increased to 92-94 percent. With these developments the cost on fertilizer subsidy by May 2008 amounted to Rs. 14,900 utilizing almost the full year allocation, leading to an extra pressure on the budget.
• Other expenditure channeled to agriculture by way of interest subsidy for agricultural loans and provision of agricultural seeds stood at Rs. 44 million by May 2008.
Table 1.12
Fertilizer subsidy - Paddy sector
Fertilizer Market rate per 50Kg bag
(Rs.)
subsidy price per 50kg bag
(Rs.)
subsidy per 50kg bag
(Rs.)
Subsidy as a percentage of
the market prices (%)
Urea 4,200 350 3,850 92 MOP 6,150 350 5,800 94 TSP 6,337 350 5,987 94
Source: Department of Development Finance.

24
Public Investment Expenditure
• With a commitment to accelerate development programs, more resources were channeled to support enhanced level of development activities especially targeting the rural sector and the newly liberated areas, through rural development initiatives such as "Gama Neguma" and "Maga Neguma " programs, the construction of key national infrastructure development projects consisting of roads and bridges , power generation, ports , irrigation , water supply and human development have gathered momentum during this period. The total public investment expenditure amounted to Rs. 78,878 million during Jan- April 2008 an increase of 24 percent over this same period of last year.
Rural Development Initiatives
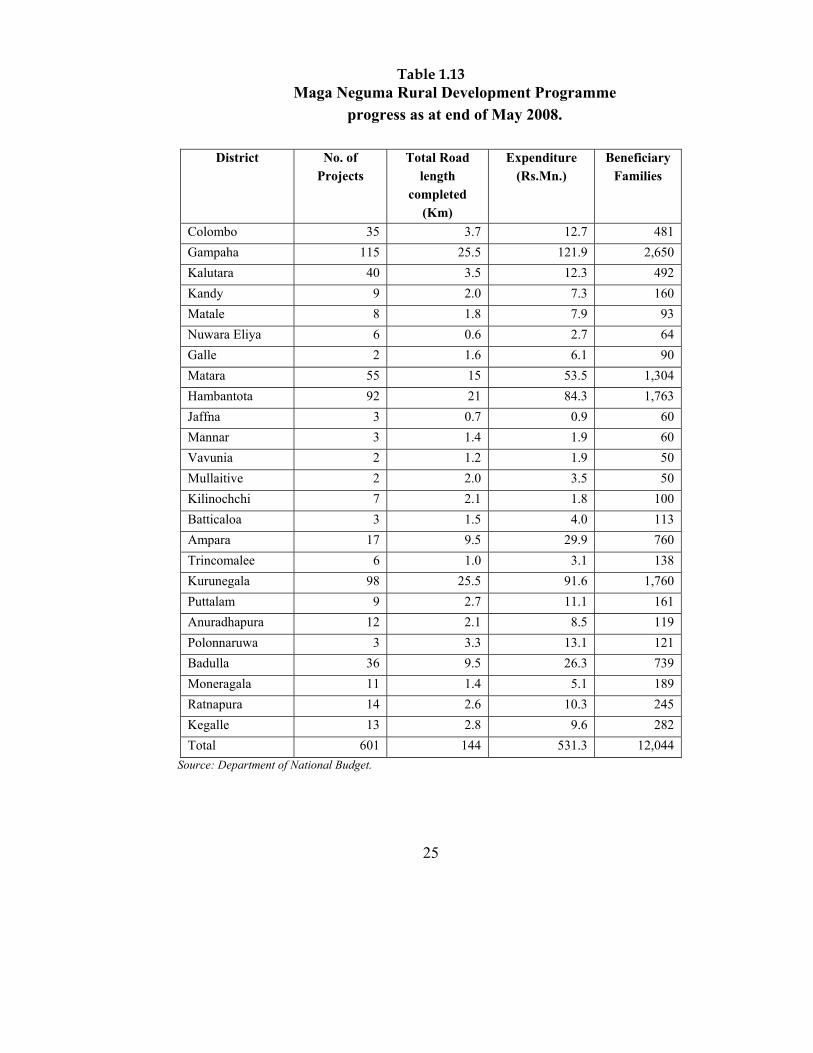
• The expenditure on "Maga Neguma" the Island wide rural infrastructure development program amounted to Rs. 531 million as at end May 2008 through which many rural roads were rehabilitated using modern techniques to ensure durability. Under the program further 144 km of rural roads were rehabilitated benefiting around 12,000 families while over 4,300 km of rural roads have been so far rehabilitated at a cost of Rs. 5,186 million.
25
Table 1.13
Maga Neguma Rural Development Programme progress as at end of May 2008.
District No. of
Projects Total Road
length completed
(Km)
Expenditure (Rs.Mn.)
Beneficiary Families
Colombo 35 3.7 12.7 481 Gampaha 115 25.5 121.9 2,650 Kalutara 40 3.5 12.3 492 Kandy 9 2.0 7.3 160 Matale 8 1.8 7.9 93 Nuwara Eliya 6 0.6 2.7 64 Galle 2 1.6 6.1 90 Matara 55 15 53.5 1,304 Hambantota 92 21 84.3 1,763 Jaffna 3 0.7 0.9 60 Mannar 3 1.4 1.9 60 Vavunia 2 1.2 1.9 50 Mullaitive 2 2.0 3.5 50 Kilinochchi 7 2.1 1.8 100 Batticaloa 3 1.5 4.0 113 Ampara 17 9.5 29.9 760 Trincomalee 6 1.0 3.1 138 Kurunegala 98 25.5 91.6 1,760 Puttalam 9 2.7 11.1 161 Anuradhapura 12 2.1 8.5 119 Polonnaruwa 3 3.3 13.1 121 Badulla 36 9.5 26.3 739 Moneragala 11 1.4 5.1 189 Ratnapura 14 2.6 10.3 245 Kegalle 13 2.8 9.6 282 Total 601 144 531.3 12,044
Source: Department of National Budget.

26
• "Gama Neguma" the major initiative to empower rural economy
further expanded at a cost of Rs. 1,702 million in the first four months of 2008.
• The Gemi Pubuduwa and Jana Pubuduwa programs designed to
restore community infrastructure, livelihood development and micro enterprise development among Samurdhi recipients were further strengthen at a cost of around 500 million during Jan-April 2008.
• Under the Dahasak Maha Weve program designed to rehabilitate
small tanks and minor irrigation services in the rural areas, 140 such projects were under different stages programming towards completion.
Spending on Development Programs Human Resource Development. Health
• Total expenditure on health stood at Rs. 10,540 million by end April 2008. The medical supplies cost was Rs. 1,625 million during the period.
• Construction work of several major health sector infrastructure
projects such as Neuro Trauma Unit and Nephrology Unit in Colombo General Hospital and the Oncology Unit at Kurunegala Teaching Hospital were in progress during this period. Further Rs. 245 million has been spent on rehabilitation of hospital buildings. Bio Medical equipment at a cost of Rs. 135 million was added to the health sector.

27
• To address the human resource shortage, recruitments in the health sector continued in 2008. 1,900 trainee nurses including 200 Tamil nurses were recruited in June while further 1,300 nurses who have completed training were absorbed to the system. 210 post intern doctors were recruited in February while further 758 doctors who have completed the post internship will be absorbed in the near future. The recruitments to the various technical grades were continued during this period. 58 MLTs, 58 pharmacists, 10 physiotherapists, 13 radiographers and 2 occupational therapists were absorbed to enhance the technically qualified personal in the health sector.
Education
• During the first four months of 2008 the total expenditure on education was Rs. 12,223 million.
• Around Rs. 300 million was spent on construction of buildings in national schools.
• 358 computer learning centres have been commissioned under the Secondary Education Modernization Project by end April while construction work on 14 open university regional centres were completed during this period under the Distance Education Modernization Project.
Roads
• The investment on road sector was around Rs. 10,457 million up to April 2008. This included Rs. 1,809 million on express ways development, Rs. 5,484 million on highways development, Rs. 317 million on bridges and flyovers and Rs. 1,530 million on rehabilitation of Tsunami affected roads.

28
• Improvements to roads - Anuradhapura- Rembewa, Kakirawa-Thalawa, Kebithigollawa-Padaviya, Kandy-Jaffna were carried out during this period.
• Ramboda tunnel and the Kelaniya Flyover were opened for traffic in
the first quarter of 2008, while the Arugambay bridge which was affected by Tsunami will be commissioned in the near future.
Water Supply
• The investment on water and sanitation cost amounted to Rs. 5,906 million in the first four months of 2008.
• Implementation work have been accelerated in water supply schemes
in areas such as towns south of Kandy, Nuwara Eliya, Galle, Kaluganga, Batticaloa, Hambantota, Nawalapitiya and Ampara. The number of pipe born water connection have increased by 25,145 through completed water supply schemes during this period.
• Rs. 489 million has been utilized for rural water supply schemes
covering 13 districts. Irrigation
• Construction work on Menik Ganga -Weharagala irrigation project continued during this period with main dam, spillway and sluice outlets already been completed and it is expected to be commissioned by September 2008 benefiting 11,000 hectare of farm land and around 11,000 farmer families.
• Government was successful in mobilizing US $ 392 million from Iran
for the Uma Oya irrigation project which would benefit 5,000 hectare

29
of land and 12,000 families in Hambatota and Moneragala districts. It is expected to generate 100 MW Hydro Power from this project.
• Australian funds have been secured to assist the distribution of drip
irrigation system among farmers in Anuradhapura, Polonnaruwa, Hambantota, Kurunegala and Moneragala districts on interest free loan basis.
• The work on Deduru Oya reservoir project was in progress during this
period with the construction of the bund and resettlement of the affected parties been nearing completion. Preliminary work such as surveying and geological investigation have been completed while infrastructure development under dam construction and resettlement areas and land acquisition have commenced.
Ports
• Work is in progress in the Hambantota Sea Port Development project
as well as the construction of the breakwater in the Colombo South harbour project, where the necessary funds have been mobilized from China and Asian Development Bank respectively.
• Government has also taken steps to revive the Oluwil harbour
development project and it is expected to mobilize US $ 69 million from the Government of Denmark.

30
Government Treasury Operations
Cash Operations
The net cash outflow from operating activities, by the end of May 2008 amounted to Rs. 23.4 billion, as against the forecasted deficit of 4.7 billion. The main reason for the deviation was the shortfall of the revenue receipts. The Government's cash operations, after investment activities, during the first five months (Jan-May) of 2008 indicated a net cash deficit of Rs. 76.9 billion, compared with Rs. 65.9 billion during the corresponding period of 2007. Cash outflow from investment activities decreased by Rs. 5.9 billion over the original cash flow estimates. The repayments on debt was marginally increased by Rs. 1 billion with the estimates, and gross borrowings were raised to meet the cash deficit of Rs. 77 billion, including the increase on temporary over draft.
The overall closing balance which corresponds to working overdraft balance with the banks increased from Rs. 37.2 billion at the beginning of the year to Rs. 44.1 billion at the end of May 2008.
Table 1.14
Statement on Government Cash Flow Operations 2007 and 2008 First Five Months.
Rs. Mn.
2007 Jan-May Item Actual Jan-May
2007 Original estimate
Actual Cash flow
Total cash inflows from revenue 218,180 284,111 261,521 Total cash outflow from operating activities (229,802) (288,819) (284,961) Net cash flow from operating activities (11,622) (4,708) (23,440) Cash flow from investment activities (54,298) (59,478) (53,542) Net cash surplus (deficit) (65,920) (64,186) (76,982) Opening cash balance (31,622) (37,211) (37,211) Gross borrowing 173,650 169,116 170,743 Debt repayment (87,431) (102,577) (103,609) Net borrowing 86,219 66,539 67,134 Adjustment Account Balance (TEB, RFA, deposits. etc.)
22,094 2,165 2,907
Closing balance (33,417) (32,693) (44,152) Source: Department of Treasury Operations

31
Chapter 2
The Economy
• The Sri Lankan economy in the first quarter of 2008 sustained the
growth momentum that has been witnessed during past three years amidst the volatile situation in the world economy and the continued challenges encountered in the domestic economy. The GDP registered a 6.2 percent growth in the first quarter in 2008 compared to 6.1 percent in 2007. The Agriculture sector output grew by 6.2 percent a significant improvement compared to first quarter of 2007 while industry and service sectors grew by 5.6 percent and 6.1 percent respectively.
• In the first quarter of 2008 most of the sub sectors in the agricultural sector achieved relatively high growth rates. The quantity of tea produced during the first quarter of 2008 was 82.6 million Kgs., an increase of 30 percent over the corresponding period of 2007 which established an all time record for the first quarter tea production of a year. The favorable weather conditions and absence of labour unrests and work stoppages contributed to the production improvements. Rubber production increased by 14 percent to 37 million Kgs. during this period while the coconut production witnessed a marginal decline. The paddy production in 2007/2008 Maha increased by 7.6 percent to 102 million bushels compared to 2006/2007 Maha while the gross extent harvested increased by 8.2 percent during this period. The attractive producer prices, continuation of the fertilizer subsidy and the improvements in the security conditions in the Eastern Province could be cited as the main contributing factors to the increase in the extent harvested.

32
• The production of other minor export crops such as cardamoms, cinnamon, pepper, coffee increased and also fetched high producer prices. Crops such as maize, ginger, sweet potatoes, red and big onions, recorded improved production in the first quarter of 2008 while production declines were recorded in crops such as potatoes, cowpea, soya beans and chillies. Livestock sector grew by 5.1 percent with increased production in beef, mutton, pork and poultry , while milk production increased by 2 percent to 51 million litres reflecting impact of the wide range of incentives granted by the Government as well as the better producer prices .
• The manufacturing sector indicated a 4.2 percent growth in the first quarter. Despite the slowdown in the world economy mainly US economy the textile and garment industry sustained its resilience and grew by 3 percent during this period while the construction industry reflecting the increased public investment in infrastructure projects remained buoyant recording a 8.6 percent growth. Production increases in rubber based products, fabricated metal products and mineral products also contributed to sustain the manufacturing sector output. Despite the slowdown in cigarettes sales and hard liquor production the food beverages and tobacco category indicated a 4 percent growth during the first quarter of 2008.
• The value addition in the service sector which accounted for 58 percent of the GDP recorded a buoyant 6.4 percent growth in the first quarter of 2008. Displaying the sustained dynamism of the telecommunication sector, the number of fixed and mobile telephones increased by 42 and 48 percent respectively during this period compared to the corresponding period of 2007. The growth of around 9.5 percent in transshipment cargo and 9.2 percent increase in cargo handling contributed to enhance the port services.

33
• The growth in trade consisting of domestic as well as external trade accelerated to 5.3 percent, while hotel services recovered marginally from the previous year set back to record growth of 1 percent. Banking and insurance and real sector grew by 5.7 percent compared to 8.6 percent first quarter of last year. This slow down in mainly attributable to the slower growth in banking sector credit accompanied with the tight monetary policy stance adopted by the Central Bank of Sri Lanka.
Chart 2.1
Sectoral Composition of GDP- 2008
Agriculture, 13.3
Industry, 28.4
Services, 58.3

34
Table 2.1 Gross Domestic Product – Sectoral Composition (2002) Constant Prices Rs. Mn.
2007 1st Q 2008 1st Q Agriculture, Forestry and Fishing 73,900 78,260 Agriculture, Livestock and Forestry 67,747 71,822
Tea 5,534 7,173 Rubber 822 911 Coconut 7,161 6,903 Minor export crops 1,774 1,816 Paddy 17,303 18,652 Highland crops 10,174 10,581 Fruits and Vegetables 13,972 14,261 Livestock 4,107 4,316 Other Agriculture 3,779 3,866 Firewood & Forestry 3,121 3,343
Fishing 6,153 6,438 Industry 154,637 163,926
Mining and Quarrying 10,763 12,248 Manufacturing 98,685 103,207
Processing Industries 3,555 3,754 Factory industry 88,553 92,626 Small industries 6,577 6,827
Electricity, gas and water 11,492 11,876 Electricity 9,760 10,082 Gas 1,148 1,188 Water 584 606
Construction 33,697 36,595 Services 327,792 348,894
Wholesale and retail trade 134,403 142,599 Import trade 43,442 47,352 Export trade 23,883 24,480 Domestic trade 67,078 70,767
Hotels and restaurants 1,830 1,845 Transport and communication 71,077 77,855
Transport 60,731 65,589 Cargo handling-Ports and Civil aviation 3,561 3,956 Post and telecommunication 6,784 8,310
Banking , insurance and real estate etc. 49,231 52,037 Ownership of dwellings 18,065 18,264 Government services 40,141 42,309 Private Services 13,046 13,985
Gross Domestic Product 556,329 591,080 Source: Department of Census & Statistics
35
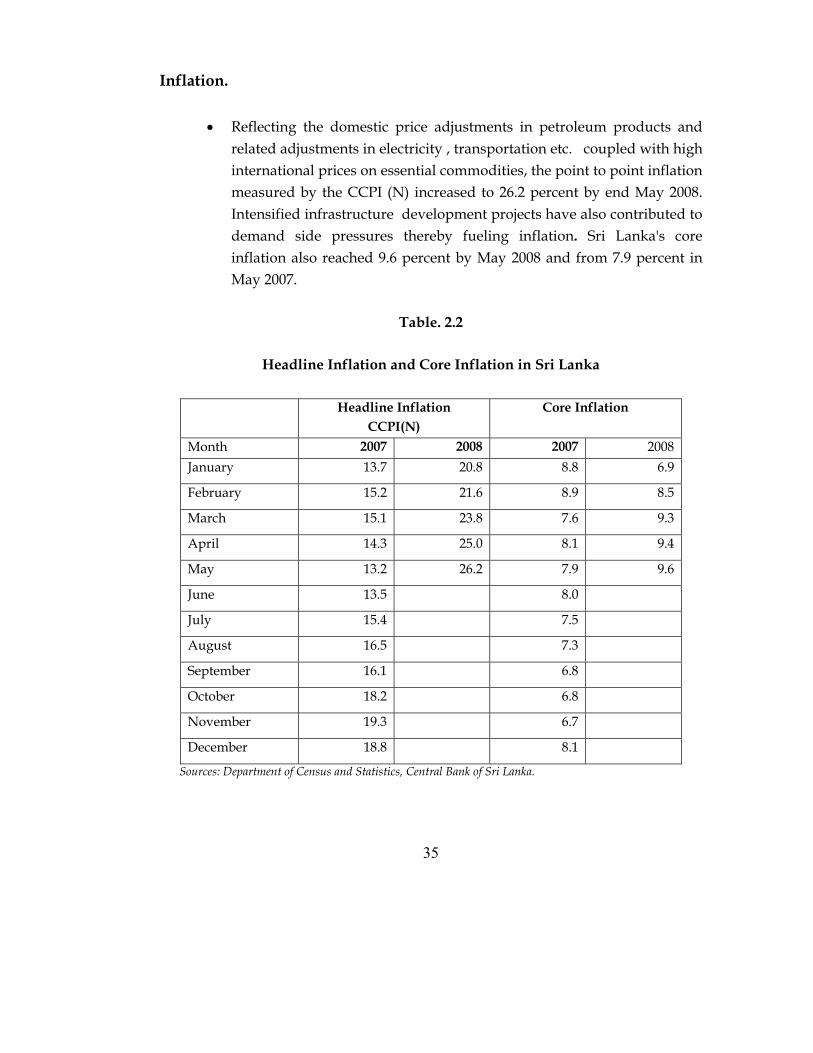
Inflation.
• Reflecting the domestic price adjustments in petroleum products and
related adjustments in electricity , transportation etc. coupled with high international prices on essential commodities, the point to point inflation measured by the CCPI (N) increased to 26.2 percent by end May 2008. Intensified infrastructure development projects have also contributed to demand side pressures thereby fueling inflation. Sri Lanka's core inflation also reached 9.6 percent by May 2008 and from 7.9 percent in May 2007.
Table. 2.2
Headline Inflation and Core Inflation in Sri Lanka
Headline Inflation
CCPI(N) Core Inflation
Month 2007 2008 2007 2008 January 13.7 20.8 8.8 6.9
February 15.2 21.6 8.9 8.5
March 15.1 23.8 7.6 9.3
April 14.3 25.0 8.1 9.4
May 13.2 26.2 7.9 9.6
June 13.5 8.0
July 15.4 7.5
August 16.5 7.3
September 16.1 6.8
October 18.2 6.8
November 19.3 6.7
December 18.8 8.1
Sources: Department of Census and Statistics, Central Bank of Sri Lanka.

36
External Sector Development. Exports
• Exports grew by 12 percent during the first 4 months in 2008 earned US $ 2,498 million. The agricultural exports grew by 37 percent to US $ 590 million with increased volumes as well as prices. The tea exports volumes grew by 11 percent while the unit prices increased by 32 percent. Reflecting the high demand for natural rubber in the backdrop of high price for synthetic rubber, the unit price per Kg increased by 26 percent US $ 52 in the first 4 months of 2008. The other agricultural exports earnings also grew to US $ 91 million compared to US $ 61 million in the corresponding period of 2007.
• Industrial exports earnings grew by 4 percent to US $ 1,831 million .
Gems and processed diamond exports recorded an increased while textile and garment exports at US $ 1,033 million reflected a growth of 4 percent despite the slowdown in demand in the US markets. Industrial exports of leather, rubber and paper products also showed improvements with earning reaching US $ 251 million during the first 4 months of 2008.
Imports
• Imports in the first four months in 2008 at US $ 4,533 million recorded a 37 percent increase over the first four months of 2007. The surge in international oil prices has resulted in increasing in the petroleum import bill by 76 percent to US $ 1,115 million from US $ 632 million during the period. Excluding the petroleum products the expenditure on imports recorded a 28 percent growth in the first four months of 2008. Imports of consumer goods grew by 37 percent with large increases being recorded in respect of several food imports namely, milk powder, wheat and rice reflecting the high international prices that prevailed during this period. Non petroleum intermediate good

37
imports amounted to US $ 1,482 million compared to US $ 1,196 million in the first four months of 2007. Increase in international fertilizer prices the import bill amounted to US $ 123 million nearly three fold increase over the corresponding period of 2007. Investment goods imports amounted to US $ 1,013 million, a 31 percent increase over the same period complimenting the growth momentum of the economy. Imports of building materials has increased by 38 percent reflecting the continues expansion of the construction industry in the country.
Trade deficit
• Reflecting these development the cumulative trade deficit by April reached US $ 2,036 million against the US $ 1,061 million in the corresponding period of 2007. The import bill on petroleum products contributed to 55 percent of the trade deficit.

38
Table 2.3 External Trade
Jan-Apr 2007 Cumulative (US $ Mn.)
Jan-Apr 2008 Cumulative (US $ Mn.)
Exports Agriculture Tea Other Industrial Food, Beverages and Tobacco Textiles and Garments Rubber Products Diamond and Jewellery Other Mineral Unclassified
2,238 430 282 148
1,756 144 996 133 105 378 47
5
2,497 590 411 179
1,831 141
1,033 175 113 369 48 28
Imports Consumer goods Food and Drink Other Consumer Goods Motor Cars & Cycles Intermediate goods Petroleum Fertilizer Chemicals Textiles and Clothing Diamonds Other intermediate Goods Investment goods Machinery and Equipment Transport Equipment Building Materials Other Investment Goods Unclassified
3,299 652 336 315 107
1,828 632 33 95
489 79
500 774 356 124 215 80 45
4,533 892 532 359 152
2,597 1,115
123 115 532 123 588
1,013 467 139 297 110 32
Trade Balance -1,060 -2,036 Source: Central Bank of Sri Lanka.

39
Private Remittances
• Reflecting the increase in average earnings by migrant workers and increased transfers through the banking sector, the private remittances increased to US $ 975 million in the first four months in 2008, compared to US $ 864 million during the same period of 2007. The worker remittance during this period were sufficient to cover 87 percent of the oil bill.
Overall Balance and Official Reserves
• The balance of Payment (BoP) had generated a surplus of US $ 292 million by end of May 2008 compared to US $ 250 million at end May 2007.
• The gross official foreign reserve increased to US $ 3,562 million by end May 2008 from US $ 3,508 million at end 2007. Total foreign reserves of the country were US $ 5 billion by end April 2008. The official reserves were sufficient for about 3.5 months of imports as of end May.
Financial Sector Development .
• Central Bank of Sri Lanka (CBSL) maintained the reserve money within the targeted levels reflecting a growth of 11.7 percent in the first quarter of 2008. To maintain the market liquidity at a level consistent with the light monetary targets, CBSL has engaged in aggressive open market operation. Accordingly, the availability of reverse repurchase facility to a particular bank has restricted only up to 3 times per month and any excessive participation came under a penalty.
• These measures have led to deceleration in broad money supply to 14.7 percent by April 2008 from 22 percent in August 2007.
• Also as a result of the tight monetary policy stance the credit demand declined substantially to 15 percent by April 2008 from high level of around 26 percent recorded in April 2007.

40
Chapter 3
Foreign Assistance The total commitment made by lenders and donor agencies to Sri Lanka during the period of January to end May 2008 was US$ 1,049 million, of which project loans accounted for US$ 959 million and grants accounted for US$ 90 million.
Table 3. 1 Aid Commitments (Jan- May, 2008)
Donor US$ mn. Japan 42.2 France 23.3 Iran 450.0 India 109.2 Denmark 155.2 Austria 29.6 Saudi Fund 23.0 Asian Development Bank 90.0 World Bank 43.1 IFAD 20.7 UNICEF 39.0 Other 23.8 Total 1049.1
Source: Department of External Resources
41
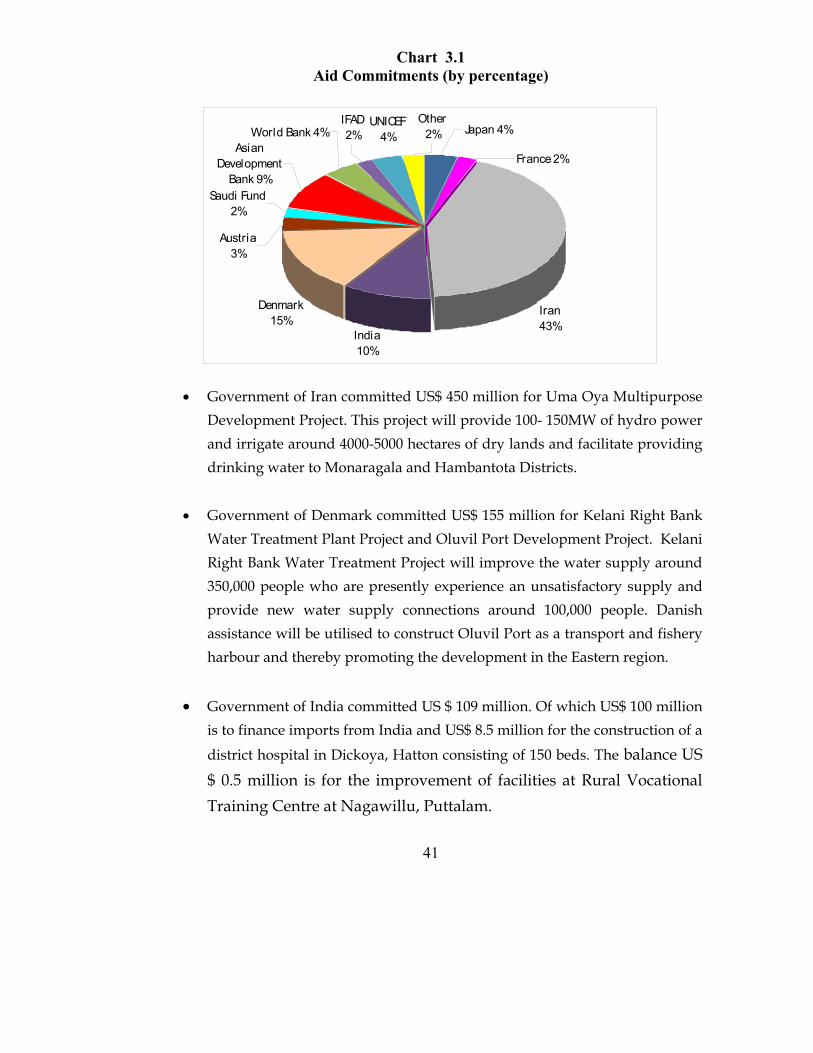
Chart 3.1 Aid Commitments (by percentage)
Saudi Fund2%
Japan 4%
France 2%
Iran43%
India10%
Denmark15%
Austria3%
Asian Development
Bank 9%
World Bank 4%IFAD2%
UNICEF4%
Other2%
• Government of Iran committed US$ 450 million for Uma Oya Multipurpose Development Project. This project will provide 100- 150MW of hydro power and irrigate around 4000-5000 hectares of dry lands and facilitate providing drinking water to Monaragala and Hambantota Districts.
• Government of Denmark committed US$ 155 million for Kelani Right Bank
Water Treatment Plant Project and Oluvil Port Development Project. Kelani Right Bank Water Treatment Project will improve the water supply around 350,000 people who are presently experience an unsatisfactory supply and provide new water supply connections around 100,000 people. Danish assistance will be utilised to construct Oluvil Port as a transport and fishery harbour and thereby promoting the development in the Eastern region.
• Government of India committed US $ 109 million. Of which US$ 100 million is to finance imports from India and US$ 8.5 million for the construction of a
district hospital in Dickoya, Hatton consisting of 150 beds. The balance US $ 0.5 million is for the improvement of facilities at Rural Vocational Training Centre at Nagawillu, Puttalam.

42
• The supplementary funds amounting to US$ 90 million was
committed by the Asian Development Bank for the Southern Expressway Development Project will be utilised to expand the initial two-lane highway to four-lane and provide access road to Galle, as well as to finance the cost overrun in the two-lane highway.
• The World Bank provided US$ 42 million for Renewable Energy for
Rural Economic Development Project and US$ 1.4 million for Avian Influenza Preparedness and Response Project.
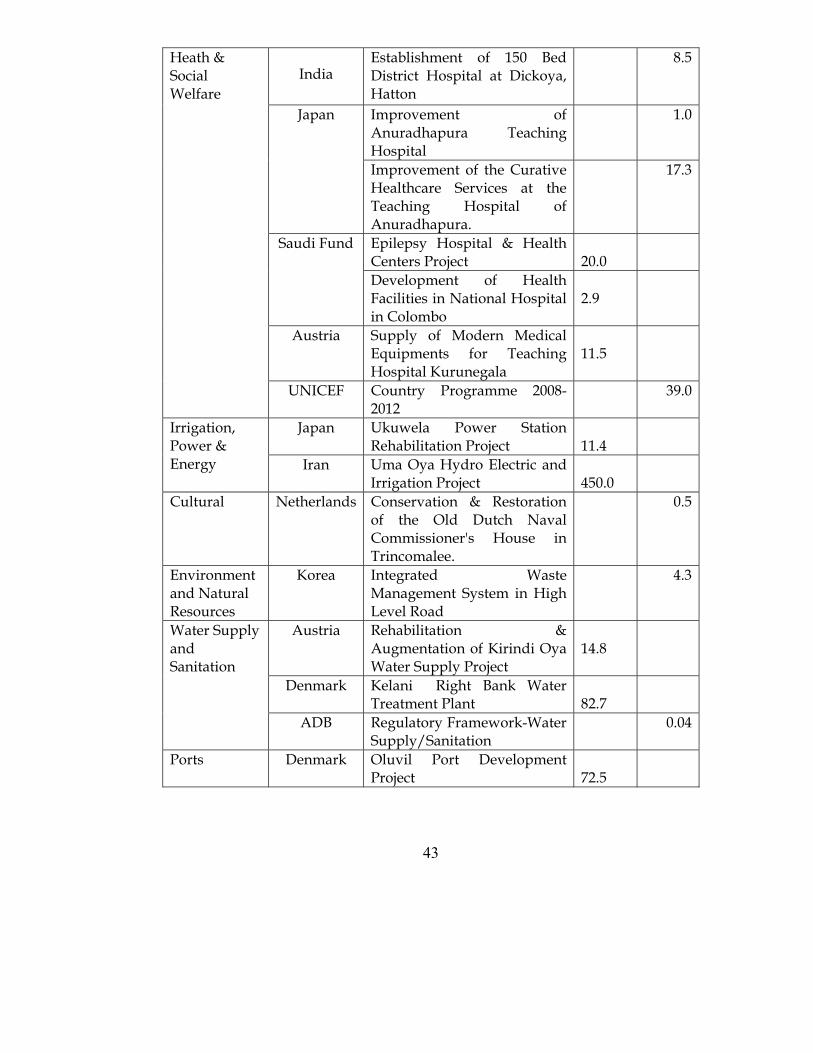
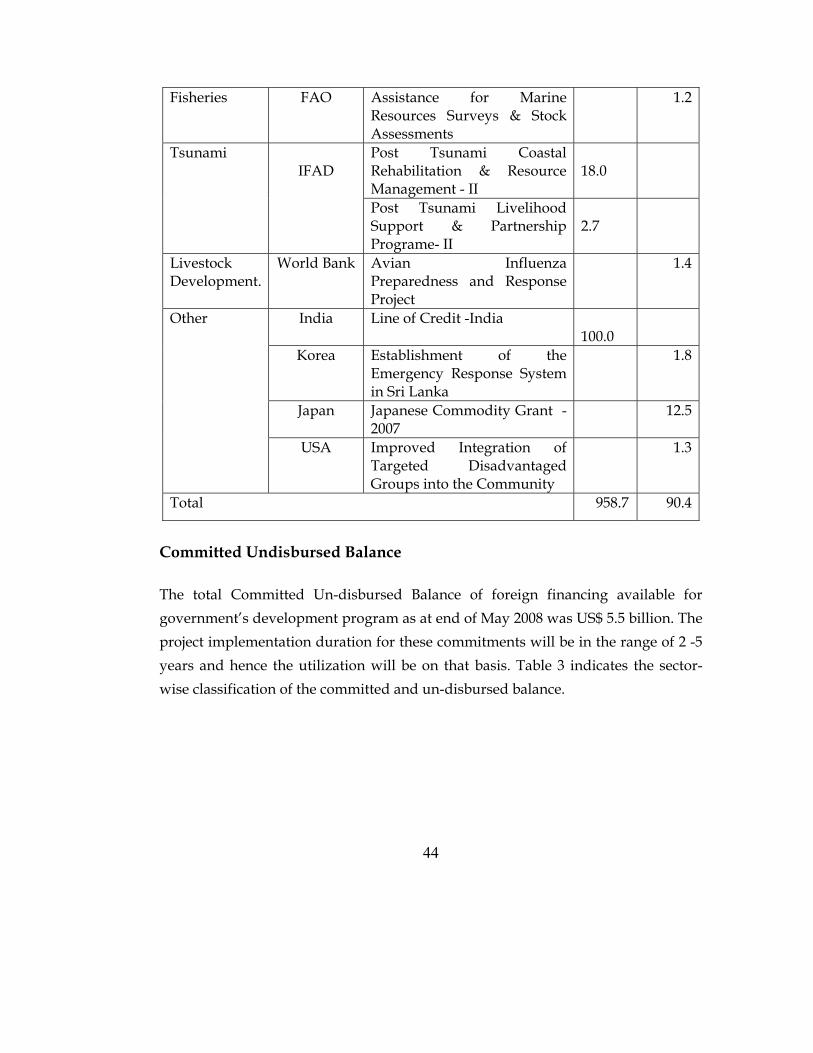
Table 3.2
Commitments from 01.01.2008 to 31.05.2008 (US$ million) Sector Country Project name Loan Grant
Australia Supply & Installation of 5000 Solar Powered Drip Irrigation & Fertilizing Systems
13.8
Agricultural Assistance in Support of Household Returnees to Batticaloa
0.4
Agriculture
FAO
Improvement of Pepper Production
0.5
France Trincomalee Integrated Infrastructure Project
23.3
ADB Southern Expressway Development Project - Supplementary
90.0
Transport
Austria Railway Bridges to Extend Rail Tracks
3.3
India Setting up of Facilities at Rural Vocational Training Centre, Nagawillu,Puttalam
0.5 Rural Development
World Bank Renewable Energy for Rural Economic Development
41.6
43
India
Establishment of 150 Bed District Hospital at Dickoya, Hatton
8.5
Improvement of Anuradhapura Teaching Hospital
1.0 Japan
Improvement of the Curative Healthcare Services at the Teaching Hospital of Anuradhapura.
17.3
Epilepsy Hospital & Health Centers Project
20.0
Saudi Fund
Development of Health Facilities in National Hospital in Colombo
2.9
Austria Supply of Modern Medical Equipments for Teaching Hospital Kurunegala
11.5
Heath & Social Welfare
UNICEF Country Programme 2008-2012
39.0
Japan Ukuwela Power Station Rehabilitation Project
11.4
Irrigation, Power & Energy Iran Uma Oya Hydro Electric and
Irrigation Project 450.0
Cultural Netherlands Conservation & Restoration of the Old Dutch Naval Commissioner's House in Trincomalee.
0.5
Environment and Natural Resources
Korea Integrated Waste Management System in High Level Road
4.3
Austria Rehabilitation & Augmentation of Kirindi Oya Water Supply Project
14.8
Denmark Kelani Right Bank Water Treatment Plant
82.7
Water Supply and Sanitation
ADB Regulatory Framework-Water Supply/Sanitation
0.04
Ports Denmark Oluvil Port Development Project
72.5
44
Fisheries FAO Assistance for Marine Resources Surveys & Stock Assessments
1.2
Post Tsunami Coastal Rehabilitation & Resource Management - II
18.0
Tsunami IFAD
Post Tsunami Livelihood Support & Partnership Programe- II
2.7
Livestock Development.
World Bank Avian Influenza Preparedness and Response Project
1.4
India Line of Credit -India 100.0
Korea Establishment of the Emergency Response System in Sri Lanka
1.8
Japan Japanese Commodity Grant -2007
12.5
Other
USA Improved Integration of Targeted Disadvantaged Groups into the Community
1.3
Total 958.7 90.4
Committed Undisbursed Balance The total Committed Un-disbursed Balance of foreign financing available for government’s development program as at end of May 2008 was US$ 5.5 billion. The project implementation duration for these commitments will be in the range of 2 -5 years and hence the utilization will be on that basis. Table 3 indicates the sector-wise classification of the committed and un-disbursed balance.

45
Table 3.3
Committed Un-disbursed Balance (CUB) – (by sector) as of 31st May 2008
Source: Department of External Resources Foreign Fund Disbursements The total foreign fund disbursement up to end of May 2008 was US$ 368 million. Of the total disbursement, project loans accounted for US$ 335 million and grants US$ 33 million.
Sector US$ Mn As a % of CUB
Roads, and Transport 922.2 16.8 Ports 746.1 13.6 Water Supply & Sanitation 469.6 8.6 Tsunami Rehabilitation 590.0 10.8 Health, Education & Vocational Training 430.1 7.8 Power & Energy 744.0 13.6 Private Sector Development 142.6 2.6 Agriculture, Fisheries, Irrigation and Land 680.7 12.4 Conflict Affected Areas Rehabilitation 149.5 2.7 Rural Development 127.8 2.3 Environment & Natural Resources 83.6 1.5 IT, Science & Technology 47.4 0.9 Housing & Urban Development 51.1 0.9 Other 301.4 5.5 Total 5,486.1 100

46
Table 3.4 Foreign Aid Disbursement
Donor US$ million Japan 91.2 Austria 12.2 China 17.1 Germany 6.1 Netherlands 6.8 United Kingdom 50.3 Asian Development Bank 104.6 World Bank 65.3 Other 14.4 Total 368.0
Source: Department of External Resources
Chart 3. 2 Foreign Aid Disbursements by Donors
104.6
12.2 17.16.1
91.2
6.8
50.3
65.3
0.0
20.0
40.0
60.0
80.0
100.0
120.0
AsianDevelopment
Bank
Austria China Germany Japan Netherlands UnitedKingdom
World Bank
Donor
US
$ M
illio
n

47
External Debt
• The total external debt of the government as at end of May 2008 stood at US $ 15.3 billion. This was an increase of US $ 180 million compared to the debt stock stood at end 2007.
• The total debt service payment up to 31st May 2008 amounted to US $ 281.6
million. Of this US $ 181.1 million was for principal payments and the balance US$ 100.5 for the interest payments. The total estimated debt service payment for 2008 is US $ 995 million, of which 28.3 percent has already been paid by 31st May 2008.