Mirant Mid-Atlantic MWAQC Technical Advisory Committee Briefing January 21, 2005.
Upload
phamkhuongCategory
view
216download
1
Mid-Year Economic Briefing
Corporate Debt Market, Corporate Issuances
and Growth Industries
Capital raising May 2013 YTD
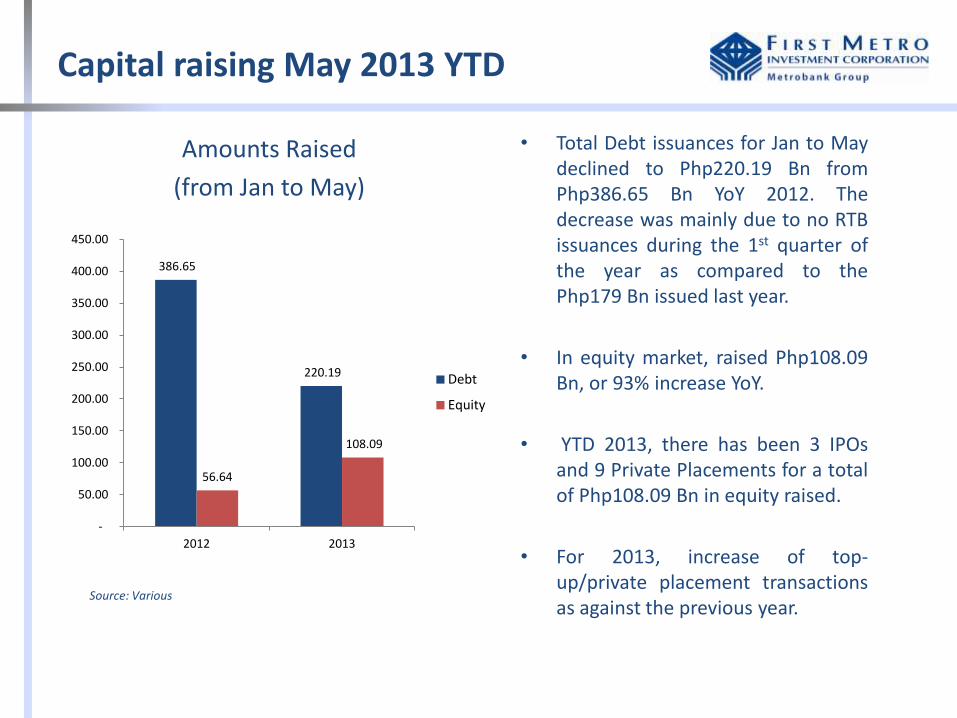
• Total Debt issuances for Jan to May declined to Php220.19 Bn from Php386.65 Bn YoY 2012. The decrease was mainly due to no RTB issuances during the 1st quarter of the year as compared to the Php179 Bn issued last year.
• In equity market, raised Php108.09 Bn, or 93% increase YoY.
• YTD 2013, there has been 3 IPOs and 9 Private Placements for a total of Php108.09 Bn in equity raised.
• For 2013, increase of top-up/private placement transactions as against the previous year.
Amounts Raised
(from Jan to May)
Source: Various
386.65
220.19
56.64
108.09
-
50.00
100.00
150.00
200.00
250.00
300.00
350.00
400.00
450.00
2012 2013
Debt
Equity
How it was cut up
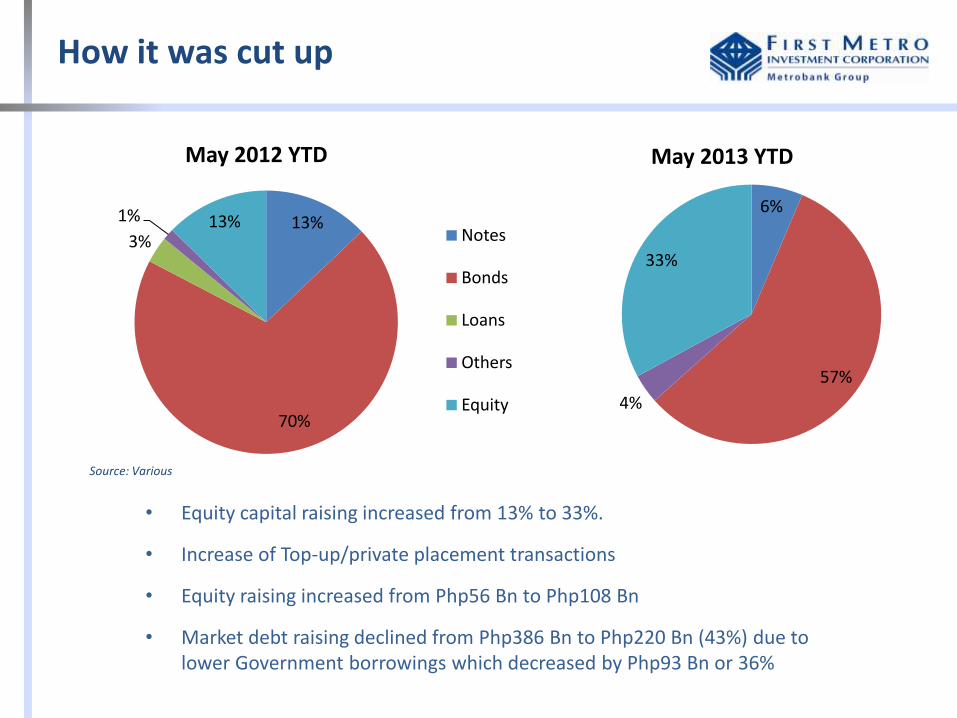
• Equity capital raising increased from 13% to 33%.
• Increase of Top-up/private placement transactions
• Equity raising increased from Php56 Bn to Php108 Bn
• Market debt raising declined from Php386 Bn to Php220 Bn (43%) due to lower Government borrowings which decreased by Php93 Bn or 36%
May 2013 YTD
6%
57%
4%
33%
13%
70%
3%
1% 13% Notes
Bonds
Loans
Others
Equity
May 2012 YTD
Source: Various
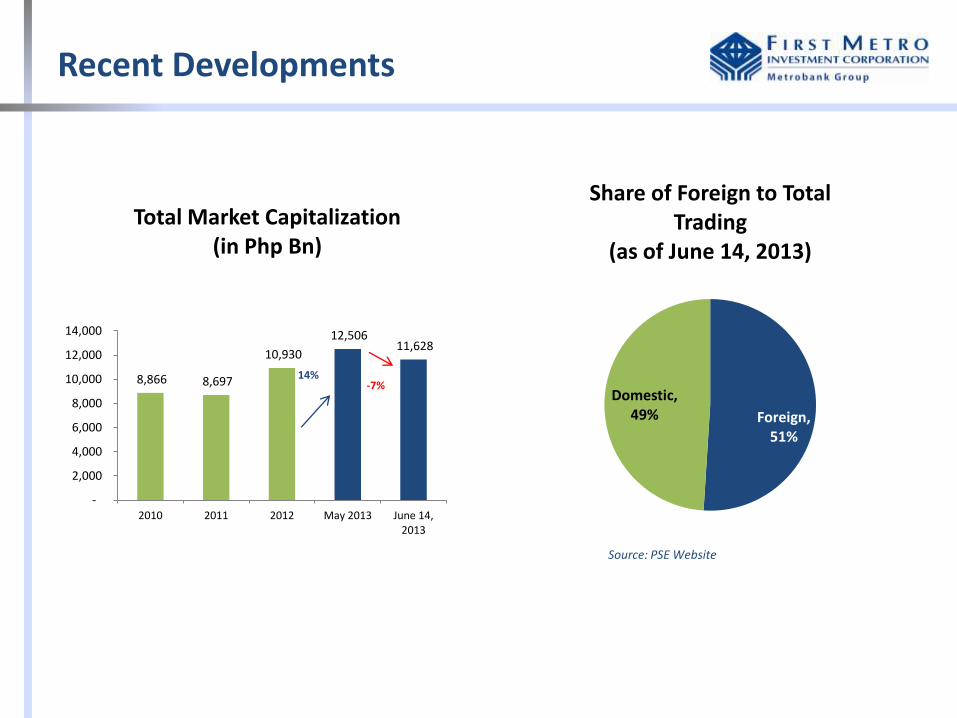
Recent Developments
8,866 8,697
10,930
12,506 11,628
-
2,000
4,000
6,000
8,000
10,000
12,000
14,000
2010 2011 2012 May 2013 June 14, 2013
Total Market Capitalization (in Php Bn)
14% -7%
Foreign, 51%
Domestic, 49%
Share of Foreign to Total Trading
(as of June 14, 2013)
Source: PSE Website
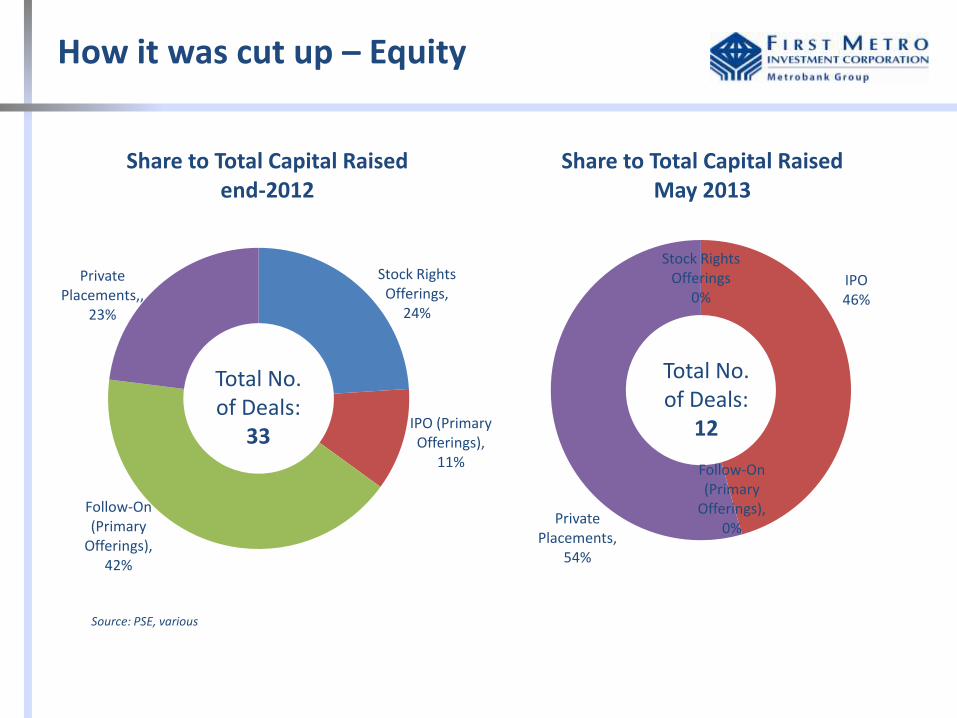
How it was cut up – Equity
Stock Rights Offerings,
24%
IPO (Primary Offerings),
11%
Follow-On (Primary
Offerings), 42%
Private Placements,,
23%
Share to Total Capital Raised end-2012
Total No. of Deals:
33
Stock Rights Offerings
0% IPO 46%
Follow-On (Primary
Offerings), 0%
Private Placements,
54%
Share to Total Capital Raised May 2013
Total No. of Deals:
12
Source: PSE, various
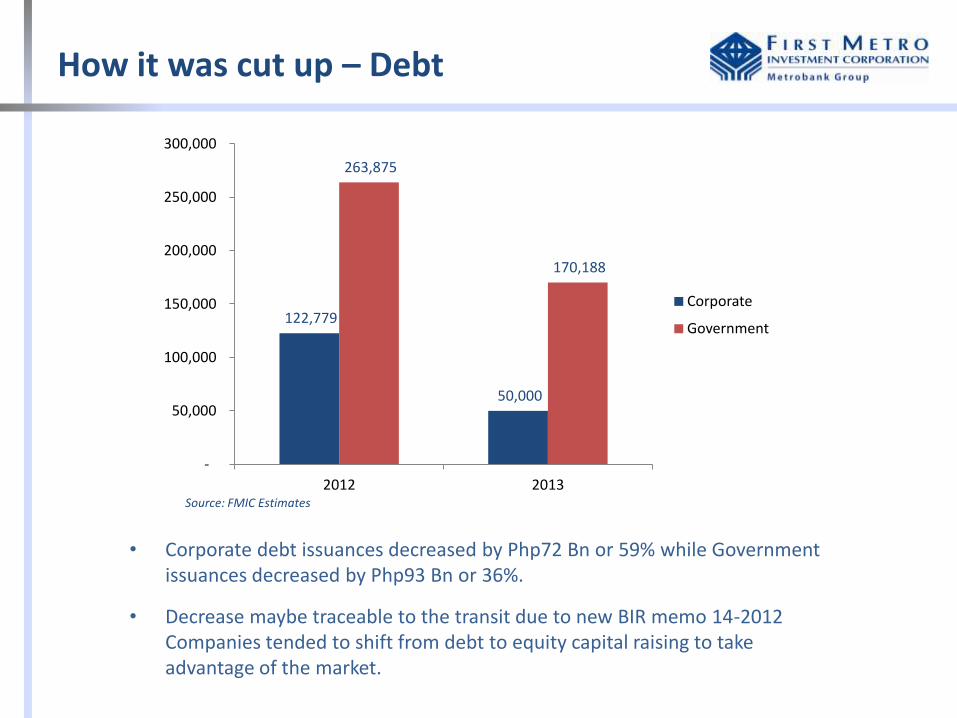
122,779
50,000
263,875
170,188
-
50,000
100,000
150,000
200,000
250,000
300,000
2012 2013
Corporate
Government
How it was cut up – Debt
• Corporate debt issuances decreased by Php72 Bn or 59% while Government issuances decreased by Php93 Bn or 36%.
• Decrease maybe traceable to the transit due to new BIR memo 14-2012 Companies tended to shift from debt to equity capital raising to take advantage of the market.
Source: FMIC Estimates
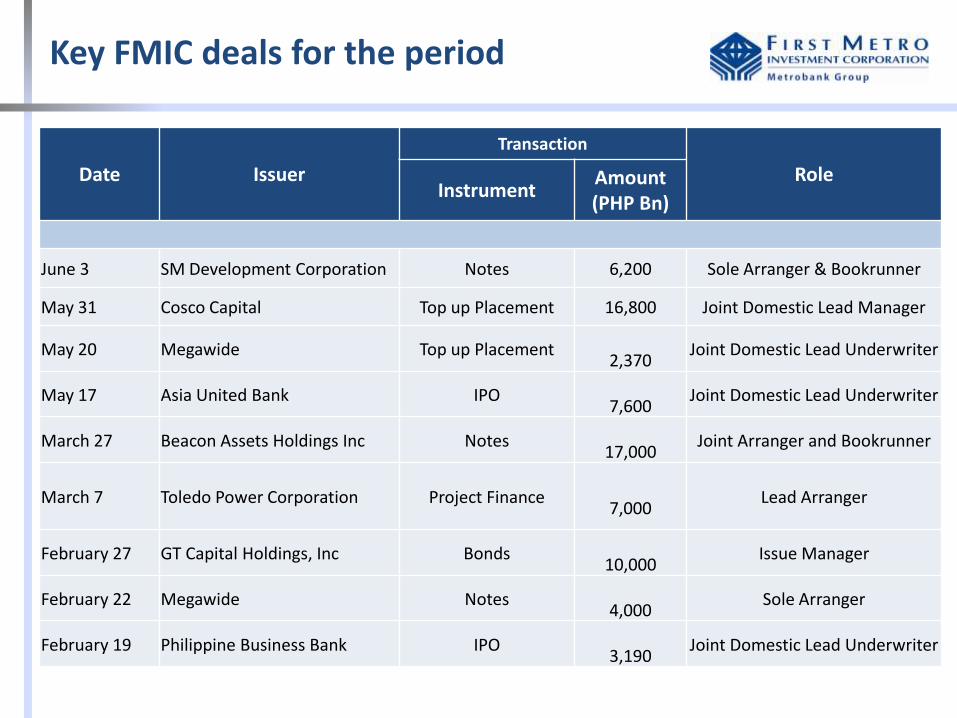
Date Issuer
Transaction
Role Instrument
Amount (PHP Bn)
June 3 SM Development Corporation Notes 6,200 Sole Arranger & Bookrunner
May 31 Cosco Capital Top up Placement 16,800 Joint Domestic Lead Manager
May 20 Megawide Top up Placement
2,370 Joint Domestic Lead Underwriter
May 17 Asia United Bank IPO
7,600 Joint Domestic Lead Underwriter
March 27 Beacon Assets Holdings Inc Notes
17,000 Joint Arranger and Bookrunner
March 7 Toledo Power Corporation Project Finance
7,000 Lead Arranger
February 27 GT Capital Holdings, Inc Bonds
10,000 Issue Manager
February 22 Megawide Notes
4,000 Sole Arranger
February 19 Philippine Business Bank IPO
3,190 Joint Domestic Lead Underwriter
Key FMIC deals for the period
Select Sectors
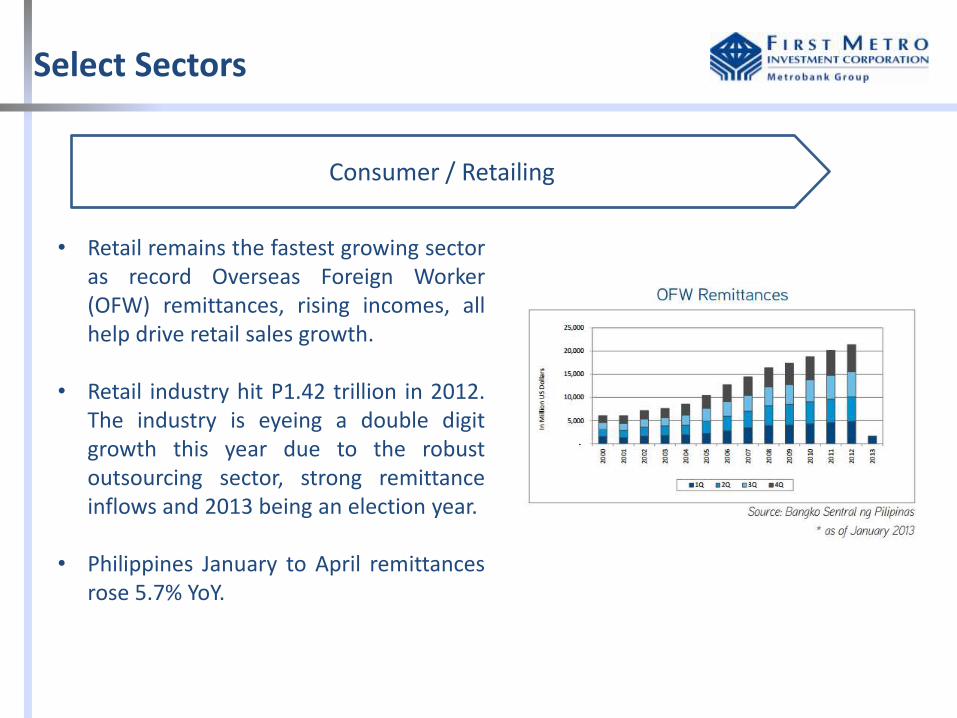
Consumer / Retailing
• Retail remains the fastest growing sector as record Overseas Foreign Worker (OFW) remittances, rising incomes, all help drive retail sales growth.
• Retail industry hit P1.42 trillion in 2012. The industry is eyeing a double digit growth this year due to the robust outsourcing sector, strong remittance inflows and 2013 being an election year.
• Philippines January to April remittances rose 5.7% YoY.
Select Sectors
Infrastructure - Some headway in the PPP (rail and airports) and Public sector initiated infra projects
• The Department of Budget and Management (DBM) reported that from January to April, infrastructure spending of the national government hit Php75.2 Bn, rising nearly 45% from Php52 Bn in the same period last year. • Mainly for road projects and partly the construction of irrigation systems, classrooms and
other educational facilities, and hospitals and health centers
• Excludes PPPs: Daang Hari, NAIA Expressway, National Orthopedic, Mactan Airport, LRT 1 Extension, CALA, Rehabilitation of the Angat Hydro-Electric Power Plant Auxiliary Turbines 4 and 5; Automated Fare Collection System
• Under the Philippine Development Plan 2011 to 2016, the Aquino administration is aiming for a
22 percent investment rate of GDP by 2016 and growth averaging to 7-8 percent a year. The country's investment-to-GDP ratio stood at 19.7 percent last year, only slightly higher than the 19.1 percent in 2011.
• Indonesia's investment rate stood at 33 percent in 2011, while that of Thailand and Malaysia at 27 percent and 24 percent, respectively.
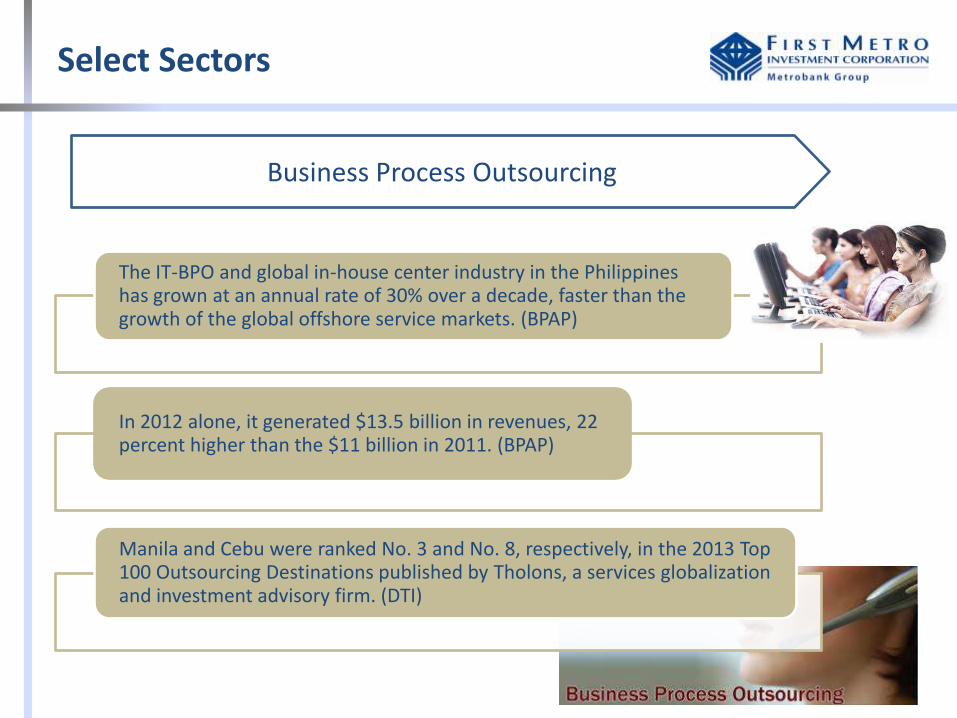
The IT-BPO and global in-house center industry in the Philippines has grown at an annual rate of 30% over a decade, faster than the growth of the global offshore service markets. (BPAP)
In 2012 alone, it generated $13.5 billion in revenues, 22 percent higher than the $11 billion in 2011. (BPAP)
Manila and Cebu were ranked No. 3 and No. 8, respectively, in the 2013 Top 100 Outsourcing Destinations published by Tholons, a services globalization and investment advisory firm. (DTI)
Select Sectors
Business Process Outsourcing
Select Sectors
Select Sectors
Property Sector
Source: Jones Lang LaSalle Leechiu Metro Manila Real Estate Overview, January 2013
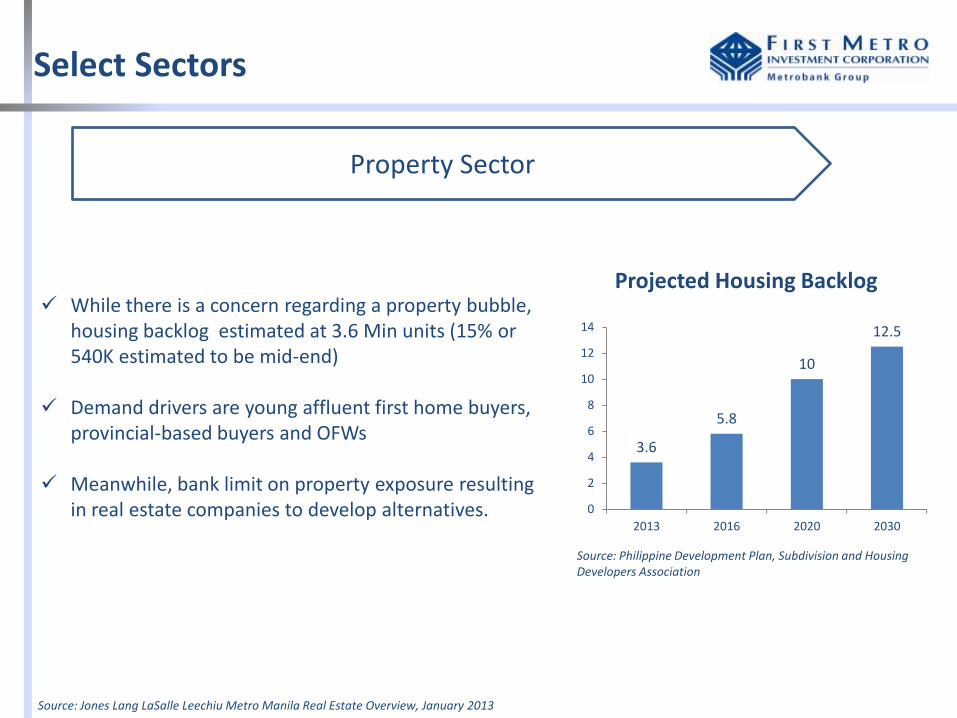
While there is a concern regarding a property bubble, housing backlog estimated at 3.6 Min units (15% or 540K estimated to be mid-end)
Demand drivers are young affluent first home buyers, provincial-based buyers and OFWs
Meanwhile, bank limit on property exposure resulting in real estate companies to develop alternatives.
3.6
5.8
10
12.5
0
2
4
6
8
10
12
14
2013 2016 2020 2030
Projected Housing Backlog
Source: Philippine Development Plan, Subdivision and Housing Developers Association
Manufacturing Resurgence?
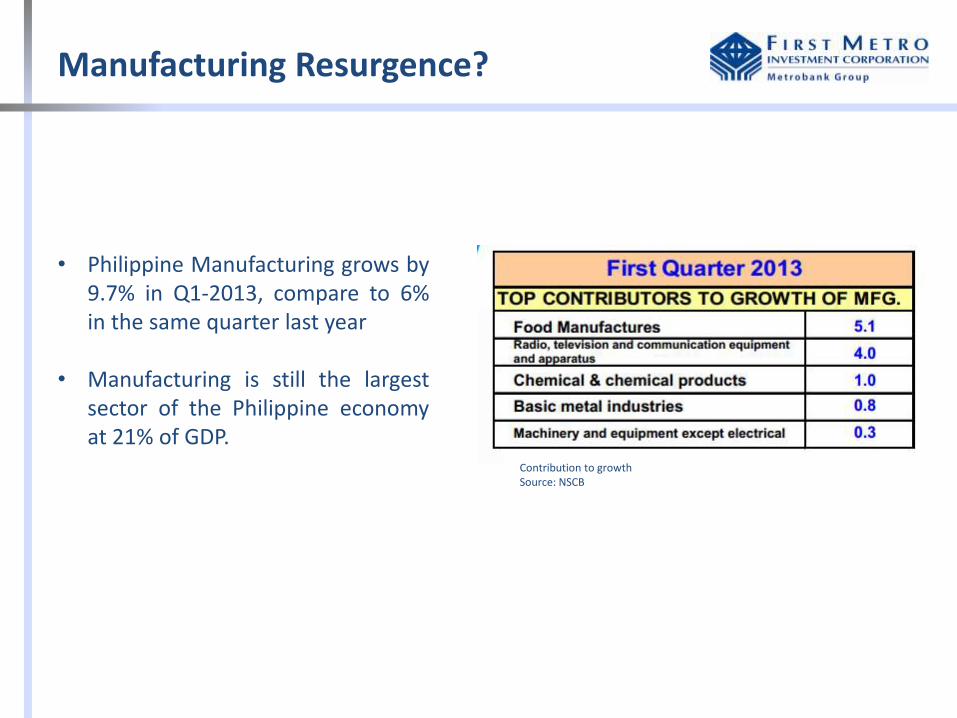
Contribution to growth Source: NSCB
• Philippine Manufacturing grows by 9.7% in Q1-2013, compare to 6% in the same quarter last year
• Manufacturing is still the largest sector of the Philippine economy at 21% of GDP.
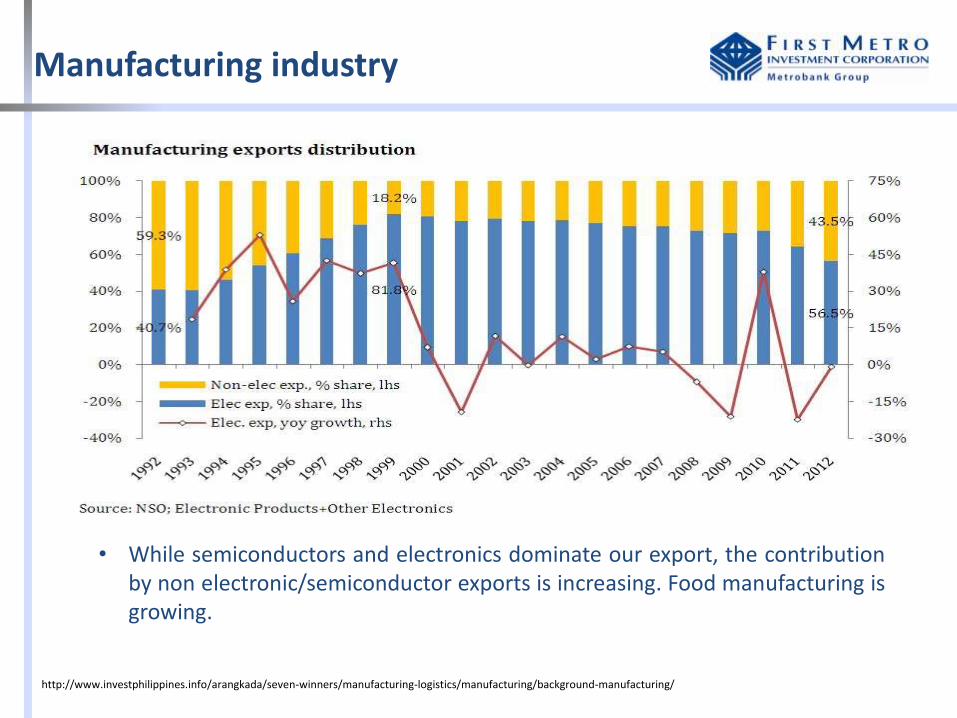
Manufacturing industry
http://www.investphilippines.info/arangkada/seven-winners/manufacturing-logistics/manufacturing/background-manufacturing/
• While semiconductors and electronics dominate our export, the contribution by non electronic/semiconductor exports is increasing. Food manufacturing is growing.
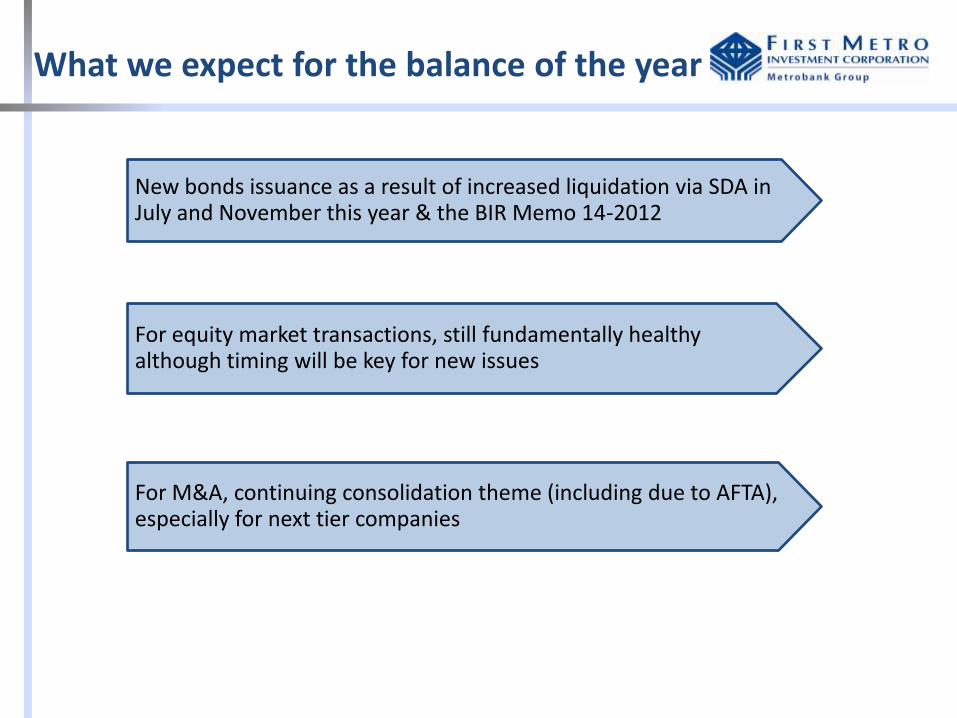
What we expect for the balance of the year
New bonds issuance as a result of increased liquidation via SDA in July and November this year & the BIR Memo 14-2012
For equity market transactions, still fundamentally healthy although timing will be key for new issues
For M&A, continuing consolidation theme (including due to AFTA), especially for next tier companies
First Metro Investment Corporation
45/F GT Tower International
6813 Ayala Avenue corner HV Dela Costa St.
Makati City 1227, Philippines
www.firstmetro.com.ph
Tel: (63-2) 858-7900
Fax: (63-2) 840-3706
Roberto Juanchito T. Dispo
President
858-7903 [email protected]
Justino R. Ocampo
Senior Vice President
Head, Investment Banking
858-7958 [email protected]
16