The transport geography of logistics and freight distribution

Mid North Coast Freight and Distribution Study
Regional Development Australia – Mid North Coast
RDA Priorities 2015-2016
RDA name Regional Development Australia Mid North Coast
Project Name Mid North Coast Freight and Distribution Study
RDA Project Priority 1
Document Title: Mid North Coast Freight and Distribution Study
Prepared For: NSW Department of Industry | Regional Development
Prepared By: Regional Development Australia Mid North Coast
This document is the joint intellectual property of RDA Mid North Coast & NSW Department of Industry, allowing
dissemination to other organisations as appropriate. The project methodology used to develop the document remains the
Intellectual Property of RDA Mid North Coast. You may reproduce and publish this document in whole or in part for you and
your organisation’s own personal, educational or non-commercial purposes. You must not reproduce or publish this
document for commercial gain without the prior written consent of RDA Mid North Coast or NSW Department of Industry.

Mid North Coast Freight and Distribution Study
Regional Development Australia – Mid North Coast
Mid North Coast Freight and Distribution Study
Contents Executive Summary ............................................................................................................................... 1
1. Introduction ................................................................................................................................ 1
1.1 Study purpose and objectives ...................................................................................................... 5
1.2 The Study Area ............................................................................................................................ 6
1.3 Structure of this report ................................................................................................................. 7
Section 2 – Definitions and Sustainability Criteria ............................................................................. 8
2.1 Intermodal Terminal ..................................................................................................................... 8
2.2 Road Freight Hubs ..................................................................................................................... 10
2.3 Highway Service Centres .......................................................................................................... 11
Section 3 – The Current and Forecast Freight Task ......................................................................... 12
3.1 Overview of the Freight Task on the Mid North Coast ............................................................... 12
3.2 Outbound Freight ....................................................................................................................... 14
3.3 Inbound Freight ......................................................................................................................... 16
3.4 Forecast Freight Growth ............................................................................................................ 18
3.4.1 Forecast Outbound Freight (2031) ............................................................................................. 18
3.4.2 Forecast Inbound Freight (2031) ............................................................................................... 18
Section 4 – Road or Rail? ................................................................................................................... 20
4.1 Identification of Contestable Rail Freight ................................................................................... 22
4.2 Intermodal Freight Hub Summary .............................................................................................. 22
Section 5 - The Road Network ............................................................................................................ 26
5.1 The Existing Road Network ....................................................................................................... 26
5.2 Proposed Freight Transport Infrastructure ................................................................................. 27
5.3 Viability of a Regional Freight Transport Hub ............................................................................ 28
Section 6: The Rail Network ............................................................................................................... 32
6.1 The Existing Rail Network .......................................................................................................... 32
Mid North Coast Freight and Distribution Study
Regional Development Australia – Mid North Coast
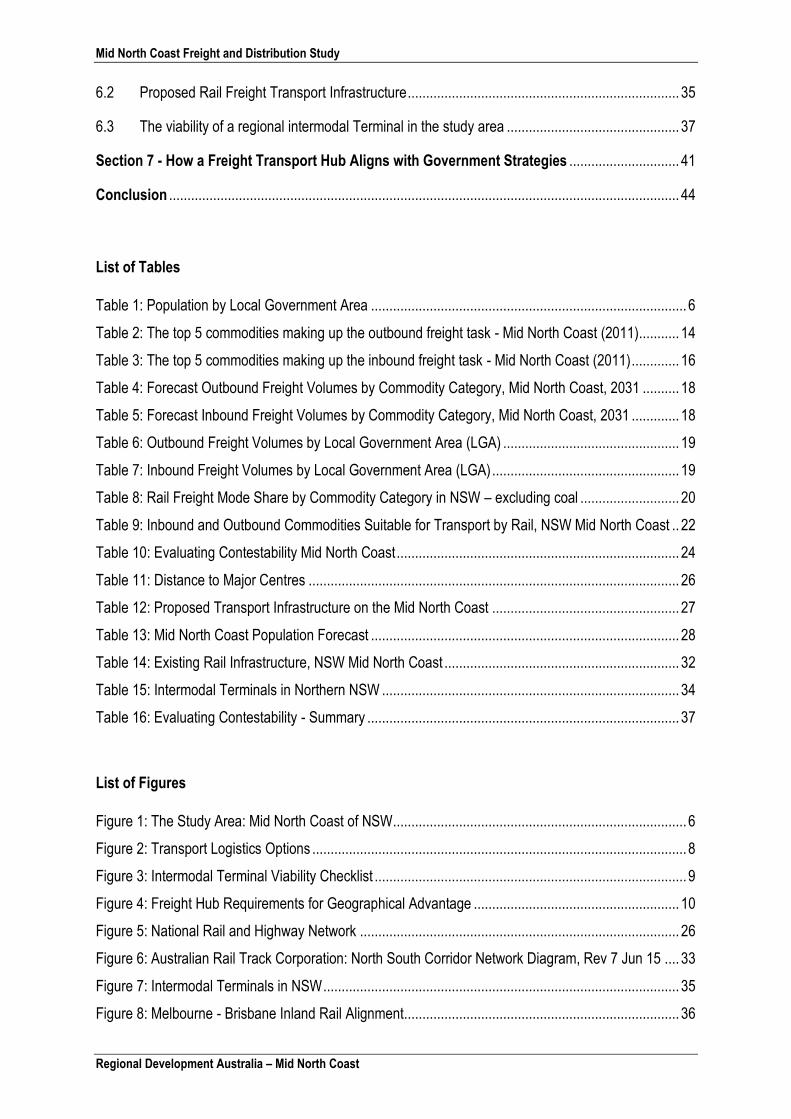
6.2 Proposed Rail Freight Transport Infrastructure .......................................................................... 35
6.3 The viability of a regional intermodal Terminal in the study area ............................................... 37
Section 7 - How a Freight Transport Hub Aligns with Government Strategies .............................. 41
Conclusion ........................................................................................................................................... 44
List of Tables
Table 1: Population by Local Government Area ...................................................................................... 6
Table 2: The top 5 commodities making up the outbound freight task - Mid North Coast (2011) ........... 14
Table 3: The top 5 commodities making up the inbound freight task - Mid North Coast (2011) ............. 16
Table 4: Forecast Outbound Freight Volumes by Commodity Category, Mid North Coast, 2031 .......... 18
Table 5: Forecast Inbound Freight Volumes by Commodity Category, Mid North Coast, 2031 ............. 18
Table 6: Outbound Freight Volumes by Local Government Area (LGA) ................................................ 19
Table 7: Inbound Freight Volumes by Local Government Area (LGA) ................................................... 19
Table 8: Rail Freight Mode Share by Commodity Category in NSW – excluding coal ........................... 20
Table 9: Inbound and Outbound Commodities Suitable for Transport by Rail, NSW Mid North Coast .. 22
Table 10: Evaluating Contestability Mid North Coast ............................................................................. 24
Table 11: Distance to Major Centres ..................................................................................................... 26
Table 12: Proposed Transport Infrastructure on the Mid North Coast ................................................... 27
Table 13: Mid North Coast Population Forecast .................................................................................... 28
Table 14: Existing Rail Infrastructure, NSW Mid North Coast ................................................................ 32
Table 15: Intermodal Terminals in Northern NSW ................................................................................. 34
Table 16: Evaluating Contestability - Summary ..................................................................................... 37
List of Figures
Figure 1: The Study Area: Mid North Coast of NSW ................................................................................ 6
Figure 2: Transport Logistics Options ...................................................................................................... 8
Figure 3: Intermodal Terminal Viability Checklist ..................................................................................... 9
Figure 4: Freight Hub Requirements for Geographical Advantage ........................................................ 10
Figure 5: National Rail and Highway Network ....................................................................................... 26
Figure 6: Australian Rail Track Corporation: North South Corridor Network Diagram, Rev 7 Jun 15 .... 33
Figure 7: Intermodal Terminals in NSW ................................................................................................. 35
Figure 8: Melbourne - Brisbane Inland Rail Alignment ........................................................................... 36
Mid North Coast Freight and Distribution Study
Regional Development Australia – Mid North Coast 1
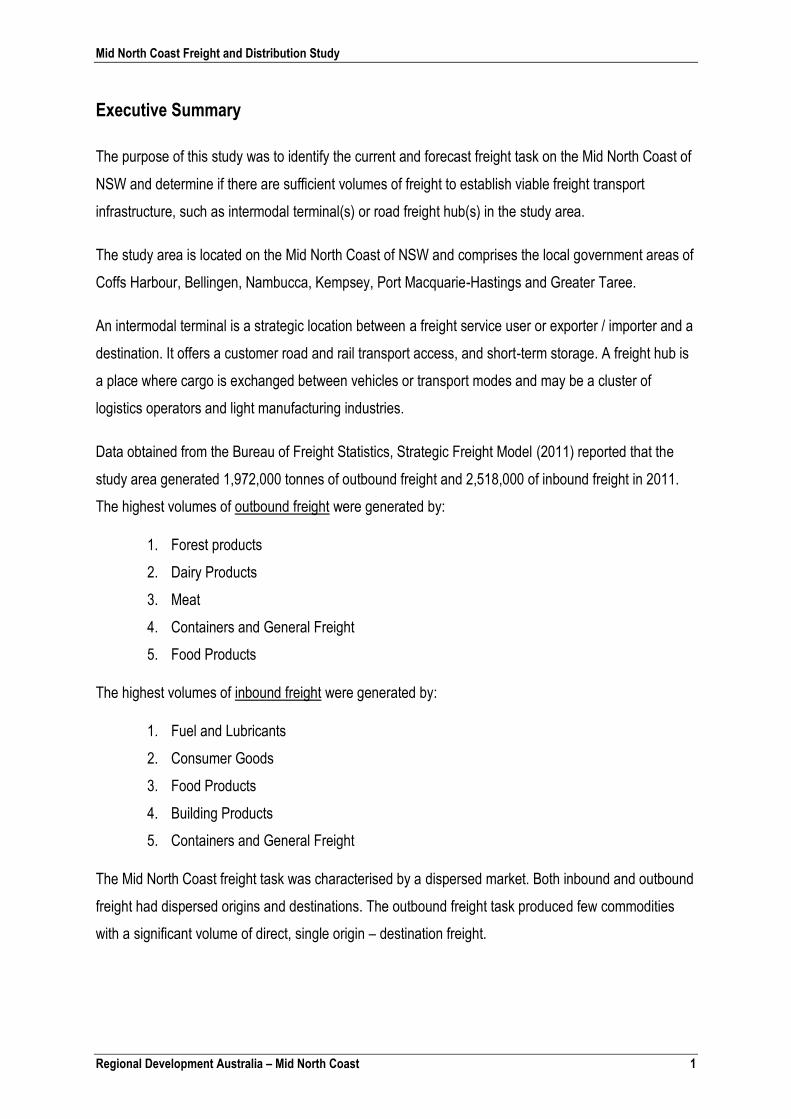
Executive Summary
The purpose of this study was to identify the current and forecast freight task on the Mid North Coast of
NSW and determine if there are sufficient volumes of freight to establish viable freight transport
infrastructure, such as intermodal terminal(s) or road freight hub(s) in the study area.
The study area is located on the Mid North Coast of NSW and comprises the local government areas of
Coffs Harbour, Bellingen, Nambucca, Kempsey, Port Macquarie-Hastings and Greater Taree.
An intermodal terminal is a strategic location between a freight service user or exporter / importer and a
destination. It offers a customer road and rail transport access, and short-term storage. A freight hub is
a place where cargo is exchanged between vehicles or transport modes and may be a cluster of
logistics operators and light manufacturing industries.
Data obtained from the Bureau of Freight Statistics, Strategic Freight Model (2011) reported that the
study area generated 1,972,000 tonnes of outbound freight and 2,518,000 of inbound freight in 2011.
The highest volumes of outbound freight were generated by:
1. Forest products
2. Dairy Products
3. Meat
4. Containers and General Freight
5. Food Products
The highest volumes of inbound freight were generated by:
1. Fuel and Lubricants
2. Consumer Goods
3. Food Products
4. Building Products
5. Containers and General Freight
The Mid North Coast freight task was characterised by a dispersed market. Both inbound and outbound
freight had dispersed origins and destinations. The outbound freight task produced few commodities
with a significant volume of direct, single origin – destination freight.

Mid North Coast Freight and Distribution Study
Regional Development Australia – Mid North Coast 2
Outbound Freight
The biggest outbound freight volume was generated by forest products, with Newcastle Port
the key destination for this commodity.
Significant volumes of outbound freight were generated by Containers and General Freight,
with Queensland being the key destination.
Significant volumes of outbound freight were generated by Food Products, with Victoria being
the key destination.
Inbound Freight
The biggest inbound freight task was generated by Fuel and Lubricants with Newcastle being
the key origin.
Significant volumes of inbound freight were generated by Consumer goods, with Newcastle
being the key origin.
Significant volumes of inbound freight were generated by Food Products with QLD being the
key origin.
Significant volumes of inbound freight were generated by Containers and General Freight with
Queensland being the key origin.
Transport for NSW reported a forecast annualised growth rate of 2.44% for outbound freight and 2.99%
for inbound freight. This equates to a 58% increase in outbound freight and a 75% increase in inbound
freight between 2011 and 2031. The forecast annualised population growth rate was much lower at
0.75% or 15% between 2011 and 2031; thus it can be assumed the forecast growth of outbound freight
will need to be largely driven by inter-regional and international trade servicing demand.
Intermodal Freight Hub Viability Assessment
The intermodal freight hub viability assessment concludes that:
The volumes of 2011 inbound and outbound freight did not meet the minimum 10,000 Twenty-
Foot Equivalent Unit (TEU’s) for a sustainable intermodal terminal when a 5% and 10% mode
share was tested.
The volumes of 2011 inbound and outbound freight met the minimum 10,000 TEU’s for a
sustainable terminal when a 15% mode share was tested.
Forecast data for 2031 illustrated the overall volume of both inbound and outbound freight did
not meet the minimum 10,000 TEU’s for a sustainable intermodal terminal when a 5% mode
share was tested.

Mid North Coast Freight and Distribution Study
Regional Development Australia – Mid North Coast 3
Forecast data for 2031 illustrated the overall volume of both inbound and outbound freight
does meet the minimum 10,000 TEU’s for a sustainable intermodal terminal when a 10% and
15% mode share was tested.
The outbound freight task on the Mid North Coast comprised 50% Forest products (2011
data). Transport for NSW (2015) advised that Forest Products can be considered highly
variable as production can stop, start or shift in focus quickly. Given the uncertainty of
production, shippers were often reluctant to fund long term investments in their supply chain.
The variable nature of such a large portion of the Mid North Coast outbound freight task
represented a significant risk to the development of an intermodal freight terminal, based on
this commodity. It was considered this represented a significant limiting factor to the
establishment of an intermodal terminal in the study area.
Road Freight Hub Viability Assessment
The road freight hub viability assessment concluded that:
Three industrial land developments are proposed on the Pacific Highway in the Nambucca,
Port Macquarie - Hastings and Taree LGA’s. These locations were identified as suitable for
development as road freight hubs and were well placed to proceed in a timely fashion.
Existing investment ready industrial land adjacent to the Highway Service Centre in Kempsey
was identified as suitable for development as a road freight hub.
Proposed industrial land in the North Boambee Valley, adjacent to the Pacific Highway bypass
of Coffs Harbour (2018/19 commencement), was identified as suitable for development as a
road freight hub.
Lots in the abovementioned developments were of sufficient size, at all locations, to
accommodate road transport firms.
Services are currently at differing stages of provision, however all services would be available
upon occupation of the abovementioned developments.
Existing businesses adjacent to the Port Macquarie-Hastings LGA proposal (manufacturing)
and the Kempsey LGA development (Highway Service Centre) may assist in attracting future
tenants.
Commercial expressions of interest have been received for the proposal in the Taree LGA and
the Nambucca LGA. A local transport and logistics company has purchased land adjacent to
the Taree LGA proposal. Anchor tenants may assist in attracting future tenants and thus create
demand for road freight services.
Mid North Coast Freight and Distribution Study
Regional Development Australia – Mid North Coast 4
No prohibitive regulations were identified.
Transport for NSW identified strong growth in the volume of both inbound and outbound road
freight to 2031 on the Mid North Coast.
The freight task on the Mid North Coast consisted of multiple commodities, destined for dispersed
locations - a scenario better suited to road transport than rail transport.
Development of an intermodal rail terminal in the region was determined as unlikely to be viable and
unlikely to attract private investment due to low volumes, seasonal commodities and insufficient
distance to destination for a competitive advantage over road transport. Despite this rail transport may
be a viable option for specific commodities, for example forest products, manufactured goods or mining
products, and should be considered on a case by case basis.
Road freight was established as the dominant and most suitable transport mode for the Mid North
Coast freight task. Investment in road freight infrastructure could see improved efficiencies for the
industry and was more likely to attract private investment than rail infrastructure. Five suitable locations
for the development of road freight hubs were identified in this study in Greater Taree, Port Macquarie-
Hastings, Kempsey, Nambucca and Coffs Harbour LGA’s and additional sites may be identified in the
future.

Mid North Coast Freight and Distribution Study
Regional Development Australia – Mid North Coast 5
Section 1: Introduction
1.1 Study purpose and objectives
The purpose of this study was to identify the current and forecast freight task on the Mid North Coast of
NSW. This study was to establish if sufficient freight volumes exist to establish viable freight transport
infrastructure such as intermodal hub(s) or freight hub(s) in the study area.
The objectives of this study were:
To define freight facilities including intermodal transport hubs, freight transport hubs and
service centres;
To define the current and forecast freight task on the Mid North Coast;
To identify existing commodities contestable for a mode shift to rail transport;
To identify existing and proposed freight transport facilities in the region;
To determine the viability of developing road or rail freight transport hubs in the region.
The deliverables (methodology) were defined in the scope of works for this project as:
Consultation between stakeholders from RMS and relevant Councils, industry and investors to
map out existing and potential opportunities;
Consultation with the transport industry to identify needs and existing gaps in infrastructure;
Economic data collection and analysis in support of transport infrastructure and the potential
flow on of jobs, investment and other economic outcomes;
Identification of suitable locations for freight transport hubs;
Freight volume estimates and minimum freight volumes required for a hub to be successful;
Document what level of participation local councils are willing to provide.

Mid North Coast Freight and Distribution Study
Regional Development Australia – Mid North Coast 6
1.2 The Study Area
The study area was the Mid North Coast of NSW, comprising the Local Government Areas of Coffs
Harbour, Bellingen, Nambucca, Kempsey, Port Macquarie-Hastings and Greater Taree. The region is
linear from north to south and stretches from the Great Divide to the east coast.
Figure 1: The Study Area: Mid North Coast of NSW
Port Macquarie-Hastings and Coffs Harbour are the most populated centres, followed by Greater
Taree, Kempsey, Nambucca and Bellingen.
Table 1: Population by Local Government Area
Local Government Area Population Count
Population
Change
(%)
Annualised
Growth Rate (%)
2011 2031
Coffs Harbour 70,950 88,100 24.17% 1.15%
Bellingen 12,900 12,800 -0.78% -0.04%
Nambucca 19,250 20,650 7.27% 0.37%
Kempsey 29,150 30,500 4.63% 0.24%
Port Macquarie Hastings 75,250 90,800 20.66% 0.99%
Greater Taree 48,100 51,900 7.90% 0.40%
Total 255,600 294,750 15.32% 0.75%
Mid North Coast Freight and Distribution Study
Regional Development Australia – Mid North Coast 7
Local Councils are very supportive of freight transport hubs whereby industry capacity can be realised.
Data used in this report has been collected at the regional level (incorporating all LGA’s) and at Local
Government Level.
1.3 Structure of this report
Section 1: Introduction
Section 2: Defines an intermodal freight hub, road freight hub and highway service centre; and
provides sustainability criteria for the development of a regional intermodal terminal and road
freight hub.
Section 3: Describes the current and forecast freight task in the study area
Section 4: Identifies commodities contestable for a mode shift to rail transport
Section 5: Describes the existing road network, proposed road transport network; and
assesses the viability of a road freight transport hub
Section 6: Describes the existing rail network, proposed rail transport infrastructure; and
assesses the viability of a regional intermodal terminal
Section 7: Describes how freight infrastructure aligns with Government strategy
Conclusion

Mid North Coast Freight and Distribution Study
Regional Development Australia – Mid North Coast 8
Section 2 – Definitions and Sustainability Criteria
This section of the report defines an intermodal terminal, road freight hub and highway service centre;
and provides sustainability criteria for the development of a regional intermodal terminal and road
freight hub.
2.1 Intermodal Terminal
An intermodal terminal is a strategic location between a freight service user or exporter / importer and a
destination. It offers a customer road and rail transport access, and short-term storage1.
A place within a regional community;
A business entity that generates a commercially sustainable outcome;
An element within a land-based supply chain.
Intermodal terminals may be located within various supply chains operating in NSW. Regional-based
exporters and importers may choose from a range of transport options to meet their freight needs as
illustrated in Figure 2.
Figure 2: Transport Logistics Options
Source: Sea Freight Council of NSW, nd, Developing Freight Hubs, A Guide to Sustainable Intermodal Terminals for
Regional Communities, available online
http://www.pacificintermodal.com.au/PacificIntermodal/userfiles/file/Developing_Freight_Hubs.pdf
1 Sea Freight Council of NSW, nd, Developing Freight Hubs, A Guide to Sustainable Intermodal Terminals for Regional Communities
Mid North Coast Freight and Distribution Study
Regional Development Australia – Mid North Coast 9
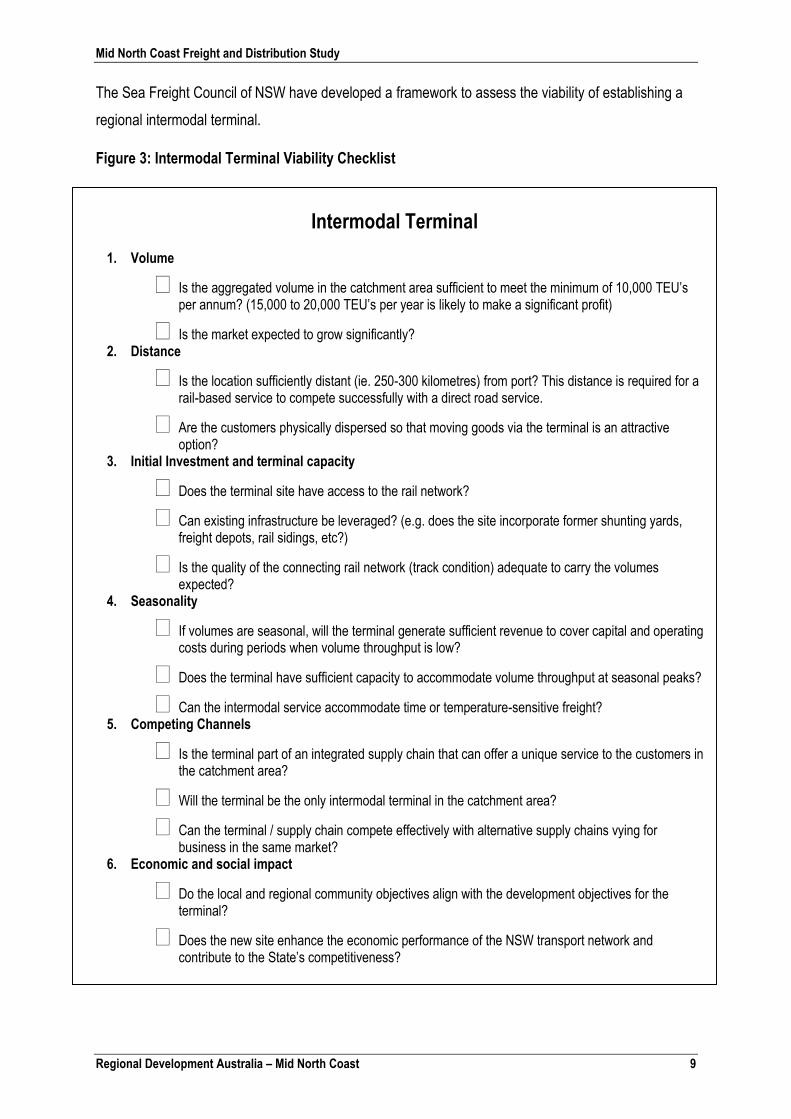
The Sea Freight Council of NSW have developed a framework to assess the viability of establishing a
regional intermodal terminal.
Figure 3: Intermodal Terminal Viability Checklist
Intermodal Terminal
1. Volume
Is the aggregated volume in the catchment area sufficient to meet the minimum of 10,000 TEU’s per annum? (15,000 to 20,000 TEU’s per year is likely to make a significant profit)
Is the market expected to grow significantly? 2. Distance
Is the location sufficiently distant (ie. 250-300 kilometres) from port? This distance is required for a rail-based service to compete successfully with a direct road service.
Are the customers physically dispersed so that moving goods via the terminal is an attractive option?
3. Initial Investment and terminal capacity
Does the terminal site have access to the rail network?
Can existing infrastructure be leveraged? (e.g. does the site incorporate former shunting yards, freight depots, rail sidings, etc?)
Is the quality of the connecting rail network (track condition) adequate to carry the volumes expected?
4. Seasonality
If volumes are seasonal, will the terminal generate sufficient revenue to cover capital and operating costs during periods when volume throughput is low?
Does the terminal have sufficient capacity to accommodate volume throughput at seasonal peaks?
Can the intermodal service accommodate time or temperature-sensitive freight? 5. Competing Channels
Is the terminal part of an integrated supply chain that can offer a unique service to the customers in the catchment area?
Will the terminal be the only intermodal terminal in the catchment area?
Can the terminal / supply chain compete effectively with alternative supply chains vying for business in the same market?
6. Economic and social impact
Do the local and regional community objectives align with the development objectives for the terminal?
Does the new site enhance the economic performance of the NSW transport network and contribute to the State’s competitiveness?
Mid North Coast Freight and Distribution Study
Regional Development Australia – Mid North Coast 10
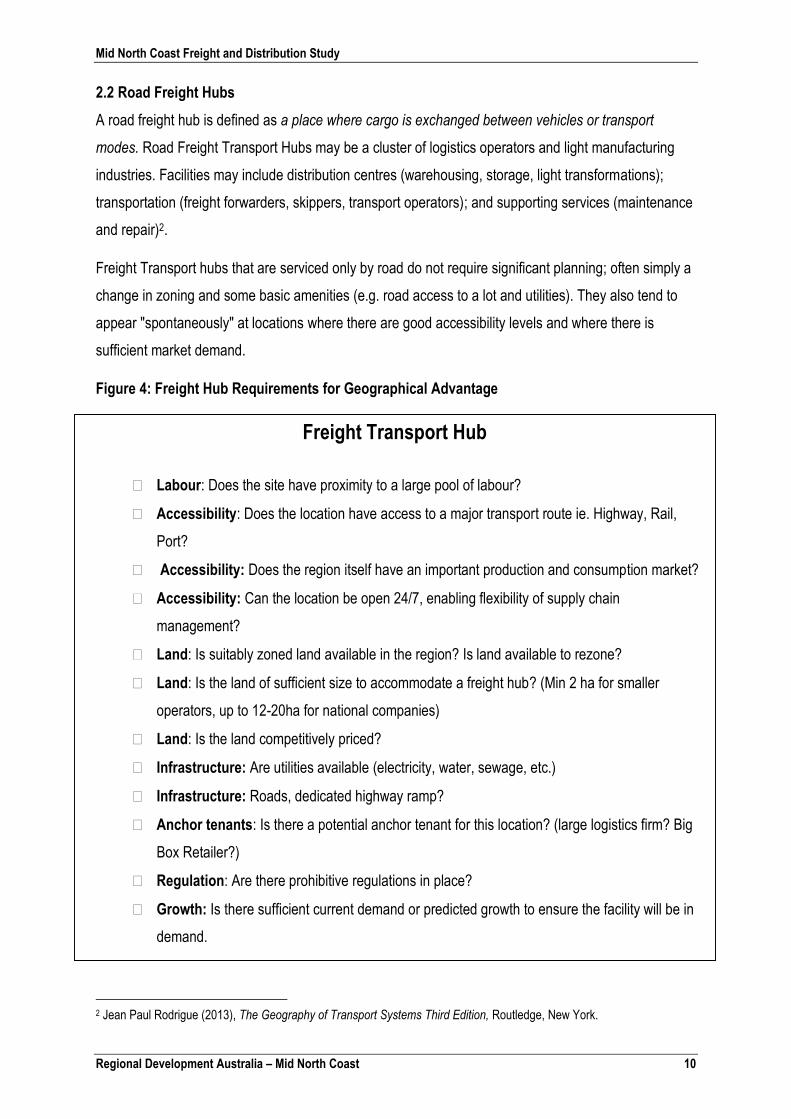
2.2 Road Freight Hubs
A road freight hub is defined as a place where cargo is exchanged between vehicles or transport
modes. Road Freight Transport Hubs may be a cluster of logistics operators and light manufacturing
industries. Facilities may include distribution centres (warehousing, storage, light transformations);
transportation (freight forwarders, skippers, transport operators); and supporting services (maintenance
and repair)2.
Freight Transport hubs that are serviced only by road do not require significant planning; often simply a
change in zoning and some basic amenities (e.g. road access to a lot and utilities). They also tend to
appear "spontaneously" at locations where there are good accessibility levels and where there is
sufficient market demand.
Figure 4: Freight Hub Requirements for Geographical Advantage
2 Jean Paul Rodrigue (2013), The Geography of Transport Systems Third Edition, Routledge, New York.
Freight Transport Hub
Labour: Does the site have proximity to a large pool of labour?
Accessibility: Does the location have access to a major transport route ie. Highway, Rail,
Port?
Accessibility: Does the region itself have an important production and consumption market?
Accessibility: Can the location be open 24/7, enabling flexibility of supply chain
management?
Land: Is suitably zoned land available in the region? Is land available to rezone?
Land: Is the land of sufficient size to accommodate a freight hub? (Min 2 ha for smaller
operators, up to 12-20ha for national companies)
Land: Is the land competitively priced?
Infrastructure: Are utilities available (electricity, water, sewage, etc.)
Infrastructure: Roads, dedicated highway ramp?
Anchor tenants: Is there a potential anchor tenant for this location? (large logistics firm? Big
Box Retailer?)
Regulation: Are there prohibitive regulations in place?
Growth: Is there sufficient current demand or predicted growth to ensure the facility will be in
demand.

Mid North Coast Freight and Distribution Study
Regional Development Australia – Mid North Coast 11
2.3 Highway Service Centres
A Highway Service Centre is defined in the NSW Governments Standard Instrument Local
Environmental Plan as:
…a building or place used to provide refreshments and vehicle services to highway users. It may
include any one or more of the following:
A restaurant or café;
Take away food and drink premises;
Service stations and facilities for emergency vehicle towing and repairs;
Parking for vehicles;
Rest areas and public amenities3.
Roads and Maritime also requires:
That the centre is open 24 hours a day, seven days a week;
That all traffic arrangements are safe and efficient;
At least 25 heavy vehicle parking spaces (nominally to suit B-Doubles, with capacity to expand
to cater for longer combinations in the future) be provided;
A number of parking spaces for recreation vehicles and coaches;
The provision of children’s play areas and tourist information;
That use of toilets and other amenities be free of obligation to purchase goods or services;
Separate undercover fuel areas for heavy and light vehicles;
That no alcohol be sold on site4.
Highway service centre and rest stop locations along the Pacific Highway were identified in the RMS
Pacific Highway Rest Stop Strategy. The strategy is included as Appendix A of this report.
It is considered the location of highway service centres and rest stops provide a service to the transport
industry, however they do not contribute directly to the inbound or outbound freight task. As such no
further consideration is given to highway service centres and rest stops in this study.
3 http://www5.austlii.edu.au/au/legis/nsw/consol_reg//silep531/sch99.html 4 Roads and Maritime Service, 2014, Highway Service Centres along the Pacific Highway, RMS 14.143 available online http://www.rms.nsw.gov.au/documents/projects/key-build-programs/pacific-highway/highway-service-centres-along-the-pacific-highway.pdf
Mid North Coast Freight and Distribution Study
Regional Development Australia – Mid North Coast 12
Section 3 – The Current and Forecast Freight Task
This section of the report details the current and forecast, inbound and outbound freight task on the Mid
North Coast and identifies:
The key commodities and volumes which made up the outbound and inbound freight task in
the study area;
The commodity types best suited to the road and rail markets;
The percentage of freight transported by each mode.
The key focus of this section was to determine if sufficient freight volumes existed in the study
area, to consider rail as a mode of transport.
The data used to analyse the freight task on the Mid North Coast was obtained from Transport for
NSW, Bureau of Statistics and Analytics, Strategic Freight Model. The model was developed in
response to Task 1A-3 of the NSW Freight and Ports Strategy to maintain a single agency for
streamlined data collection and strategic analysis5.
The original source data ranged (in age) from between 2004 to 2010. Based on input growth rates by
commodity, all data were then adjusted to provide a base year estimate for 2011 and to forecast 20
years into the future in ten year increments (i.e. 2021 and 2031). The forecast years are consistent with
most other significant data collection and modelling activities between NSW and the Commonwealth
(such as the ABS Census and the BTS population and employment forecasts)5.
3.1 Overview of the Freight Task on the Mid North Coast
The Mid North Coast of NSW generated 1,972,000 tonnes of outbound freight and 2,518,000 tonnes
(excluding intra-regional freight - freight transported between the Local Government Areas) of inbound
freight in 2011.
The highest volumes of outbound freight were generated by:
1. Forest products
2. Dairy Products
3. Containers and General Freight
4. Food Products
5. Meat
5 Transport for NSW, 2014, Bureau of Freight Statistics: Strategic Freight Model Background Information, Version 0.1.
Mid North Coast Freight and Distribution Study
Regional Development Australia – Mid North Coast 13
The highest volumes of inbound freight were generated by:
1. Fuel and Lubricants
2. Consumer Goods
3. Food Products
4. Building Products
5. Containers and General Freight
The outbound and inbound freight task on the Mid North Coast, including key origin destination
information, is provided in sections 3.2 and 3.3 of this report. The freight task was characterised by:
A dispersed market. Both inbound and outbound freight had dispersed origins and destinations.
Outbound
The outbound freight task produced few commodities with a significant volume of direct, single
origin – destination freight.
The biggest outbound freight volume was generated by Forest Products, with Newcastle Port
the key destination.
Significant volumes of outbound freight were generated by Containers and General Freight,
with Queensland being the key destination.
Significant volumes of outbound freight were generated by Food Products, with Victoria being
the key destination.
Inbound
The biggest inbound freight task was generated by Fuel and Lubricants with Newcastle being
the key origin.
Significant volumes of inbound freight were generated by Consumer goods, with Newcastle
being the key origin.
Significant volumes of inbound freight were generated by Food Products with Queensland
being the key origin.
Significant volumes of inbound freight were generated by Containers and General Freight with
Queensland being the key origin.
Mid North Coast Freight and Distribution Study
Regional Development Australia – Mid North Coast 14
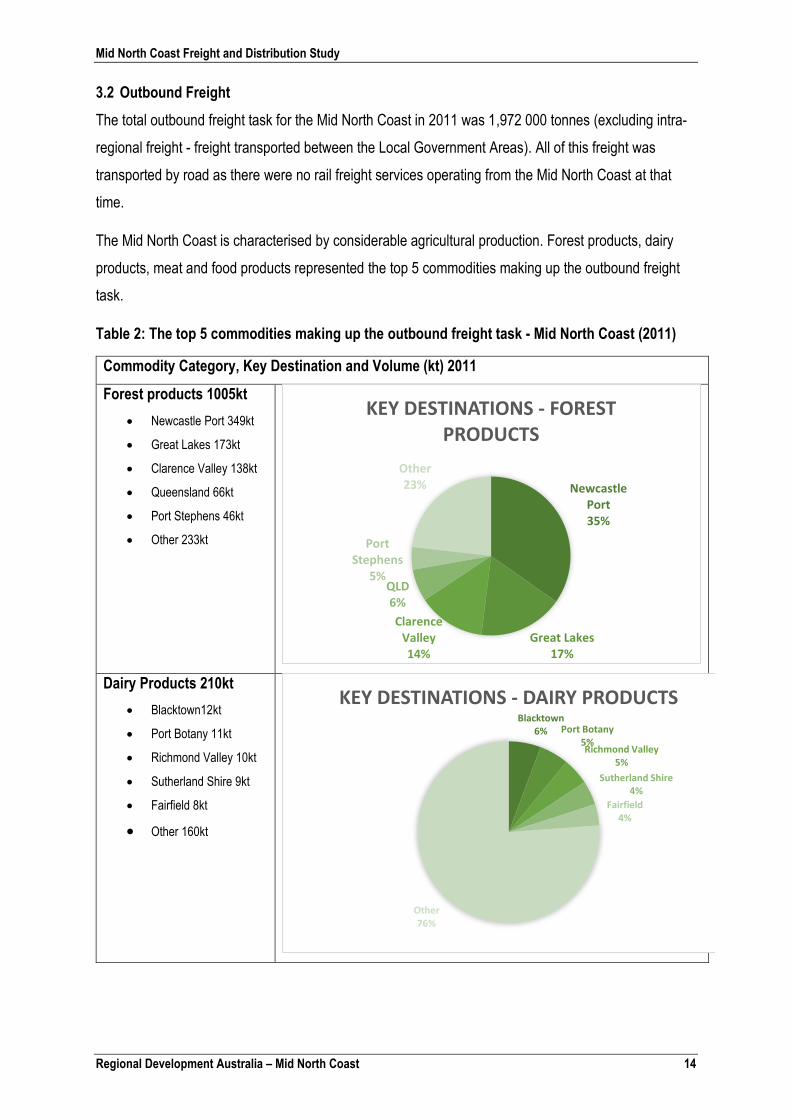
3.2 Outbound Freight
The total outbound freight task for the Mid North Coast in 2011 was 1,972 000 tonnes (excluding intra-
regional freight - freight transported between the Local Government Areas). All of this freight was
transported by road as there were no rail freight services operating from the Mid North Coast at that
time.
The Mid North Coast is characterised by considerable agricultural production. Forest products, dairy
products, meat and food products represented the top 5 commodities making up the outbound freight
task.
Table 2: The top 5 commodities making up the outbound freight task - Mid North Coast (2011)
Commodity Category, Key Destination and Volume (kt) 2011
Forest products 1005kt
Newcastle Port 349kt
Great Lakes 173kt
Clarence Valley 138kt
Queensland 66kt
Port Stephens 46kt
Other 233kt
Dairy Products 210kt
Blacktown12kt
Port Botany 11kt
Richmond Valley 10kt
Sutherland Shire 9kt
Fairfield 8kt
Other 160kt
Newcastle Port 35%
Great Lakes17%
Clarence Valley 14%
QLD6%
Port Stephens
5%
Other23%
KEY DESTINATIONS - FOREST PRODUCTS
Blacktown 6% Port Botany
5%Richmond Valley
5%
Sutherland Shire 4%
Fairfield 4%
Other76%
KEY DESTINATIONS - DAIRY PRODUCTS
Mid North Coast Freight and Distribution Study
Regional Development Australia – Mid North Coast 15
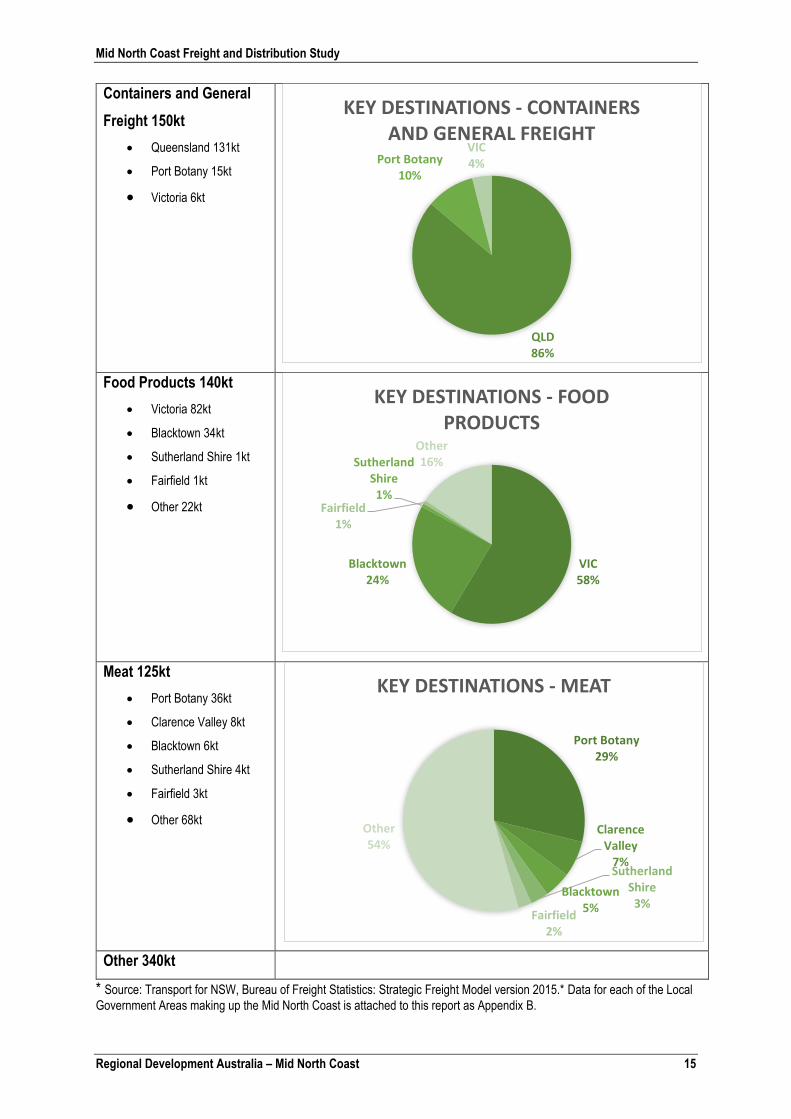
Containers and General
Freight 150kt
Queensland 131kt
Port Botany 15kt
Victoria 6kt
Food Products 140kt
Victoria 82kt
Blacktown 34kt
Sutherland Shire 1kt
Fairfield 1kt
Other 22kt
Meat 125kt
Port Botany 36kt
Clarence Valley 8kt
Blacktown 6kt
Sutherland Shire 4kt
Fairfield 3kt
Other 68kt
Other 340kt
* Source: Transport for NSW, Bureau of Freight Statistics: Strategic Freight Model version 2015.* Data for each of the Local
Government Areas making up the Mid North Coast is attached to this report as Appendix B.
QLD86%
Port Botany10%
VIC4%
KEY DESTINATIONS - CONTAINERS AND GENERAL FREIGHT
VIC58%
Blacktown 24%
Sutherland Shire 1%
Fairfield 1%
Other16%
KEY DESTINATIONS - FOOD PRODUCTS
Port Botany29%
Clarence Valley
7%
Blacktown 5%
Sutherland Shire 3%
Fairfield 2%
Other54%
KEY DESTINATIONS - MEAT

Mid North Coast Freight and Distribution Study
Regional Development Australia – Mid North Coast 16
3.3 Inbound Freight
The total inbound freight task for the Mid North Coast in 2011 was 2, 518 000 tonnes (excluding intra-
regional freight), which was 28% greater than the outbound freight task. All of this freight was
transported by road as there were no rail freight services operating into the Mid North Coast at that
time.
The inbound freight task consisted of Fuel and Lubricants, Consumer goods, Food Products, Building
Products and Containers and General Freight.
Table 3: The top 5 commodities making up the inbound freight task - Mid North Coast (2011)
Commodity Category, Key Origin and Volume (kt) 2011
Fuel and Lubricants
(605kt)
Newcastle (556kt)
Queensland (49kt)
Consumer Goods (565kt)
Newcastle (111kt)
Queensland (56kt)
Sydney (40kt)
Baulkham Hills
(23kt)
Blacktown (20kt)
Other (315kt)
Newcastle 92%
QLD8%
KEY ORIGINS - FUEL & LUBRICANTS
Newcastle 20%
QLD10%
Sydney 7%
Baulkham Hills 4%Blacktown
3%
Other56%
KEY ORIGINS - CONSUMER GOODS

Mid North Coast Freight and Distribution Study
Regional Development Australia – Mid North Coast 17
Food Products (335kt)
Queensland (314kt)
Victoria (8kt)
Bankstown (1kt)
Blacktown (1kt)
Fairfield (1kt)
Other (10kt)
Building Products (245kt)
Newcastle (28kt)
Bankstown (19kt)
Blacktown (19kt)
Fairfield (15kt)
Holroyd (12kt)
Other (152kt)
Containers & General
Freight (203kt)
Queensland (199kt)
Victoria (3kt)
Port Botany (1kt)
Source: Transport for NSW, Bureau of Freight Statistics: Strategic Freight Model version 2015.
QLD94%
VIC3%
Bankstown 0%
Blacktown 0%
Fairfield 0%
Other3%
KEY ORIGINS - FOOD PRODUCTS
Newcastle 11%
Bankstown 8%
Blacktown 8%
Fairfield 6%
Holroyd5%
Other62%
KEY ORIGINS - BUILDING PRODUCTS
QLD98%
VIC1%
Port Botany1%
KEY ORIGINS - CONTAINERS AND GENERAL FREIGHT

Mid North Coast Freight and Distribution Study
Regional Development Australia – Mid North Coast 18
3.4 Forecast Freight Growth
This section of the report details the forecast growth in the freight task by commodity to 2031.
Forecast data were modelled using the Transport for NSW Strategic Freight Model, which was sourced
from a range of data sets including the Hyder/Sd&D regional NSW freight supply chain studies
(various); The Metropolitan Freight Movement Model (FMM by Bureau of Transport Statistics) and The
interstate freight task (various BITRE datasets for the road and rail task)5.
The forecast freight volume data illustrated in Tables 3 and 4, predicts annualised growth rates
between 1.89% and 3.26%. The average annualised growth rate for all outbound freight from the Mid
North Coast was 2.44%, and 2.99% for inbound freight. Average annualised population growth for the
Mid North Coast was significantly lower at 0.75%, thus it can be assumed forecast growth of outbound
freight will need to be largely driven by inter-regional and international trade servicing demand.
3.4.1 Forecast Outbound Freight (2031)
Table 4: Forecast Outbound Freight Volumes by Commodity Category, Mid North Coast, 2031
Commodity Category 2011 Volume 2031 Volume % Increase Annualised Growth Rate %
Forest Products 1005 1435 42.79% 1.89%
Dairy Products 210 375 78.57% 3.10%
Containers and General Freight 150 275 83.33% 3.24%
Food Products 140 250 78.57% 3.10%
Meat 125 230 84.00% 3.26%
Other 340 550 61.76% 2.56%
Total 1970 3115 58.12% 2.44%
* Source: Transport for NSW, Bureau of Freight Statistics: Strategic Freight Model version 2015.
3.4.2 Forecast Inbound Freight (2031)
Table 5: Forecast Inbound Freight Volumes by Commodity Category, Mid North Coast, 2031
Commodity Category 2011 Volume 2031 Volume % Increase Annualised Growth Rate %
Fuel and Lubricants 605 1095 80.99% 3.17%
Consumer Goods 565 1015 79.65% 3.13%
Food Products 335 605 80.60% 3.16%
Building Products 245 445 81.63% 3.19%
Containers and General Freight 205 365 78.05% 3.08%
Other 565 885 56.64% 2.39%
Total 2520 4410 75.00% 2.99%
* Source: Transport for NSW, Bureau of Freight Statistics: Strategic Freight Model version 2015.

Mid North Coast Freight and Distribution Study
Regional Development Australia – Mid North Coast 19
Freight volume growth rates by Local Government Area (LGA) (Tables 5 and 6), illustrate the highest
outbound freight volume increases are forecast for Kempsey, Greater Taree and Bellingen, followed by
Coffs Harbour, Port Macquarie Hastings and Nambucca. The highest inbound freight volume increases
are forecast for Bellingen, Greater Taree and Coffs Harbour, followed by Kempsey, Port Macquarie-
Hastings and Nambucca.
Table 6: Outbound Freight Volumes by Local Government Area (LGA)
Local Government Area - Outbound Freight
2011 Volume (kt)
2031 Volume (kt)
% Increase Annualised Growth Rate
Bellingen 105 165 57.14% 2.41%
Coffs Harbour 575 820 42.61% 1.89%
Greater Taree 470 775 64.89% 2.67%
Port Macquarie-Hastings 720 1015 40.97% 1.82%
Kempsey 480 845 76.04% 3.02%
Nambucca 150 210 40.00% 1.79%
Table 7: Inbound Freight Volumes by Local Government Area (LGA)
Local Government Area - Inbound Freight
2011 Volume (kt)
2031 Volume (kt)
% Increase Annualised Growth Rate
Bellingen 105 195 85.71% 3.31%
Coffs Harbour 735 1255 70.75% 2.86%
Greater Taree 605 1035 71.07% 2.87%
Port Macquarie-Hastings 1030 1705 65.53% 2.69%
Kempsey 350 590 68.57% 2.79%
Nambucca 225 345 53.33% 2.28%
Mid North Coast Freight and Distribution Study
Regional Development Australia – Mid North Coast 20
Section 4 – Road or Rail? Commodities Contestable for a Mode Shift to Rail
Road and Rail transport each have particular attributes that render them more suitable, and generally
less costly, for the transport of particular commodities. Road offers fast service, flexibility and reliability
and is well suited to the carriage of smaller or time sensitive consignments to dispersed locations6.
Rail offers logistical advantages for bulk movements (coal, minerals, grain), but relatively slow door-to-
door transit times for other freight because of infrastructure constraints. Rail has pickup and delivery
(PUD) costs at each end, so the door-to-door costs charged to customers are less competitive,
especially on short-haul trips. Rail also has inferior service quality to road in terms of on-time reliability
and ability to serve customers’ preferred departure and arrival times7.
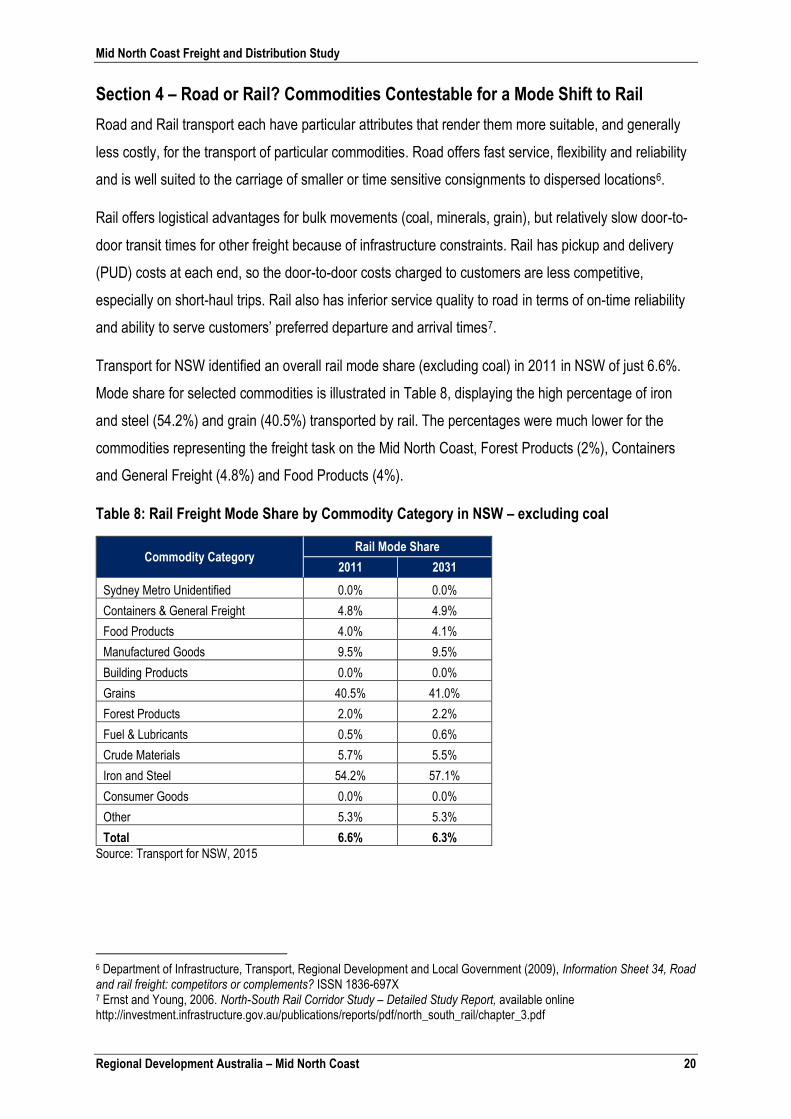
Transport for NSW identified an overall rail mode share (excluding coal) in 2011 in NSW of just 6.6%.
Mode share for selected commodities is illustrated in Table 8, displaying the high percentage of iron
and steel (54.2%) and grain (40.5%) transported by rail. The percentages were much lower for the
commodities representing the freight task on the Mid North Coast, Forest Products (2%), Containers
and General Freight (4.8%) and Food Products (4%).
Table 8: Rail Freight Mode Share by Commodity Category in NSW – excluding coal
Commodity Category Rail Mode Share
2011 2031
Sydney Metro Unidentified 0.0% 0.0%
Containers & General Freight 4.8% 4.9%
Food Products 4.0% 4.1%
Manufactured Goods 9.5% 9.5%
Building Products 0.0% 0.0%
Grains 40.5% 41.0%
Forest Products 2.0% 2.2%
Fuel & Lubricants 0.5% 0.6%
Crude Materials 5.7% 5.5%
Iron and Steel 54.2% 57.1%
Consumer Goods 0.0% 0.0%
Other 5.3% 5.3%
Total 6.6% 6.3%
Source: Transport for NSW, 2015
6 Department of Infrastructure, Transport, Regional Development and Local Government (2009), Information Sheet 34, Road and rail freight: competitors or complements? ISSN 1836-697X 7 Ernst and Young, 2006. North-South Rail Corridor Study – Detailed Study Report, available online http://investment.infrastructure.gov.au/publications/reports/pdf/north_south_rail/chapter_3.pdf
Mid North Coast Freight and Distribution Study
Regional Development Australia – Mid North Coast 21
As all inbound and outbound freight movements on the Mid North Coast are currently transported by
road, there was no current regional data to assess commodities sent by rail. In addition data describing
the NSW rail mode share (excluding coal) in Table 8 varied considerably, depending upon the
commodity. As such it was considered that an assessment of contestable rail freight must consider a
variety of mode share scenarios. The following methodology was used to assess contestable rail
freight:
Step 1 – Identified Contestable Rail Freight
Step 1 identified freight contestable for rail transport by commodity type. Any commodity currently
transported by rail in Australia was included in this assessment to ensure the broadest possible market
opportunities were considered. Fuel and Lubricants and Livestock were excluded from the assessment
because of the specialised transport infrastructure and storage facilities they require.
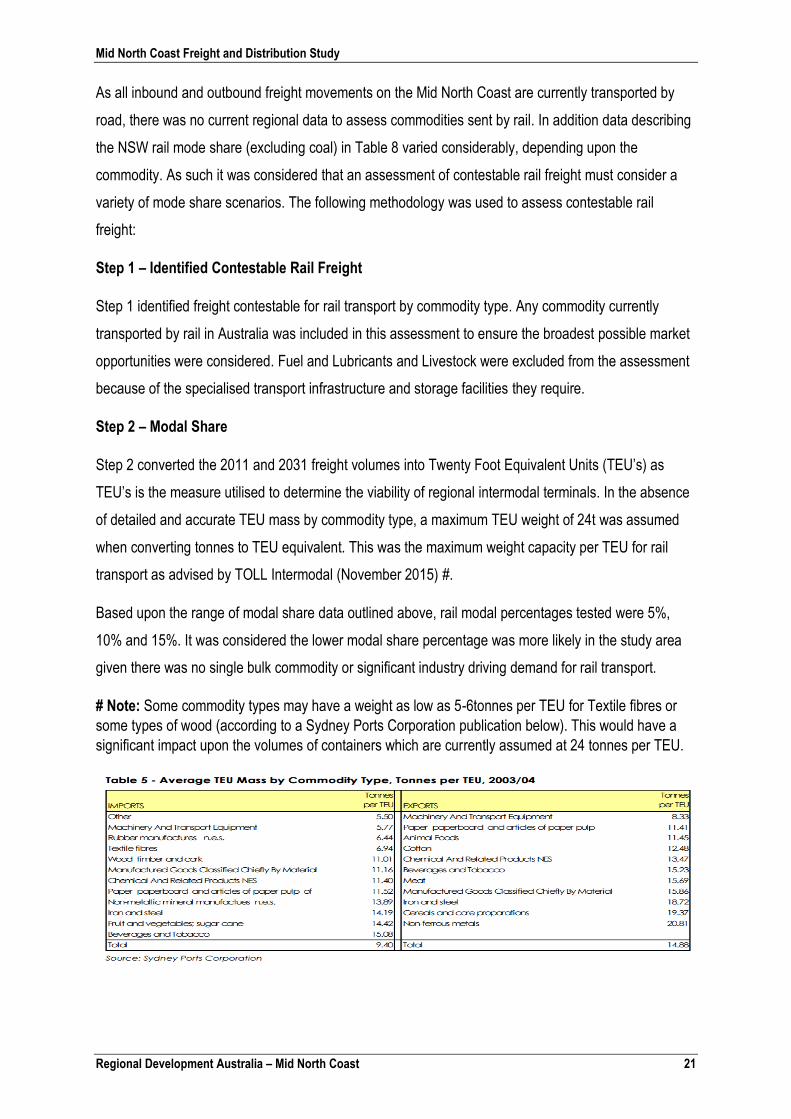
Step 2 – Modal Share
Step 2 converted the 2011 and 2031 freight volumes into Twenty Foot Equivalent Units (TEU’s) as
TEU’s is the measure utilised to determine the viability of regional intermodal terminals. In the absence
of detailed and accurate TEU mass by commodity type, a maximum TEU weight of 24t was assumed
when converting tonnes to TEU equivalent. This was the maximum weight capacity per TEU for rail
transport as advised by TOLL Intermodal (November 2015) #.
Based upon the range of modal share data outlined above, rail modal percentages tested were 5%,
10% and 15%. It was considered the lower modal share percentage was more likely in the study area
given there was no single bulk commodity or significant industry driving demand for rail transport.
# Note: Some commodity types may have a weight as low as 5-6tonnes per TEU for Textile fibres or
some types of wood (according to a Sydney Ports Corporation publication below). This would have a
significant impact upon the volumes of containers which are currently assumed at 24 tonnes per TEU.
Mid North Coast Freight and Distribution Study
Regional Development Australia – Mid North Coast 22
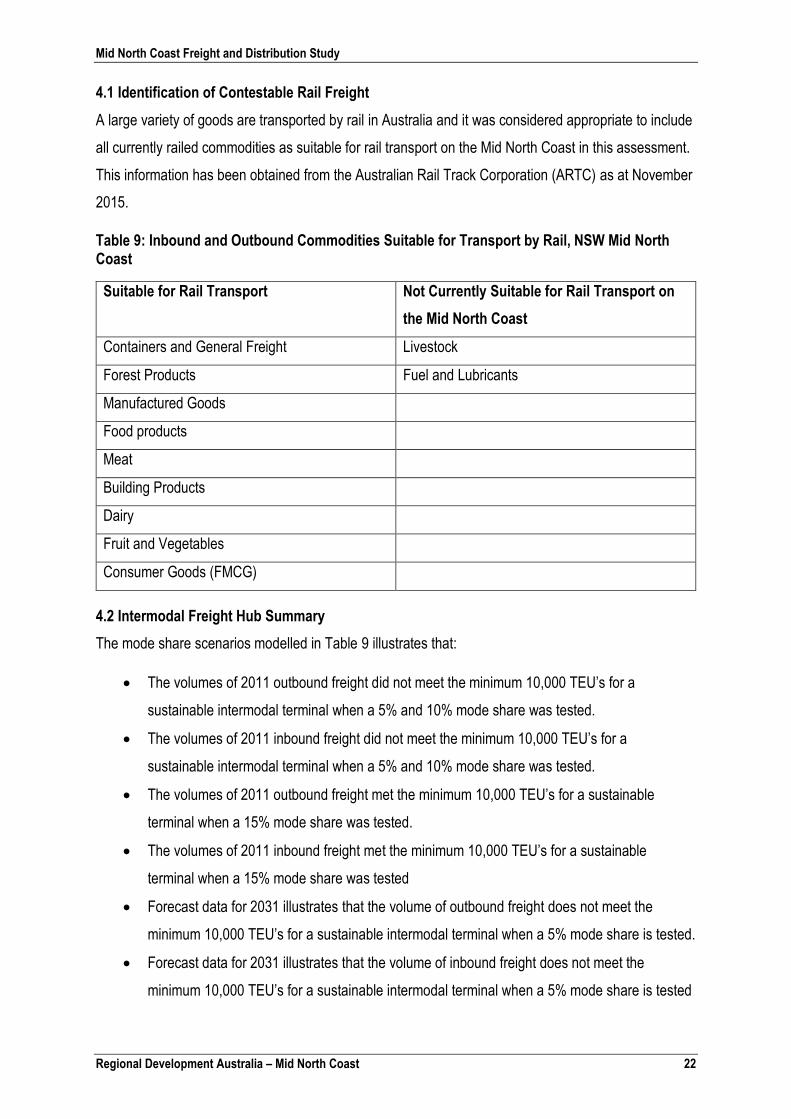
4.1 Identification of Contestable Rail Freight
A large variety of goods are transported by rail in Australia and it was considered appropriate to include
all currently railed commodities as suitable for rail transport on the Mid North Coast in this assessment.
This information has been obtained from the Australian Rail Track Corporation (ARTC) as at November
2015.
Table 9: Inbound and Outbound Commodities Suitable for Transport by Rail, NSW Mid North Coast
Suitable for Rail Transport Not Currently Suitable for Rail Transport on
the Mid North Coast
Containers and General Freight Livestock
Forest Products Fuel and Lubricants
Manufactured Goods
Food products
Meat
Building Products
Dairy
Fruit and Vegetables
Consumer Goods (FMCG)
4.2 Intermodal Freight Hub Summary
The mode share scenarios modelled in Table 9 illustrates that:
The volumes of 2011 outbound freight did not meet the minimum 10,000 TEU’s for a
sustainable intermodal terminal when a 5% and 10% mode share was tested.
The volumes of 2011 inbound freight did not meet the minimum 10,000 TEU’s for a
sustainable intermodal terminal when a 5% and 10% mode share was tested.
The volumes of 2011 outbound freight met the minimum 10,000 TEU’s for a sustainable
terminal when a 15% mode share was tested.
The volumes of 2011 inbound freight met the minimum 10,000 TEU’s for a sustainable
terminal when a 15% mode share was tested
Forecast data for 2031 illustrates that the volume of outbound freight does not meet the
minimum 10,000 TEU’s for a sustainable intermodal terminal when a 5% mode share is tested.
Forecast data for 2031 illustrates that the volume of inbound freight does not meet the
minimum 10,000 TEU’s for a sustainable intermodal terminal when a 5% mode share is tested
Mid North Coast Freight and Distribution Study
Regional Development Australia – Mid North Coast 23
Forecast data for 2031 illustrates that the volume of outbound freight meets the minimum
10,000 TEU’s for a sustainable intermodal terminal when a 10% and 15% mode share is
tested.
Forecast data for 2031 illustrates that the volume of inbound freight meets the minimum
10,000 TEU’s for a sustainable intermodal terminal when a 10% and 15% mode share is
tested.
Outbound freight volumes consist largely of forest products. Forest products represent a
crucial commodity contributing to the volumes needed for a sustainable intermodal terminal.
It should be noted that this study is assessing the freight volumes required, for the establishment of an
economically viable, intermodal rail terminal. The use of rail transport and existing rail infrastructure on
the Mid North Coast, may still be a viable option for individual businesses or commodities, for example
forest products, manufactured goods or mining products, and should be assessed on a case by case
basis.

Mid North Coast Freight and Distribution Study
Regional Development Australia – Mid North Coast 24
Table 10: Evaluating Contestability Mid North Coast
Outbound Freight: Commodity Category
Key Destination
Commodity suitable for Rail Transport?
2011 Volume (kt)
Equivalent TEU's (Max weight for rail 24t)
Mode Share 5%
Mode Share 10%
Mode Share 15%
Current Road Volume Meets Freight Hub Threshold? (10,000 TEU's)
2031 Volume (kt)
Equivalent TEU's (Max weight for rail 24t)
Mode Share 5%
Mode Share 10%
Mode Share 15%
Future Freight Volume Meets Freight Hub Threshold (10,000 TEU's)?
Forest Products Newcastle Port 349 14541.67 727.08 1454.17 2181.25 631.00 26291.67 1314.58 2629.17 3943.75
Great Lakes 173 7208.33 360.42 720.83 1081.25 212.00 8833.33 441.67 883.33 1325.00
Clarence Valley 138 5750.00 287.50 575.00 862.50 168.00 7000.00 350.00 700.00 1050.00
QLD 66 2750.00 137.50 275.00 412.50 80.00 3333.33 166.67 333.33 500.00
Port Stephens 46 1916.67 95.83 191.67 287.50 56.00 2333.33 116.67 233.33 350.00
Other 233 9708.33 485.42 970.83 1456.25 288.00 12000.00 600.00 1200.00 1800.00
Sub-total Yes 1005 41875.00 2093.75 4187.50 6281.25 1435.00 59791.67 2989.58 5979.17 8968.75
Dairy Products Blacktown 12 500.00 25.00 50.00 75.00 22.00 916.67 45.83 91.67 137.50
Port Botany 11 458.33 22.92 45.83 68.75 20.00 833.33 41.67 83.33 125.00
Richmond Valley 10 416.67 20.83 41.67 62.50 19.00 791.67 39.58 79.17 118.75
Sutherland Shire 9 375.00 18.75 37.50 56.25 16.00 666.67 33.33 66.67 100.00
Fairfield 8 333.33 16.67 33.33 50.00 14.00 583.33 29.17 58.33 87.50
Other 160 6666.67 333.33 666.67 1000.00 284.00 11833.33 591.67 1183.33 1775.00
Sub-total Yes 210 8750.00 437.50 875.00 1312.50 375.00 15625.00 781.25 1562.50 2343.75
Containers & General Freight
QLD 131 5458.33 272.92 545.83 818.75 236.00 9833.33 491.67 983.33 1475.00
Port Botany 15 625.00 31.25 62.50 93.75 28.00 1166.67 58.33 116.67 175.00
VIC 6 250.00 12.50 25.00 37.50 10.00 416.67 20.83 41.67 62.50
Sub-total Yes 152 6333.33 316.67 633.33 950.00 274.00 11416.67 570.83 1141.67 1712.50
Food Products QLD 0 0.00 0.00 0.00 0.00 0.00 0.00 0.00 0.00 0.00
VIC 82 3416.67 170.83 341.67 512.50 148.00 6166.67 308.33 616.67 925.00
Blacktown 34 1416.67 70.83 141.67 212.50 61.00 2541.67 127.08 254.17 381.25
Sutherland Shire 1 41.67 2.08 4.17 6.25 3.00 125.00 6.25 12.50 18.75
Fairfield 1 41.67 2.08 4.17 6.25 2.00 83.33 4.17 8.33 12.50
Other 22 916.67 45.83 91.67 137.50 36.00 1500.00 75.00 150.00 225.00
Sub-total Yes 140 5833.33 291.67 583.33 875.00 250.00 10416.67 520.83 1041.67 1562.50
Meat Port Botany 36 1500.00 75.00 150.00 225.00 64.00 2666.67 133.33 266.67 400.00
Clarence Valley 8 333.33 16.67 33.33 50.00 14.00 583.33 29.17 58.33 87.50
Blacktown 6 250.00 12.50 25.00 37.50 10.00 416.67 20.83 41.67 62.50
Sutherland Shire 4 166.67 8.33 16.67 25.00 7.00 291.67 14.58 29.17 43.75
Fairfield 3 125.00 6.25 12.50 18.75 6.00 250.00 12.50 25.00 37.50
Other 68 2833.33 141.67 283.33 425.00 129.00 5375.00 268.75 537.50 806.25
Sub-total Yes 125 5208.33 260.42 520.83 781.25 230.00 9583.33 479.17 958.33 1437.50
Other 340 14166.67 708.33 1416.67 2125.00 550.00 22916.67 1145.83 2291.67 3437.50
Total 1972 82166.67 4108.33 8216.67 12325.00 Yes 3114.00 129750.00 6487.50 12975.00 19462.50 Yes

Mid North Coast Freight and Distribution Study
Regional Development Australia – Mid North Coast 25
Mid North Coast
Outbound Freight: Commodity Category
Key Destination
Commodity suitable for Rail Transport?
2011 Volume (kt)
Equivalent TEU's (Max weight for rail 24t)
Mode Share 5%
Mode Share 10%
Mode Share 15%
Current Road Volume Meets Freight Hub Threshold? (10,000 TEU's)
2031 Volume (kt)
Equivalent TEU's (Max weight for rail 24t)
Mode Share 5%
Mode Share 10%
Mode Share 15%
Future Freight Volume Meets Freight Hub Threshold (10,000 TEU's)?
Fuel & Lubricants Newcastle 556 1004
QLD 49 89
Sub-total No 605 Not suitable for rail
transport
1093
Consumer Goods Newcastle 111 4625.00 231.25 462.50 693.75 201 8375.00 418.75 837.50 1256.25
QLD 56 2333.33 116.67 233.33 350.00 100 4166.67 208.33 416.67 625.00
Sydney 40 1666.67 83.33 166.67 250.00 73 3041.67 152.08 304.17 456.25
Baulkham Hills 23 958.33 47.92 95.83 143.75 41 1708.33 85.42 170.83 256.25
Blacktown 20 833.33 41.67 83.33 125.00 37 1541.67 77.08 154.17 231.25
Other 315 13125.00 656.25 1312.50 1968.75 563 23458.33 1172.92 2345.83 3518.75
Sub-total Yes 565 23541.67 1177.08 2354.17 3531.25 1015 42291.67 2114.58 4229.17 6343.75
Food Products QLD 314 13083.33 654.17 1308.33 1962.50 566 23583.33 1179.17 2358.33 3537.50
VIC 8 333.33 16.67 33.33 50.00 14 583.33 29.17 58.33 87.50
Bankstown 1 41.67 2.08 4.17 6.25 2 83.33 4.17 8.33 12.50
Blacktown 1 41.67 2.08 4.17 6.25 2 83.33 4.17 8.33 12.50
Fairfield 1 41.67 2.08 4.17 6.25 2 83.33 4.17 8.33 12.50
Other 10 416.67 20.83 41.67 62.50 19 791.67 39.58 79.17 118.75
Sub-total Yes 335 13958.33 697.92 1395.83 2093.75 605 25208.33 1260.42 2520.83 3781.25
Building Products Newcastle 28 1166.67 58.33 116.67 175.00 50 2083.33 104.17 208.33 312.50
Bankstown 19 791.67 39.58 79.17 118.75 35 1458.33 72.92 145.83 218.75
Blacktown 19 791.67 39.58 79.17 118.75 34 1416.67 70.83 141.67 212.50
Fairfield 15 625.00 31.25 62.50 93.75 27 1125.00 56.25 112.50 168.75
Holroyd 12 500.00 25.00 50.00 75.00 22 916.67 45.83 91.67 137.50
Other 152 6333.33 316.67 633.33 950.00 277 11541.67 577.08 1154.17 1731.25
Sub-total Yes 245 10208.33 510.42 1020.83 1531.25 445 18541.67 927.08 1854.17 2781.25
Containers & General Freight QLD 199 8291.67 414.58 829.17 1243.75
359
14958.33 747.92 1495.83 2243.75
VIC 3 125.00 6.25 12.50 18.75 6 250.00 12.50 25.00 37.50
Port Botany 1 41.67 2.08 4.17 6.25 2 83.33 4.17 8.33 12.50
Sub-total Yes 203 8458.33 422.92 845.83 1268.75 367 15291.67 764.58 1529.17 2293.75
Other 565 23541.67 1177.08 2354.17 3531.25 885 36875.00 1843.75 3687.50 5531.25
Total 1913 79708.33 3985.42 7970.83 11956.25 Yes 3317 138208.33 6910.42 13820.83 20731.25 Yes

Mid North Coast Freight and Distribution Study
Regional Development Australia – Mid North Coast 26
Section 5 - The Road Network
This section of the report describes the existing road network, proposed road transport network and
assesses the viability of a road freight hub in the study area.
5.1 The Existing Road Network
The Mid North Coast has strong connectivity to the National Highway Network, with a total of 285km of
highway passing through the region. The Pacific Highway provides the primary road connection
between Sydney and Brisbane and is currently being upgraded to a four lane divided road, with
completion scheduled by 2020. The upgraded road will improve conditions for road transport in the
future by providing safer travel: reduced travel times and more consistent and reliable travel.
Table 11: Distance to Major Centres
Regional Centres To Sydney (km) To Brisbane (km)
Taree 308 618
Port Macquarie 383 551
Kempsey 419 503
Nambucca Heads 486 439
Bellingen 522 427
Coffs Harbour 534 392
Figure 5: National Rail and Highway Network

Mid North Coast Freight and Distribution Study
Regional Development Australia – Mid North Coast 27
The outbound and inbound freight task in the study area is met entirely by road transport. The road
transport industry in Australia consists of large multi-national transport companies to smaller family
owned businesses. Freight companies operating on the Mid North Coast currently provide their own
depot, warehousing and storage facilities and it is likely that this situation will continue due to the
uncertainty and reduced control associated with externally owned, multi-user facilities.
5.2 Proposed Freight Transport Infrastructure
Industry and Councils are very supportive of Transport Hubs as a means to encourage economic
development in their region. Each of the Councils on the Mid North Coast were consulted and asked to
identify current proposals in their region.
The proposals nominated by Councils are best described as road freight hubs, as they are essentially
Industrial land developments, with good connectivity to the Pacific Highway. These proposals are
summarised in Table 11.
Table 12: Proposed Transport Infrastructure on the Mid North Coast
Council Name Intermodal Name and Description
Nambucca Valley
Council
Valla Enterprise Zone Growth Area:
50ha site
Located immediately adjacent to the Pacific Hwy upgrade;
Incorporate a double interchange and highway service
centre
Port Macquarie
Hastings Council
Sancrox Employment Lands:
85.4ha – current proposal 70 lots from 3500m2 to 10 hectares.
Located immediately adjacent to the Pacific Hwy
Sancrox overpass due for completion in late 2016 will allow
easy access to the precinct for heavy vehicles.
Greater Taree City
Council
The Northern Taree Entry Freight Interchange.
60 ha site
Located immediately adjacent to the Pacific Hwy with
access via the Cundletown overpass.
Adjacent to the Taree Airport
4 hours drive from Sydney
REMPLAN economic modelling indicates some 200 FTE
positions may be created from the proposal
Estimated cost $3.05 million ($1.8m two lane roundabout
and $1.25m

Mid North Coast Freight and Distribution Study
Regional Development Australia – Mid North Coast 28
In addition to the abovementioned proposals, existing industrial land (or land identified for rezoning)
with good highway connectivity is identified in the following locations:
Coffs Harbour Lot 2 Stadium Drive – 3.4 ha, south eastern roundabout
corner of the Pacific Highway and Stadium Drive
North Boambee Valley – 37 hectares of proposed industrial
land adjacent to the proposed Pacific Highway bypass of
Coffs. The Bypass is scheduled for commencement in
2018/19 and the proposal is in the concept – strategic
planning phase.
Bellingen 2.3ha approved employment lands in Urunga on the eastern
side of the railway line. This land is not currently for sale.
Kempsey South Kempsey Industrial Park – Industrial land adjacent to
the South Kempsey Service Centre. Excellent Highway
access.
5.3 Viability of a Regional Freight Transport Hub
This section provides a discussion of potential road freight hubs on the Mid North Coast based on the
sustainability criteria outlined in Section 2.
5.3.1 Labour: Does the site have proximity to a large pool of labour?
The larger centres of Coffs Harbour, Port Macquarie, Taree and Kempsey have the highest populations
and thus the largest labour pools. Coffs Harbour and Port Macquarie-Hastings have the highest
predicted population growth rates, with a predicted increase by 2031 of 24% for Coffs Harbour and 20%
for Port Macquarie-Hastings.
Table 13: Mid North Coast Population Forecast
Local Government Area Population Count
Population Change
(%)
Annualised Growth Rate
2011 2031
Coffs Harbour 70,950 88,100 24.17% 1.15%
Bellingen 12,900 12,800 -0.78% -0.04%
Nambucca 19,250 20,650 7.27% 0.37%
Kempsey 29,150 30,500 4.63% 0.24%
Port Macquarie Hastings 75,250 90,800 20.66% 0.99%
Greater Taree 48,100 51,900 7.90% 0.40%
Total 255,600 294,750 15.32% 0.75%
Source: The NSW Department of Planning, Population Projections, accessed December 2015
http://www.planning.nsw.gov.au/projections
Mid North Coast Freight and Distribution Study
Regional Development Australia – Mid North Coast 29
Accessibility
Does the location have access to a major transport route? (Highway, Rail, Port)
Each of the sites identified in section 5.2 have access to the Pacific Highway, the national highway
linking Sydney and Brisbane.
Does the region itself have an important production and consumption market?
The study area has important production and consumption markets. The highest volumes of outbound
freight on the Mid North Coast are generated by forest products, dairy products, meat, containers and
general freight and food products. The highest volumes of inbound freight are generated by fuel and
lubricants, consumer goods, food products, building products and containers and general freight.
The study area is characterised by dispersed origin and destination freight, with few commodities of
sufficient volume or direct origin-destination locations. Road offers the most suitable freight transport
service as it is flexible and better suited to the carriage of smaller or time sensitive consignments to
dispersed locations.
Can the location be open 24/7, enabling flexibility of supply chain management?
Proposed freight developments and industrial lands identified in section 5.2 are either currently zoned
for industrial use or are identified in strategic planning documents for rezoning. This land is considered
suitable to accommodate road freight development due to its connectivity to the Pacific Highway.
Land
Is suitably zoned land available in the region? Is land available to rezone?
The proposed freight developments, existing industrial land and proposed industrial land identified in
section 5.2 are suitable to accommodate road freight development. Additional sites with good
connectivity to the Pacific Highway may be identified in the future.
Is the land of sufficient size to accommodate a freight hub? (Min 2ha for smaller
operators, up to 12-20ha for national companies)
The proposals identified in section 5.2 consist of a 50ha, 60ha and 85.4ha parcel. The final subdivision
design is not yet complete for the proposals in Taree and Valla, thus the development can
accommodate a range of lot sizes. The proposal in Port Macquarie-Hastings offers a range of lot sizes
from 3500m2 to 10 ha, with flexibility to consolidate or subdivide lots to meet the needs of small,
medium and large enterprises.

Mid North Coast Freight and Distribution Study
Regional Development Australia – Mid North Coast 30
Is the land competitively priced?
The price of private developments identified in section 5.2 is subject to negotiation with the developer.
Infrastructure
Services to the land identified in section 5.2 are at differing stages of provision, however all services
would be available upon occupation of the land.
The proposals identified in section 5.2 have dedicated highway access and it is considered that any
future proposals would require similar infrastructure to facilitate heavy vehicle access.
Anchor Tenants
The proposals identified in section 5.2 have existing adjacent tenants and / or interest from a number of
tenants including manufacturing, transport and industrial businesses. Anchor tenants may assist in
attracting future tenants and thus create demand for road freight services.
Existing businesses are present adjacent to the Port Macquarie-Hastings LGA proposal
(manufacturing); and the Kempsey LGA development (Highway Service Centre); which may assist in
attracting future tenants.
Regulation
It is considered the proposals identified in section 5.2 are either suitably zoned or identified for future
rezoning and thus will not have restrictive regulations.
Growth
Forecast freight growth rates provided by Transport for NSW Strategic Freight Model in section 3.4 of
this report illustrates sufficient growth to support the expansion of the transport and logistics industry in
the study area.
The highest growth rates of annualised outbound freight are forecast for Kempsey, Greater Taree,
Bellingen, Coffs Harbour, Port Macquarie-Hastings then Nambucca. The highest growth rates of
annualised inbound freight are forecast for Bellingen, Greater Taree, Coffs Harbour, Kempsey, Port
Macquarie-Hastings then Nambucca.

Mid North Coast Freight and Distribution Study
Regional Development Australia – Mid North Coast 31
Road Freight Hub Summary
Three industrial land developments are proposed on the Pacific Highway in Nambucca, Port
Macquarie and Taree. These locations are identified as suitable for development as road
freight hubs.
The South Kempsey Industrial Park is identified as suitable for development as a road freight
hub.
Proposed industrial land in the North Boambee Valley, adjacent to the Pacific Highway bypass
of Coffs Harbour (2018/19 commencement) is identified as suitable for development as a road
freight hub.
Lots in the abovementioned developments are of sufficient size at all locations to accommodate
road transport firms.
Services are currently at differing stages of provision, however all services would be available
upon occupation of the land.
Existing businesses are present adjacent to the Port Macquarie-Hastings LGA proposal
(manufacturing); and the Kempsey LGA development (Highway Service Centre); which may
assist in attracting future tenants.
Expressions of interest have been received for the proposal in the Taree LGA and the
Nambucca LGA. Anchor tenants may assist in attracting future tenants and thus create
demand for road freight services.
No prohibitive regulations are identified.
Transport for NSW identify strong growth in the volume of both inbound and outbound road
freight to 2031 on the Mid North Coast.

Mid North Coast Freight and Distribution Study
Regional Development Australia – Mid North Coast 32
Section 6: The Rail Network
This section of the report describes the existing rail network, proposed rail transport infrastructure and
assesses the viability of a regional intermodal terminal in the study area.
6.1 The Existing Rail Network
The main north-south rail line from Sydney to Brisbane traverses the study area. This line is used for
passenger trains and freight trains, however, freight trains do not currently stop on the Mid North Coast.
Passenger stops are located in Wingham, Taree, Kendall, Wauchope, Kempsey, Eungai, Macksville,
Nambucca Heads, Urunga, Sawtell and Coffs Harbour.
Two major direct origin – destination freight services operate on the North Coast rail line - Pacific
National and Aurizon (formerly Qld Rail) - representing 90% of the freight task. Smaller regional rail
freight operators represent the remaining 10%.
The rail freight task through the region is dominated by the movement of container freight from the Port
of Melbourne to Brisbane and from Sydney’s Port Botany to Brisbane. Return freight predominantly
consists of agricultural produce from Queensland returning to Sydney and Melbourne.
There are currently no operational intermodal terminals on the Mid North Coast, however there are a
number of existing sidings and associated infrastructure in the region.
Table 14: Existing Rail Infrastructure, NSW Mid North Coast
Location Description of Infrastructure Ownership
Taree Railcorp Station
2 sidings
1 private spur?
Mixed
Kendall Stock and Goods Loop Private
Wauchope Railcorp Station
Goods neck
Private
Telegraph Point Small siding, difficult to access Public
Kundabung Goods loop
Kempsey Railcorp station
Pacific National siding
Shell siding
Stock
Mixed
Eungai Small siding (close to residential properties) Public
Nambucca Heads Small siding, difficult to access Public
Raleigh Siding Public
Boambee Beach Siding Engineering Goods Private
Mid North Coast Freight and Distribution Study
Regional Development Australia – Mid North Coast 33
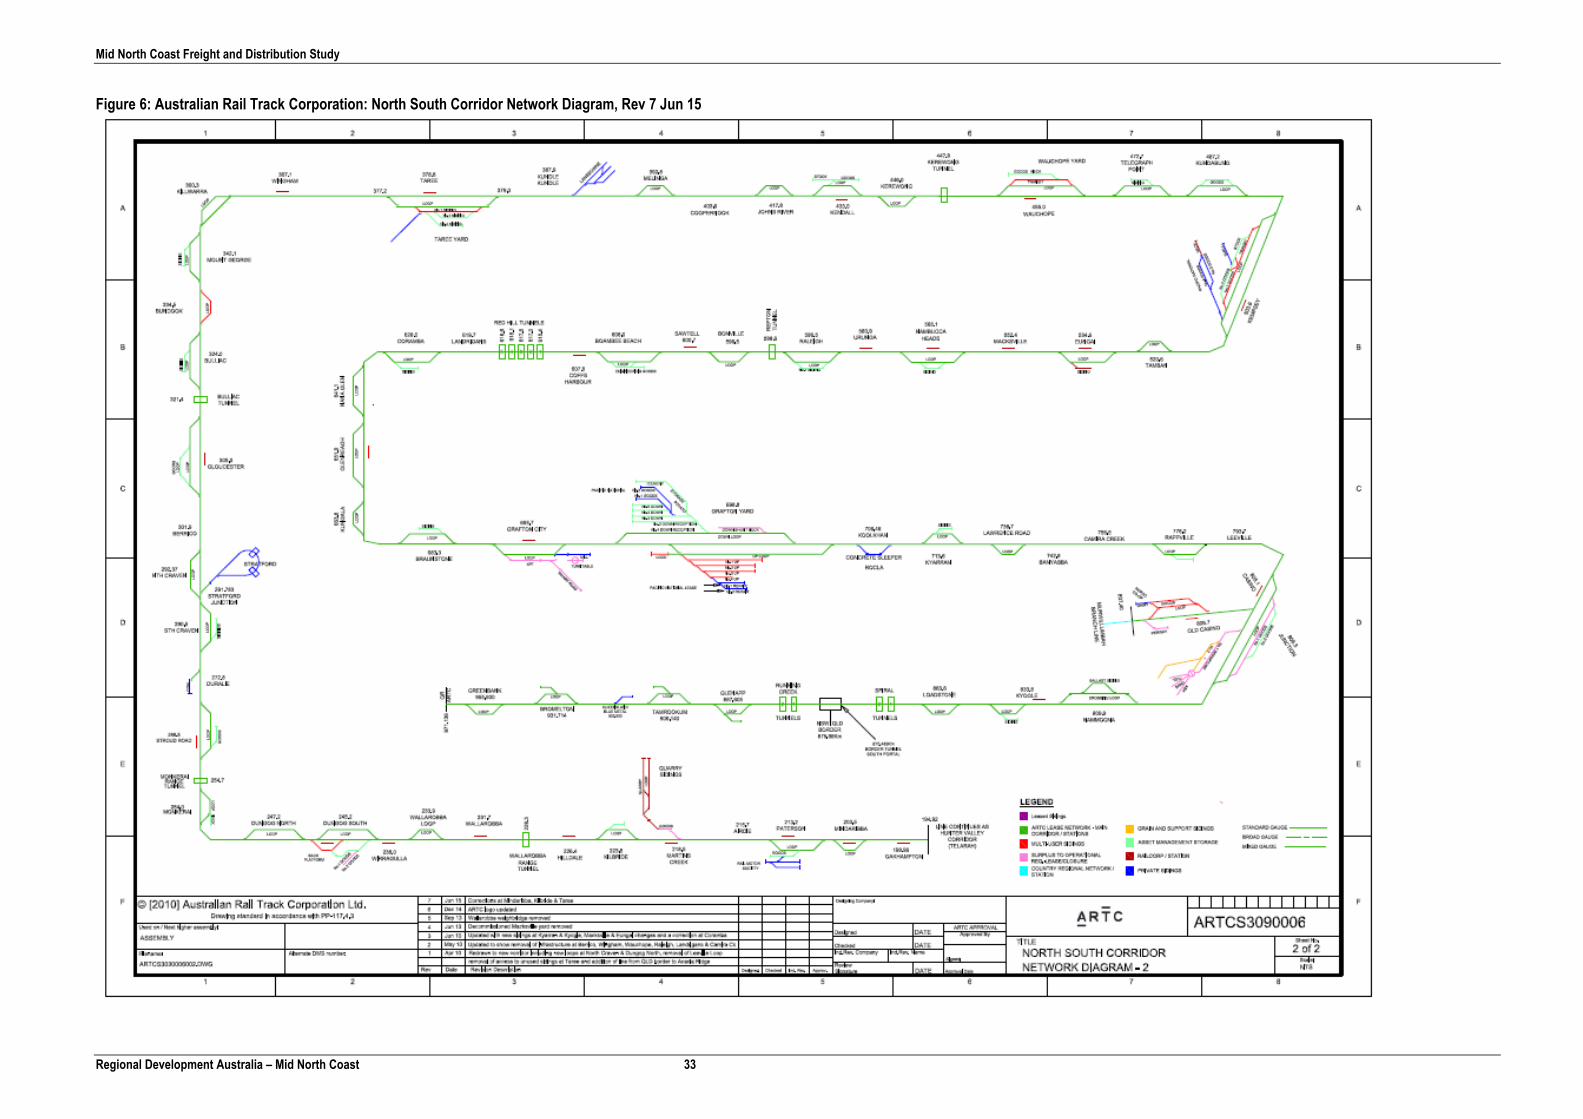
Figure 6: Australian Rail Track Corporation: North South Corridor Network Diagram, Rev 7 Jun 15

Mid North Coast Freight and Distribution Study
Regional Development Australia – Mid North Coast 34
Surrounding Intermodal Terminals
In NSW there are six metropolitan intermodal terminals and 22 regional intermodal terminals. There are
7 Regional Intermodal Terminals in the regions adjoining the Mid North Coast being:
Table 15: Intermodal Terminals in Northern NSW
LGA Name Intermodal Name Status Newcastle Kooragang Is: Mountain
Industries
Sandgate: Crawfords
Kooragang Island:
Walsh Point
Carrington: Toll
Operational
Operational
Non-Operational
Operational
Richmond Valley Casino: Casino Rail
Freight Terminal
Casino: Pacific
Intermodal and Logistics
Industrial Park
Under Construction
Proposed
Tamworth Regional Tamworth (West Tamworth):
Former Hills Transport / Pacific
National site
Non-Operational
Mid North Coast Freight and Distribution Study
Regional Development Australia – Mid North Coast 35
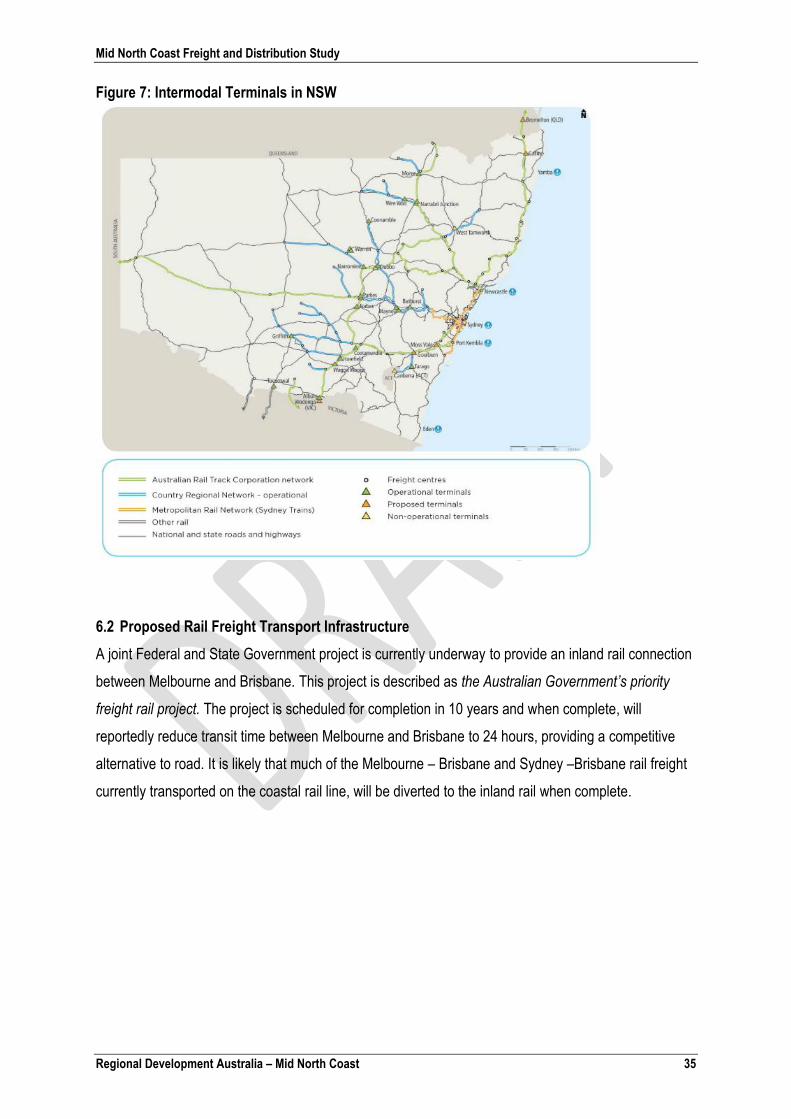
Figure 7: Intermodal Terminals in NSW
6.2 Proposed Rail Freight Transport Infrastructure
A joint Federal and State Government project is currently underway to provide an inland rail connection
between Melbourne and Brisbane. This project is described as the Australian Government’s priority
freight rail project. The project is scheduled for completion in 10 years and when complete, will
reportedly reduce transit time between Melbourne and Brisbane to 24 hours, providing a competitive
alternative to road. It is likely that much of the Melbourne – Brisbane and Sydney –Brisbane rail freight
currently transported on the coastal rail line, will be diverted to the inland rail when complete.

Mid North Coast Freight and Distribution Study
Regional Development Australia – Mid North Coast 36
Figure 8: Melbourne - Brisbane Inland Rail Alignment

Mid North Coast Freight and Distribution Study
Regional Development Australia – Mid North Coast 37
6.3 The viability of a regional intermodal Terminal in the study area
This section provides a discussion of potential rail transport hubs on the Mid North Coast based on the
sustainability criteria outlined in Section 2.
Intermodal Terminal Viability Checklist
1. Volume
Is the aggregated volume in the catchment area sufficient to meet the minimum of
10,000 TEU’s per annum? (15,000 to 20,000 TEU’s per year is likely to make a
significant profit)
Is the market expected to grow significantly?
A summary of the mode share analysis is provided as Table 16. The data illustrates that the volume of
both inbound and outbound freight for the Mid North Coast meets the minimum 10,000 TEU volume
under a 15% mode share in 2011 and the 10% and 15% mode share in 2031.
Table 16: Evaluating Contestability - Summary
Outbound Freight (TEU’s) Inbound Freight (TEU’s)
2011 2031 2011 2031
5% Mode Share 4,108 6,487 3,985 6,910
10% Mode Share 8,216 12,975 7,970 13,820
15% Mode Share 12,325 19,462 11,956 20,731
Limitations with the data:
1. Approximately half of the outbound freight volume is made up of forest products. The forest
product industry is reported to be highly variable as production can stop, start or shift focus
quickly8. Consultation with Boral Timber identified that the forest products destined for
Newcastle Port identified in this data (2908-4362 TEU) are no longer sent to this market.
2. The current mode share in NSW (less coal) is just 6.6%, thus it is considered a 5% mode share
is more likely than a 10% or 15% mode share – based on data for the Mid North Coast as a
whole.
8 Transport for NSW, 2015. Containerised Cargo Assessment, Northern NSW.

Mid North Coast Freight and Distribution Study
Regional Development Australia – Mid North Coast 38
2. Distance
Is the location sufficiently distant (ie. 250-300 kilometres) from port? This distance
is required for a rail-based service to compete successfully with a direct road
service.
Are the customers physically dispersed so that moving goods via the terminal is an
attractive option?
The distance between the northern and southern boundary of the study area is approximately 280kms.
Intermodal terminals have a catchment radius of approximately 100kms, suggesting 2 terminals could
be possible based solely on catchment distances.
Destination markets need to be at least 250-300kms for rail to compete successfully with road. The
most significant origins and destinations are Newcastle, Sydney and Brisbane. The distance to
Newcastle ranges from 165kms - 416kms from the study area, Sydney 310kms – 560kms and Brisbane
368kms– 647kms.
Depending upon the location of a terminal it is unlikely that a sufficient distance could be achieved to
attract a change of mode. Although distances will be greater than 250km-300kms, it is unlikely
commodities would be trucked to an intermodal terminal, with commodities transferred to rail, when a
truck could complete the full journey in a maximum of 7 ½ hours (based on the maximum distance
Forster to Brisbane – 647kms).
3. Initial Investment and terminal capacity
Does the terminal site have access to the rail network?
Can existing infrastructure be leveraged? (e.g.does the site incorporate former
shunting yards, freight depots, rail sidings, etc?)
Is the quality of the connecting rail network (track condition) adequate to carry the
volumes expected?
Appendix D of the NSW Freight and Port strategy identifies that in regional areas, terminals have
generally evolved around pre-existing infrastructure, often based around a company’s distribution
chain, with few green field sites being developed.
Existing rail infrastructure in the Kempsey LGA provides the most comprehensive infrastructure for
utilisation, should an intermodal terminal be pursued.
Mid North Coast Freight and Distribution Study
Regional Development Australia – Mid North Coast 39
4. Seasonality
If volumes are seasonal, will the terminal generate sufficient revenue to cover
capital and operating costs during periods when volume throughput is low?
Does the terminal have sufficient capacity to accommodate volume throughput at
seasonal peaks?
Can the intermodal service accommodate time or temperature-sensitive freight?
The outbound freight task on the Mid North comprises 50% Forest products (2011 data). Transport for
NSW (2015) advises that Forest Products can be considered highly variable as production can stop,
start or shift in focus quickly. Given the uncertainty of production, shippers are often reluctant to fund
long term investments in their supply chain. Instead when they are active, their output can be
considered a windfall for existing operators8.
The variable nature of such a large portion of the Mid North Coast outbound freight task, represents a
significant risk to the development of an intermodal freight terminal on the Mid North Coast. It is
considered this represents a major limiting factor to the establishment of an intermodal terminal in the
study area.
5. Competing Channels
Is the terminal part of an integrated supply chain that can offer a unique service to
the customers in the catchment area?
Will the terminal be the only intermodal terminal in the catchment area?
Can the terminal / supply chain compete effectively with alternative supply chains
vying for business in the same market?
The most significant competition for the rail freight market on the Mid North Coast is the flexibility,
speed and cost competitiveness of the road freight market. The commodity types making up the freight
task are better suited to flexible road transport. In addition the origin – destination distances are
considered insufficient to attract a shift to rail.
6. Economic and social impact
Do the local and regional community objectives align with the development
objectives for the terminal?
Councils on the Mid North Coast are very supportive of transport infrastructure investment as a means
of attracting industry and increasing employment in the region. Improved freight transport infrastructure
aligns with this objective.

Mid North Coast Freight and Distribution Study
Regional Development Australia – Mid North Coast 40
Increasing the use of rail for freight transport is a well-supported concept, however, the volumes of
outbound and inbound freight on the Mid North Coast are unlikely to support an intermodal freight
terminal based upon the tested commodities and modal share percentages.
This study has assessed the viability of an intermodal rail terminal, however the use of rail transport
and existing rail infrastructure on the Mid North Coast, may still be a viable option for individual
businesses or commodities, for example forest products, manufactured goods or mining products, and
should be assessed on a case by case basis.
Investment in road freight infrastructure is considered more closely aligned to local and regional
community objectives as road freight is currently the dominant and most suitable transport mode for the
Mid North Coast freight task. Investment in road freight infrastructure could see improved efficiencies
for the industry and is more likely to attract private investment.

Mid North Coast Freight and Distribution Study
Regional Development Australia – Mid North Coast 41
Section 7 - How a Freight Transport Hub Aligns with Government Strategies
This section of the report describes how investment in freight infrastructure aligns with all levels of Government strategy.
Policy Key Objectives of the Policy How does Investment in freight infrastructure align with this policy?
RDA Regional Plan 2013-2016: regional priorities of
improved infrastructure and competitive rural
industries (p. 59)
Objectives 2010-2030
Connecting our people, coast and valleys
Connecting our region to our neighbours and our country
Connecting our products, services and capacity to our
neighbours, our country and the world
Investment in freight infrastructure aligns with:
First Order Priority: Address the backlog of infrastructure
investment and plan and develop new infrastructure.
Second Order Priority: Maintain and grow competitive rural
industry sector.
(Commonwealth) National Stronger Region’s Funding
Guidelines: priority infrastructure with economic
benefits in disadvantaged regions
The objective of the NSRF is to fund investment ready projects
which support economic growth and sustainability of regions
across Australia, particularly disadvantaged regions, by
supporting investment in priority infrastructure.
Freight Infrastructure supports the expansion of the transport
and logistics sector which in turn services a range of industries
present on the Mid North Coast including manufacturing and
agriculture.
Trade and Investment’s NSW Economic Development
Framework (2014): improve transport corridors from
paddock to plate and port, page 6;
Objective 4: Invest in critical Infrastructure
Point 4: Fund regional infrastructure, including under the
Resources for Regions program and improve transport
corridors from paddock to plate.
Investment in freight infrastructure provides a direct
improvement in the transport and logistics choices of food
producers on the Mid North Coast.
Department of Planning’s MNC Regional Strategy to
2031: Regional transport, page 41;
The Pacific Highway will be the primary inter-region road
corridor. It will also have an important role as an intra-region
link in particular providing access to the major regional centres
of each subregion from the other settlements in those
The development of road freight hubs with good connectivity to
the Pacific Highway contributes to the improvement of intra-
regional links and the efficiency of freight transport.

Mid North Coast Freight and Distribution Study
Regional Development Australia – Mid North Coast 42
subregions. The efficiency and safety of the Pacific Highway
corridor will be enhanced and protected.
The North Coast rail line within the Region will continue to be
enhanced, increasing potential for growth in freight and
passenger transport.
Existing infrastructure on the North Coast rail line may support
the growth in rail freight into the future.
NSW Long Term Transport masterplan: Transport and
freight, page 34;
Provides an overall framework to guide NSW Government
transport funding priorities over 20 years. In particular point 9.
9. Improving freight efficiency and productivity: through major
investments and efficiencies in the road and rail freight
networks and at ports, airports and intermodal terminals, and
through the Bridges for the Bush program to improve regional
connectivity.
Investment in road freight infrastructure is crucial for the Mid
North Coast as road freight transport is the primary means of
freight distribution for the region.
The development of road freight hubs with good connectivity to
the Pacific Highway contributes to improved efficiency for
transport operators and thus contributes to the overall NSW
freight task.
MNC Regional Action Plan (NSW 2021): Improve the
movement of freight, page 8;
The Mid North Coast Regional Action plan aligns with long
term transport, land use and service planning across the
region.
Of particular relevance is the action on page 8: Improve the
movement of freight. Where infrastructure investment will be
identified - particularly opportunities for improved performance
and efficiency. In addition future development will be better
placed to attract private sector investment.
Investment in road freight hubs along the Pacific Highway
provides an opportunity for improved freight movement
efficiencies, through the reduction of first and last mile
transport costs.
In addition road freight hubs on industrial land, provide an
attractive opportunity for private sector investment.
State Infrastructure Strategy 2012 to 2032: Access to
markets, particularly mining and agriculture products,
page 65
Improve access to employment and to connect people
and communities;
Investment in freight transport infrastructure on the Mid North
Coast will improve efficient access to domestic and

Mid North Coast Freight and Distribution Study
Regional Development Australia – Mid North Coast 43
Improve local transport networks;
Efficient access to markets, particularly mining and
agriculture products to domestic and international
markets.
international markets for the agricultural commodities produced
in the region.
Increased market access leads to greater employment
opportunities for the agricultural and transport and logistics
sectors.

Mid North Coast Freight and Distribution Study
Regional Development Australia – Mid North Coast 44
Conclusion
This report identifies that the freight task on the Mid North Coast consists of multiple commodities,
destined for dispersed locations, with relatively short distances to destination. A scenario better suited
to road transport rather than rail transport.
Development of an intermodal rail terminal in the region is unlikely to be viable and unlikely to attract
private investment due to low freight volumes, seasonal commodities and insufficient distance to
destination for a competitive advantage over road transport.
Road freight is currently the dominant and most suitable transport mode for the Mid North Coast freight
task. Investment in road freight infrastructure could see improved efficiencies for the industry and is
more likely to attract private investment.
Five suitable locations for the development of road freight hubs are identified in this study in Greater
Taree, Port Macquarie-Hastings, Kempsey, Nambucca and Coffs Harbour Local Government Areas.
Additional suitable sites with good connectivity to the Pacific Highway may be identified in the future.

Mid North Coast Freight and Distribution Study
Regional Development Australia – Mid North Coast 45
Appendix A - RMS Pacific Highway Rest Stop Strategy

Mid North Coast Freight and Distribution Study
Regional Development Australia – Mid North Coast 46
Appendix B – Freight Data by LGA

Mid North Coast Freight and Distribution Study
Regional Development Australia – Mid North Coast 47
Appendix C - Stakeholder Consultation
Responses received - Mid North Coast Freight and Distribution Study Consultation
Council
Greater Taree City Council
Port Macquarie-Hastings Council
Kempsey Shire Council
Nambucca Shire Council
Bellingen Shire Council
Coffs Harbour City Council
Roads and Maritime Service (RMS)
Australian Rail Track Corporation (ARTC)
Transport for NSW
Forests NSW
Nestle
Advanced Metal Industries
Pearsons Transport
Expressways Spares
Boral