Mid-IR AGPMs for ELT applications - arXiv · Mid-IR AGPMs for ELT applications Brunella...
8
Mid-IR AGPMs for ELT applications Brunella Carlomagno a , Christian Delacroix a , Olivier Absil a , Pontus Forsberg b , Serge Habraken a , Aïssa Jolivet a , Mikael Karlsson b , Dimitri Mawet c , Pierre Piron a , Jean Surdej a and Ernesto Vargas Catalan b a Department of Astrophysics, Geophysics and Oceanography, University of Liège, 17 allée du Six Août, B-4000 Sart Tilman, Belgium; b Ångström Laboratory, Uppsala University, Lägerhyddsvägen 1, SE-751 21 Uppsala, Sweden; c European Southern Observatory, Alonso de Córdova 3107, Vitacura 7630355, Santiago, Chile ABSTRACT The mid-infrared region is well suited for exoplanet detection thanks to the reduced contrast between the planet and its host star with respect to the visible and near-infrared wavelength regimes. This contrast may be further improved with Vector Vortex Coronagraphs (VVCs), which allow us to cancel the starlight. One flavour of the VVC is the AGPM (Annular Groove Phase Mask), which adds the interesting properties of subwavelength gratings (achromaticity, robustness) to the already known properties of the VVC. In this paper, we present the optimized designs, as well as the expected performances of mid-IR AGPMs etched onto synthetic diamond substrates, which are considered for the E-ELT/METIS instrument. Keywords: Exoplanets detection, Mid-IR, Vector Vortex Coronagraphs, E-ELT/METIS instrument 1. INTRODUCTION Direct detection of exoplanets presents two important challenges: the presence of the extremely brighter host star and the small angular separation between the latter and its companion. However, disentangling the signal of an exoplanet from its star allows us to obtain its spectrum, which can be analyzed to infer the atmospheric composition and eventually search for biosignatures. A simple way to alleviate the contrast problem is to observe in the mid-infrared (3 - 13μm) regime, where the contrast between the star and the planet is reduced. In order to improve this contrast, a coronagraphic technique can also be implemented. A mask stops the light of the star, while allowing the light of the companion (as the reflected or the emitted light of the planet) to pass through the optical system. 1 While an amplitude mask blocks directly the light, preventing from observing regions close to the star, the phase mask rejects the starlight by destructive interferences, using (spatially-distributed) phase shifts. In particular, the vortex phase mask produces a continuous helical phase ramp, with a singularity at the center, which creates an optical vortex and hence nulls the light locally. One flavour of the vortex phase mask is the vector vortex, 2, 3 which consists in a rotationally symmetric halfwave plate (HWP), with an optical axis orientation that rotates about the center. The effect of this vector vortex is to make the incoming horizontal polarization turn twice as fast as the azimuthal coordinate. When the vector vortex has completed the rotation with a phase ramp of 2 × 2π, the produced optical vortex is of charge 2 (see Fig. 1). These systems are called Vector Vortex Coronagraphs (VVCs). They present interesting properties: a small inner working angle (down to 0.9λ/D), high throughput, clear off- axis 360 ◦ discovery space and simplicity. One type of VVC is the Annular Groove Phase Mask (AGPM), which can be rendered achromatic over an appreciable spectral range thanks to the use of subwavelength gratings. 4, 5 This technology would be well suited for applications at mid-infrared wavelengths on future extremely large telescopes (ELTs). Further author information: [email protected]; phone: +32 43669739; ago.ulg.ac.be arXiv:1604.08355v1 [astro-ph.IM] 28 Apr 2016
Transcript of Mid-IR AGPMs for ELT applications - arXiv · Mid-IR AGPMs for ELT applications Brunella...

Mid-IR AGPMs for ELT applications
Brunella Carlomagnoa, Christian Delacroixa, Olivier Absila, Pontus Forsbergb, SergeHabrakena, Aïssa Joliveta, Mikael Karlssonb, Dimitri Mawetc, Pierre Pirona, Jean Surdeja and
Ernesto Vargas Catalanb
aDepartment of Astrophysics, Geophysics and Oceanography, University of Liège, 17 allée duSix Août, B-4000 Sart Tilman, Belgium;
bÅngström Laboratory, Uppsala University, Lägerhyddsvägen 1, SE-751 21 Uppsala, Sweden;cEuropean Southern Observatory, Alonso de Córdova 3107, Vitacura 7630355, Santiago, Chile
ABSTRACT
The mid-infrared region is well suited for exoplanet detection thanks to the reduced contrast between the planetand its host star with respect to the visible and near-infrared wavelength regimes. This contrast may be furtherimproved with Vector Vortex Coronagraphs (VVCs), which allow us to cancel the starlight. One flavour ofthe VVC is the AGPM (Annular Groove Phase Mask), which adds the interesting properties of subwavelengthgratings (achromaticity, robustness) to the already known properties of the VVC. In this paper, we presentthe optimized designs, as well as the expected performances of mid-IR AGPMs etched onto synthetic diamondsubstrates, which are considered for the E-ELT/METIS instrument.
Keywords: Exoplanets detection, Mid-IR, Vector Vortex Coronagraphs, E-ELT/METIS instrument
1. INTRODUCTION
Direct detection of exoplanets presents two important challenges: the presence of the extremely brighter hoststar and the small angular separation between the latter and its companion. However, disentangling the signalof an exoplanet from its star allows us to obtain its spectrum, which can be analyzed to infer the atmosphericcomposition and eventually search for biosignatures. A simple way to alleviate the contrast problem is to observein the mid-infrared (3 − 13µm) regime, where the contrast between the star and the planet is reduced. In orderto improve this contrast, a coronagraphic technique can also be implemented. A mask stops the light of the star,while allowing the light of the companion (as the reflected or the emitted light of the planet) to pass throughthe optical system.1 While an amplitude mask blocks directly the light, preventing from observing regions closeto the star, the phase mask rejects the starlight by destructive interferences, using (spatially-distributed) phaseshifts. In particular, the vortex phase mask produces a continuous helical phase ramp, with a singularity at thecenter, which creates an optical vortex and hence nulls the light locally. One flavour of the vortex phase maskis the vector vortex,2,3 which consists in a rotationally symmetric halfwave plate (HWP), with an optical axisorientation that rotates about the center.
The effect of this vector vortex is to make the incoming horizontal polarization turn twice as fast as theazimuthal coordinate. When the vector vortex has completed the rotation with a phase ramp of 2 × 2π, theproduced optical vortex is of charge 2 (see Fig. 1). These systems are called Vector Vortex Coronagraphs (VVCs).They present interesting properties: a small inner working angle (down to 0.9λ/D), high throughput, clear off-axis 360◦ discovery space and simplicity. One type of VVC is the Annular Groove Phase Mask (AGPM), whichcan be rendered achromatic over an appreciable spectral range thanks to the use of subwavelength gratings.4,5This technology would be well suited for applications at mid-infrared wavelengths on future extremely largetelescopes (ELTs).
Further author information: [email protected]; phone: +32 43669739; ago.ulg.ac.be
arX
iv:1
604.
0835
5v1
[as
tro-
ph.I
M]
28
Apr
201
6

Figure 1: Left: Illustration of the spatial variation of the optical axis orientation of a vector vortex coronagraph(VVC) of topological charge 2, obtained with a rotationally symmetric HWP. Right: Computed 2 × 2π phaseramp created by a charge-2 vortex.
2. DESIGN OPTIMIZATION PROCEDURE
2.1 Grating parametersThe design optimization technique uses an algorithm based on the Rigorous Coupled Wave Analysis (RCWA)6and coded in MATLAB R©.7 The RCWA solves Maxwell’s equations without simplifying assumptions. Theprincipal optimization parameters of the subwavelength grating profile are the filling factor F and the depth h(see Fig. 2, left).
Thanks to its great optical, mechanical, thermal and chemical characteristics, synthetic diamond turns out tobe a very well suited material to manufacture such AGPMs, based on an advanced micro-fabrication techniqueusing nano-imprint lithography and reactive ion etching.8,9 Due to fabrication issues, the walls of the etchedgrooves are not perfectly vertical, showing a slope α ∼ 3◦ in the present case (see Fig. 2, right).
Figure 2: Left: Schematic diagram of a trapezoidal grating. The filling factor F is such that FΛ corresponds tothe line width on top of the walls. Right: Cross sectional view of a diamond AGPM dedicated to the L band.The grating sidewalls have an angle α ∼ 3◦ and an average width FequivΛ ∼ 0.5µm.
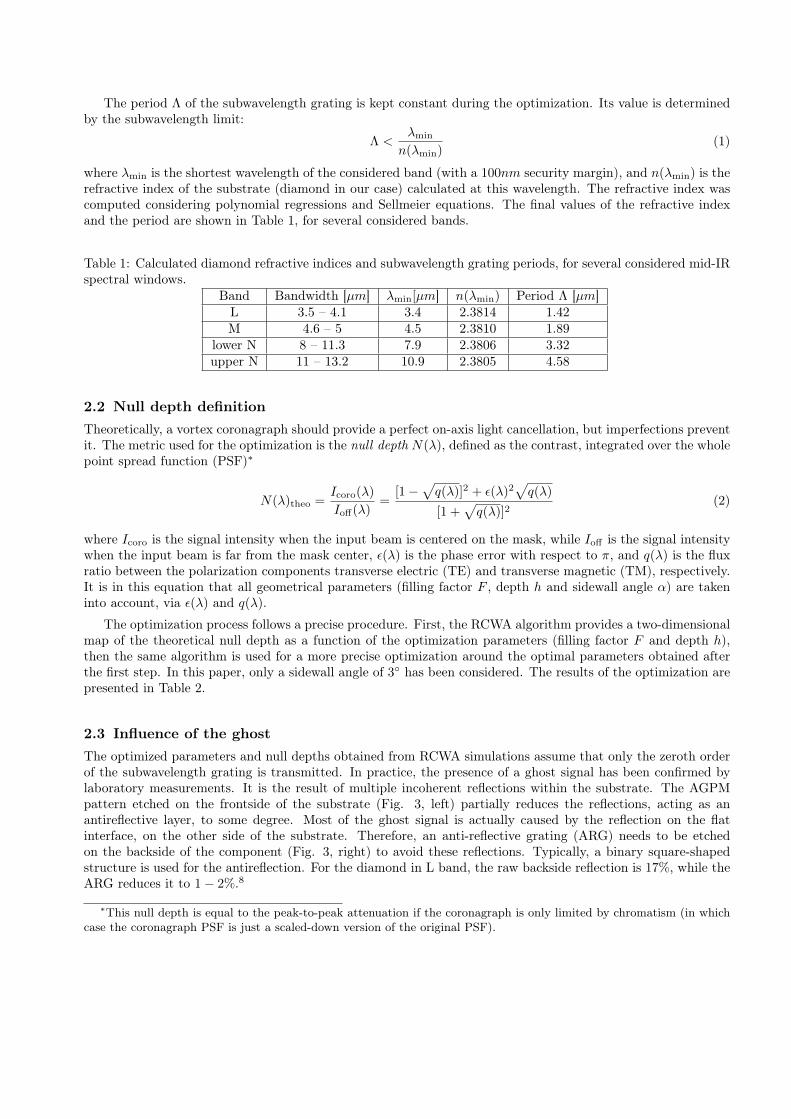
The period Λ of the subwavelength grating is kept constant during the optimization. Its value is determinedby the subwavelength limit:
Λ <λmin
n(λmin)(1)
where λmin is the shortest wavelength of the considered band (with a 100nm security margin), and n(λmin) is therefractive index of the substrate (diamond in our case) calculated at this wavelength. The refractive index wascomputed considering polynomial regressions and Sellmeier equations. The final values of the refractive indexand the period are shown in Table 1, for several considered bands.
Table 1: Calculated diamond refractive indices and subwavelength grating periods, for several considered mid-IRspectral windows.
Band Bandwidth [µm] λmin[µm] n(λmin) Period Λ [µm]L 3.5 – 4.1 3.4 2.3814 1.42M 4.6 – 5 4.5 2.3810 1.89
lower N 8 – 11.3 7.9 2.3806 3.32upper N 11 – 13.2 10.9 2.3805 4.58
2.2 Null depth definitionTheoretically, a vortex coronagraph should provide a perfect on-axis light cancellation, but imperfections preventit. The metric used for the optimization is the null depth N(λ), defined as the contrast, integrated over the wholepoint spread function (PSF)∗
N(λ)theo =Icoro(λ)
Ioff(λ)=
[1 −√q(λ)]2 + ε(λ)2
√q(λ)
[1 +√q(λ)]2
(2)
where Icoro is the signal intensity when the input beam is centered on the mask, while Ioff is the signal intensitywhen the input beam is far from the mask center, ε(λ) is the phase error with respect to π, and q(λ) is the fluxratio between the polarization components transverse electric (TE) and transverse magnetic (TM), respectively.It is in this equation that all geometrical parameters (filling factor F , depth h and sidewall angle α) are takeninto account, via ε(λ) and q(λ).
The optimization process follows a precise procedure. First, the RCWA algorithm provides a two-dimensionalmap of the theoretical null depth as a function of the optimization parameters (filling factor F and depth h),then the same algorithm is used for a more precise optimization around the optimal parameters obtained afterthe first step. In this paper, only a sidewall angle of 3◦ has been considered. The results of the optimization arepresented in Table 2.
2.3 Influence of the ghostThe optimized parameters and null depths obtained from RCWA simulations assume that only the zeroth orderof the subwavelength grating is transmitted. In practice, the presence of a ghost signal has been confirmed bylaboratory measurements. It is the result of multiple incoherent reflections within the substrate. The AGPMpattern etched on the frontside of the substrate (Fig. 3, left) partially reduces the reflections, acting as anantireflective layer, to some degree. Most of the ghost signal is actually caused by the reflection on the flatinterface, on the other side of the substrate. Therefore, an anti-reflective grating (ARG) needs to be etchedon the backside of the component (Fig. 3, right) to avoid these reflections. Typically, a binary square-shapedstructure is used for the antireflection. For the diamond in L band, the raw backside reflection is 17%, while theARG reduces it to 1 − 2%.8
∗This null depth is equal to the peak-to-peak attenuation if the coronagraph is only limited by chromatism (in whichcase the coronagraph PSF is just a scaled-down version of the original PSF).

Figure 3: SEM pictures of an L-band AGPM fabricated at the Ångström Laboratory using reactive ion etch-ing and nanoimprint lithography. Left: Annular grooves etched on the frontside of the component. Right:Antireflective structure etched on the backside.
The total null depth is then the sum of two components:
Ntotal(λ) = Ntheo(λ) +Nghost(λ) (3)
whereNghost(λ) =
Ighost(λ)
Ioff(λ). (4)
Even though the final parameters come from a perfect optimization, where the only metric is the theoretical nulldepth, the expected performances for a total null depth (considering the ghost) are improved by the use of theARG. When no ARG is present, the performances deteriorate very fast, as shown in section 3.2.
3. SIMULATION RESULTS AND LABORATORY VALIDATION
3.1 Spectral band selectionWe have applied our optimization procedure to the mid-infrared bands L, M and N. These three bands areexpected to be addressed by the METIS instrument on the future E-ELT, for which this optimization study wasproposed. Our AGPM could however be used for any other high contrast imaging instrument working at thesewavelengths.
Because the N band is very wide (8 − 13.2µm), it is difficult to cover it with a single component. Therefore,we divided it into two sub-bands (lower and upper), on which the AGPM design was optimized. The upper Nband was defined to suit the VISIR mid infrared camera of the VLT: 11 − 13.2µm. Recently, we have etched afew AGPMs covering this band. One of these is now installed on VISIR and shows promising performance.10Concerning the lower N band, we followed a different path. A constraint was imposed on the mean null depth,which should be smaller than 10−3. We could then calculate the maximal width of the spectral band, that wehave arbitrarily started at 8µm, to define the lower N band: 8 − 11.3µm (see Fig. 4).

8 8.5 9 9.5 10 10.5 11 11.50
0.2
0.4
0.6
0.8
1
1.2x 10
−3
Max wavelength[µm]
Nu
ll w
/o g
ho
st
[\]
Evolution of the Null w/o ghost for the N band
Figure 4: Definition of the lower N band spectral window. Optimized mean null depth for a minimal wavelengthof 8µm, function of the maximal wavelength. The desired mean null depth 10−3 is obtained for the bandwidth8 − 11.3µm .
3.2 Optimal AGPM parameters and null depth at L, M and N bandsThe results of our RCWA simulations are presented in Table 2, with the optimized filling factor F , grating depthh, and mean null depth N over the whole bandwidth.
The AGPM mean null depth (over each spectral band) is shown in Fig. 5 (left), function of the profile pa-rameters F and h. The dark blue region in the center of the figure corresponds to the optimal parameters region,providing the best contrast expressed here on a logarithmic scale. In Fig. 5 (right), we see that the theoreticaloptimal mean null depth N is comprised between 10−4 and 10−3. When the ghost is taken into account, thesomewhat degraded null depth value is still close to 10−3, showing the excellent performance of the ARG.
Table 2: Optimized filling factor F , grating depth h, and mean null depth N , for several considered mid-IRspectral windows.
Band Bandwidth F h[µm] NL 3.5 – 4.1 0.45 5.22 4.1 × 10⁻⁴
M 4.6 – 5 0.41 6.07 3.4 × 10⁻⁴
lower N 8 – 11.3 0.49 15.77 10−3
upper N 11 – 13.2 0.45 16.55 4.1 × 10⁻⁴

Figure 5: RCWA multiparametric simulations for the L, M and N bands. Left: Mean null depth map, functionof depth and filling factor, showing the optimal design values. For the N band, the upper right corner doesnot correspond to a possible geometrical solution, because of the merging of the sidewalls. Right: Computedcoronagraphic performance of the AGPM, showing the benefits of etching an ARG on the backside of thecomponent.

3.3 L-band AGPM laboratory demonstrationTo validate the performance of the L-band AGPM manufactured at the Uppsala University, we carried outlaboratory coronagraphic performance tests11 on the YACADIRE optical bench at the Observatoire de Paris.Two series of frames were recorded. The first one was obtained with the AGPM placed at the optimal position(coronagraphic frames). The second one was obtained with the AGPM far from this position (off-axis frames), inorder to measure a reference PSF without coronagraphic effect, but still propagating into the diamond substrate.Since the presence of the AGPM slightly modifies the PSF profile near the axis, we used the raw null depthto quantify the coronagraphic performance (rather than peak-to-peak attenuation). It is defined as the ratiobetween the integrated flux over a certain area around the centre of the final coronagraphic image, and theintegrated flux of the same area in the off-axis image. While considering the full PSF would lead to a pessimisticresult, because of all the background and high frequency artefacts, the sole central peak seems to be moreappropriate. The raw null depth is then defined as:
NAGPM =
∫ FWHM
0
∫ 2π
0Icoro(r, θ)r dr dθ∫ FWHM
0
∫ 2π
0Ioff(r, θ)r dr dθ
(5)
where we use the FWHM of the PSF as a boundary for our integral and Icoro and Ioff are the medians ofthe reduced coronagraphic and off-axis images. The measured raw null depth was 2 × 10⁻³ over the band,which is only within a factor 2 of the expected performance N ∼ 10−3 (Fig. 5, right). Our L-band AGPMswere also recently tested and validated on sky, with two infrared cameras: VLT-NACO and LBT-LMIRCam.12–14
Finally, let us mention that no M-band AGPM has been etched so far. This will be done in the coming yearand we plan to test these new AGPMs on a dedicated optical bench.15
4. CONCLUSIONSIn this paper, we have presented the design and the expected performances of the AGPM in the mid-infraredregime, in particular the L, M and N bands. Our simulations and laboratory tests show that a null depth betterthan 10−3 can be achieved on most mid-infrared atmospheric windows, assuming a perfect input wavefront. Thiswould translate into a contrast of about 5 × 10⁻⁶ at 2λ/D from the optical axis, which looks very promising forfuture ELT applications.
ACKNOWLEDGMENTSThe research leading to these results has received funding from the European Research Council under theEuropean Union’s Seventh Framework Programme (ERC Grant Agreement n.337569) and from the FrenchCommunity of Belgium through an ARC grant for Concerted Research Actions.
REFERENCES[1] Lyot, B., “The study of the solar corona and prominences without eclipses (George Darwin Lecture, 1939),”
Monthly Notices of the Royal Astronomical Society 99, 580–594 (1939).[2] Mawet, D., Serabyn, E., Liewer, K., Hanot, C., McEldowney, S., Shemo, D., and O’Brien, N., “Opti-
cal Vectorial Vortex Coronagraphs using Liquid Crystal Polymers: theory, manufacturing and laboratorydemonstration,” Optics Express 17, 1902–1918 (2009).
[3] Mawet, D., Murakami, N., Delacroix, C., Serabyn, E., Absil, O., Baba, N., Baudrand, J., Boccaletti, A.,Burruss, R., Chipman, R., Forsberg, P., Habraken, S., Hamaguchi, S., Hanot, C., Ise, A., Karlsson, M.,Kern, B., Krist, J., Kuhnert, A., Levine, M., Liewer, K., McClain, S., McEldowney, S., Mennesson, B.,Moody, D., Murakami, H., Niessner, A., Nishikawa, J., O’Brien, N., Oka, K., Park, P., Piron, P., Pueyo, L.,Riaud, P., Sakamoto, M., Tamura, M., Trauger, J., Shemo, D., Surdej, J., Tabirian, N., Traub, W., Wallace,J., and Yokochi, K., “Taking the vector vortex coronagraph to the next level for ground- and space-basedexoplanet imaging instruments: review of technology developments in the USA, Japan, and Europe,” Proc.SPIE 8151, 815108–14 (2011).

[4] Mawet, D., Riaud, P., Absil, O., and Surdej, J., “Annular groove phase mask coronaghaph,” AstrophysicalJournal 633, 1191–1200 (2005).
[5] Delacroix, C., Forsberg, P., Karlsson, M., Mawet, D., Absil, O., Hanot, C., Surdej, J., and Habraken, S.,“Design, manufacturing, and performance analysis of mid-infrared achromatic half-wave plates with diamondsubwavelength gratings,” Applied Optics 51, 5897 (2012).
[6] Moharam, M. G. and Gaylord, T. K., “Diffraction analysis of dielectric surface-relief gratings,” Journal ofthe Optical Society of America 72, 1385 (1982).
[7] Mawet, D., Riaud, P., Surdej, J., and Baudrand, J., “Subwavelength surface-relief gratings for stellar coro-nagraphy,” Applied Optics 44, 7313–7321 (2005).
[8] Forsberg, P. and Karlsson, M., “High aspect ratio optical gratings in diamond,” Diamond and RelatedMaterials 34, 19–24 (2013).
[9] Forsberg, P., Vargas, E., Delacroix, C., Absil, O., Carlomagno, B., Mawet, D., Habraken, S., Surdej, J., andKarlsson, M., “Manufacturing of diamond annular groove phase masks for the mid infrared region: 5 yearsof successful process development of diamond plasma etching,” Proc. SPIE 9151, 44 (2014).
[10] Delacroix, C., Absil, O., Mawet, D., Hanot, C., Karlsson, M., Forsberg, P., Pantin, E., Surdej, J., andHabraken, S., “A diamond AGPM coronagraph for VISIR,” Proc. SPIE 8446, 84468K–9 (2012).
[11] Delacroix, C., Absil, O., Mawet, D., Christiaens, V., Karlsson, M., Boccaletti, A., Baudoz, P., Kuittinen,M., Vartiainen, I., Surdej, J., and Habraken, S., “Laboratory demonstration of a mid-infrared agpm vectorvortex coronagraph,” Astronomy and Astrophysics 553, A98 (2013).
[12] Mawet, D., Absil, O., Delacroix, C., Girard, J. H., Milli, J., O’Neal, J., Baudoz, P., Boccaletti, A., Bourget,P., Christiaens, V., Forsberg, P., Gonte, F., Habraken, S., Hanot, C., Karlsson, M., Kasper, M., Lizon,J.-L., Muzic, K., Olivier, R., Peña, E., Slusarenko, N., Tacconi-Garman, L. E., and Surdej, J., “L’-bandAGPM vector vortex coronagraph’s first light on VLT/NACO. Discovery of a late-type companion at twobeamwidths from an F0V star,” Astronomy and Astrophysics 552, L13 (2013).
[13] Absil, O., Milli, J., Mawet, D., Lagrange, A.-M., Girard, J., Chauvin, G., Boccaletti, A., Delacroix, C., andSurdej, J., “Searching for companions down to 2 AU from β Pictoris using the L’-band AGPM coronagraphon VLT/NACO,” Astronomy and Astrophysics 559, L12 (2013).
[14] Defrère, D., Absil, O., Hinz, P., Mawet, D., Kühn, J., Mennesson, B., Skemer, A., Wallace, J., Delacroix,C., Kenworthy, M., Durney, O., and Montoya, M., “L’-band AGPM vector vortex coronagraph’s first lighton LBTI/LMIRCAM,” Proc. SPIE 9148, 145 (2014).
[15] Jolivet, A., Piron, P., Absil, O., Delacroix, C., Mawet, D., and Habraken, S., “The VORTEX coronagraphictest bench,” Proc. SPIE 9151, 217 (2014).