
Mid-Columbia Report - For Printing
142
Mid-Columbia Municipal Supply Assessment Department of Health Office of Drinking Water The Columbia River near Vantage Report of Activities and Findings 2013-2015 Interagency Agreement Number C1400131 DOH Contract N20500
-
Upload
andrea-watson -
Category
Documents
-
view
185 -
download
6
Transcript of Mid-Columbia Report - For Printing

Mid-Columbia Municipal Supply Assessment
D e p a r t m e n t o f H e a l t h
O f f i c e o f D r i n k i n g W a t e r
The Columbia River near Vantage
Report of Activities and Findings
2013-2015
Interagency Agreement Number C1400131
DOH Contract N20500

i

ii
Table of Contents I. Executive Summary………………………………………………………………...……1 II. Introduction…………………………………………………………………………...….2
Background Project Description and Strategy
III. Tasks & Services Provided………………………………………………………………6 Task 1) Questionnaire Development & Application Task 2) Public Outreach & Education Task 3) Follow-up Activities Informed by Questionnaire, Public Outreach &
Education Task 4) Summary of Follow-up Activities
IV. Financial Summary……………………………………………………………...……..10 V. Discussion & Next Steps………………………………………………………………..11
Accomplishments Issues Encountered Recommendations
Figures Cover Photo Courtesy of Brian Walsh
Figure 1. Mid-Columbia Basin Study Area Figure 2. ERWOW Well Level Measurement Training Tables
Table 1. Mid-Columbia Basin Study Communities – Source Capacity and Future Demand
Table 2. Financial Breakdown of Budget Expenditures Appendices
Appendix A – Interagency Agreement No. C1400131, DOH Contract N20500 Appendix B – Initial Questionnaire and Accompanying Introductory Letter Appendix C – Summary Table of Initial Questionnaire Results, Summary
Narrative, and Conclusions Appendix D – 2014 Columbia Basin Municipal Ground Water Open House
Invitation Letter Appendix E – 2014 Columbia Basin Municipal Ground Water Open House
Sign in Sheet and Meeting Materials Appendix F – 2014 Columbia Basin Municipal Ground Water Open House
Small Group Response Summary, Tables, and Conclusion Appendix G – ERWOW 2015 Presentation Slides Appendix H – Follow-up Questionnaire Appendix I – ERWOW Consultation Training Summary, Tables, and Conclusions

iii

1
I. Executive Summary
In response to concerns regarding declining groundwater in the Mid-Columbia Basin, the
Washington State Department of Ecology contracted with the Department of Health (Health),
Office of Drinking Water to assist municipalities in the counties of Adams, Franklin, Grant, and
Lincoln as they develop long-term solutions for a more resilient future water supply. The
contract was designed and implemented in several project phases: preliminary data collection,
public outreach and educational activities, and follow-up consultations with participating
municipalities. The period of performance was October 1, 2013 to June 30, 2015, and a budget of
$42,500 was provided to complete project tasks.
This report outlines the elements of the project and documents the successful completion of the
contract. In addition to collecting important data from affected municipalities in the Mid-
Columbia Basin, this project opened dialogues between Health, Ecology, and Mid-Columbia
Basin municipalities about groundwater decline and water system planning. The information
generated by this project will be invaluable for assisting these municipalities to prioritize their
water systems’ short and long-term planning activities.
2
II. Introduction
A study completed in 2012 by the Columbia Basin Ground Water Management Area
(CBGWMA) highlighted the effects of declining groundwater on the municipalities within the
Mid-Columbia Basin. The study area included Adams, Franklin, Grant, and Lincoln counties.
The CBGWMA study compared current and future water supply conditions using data from 124
wells owned by 25 different water systems in the basin (see Figure 1). According to the study, at
least half of the water systems will likely not meet their future water needs; as Table 1
demonstrates, at least eight of these systems will experience difficulty meeting water needs by
2060 (see Table 1).
In 2013, the United States Geological Survey (USGS) completed Scientific Investigations Report
2013-5079, Groundwater Depletion in the United States (1900-2008). The report confirmed that
water levels in wells located within the Columbia Plateau deep aquifer system are declining.
Groundwater levels were compared by taking measurements in 1984 and 2009 in 470 wells. In
most cases (83 percent), small to moderate declines in groundwater levels were observed.
Roughly one-third (29 percent) of all wells have declined more than 22 feet since 1984. The
USGS report concludes that it is that these groundwater supplies will experience further negative
depletion in the future.
The declining water levels in the Mid-Columbia Basin pose a substantial public health risk if
additional and alternative sources of supply are not developed in a timely manner. A number of
municipalities will face a water supply crisis during the coming decades. Now is the time for
Mid-Columbia Basin municipalities to identify long-term water supply options, and develop and
implement system specific mitigation and adaptation strategies.

3
Figure 1. Mid-Columbia Basin Study Area and Municipalities
Map credit: Ben Serr, Office of Drinking Water eastern regional office environmental planner.
4
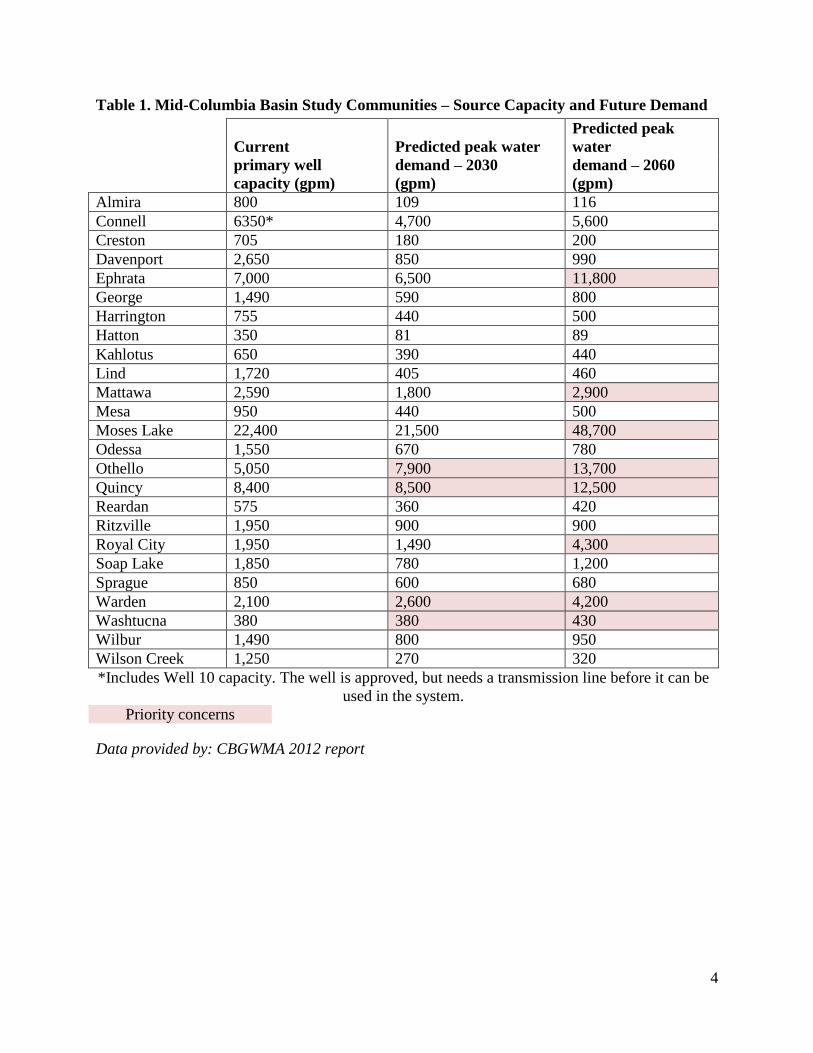
Table 1. Mid-Columbia Basin Study Communities – Source Capacity and Future Demand
Current Predicted peak water
Predicted peak
water
primary well demand – 2030 demand – 2060
capacity (gpm) (gpm) (gpm)
Almira 800 109 116
Connell 6350* 4,700 5,600
Creston 705 180 200
Davenport 2,650 850 990
Ephrata 7,000 6,500 11,800
George 1,490 590 800
Harrington 755 440 500
Hatton 350 81 89
Kahlotus 650 390 440
Lind 1,720 405 460
Mattawa 2,590 1,800 2,900
Mesa 950 440 500
Moses Lake 22,400 21,500 48,700
Odessa 1,550 670 780
Othello 5,050 7,900 13,700
Quincy 8,400 8,500 12,500
Reardan 575 360 420
Ritzville 1,950 900 900
Royal City 1,950 1,490 4,300
Soap Lake 1,850 780 1,200
Sprague 850 600 680
Warden 2,100 2,600 4,200
Washtucna 380 380 430
Wilbur 1,490 800 950
Wilson Creek 1,250 270 320
*Includes Well 10 capacity. The well is approved, but needs a transmission line before it can be
used in the system.
Priority concerns
Data provided by: CBGWMA 2012 report

5
Project Description and Strategy
The purpose of this project was to collect data that will be used to provide targeted planning and technical assistance to Mid-Columbia Basin municipalities that face water supply challenges as a result of declining aquifer levels. This project also used the resources and information available to the GWMA staff and the Departments of Health and Ecology to begin a dialogue with municipalities about their ability to meet current and future potable water needs.
The Washington Department of Ecology/Office of the Columbia River and the Washington Department of Health/Office of Drinking Water entered into Interagency Agreement No. C1400131, DOH Contract N20500 (see Appendix A). The contract outlines the following tasks and associated deliverables:
Task 1) Questionnaire Development & Application
Deliverables: Copy of questionnaire and a summary of responses.
Task 2) Public Outreach & Education
Deliverables: Copies of public meeting announcement, other materials provided at meeting, including the attendee list, and summaries of all meetings and activities.
Task 3) Follow-up Activities Informed by Questionnaire, Public Outreach & Education
Deliverables: Copy of follow-up materials including second questionnaire and summaries of system consultations and additional outreach.
Task 4) Summary of Follow-up Activities
Deliverables: Summary of findings.

6
III. Tasks & Services Provided
Task 1) Questionnaire Development & Application
The Department of Health, in consultation with the Department of Ecology, developed a
questionnaire (see Appendix B) that queried Mid-Columbia Basin municipalities’ understanding
of groundwater supply issues. The questionnaire covered the following:
Awareness of groundwater decline;
Interest in public meeting attendance;
Willingness to install a water level measuring device and record the resulting data;
Water system planning;
Forming partnerships to help address groundwater decline;
How to address concern regarding ability to meet future demand.
Health sent the questionnaire to the system managers of the 25 municipalities identified in the
October 2012 CBGWMA study (see Table 1) in August of 2013. The questionnaire packet (see
Appendix B) included additional information informing the municipalities that the collective
responses would be shared at a future public meeting on declining water levels. This meeting
was the first element of the public outreach and education phase of the contract. We received 19
completed questionnaires. The results were used to produce a summary table and narrative (see
Appendix C). The questionnaire data was also used to create a topics list and agenda for the
public meeting, as is discussed in the following section.
Task 2) Public Outreach & Education
Public Meeting
The 2014 Columbia Basin Municipal Ground Water Open House was held on January 9, 2014.
Invitation letters (see Appendix D) were sent to the 25 water systems that had received the initial
project questionnaire regardless of whether they had or had not responded. The public meeting
was hosted at the Advanced Technologies & Education Center (ATEC) at Big Bend Community
College in Moses Lake, WA from 9am to 1pm, and was facilitated by Health staff. The 53
attendees included Mid-Columbia Basin municipalities and water systems personnel, GWMA
representatives, and various state agency staff. Each attendee received a packet of materials
providing information about groundwater decline, as well as the results of the initial
questionnaire (see Appendix E, for initial questionnaire results see Appendix C).
The meeting included small group discussions that allowed municipality representatives to
answer and discuss questions about how aquifer changes are affecting their systems, how to
adjust to these changes, to layout crucial next steps, and to identify areas in which assistance
might be needed. The responses to these questions were recorded, compiled, and summarized
(see Appendix F). This information provided insight into key issues surrounding water supply
management, aquifer change response, water system planning in the Mid-Columbia Basin, and
the need for low cost training opportunities for water system operators. Responses informed the
development and focus of further public outreach activities in fulfillment of Task 2.

7
Outreach and training at the Evergreen Rural Water of Washington 2015 Annual Conference,
February 9, 2015, Yakima, Washington
Health partnered with Evergreen Rural Water of Washington (ERWOW) to augment the
education and outreach opportunities initiated with the open house. ERWOW is a non-profit
organization that provides training and technical assistance to water systems in Washington
State. Their annual conference is attended by a diverse array of individuals, organizations,
agencies, and companies involved in water management (see Appendix G). Health staff hosted
two sessions at the ERWOW 2015 Annual Conference in Yakima, WA. The sessions are
described below.
“Will the Water Run Dry” Presentation
Office of Drinking Water eastern regional office manager Dorothy Tibbetts facilitated a session
entitled “Will the Water Run Dry.” Ms. Tibbett’s session provided attendees with an overview of
the current state of Mid-Columbia Basin groundwater sources and how supply issues are being
addressed. Wade Ferris, City Administrator for the City of Othello, WA gave a guest
presentation during Ms. Tibbett’s session. Mr. Ferris spoke to the audience about how Othello is
currently handling groundwater decline, including addressing immediate problems and engaging
in long-range planning.
“Measuring Water Levels: The How and Why of Smart Water System Management” – Panel
Discussion and Water Level Measurement Workshop
A separate session included a panel discussion by:
Office of Drinking Water Hydrogeologist Ginny Stern.
Pacific Groundwater Group Principle Hydrogeologist Charles Ellingson.
Sander Enterprises Engineer and Municipal Utility Specialist Dan Sander.
ERWOW Source Water Protection Specialist Charles Brown.
ERWOW Southern Circuit Rider Derek Zock.
This session offered discussion and presentations from a panel of water resources professionals
on the critical role water level monitoring plays in effective water system management. While
the audience included operators from all over Washington, the challenge facing the Mid-
Columbia Basin supplies was used to underscore the value of ongoing water level measurements.
Copies of the presentations given by Ginny Stern and Charles Ellingson are included in
Appendix G.
Task 3) Follow-up Activities Informed by Questionnaire, Public Outreach & Education
Data Summary Tables
Office of Drinking Water environmental engineer Jeff Johnson created data tables that
summarize the well data collected from the 25 municipalities that participated in the CBGWMA
2012 study (see Appendix E, data tables included in 2014 Columbia Basin Municipal Ground
Water Open House meeting materials for attendees).
8
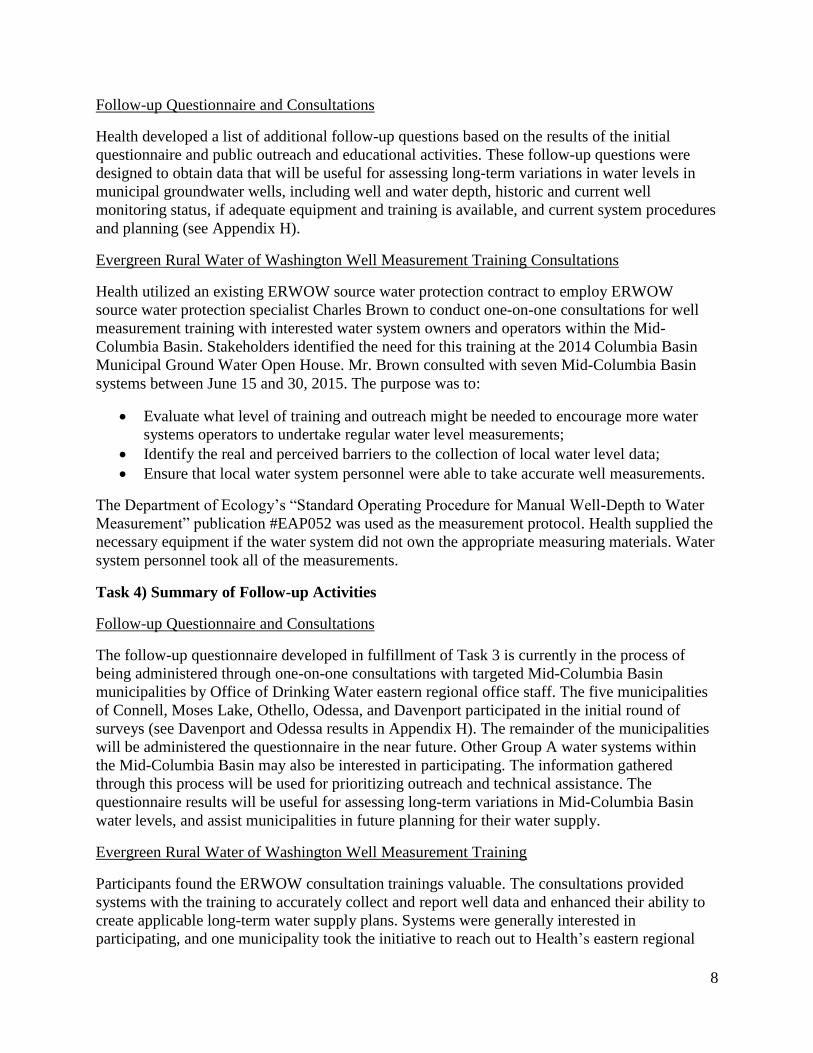
Follow-up Questionnaire and Consultations
Health developed a list of additional follow-up questions based on the results of the initial
questionnaire and public outreach and educational activities. These follow-up questions were
designed to obtain data that will be useful for assessing long-term variations in water levels in
municipal groundwater wells, including well and water depth, historic and current well
monitoring status, if adequate equipment and training is available, and current system procedures
and planning (see Appendix H).
Evergreen Rural Water of Washington Well Measurement Training Consultations
Health utilized an existing ERWOW source water protection contract to employ ERWOW
source water protection specialist Charles Brown to conduct one-on-one consultations for well
measurement training with interested water system owners and operators within the Mid-
Columbia Basin. Stakeholders identified the need for this training at the 2014 Columbia Basin
Municipal Ground Water Open House. Mr. Brown consulted with seven Mid-Columbia Basin
systems between June 15 and 30, 2015. The purpose was to:
Evaluate what level of training and outreach might be needed to encourage more water
systems operators to undertake regular water level measurements;
Identify the real and perceived barriers to the collection of local water level data;
Ensure that local water system personnel were able to take accurate well measurements.
The Department of Ecology’s “Standard Operating Procedure for Manual Well-Depth to Water
Measurement” publication #EAP052 was used as the measurement protocol. Health supplied the
necessary equipment if the water system did not own the appropriate measuring materials. Water
system personnel took all of the measurements.
Task 4) Summary of Follow-up Activities
Follow-up Questionnaire and Consultations
The follow-up questionnaire developed in fulfillment of Task 3 is currently in the process of
being administered through one-on-one consultations with targeted Mid-Columbia Basin
municipalities by Office of Drinking Water eastern regional office staff. The five municipalities
of Connell, Moses Lake, Othello, Odessa, and Davenport participated in the initial round of
surveys (see Davenport and Odessa results in Appendix H). The remainder of the municipalities
will be administered the questionnaire in the near future. Other Group A water systems within
the Mid-Columbia Basin may also be interested in participating. The information gathered
through this process will be used for prioritizing outreach and technical assistance. The
questionnaire results will be useful for assessing long-term variations in Mid-Columbia Basin
water levels, and assist municipalities in future planning for their water supply.
Evergreen Rural Water of Washington Well Measurement Training
Participants found the ERWOW consultation trainings valuable. The consultations provided
systems with the training to accurately collect and report well data and enhanced their ability to
create applicable long-term water supply plans. Systems were generally interested in
participating, and one municipality took the initiative to reach out to Health’s eastern regional

9
office staff for inclusion. The trainings were offered at no-cost based on the concerns about a
lack of capital for such activities raised through the initial questionnaire and at the open house.
The data collected during these consultations will also assist Health in determining the current
status of Mid-Columbia Basin groundwater supply (see Appendix I). The Department of Health
is evaluating how an expansion of a technical outreach program like this can be used to
encourage and expand water systems capacity to monitor water levels.
Figure 2. ERWOW Well Level Measurement Training
Mr. Charles Brown (pictured on the right), ERWOW Source Water Protection Specialist, and
Mr. Joe Schons, City of George Public Works Director, measure water levels in one of the
municipal wells that serve the citizens of George, WA. Photo credit: Brian Walsh.

10
IV. Financial Summary
The total budget allotted for this contract in the original IAA was $42,500 (see Appendix A). At
the time of this report, total project expenditures are in the process of finalization. We anticipate
that the total expenditures will be well within the overall project budget due to factors including
Health’s utilization of its existing contract with ERWOW to fulfill a portion of Task 3. A
breakdown of the projected budget and expenditures by project task is as follows:
Table 2: Financial Breakdown of Budget Expenditures
Mid-Columbia Basin Municipal Supply Project Budget and Expenditures
Task Task Budget Total Expenditure Remaining Funds
Task 1) Questionnaire
Development & Application
$2,500 $2,500 0
Task 2) Public Outreach &
Education
$15,000 $15,000 0
Task 3) Follow-up Activities
Informed by Questionnaire,
Public Outreach & Education
$15,000 $5,000 $10,000
Task 4) Summary of Follow-up
Activities
$10,000 $5,000 $15,000
Totals $42,500 $27,000 $15,500

11
V. Discussion & Next Steps
Accomplishments
The Office of Drinking Water has successfully completed the tasks outlined in the original
Interagency Agreement. Project implementation has facilitated the collection of important data
from municipalities in the Mid-Columbia Basin that are facing water supply challenges due to
groundwater decline. Data was collected primarily through the initial questionnaire, the
Columbia Basin Municipal Ground Water Open House small group worksheets, and additional
data will result from the follow-up questionnaire.
Project data provides insight into topics important to addressing declining water levels, including
community awareness and concern regarding water availability, current short and long-term
municipal water system planning implementation, and solutions to water supply issues that are of
interest to water system managers. It will add to the existing historical data submitted by
municipalities through current reporting systems such as the Water Use Efficiency program.
Such information will also allow Mid-Columbia Basin municipalities to prioritize their water
systems’ short and long-term planning activities with targeted assistance from Health, leading to
a more resilient future water supply.
The implementation of this project opened dialogues about groundwater decline between Health,
Ecology, and Mid-Columbia Basin municipalities, as well as among municipalities themselves.
As previously discussed, the open house allowed attendees to discuss this issue with one another
and present their collective concerns to agency representatives. In response to the points raised,
Health staff held informational and training sessions at the ERWOW 2015 Annual Conference, a
locally held event attended by many Mid-Columbia Basin stakeholders. Attendee evaluations of
these sessions were overall very positive, and included the suggestion that “Will the Water Run
Dry” be presented again at future ERWOW educational events.
We need to thank Health’s source water protection manager Corina Hayes for expanding an
existing contract with ERWOW, allowing us to provide the no-cost water level measurement
trainings to Mid-Columbia Basin water system operators. ERWOW trainings significantly
expanded the level of outreach and education encompassed by this project. ERWOW source
water protection specialist Charles Brown reported that the majority of the systems he worked
with during this project are very willing to take and record well measurements if they possess the
necessary measurement devices. Mr. Brown suggested that contracting a TA provider, equipping
them with appropriate materials, and scheduling consultations with small Mid-Columbia Basin
water systems twice annually would provide a solution to the data gap that occurs when system
personnel are unable to record well level measurements themselves.
Reaching out to targeted municipalities to schedule follow-up consultations for application of the
second questionnaire served to further relationships between several municipalities and Health’s
eastern regional office. Conversations regarding groundwater decline and the roles of agencies,
system managers, and others in addressing this issue have been expanded. It is clear that Mid-
Columbia Basin water supply issues are important to and recognized by many local
communities. When opportunities for discussion, collaboration, and training and education are
presented to affected municipalities, they have demonstrated a high level of interest and
participation, and this interest is only expected to grow over time.
12
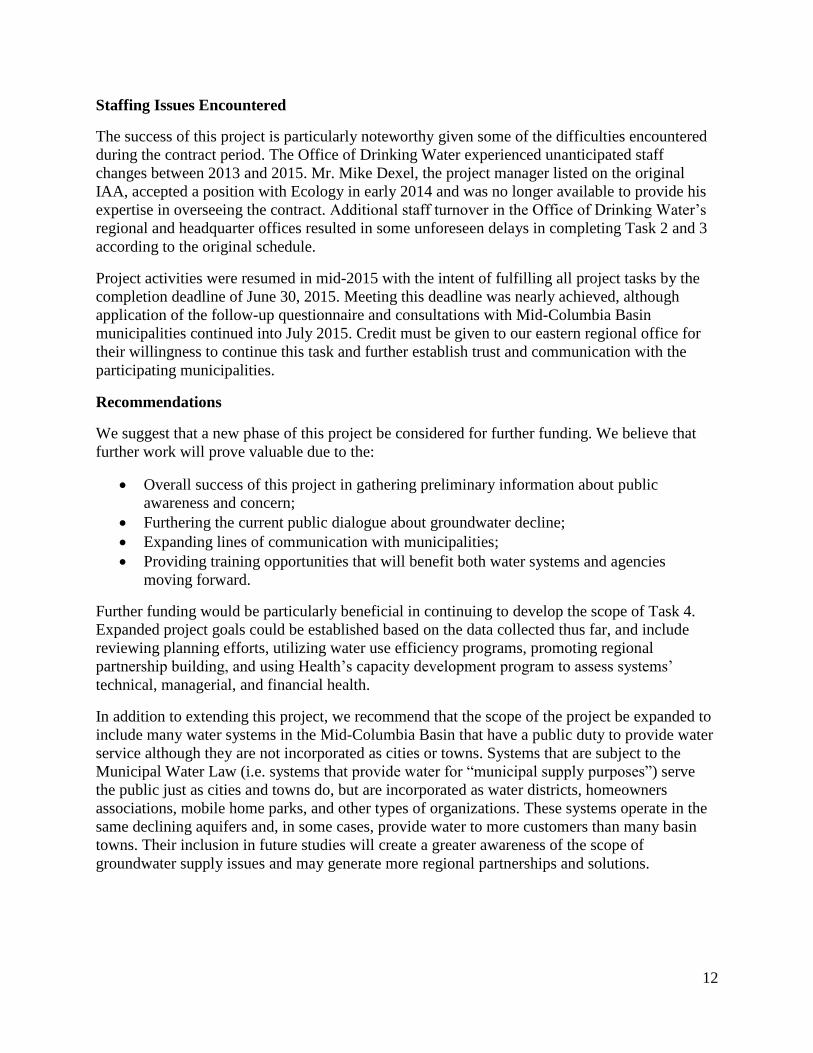
Staffing Issues Encountered
The success of this project is particularly noteworthy given some of the difficulties encountered
during the contract period. The Office of Drinking Water experienced unanticipated staff
changes between 2013 and 2015. Mr. Mike Dexel, the project manager listed on the original
IAA, accepted a position with Ecology in early 2014 and was no longer available to provide his
expertise in overseeing the contract. Additional staff turnover in the Office of Drinking Water’s
regional and headquarter offices resulted in some unforeseen delays in completing Task 2 and 3
according to the original schedule.
Project activities were resumed in mid-2015 with the intent of fulfilling all project tasks by the
completion deadline of June 30, 2015. Meeting this deadline was nearly achieved, although
application of the follow-up questionnaire and consultations with Mid-Columbia Basin
municipalities continued into July 2015. Credit must be given to our eastern regional office for
their willingness to continue this task and further establish trust and communication with the
participating municipalities.
Recommendations
We suggest that a new phase of this project be considered for further funding. We believe that
further work will prove valuable due to the:
Overall success of this project in gathering preliminary information about public
awareness and concern;
Furthering the current public dialogue about groundwater decline;
Expanding lines of communication with municipalities;
Providing training opportunities that will benefit both water systems and agencies
moving forward.
Further funding would be particularly beneficial in continuing to develop the scope of Task 4.
Expanded project goals could be established based on the data collected thus far, and include
reviewing planning efforts, utilizing water use efficiency programs, promoting regional
partnership building, and using Health’s capacity development program to assess systems’
technical, managerial, and financial health.
In addition to extending this project, we recommend that the scope of the project be expanded to
include many water systems in the Mid-Columbia Basin that have a public duty to provide water
service although they are not incorporated as cities or towns. Systems that are subject to the
Municipal Water Law (i.e. systems that provide water for “municipal supply purposes”) serve
the public just as cities and towns do, but are incorporated as water districts, homeowners
associations, mobile home parks, and other types of organizations. These systems operate in the
same declining aquifers and, in some cases, provide water to more customers than many basin
towns. Their inclusion in future studies will create a greater awareness of the scope of
groundwater supply issues and may generate more regional partnerships and solutions.

Appendix A
Interagency Agreement No. C1400131, DOH Contract N20500


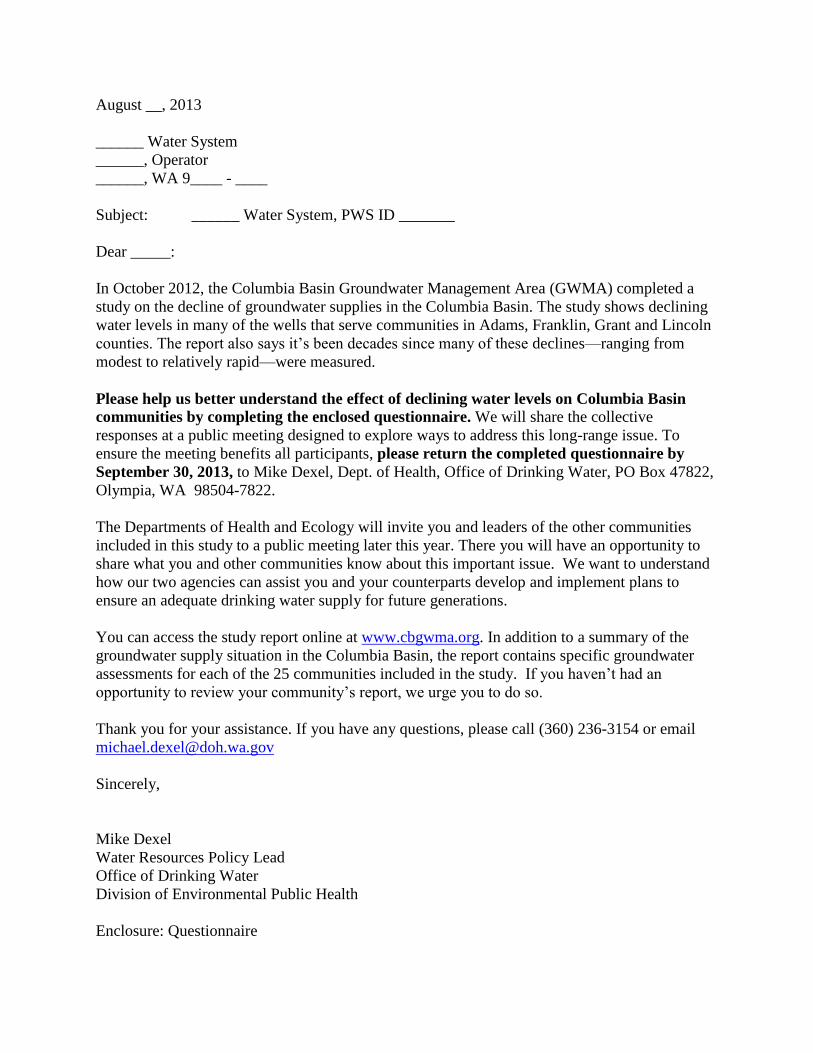
Appendix B Initial Questionnaire and Accompanying Introductory Letter
August __, 2013
______ Water System
______, Operator
______, WA 9____ - ____
Subject: ______ Water System, PWS ID _______
Dear _____:
In October 2012, the Columbia Basin Groundwater Management Area (GWMA) completed a
study on the decline of groundwater supplies in the Columbia Basin. The study shows declining
water levels in many of the wells that serve communities in Adams, Franklin, Grant and Lincoln
counties. The report also says it’s been decades since many of these declines—ranging from
modest to relatively rapid—were measured.
Please help us better understand the effect of declining water levels on Columbia Basin
communities by completing the enclosed questionnaire. We will share the collective
responses at a public meeting designed to explore ways to address this long-range issue. To
ensure the meeting benefits all participants, please return the completed questionnaire by
September 30, 2013, to Mike Dexel, Dept. of Health, Office of Drinking Water, PO Box 47822,
Olympia, WA 98504-7822.
The Departments of Health and Ecology will invite you and leaders of the other communities
included in this study to a public meeting later this year. There you will have an opportunity to
share what you and other communities know about this important issue. We want to understand
how our two agencies can assist you and your counterparts develop and implement plans to
ensure an adequate drinking water supply for future generations.
You can access the study report online at www.cbgwma.org. In addition to a summary of the
groundwater supply situation in the Columbia Basin, the report contains specific groundwater
assessments for each of the 25 communities included in the study. If you haven’t had an
opportunity to review your community’s report, we urge you to do so.
Thank you for your assistance. If you have any questions, please call (360) 236-3154 or email
Sincerely,
Mike Dexel
Water Resources Policy Lead
Office of Drinking Water
Division of Environmental Public Health
Enclosure: Questionnaire

Questionnaire on Declining Groundwater Supplies in Columbia River Basin
1) Are you aware of the extent of the declining groundwater levels in the Columbia Basin that
may affect your community’s ability to meet future water demands?
Yes No
2) Speaking for your water utility, are you interested in participating in the public meeting the
departments of Health and Ecology will hold on the Columbia Basin report this fall?
Yes No
If there are others from your water utility who might want to attend, please list their names
and titles here: (for example: 1. John Miller, Public Works Director; 2. Bob Hill, Mayor)
3) If data were lacking from your utility’s well(s), would you be willing to install a water level
measuring device?
Yes No
If yes, would you be willing to record and report the data from the water-level measuring
device(s) to the state on a monthly basis?
Yes No
4) Did your water system complete a water system plan within the last six years?
Yes No
If yes, does the plan include any of the following? (check all that apply):
Strategy for dealing with a long-term water shortage.
Evaluation of long-range (20-50 years) water supply and demand.
Description a water use efficiency program.
Evaluation of possible new sources of supply.
If no, do you have enough resources to complete a plan now?
Yes No
If no, what resources do you need to do one now? (Include cost or other required resources)

5) Has your water utility considered forming local water supply partnerships with nearby water
suppliers as a means for addressing declining groundwater supplies?
Yes No
If yes, list the jurisdictions or local governments you would (or do) include in the
partnership:
6) Are you concerned about your existing sources of supply meeting current or future demand?
Please describe here:
Yes No
If yes, how can Health, Ecology, or the GWMA help your water system meet your future water
needs?

Appendix C Summary Table of Initial Questionnaire Results, Summary Narrative, and Conclusions

Water System Name: Completed by: 1. Are you aware of the extent of the
declining groundwate
r levels in the
Columbia Basin that may affect
your community' s ability to
meet future water
demands?
2. Speaking for your
water utility, are you
interested in participatin
g in the public
meeting Health/Ecol
ogy will hold on the Columbia
Basin report this fall?
If there are others from your water utility who might want to attend,
please list their names and titles here.
3. If data were
lacking from your
utility's well(s),
would you be willing to install a water-level measuring
device?
If yes, would you be willing to record
and report the data from the
water-level measuring device(s) to the sate on a monthly
basis?
4. Did your water
system complete a
water system
plan within the last 6 years?
If yes, does the plan
include any of the
following? (check all
that apply).
Strategy for dealing
with a long- term water shortage.
Evaluation of long-
range (20- 50 years)
water supply and
demand.
Description of a water
use efficiency program.
Evaluation of possible
new sources of
supply.
If no, do you have enough resources to complete a plan now?
If no, what resources
do you need to do one
now? (Include cost
or other required
resources).
5. Has your water utility considered forming a
local water supply
partnership with nearby
water supplies as a
way to address declining
groundwater supplies?
If yes, list the jurisdictions
or local governments you would (or do) include in
your partnership:
6. Are you concerned about your
existing sources of
supply meeting
current or future
demand?
Please describe here: If yes, how can Health/Ecology or the GWMA help your water systems meet your future
water needs?
Comments:
ALMIRA WATER SYSTEM CONNELL, CITY OF
Larry Turner, City of Connell
Yes
Yes
Gary Walton, Mayor
Yes
Yes
Yes
X
X
X
No
We have only the information that has been gathered by GWMA and currently all source's are producing at normal levels, with some minor drop in level's.
That would be a good table discussion.
6. Maybe.
CRESTON PUBLIC WATER
Unknown, Town of Creston
Yes
Yes
Matt Strive, Town Maintenance Superintendent- Blake Angstrom, Mayor
Yes
Yes
Yes
X
X
No
Yes
DAVENPORT WATER DIVISION
Unknown, City of Davenport
Yes
Yes
Yes
Yes
Yes
X
X
Yes
No
Yes
Not as this time/we are currently looking at drilling a new well in the NE corner of Davenport but depends on some well monitoring E & N of Davenport.
EPHRATA WATER DEPARTMENT Bill Sangster, PWD Yes Yes Bill Sangster PW
Director Yes Yes Yes X X No Yes Funding of new wells. 3. (1st part of question): If funds are available.
GEORGE, CITY OF HARRINGTON, CITY OF Mayor Paul Gilliland, City of
Harrington Yes Yes Yes Yes No No Need to hire an engineer. No No
HATTON, TOWN OF KAHLOTUS, CITY OF LIND, TOWN OF Unknown, Town of Lind Yes Yes Yes Yes Yes X No Yes Grant Funding. MATTAWA WATER SYSTEM Unknown, Town of
Mattawa Yes Yes Yes Yes Yes X X X Yes Port of Mattawa. No
MESA WATER DEPARTMENT Unknown, City of Mesa No Yes Yes Yes Yes X X X No No GWMA presented he council with information that
we have new water not ancient water. 3. (1st part of question): If it is provided.
MOSES LAKE, CITY OF
Sean O'Brien, Moses Lake
Yes
Yes
Myself and others will be interested in attending.
Yes
Yes
No
X
X
No
Yes
All of the City's deep wells have been annually declining since we have kept records. This dates back to the late 50's for some wells. This results in less production and increased cost and is unsustainable.
Declare that providing a sustainable supply of potable water to the citizens of the Columbia basin is a vital necessity to the future survival of the region. Acknowledge that major changes in the agricultural industry need to be made to reach that goal. Determine how much water is being over pumped and start reducing in areas with large decline. Prohibit wells from being depend in the Odessa subarea.
3. (1st part of question): All of our well sites do have water-level measuring devices in them unless it is physically impossible to install one. 4. (1st part of question): We are a little overdue, but had our preplan meeting with the DOH last month.
ODESSA OTHELLO WATER DEPARTMENT
Dan Quick, City of Othello
Yes
Yes
Yes
Yes
Yes
X
X
X
X
"Money," for transmission line from future well #9.
Yes
Stream line on drilling permits, progress reports.
3. (2d part of question): It will take some programming to get the report. 4. (2d part of question): Need two new wells, and a 2.1 million gal. water storage.
QUINCY WATER DEPARTMENT, CITY OF
Dave Reynolds, Town of Quincy
Yes
Yes
Yes Yes
Yes
X No
Yes Communication and cooperation between DOH & DOE to speed up process of water conservation and planning with the cities.
REARDAN, TOWN OF
Unknown, Town of Reardan
Yes
Yes
Yes
Yes
Yes
X
X
X
X
No
Yes
We constantly monitor our water supply, A Town is a living entity and like any life form, water is essential to its very existence--No Water=no town.
You can help by supporting continued and enhanced ground water research and by prioritizing rehydration efforts utilizing high water flows of the Spokane and council rivers.
5. The distance to any 'nearby' water supplier are too far away to make forming a partnership practical.
RITZVILLE WATER DEPARTMENT
Unknown, City of Ritzville
Yes
Yes Mike Shrag, Council
Member
Yes
Yes
Yes
X X
X
No Yes
We are drilling new well now and it will handle current and some future demand but out back up wells will need work.
Need grant money and permits, and water right to dill another well and cap existing well because of being crooked.
ROYAL CITY WATER John Lasen, Royal City Water System No Yes Yes Yes X X Yes Port of Royal. No
SOAP LAKE WATER DEPT Unknown, City of Soap Lake No Yes Yes Yes Yes X X X X No No 3. (1st part of question): Cost 3.
(2d part of question): Cost.
SPRAGUE, CITY OF Unknown, City of Sprague Yes Yes Mayor Mike Evans Yes Yes Yes X X No Yes Education 5. No nearby suppliers.
WARDEN, CITY OF
Unknown, City of Warden
Yes
Yes Mayor Tony Massa, Ron
Current, PW Director
Yes No
Yes No
Yes All use of current water sources and transfer water rights from Grande Ronde to Wanapum aquifers.
3. (1st part of question): Unsure. 4. (1st part of question): In progress currently.
WASHTUCNA WATER DEPARTMENT WILBUR, TOWN OF Unknown, Town of Wilbur Yes No No Yes X X No No WILSON CREEK WATER DEPT, TOWN OF
Kathy Bohnet, Mayor, Town of Wilson Creek
Yes
Yes
Our Mayor Kathy Bohnet will try to attend your public meeting
Yes
X
X
X
X
No
No
Make no additional demand of us that are not funded.
3. (1st part of question): Yes if there were no cost to the town. 5. We are remote and not near other sources.
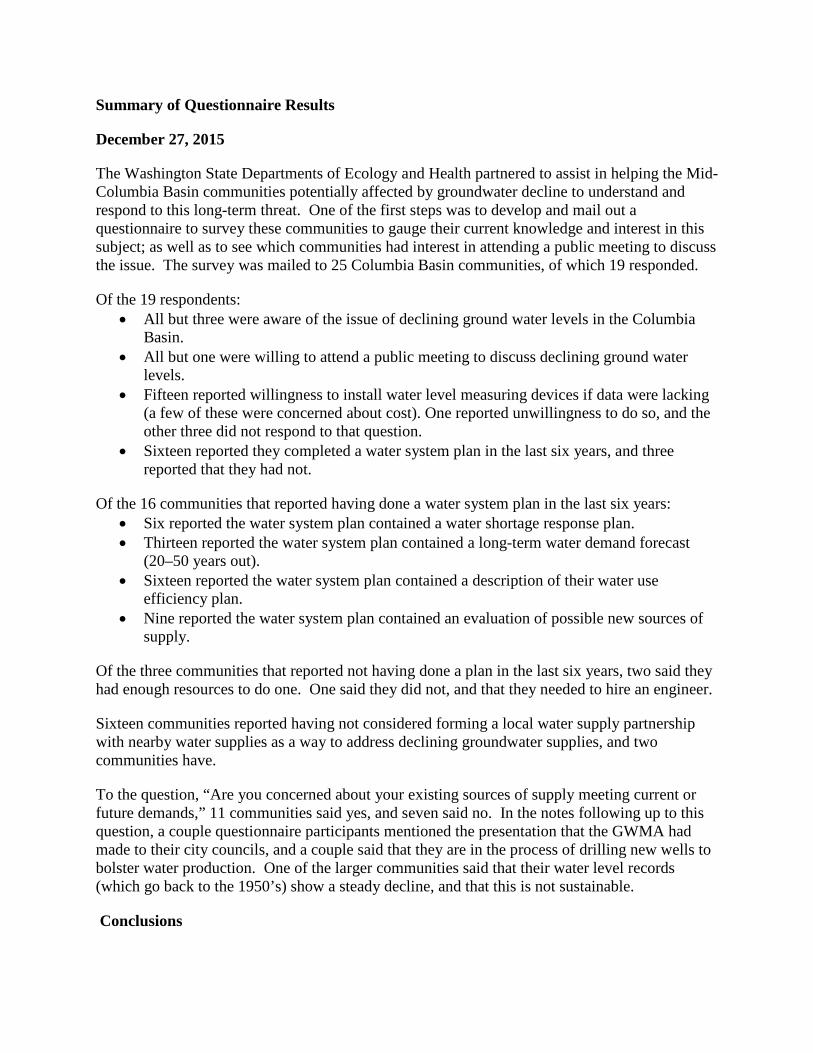
Summary of Questionnaire Results
December 27, 2015
The Washington State Departments of Ecology and Health partnered to assist in helping the Mid-Columbia Basin communities potentially affected by groundwater decline to understand and respond to this long-term threat. One of the first steps was to develop and mail out a questionnaire to survey these communities to gauge their current knowledge and interest in this subject; as well as to see which communities had interest in attending a public meeting to discuss the issue. The survey was mailed to 25 Columbia Basin communities, of which 19 responded.
Of the 19 respondents: • All but three were aware of the issue of declining ground water levels in the Columbia
Basin. • All but one were willing to attend a public meeting to discuss declining ground water
levels. • Fifteen reported willingness to install water level measuring devices if data were lacking
(a few of these were concerned about cost). One reported unwillingness to do so, and the other three did not respond to that question.
• Sixteen reported they completed a water system plan in the last six years, and three reported that they had not.
Of the 16 communities that reported having done a water system plan in the last six years: • Six reported the water system plan contained a water shortage response plan. • Thirteen reported the water system plan contained a long-term water demand forecast
(20–50 years out). • Sixteen reported the water system plan contained a description of their water use
efficiency plan. • Nine reported the water system plan contained an evaluation of possible new sources of
supply.
Of the three communities that reported not having done a plan in the last six years, two said they had enough resources to do one. One said they did not, and that they needed to hire an engineer.
Sixteen communities reported having not considered forming a local water supply partnership with nearby water supplies as a way to address declining groundwater supplies, and two communities have.
To the question, “Are you concerned about your existing sources of supply meeting current or future demands,” 11 communities said yes, and seven said no. In the notes following up to this question, a couple questionnaire participants mentioned the presentation that the GWMA had made to their city councils, and a couple said that they are in the process of drilling new wells to bolster water production. One of the larger communities said that their water level records (which go back to the 1950’s) show a steady decline, and that this is not sustainable.
Conclusions
The initial questionnaire surveying the Mid-Columbia Basin water systems identified by the October 2012 GWMA study successfully collected important information regarding the knowledge and current levels of water system planning that are present in the basin. Responses indicated that there is a broad awareness of declining water levels among water systems managers. Interest in attending a public meeting on this issue was high, as was willingness to install water level monitoring devices if current well data was lacking, although the cost of installing these devices was cited as a concern.
The data resulting from this questionnaire also demonstrated most respondents had water system plans in place plans included long-term water demand forecasts and all encompassed a water use efficiency plan. However, despite the concern reported by many respondents regarding their ability to meet current or future water supply demands, relatively few plans included a water shortage response portion and or an evaluation of possible new supply sources. Only 12% of respondents had considered a local water supply partnership as a way to address this issue.
Appendix D 2014 Columbia Basin Municipal Ground Water Open House Invitation Letter

Public Health – Always Working for a Safer and Healthier Washington
STATE OF WASHINGTON
DEPARTMENT OF HEALTH OFFICE OF DRINKING WATER
243 Israel Road Southeast PO Box 47822 Olympia, Washington 98504-7822
Tel: (360) 236-3100 Fax: (360) 236-2253 TDD Relay Service: 1-800-833-6388 December __, 2013
Water System , Operator , WA 9 -
Subject: Columbia Basin Municipal Ground Water Open House January 9, 2014 Dear _____: Last August, the Department of Health sent you a questionnaire to help us gather feedback regarding the effect of declining water levels of wells in Columbia Basin communities. Here are a few highlights from that questionnaire:
• Nineteen of the 25 Columbia Basin communities responded to the survey. • All but three respondents are aware of declining groundwater levels. • Eleven of the 25 respondents are concerned about the ability of current water sources to
meet current or future demand. • All but one respondent expressed interest in attending a public meeting focused on the
local effects of declining municipal water supplies. Thank you for helping the department better understand your water supply needs and challenges. January 9 the Departments of Health and Ecology invite you and leaders of other communities affected by the declining water levels in Columbia Basin wells to an Open House in Moses Lake. Purpose: Discuss water supply challenges facing municipal water suppliers Date: Thursday, January 9th, 2014, from 9 a.m.–1 p.m. Location: Advanced Technologies & Education Center (ATEC)
Big Bend Community College Masto conference Center, Rom 1870 7611 Bolling St NE,
Moses Lake, WA 98837 (Directions enclosed) *Coffee and refreshments will be provided.
Please RSVP to Mike Dexel by January 7, 2014. When you RSVP, please indicate the number of people attending the meeting. Send your RSVP to [email protected].

Public Health – Always Working for a Safer and Healthier Washington
This meeting is meant to encourage an open dialogue between municipalities and those familiar with the declining groundwater supply in the Columbia Basin. We want to understand how our two agencies can assist you and your counterparts develop and implement plans to ensure an adequate drinking water supply for future generations. We intend to go over the full range of questionnaire responses and hope to get a better understanding of the scope of the issue from you and other communities’ perspectives. Your attendance is strongly encouraged. Thank you for your participation and we look forward to seeing you at Big Bend Community College in Moses Lake on January 9. If you have any questions, please contact me at 360-236-3154, or via email at [email protected]. Sincerely,
Mike Dexel Water Resources Policy Lead Enclosures: Driving Directions to Big Bend Community College

Appendix E 2014 Columbia Basin Municipal Ground Water Open House
Sign in Sheet and Meeting Materials
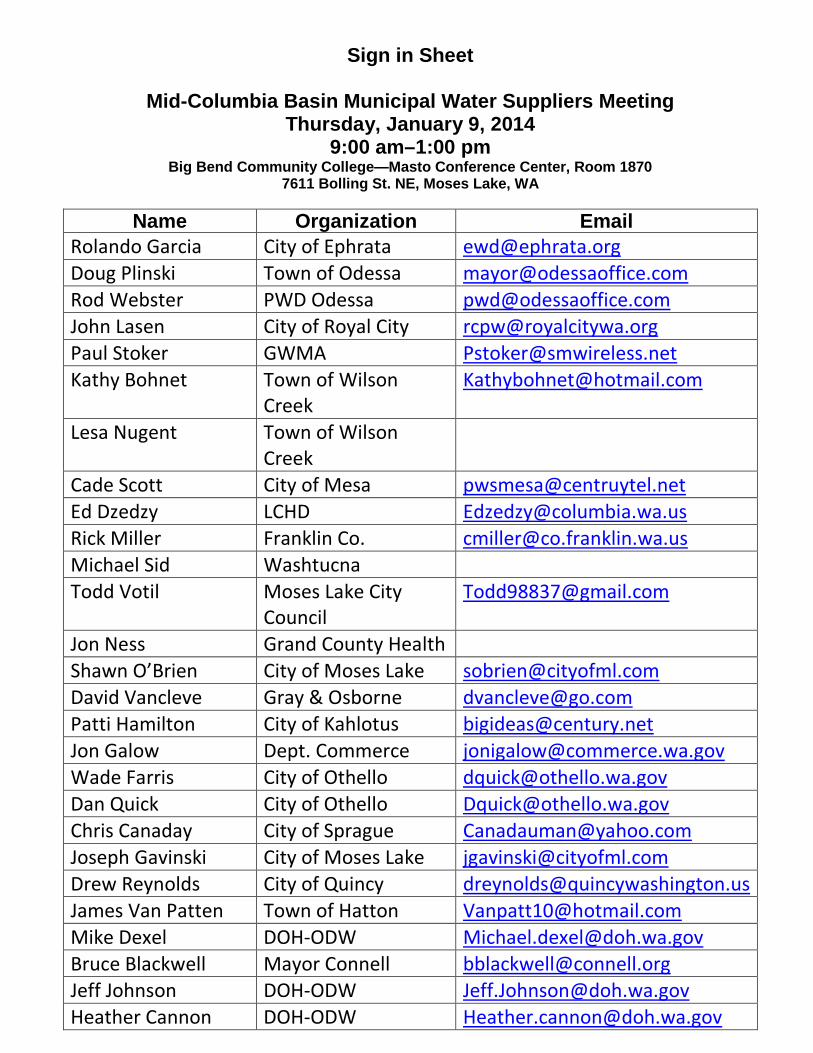
Sign in Sheet
Mid-Columbia Basin Municipal Water Suppliers Meeting Thursday, January 9, 2014
9:00 am–1:00 pm Big Bend Community College—Masto Conference Center, Room 1870
7611 Bolling St. NE, Moses Lake, WA
Name Organization Email Rolando Garcia City of Ephrata [email protected] Doug Plinski Town of Odessa [email protected] Rod Webster PWD Odessa [email protected] John Lasen City of Royal City [email protected] Paul Stoker GWMA [email protected] Kathy Bohnet Town of Wilson
Creek [email protected]
Lesa Nugent Town of Wilson Creek
Cade Scott City of Mesa [email protected] Ed Dzedzy LCHD [email protected] Rick Miller Franklin Co. [email protected] Michael Sid Washtucna Todd Votil Moses Lake City
Council [email protected]
Jon Ness Grand County Health Shawn O’Brien City of Moses Lake [email protected] David Vancleve Gray & Osborne [email protected] Patti Hamilton City of Kahlotus [email protected] Jon Galow Dept. Commerce [email protected] Wade Farris City of Othello [email protected] Dan Quick City of Othello [email protected] Chris Canaday City of Sprague [email protected] Joseph Gavinski City of Moses Lake [email protected] Drew Reynolds City of Quincy [email protected] James Van Patten Town of Hatton [email protected] Mike Dexel DOH-ODW [email protected] Bruce Blackwell Mayor Connell [email protected] Jeff Johnson DOH-ODW [email protected] Heather Cannon DOH-ODW [email protected]
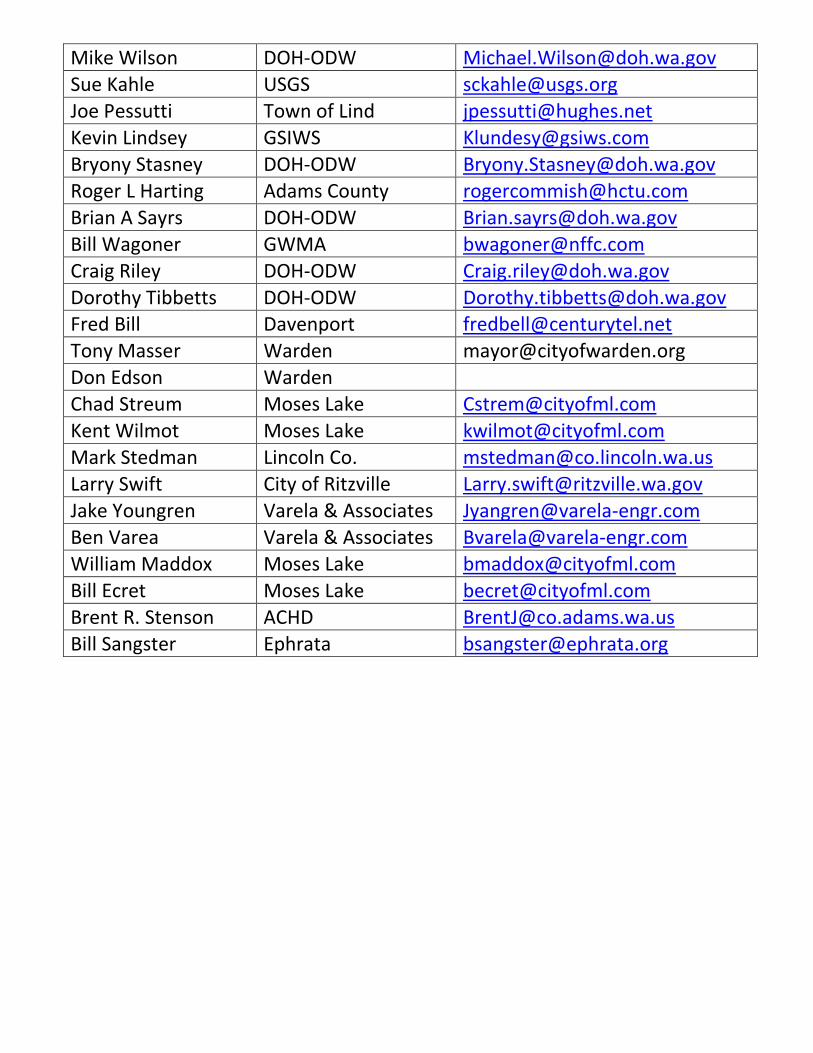
Mike Wilson DOH-ODW [email protected] Sue Kahle USGS [email protected] Joe Pessutti Town of Lind [email protected] Kevin Lindsey GSIWS [email protected] Bryony Stasney DOH-ODW [email protected] Roger L Harting Adams County [email protected] Brian A Sayrs DOH-ODW [email protected] Bill Wagoner GWMA [email protected] Craig Riley DOH-ODW [email protected] Dorothy Tibbetts DOH-ODW [email protected] Fred Bill Davenport [email protected] Tony Masser Warden [email protected] Don Edson Warden Chad Streum Moses Lake [email protected] Kent Wilmot Moses Lake [email protected] Mark Stedman Lincoln Co. [email protected] Larry Swift City of Ritzville [email protected] Jake Youngren Varela & Associates [email protected] Ben Varea Varela & Associates [email protected] William Maddox Moses Lake [email protected] Bill Ecret Moses Lake [email protected] Brent R. Stenson ACHD [email protected] Bill Sangster Ephrata [email protected]

Agenda Mid-Columbia Basin Municipal Water Suppliers Meeting
Thursday, January 9, 2014 9:00 am–1:00 pm
Big Bend Community College—Masto Conference Center, Room 1870 7611 Bolling St. NE, Moses Lake, WA
Time Topic Lead
9:00–9:30 Welcome and Introductions Ginny Stern
9:30–10:00 Goal of meeting Why We are Here & What to Expect:
• Overview of declining groundwater supply in Columbia basin.
• Summary of survey results.
Mike Dexel
10:00–10:25 Office of Drinking Water Perspective: • How DOH protects public health in a
declining water supply situation. • What our agency does and doesn’t do. • Planning for a sustainable water supply. • Overview of source capacity and future
demand.
Jeff Johnson/Dorothy Tibbetts
10:25–10:30 Preface to Group Discussions Ginny Stern
10:30–10:45 Break
10:45–12:00 Identify challenges in water supply and meeting current/future demand
Questions to discuss and answer:
• How are the changes in the aquifer affecting your water system?
• In the next 10-15 years, how will you adjust to changing water supply conditions?
• In terms of managing water supply, what are your most important next steps?
• What one thing would you want the most help with?
All (DOH staff help facilitate small group discussions)
12:00–12:45 Report back from each small group: • Capture the general themes.
Mike Dexel/Dorothy Tibbetts
12:40–1:00 Next steps: • Summarize what we heard. • Future one on one consultations. • Meeting evaluation.
Wrap-up: • Should we meet again?
Mike Dexel Ginny Stern
1:00 Adjourn
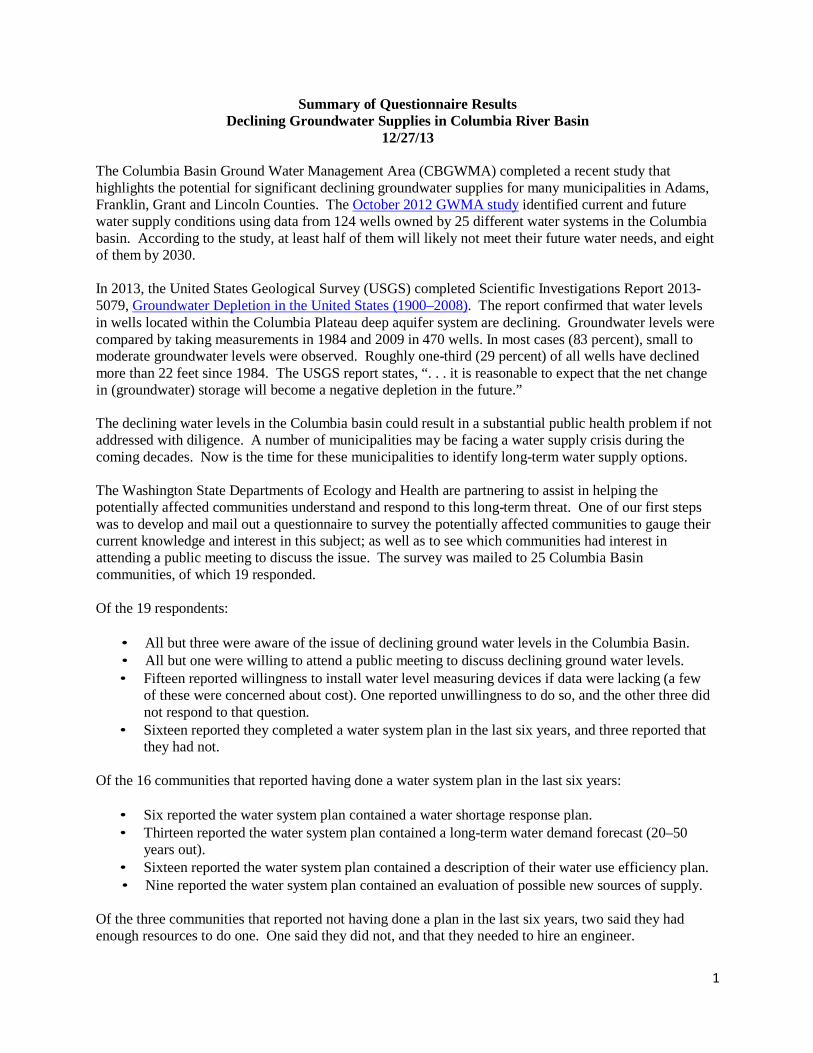
Summary of Questionnaire Results Declining Groundwater Supplies in Columbia River Basin
12/27/13
The Columbia Basin Ground Water Management Area (CBGWMA) completed a recent study that highlights the potential for significant declining groundwater supplies for many municipalities in Adams, Franklin, Grant and Lincoln Counties. The October 2012 GWMA study identified current and future water supply conditions using data from 124 wells owned by 25 different water systems in the Columbia basin. According to the study, at least half of them will likely not meet their future water needs, and eight of them by 2030.
In 2013, the United States Geological Survey (USGS) completed Scientific Investigations Report 2013- 5079, Groundwater Depletion in the United States (1900–2008). The report confirmed that water levels in wells located within the Columbia Plateau deep aquifer system are declining. Groundwater levels were compared by taking measurements in 1984 and 2009 in 470 wells. In most cases (83 percent), small to moderate groundwater levels were observed. Roughly one-third (29 percent) of all wells have declined more than 22 feet since 1984. The USGS report states, “. . . it is reasonable to expect that the net change in (groundwater) storage will become a negative depletion in the future.”
The declining water levels in the Columbia basin could result in a substantial public health problem if not addressed with diligence. A number of municipalities may be facing a water supply crisis during the coming decades. Now is the time for these municipalities to identify long-term water supply options.
The Washington State Departments of Ecology and Health are partnering to assist in helping the potentially affected communities understand and respond to this long-term threat. One of our first steps was to develop and mail out a questionnaire to survey the potentially affected communities to gauge their current knowledge and interest in this subject; as well as to see which communities had interest in attending a public meeting to discuss the issue. The survey was mailed to 25 Columbia Basin communities, of which 19 responded.
Of the 19 respondents:
• All but three were aware of the issue of declining ground water levels in the Columbia Basin. • All but one were willing to attend a public meeting to discuss declining ground water levels. • Fifteen reported willingness to install water level measuring devices if data were lacking (a few
of these were concerned about cost). One reported unwillingness to do so, and the other three did not respond to that question.
• Sixteen reported they completed a water system plan in the last six years, and three reported that they had not.
Of the 16 communities that reported having done a water system plan in the last six years:
• Six reported the water system plan contained a water shortage response plan. • Thirteen reported the water system plan contained a long-term water demand forecast (20–50
years out). • Sixteen reported the water system plan contained a description of their water use efficiency plan. • Nine reported the water system plan contained an evaluation of possible new sources of supply.
Of the three communities that reported not having done a plan in the last six years, two said they had enough resources to do one. One said they did not, and that they needed to hire an engineer.
1

Sixteen communities reported having not considered forming a local water supply partnership with nearby water supplies as a way to address declining groundwater supplies, and two communities have.
To the question, “Are you concerned about your existing sources of supply meeting current or future demands,” 11 communities said yes, and seven said no. In the notes following up to this question, a couple questionnaire participants mentioned the presentation that the GWMA had made to their city councils, and a couple said that they are in the process of drilling new wells to bolster water production. One of the larger communities said that their water level records (which go back to the 1950’s) show a steady decline, and that this is not sustainable.
Next Steps
Anticipated next steps include holding a public meeting on January 9, 2014 in Moses Lake. Following the public meeting, Department of Health staff intends to meet with each interested individual community, to discuss issues such as planning for alternative sources of supply, options for collecting and reporting water level data, and other matters related to the declining water supplies.
2

Columbia River Policy Advisory Group (CRPAG) June 19, 2013
The meeting began at 9:30 a.m. with a presentation by Junior Achievement. Facilitator Neil Aaland explained he was facilitating today’s meeting the place of Dan Silver. He also explained that the agenda was revised; Ecology Director Maia Bellon had to cancel her attendance because of the Governor’s direction that cabinet officials remain in Olympia during budget negotiations.
Threats to municipal supplies within the Columbia River basin
Mike Dexel and Russell Mau of the Washington Department of Health discussed this topic. A 2013 USGS report identified groundwater depletions all over the country, including the Columbia River basin. The recent GWMA studies have raised concern about the effects of declining water levels in the Columbia River basin and the effect on municipal water supplies. The Department of Health wanted to look closer at the GWMA data and determine how big a problem this is for each of the 25 municipalities in the GWMA study. Several cities were identified as having problems meeting future demand, some by 2030. The Department of Health is particularly concerned about source capacity and declining well levels for both Othello and Warden; Quincy has the ability to drill more wells to meet future demand in an area with less severe aquifer declines. The best way to manage this is to engage in water system planning, install water level measuring devices in the highest source production municipal wells to monitor declines and evaluate new sources of supply. Unpopular but available tools to manage water level declines include capping growth and limiting connections. The town of Warden only has one well which has a water level that is declining 13.4 feet yearly. They have two emergency wells. One possible solution is to transfer an agricultural right to municipal supply purposes. This would create a new season of use. The Department of Health plans to reach out to all 25 municipalities this year, especially those that are facing water supply challenges in an effort to evaluate their ability to respond to a water supply shortage.
CRPAG members and the audience had the following questions and observations:
• Is there any sense of supply issues in other areas of the state? [There are some issues around Airway Heights; they need to consider their options.]
• In Ritzville, DOH had concerns about letting them use the shallow aquifer due to high nitrate levels.
• How does conservation and Best Management Practices (BMPs) fit? [They are required to asses those as part of planning; they have to show three different demand curves based on water conservation alternatives. Municipal conservation is part of the picture to meet demand, but can’t solve the problem. Communities also have to address leakage.]
• Other than the 25 municipalities in the GWMA study, what is DOH doing about the other Group A or Group B water systems in the study area? [DOH is gathering information about these water systems, such as homeowners associations. The plan is to make sure they are informed of the declining water supplies.]
• Are the communities mentioned on the path to address their situation? [Warden is currently working on updating a water system plan, Othello not sure; Moses Lake is monitoring well levels and deepened their existing wells.]
• What about rural customers? [DOH is looking at all users in the GWMA.] • Why is the solution for this problem partnering with OCR? [OCR started evaluating this due to
the legislative direction regarding the Odessa aquifer; it’s not limited to agricultural wells. Municipal systems may be at risk and the state (OCR and DOH) want to be in a position to help before it’s too late.]
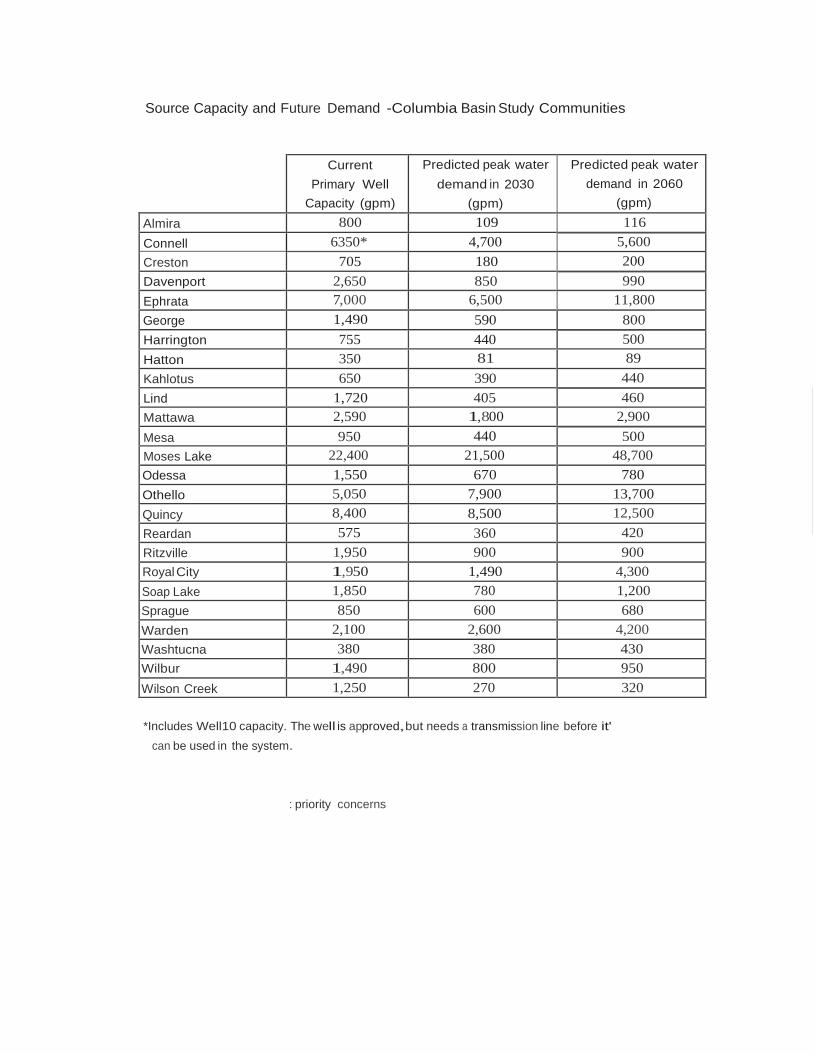
Source Capacity and Future Demand -Columbia Basin Study Communities
Current Primary Well
Capacity (gpm)
Predicted peak water demand in 2030
(gpm)
Predicted peak water demand in 2060
(gpm) Almira 800 109 116 Connell 6350* 4,700 5,600 Creston 705 180 200 Davenport 2,650 850 990 Ephrata 7,000 6,500 11,800 George 1,490 590 800 Harrington 755 440 500 Hatton 350 81 89 Kahlotus 650 390 440 Lind 1,720 405 460 Mattawa 2,590 1,800 2,900 Mesa 950 440 500 Moses Lake 22,400 21,500 48,700 Odessa 1,550 670 780 Othello 5,050 7,900 13,700 Quincy 8,400 8,500 12,500 Reardan 575 360 420 Ritzville 1,950 900 900 Royal City 1,950 1,490 4,300 Soap Lake 1,850 780 1,200 Sprague 850 600 680 Warden 2,100 2,600 4,200 Washtucna 380 380 430 Wilbur 1,490 800 950 Wilson Creek 1,250 270 320
*Includes Well10 capacity. The well is approved,but needs a transmission line before it'
can be used in the system.
: priority concerns

Almira
Capacity
(gpm) Water Level
Decline (ft/yr) 2060 Future projected
pumping DTW (ft) Total Depth
(ft) Well 1 decom --- --- 200 Well 2 150 1.5 214 150 Well 3 179 2.6 132 to 282 no data Well 4 650 1.4 no data 377
Current Primary Well
Capacity (gpm)
Predicted peak water demand in 2030
(gpm)
Predicted peak water demand in 2060
(gpm) 800 109 116
-This system appears to have plenty of source capacity through 2060. -Well 2 may go dry before 2060 due to aquifer decline. This would impact redundancy. -Data needs:
-Measure DTW in Well 4 (hasn't been measured since initial DTW 1991) -Measure static and pumping water levels in the wells quarterly. -Measure total depth for Well 3
Legend:
Permanent Well Emergency Well Inactive/Decommissioned Well Lincoln Co
DTW = Depth to Water

Connell
Capacity
(gpm) Water Level
Decline (ft/yr) 2060 Future projected
pumping DTW (ft) Total Depth
(ft) Well 1 110 no data no data no data Well 2 200 no data no data no data Well 3 200 0.7 435 502 Well 4 550 4.4 640 to 833 1,105 Well 5 600 2.3 670 to 719 990 Well 6 450 3.8 623 1,000 Well 8 1850 5.6 853 to 870 1,325 Well 9B 1100 1.1 no data 527 Well 10 1800 0.2 no data 1,295 *Well 10 is approved, but needs a transmission line before it can be used in the system
Current
Primary Well Capacity (gpm)
Predicted peak water demand in 2030
(gpm)
Predicted peak water demand in 2060
(gpm) 6350** 4,700 5,600
**includes Well 10 capacity
-This system appears to have plenty of source capacity through 2060. -A transmission line would need to be built to access Well 10 capacity. -Wells 4 and 8 may have a pumping DTW of greater than 800 feet before 2060. -Data needs:
-Measure static and pumping water levels in all the wells quarterly.
Legend:
Permanent Well Emergency Well Inactive/Decommissioned Well Franklin Co
DTW = Depth to Water

Creston
Capacity
(gpm) Water Level
Decline (ft/yr) 2060 Future projected
pumping DTW (ft) Total Depth
(ft) Well 1 (South) 155 0 no data 288 Well 2 (North) 550 0.9 no data 766
Current Primary Well
Capacity (gpm)
Predicted peak water demand in 2030
(gpm)
Predicted peak water demand in 2060
(gpm) 705 180 200
-This system appears to have plenty of source capacity through 2060. -Nitrate levels in both wells have exceeded 10 ppm in the past, and are currently
in the 6 to 7 ppm range. -Data needs:
-Measure static and pumping water levels in both wells quarterly.
Legend:
Permanent Well Emergency Well Inactive/Decommissioned Well Lincoln Co
DTW = Depth to Water

Davenport
Capacity
(gpm) Water Level
Decline (ft/yr) 2060 Future projected
pumping DTW (ft) Total Depth
(ft) Well 1 no data 1.1 no data 360 Well 2 200 2 no data 495 Well 3 decom --- decom 722 Well 4 decom --- decom 302 Well 5 decom --- decom 501 Well 6 1600 0.7 355 to 740 975 Well 7 1050 5.2 no data 959
Current Primary Well
Capacity (gpm)
Predicted peak water demand in 2030
(gpm)
Predicted peak water demand in 2060
(gpm) 2,650 850 990
-This system appears to have plenty of source capacity through 2060. -Data needs:
-Measure static and pumping water levels in all the wells quarterly.
Legend:
Permanent Well Emergency Well Inactive/Decommissioned Well Lincoln Co
DTW = Depth to Water
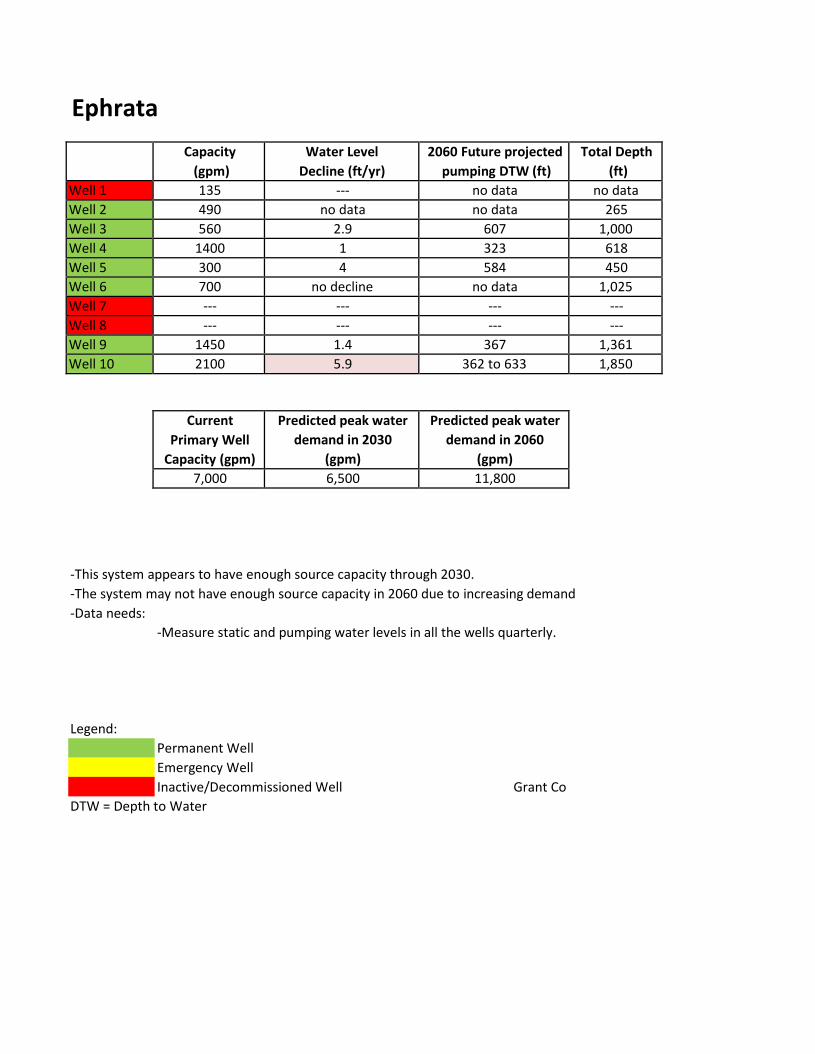
Ephrata
Capacity
(gpm) Water Level
Decline (ft/yr) 2060 Future projected
pumping DTW (ft) Total Depth
(ft) Well 1 135 --- no data no data Well 2 490 no data no data 265 Well 3 560 2.9 607 1,000 Well 4 1400 1 323 618 Well 5 300 4 584 450 Well 6 700 no decline no data 1,025 Well 7 --- --- --- --- Well 8 --- --- --- --- Well 9 1450 1.4 367 1,361 Well 10 2100 5.9 362 to 633 1,850
Current Primary Well
Capacity (gpm)
Predicted peak water demand in 2030
(gpm)
Predicted peak water demand in 2060
(gpm) 7,000 6,500 11,800
-This system appears to have enough source capacity through 2030. -The system may not have enough source capacity in 2060 due to increasing demand -Data needs:
-Measure static and pumping water levels in all the wells quarterly.
Legend:
Permanent Well Emergency Well Inactive/Decommissioned Well Grant Co
DTW = Depth to Water

George
Capacity
(gpm) Water Level
Decline (ft/yr) 2060 Future projected
pumping DTW (ft) Total Depth
(ft) Well 1 616 0.5 128 188 Well 2 308 0.5 no data 177 Well 3 875 no data no data 416
Current Primary Well
Capacity (gpm)
Predicted peak water demand in 2030
(gpm)
Predicted peak water demand in 2060
(gpm) 1,490 590 800
-This system appears to have plenty of source capacity through 2060. -Data needs:
-Measure static and pumping water levels in the wells quarterly.
Legend:
Permanent Well Emergency Well Inactive/Decommissioned Well Grant Co
DTW = Depth to Water
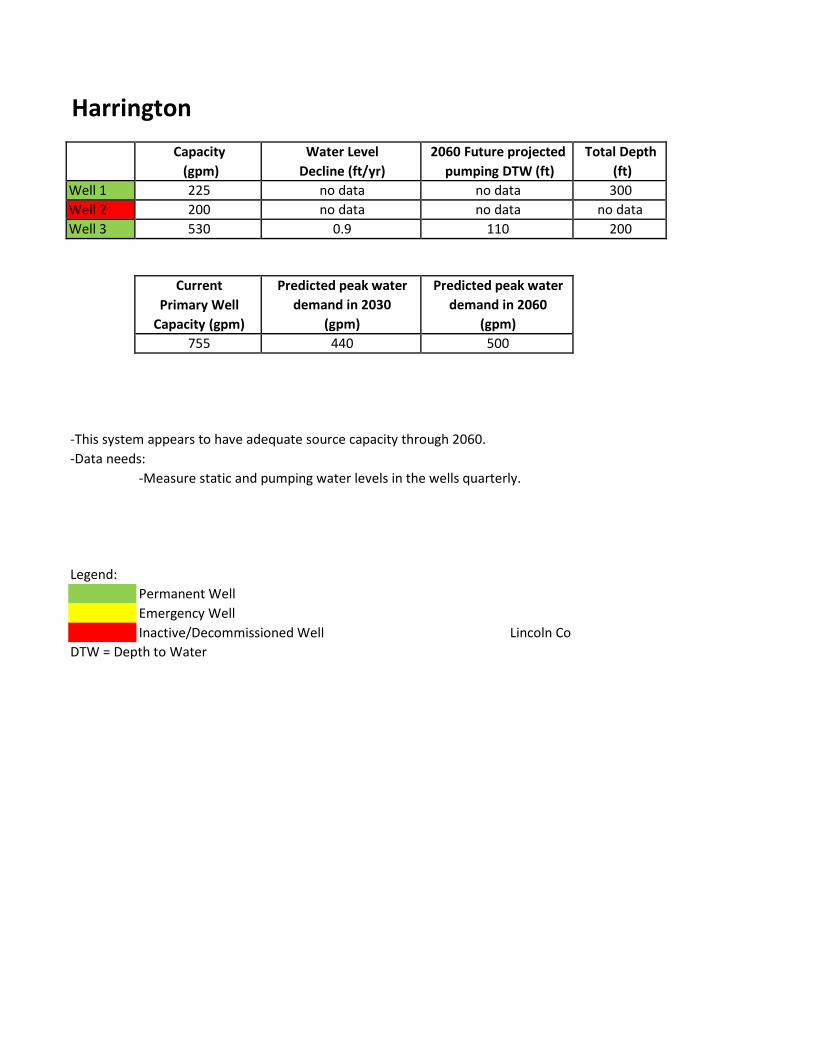
Harrington
Capacity
(gpm) Water Level
Decline (ft/yr) 2060 Future projected
pumping DTW (ft) Total Depth
(ft) Well 1 225 no data no data 300 Well 2 200 no data no data no data Well 3 530 0.9 110 200
Current Primary Well
Capacity (gpm)
Predicted peak water demand in 2030
(gpm)
Predicted peak water demand in 2060
(gpm) 755 440 500
-This system appears to have adequate source capacity through 2060. -Data needs:
-Measure static and pumping water levels in the wells quarterly.
Legend:
Permanent Well Emergency Well Inactive/Decommissioned Well Lincoln Co
DTW = Depth to Water

Hatton
Capacity
(gpm) Water Level
Decline (ft/yr) 2060 Future projected
pumping DTW (ft) Total Depth
(ft) Little Well (1) 100 6.3 no data no data Big Well (2) 250 1.5 no data 700
Current Primary Well
Capacity (gpm)
Predicted peak water demand in 2030
(gpm)
Predicted peak water demand in 2060
(gpm) 350 81 89
-This system appears to have plenty of source capacity through 2060. -Data needs:
-Measure total depth of Little Well -Measure static and pumping water levels in both wells quarterly.
Legend:
Permanent Well Emergency Well Inactive/Decommissioned Well Adams Co
DTW = Depth to Water
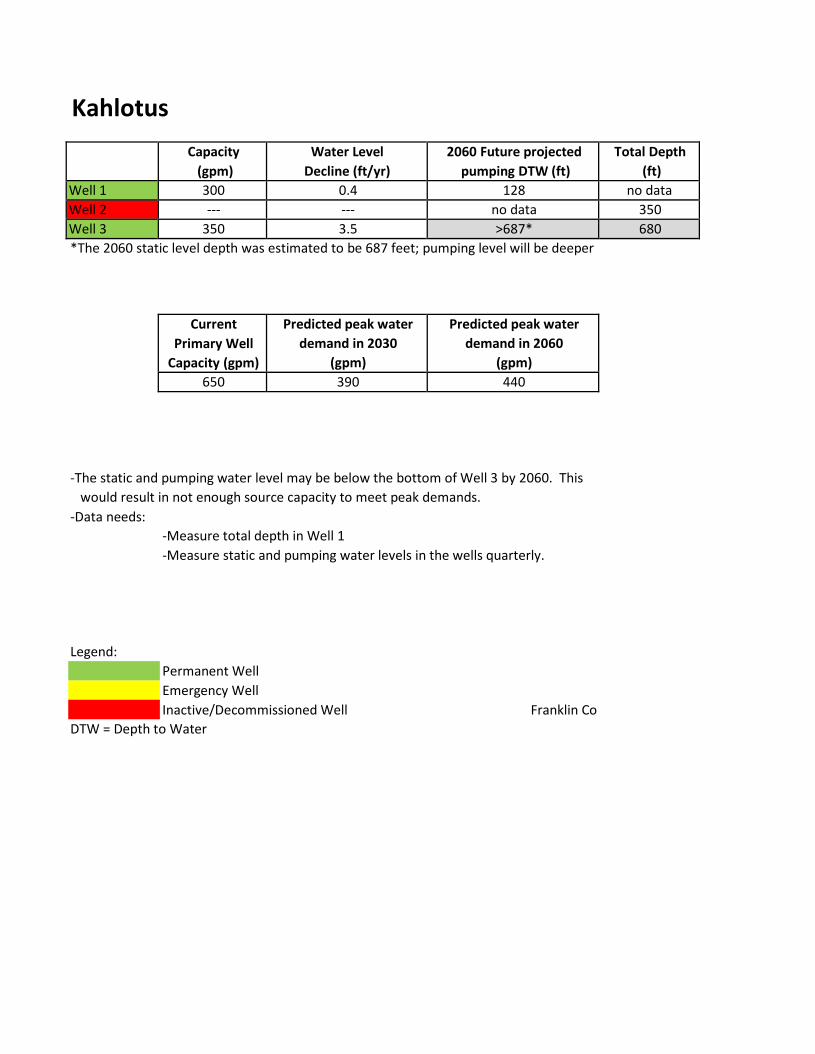
Kahlotus
Capacity
(gpm) Water Level
Decline (ft/yr) 2060 Future projected
pumping DTW (ft) Total Depth
(ft) Well 1 300 0.4 128 no data Well 2 --- --- no data 350 Well 3 350 3.5 >687* 680 *The 2060 static level depth was estimated to be 687 feet; pumping level will be deeper
Current Primary Well
Capacity (gpm)
Predicted peak water demand in 2030
(gpm)
Predicted peak water demand in 2060
(gpm) 650 390 440
-The static and pumping water level may be below the bottom of Well 3 by 2060. This would result in not enough source capacity to meet peak demands.
-Data needs: -Measure total depth in Well 1 -Measure static and pumping water levels in the wells quarterly.
Legend:
Permanent Well Emergency Well Inactive/Decommissioned Well Franklin Co
DTW = Depth to Water

Lind
Capacity
(gpm) Water Level
Decline (ft/yr) 2060 Future projected
pumping DTW (ft) Total Depth
(ft) Well 1 --- --- --- 286 Well 2 --- --- --- --- Well 3 300 no data no data 382 Well 4 --- --- --- 204 Well 6 520 1 no data 747 Well 7 520 0.7 778 to 857 1,020 Well 8 1200 5.2 621 2,034
Current Primary Well
Capacity (gpm)
Predicted peak water demand in 2030
(gpm)
Predicted peak water demand in 2060
(gpm) 1,720 405 460
-This system appears to have plenty of source capacity through 2060. -The 2060 pumping level in Well 7 may deeper than 800 feet. -High drawdown in 2012 is limiting current pumping capacity. -Data needs:
-Measure static and pumping water levels in all the wells quarterly.
Legend:
Permanent Well Emergency Well Inactive/Decommissioned Well Adams Co
DTW = Depth to Water
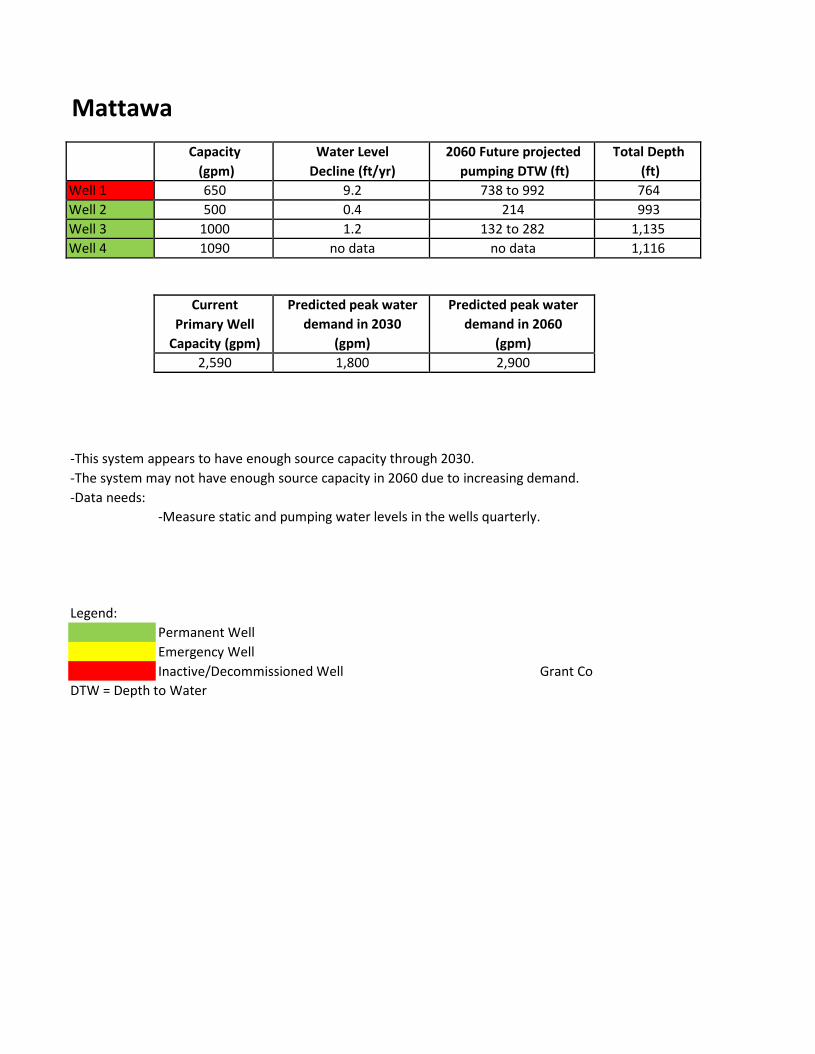
Mattawa
Capacity
(gpm) Water Level
Decline (ft/yr) 2060 Future projected
pumping DTW (ft) Total Depth
(ft) Well 1 650 9.2 738 to 992 764 Well 2 500 0.4 214 993 Well 3 1000 1.2 132 to 282 1,135 Well 4 1090 no data no data 1,116
Current Primary Well
Capacity (gpm)
Predicted peak water demand in 2030
(gpm)
Predicted peak water demand in 2060
(gpm) 2,590 1,800 2,900
-This system appears to have enough source capacity through 2030. -The system may not have enough source capacity in 2060 due to increasing demand. -Data needs:
-Measure static and pumping water levels in the wells quarterly.
Legend:
Permanent Well Emergency Well Inactive/Decommissioned Well Grant Co
DTW = Depth to Water

Mesa
Capacity
(gpm) Water Level
Decline (ft/yr) 2060 Future projected
pumping DTW (ft) Total Depth
(ft) Well 1 500 no data no data 100 Well 2 450 no data no data 163
Current Primary Well
Capacity (gpm)
Predicted peak water demand in 2030
(gpm)
Predicted peak water demand in 2060
(gpm) 950 440 500
-This system appears to have plenty of source capacity through 2060. -Data needs:
-Measure static and pumping water levels in both wells quarterly.
Legend:
Permanent Well Emergency Well Franklin Co Inactive/Decommissioned Well
DTW = Depth to Water

Moses Lake
Capacity (gpm)
Water Level Decline (ft/yr)
2060 Future projected pumping DTW (ft)
Total Depth (ft)
3 1,000 3.5 499 909 4 1,050 4.3 505 to 533 1,000 5 --- --- --- 786 7 1,000 2.5 152 950 8 750 1.9 409 1,049 9 1,200 7.5 903 1,100
10 1,400 2.6 349 to 451 692 11 850 --- --- --- 12 1,900 0.4 >463 585 13 --- --- --- --- 14 1,000 6.5 750 1,025 17 2,000 11 605 to 1,031 1,240 18 2,000 2.8 463 585 19 700 1.8 --- ---
19R 825 no data no data 755 21 650 2.2 235 to 311 730 22 --- --- --- 719 23 1,400 1.4 281 791 24 2,000 2.2 253 to 311 730 28 1,700 1.8 no data 750 29 750 1.4 no data 134 31 850 8.17 --- ---
31R 950 no data no data 970 32 --- --- --- --- 33 1,000 3.6 no data 800
Current
Primary Well Capacity (gpm)
Predicted peak water demand in 2030
(gpm)
Predicted peak water demand in 2060
(gpm) 22,400 21,500 48,700
-This system appears to have enough source capacity through 2030. -The system may not have enough source capacity in 2060 due to increasing demand, and
possibly also due to decreasing aquifer water levels. -Data needs:
-Measure static and pumping water levels in all the wells quarterly.
Legend:
Permanent Well Emergency Well Inactive/Decommissioned Well Grant Co
DTW = Depth to Water

Odessa
Capacity
(gpm) Water Level
Decline (ft/yr) 2060 Future projected
pumping DTW (ft) Total Depth
(ft) Well 1 --- --- --- --- Well 2 300 --- --- --- Well 3 600 5.1 750 595 Well 4 950 0.9 218 to 234 660
Current Primary Well
Capacity (gpm)
Predicted peak water demand in 2030
(gpm)
Predicted peak water demand in 2060
(gpm) 1,550 670 780
-This system appears to have plenty of source capacity through 2060. -Well 3 may become unusable before 2060 due to the declining aquifer level. The
system would still have enough source to meet peak demands, but this would impact reliability.
-Data needs: -Measure static and pumping water levels in the wells quarterly.
Legend:
Permanent Well Emergency Well Inactive/Decommissioned Well Lincoln Co
DTW = Depth to Water

Othello
Capacity
(gpm) Water Level
Decline (ft/yr) 2060 Future projected
pumping DTW (ft) Total Depth
(ft) Well 2 350 1.2 no data 697 Well 3 1,300 1.5 no data 900 Well 4 3,500 no data no data 976 Well 5 500 1.1 526 1,007 Well 6 1,300 7 no data 1,005 Well 7 800 no data 875 820 Well 8 800 1.6 615 853
Current Primary Well
Capacity (gpm)
Predicted peak water demand in 2030
(gpm)
Predicted peak water demand in 2060
(gpm) 5,050 7,900 13,700
-This system appears to not have enough source capacity through 2030 because of increased demand.
-The 2060 pumping level in Well 7 may deeper than 800 feet. -Data needs:
-Measure static and pumping water levels in all the wells quarterly.
Legend:
Permanent Well Emergency Well Inactive/Decommissioned Well Adams Co
DTW = Depth to Water

Quincy
Capacity
(gpm) Water Level
Decline (ft/yr) 2060 Future projected
pumping DTW (ft) Total Depth
(ft) Well 1 1,050 no data no data 431 Well 2 1,250 no data no data no data Well 3 1,400 no decline no data 406 Well 4 2,500 0.6 258 392 Well 5 2,200 no decline no data 381
Current Primary Well
Capacity (gpm)
Predicted peak water demand in 2030
(gpm)
Predicted peak water demand in 2060
(gpm) 8,400 8,500 12,500
-This system appears to not have enough source capacity through 2030 because of increased demand.
-Data needs: -Measure static and pumping water levels in all the wells quarterly.
Legend:
Permanent Well Emergency Well Inactive/Decommissioned Well Grant Co
DTW = Depth to Water

Reardan
Capacity
(gpm) Water Level
Decline (ft/yr) 2060 Future projected
pumping DTW (ft) Total Depth
(ft) Well 2 20 --- --- --- Well 5 75 --- --- --- Well 6 225 0.4 161 300 Well 7 40 --- --- --- Well 8 575 no data no data 452
Current Primary Well
Capacity (gpm)
Predicted peak water demand in 2030
(gpm)
Predicted peak water demand in 2060
(gpm) 575 360 420
-This system appears to not have enough source capacity through 2060. -Data needs:
-Measure static and pumping water levels in all the wells quarterly.
Legend:
Permanent Well Emergency Well Inactive/Decommissioned Well Lincoln Co
DTW = Depth to Water
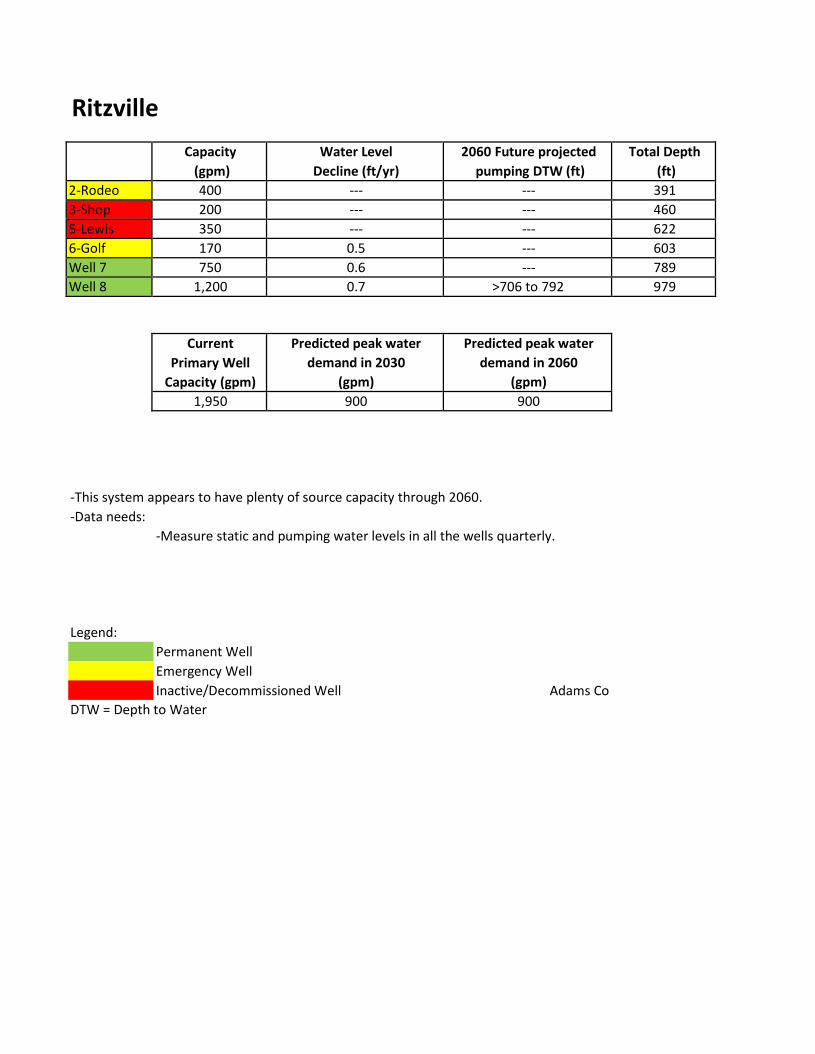
Ritzville
Capacity
(gpm) Water Level
Decline (ft/yr) 2060 Future projected
pumping DTW (ft) Total Depth
(ft) 2-Rodeo 400 --- --- 391 3-Shop 200 --- --- 460 5-Lewis 350 --- --- 622 6-Golf 170 0.5 --- 603 Well 7 750 0.6 --- 789 Well 8 1,200 0.7 >706 to 792 979
Current Primary Well
Capacity (gpm)
Predicted peak water demand in 2030
(gpm)
Predicted peak water demand in 2060
(gpm) 1,950 900 900
-This system appears to have plenty of source capacity through 2060. -Data needs:
-Measure static and pumping water levels in all the wells quarterly.
Legend:
Permanent Well Emergency Well Inactive/Decommissioned Well Adams Co
DTW = Depth to Water
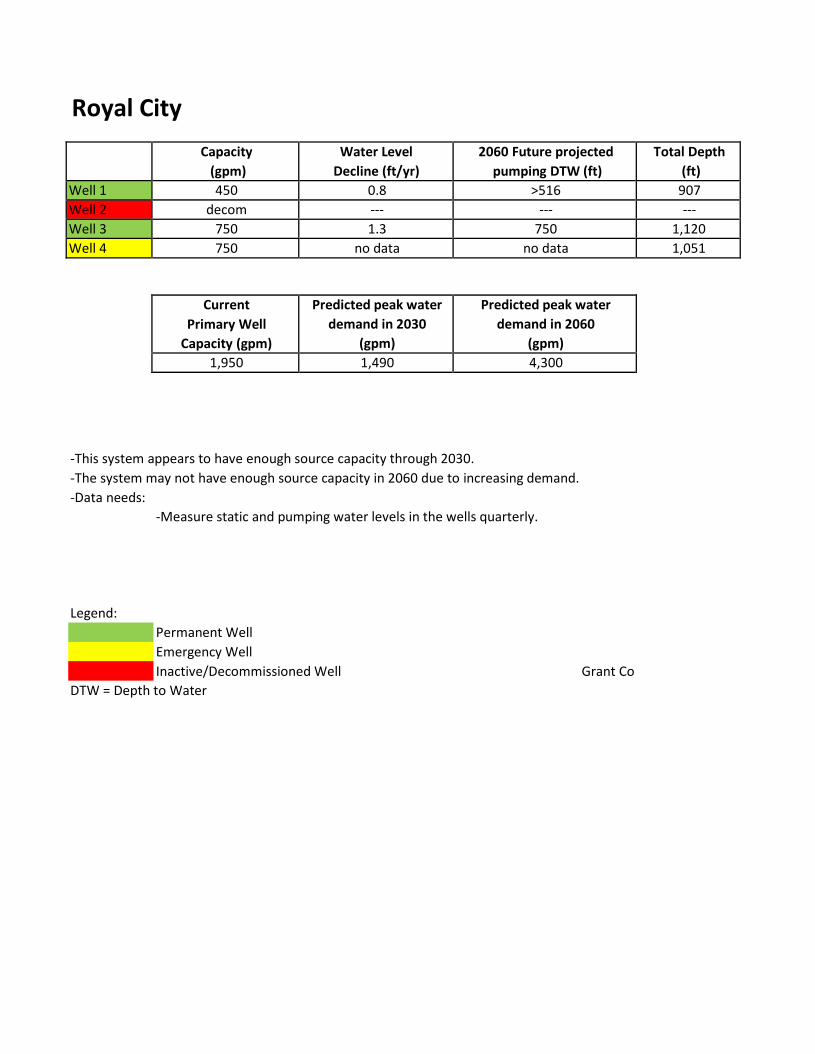
Royal City
Capacity
(gpm) Water Level
Decline (ft/yr) 2060 Future projected
pumping DTW (ft) Total Depth
(ft) Well 1 450 0.8 >516 907 Well 2 decom --- --- --- Well 3 750 1.3 750 1,120 Well 4 750 no data no data 1,051
Current Primary Well
Capacity (gpm)
Predicted peak water demand in 2030
(gpm)
Predicted peak water demand in 2060
(gpm) 1,950 1,490 4,300
-This system appears to have enough source capacity through 2030. -The system may not have enough source capacity in 2060 due to increasing demand. -Data needs:
-Measure static and pumping water levels in the wells quarterly.
Legend:
Permanent Well Emergency Well Inactive/Decommissioned Well Grant Co
DTW = Depth to Water
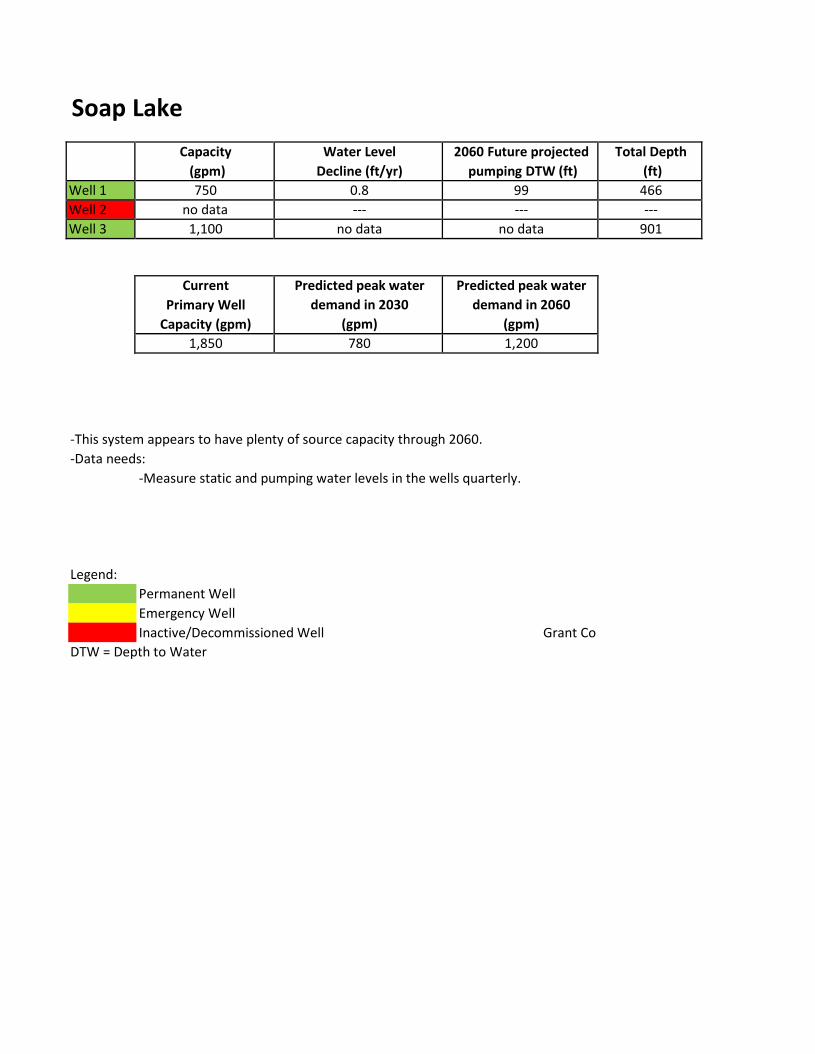
Soap Lake
Capacity
(gpm) Water Level
Decline (ft/yr) 2060 Future projected
pumping DTW (ft) Total Depth
(ft) Well 1 750 0.8 99 466 Well 2 no data --- --- --- Well 3 1,100 no data no data 901
Current Primary Well
Capacity (gpm)
Predicted peak water demand in 2030
(gpm)
Predicted peak water demand in 2060
(gpm) 1,850 780 1,200
-This system appears to have plenty of source capacity through 2060. -Data needs:
-Measure static and pumping water levels in the wells quarterly.
Legend:
Permanent Well Emergency Well Inactive/Decommissioned Well Grant Co
DTW = Depth to Water
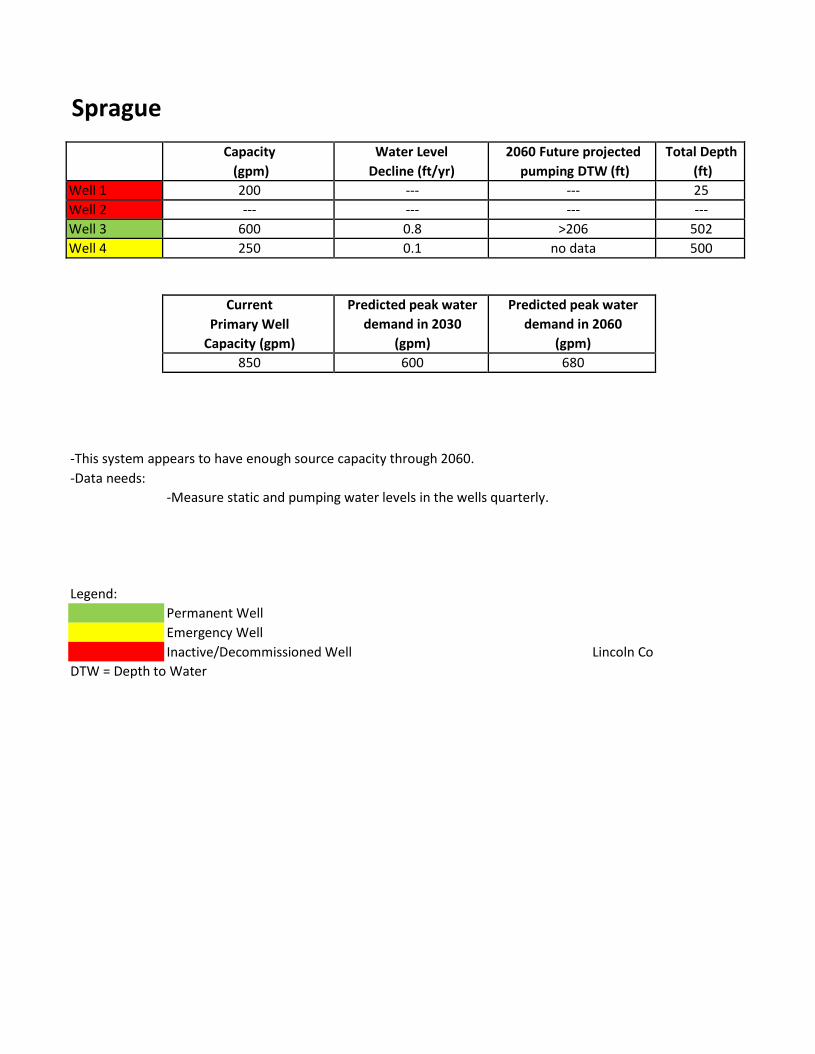
Sprague
Capacity
(gpm) Water Level
Decline (ft/yr) 2060 Future projected
pumping DTW (ft) Total Depth
(ft) Well 1 200 --- --- 25 Well 2 --- --- --- --- Well 3 600 0.8 >206 502 Well 4 250 0.1 no data 500
Current Primary Well
Capacity (gpm)
Predicted peak water demand in 2030
(gpm)
Predicted peak water demand in 2060
(gpm) 850 600 680
-This system appears to have enough source capacity through 2060. -Data needs:
-Measure static and pumping water levels in the wells quarterly.
Legend:
Permanent Well Emergency Well Inactive/Decommissioned Well Lincoln Co
DTW = Depth to Water

Warden
Capacity
(gpm) Water Level
Decline (ft/yr) 2060 Future projected
pumping DTW (ft) Total Depth
(ft) Well 4 decom --- --- 319 Well 5 1,600 1.9 382 368 Well 6 1,250 no decline no data 830 Well 7 2,100 16.8 1,151 857
Current Primary Well
Capacity (gpm)
Predicted peak water demand in 2030
(gpm)
Predicted peak water demand in 2060
(gpm) 2,100 2,600 4,200
-This system appears to not have enough source capacity through 2030 due to decreasing aquifer levels and increasing demand.
-Data needs: -Measure static and pumping water levels in the wells quarterly.
Legend:
Permanent Well Emergency Well Inactive/Decommissioned Well Grant Co
DTW = Depth to Water

Washtucna
Capacity
(gpm) Water Level
Decline (ft/yr) 2060 Future projected
pumping DTW (ft) Total Depth
(ft) #1(spring) 100 --- --- --- Well 2 160 0.1 no data 472 Well 3 280 3.9 >500 536
Current Primary Well
Capacity (gpm)
Predicted peak water demand in 2030
(gpm)
Predicted peak water demand in 2060
(gpm) 380 380 430
-This system appears to have plenty of source capacity through 2030. -This system appears to not have enough source capacity through 2060 due to increased demand. -Data needs:
-Measure static and pumping water levels in the wells quarterly.
Legend:
Permanent Well Emergency Well Inactive/Decommissioned Well Adams Co
DTW = Depth to Water

Wilbur
Capacity
(gpm) Water Level
Decline (ft/yr) 2060 Future projected
pumping DTW (ft) Total Depth
(ft) Well 2 500 no data no data 502 Well 3 840 0.7 250 294 Well 4 650 1.44 no data 375
Current Primary Well
Capacity (gpm)
Predicted peak water demand in 2030
(gpm)
Predicted peak water demand in 2060
(gpm) 1,490 800 950
-This system appears to have plenty of source capacity through 2060. -Data needs:
-Measure static and pumping water levels in the wells quarterly.
Legend:
Permanent Well Emergency Well Inactive/Decommissioned Well Lincoln Co
DTW = Depth to Water
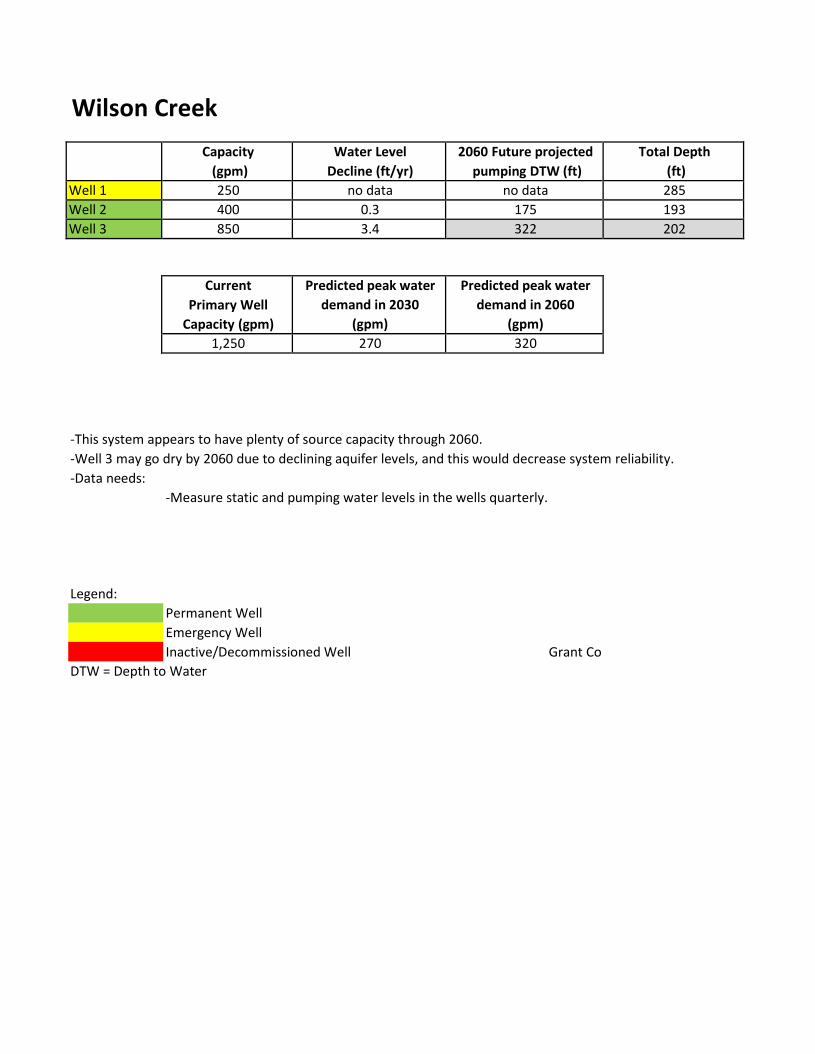
Wilson Creek
Capacity
(gpm) Water Level
Decline (ft/yr) 2060 Future projected
pumping DTW (ft) Total Depth
(ft) Well 1 250 no data no data 285 Well 2 400 0.3 175 193 Well 3 850 3.4 322 202
Current Primary Well
Capacity (gpm)
Predicted peak water demand in 2030
(gpm)
Predicted peak water demand in 2060
(gpm) 1,250 270 320
-This system appears to have plenty of source capacity through 2060. -Well 3 may go dry by 2060 due to declining aquifer levels, and this would decrease system reliability. -Data needs:
-Measure static and pumping water levels in the wells quarterly.
Legend:
Permanent Well Emergency Well Inactive/Decommissioned Well Grant Co
DTW = Depth to Water

How are the changes in the aquifer
affecting your water system?
• Have you noticed any impacts? • What types of things have you seen? (Impacts or challenges) • How do you expect it to change in the next 10–15 years? • Do you have the capacity to measure the impacts you think you are
seeing or expecting to see? • What do you need to be able to track impacts or address challenges?
In the next 10–15 years, how will you adjust to changing water supply conditions?
• What are your assumptions about future supply and demand? • What would success look like for your system? (I know I am making
progress because . . . ) • What would you have done between now and then to be successful? • What’s missing to make you successful? • What alternatives are you willing to consider to achieve success? • What is the biggest barrier?

In terms of managing water supply, what
are your most important next steps?
• My systems priorities include the following three things? • The first thing I want to work on is . . .

What one thing would you want the most
help with?
• Who do you think you expect to turn to for that help? • Is there a timeline?

Appendix F 2014 Columbia Basin Municipal Ground Water Open House
Small Group Response Summary, Tables, and Conclusion

2014 Columbia Basin Municipal Ground Water Open House Small Group Responses
The 2014 Columbia Basin Municipal Ground Water Open House provided invaluable
information on several key issues surrounding water supply management and aquifer change
response and planning in the Columbia Basin. The small group sessions and discussions yielded
these (summarized, full responses following) responses to the worksheet:
How are the changes in the aquifer affecting your water system?
Water systems are experiencing pumping level declines
o Therefore there is a need to track and compare across systems within each county
o Many systems, including very small systems not represented at the Open House
are also impacted by aquifer change
The public, legislators, and decision makers need to be alerted about this issue
o Alarmist messaging must be avoided
o Departments of Ecology and Health have a role to play in this messaging
Well monitoring is a positive action, but an unfunded mandate for monitoring is not
wanted or seen as feasible
In the next 10-15 years, how will you adjust to changing water supply conditions?
Examine and respond to demand
o Adjust rate structures to adequately encompass demand
o Provide quality community education so that the public understands the necessity
of rate changes
Implement upgrades to systems and towns
o Proactively install new wells
o Install additional shallow wells
Employ regional solutions
o Utilize Billy Clap Lake
o Ephrata expressed interest in using an injections well to reclaim water (and
enhance storage and recovery)
Secure further funding
o Alternate sources and new technologies, such as ASR, surface water, can be cost
prohibitive
o Funding is also needed for community education, communications, etc.
o Political and legislative changes are necessary to take action and make further
funding available
Flexibility from Ecology will be necessary, particularly regarding water rights, transfers,
etc.
In terms of managing water supply, what are your most important next steps?
Providing quality water is the top priority
o This involves the creation of a 15 year plan that encompasses planning for
infrastructure needs and economic development
o Water systems will work with GWMA
Implement infrastructure maintenance and upgrades
o Reduce leaks through conservation and WUE
o Add storage in addition to adding new wells
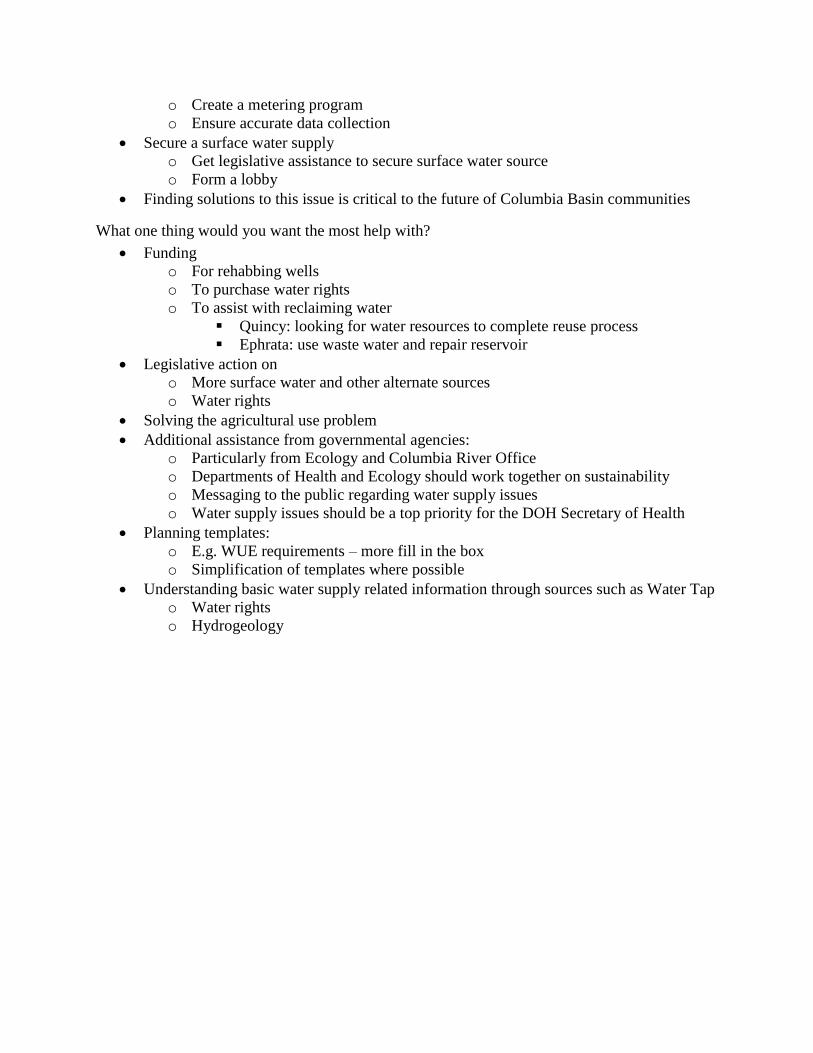
o Create a metering program
o Ensure accurate data collection
Secure a surface water supply
o Get legislative assistance to secure surface water source
o Form a lobby
Finding solutions to this issue is critical to the future of Columbia Basin communities
What one thing would you want the most help with?
Funding
o For rehabbing wells
o To purchase water rights
o To assist with reclaiming water
Quincy: looking for water resources to complete reuse process
Ephrata: use waste water and repair reservoir
Legislative action on
o More surface water and other alternate sources
o Water rights
Solving the agricultural use problem
Additional assistance from governmental agencies:
o Particularly from Ecology and Columbia River Office
o Departments of Health and Ecology should work together on sustainability
o Messaging to the public regarding water supply issues
o Water supply issues should be a top priority for the DOH Secretary of Health
Planning templates:
o E.g. WUE requirements – more fill in the box
o Simplification of templates where possible
Understanding basic water supply related information through sources such as Water Tap
o Water rights
o Hydrogeology

Table 1: Ritzville, Lind, Sprague, and Hatton.
Notes typed by Andy Cervantes
Adams County Sprague
Roger Hartwig, Commissioner Chris Canady
Brent Stenson, ACHD
Consultant Lind
Jake Youngren Joseph Pesutti
Ben Varela
Ritzville Hatton
Larry Swift, Public Works James Van Patten, Councilman
Question 1: What one thing would you want the most help with
Comments Background Meaning Aha’s or Realizations
Better access to state and
federal field or support staff
Changes in rules, policies,
etc.
▫ Fluoride MCL changes
There are many agencies,
rules, policies, and so on out
there. It is difficult to get a
handle on everything, and it
would be better to get more
face time with the regulating
agencies or staff.
In looking at the
characteristics of the table,
they were grouped by county
and location and or route to
get to.
One key point identified is the
information being shared in
this format, even just at the
table, provided an ideal
mechanism to check in and
see how the neighboring
communities were
doing. Where some were
observing declines in water
level, water quality, others
were not.
In some cases, the lead agency
for implementing a rule,
funding source, or providing
technical assistance was not
readily known. It did depend
on the knowledge and
personal experience of the
person at the table
Increased support and funding
for projects – State and
Federal
Bringing in surface water
to area, such as;
▫ Weber Siphon (stalled)
▫ Widen canal, pumping
stations to transport
added irrigation water
for ag. Purposes
Budgets are tight all across the
board, and they are looking to
get more support for personal
projects that can help monitor
their monitoring tracking
reporting requirements for the
sources. Including, those
larger projects that will help
reduce the groundwater
consumption from irrigators
Budgeting, Cost Estimates,
Funding
All over the board on where
they needed help with on their
own systems, costs for
proposed projects, etc.
Templates for agency
monitoring / reporting,
requirements
Looking for a concise or
single location and handout
for getting information on
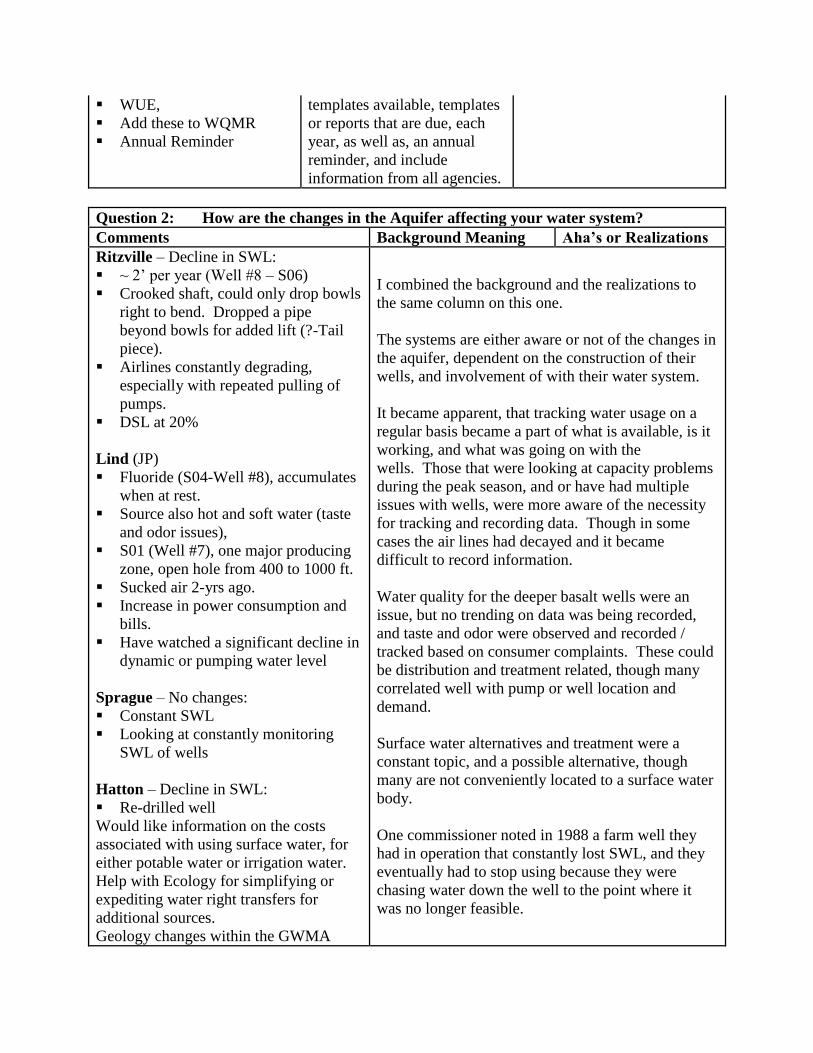
WUE,
Add these to WQMR
Annual Reminder
templates available, templates
or reports that are due, each
year, as well as, an annual
reminder, and include
information from all agencies.
Question 2: How are the changes in the Aquifer affecting your water system?
Comments Background Meaning Aha’s or Realizations
Ritzville – Decline in SWL:
~ 2’ per year (Well #8 – S06)
Crooked shaft, could only drop bowls
right to bend. Dropped a pipe
beyond bowls for added lift (?-Tail
piece).
Airlines constantly degrading,
especially with repeated pulling of
pumps.
DSL at 20%
Lind (JP)
Fluoride (S04-Well #8), accumulates
when at rest.
Source also hot and soft water (taste
and odor issues),
S01 (Well #7), one major producing
zone, open hole from 400 to 1000 ft.
Sucked air 2-yrs ago.
Increase in power consumption and
bills.
Have watched a significant decline in
dynamic or pumping water level
Sprague – No changes:
Constant SWL
Looking at constantly monitoring
SWL of wells
Hatton – Decline in SWL:
Re-drilled well
Would like information on the costs
associated with using surface water, for
either potable water or irrigation water.
Help with Ecology for simplifying or
expediting water right transfers for
additional sources.
Geology changes within the GWMA
I combined the background and the realizations to
the same column on this one.
The systems are either aware or not of the changes in
the aquifer, dependent on the construction of their
wells, and involvement of with their water system.
It became apparent, that tracking water usage on a
regular basis became a part of what is available, is it
working, and what was going on with the
wells. Those that were looking at capacity problems
during the peak season, and or have had multiple
issues with wells, were more aware of the necessity
for tracking and recording data. Though in some
cases the air lines had decayed and it became
difficult to record information.
Water quality for the deeper basalt wells were an
issue, but no trending on data was being recorded,
and taste and odor were observed and recorded /
tracked based on consumer complaints. These could
be distribution and treatment related, though many
correlated well with pump or well location and
demand.
Surface water alternatives and treatment were a
constant topic, and a possible alternative, though
many are not conveniently located to a surface water
body.
One commissioner noted in 1988 a farm well they
had in operation that constantly lost SWL, and they
eventually had to stop using because they were
chasing water down the well to the point where it
was no longer feasible.

where the impacts are more significant to
not at all, with respect to, SWL and WQ.
City of Othello is looking 2-miles east
out of town for a new source.
Question 3: In the next 10-15 years, how will you adjust to changing water supply
conditions?
Comments Background Meaning Aha’s or Realizations
Expedite water right process
know.
Upper aquifer over
allocated
Cascading water issues
Help with or investigate
further the possibility of using
the shallow / upper aquifer
Legal barriers
Capacity / Treatment
issues
Many wells in the area are
tapped into the upper aquifer
(such as Hatton), that are not
showing any signs of decline
in SWL or WQ.
Better tracking of water use.
DSL or leaks
Other water sources,
Surface Water
ASR – Aquifer Storage
Recharge
Legal Barriers/ actions.
Water right process for
transferring rights
Enforcement authority for
mis-use over-use on
existing wells or water
rights
I combined the background and the realizations to the same
column on this one.
The systems are either aware or not of the changes in the
aquifer, and the ramifications for future development.
Some of the concerns evolved around the construction of new
sources, and trying to locate a better area that would be within
reasonable distance of the community and possibly a better
supply. While most of the problematic areas within the
communities appeared to be in the deeper aquifer, their did
appear to be some hope for production in the shallower
aquifer. Information and ability to attempt drilling in the
shallower aquifer became an interest, as well as, tracking
whether additional sampling, treatment, etc. would be
necessary.
Many were well versed with other uses within and around their
communities, as well as, the surrounding area. Would like to
see more accountability, enforcement, or curtailment of use
within those areas where water appears to be used beyond their
legal right.
Would like to see better reporting from communities on water
use and leaks, as well as, all groundwater suppliers within the
GWMA.
Question 4:
Comments Background Meaning Aha’s or Realizations

Increased SWL and dynamic
pumping level data collection
Will place a probe down
the new well
Better or improved DSL
tracking
WUE
Accounting issue
Billing Software
No Free Lunch
Investing money into the
infrastructure
New well
Repair air lines
Internal airlines within the
casing
Currently broken
I combined the background and the realizations to the same
column on this one.
The systems are looking at how they can make better use of the
existing resource, so they can continue to grow in the future,
without having to rely heavily on looking for a new source
(GW well).
They understand the report indicates the aquifer is declining,
and the replacement of a source may not have the expected
results or improved performance as their current sources.
Communities understood they have to be more accountable for
the resource, and that the problems extend from equipment,
human error, software compatibility, and so on.
In agreement tracking of the resource, whether it is within the
distribution system or the well is a top priority.

Table 2: Davenport and Odessa
With Ed Dzedzy, Lincoln County Health Department, and Mark Stedman
Notes typed up by: Heather Cannon
Question 1: How are the changes in the aquifer affecting your water system?
Changes in wells are not yet significant but they are looking to the future. Wells were in 500’
aquifer or so, now wells are 900’ to 1,000’ deep to try to help recharge the deeper wells as there
is a small amount of recharge. In addition, they are also using WUE measures. New inclining
block rate for water was started for both revenue and WUE reasons.
Customer education on WUE, how to use the water they purchased.
Do you have a coordinated effort by DOE and DOH on water usage in the GWMA on municipal
and agriculture use? No, and there is no money because it is not a priority. The Secretary of
Health and the Director of ECY need to go to the state legislature and get the money to measure
all wells all year long, including agricultural wells. DOH needs to ask for the funding for in-well
measuring because local governments do not have money for this. Secretary Weisman needs to
put this on his radar.
There needs to be education for towns and cities on how to collect and interpret the information.
Economic development is impacted because they will look at water supply; this is creating issues
with those wanting to come to the area for development.
We don’t know how much it is really declining and the GWMA report is dated and an
interpretation by one person.
ERWOW may be able to help with readings
We are fixing old pipes and have a meter program; we have replaced 24 of 80 old meters which
can cause inaccuracy and WUE issues. The council and mayor support the metering program and
main replacement.
Do we even know if there are changes? Yes, neighboring wells are being deepened and this
causes concern.
Yes, the Lake Creek drainage is drying up also Pacific Lake. Deer Springs are dry and Coffee
Pot is lower. There exists video of the draining of Deer Springs due to agricultural use. It is
drying up Northeast so there is visible information.
Selling a community is tough now for activities like recreation.
In ag vs. muni uses, ag uses a lot more per crop circle.
We should look at the ability for waste water reuse for things like cemeteries because people like
a green cemetery but the cost is a big impact.

Other wells that are not muni such as golf courses also impact well depth and this should be
evaluated.
Let’s have the water rights discussion regarding first in line which was ok when water was
unlimited. This should this be addressed; some type of priority discussion at some level.
There may need to be changes in farming practice.
They should look at finishing the project to bring water to the basin, is this economically
feasible, look at food production per water use measurement. There needs to be a general
improvement of surface water provided and less well use to make it sustainable and profitable.
Pumping into Lake Creek is a possible solution with completion of the East Hi system but
storage may be an issue maybe they can use Crab Creek. 45 million for a study of a 24” pipe is a
waste of money. Money is the issue. Spend money on projects not more studies.
Question 2: In the next 10-15 years how will you adjust to changing water supply
conditions?
Fixing infrastructure and metering which takes money.
Conduct public awareness and education about water use.
Look at water reuse but will need money.
Understand the data (obtain the data and understand what it means) and will need money and
help and convey this to the consumers so it can be explained what you know and how you know
it.
Note that this is a regional problem to be addressed NOW and make it the Secretary of Health’s
priority.
Reducing water use reducing available water to reuse and low flow has impacts to the
wastewater system and this costs money and it takes extra water to flush the WW system.
Are water use or maximum use restrictions in the future a possibility? Maybe.
Landscaping is an issue so appropriate landscaping and community education about this topic
such as what is the correct landscaping/plants for a desert.
Planning for new developments should include water usage limits and landscaping limits.
Many towns are at a minimum population and are declining and there are 100’s of vacant homes.
There may be water restrictions and inverted water rates so they choose to pay more if they
choose to use more.
Landscaping incentives may be adopted.
How do you survive with the existing water you have?
Municipal use is minimal so you will be controlling a minor part so municipals will lose.

Othello and Moses Lake have inadequate supply and processing takes a lot of water and can this
be reduced? Other businesses use less water than processing can processing be moved to where
the water is or other businesses be brought in?
There needs to be better integration of surface and ground water by bringing in more surface
water.
We need federal help, money and an agreement on the water supply. There is a history here.
Question 3: In terms of managing water supply, what are your most important next steps?
Get water meters installed.
Fix infrastructure.
Educate legislators and customers.
Additional wells.
Better understanding of the aquifer systems, where is the water from and where is it going?
Time to act is now, data may not be complete or great but the time to act is now.
Put in the surface water infrastructure to minimize ground water use.
Reevaluate agriculture.
First thing – fix water loss in local infrastructure. Get data from metering.
Start a coalition of the 25 communities to work on a unified message on needing data collection
in addition the communities should come together to educate the legislature and the federal level
as we all live and work together and need to work together on this issue.
Educate local councils.
Does there need to be an education campaign for agriculture? This exists and they are mostly
crop circle metered and computerized.
We need to address economic development without the alarmist message; we need to show we
are working on a regional solution.
DOE says keep on drilling and drill deeper. How did we get to where we are? This was
supposed to be a temporary deep irrigation well solution and the federal government made a bad
promise and gave the state the ok to issue water rights but did not come through with the surface
water.
Question 4: What one thing would you want the most help with?
Grant money for infrastructure and metering, state and federal, DOH to be an advocate to fix the
problem and not be a roadblock. Expand the type of projects that can be funded.
Have DOH facilitate the regional group effort; to bring them to the table.

PWBTF is gone, restore this money.
Have a coordinated effort from DOE and DOH on regional water supply for sustainability and
rejuvenation of ground water by working with the federal government and Bureau; everyone
needs to be onboard, counties, tribes, businesses, etc.
We need to master the political message; not be alarmist because of loss of economic
development. But put out the correct message and information such as Odessa and the Odessa
aquifer are not the same thing. So we need to have a state led effort by DOH and DOE; is there
value in this? The story kills economic development.
We need an executive session for all of the mayors and state representatives to discuss this.
Build the canal.
The Columbia Basin Development League may have the structure in place for this group; and a
legislative capital funding person and a federal funding person need to be members of the group.
Notes from Discussion at Jan 9, 2014 Columbia Basin Public Meeting
Big Bend Community College, Moses Lake
Notes typed up by Jeff Johnson
Table 3: Royal City, Othello, Warden, Jon Ness (Grant Co HD), Dave Nazy (Ecology-
OCR), Jeff Johnson DOH-ODW
How are the changes in the aquifer affecting your water system?
Royal City – have not seen losses in their water levels. Recent data from Well 4 shows
that the situation is better than what was shown in the GWMA report. Royal City has fee
structure set up to encourage conservation, this has been successful.
Warden – Wells 6 & 7 are in Grande Ronde, Well 6 in Wanapum also. A fault causes
ground water to pool up (be more plentiful) on the west side of town. They are looking at
acquiring a Farm Well (this would end up being Well 8)and drilling a new well into the
Wanapum (this would end up being Well 9). City needs all the players at the table to
figure out plan – Bureau of Reclamation, Ecology, DOH need to work together up front.
Can’t get Ecology to agree with themselves. The East Low Canal is maintaining water
levels in the Wanapum. Need $ to fund purchases of water rights and well rehabilitation.
Well 6 comingles water from the Wanapum and Grande Ronde, and is still used as a
permanent source.
Othello – Still declining water levels (pumping level). Static recovers just fine. Well 2
650 ft deep, can only be used until irrigation starts. Well 6 showing regional problem.
Have done work to rehabilitate some wells, but not Well 2. Withdrawal rates from
Othello’s wells have declined since the GWMA report. Well 7 probably has bacteria
problem (clogging?). Hard to take well off-line because of system capacity to meet
needs. Planning to purchase property east of town for Well 9. Some questions regarding
the future demand forecast numbers in the GWMA report.
In the next 10-15 years, how will you adjust to changing water supply conditions?
Warden – Changing from relying on withdrawing groundwater from Grande Ronde to
instead taking water from the Wanapum. Trying to reduce demand by having
conservation-based rates, but can only do so much. 20% - 25% of the City gets shut off
notices for not paying bill (then most of them pay), but this indicates the financial stress
of the community. 2 very significant employers in Grant County are the 2 potato
processors in Warden.
Royal City – Increasing storage capacity and replacing water mains that could fail.
Starting to slowly increase water fees for infrastructure fund.
Othello – After new wells, they then will need 2 to 3 million gallons of storage then
replace old pipes.
What one thing would you want the most help with?
Once 2nd
siphon is done and surface water is available for irrigation, get the agriculture
irrigators to actually stop using groundwater and switch over.
Using reclaimed water is nearly impossible under current laws (due to impairment).
Funding for rehabilitation of a well
Funding to purchase water rights
Make it easier to use reclaimed water.
In terms of managing water supply, what are your most important next steps?

Our group covered what they wanted to say on this question under the other questions, mostly in
the question on how they plan to adjust in the next 10-15 years.
Table 4: Moses Lake
Notes typed by: Bryony Stasney
How are changes in the aquifer affecting your water system?
Moses Lake pulls groundwater from upper unconsolidated and lower basalt aquifers. The
main units from top to bottom comprise upper unconsolidated sand and gravel aquifer,
Ringold sands and silts, Wanapum basalt aquifer, Vantage interbed and Grand Ronde
basalt aquifer.
All groundwater sources have declining water tables, in particular the basalt aquifer. The
upper unconsolidated aquifer is recharged seasonally by irrigation water. Seasonal
recharge of the upper unconsolidated aquifer appears to have declined as the irrigation
canals are lined.
Moses Lake has water level recording devices in all wells and telemetry so that operators
can view water levels in wells remotely.
Moses Lake has observed static and pumping groundwater level declines of between 2 to
4 feet annually in all wells since the 1950s. This has caused Moses Lake to incrementally
lower pumps in most wells. Moses Lake acknowledges that there are a few wells for
which the pumps cannot be lowered any further without deepening the wells.
Groundwater quality in the deeper aquifer is poor – with warmer temperatures and
hydrogen sulfide.
Moses Lake would like to see a dedicated monitoring well drilled and installed to monitor
groundwater level changes in the various aquifers. Is there funding support to do this?
In the next 10-15 years, how will you adjust to changing water supply conditions?
Moses Lake knows that it needs to start taking action right away and that current / future
groundwater supply cannot be sustained under existing conditions.
Moses Lake sees the best option as a regional water supply strategy, involving conveying
surface water from Billy Clapp Lake down Stratford Road and into Moses Lake.
Moses Lake would like to understand the water rights / legal issues that need to be
addressed to allow surface water to be used for municipal supply. Moses Lake
anticipates that legislative changes may be needed.
Moses Lake plans to start developing a blue-print in 2014 to identify actions to address
declining water supplies. Some alternatives considered include: more shallow wells; a
separate irrigation / potable system; aquifer storage and recovery; irrigation system
improvements; incentives for property owners to use water from Moses Lake to irrigate
(if they can legally) rather than using potable water; education for all city departments
and the community.
Moses Lake needs funding to implement.
In terms of managing water supply, what are your most important next steps?
The first / priority step is to develop a plan / blue-print for water supply for the next 15+
years – Moses Lake is planning to work with the GWMA in 2014 on this planning effort.
Continue planned infrastructure for economic development.
Continue to provide good quality drinking water for our customers.

What one thing would you want the most help with?
Funding to implement solutions.
Legislative action to ensure available surface water can be used for municipal
supply. Want to understand if there is something politically required to be able to use
Billy Clapp Lake as a municipal water supply.
The timeline for funding and legislative action is within the next 5 years - will request
help from Ecology’s Office of the Columbia River as well as state and federal
representatives.
Need help with communication with representatives, community, City departments –
including public meetings, press releases, technical information.

Table 4: Moses Lake
How are the changes in the aquifer affecting your water system?
Industrial area in Winchester: a new well was necessary after the old well suddenly went dry.
The old well is now used for monitoring with a pressure transducer. This experience drove the
participant to joining the GWMA committee.
Wilson Creek: the mayor’s personal domestic well on a dry land farm had to be redrilled. She
blames overallocation to deep agricultural wells. Wells have been constructed in anticipation of
the canals, but it hasn’t happened. Crab Creek runs dry in Wilson Creek (and, yet, the town is
still required to adopt a shoreline master plan). Wilson Creek’s mayor asks: Whose cost is it? If
ag overdraws water and the city needs to deepen the wells, who pays? The City. Is that the
“right” answer?
Wilson Creek had to establish a moratorium on new connections, but was fortunate to find a
record of old rights. Wilson Creek is reducing water for domestic irrigation and parks.
Ephrata: formerly, they had a source of emergency water from the canal, but it has not been used
since 1961. The City is trying conservation. New hardware and maybe plugs and screens would
help. But, those solutions are expensive and it’s causing rates to go up.
It was observed that most of the cost of water depth monitoring is pulling the pump, not the
equipment.
Ephrata currently has manual water depth daily monitoring—it is recorded on paper each day.
Ephrata operator suggests that a mandate for water depth monitoring may be necessary.
In the next 10-15 years, how will you adjust to changing water supply conditions?
Quincy: most of the water used in the City is for food processing. The permit for food processing
water disposal expires in 2015. The City wants to use the water for cooling at the data center.
Ephrata: the City wants to reinject wastewater for reuse. The City does have a purple hydrant,
but it can’t be used because it has too much process associated with its use. Money is always the
issue.
Wilson Creek: With the recovery of the old water rights, Wilson Creek seems to be in good
shape at the moment.
In terms of managing water supply, what are you most important next steps?
Quincy: The City needs to complete its reclamation system. The recovered water is not used for
parks due to the “ick factor.” They switched to 100% radio read in 2005. They will also probably
be seeking water rights.

Ephrata wants to send its wastewater to Boulder Park. It is raising rates to complete its
distribution replacement. They have also disconnected school irrigation from the water system (it
is now using water from the canal). The City lost revenue from the school change, but they’re
grateful they have the water back. The City has a claim they wish to convert to a water right.
Wilson Creek is focusing on its DSL, including its leaking reservoir. They also need to replace
their pump. Wilson Creek still has a great deal of AC pipe to replace: “It’s a time bomb.” Wilson
Creek recently had their old water rights recognized.
What one thing would you want the most help with?
Ephrata: funding. New reservoir, in part because a standpipe is good for H2S mitigation of deep
wells.
Quincy: New infrastructure.
Wilson Creek: no unfunded mandate for monitoring.
They want help from each other: The systems currently all work together to help out.
They want help from DOH: make dollars available for maintenance purposes and change grant
and loan funds (e.g. DWSRF) to have fewer limitations.
They want help from Ecology: tighten up permit regulation for ag wells. The fines are merely the
cost of doing business.

Table 6: Kahlotus, Washtucna, Connell, Mesa & Franklin County
Notes typed by Craig Riley
1. How are the changes in the aquifer affecting your water system?
Washtucna: issues with main water supply (spring) during heavy summer use; town
needs to redevelop Railroad Well for additional source; better water rights
management to prevent excessive drawdown by other users; major water quality
concerns – secondary contaminants, nitrates, sealing casing for the RR Wells
Connell: city started buying more water rights 10-15 years ago, installing VFD pump
drives for more efficiency, conducting monitoring well levels [Wells 4 & 10 have
SCADA controls & data collection], reservoir capacity & old pipes – they have
replaced ¾ of town’s distribution system in last 3 to 5 years
Franklin County: ground water levels and supplies are overall a serious issue
throughout Eastern Washington
Overall
o need to acknowledge the complexity of the aquifer system and different
conditions facing each system; lack of problems in one community does not
suggest others have adequate supplies
o more access and help for other water systems (e.g. home owner associations)
o more assistance from state for smaller cities & HOA’s
o provide an advocate (for water supply issues)
o expand NO3 awareness & treatment
o funding for ground water level tracking available to local governments
o none of the communities were opposed to ground water level data collection
2. In the next 10-15 years, how will you adjust to changing water supply conditions?
Washtucna – mayor doesn’t care (he’s not running again)
Mesa – no issues unless dams are breached and groundwater concentrating in canyons
dries up
Connell – distribution system in good shape; may need funds for treatment
WUE program implementation – cut back to < 25%
Kahlotus – taking baby steps, they need more knowledge with water rights
Flat rates are a barrier for all the communities
metering is a necessity
communications (water is a necessity not a luxury)
sarcasm: moratoriums (on hookups are good to generate interest by the community)
3. In terms of managing water supply, what are the most important next steps?
conservation water rates
metering
public education
DSL reduction to 12-15% range
leak detection (Washtucna & Connell)
distribution system replacement – Kahlotus
Note: for all of these communities, water has been a priority

Wish lists
o new reservoir
o new or rehabilitated wells
o more data
o water collection (blue sky ideas for new or innovative sources)
o replacing leaky pipes
4. What one thing would you want the most help with?
transmission mains from “good wells” to communities (e.g. extending supplies
outward to available sources not currently within the community
dual distribution system development to allow potable & nonpotable water supplies
(extensive irrigation water supplies are available)
water system planning for the future
water rate studies
infrastructure replacement (distribution, pumps, boosters & storage tanks)
assistance to communities to “pay attention to water issues”; comment from Mayor
Blackwell of Connell: remind citizens that water is a necessity and not a luxury
provide training: Water 101
improving access to DOH Employees for quick access by topic to improve
communications between communities and DOH
better access to Water Tap for communities (and citizens)
outreach to non-community water systems
assistance with working with and supporting NGO’s such as GWMA (participants
expressed strong support for GWMA organization.

Conclusions
The January 9th, 2014 Columbia Basin Municipal Ground Water Open House effectively
allowed a broad range of Mid-Columbia Basin municipal water supply stakeholders to come
together for discussion and education. The broad issues that were identified as a result of this
meeting relating to water supply and declining groundwater levels included the need for a more
structured community voice, the importance of exploring alternative water supplies and securing
funding to pursue these projects, and an interest in continuing to work with and receive support
from the Departments of Health and Ecology.

Appendix G ERWOW 2015 Presentation Slides

7/14/2015
1
Will the Water Run Dry? Protecting Municipal Water Supply
in the Columbia Basin
Dorothy Tibbetts Brian Sayrs
Office of Drinking Water
2
Office of Drinking Water’s Mission
To protect the health of the people of
Washington State by ensuring safe
and reliable drinking water.
3
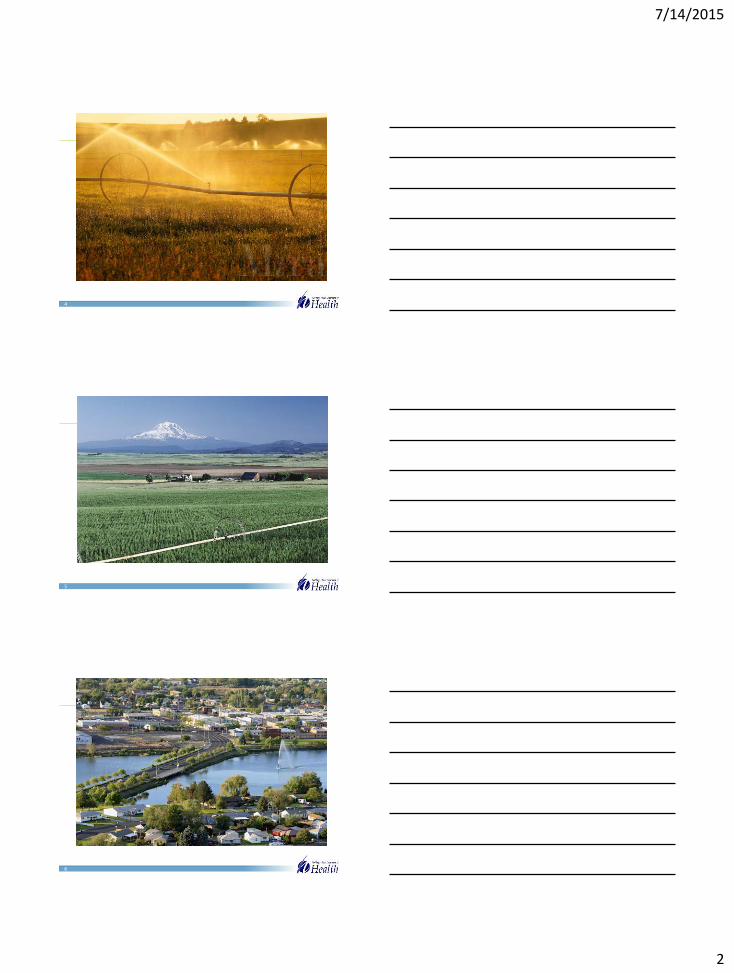
7/14/2015
2
4
5
6
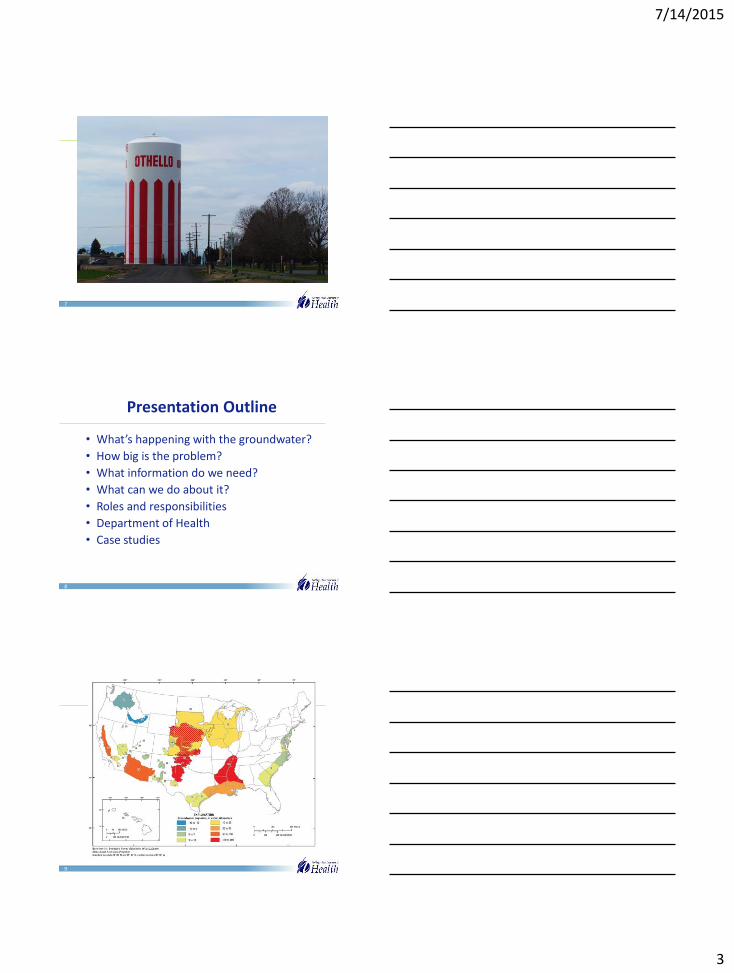
7/14/2015
3
7
8
Presentation Outline
• What’s happening with the groundwater?
• How big is the problem?
• What information do we need?
• What can we do about it?
• Roles and responsibilities
• Department of Health
• Case studies
9

7/14/2015
4
10
11
12

7/14/2015
5
13
14
The Aquifer System
• The deep aquifer – Very old
– Doesn’t get replenished
• The shallow aquifer – Some areas are replenished
by recharge from surface water irrigation.
• The situation varies in each locality.
15
Generally Speaking…
• 83 percent of wells measured in 1984 and 2009 showed declines in water level.
• 29 percent showed declines greater than 7.6 meters.
• Declines greater than 30 meters and as great as 91 meters were measured in many wells.
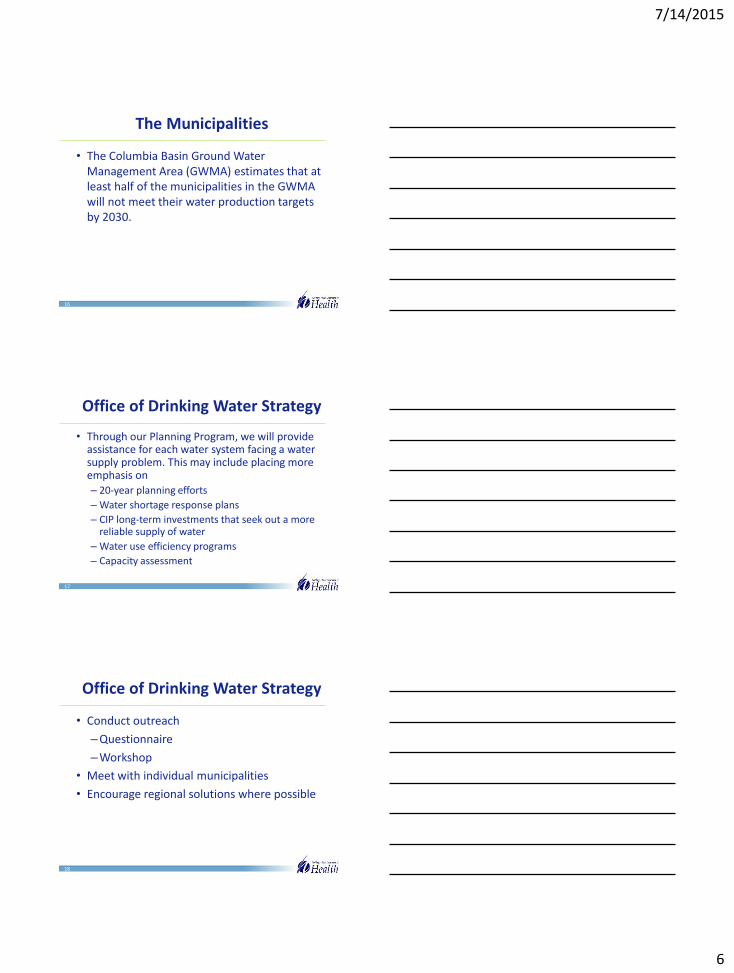
7/14/2015
6
16
The Municipalities
• The Columbia Basin Ground Water Management Area (GWMA) estimates that at least half of the municipalities in the GWMA will not meet their water production targets by 2030.
17
Office of Drinking Water Strategy
• Through our Planning Program, we will provide assistance for each water system facing a water supply problem. This may include placing more emphasis on – 20-year planning efforts
– Water shortage response plans
– CIP long-term investments that seek out a more reliable supply of water
– Water use efficiency programs
– Capacity assessment
18
Office of Drinking Water Strategy
• Conduct outreach
–Questionnaire
–Workshop
• Meet with individual municipalities
• Encourage regional solutions where possible

7/14/2015
7
19
The Municipalities
Do you have a current plan that addresses
• Short-term response measures
– Water shortage emergency response plan
• Long-term response measures – Evaluate new source(s) of supply
• Shallow aquifer
• Surface water
• “Alternative” supplies, such as reclaimed water and aquifer storage recovery
• Water use efficiency (WUE) program.
20
Q: What Do You Need to Know?
A: Water Supply and Demand
• Total well capacity (gallons per minute).
• Water levels and trends in the wells.
• Trends in depth to water.
–Static and dynamic
• Predicted peak demand.
• Population projections.
21
WAC 246-290-415(9)
(9) All purveyors utilizing groundwater wells shall monitor well levels from ground level to the static water level on a seasonal basis, including low demand and high demand periods, to document the continuing availability of the source to meet projected, long-term demands. Purveyors shall maintain this data and provide it to the department upon request.
7/14/2015
8
22
What Do You Need to Do?
• Install measuring devices in your wells.
• Complete and maintain your water system planning document.
• Start talking about it!
– Increase public awareness and public support.
– Develop regional boards, committees, or associations dedicated to addressing this issue.
23
What are you doing to protect your customers?
• Do you have all the information you need?
• How are the changes in the aquifer affecting your water system?
• In the next 10-20 years, how will you adjust to the changing water supply conditions?
• In terms of managing water supply, what are your most important next steps?
24
Comments? Questions?


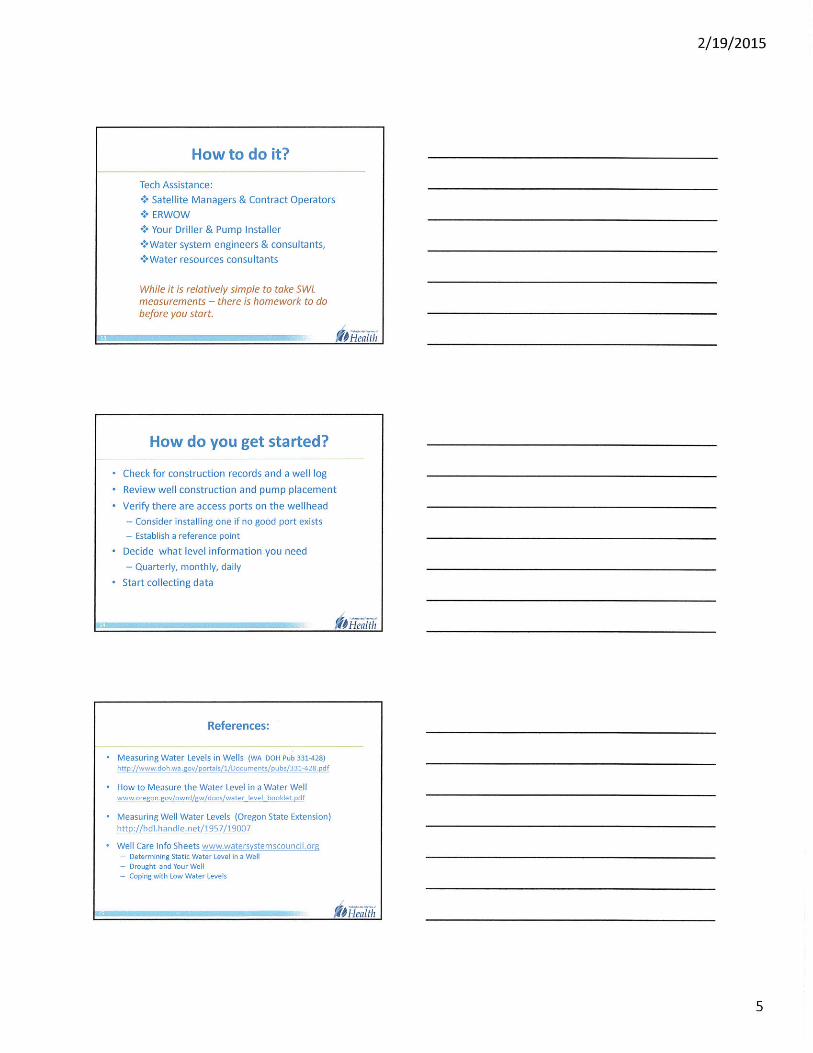
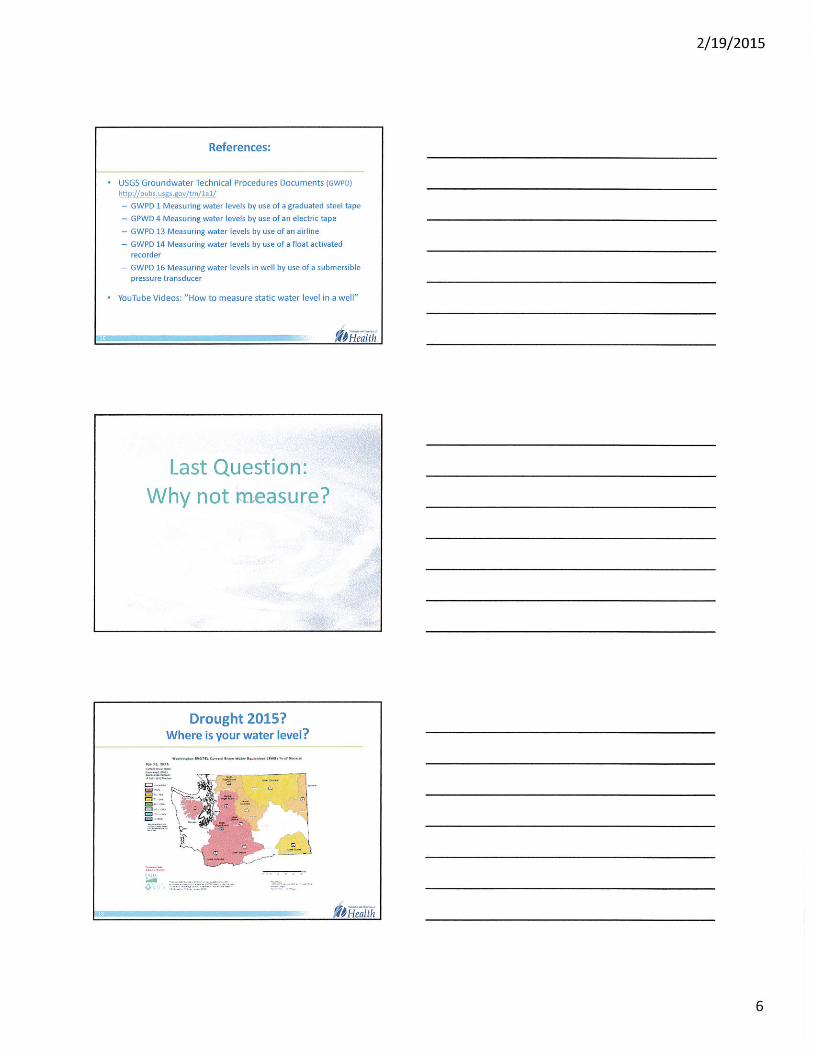

Water Levels – An Investment in Problem Solving
September 19, 2015
Evergreen Rural Water of Washington, 2015 Conference and Tradeshow
Water Levels – Key to understanding aquifers, wells, and pumpsaquifers, wells, and pumps
How much water is in the aquifer? Is it changing?
Am I competing with my neighbor?
How hard can I pump my well?
What is the right pump and how deep should I set it?g p p p
Is my well clogging?
Is my pump deteriorating? Is my pump deteriorating?

Interpretation of water levels depends on the well typedepends on the well type
Production Wells Production Wells Static water level (pump off) Pumping water level (pump on)= Aquifer drawdown + Well loss (“skin effect”)
Monitoring Wells Aquifer water level Aquifer water level Aquifer drawdown (no skin effect)
Production Well
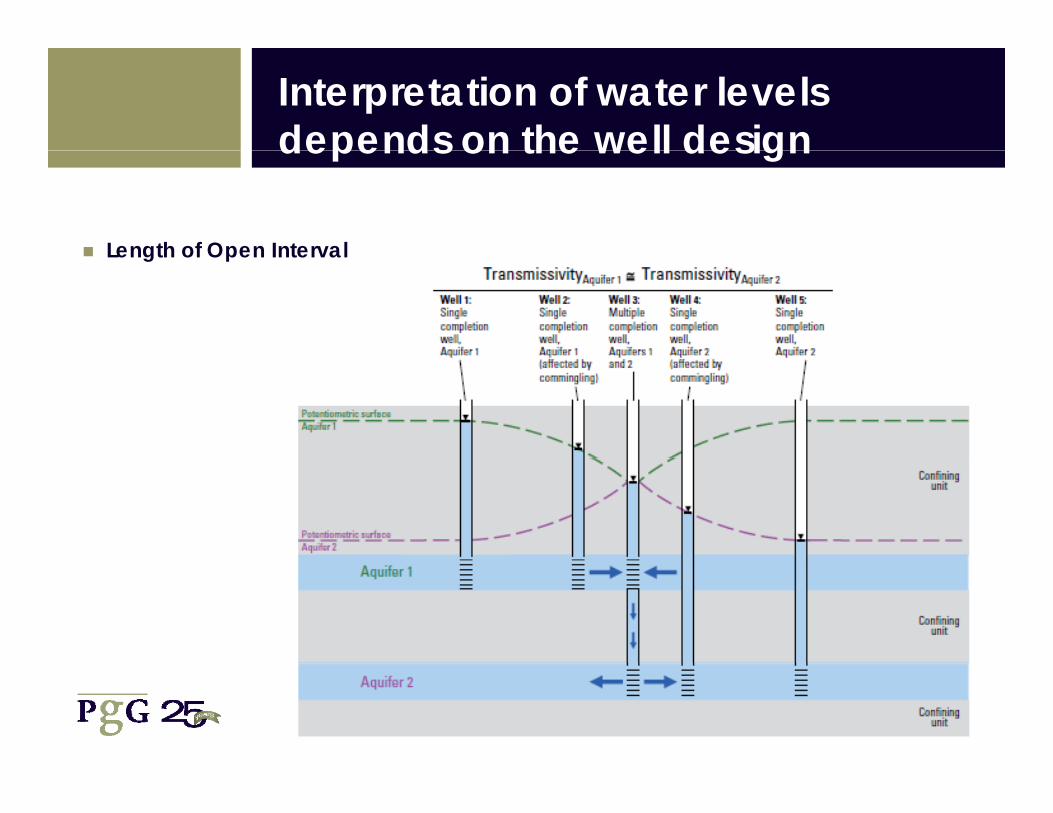
Interpretation of water levels depends on the well designdepends on the well design
Length of Open Interval Length of Open Interval

How to Measure Water Levels
Common Instruments Sounder (“E-tape”) Transducer SCADA Sounding tubes
i li Air line
Sounder
Sounding Air line
Sounding tubes

My Favorite Wellheady
Lots of Access!
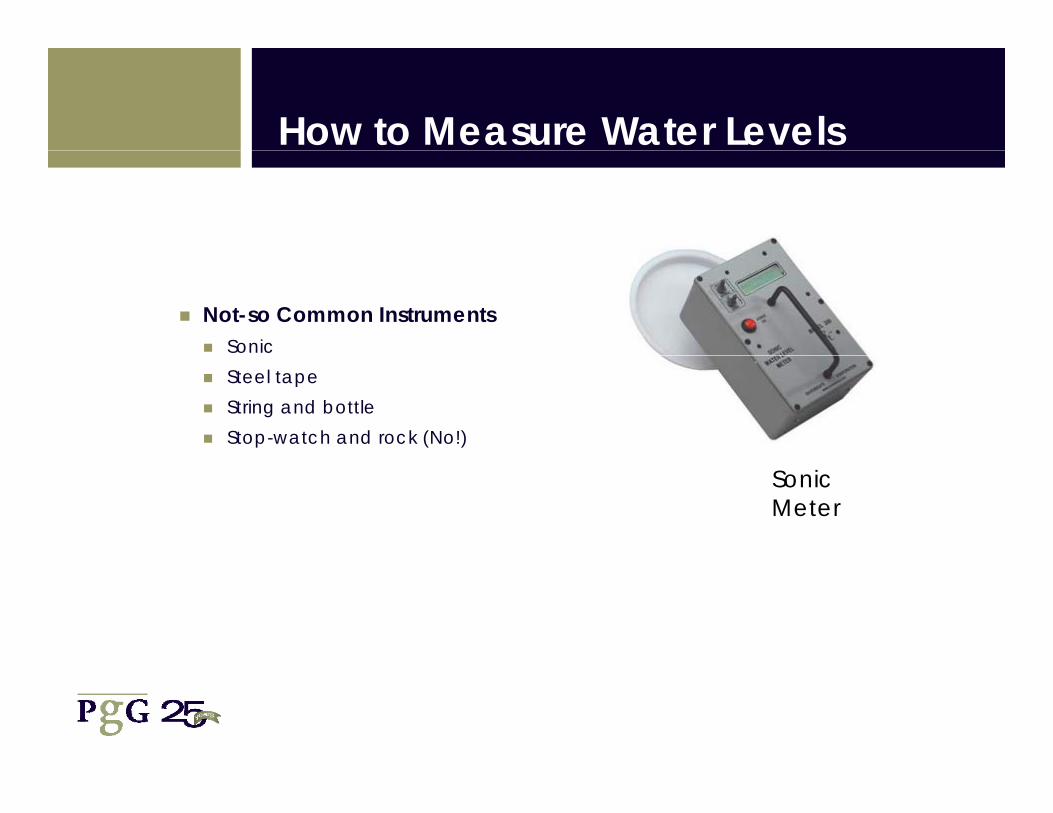
How to Measure Water Levels
Not-so Common Instruments Sonic Steel tape String and bottle Stop-watch and rock (No!)
Sonic Meter
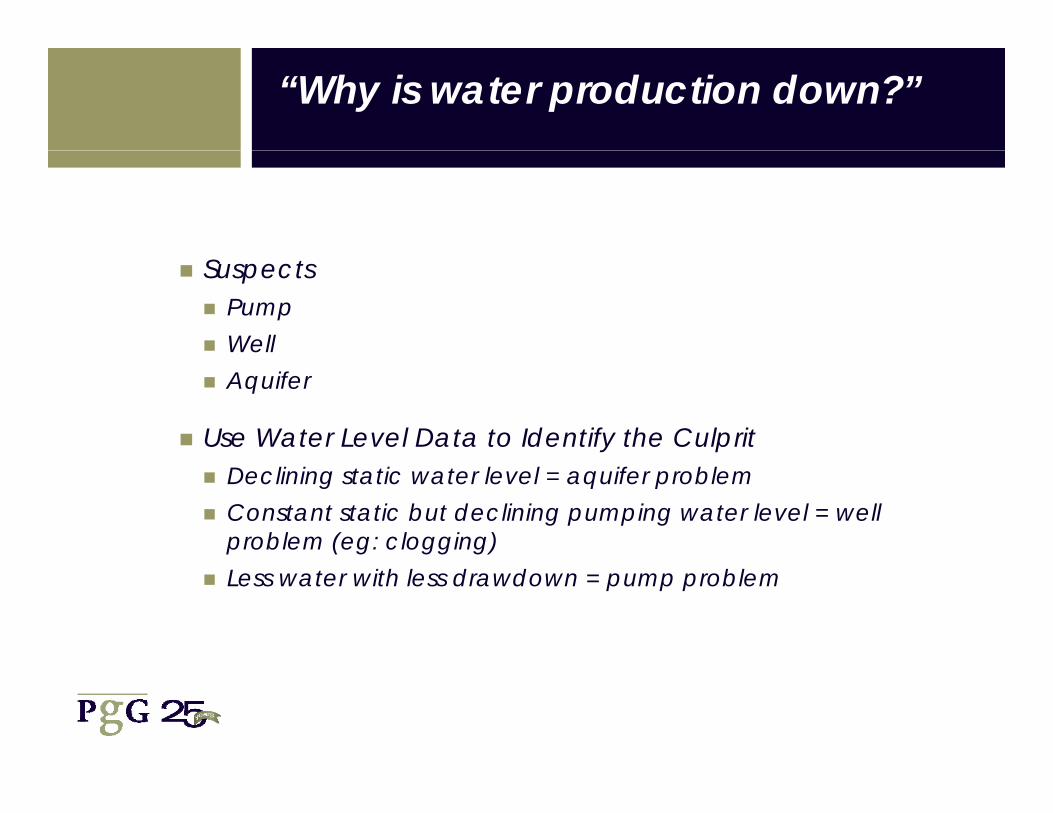
“Why is water production down?”
Suspects Pump Well Aquifer
Use Water Level Data to Identify the Culprit Declining static water level = aquifer problem Constant static but declining pumping water level = well
problem (eg: clogging) Less water with less drawdown = pump problem

Aquifer Overdraft Determined by Water Level AnalysisWater Level Analysis
50+ ft Decline of Winter Static Water Level = Long Term Overdraft
150 ft Seasonal Variation in non-pumped well = Seasonal Overdraft
Wanapum
Grande RondeGrande Ronde

Well Clogging Determined by Water Level AnalysisLevel Analysis
Two wells nearby in same aquifer – drawdown in one increases dramatically
This case – iron bacteria effecting well performance

Water Levels as Part of Well Performance MonitoringPerformance Monitoring
Track performance and work on wells over time
Specific Capacity – single number that includes pumping rate and drawdown informationdrawdown information
SC = FLOW / DRAWDOWN(eg: gpm/ft)

Specific Capacity Trends
Key to scheduling well maintenance work
Specific Capacity over Time

Appendix H
Follow-up Questionnaire, Davenport and Odessa Responses

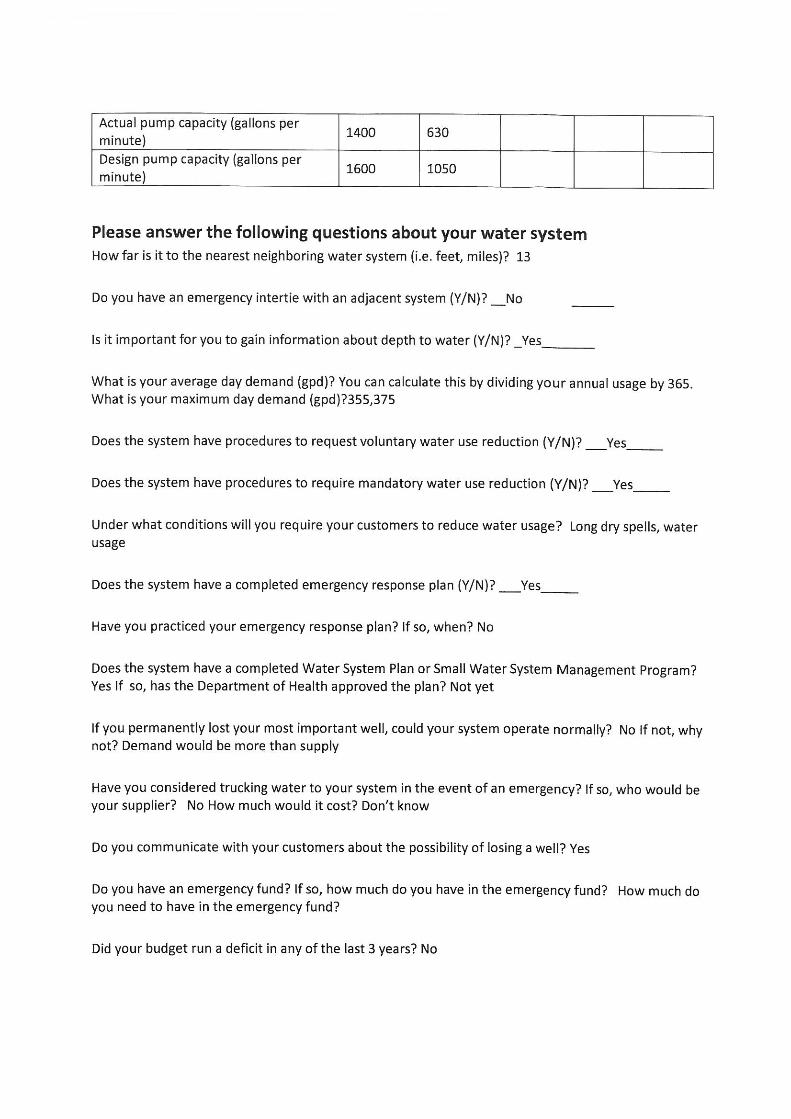


Survey questions for Mid-Columbia Basin municipalities
The Department of Health is attempting to gain a better understanding of the specific needs of
individual water systems in the Mid-Columbia Basin affected by the depletion of the basalt aquifer
groundwater.
Contact information
Water system name: Town of Odessa PWS ID#: 63050
Name of person answering survey: Rodney Webster, Public Works Director
Contact information: (509) 982-2201
Please fill out the following table with information about each of your wells.
Please add additional pages, if necessary.
DOH source number (e.g. S01) and use S01 – E S02 – P S03 – S
Depth to bottom of well (feet below ground surface) 248 595 660
Year bottom of well checked 1966 1977
Aquifer(s) that feeds the well (e.g. Grand Ronde)
Grand Ronde
Wanapum & Grand Ronde
Pump depth (feet below ground surface)
Do you have the equipment needed to measure DTW (Yes/No) N N N
Does someone have the training necessary to measure DTW? (Yes/No)
Y Y Y
Has DTW been measured more than once? (Yes/No) N Y Y
How often is DTW measured (e.g. monthly) N N N
Initial DTW measurement (ft./year) 360/1966 119/1977
Date of last DTW measurement (month/year) 2010 2010
What was the last DTW measurement (feet below ground surface)
470 149
Actual pump capacity (gallons per minute) 300 350 570
Design pump capacity (gallons per minute) 300 600 950

Please answer the following questions about your water system How far is it to the nearest neighboring water system (i.e. feet, miles)? 27 Mi.
Do you have an emergency intertie with an adjacent system (Y/N)? No
Is it important for you to gain information about depth to water (Y/N)? Yes
What is your average day demand (gpd)? You can calculate this by dividing your annual usage by 365. What is your maximum day demand (gpd)? 342,462 gpd ADD, 1,328,149 gpd MDD (2014 WSP)
Does the system have procedures to request voluntary water use reduction (Y/N)? Yes
Does the system have procedures to require mandatory water use reduction (Y/N)? Unknown
Under what conditions will you require your customers to reduce water usage? Loss of a production well
Does the system have a completed emergency response plan (Y/N)? Yes
Have you practiced your emergency response plan? If so, when? No
Does the system have a completed Water System Plan or Small Water System Management Program? If so, has the Department of Health approved the plan? Yes. Not approved, in process.
If you permanently lost your most important well, could your system operate normally? If not, why not? No. Cannot meet summer/irrigation demand if Well #4 is lost. It would trigger a water use reduction.
Have you considered trucking water to your system in the event of an emergency? If so, who would be your supplier? How much would it cost? No
Do you communicate with your customers about the possibility of losing a well? Yes
Do you have an emergency fund? If so, how much do you have in the emergency fund? How much do you need to have in the emergency fund? Yes. Waiting on additional information.
Did your budget run a deficit in any of the last 3 years? No
What is your average residential rate? You can calculate this by taking your total bills from your residential accounts for 12 consecutive months, dividing by the number of residential customers, then dividing by 12. Waiting on additional information.

What is your community’s median household income (dollars)? $45,203 (US Census Bureau, 2013 ACS). Rod suspects this number to be inaccurate and more than the actual figure. The town is going to conduct an income survey in the future.
Do you have a seasonal rate or an inclining block rate? Yes. 2014 WSP is inaccurate.

Appendix I ERWOW Consultation Training Summary, Tables, and Conclusions

Mid-Columbia Well Measurements Contact Report Evergreen Rural Water of Washington
Charles Brown, Source water Protection Specialist
Davenport Water Division
6/23/15 ERWOW met with Fred Bell, Public Works Director and Joel Anderson, Water Operator to provide Technical Assistance and water well measurement training. They were provided “Standard Operating Procedure for Manual Well-Depth and Depth-to-Water Measurements” and “How to Measure the Water Level in a Well (using an electric water level meter)”. Davenport has 2 well wells. Both wells were located on Google Earth for Latitude, Longitude and Elevation. Water levels are measured periodically using their electric-tape. A measuring point (MP) and Stickup (MP Correction) was established for each well to determine Depth to Water Below the Land Surface (DTW below LSD). The equipment was disinfected with bleach solution and tested for operation. A measurement was made for each well by City personnel. Well #6 measured 228.90 Ft DTW below LSD and Well #7 measured 230.20 Ft DTW below LSD. Equipment was disinfected and stored.
Creston Public Water
6/23/15 ERWOW met with Blake Angstrom, Mayor and Rod Christman, Water Operator to provide Technical Assistance and water well measurement training. They were provided “Standard Operating Procedure for Manual Well-Depth and Depth-to-Water Measurements” and “How to Measure the Water Level in a Well (using an electric water level meter)”. Creston has 2 well wells. Both wells were located on Google Earth for Latitude, Longitude and Elevation. Water levels were measured in 2012 and 2013 by Franklin County. A measuring point (MP) and Stickup (MP Correction) was established for each well to determine Depth to Water Below the Land Surface (DTW below LSD). The equipment was disinfected with bleach solution and tested for operation. A measurement was made for Well #1 by City personnel using DOH electric-tape. Well #1 measured 131.00 Ft DTW below LSD. Well #7 was not measured. There was an air line with gage but the gage was defective. Equipment was disinfected and stored. Well #1 has a pressure transducer and telemetry that constantly measures the water level above the transducer. This allows for automatic pump shut down if the water level is too low. Depth to the transducer was unknown. If the depth to the transducer can be determined then a constant water level can be determined.
Town of Odessa
6/24/15 ERWOW met with Rod Webster, Public Works Director, Gerald Greenwalt, Water Operator and Jim Williams, Water Operator to provide Technical Assistance and water well measurement training. They were supplied with “Standard Operating Procedure for Manual Well-Depth and Depth-to-Water Measurements” and “How to Measure the Water Level in a Well (using an electric water level meter)”. Odessa has 2 wells. Both wells were located on Google Earth for Latitude, Longitude and Elevation. Well #3 has a pressure transducer and telemetry that constantly measures the water level above the transducer. This allows for automatic pump shut down if the water level is too low. Depth to the transducer was unknown. If the depth to the transducer can be determined then a constant water level can be determined. A

measuring point (MP) and Stickup (MP Correction) was established for each well to determine Depth to Water Below the Land Surface (DTW below LSD). The equipment was disinfected with bleach solution and tested for operation. A measurement was made for Well #1 by City personnel using DOH electric-tape. Well #3 DTW below LSD was greater than 300 Ft. Well #7 is an emergency well was not measured. There was an air line with gage but the gage was defective. Equipment was disinfected and stored.
Almira Water System
6/24/15 ERWOW met with Brent Robertson, Public Works Director to provide Technical Assistance and water well measurement training. He was supplied with “Standard Operating Procedure for Manual Well-Depth and Depth-to-Water Measurements” and “How to Measure the Water Level in a Well (using an electric water level meter)”. Almira has 3 wells. All wells were located on Google Earth for Latitude, Longitude and Elevation. Well #5 has a pressure transducer and telemetry that can constantly measure the water level above the transducer. This allows for automatic pump shut down if the water level is too low. Well #5 was shut down and the pump removed for maintenance. If the depth to the transducer can be determined then a constant water level can be determined. Wells #4 and #5 have airlines and air gages. A measuring point (MP) and Stickup (MP Correction) was established for each well to determine Depth to Water Below the Land Surface (DTW below LSD). A measurement was made for Well #2 and Well #4 by City personnel using the dedicated airline at each well. No access ports were available for use of electric tape. Well #2 DTW below LSD was 117.1 Ft. Well #4 DTW below LSD was 225.0 Ft.
Town of Wilber
6/24/15 ERWOW met with Larry Kause, Water Operator to provide Technical Assistance and water well measurement training. He was supplied with “Standard Operating Procedure for Manual Well-Depth and Depth-to-Water Measurements” and “How to Measure the Water Level in a Well (using an electric water level meter)”. Almira has 2 wells. All wells were located on Google Earth for Latitude, Longitude and Elevation. Wells #3 and #4 have airlines and air gages. A measuring point (MP) and Stickup (MP Correction) was established for each well to determine Depth to Water Below the Land Surface (DTW below LSD). A measurement was made for Well #3 and Well #4 by City personnel using the dedicated airline at each well. No access ports were available for use of electric tape. Well #3 DTW below LSD was 128.5 Ft. Well #4 DTW below LSD was not determined due to defective valve stem.
Royal City Water
6/24/15 ERWOW met with John Lasen, Public Works Director to provide Technical Assistance and water well measurement training. He was supplied with “Standard Operating Procedure for Manual Well-Depth and Depth-to-Water Measurements” and “How to Measure the Water Level in a Well (using an electric water level meter)”. Royal City has 3 wells. All wells were located on Google Earth for Latitude, Longitude and Elevation. All three well have pressure transducers that continuously measure the water level in each well. No measurements were taken.

City of George 6/30/15 ERWOW met with Joe Schone, Public Works Director to provide Technical Assistance and water well measurement training. Brian Walsh, Policy and Rules Section Manager and Andrea Watson Policy and Rules Section Environmental Specialist were also in attendance, with DOH. They were supplied with “Standard Operating Procedure for Manual Well-Depth and Depth-to-Water Measurements” and “How to Measure the Water Level in a Well (using an electric water level meter)”. George has 3 well wells. All wells were located on Google Earth for Latitude, Longitude and Elevation. Water levels are measured periodically using their electric-tape. A measuring point (MP) and Stickup (MP Correction) was established for each well to determine Depth to Water Below the Land Surface (DTW below LSD). The equipment was disinfected with bleach solution and tested for operation. A measurement was attempted for each well by City personnel. Well #1 measured 28.60 Ft DTW below LSD. Well #2 was in use and was not measures. Attempted to measure DTW Below LSD on Well #3 using both DOH and City equipment. Depth to Water was greater than 300 ft. Equipment was disinfected and stored.

Data Collection - Well Inventory and Identifiers (Use additional sheets as necessary)
S:\EPH\DW\Headquarters Operations\Policy & Rules Section\Mid-Columbia\Andrea's Mid Columbia Report Documents\Mid Columbia\Materials for Report\Almira Well Identifier.xlsx
Water System Name: Almira Water System Contact Name: Brent Robertson Contact Phone: (509) 977-1218
Well Name Well Number
USGS SiteID/SiteName
470910122160301
Latitude Longitude Location Method
DOH Source Id. (i.e. SO4)
DOE Well Tag
DOE Well Log Number/ID
Measuring
Point in 100th Ft.*
Month Year Total Production Units
EXAMPLE - Water Co. well #1 #1 19N/04E-11D02 47.15154545 -122.429444 GPS, NAD83 S01 ABC123 123456 1.01 March 2009 18,056,000 G
Well #2 #2 47.713136 118.943111 Google Earth SO2 ABR563 38.5 June 2015 G
Wel l#4 #4 47.712397 118.941057 Google Earth SO4 ABR153 60 June 2015 G
Well #5 #5 47.711509 118.940398 Google Earth SO5 BHP252 June 2015 G
* See "Purveyor Well Identifier Form Instructions" for information on "measuring Point"

Data Collection - Well Inventory and Identifiers (Use additional sheets as necessary)
S:\EPH\DW\Headquarters Operations\Policy & Rules Section\Mid-Columbia\Andrea's Mid Columbia Report Documents\Mid Columbia\Materials for Report\Wilbur Well Identifier.xlsx
Water System Name: Town of Wilbur Contact Name: Jeremy McElyea Contact Phone: (509) 647-5821
Well Name Well Number
USGS SiteID/SiteName
470910122160301
Latitude Longitude Location Method
DOH Source Id. (i.e. SO4)
DOE Well Tag
DOE Well Log Number/ID
Measuring
Point in 100th Ft.*
Month Year Total Production Units
EXAMPLE - Water Co. well #1 #1 19N/04E-11D02 47.15154545 -122.429444 GPS, NAD83 S01 ABC123 123456 1.01 March 2009 18,056,000 G
West Well #3 47.763285 118.715518 Google Earth SO2 ABR562 June 2015 G
East Well #4 47.759917 118.696345 Google Earth SO1 ABR561 June 2015 G
* See "Purveyor Well Identifier Form Instructions" for information on "measuring Point"
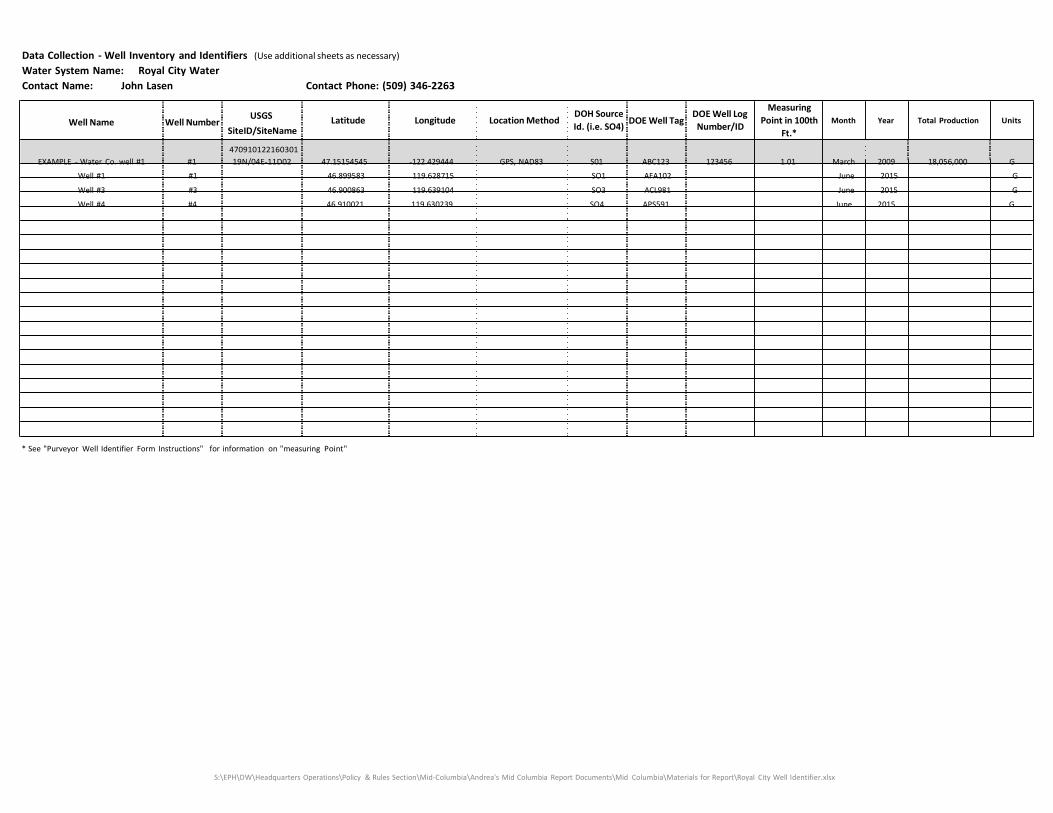
Data Collection - Well Inventory and Identifiers (Use additional sheets as necessary)
S:\EPH\DW\Headquarters Operations\Policy & Rules Section\Mid-Columbia\Andrea's Mid Columbia Report Documents\Mid Columbia\Materials for Report\Royal City Well Identifier.xlsx
Water System Name: Royal City Water Contact Name: John Lasen Contact Phone: (509) 346-2263
Well Name Well Number
USGS SiteID/SiteName
470910122160301
Latitude Longitude Location Method
DOH Source Id. (i.e. SO4)
DOE Well Tag
DOE Well Log Number/ID
Measuring
Point in 100th Ft.*
Month Year Total Production Units
EXAMPLE - Water Co. well #1 #1 19N/04E-11D02 47.15154545 -122.429444 GPS, NAD83 S01 ABC123 123456 1.01 March 2009 18,056,000 G
Well #1 #1 46.899583 119.628715 SO1 AFA102 June 2015 G
Well #3 #3 46.900863 119.639104 SO3 ACL981 June 2015 G
Well #4 #4 46.910021 119.630239 SO4 APS591 June 2015 G
* See "Purveyor Well Identifier Form Instructions" for information on "measuring Point"

Data Collection - Well Inventory and Identifiers (Use additional sheets as necessary)
S:\EPH\DW\Headquarters Operations\Policy & Rules Section\Mid-Columbia\Andrea's Mid Columbia Report Documents\Mid Columbia\Materials for Report\Odessa Well Identifier.xlsx
Water System Name: Town of Odessa Contact Name: Rod Webster Contact Phone: (509) 982-2201
Well Name Well Number
USGS SiteID/SiteName
470910122160301
Latitude Longitude Location Method
DOH Source Id. (i.e. SO4)
DOE Well Tag
DOE Well Log Number/ID
Measuring
Point in 100th Ft.*
Month Year Total Production Units
EXAMPLE - Water Co. well #1 #1 19N/04E-11D02 47.15154545 -122.429444 GPS, NAD83 S01 ABC123 123456 1.01 March 2009 18,056,000 G
Well #3 #3 47.323482 118.690024 Google Earth SO2 ABR073 18 June 2015 G
Well #4 #4 47.325372 118.675845 Google Earth SO3 ABR564 June 2015 G
* See "Purveyor Well Identifier Form Instructions" for information on "measuring Point"

Data Collection - Well Inventory and Identifiers (Use additional sheets as necessary)
S:\EPH\DW\Headquarters Operations\Policy & Rules Section\Mid-Columbia\Andrea's Mid Columbia Report Documents\Mid Columbia\Materials for Report\George Well Identifier.xlsx
Contact Name: City of George Contact Name: Joe Schone Contact Phone: (509) 785-5081
Well Name Well Number
USGS SiteID/SiteName
470910122160301
Latitude Longitude Location Method
DOH Source Id. (i.e. SO4)
DOE Well Tag
DOE Well Log Number/ID
Measuring
Point in 100th Ft.*
Month Year Total Production Units
EXAMPLE - Water Co. well #1 #1 19N/04E-11D02 47.15154545 -122.429444 GPS, NAD83 S01 ABC123 123456 1.01 March 2009 18,056,000 G
Well #1 #1 47.084871 119.856401 Google Earth SO1 ABR079 June 2015 G
Well #2 #2 47.085077 119.856287 Google Earth SO1 ABR743 28.5 June 2015 G
Well #3 #3 47.072788 119.859515 Google Earth SO4 AFL689 June 2015 G
* See "Purveyor Well Identifier Form Instructions" for information on "measuring Point"

Data Collection - Well Inventory and Identifiers (Use additional sheets as necessary)
S:\EPH\DW\Headquarters Operations\Policy & Rules Section\Mid-Columbia\Andrea's Mid Columbia Report Documents\Mid Columbia\Materials for Report\Daveport Well Identifier.xlsx
Water System Name: Davenport Water Division Contact Name: Fred Bell Contact Phone: (509) 725-4352
Well Name Well Number
USGS SiteID/SiteName
470910122160301
Latitude Longitude Location Method
DOH Source Id. (i.e. SO4)
DOE Well Tag
DOE Well Log Number/ID
Measuring
Point in 100th Ft.*
Month Year Total Production Units
EXAMPLE - Water Co. well #1 #1 19N/04E-11D02 47.15154545 -122.429444 GPS, NAD83 S01 ABC123 123456 1.01 March 2009 18,056,000 G
#6 47.647462 118.158333 Google Earth SO6 ABR081 20.25 June 2015 G
#7 47656471 118.14619 Google Earth SO7 ABJ061 38.5 June 2015 G
* See "Purveyor Well Identifier Form Instructions" for information on "measuring Point"

AWWA WLCC Free Water Audit Software: Reporting Worksheet Back to Instructions
Copyright © 2010, American Water Works Association. All Rights Reserved. WAS v4.2
? Click to access definition
Water Audit Report for: davenport water division
Reporting Year: 2014 10/2012 - 10/2013
Please enter data in the white cells below. Where available, metered values should be used; if metered values are unavailable please estimate a value. Indicate your confidence in the accuracy of the input data by grading each component (1-10) using the drop-down list to the left of the input cell. Hover the mouse over the cell to obtain a description of the grades
All volumes to be entered as: MILLION GALLONS (US) PER YEAR
WATER SUPPLIED Volume from own sources: ?
<< Enter grading in column 'E'
3 174.800 Million gallons (US)/yr (MG/Yr) Master meter error adjustment (enter positive value): ? 3 8.740 under-registered MG/Yr
Water imported: ? Water exported: ?
0.000 MG/Yr 0.000 MG/Yr
WATER SUPPLIED: 183.540 MG/Yr
AUTHORIZED CONSUMPTION Click here: ?
Billed metered: ? Billed unmetered: ?
3 129.700 MG/Yr 0.000 MG/Yr
for help using option buttons below
Unbilled metered: ?
Unbilled unmetered: ?
0.000 MG/Yr Pcnt: Value:
2.294 MG/Yr 1.25% Default option selected for Unbilled unmetered - a grading of 5 is applied but not displayed
AUTHORIZED CONSUMPTION: ? 131.994 MG/Yr Use buttons to select percentage of water supplied
OR value
WATER LOSSES (Water Supplied - Authorized Consumption) 51.546 MG/Yr
Apparent Losses Pcnt: Value:
Unauthorized consumption: ? 0.459 MG/Yr 0.25% Default option selected for unauthorized consumption - a grading of 5 is applied but not displayed
Customer metering inaccuracies: ? 3 6.826 MG/Yr 5.00% Systematic data handling errors: ? 0.000 MG/Yr
Systematic data handling errors are likely, please enter a non-zero value; otherwise grade = 5 Choose this option to enter a percentage of
Apparent Losses: ?
Real Losses (Current Annual Real Losses or CARL)
Real Losses = Water Losses - Apparent Losses: ?
7.285 44.261 MG/Yr
billed metered ? consumption. This is
NOT a default value
WATER LOSSES: 51.546 MG/Yr
NON-REVENUE WATER
NON-REVENUE WATER: ?
53.840 MG/Yr
= Total Water Loss + Unbilled Metered + Unbilled Unmetered
SYSTEM DATA
Length of mains: ? Number of active AND inactive service connections: ?
6 16.3 miles
7 900 Connection density: 55 conn./mile main
Average length of customer service line: ?
Average operating pressure: ?
7 12.0 ft
6 50.0 psi
(pipe length between curbstop and customer meter or property boundary)
COST DATA
Total annual cost of operating water system: ? 7 $406,982 $/Year
Customer retail unit cost (applied to Apparent Losses): ? 8 $3.22 $/100 cubic feet (ccf) Variable production cost (applied to Real Losses): ? 8 $251.00 $/Million gallons
PERFORMANCE INDICATORS
Financial Indicators
Non-revenue water as percent by volume of Water Supplied: 29.3% Non-revenue water as percent by cost of operating system: 10.6%
Annual cost of Apparent Losses: $31,359 Annual cost of Real Losses: $11,109
Operational Efficiency Indicators
Apparent Losses per service connection per day: 22.18 gallons/connection/day
Real Losses per service connection per day*: 134.74 gallons/connection/day
Real Losses per length of main per day*: N/A
Real Losses per service connection per day per psi pressure: 2.69 gallons/connection/day/psi
? Unavoidable Annual Real Losses (UARL): Not Valid *** UARL cannot be calculated as either average pressure, number of connecions or length of mains is too small: SEE UARL DEFINITION ***
From Above, Real Losses = Current Annual Real Losses (CARL): 44.26
? Infrastructure Leakage Index (ILI) [CARL/UARL]:
* only the most applicable of these two indicators will be calculated
WATER AUDIT DATA VALIDITY SCORE:
*** YOUR SCORE IS: 46 out of 100 ***
A weighted scale for the components of consumption and water loss is included in the calculation of the Water Audit Data Validity Score
PRIORITY AREAS FOR ATTENTION:
Based on the information provided, audit accuracy can be improved by addressing the following components:
1: Volume from own sources
2: Master meter error adjustment
3: Billed metered
For more information, click here to see the Grading Matrix worksheet
AWWA Water Loss Control Committee Reporting Worksheet 1
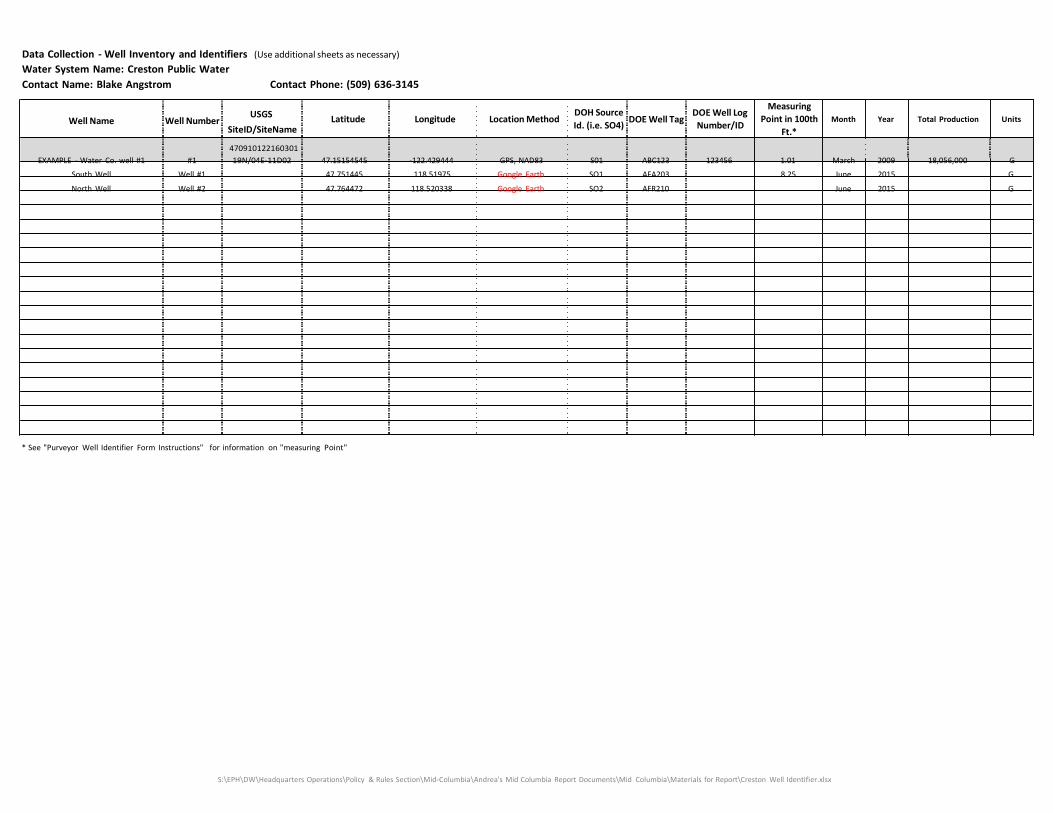
Data Collection - Well Inventory and Identifiers (Use additional sheets as necessary) Water System Name: Creston Public Water Contact Name: Blake Angstrom Contact Phone: (509) 636-3145
Well Name Well Number
USGS SiteID/SiteName
470910122160301
Latitude Longitude Location Method
DOH Source Id. (i.e. SO4)
DOE Well Tag
DOE Well Log Number/ID
Measuring
Point in 100th Ft.*
Month Year Total Production Units
EXAMPLE - Water Co. well #1 #1 19N/04E-11D02 47.15154545 -122.429444 GPS, NAD83 S01 ABC123 123456 1.01 March 2009 18,056,000 G
South Well Well #1 47.751445 118.51975 Google Earth SO1 AFA203 8.25 June 2015 G
North Well Well #2 47.764472 118.520338 Google Earth SO2 AFR210 June 2015 G
* See "Purveyor Well Identifier Form Instructions" for information on "measuring Point"
S:\EPH\DW\Headquarters Operations\Policy & Rules Section\Mid-Columbia\Andrea's Mid Columbia Report Documents\Mid Columbia\Materials for Report\Creston Well Identifier.xlsx


