Mid-Coast Bacteria TWG 17th Meeting (final) - oregon.gov · Mid-Coast Bacteria TMDL: Seventeenth...
41
Mid-Coast Bacteria TMDL: Seventeenth TWG Meeting Mid Coast Bacteria TMDL: Seventeenth TWG Meeting Kevin Brannan Oregon DEQ A il 13 2016 April 13, 2016
Transcript of Mid-Coast Bacteria TWG 17th Meeting (final) - oregon.gov · Mid-Coast Bacteria TMDL: Seventeenth...

Mid-Coast Bacteria TMDL: Seventeenth TWG MeetingMid Coast Bacteria TMDL: Seventeenth TWG Meeting
Kevin BrannanOregon DEQA il 13 2016April 13, 2016

Meeting Objectives
• Updates and Announcements from TWG members• Load Duration Curves StatusLoad Duration Curves Status• Beaches Status• Big Elk Creek Modelingg g• Other modeling
Slide 2

Load Duration Curve based TMDLs - Status
• Compiling reports• Conducting additional analysisConducting additional analysis
– Source characterization– Estuary
Slide 3

Beach TMDLs
• Compiling reports• Additional source characterizationAdditional source characterization• Additional monitoring
Slide 4

Watershed Modeling: Big Elk Creek
• Extended the simulation period– Updated simulation period 1995-10-01 to 2014-05-31Updated simulation period 1995 10 01 to 2014 05 31– Previous simulation period 1995-10-01 to 2010-12-31
• Model calibration re-done• Model parameter uncertainty analysis re-done• Contractor reviewing overall model
F d d f USEPA– Funded form USEPA– Methods for review developed– Completion Nov 2015
Slide 5
Completion Nov 2015

Watershed Modeling: Big Elk Creek
Slide 6

Big Elk Creek: Extended the simulation periodDaily Total Precip
Previous
Slide 7
Updated

Big Elk Creek: Extended the simulation periodAverage Annual Precip
Previous
Slide 8
Updated

Big Elk Creek: Extended the simulation periodAnnual Total Precip
Previous
Slide 9
Updated
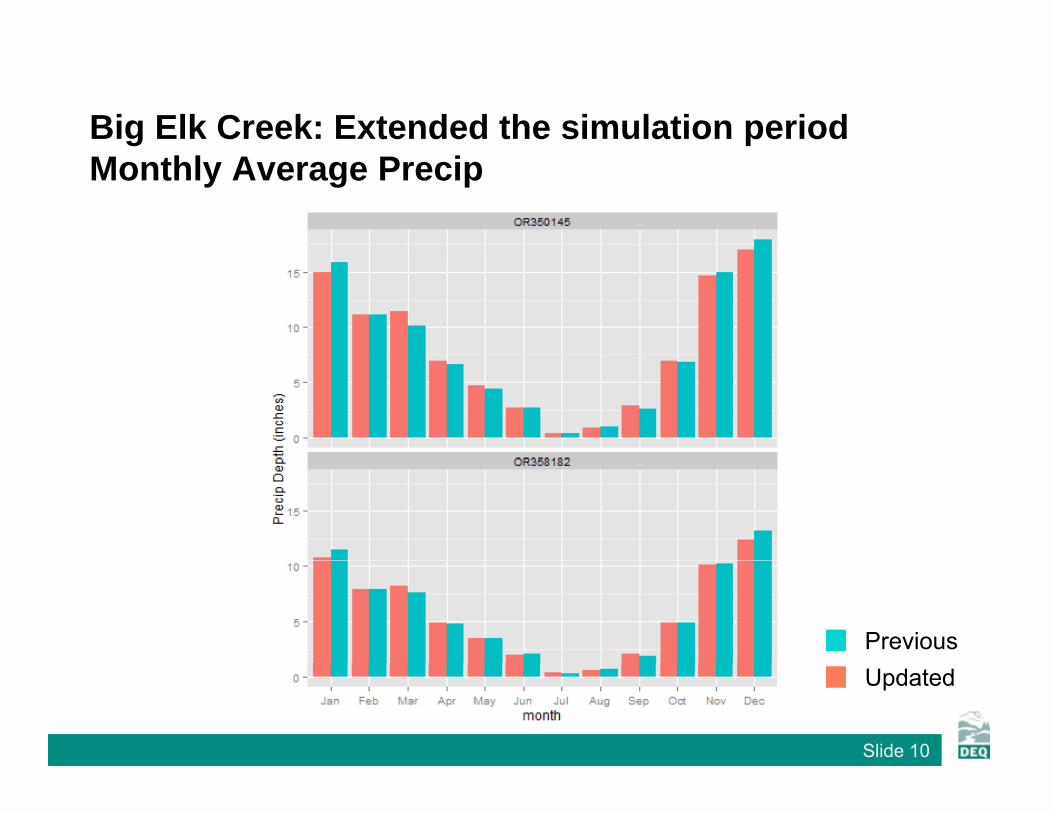
Big Elk Creek: Extended the simulation periodMonthly Average Precip
Previous
Slide 10
Updated

Model Calibration
• Calibrated 24 parameters• Varied by land useVaried by land use
(forest, pasture or residential-transportation• Varied by soil permeability
(high and low permeable areas related to elevation)• Calibrated parameters related to:
Soil infiltration along with surface and sub surface storage– Soil, infiltration along with surface and sub-surface storage– Sub-surface flow, interflow and groundwater flow– Plants, ET and interception
Slide 11

Parameter Names and DescriptionsParameter Name Parameter Description
LZSN Lower zone nominal soil moisture storage
INFILT Index to mean soil infiltration rate
AGWRC Groundwater recession rate
DEEPFR Fraction of infiltrating water lost to deep aquifers
BASETP ET by riparian vegetation as active groundwater enters streambedBASETP ET by riparian vegetation as active groundwater enters streambed
AGWET Fraction of watershed subject to direct evaporation from groundwater storage
UZSN Nominal upper zone soil moisture storagepp g
INTFW Interflow coefficient
IRC Interflow recession coefficient
CEPSC M i i it ti i t ti
Slide 12
CEPSC Maximum precipitation interception
LZETP Index to lower zone evapotranspiration

Calibration Performance MeasuresCalibration Performance MeasuresDefinitions
• Log-transformed daily mean flows (qlog)• Total flow volumes (QT t l)Total flow volumes (QTotal)• Summer (June - August) flow volumes (Qsmr)• Winter (December - March) flow volumes (Qwtr)( ) ( wtr)• Storm volumes and peak flows for selected storm periods
(Qstm-i and qpeak-i for the i-th storm)Fl d i i i ( d i f• Flow duration statistics (exceedance times for q5%, q10%, q25%, q50% and q95% flows)
• Baseflow index (the ratio of groundwater outflow to total
Slide 13
Baseflow index (the ratio of groundwater outflow to total outflow from pervious land segments, b-index)

Watershed Modeling: Big Elk Creek
Period Start End Years StormsOriginal 1995-10-01 2010-12-31 15 18Updated 1995-10-01 2014-05-31 19 23
Slide 14

Calibration Performance Measures:Calibration Performance Measures: Original Period
Flow Statistic Observed Modeled Percent ErrorQTotal (in/yr) 53.12 52.87 -0.5%Qsmr (in/yr) 2.11 2.09 -0.8%Qwtr (in/yr) 28.31 27.15 -4.1%Q t (in/yr) 4 39 3 89 -11 4%Qstm (in/yr) 4.39 3.89 11.4%qmean (cfs) 2,350 2,176 -7.4%Baseflow Index 0.44 0.41 -6.0%
Slide 15

Calibration Performance Measures:Calibration Performance Measures: Updated Period
Flow Statistic Observed Modeled Percent ErrorQTotal (acre-ft) 52.44 51.51 -1.8%Qsmr (acre-ft) 2.08 2.05 -1.1%Qwtr (acre-ft) 29.76 28.25 -5.1%Q t (acre-ft) 3 70 3 29 -11 0%Qstm (acre ft) 3.70 3.29 11.0%qmean (cfs) 1,872 1,786 -4.6Baseflow Index 0.44 0.435 -1.0%
Slide 16

Calibration Performance Measures:Calibration Performance Measures: Updated Period
Flow Statistic Original UpdatedQTotal (acre-ft) -0.5% -1.8%Qsmr (acre-ft) -0.8% -1.1%Qwtr (acre-ft) -4.1% -5.1%Q t (acre-ft) -11 4% -11 0%Qstm (acre ft) 11.4% 11.0%qmean (cfs) -7.4% -4.6Baseflow Index -6.0% -1.0%
Slide 17

Flow Duration Curves
Original Period Updated Period
Slide 18

Flow Duration Curves
Slide 19

Uncertainty Analysis Re-Do
• Original– Generate random parameter values without considering
parameter covariance– Run model for each parameter set– sub-set based on USGS FDCsub set based on USGS FDC
• Updated– use Covariance Matrix to generate random parameter
values– Constrain random parameters by calibration – sub-set based on USGS FDC
Slide 20
sub set based on USGS FDC
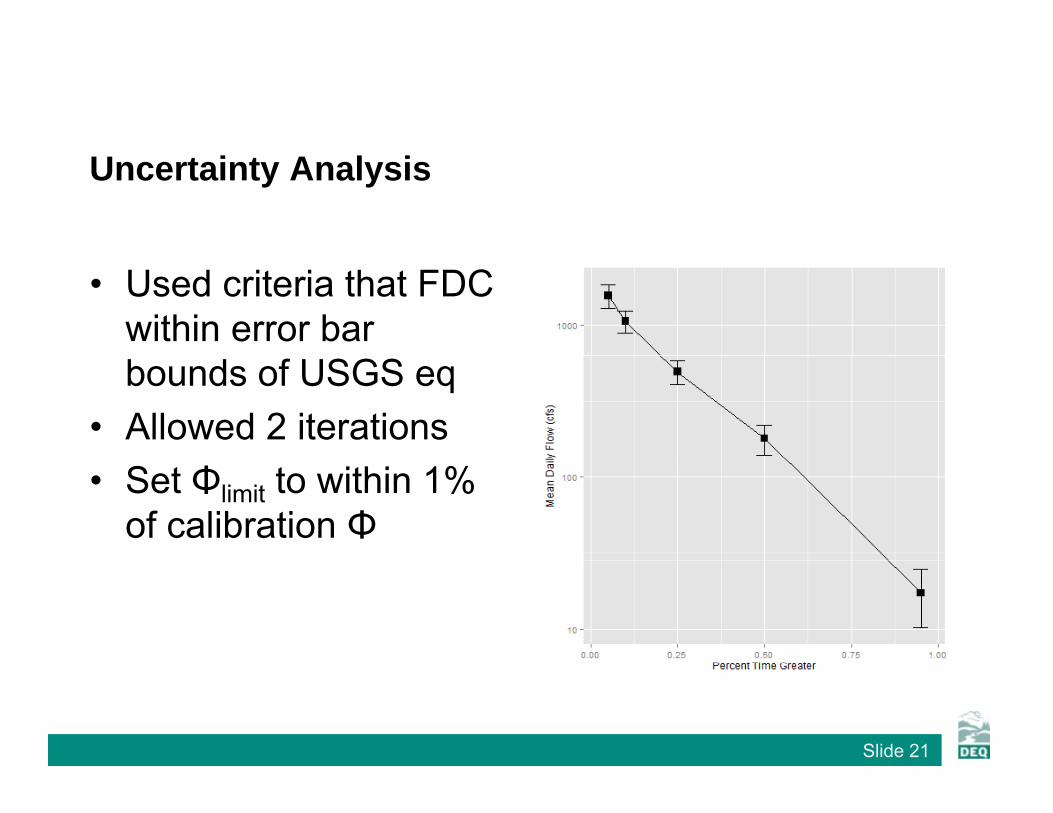
Uncertainty Analysis
• Used criteria that FDC within error bar bounds of USGS eq
• Allowed 2 iterations• Set Φlimit to within 1%
of calibration Φ
Slide 21

Flow Duration Curves
Slide 22

Select Uncertainty Analysis Runs
• None of the runs within UGS Eq error bars• Vary number of points within error barsVary number of points within error bars
– 5 out of 5 points = no runs out of 1,000– 4 out of 5 points = 47 runs out of 1,000– 3 out of 5 points = 636 runs out of 1,000– 2 out of 5 points = 984 runs out of 1,000
1 out of 5 points = 995 runs out of 1 000– 1 out of 5 points = 995 runs out of 1,000• None of the runs with value within error bar for lowest flow• Redo with tighter range and more calibration constraints
Slide 23
Redo with tighter range and more calibration constraints

Additional calibration????
• Do additional hydrologic calibration?• Include hydrologic calibration in water quality calibration?Include hydrologic calibration in water quality calibration?• Use current hydrologic calibration and move on to water
quality calibration
Slide 24

Watershed Modeling: Big Elk Creek
Slide 25

Watershed Modeling: Big Elk Creek (continued)
• Current ODEQ work– Conduct hydrologic parameter estimation/uncertaintyConduct hydrologic parameter estimation/uncertainty
analysis for new simulation period– Setup bacteria model for new simulation period
C ti t i t TWG f db k i t b t i b– Continue to incorporate TWG feedback into bacteria sub-model input
• Compile reportp p
Slide 26

Additional Watershed Modeling:Additional Watershed Modeling:Upper Yaquina River
• Develop watershed model like Big Elk CreekS t i l t ti• Support implementation
• Begin model development for Yaquinadevelopment for Yaquina River
• Contractor began work J 2015June-2015
Slide 27

Additional Watershed Modeling:Additional Watershed Modeling:Upper Yaquina River
• Utilize information from Big Elk Creek modeling
WDM file– WDM file– Hydro parameters– Bacteria input– …
Slide 28

Watershed Modeling: Upper Yaquina River
• Utilize information from Big Elk Creek modeling
WDM file– WDM file– Hydro parameters– Bacteria input– Model review– …
• Completion estimatedCompletion estimated toward end of 2016
Slide 29

Additional Watershed Modeling:Additional Watershed Modeling:Upper Yaquina River
• Use for implementation and possibly for DO TMDL• Hydrologic calibration – used Big Elk parameter valuesHydrologic calibration used Big Elk parameter values
without modification • Pause on bacteria modeling
Slide 30

Mean Daily FlowAvg Monthly Rainfall (in)Avg Observed Flow (10/1/2003 to 9/30/2014 )Avg Modeled Flow (Same Period)
0
2
46000
7000
8000
n)
Avg Modeled Flow (Same Period)
4
6
8
103000
4000
5000
ily R
ain
fall
(in
Flo
w (
cfs
)
10
12
140
1000
2000
Oct-03 Apr-05 Oct-06 Apr-08 Oct-09 Apr-11 Oct-12 Apr-14
Da
Oct 03 Apr 05 Oct 06 Apr 08 Oct 09 Apr 11 Oct 12 Apr 14
Date
Slide 31
Model DSN 262 vs. S 14306030 Yaquina River Near Chitwood, Oregon

Mean Monthly FlowAvg Monthly Rainfall (in)Avg Observed Flow (10/1/2003 to 9/30/2014 )Avg Modeled Flow (Same Period)
20
25
800
1000
1200
(in)
g ( )
10
15
400
600
800
nth
ly R
ain
fall
Flo
w (
cfs
)
0
5
0
200
O-03 A-05 O-06 A-08 O-09 A-11 O-12 A-14
Mon
O-03 A-05 O-06 A-08 O-09 A-11 O-12 A-14
Month
Slide 32
Model DSN 262 vs. S 14306030 Yaquina River Near Chitwood, Oregon

Monthly Regression and Temporal VariationAvg Flow (10/1/2003 to 9/30/2014 )Line of Equal Value
Avg Observed Flow (10/1/2003 to 9/30/2014 )Avg Modeled Flow (10/1/2003 to 9/30/2014 )
y = 0.9386x + 24.609R² = 0.94941000
1200
w (
cfs
)
Best-Fit Line
80%
90%
100%
+ M
od
)
g ( )Line of Equal Value
600
800
Mo
de
led
Flo
w
40%
50%
60%
70%
ance
(O
bs +
0
200
400
Ave
rag
e M
0%
10%
20%
30%
Wa
ter
Ba
l
00 200 400 600 800 1000 1200
Average Observed Flow (cfs)
0%O-03 A-05 O-06 A-08 O-09 A-11 O-12 A-14
Month
Slide 33
Model DSN 262 vs. S 14306030 Yaquina River Near Chitwood, Oregon

Seasonal Regression and Temporal AggregateAvg Flow (10/1/2003 to 9/30/2014)Line of Equal ValueBest-Fit Line
Avg Monthly Rainfall (in)Avg Observed Flow (10/1/2003 to 9/30/2014)Avg Modeled Flow (Same Period)
y = 0.9551x + 20.773R² = 0.9862
600
800
w (
cfs)
Oct Nov Dec Jan Feb Mar Apr May Jun Jul Aug Sep0
2600
800
(in)
g ( )
400
Mo
de
led
Flo
w
4
6
8
400
hly
R
ain
fall
Flo
w (
cfs
)
0
200
Ave
rag
e 8
10
120
200
Mo
nth
0 200 400 600 800
Average Observed Flow (cfs)
10 11 12 1 2 3 4 5 6 7 8 9
Month
Slide 34
Model DSN 262 vs. S 14306030 Yaquina River Near Chitwood, Oregon

Seasonal Medians and Ranges
0900
Observed (25th, 75th) Average Monthly Rainfall (in)Median Observed Flow (10/1/2003 to 9/30/2014) Modeled (Median, 25th, 75th)
Oct Nov Dec Jan Feb Mar Apr May Jun Jul Aug Sep0
2
4600
700
800
900
(in)
4
6
8300
400
500
600
thly
R
ain
fall
Flo
w (
cfs
)
8
10
120
100
200
300
Mo
nt
10 11 12 1 2 3 4 5 6 7 8 9
Month
Slide 35
Model DSN 262 vs. S 14306030 Yaquina River Near Chitwood, Oregon

Observed Flow Duration (10/1/2003 to 9/30/2014 )
Modeled Flow Duration (10/1/2003 to 9/30/2014 )
Flow Duration Curves
1000
10000
s)( )
100
1000
rag
e F
low
(cfs
10Da
ily A
ve
10% 10% 20% 30% 40% 50% 60% 70% 80% 90% 100%
Percent of Time that Flow is Equaled or Exceeded
Slide 36
Percent of Time that Flow is Equaled or Exceeded

Observed Flow Volume (10/1/2003 to 9/30/2014 )
Normalized Cumulative Flow
100%
120%
10
0%
)Modeled Flow Volume (10/1/2003 to 9/30/2014 )
80%
100%
(Ob
se
rve
d a
s 1
40%
60%
Flo
w V
olu
me
(
0%
20%
Oct-03 Apr-05 Oct-06 Apr-08 Oct-09 Apr-11 Oct-12 Apr-14
No
rma
lize
d
Slide 37

HSPF Simulated Flow Observed Flow Gage
REACH OUTFLOW FROM DSN 262 S 14306030 Yaquina River near Chitwood, Oregon
11-Year Analysis Period: 10/1/2003 - 9/30/2014 Flow volumes are (inches/year) for upstream drainage area Manually Entered Data
Drainage Area (sq-mi): 71
Total Simulated In stream Flow: 45 92 Total Observed In stream Flow: 43 95Total Simulated In-stream Flow: 45.92 Total Observed In-stream Flow: 43.95
Total of simulated highest 10% flows: 22.53 Total of Observed highest 10% flows: 20.43Total of Simulated lowest 50% flows: 4.07 Total of Observed Lowest 50% flows: 3.41
Simulated Summer Flow Volume (months 7-9): 1.36 Observed Summer Flow Volume (7-9): 0.96( ) ( )Simulated Fall Flow Volume (months 10-12): 13.74 Observed Fall Flow Volume (10-12): 13.09Simulated Winter Flow Volume (months 1-3): 21.95 Observed Winter Flow Volume (1-3): 21.89Simulated Spring Flow Volume (months 4-6): 8.88 Observed Spring Flow Volume (4-6): 8.02
Total Simulated Storm Volume: 20.69 Total Observed Storm Volume: 14.11Si l t d S St V l (7 9) 0 30 Ob d S St V l (7 9) 0 15Simulated Summer Storm Volume (7-9): 0.30 Observed Summer Storm Volume (7-9): 0.15
Errors (Simulated-Observed) Error Statistics Recommended Criteria
Error in total volume: 4.48 10Error in 50% lowest flows: 19.36 10Error in 10% highest flows: 10.27 15Seasonal volume error - Summer: 41.02 30Seasonal volume error - Fall: 4.96 30Seasonal volume error - Winter: 0.27 30Seasonal volume error - Spring: 10.78 30Error in storm volumes: 46.55 20Error in summer storm volumes: 105 65 50
>> Clear
Slide 38
Error in summer storm volumes: 105.65 50Nash-Sutcliffe Coefficient of Efficiency, E: 0.643Baseline adjusted coefficient (Garrick), E': 0.611 Monthly NSE 0.933
Model accuracy increases

Calibration Performance Measures
Flow Statistic Observed Modeled Percent ErrorQTotal (in) 44.0 45.92 4.8%Qsmr (in) 1.0 1.36 41.0%Qwtr (in) 21.9 22.0 0.27%Q t (in) 14 1 20 69 46 6%Qstm (in) 14.1 20.69 46.6%
Slide 39
Next Steps
• Big Elk Creek– Finish uncertainty analysis for hydrology simulationFinish uncertainty analysis for hydrology simulation– Conduct bacteria modeling– Continue compiling report
• Upper Yaquina River on hold• Compile LDC and Beach reports
Slide 40
Discussion
Slide 41Slide 41