Microstructural Control in Hot Working of IN-718...
10
Microstructural Control in Hot Working of IN-718 Superalloy Using Processing Map N. SRINIVASAN and Y.V.R.K. PRASAD The hot-working characteristics of IN-718 are studied in the temperature range 900 ~ to 1200 ~ and strain rate range 0.001 to 100 s -~ using hot compression tests. Processing maps for hot working are developed on the basis of the strain-rate sensitivity variations with temperature and strain rate and interpreted using a dynamic materials model. The map exhibits two domains of dynamic recrystaUization (DRX): one occurring at 950 ~ and 0.001 s -~ with an efficiency of power dissipation of 37 pct and the other at 1200 ~ and 0.1 s -1 with an efficiency of 40 pet. Dynamic recrystallization in the former domain is nucleated by the ~(Ni3Nb) precipitates and results in fine-grained microstructure. In the high-temperature DRX domain, carbides dissolve in the matrix and make interstitial carbon atoms available for increasing the rate of dislocation generation for DRX nucleation. It is recommended that IN-718 may be hot-forged initially at 1200~ and 0.1 s -l and finish-forged at 950 ~ and 0.001 s -1 so that fine-grained structure may be achieved. The available forging practice validates these results from processing maps. At temperatures lower than 1000 ~ and strain rates higher than 1 s -l, the material exhibits adiabatic shear bands. Also, at temperatures higher than 1150 ~ and strain rates more than 1 s -1, IN-718 exhibits intercrystalline cracking. Both these regimes may be avoided in hot- working IN-718. I. INTRODUCTION THE nickel-base superalloy IN-718" is used for sev- *IN-718 is a trademark of Huntington Alloys, Huntington, WV. oral critical gas-turbine components, many of which are hot-forged. For obtaining required low-cycle fatigue and fracture properties, it is essential that the microstructure is controlled at the processing stage. For example, in the turbine disc application, a fine-grained structure is pre- ferred for which the technology of forging and thermo- mechanical processing are described. [L2] The hot ductility of IN-718 tested under tension in the temperature range of 1000 0(2 to 1050 ~ reaches its peak value at a strain rate of about 2.5 s-l. t3] Recently, Chaudhury et al. [4] have developed a processing map for hot deformation of IN-718 in the temperature range of 975 ~ to 1150 ~ and in the strain-rate range of 0.01 to 25 s -~ and interpreted the map in terms of dynamic recrystallization (DRX) mech- anism and phase changes occurring in the material. As the commercial forging practice involves initial forging at high temperatures (>1150 ~ and finish forging be- low 980 ~ to obtain fine-grained structures, it will be beneficial if data are obtained in wider temperature and strain-rate ranges. The purpose of the present investi- gation is to evaluate the hot deformation behavior in wide temperature and strain-rate ranges and generate a pro- cessing map for hot working of IN-718 with a view to optimizing its workability and microstructure during pro- cessing. Processing maps are developed on the basis of the dynamic materials model, tS] which is reviewed by Gegel et al. I6] and Alexander. t71The model considers the N. SRINIVASAN, Graduate Student, and Y.V.R.K. PRASAD, Professor and Chairman, are with the Department of Metallurgy, Indian Institute of Science, Bangalore 560012, India. Manuscript submitted October 26, 1993. workpiece as a dissipator of power, and the instanta- neous power dissipated at a given strain rate (~) consists of two complementary parts: G content and J cocontent representing the temperature rise and microstructural dissipation, respectively. The factor that partitions power between J and G is the strain-rate sensitivity (m) of flow stress (Or). The J cocontent is given bytS] where ~ is strain rate. For an ideal linear dissipator, J = Jn~x = Or. g/2 and the efficiency of power dissi- pation of a nonlinear dissipator may be expressed in terms of a dimensionless parameter: J 2m 7/ J~ (m + 1) [2] The variation of ,/with temperature and strain rate con- stitutes the power dissipation map, the domains of which may be interpreted in terms of specific microstructural processes. The extremum principles of irreversible thermo- dynamics as applied to large plastic flowtsl axe applicable to the dynamic materials model. Kuma~9] and Prasad ~176 combined these principles with those of separability of power dissipation and obtained a continuum criterion for obtaining flow instability during hot deformation, and it is given by 0 In (m/m + 1) ~(~) = + m < 0 [3] 0 In The variation of the instability parameter ~(~) with temperature and strain rate is superimposed on the power dissipation map for delineating the regimes of flow in- stability where ~(g) is negative. METALLURGICAL AND MATERIALS TRANSACTIONS A VOLUME 25A, OCTOBER 1994--2275
Transcript of Microstructural Control in Hot Working of IN-718...

Microstructural Control in Hot Working of IN-718 Superalloy Using Processing Map
N. SRINIVASAN and Y.V.R.K. PRASAD
The hot-working characteristics of IN-718 are studied in the temperature range 900 ~ to 1200 ~ and strain rate range 0.001 to 100 s -~ using hot compression tests. Processing maps for hot working are developed on the basis of the strain-rate sensitivity variations with temperature and strain rate and interpreted using a dynamic materials model. The map exhibits two domains of dynamic recrystaUization (DRX): one occurring at 950 ~ and 0.001 s -~ with an efficiency of power dissipation of 37 pct and the other at 1200 ~ and 0.1 s -1 with an efficiency of 40 pet. Dynamic recrystallization in the former domain is nucleated by the ~(Ni3Nb) precipitates and results in fine-grained microstructure. In the high-temperature DRX domain, carbides dissolve in the matrix and make interstitial carbon atoms available for increasing the rate of dislocation generation for DRX nucleation. It is recommended that IN-718 may be hot-forged initially at 1200~ and 0.1 s -l and finish-forged at 950 ~ and 0.001 s -1 so that fine-grained structure may be achieved. The available forging practice validates these results from processing maps. At temperatures lower than 1000 ~ and strain rates higher than 1 s -l, the material exhibits adiabatic shear bands. Also, at temperatures higher than 1150 ~ and strain rates more than 1 s -1, IN-718 exhibits intercrystalline cracking. Both these regimes may be avoided in hot- working IN-718.
I. INTRODUCTION
THE nickel-base superalloy IN-718" is used for sev-
*IN-718 is a trademark of Huntington Alloys, Huntington, WV.
oral critical gas-turbine components, many of which are hot-forged. For obtaining required low-cycle fatigue and fracture properties, it is essential that the microstructure is controlled at the processing stage. For example, in the turbine disc application, a fine-grained structure is pre- ferred for which the technology of forging and thermo- mechanical processing are described. [L2] The hot ductility of IN-718 tested under tension in the temperature range of 1000 0(2 to 1050 ~ reaches its peak value at a strain rate of about 2.5 s-l. t3] Recently, Chaudhury et al. [4] have developed a processing map for hot deformation of IN-718 in the temperature range of 975 ~ to 1150 ~ and in the strain-rate range of 0.01 to 25 s -~ and interpreted the map in terms of dynamic recrystallization (DRX) mech- anism and phase changes occurring in the material. As the commercial forging practice involves initial forging at high temperatures (>1150 ~ and finish forging be- low 980 ~ to obtain fine-grained structures, it will be beneficial if data are obtained in wider temperature and strain-rate ranges. The purpose of the present investi- gation is to evaluate the hot deformation behavior in wide temperature and strain-rate ranges and generate a pro- cessing map for hot working of IN-718 with a view to optimizing its workability and microstructure during pro- cessing. Processing maps are developed on the basis of the dynamic materials model, tS] which is reviewed by Gegel et al. I6] and Alexander. t71 The model considers the
N. SRINIVASAN, Graduate Student, and Y.V.R.K. PRASAD, Professor and Chairman, are with the Department of Metallurgy, Indian Institute of Science, Bangalore 560012, India.
Manuscript submitted October 26, 1993.
workpiece as a dissipator of power, and the instanta- neous power dissipated at a given strain rate (~) consists of two complementary parts: G content and J cocontent representing the temperature rise and microstructural dissipation, respectively. The factor that partitions power between J and G is the strain-rate sensitivity (m) of flow stress (Or). The J cocontent is given by tS]
where ~ is strain rate. For an ideal linear dissipator, J = Jn~x = Or. g / 2 and the efficiency of power dissi- pation of a nonlinear dissipator may be expressed in terms of a dimensionless parameter:
J 2m 7/ J ~ (m + 1) [2]
The variation of ,/with temperature and strain rate con- stitutes the power dissipation map, the domains of which may be interpreted in terms of specific microstructural processes.
The extremum principles of irreversible thermo- dynamics as applied to large plastic flow tsl axe applicable to the dynamic materials model. Kuma~ 9] and Prasad ~176 combined these principles with those of separability of power dissipation and obtained a continuum criterion for obtaining flow instability during hot deformation, and it is given by
0 In ( m / m + 1) ~(~) = + m < 0 [3]
0 In
The variation of the instability parameter ~(~) with temperature and strain rate is superimposed on the power dissipation map for delineating the regimes of flow in- stability where ~(g) is negative.
METALLURGICAL AND MATERIALS TRANSACTIONS A VOLUME 25A, OCTOBER 1994--2275

II. EXPERIMENTAL
The chemical composition (wt pct) of IN-718 material used in this investigation is given in Table I. Cylindrical hot compression specimens of 8-mm diameter and 12-mm height were used. Concentric grooves of about 0.5-mm depth were engraved on the specimen faces to facilitate the retention of lubricant. A chamfer of 1 mm at 45 deg was machined along the edges of the face to avoid fold over in the initial stages of the compression. A 0.5-mm diameter hole was drilled to a depth of 4 mm at half the height of the specimen for insertion of a thermocouple.
Hot compression tests were conducted in the temper- ature range 900 ~ to 1200 ~ and in the strain-rote range of 0.001 to 100 s -1. A computer-controlled servo- hydraulic machine (DARTEC, Stourhridge, West Midlands, UK) was used in this investigation. The ma- chine could be operated with an exponential decay of actuator speed with time to give constant true-strain rate with strain. In arriving at the exponential decay equation for the stroke variation, the small elastic deflections of the machine and the grips were neglected. The accuracy of temperature controller was within -+ 2 deg and the adi- abatic temperature rise during compression was mea- sured with a thermocouple embedded in the specimen. From the load-stroke data, true stress-true strain values were calculated using standard equations. The flow stress data obtained at different temperatures and strain rates were corrected for the adiabatic temperature rise using linear interpolation of log or vs (1/T), and this correction was found to be significant at lower temperatures and higher strain rates. Power dissipation maps were con- structed using these data. The following computational procedure was adopted for this purpose: log flow stress vs log strain-rate data at a constant temperature and strain were fitted using a cubic spline function, and the strain- rate sensitivity (m) was calculated as a function of strain rate. The procedure was repeated at different tempera- tures. The efficiency of power dissipation through microstructural changes 7/ = 2 m / ( m + 1) was then cal- culated from a set of m values as a function of strain rate and temperature and plotted as a three-dimensional (3-D) map. The 3-D variation of efficiency was projected as isoefficiency contour map onto the strain-rate tempera- ture plane.
Specimens deformed under conditions of different do- mains were sectioned longitudinally (parallel to the compression axis) for optical metallographic examina- tion. The cut surface was mechanically polished using standard techniques and etched electrolytically in a so- lution of 20 pet HC1 and 80 pct methanol.
The tensile ductility of the material was measured using cylindrical specimens of 4-mm diameter and 25-mm gage
Table I . C h e m i c a l Composition (in Weight Percent) and Initial Grain Size of IN-718
Initial Grain Material Chemical Composition (Wt Pct) Size (/~m)
IN-718 19.0Cr, 18.5Fe, 5.1Nb, 3.0Mo, 6 0.04C, 0.5A1, 0.9Ti, 0.2Si, Ni-balance
2276--VOLUME 25A, OCTOBER 1994
length at different temperatures (900 ~ to 1200 ~ and strain rates of 0.001 and 0.1 s -1.
I lL RESULTS
The initial microstructure of the material used in this investigation is shown in Figure 1, which exhibits fine- grained structure.
Typical true stress-true strain curves obtained at 950 ~ and 1150 ~ are shown in Figures 2(a) and (b). These represent typical behavior of the material at temperatures below and above the 8-phase dissolution temperature (1040 ~ The curves exhibit flow softening, which is significant at strain rates higher than 1 s -1. The flow stress data corrected for adiabatic temperature rise are given in Table II, as a function of temperature, strain rate, and strain.
The power dissipation map obtained at a strain of 0.5 is shown in Figure 3. In this figure, the contours of iso- efficiency (marked as percent) are projected onto a plane of temperature and strain-rate axes. The maps obtained at strains of 0.1, 0.2, 0.3, and 0.4 are essentially similar to that shown in Figure 3, indicating that strain does not have a significant influence. The map exhibits the fol- lowing features:
(a) a domain occurring at temperatures below 1050 ~ with a peak efficiency of 37 pet at 950 ~ and 0.001 s-l; (b) a domain occurring at temperatures above 1050 ~ with a peak efficiency of about 40 pet occurring at 1200 ~ and 0.1 s-l; (c) a change in curvature of the contours occurring at 1050 ~ and (d) in the high-temperature high-strain-rate comer of the map, the efficiency contours are closely spaced, indi- cating a sharp change in the efficiency values with in- creasing temperature and strain rate.
The instability map was developed on the basis of the continuum criterion given by Eq. [3] and is shown in Figure 4. The conditions under which the parameter ~(~) becomes negative are contoured and are shown as flow instability regimes (Figure 4). The material exhibits two such regimes at strain rates higher than 1 s-l: one
Fig. 1 - - In i t ia l microstructure of the superalloy IN-718.
METALLURGICAL AND MATERIALS TRANSACTIONS A

IN 7115 950* C
700r 1
o ; o 1
1 0 o ~
0 0.2 0.4 0.6 TRUE PLASTIC STRAIN
(a)
4 0 0 f IN 718 1150"C
lOO g / / . f - - - - ~ - . ~
F[ " - _ - l O
lO0
- . __ _ % 0.001
, r I I I I I --I 0 0.2 0.4 0.6
TRUE PLASTIC STRAIN (b)
Fig. 2 - - ( a ) True stress-lrue plastic strain curves for IN-718 at 950 ~ and at different strain rates. (b) True stress-true plastic strain curves for IN-718 at 1150 ~ and at different strain rates.
occurring below about 1020 ~ and the other occurring above 1120 ~ Specimens deformed in these regimes were examined for the microstructural manifestation of these two types of flow instabilities and are discussed in Section IV-A-3 .
IV. DISCUSSION
The microstructure of IN-718 alloy has essentially a face-centered cubic (fcc)7 matrix, which is precipitation strengthened, tH] The major strengthening phase is 7"
precipitates (bct), which is coherent with the matrix. Some amount of ordered 7' precipitate (fcc) is also present in the matrix. In addition, 6 phase with an ideal compo- sition of Ni3Nb having orthorhombic crystal structure is also present in IN-718. The 6 phase occurs either as a blocky grain-boundary constituent or as Widmenstaten plates in the matrix. MC types of carbides are also pres- ent both in the matrix and along the grain boundaries.
The power dissipation characteristics of the specimen are dependent on the phases present at the temperature of deformation, and, therefore, solutionizing tempera- tures for the phases will be useful in interpreting the maps.
A. Interpretation of Processing Map
The processing maps are interpreted on the basis of the broad principle of atomistic mechanism represented in Raj maps. t~2] The mechanisms considered are DRX and dynamic recovery, both of which are considered "safe" for processing. The limiting conditions which de- fine the safe regime are obtained for fracture mecha- nisms like void formation dominating at lower temperatures and higher strain rates and wedge cracking occurring at higher temperatures and lower strain rates. The different domains exhibited by the power dissipation map may be identified on the basis of the corresponding efficiency variations, microstructural features, and duc- tility values. For example, the ductility in the dynamic recrystallization domain is high and the grain-size vari- ation with temperature is sigmoidal. On the other hand, the domains representing fracture processes will exhibit poor ductility.
1. Low-temperature domain The domain extends over a temperature ranlge of 900 ~
to 1020 ~ at strain rates lower than 0.01 s- '(Figure 3). The efficiency values of power dissipation exhibited by the domain are typical of the DRX process in nickel ma- terials, t13'141 with its peak efficiency of 37 pct occurring at 950 ~ and 0.001 s-L The flow curves obtained under different combination of strain rate and temperature in the domain show initial slight flow softening followed by a steady state (Figure 2(a)). This type of flow be- havior has been widely accepted to result from the DRX process, t~5] This is further confirmed on the basis of microstructural observations on the samples deformed under the conditions in the domain. Typical micro- structures recorded on specimens deformed at a strain rate of 0.001 s -~ and at 900 ~ 950 ~ and 1000 ~ are shown in Figures 5(a) through (c). These exhibit uniform fine recrystallized grain structures with serrated grain boundaries. The ~ phase is effective in pinning the grain boundaries and in retaining a fine-grained structure. At temperatures above 1040 ~ grain growth is promoted (Figure 5(d)) since g-phase dissolution occurs. In Figure 6, variations of ductility, average grain diameter, and efficiency of power dissipation with temperature in the DRX domain are compared. The ductility peak and the peak efficiency value occur at the same temperature (950 ~ The temperature at which 50 pct change in the grain size occurred in the sigmoidal variation of grain size (Figure 6(b)) has also coincided with the tempera- ture of peak ductility and peak efficiency. This further
METALLURGICAL AND MATERIALS TRANSACTIONS A VOLUME 25A, OCTOBER 1994--2277

Table II. Flow Stress Values (in MPa) of IN-718 at Different Strain Rates and Temperatures (Corrected for Adiabatic Temperature Rise)
Strain Temperature (~
Strain Rate (S -1) 900 950 1000 1050 1100 1150 1200
0.1 0.001 188 123 79.4 70.6 48.9 39 26.0 0.01 293 210 134 104 87.3 60 51.4 0.1 399 277 225 173 149 79.4 78.7 1 616 486 332 258 215 156 136
10 634 561 475 410 335 274 201 100 684 598 546 509 417 354 217
0.2 0,001 185 123 79.4 72.8 50.4 36.8 24.1 0.01 301 214 137 108 92.1 61.4 49.2 0.1 394 281 221 177 153 75.6 74.6 1 633 466 330 252 217 160 134
10 711 601 459 406 340 273 182 100 731 661 600 565 450 375 134
0.3 0,001 182 120 79 72.3 49.4 37.5 23.7 0.01 308 212 132 112 83.4 58.3 46.5 0.1 366 269 209 171 148 69.5 68.7 1 587 435 317 235 208 154 127
10 686 555 423 374 316 262 161 100 691 639 571 545 432 365 60.7
0.4 0.001 173 118 81.5 73.4 50.9 38.4 23.5 0.01 297 204 130 112 80.7 55.5 46.4 0.1 348 261 201 166 141 65.8 64.0 1 540 404 298 229 197 143 117
10 638 512 392 354 295 251 144 100 640 602 535 520 406 349 47.3
0.5 0,001 164 119 82.6 77.3 51.5 39.8 24.5 0.01 294 203 131 113 80.4 53.3 47.6 0.1 340 256 197 166 139 63.4 61.3 1 512 392 280 235 190 135 108
10 593 493 390 359 284 251 126 100 600 561 493 500 378 327 37,5
2 2
~ o ~: z z 0
-2 -2
- 3 - 3 I I I 900 1000 1100 1200 900 1000 1100 1200
TEMPERATURE ~'C TEMPERATURETC
Fig. 3--Processing map for IN-718 at strain of 0.5. Numbers rep- Fig. 4--Contour map of instability parameter ~(~) on temperature- resent percent efficiency of power dissipation, strain rate plane for IN-718.
2278--VOLUME 25A, OCTOBER 1994 METALLURGICAL AND MATERIALS TRANSACTIONS A

(~) 900~ 0.001 s -t (b) 950~ and 0.001 s - '
(c) 1000~ and 0.001 s -1 (d) 1050~ and 0.001 s -1
Fig. 5--Microstructures obtained on IN-718 specimens deformed at strain rate of 0.001 s -1 and at different temperatures: (a) 900 ~ (b) 950 ~ and (c) 1000 ~ These conditions correspond to lower temperature DRX domain. (d) Microstructure obtained on IN-718 specimen deformed at 1050 ~ and 0.001 s -1 showing grain growth in the absence of 6 precipitate.
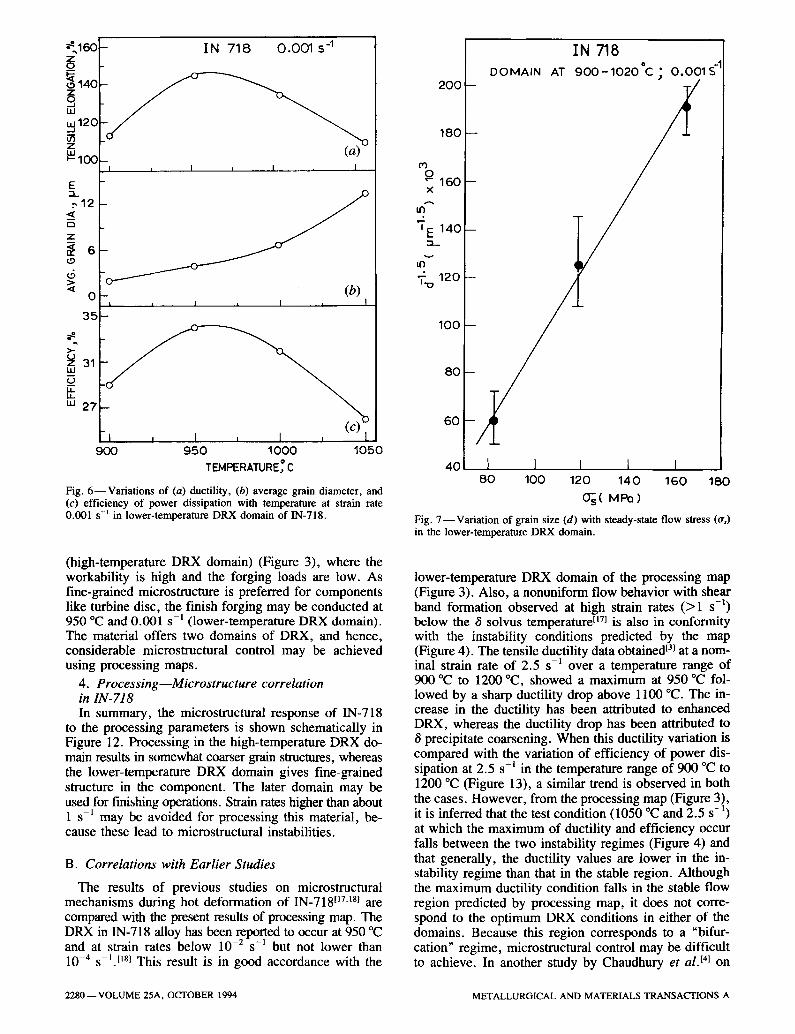
corroborates with the interpretation that the domain rep- resents the DRX process. In this domain, the grain-size variation (d) with steady-state flow stress (o-s) is shown in Figure 7, which indicates a linear relationship be- tween (d) -~5 and o's, as reported by others for the DRX process. [161
2. High-temperature domain This domain essentially occurs after the completion of
8 dissolution. It extends over a strain-rate range of 0.01 to 0.5 s -~ at temperatures above 1150 ~ with its peak efficiency of 40 pct occurring at about 1200 ~ and 0.1 s -l (Figure 3). On the same lines of discussion for the low-temperature domain, this domain can also be interpreted to represent the DRX process. In this case, 6 phase is not present in the matrix. In Figures 8(a) through (c), the microstructures obtained on samples deformed at 0.1 s -1 and across the domain at 1100 ~ 1150 ~ and 1200 ~ are presented. Even though the grain sizes in this domain are much larger than that for the lower- temperature DRX domain, both domains have similar microstructural characteristics. The larger grain sizes in this high-temperature domain indicate that the carbides present in the matrix are not as effective as 8 precipitates in hindering the grain-boundary migration. Further, the variations of ductility and the efficiency of power dis- sipation, as shown in Figures 9(a) and (c), are similar to that observed in the lower-temperature domain and confirm that the domain represents DRX. The continu- ous increase in the variations of average grain diameter
with temperature (Figure 9(b)) indicates that the domain may extend even beyond 1200 ~ The mechanism of DRX in IN-718 both at lower and higher temperatures will be discussed in Section C.
3. Instability regime The instability map (Figure 4) developed on the basis
of the criterion given by Eq. [3] exhibits two distinct flow instability regimes occurring at higher strain rates (>1 S -1) and at temperatures lower and higher than 1050 ~ The microstructural features of the instability are shown in Figure 10, which corresponds to the con- dition of 900 ~ and 100 s -~. The microstructure ex- hibits adiabatic shear bands oriented at about 45 deg with respect to the compression axis. In the case of higher strain rate (100 s -l) of deformation, the shear band for- mation is so intense that fracture occurred along the band (Figure 10). When the rate of deformation is reduced, the shear band formation will be less intense and appears diffused. For the high-temperature instability regime, on the other hand, the microstructure exhibits intergranular cracking, as shown in Figure 11, which corresponds to a deformation condition of 1200 ~ and 100 s -~. This may be due to the presence of iron as well as coarse carbides at the grain boundaries, which causes fracture at high strain rates due to embrittlement of grain bound- aries at higher temperatures.
The discussion on processing maps indicates that the initial forging steps are best done at 1200 ~ and 0.1 s -~
METALLURGICAL AND MATERIALS TRANSACTIONS A VOLUME 25A, OCTOBER 1994--2279
~160 z
~140 z s w
z Nloc
E
,-,12
z ~ 6
0
35
o-..~ o
~ 31 u.I
"' 27
IN 718 0 .001 s 4
(a)
I ~ I = I I
_ ( b )
_l , I , I , I 900 9 5 0 1000 1050
TEMPERATUREs* C
Fig. 6 - -Var ia t ions of (a) ductility, (b) average grain diameter, and (c) efficiency of power dissipation with temperature at strain rate 0.001 s -~ in lower-temperature DRX domain of IN-718.
(high-temperature DRX domain) (Figure 3), where the workability is high and the forging loads are low. As fine-grained microstructure is preferred for components like turbine disc, the finish forging may be conducted at 950 ~ and 0.001 s-l (lower-temperature DRX domain). The material offers two domains of DRX, and hence, considerable microstructural control may be achieved using processing maps.
4. Processing Microstructure correlation in IN-718 In summary, the microstructural response of IN-718
to the processing parameters is shown schematically in Figure 12. Processing in the high-temperature DRX do- main results in somewhat coarser grain structures, whereas the lower-temperature DRX domain gives fine-grained structure in the component. The later domain may be used for finishing operations. Strain rates higher than about 1 s -~ may be avoided for processing this material, be- cause these lead to microstructural instabilities.
B. Correlations with Earlier Studies
The results of previous studies on microstructural mechanisms during hot deformation of IN-718 tlTJs] are compared with the present results of processing map. The DRX in 1N-718 alloy has been reported to occur at 950 ~
2 1 and at strain rates below 10- s- but not lower than 10 -4 s-1. t~8] This result is in good accordance with the
2001
180
P3 0 "- 160 x
I E 140
"i:. 120
100
80
60
40
IN 718 DOMAIN AT 9 O O - 1 0 2 0 * C ; 0 . 0 0 1 S -~
I I I I 1 80 100 120 140 160 18(
~ s ( M P o )
Fig. 7 - -Var ia t ion of grain size (d) with steady-state flow slress (tr,) in the lower-temperature DRX domain.
lower-temperature DRX domain of the processing map (Figure 3). Also, a nonuniform flow behavior with shear band formation observed at high strain rates (>1 s -l) below the 8 solvus temperature tiT] is also in conformity with the instability conditions predicted by the map (Figure 4). The tensile ductility data obtained p} at a nom- inal strain rate of 2.5 s -~ over a temperature range of 900 ~ to 1200 ~ showed a maximum at 950 ~ fol- lowed by a sharp ductility drop above 1100 ~ The in- crease in the ductility has been attributed to enhanced DRX, whereas the ductility drop has been attributed to
precipitate coarsening. When this ductility variation is compared with the variation of efficiency of power dis- sipation at 2.5 s-t in the temperature range of 900 ~ to 1200 ~ (Figure 13), a similar trend is observed in both the cases. However, from the processing map (Figure 3), it is inferred that the test condition (1050 ~ and 2.5 s -1) at which the maximum of ductility and efficiency occur falls between the two instability regimes (Figure 4) and that generally, the ductility values are lower in the in- stability regime than that in the stable region. Although the maximum ductility condition falls in the stable flow region predicted by processing map, it does not corre- spond to the optimum DRX conditions in either of the domains. Because this region corresponds to a "bifur- cation" regime, microstructural control may be difficult to achieve. In another study by Chaudhury et al. I41 on
2280--VOLUME 25A, OCTOBER 1994 METALLURGICAL AND MATERIALS TRANSACTIONS A

(a) (b)
(c)
Fig. 8 - -Micros t ruc tu res obtained on IN-718 specimens deformed at strain rate o f 0.1 s ~ and at different temperatures: (a) I100~ (b) 1150 ~ and (c) 1200 ~ These conditions correspond to higher-temperature DRX domain.
the process optimization of IN-718 in the temperature and strain-rate ranges of 975 ~ to 1150 ~ and 0.01 to 2.5 s -l , DRX has been reported. However, when this temperature-strain rate frame is superimposed on the processing map (Figure 3), the test conditions used by Chaudhury et al. [4] do not cover optimum conditions for either of the DRX domains. Thus, optimization using these data may not, therefore, lead to useful results on microstructural control.
C. Mechanism of DRX
IN-718 exhibits two distinct DRX domains unlike pure nickel tl31 and other nickel alloys, namely, Ni-20Cr tl41 and IN-600. t~9J The DRX conditions are greatly influenced by alloying elements as well as the various phases pres- ent in the material, t2~ IN-718 being a nickel-iron-base alloy, the Ni-Cr-Fe system forms the matrix phase. As IN-600 basically consists of the Ni-Cr-Fe system with carbide precipitates, the characteristics of DRX process in IN-600 tlgl are compared with those of IN-718. IN-600 exhibits a single DRX domain with its peak occurring at
the same temperature and strain-rate conditions (1200 ~ and 0.1 s-l) tl9] as the higher-temperature DRX domain of IN-718. In both these cases, the temperature range at which the DRX domain starts appearing has coincided with that of carbide dissolution. Further, the material NICHROME,* which forms the basic matrix of the Ni-Cr binary system for many NIMONIC** alloys, also ex-
*NICHROME is a trademark of Harrison Alloys, Inc. , Harrison, NJ.
**NIMONIC is a trademark of Inc. Alloys International, Inc., Huntington, WV.
hibits a similar DRX domain tt41 as IN-600 but over a wider range of temperature. This is because in IN-600, carbide dissolution occurs at lower temperatures. A striking difference in the DRX conditions are observed when the processing maps of these alloys are compared with the map of high-purity nickel (99.98 pct). tl3~ The DRX domain in these alloys occurs at higher tempera- ture (1200 ~ and lower strain rate (0.1 s-l). Table III summarizes the DRX conditions in the processing maps for different nickel materials.
METALLURGICAL AND MATERIALS TRANSACTIONS A VOLUME 25A, OCTOBER 1994--2281

o...~ ~
z
o 72
z o "' 66 IJJ _.1
if) z
~ 6o
E
: 60 .< 6
z 40 < rr t.9
20 <
40
>=
u 36 LU
LL U- uJ 32
I
IN 718 0.1 s -~
i I ~ l ~ I
, I i I i I
1 , I , I J
(c) I
1200 1 0 5 0 1100 1150
TEM PERATURE fl C
Fig. 9 - - V a r i a t i o n s of (a) ductility, (b) average grain diameter, and (c) efficiency of power dissipation with temperature at strain rate 0.01 s -) in higher-temperature DRX domain of IN-718.
iiiii~;;!i ........ ~!'~,.
:,r i
: i
Fig. 11- -Micros t ruc ture obtained on IN-718 specimen deformed at 1200 ~ and 100 s - ' showing intercrystalline cracking.
\'- ic~
z
~ -1 S
9 0 0 1000 1100 1200
TEMPE RATUR E " C
Fig. 1 2 - - V a r i o u s domains of microstructural mechanisms exhibited by IN-718 in the hot-working range as predicted by processing map.
Fig. 10- -Micros t ruc ture obtained on IN-718 specimen deformed at 900 ~ and 100 s - ' showing fracture along the adiabatic shear band. The compression axis is vertical.
At elevated temperatures, nickel has a lower stacking fault energy (SFE) (40 m J / m 2 at 1000 ~ [21] and under- goes DRX at 925 ~ and 1 s-] with a peak efficiency of power dissipation of about 31 pct. [13] Also, the presence of carbon has a strong influence on the strain rate for DRX, [22] because interstitial carbon increases the rate of
dislocation generation. On the other hand, the addition of chromium lowers the SFE, and the nickel-base alloys may be considered to be low SFE materials. ~23] Further, chromium in nickel causes strengthening due to long range stress fields, which in turn increase the DRX tempera- ture. t~4] The mechanism of DRX may be discussed on the basis of a simple DRX model, which considers the rate of nucleation vs the rate of grain-boundary migra- tion. The nucleation consists of the formation of inter- faces due to dislocation generation and simultaneous recovery and rearrangement. Unlike static recrystalliza- tion (SRX), in DRX, the dislocation generation and re- covery processes occur simultaneously, leading to the formation of interface or subgrain. This interface will become a nucleus for DRX when it attains a critical con- figuration of a high-angle boundary and will grow by the
2282--VOLUME 25A, OCTOBER 1994 METALLURGICAL AND MATERIALS TRANSACTIONS A

8 0 - I N 71 8 - 50
< 60 - ~ - ~ 40 .~. ttl ~
_z z 4 0 -
2~ , ./ iley,1969 B] )
900 1000 1100 1200 TEMPE RATU RE ~
Fig. 13 - -Var ia t ions of ductilityt3] and efficiency of power dissipation with temperature at strain rate of 2.5 s -t in IN-718.
Table III. DRX Temperature, Strain Rate, and Efficiency of Power Dissipation of Nickel Materials
DRX
Temperature Strain Rate Efficiency Material (~ (s-]) (Pc0
Nickel (99.98) 925 1.0 31 Ni-0.02C 925 0.0003 44 Ni-0.02C-0.002S 875 0.0003 46 Ni-20Cr 1200 0.1 38 IN-600 1200 0.2 48
process of migration. The driving force for interface mi- gration in DRX is the reduction in the total energy for interfaces, whereas in SRX, it is the stored energy of individual dislocations. The nucleation rate RF depends on the rate of generation of dislocation and the proba- bility of their recovery:
Re = ~ exp (-QD/RT) (4)
The rate of annihilation of recovered groups of dis- locations (subgrains) caused by migration of interfaces, RM, may be assumed to be proportional to grain-boundary mobility M, and it is given by
RM = C. M (5)
where C is a c o n s t a n t (10 -6 m - l ) and M is given by the equation
M = OF/kTb (6)
It was shown that in nickel, Re is four orders of mag- nitude less than Rm at the peak DRX condition (925 ~ and 1 s-I). tl3] Therefore, the rate of DRX nucleation in these materials is controlled by the diffusion-dependent climb of edge dislocations.
At lower temperatures (<1050 ~ the presence of
phase in IN-718 promotes DRX nucleation by increas- ing the rate of dislocation generation. Therefore, lower strain rates (<0.01 s -l) are sufficient to generate the re- quired rate of dislocation density for the nucleation pro- cess of DRX. In contrast, it may be noted that the lower- temperature DRX domain is absent in NICHROME u4] and IN-600 tlg] materials because 8 phase is not present in these alloys. On the other hand, DRX in these alloys occurs only at higher temperatures (1200 ~ and at strain rate 0.1 s -~, as also in IN-718. At these high tempera- tures, the carbides (MC) go into solution and make inter- stitial carbon available for enhancing the nucleation rates for DRX. Carbon as an interstitial is very effective in increasing the rate of dislocation generation. Thus, it is clear that carbide dissolution precedes the occurrence of DRX in all these alloys.
The peak efficiency of power dissipation in IN-718 is lower than that in IN-600 but slightly higher than that in NICHROME. It is likely that the presence of Chro- mium, t24] niobium, and molybdenum in solution in IN-718 at 1200 ~ decreases the rate of climb and hence the rate of DRX nucleation. This is counteracted by the increase in the climb rate due to the lower activation energy for diffusion of chromium in Nickel caused by the presence of iron. t251 Thus, in IN-718, the DRX efficiency lies be- tween that of IN-600 and NICHROME, although all other parameters remain essentially unchanged.
D. Recommended Forging Practice
The forging sequence for IN-718 given by Marsh TM
has two stages of operation: initial forging, above the 6 solutionizing temperature, and final forging, below the
solutionizing temperature. By comparing this with the processing map Figure 3 that exhibits change in curva- ture of the power dissipation contours at the temperature of completion of 6 dissolution (1040 ~ the following inferences may be made:
the initial phase of forging conditions correspond to the conditions of the higher-temperature domain;
and the final phase of forging conditions correspond to the
conditions of lower-temperature domain.
Both these domains represent the DRX process, which is considered to impart good workability during forming operation [26] and produces more uniform microstructure throughout the component. As the grain growth is in- hibited by 6 precipitate, the finish forging carried out in the lower-temperature DRX domain results in fine-grain recrystallized structure. The temperature used t27! (<1040 ~ for final forging of IN-718 falls within this domain. However, unlike the forging temperature, the forging speed, which is also a critical parameter in thermomechanical processing, is not well documented in the literature. It is evident from the processing map that the two DRX domains have a shift of nearly two orders of magnitude on the strain-rate scale. As discussed in Section IV-A-3 , the higher strain rates, at lower tem- peratures, lead to adiabatic shear band formation, whereas at higher temperatures, they lead to intergranular crack- ing. Also, lower strain rates at higher temperatures (> 1050 ~ lead to abnormal grain growth resulting in
METALLURGICAL AND MATERIALS TRANSACTIONS A VOLUME 25A, OCTOBER 1994--2283
poor workability with low efficiency values of power dissipation. Therefore, the optimum conditions for the forging sequence provided by the processing map are as follows:
(a) initial forging at 1200 ~ and 0.1 s -~ with ~ phase in solution, and (b) final forging at 950 ~ and 0.001 s -l in the presence of ~ phase.
In order to control the microstructures of the compo- nent closely, it is necessary that each of these steps be conducted, limiting the processing conditions to within each of the domain.
V. CONCLUSIONS
The hot-working characteristics of IN-718 are studied in the temperature range 900 ~ to 1200 ~ and strain- rate range 0.001 to 100 s -l using processing maps. The following conclusions are drawn from this investigation.
1. IN-718 exhibits two domains of DRX, one with a peak efficiency of 38 pct occurring at 950 ~ and 0.001 s -~ and the other with a peak efficiency of 40 pct occurring at 1200 ~ and 0.1 s -~.
2. The DRX at lower temperatures is nucleated by 8 phase (Ni3Nb), whereas interstitial carbon present due to carbide dissolution causes DRX at higher tempera- tures. Fine grain size is produced during forging at 950 ~ because of the presence of ~ precipitates.
3. Hot workin~ in the initial stages is best done at 1200 ~ and 0.1 s-" and finishing operations are done in the lower-temperature DRX domain so that fine grain size is achieved.
4. The material exhibits flow instabilities in the form of adiabatic shear bands at temperatures lower than 1000 ~ and higher than 1 s -~.
5. Intercrystalline cracking occurs at temperatures higher than 1150 ~ and strain rates higher than 1 s -~.
REFERENCES
1. Metallurgy and Applications of Superalloy 718, Edward A. Loria, ed., TMS-AIME, Warrendale, PA, 1989.
2. A.E. Marsh: Metallurgia, 1982, vol. 49, pp. 10-20. 3. R.E. Bailey: Report No. SP-69-9, Allegheny Ludlum Steel
Research Center, Brackenridge, PA, 1969. 4. P.K. Chandhury, J.J. Valencia, and D. Zhao: Materials Week
'92, ASM and TMS, Chicago, IL, p. 65 (Abstract). 5. Y.V.R.K. Prasad, H.L. Gegel, S.M. Doraivelu, J.C. Malas, J.T.
Morgan, K.A. Lark, and D.R. Barker: Metall. Trans. A, 1984, vol. 15A, pp. 1883-92.
6. H.L. Gegel, J.C. Malas, S.M. Doraivelu, and V.A. Shende: Metals Handbook, ASM, Metals Park, OH, 1987, vol. 14, pp. 417-38.
7. J.M. Alexander:. Modelling of Hot Deformation of Steels, Springer- Verlag, Berlin, 1989, pp. 101-14.
8. H. Ziegler: Progress in Solid Mechanics, John Wiley and Sons, New York, NY, 1963, vol. 4, pp. 93-193.
9. A.K.S. Kalyan Kumar: Master's Thesis, Indian Institute of Science, Bangalore, 1987.
10. Y.V.R.K. Prasad: Ind. J. Technol., 1990, vol. 28, pp. 435-51. 11. C.T. Sims and W.C. Hagel: The Superalloy, Wiley-Interscience
Publishing, New York, NY, 1972. 12. R. Raj: Metall. Trans. A, 1981, vol. 12A, pp. 1089-97. 13. N. Srinivasan and Y.V.R.K. Prasad: Mater. Sci. Technol., 1992,
vol. 8, pp. 206-12. 14. N. Srinivasan and Y.V.R.K. Prasad: J. Mater. Process. Technol.,
1994, vol. 41, pp. 409-24. 15. M.J. Luton and C.M. Sellars: Acta Metall., 1969, vol. 17,
pp. 1033-43. 16. H.J. McQueen and J.J. Jonas: Treatise Mater. Sci. Technol., 1975,
vol. 6, pp. 393-493. 17. T.E. Howson and W.J. Couts, Jr.: Metallurgy and Applications--
Superalloy 718, TMS-AIME, Warrandale, PA, 1989, pp. 685-94. 18. P.E. Mosser, G. Leconte, J. Leray, A. Lasalmonie, and
Y. Honnarat: Metallurgy and Applications--Superalloy 718, TMS-AIME, Warrandale, PA, 1989, pp. 79-93.
19. N. Srinivasan and Y.V.R.K. Prasad: Mater. Sci. Technol., in press.
20. M. Ueki, S. Horie, and T. Nakamura: Mater. Sci. Technol., 1987, vol. 3, pp. 329-37.
21. M.N. Shetty and A.K. Laha: Z. Metallkd., 1986, vol. 6, pp. 397-402.
22. N. Srinivasan and Y.V.R.K. Prasad: Indian Institute of Science, Bangalore, unpublished research, 1993.
23. B.E.P. Beeston and L.K. France: J. Inst. Met., 1968, vol. 96, pp. 105-07.
24. K. Monma; H. Suto, and H. Oikama: J. Jpn. Inst. Met., 1964, vol. 28, pp. 188-96.
25. D.D. Pruthi, M.S. Anand, and R.P. Agarwala: J. Nucl. Mater., 1977, vol. 64, pp. 206-10.
26. W.J. McG. Tegart: Ductility, ASM, Metals Park, OH, 1968, pp. 133-77.
27. W.A. Wilkinson: Metallurgy and Applications--Superalloy 718, TMS-AIME, Warrandale, PA, 1989, pp. 119-34.
2284--VOLUME 25A, OCTOBER 1994 METALLURGICAL AND MATERIALS TRANSACTIONS A