MicroStrategy Human Resources Analysis Module Reference
260
Human Resources Analysis Module Reference Version: 9.0.2 Document Number: 09990902
Transcript of MicroStrategy Human Resources Analysis Module Reference

Human Resources Analysis Module Reference
Version: 9.0.2Document Number: 09990902

Sixteenth Edition, October 2010, version 9.0.2To ensure that you are using the documentation that corresponds to the software you are licensed to use, compare this version number with the software version shown in “About MicroStrategy...” in the Help menu of your software.
Document number: 09990902
Copyright © 2010 by MicroStrategy Incorporated. All rights reserved.
If you have not executed a written or electronic agreement with MicroStrategy or any authorized MicroStrategy distributor, the following terms apply:This software and documentation are the proprietary and confidential information of MicroStrategy Incorporated and may not be provided to any other person. Copyright © 2001-2010 by MicroStrategy Incorporated. All rights reserved.THIS SOFTWARE AND DOCUMENTATION ARE PROVIDED “AS IS” AND WITHOUT EXPRESS OR LIMITED WARRANTY OF ANY KIND BY EITHER MICROSTRATEGY INCORPORATED OR ANYONE WHO HAS BEEN INVOLVED IN THE CREATION, PRODUCTION, OR DISTRIBUTION OF THE SOFTWARE OR DOCUMENTATION, INCLUDING, BUT NOT LIMITED TO, THE IMPLIED WARRANTIES OF MERCHANTABILITY AND FITNESS FOR A PARTICULAR PURPOSE, GOOD TITLE AND NONINFRINGMENT, QUALITY OR ACCURACY. THE ENTIRE RISK AS TO THE QUALITY AND PERFORMANCE OF THE SOFTWARE AND DOCUMENTATION IS WITH YOU. SHOULD THE SOFTWARE OR DOCUMENTATION PROVE DEFECTIVE, YOU (AND NOT MICROSTRATEGY, INC. OR ANYONE ELSE WHO HAS BEEN INVOLVED WITH THE CREATION, PRODUCTION, OR DISTRIBUTION OF THE SOFTWARE OR DOCUMENTATION) ASSUME THE ENTIRE COST OF ALL NECESSARY SERVICING, REPAIR, OR CORRECTION. SOME STATES DO NOT ALLOW THE EXCLUSION OF IMPLIED WARRANTIES, SO THE ABOVE EXCLUSION MAY NOT APPLY TO YOU.In no event will MicroStrategy, Inc. or any other person involved with the creation, production, or distribution of the Software be liable to you on account of any claim for damage, including any lost profits, lost savings, or other special, incidental, consequential, or exemplary damages, including but not limited to any damages assessed against or paid by you to any third party, arising from the use, inability to use, quality, or performance of such Software and Documentation, even if MicroStrategy, Inc. or any such other person or entity has been advised of the possibility of such damages, or for the claim by any other party. In addition, MicroStrategy, Inc. or any other person involved in the creation, production, or distribution of the Software shall not be liable for any claim by you or any other party for damages arising from the use, inability to use, quality, or performance of such Software and Documentation, based upon principles of contract warranty, negligence, strict liability for the negligence of indemnity or contribution, the failure of any remedy to achieve its essential purpose, or otherwise. The entire liability of MicroStrategy, Inc. and your exclusive remedy shall not exceed, at the option of MicroStrategy, Inc., either a full refund of the price paid, or replacement of the Software. No oral or written information given out expands the liability of MicroStrategy, Inc. beyond that specified in the above limitation of liability. Some states do not allow the limitation or exclusion of liability for incidental or consequential damages, so the above limitation may not apply to you.The information contained in this manual (the Documentation) and the Software are copyrighted and all rights are reserved by MicroStrategy, Inc. MicroStrategy, Inc. reserves the right to make periodic modifications to the Software or the Documentation without obligation to notify any person or entity of such revision. Copying, duplicating, selling, or otherwise distributing any part of the Software or Documentation without prior written consent of an authorized representative of MicroStrategy, Inc. are prohibited. U.S. Government Restricted Rights. It is acknowledged that the Software and Documentation were developed at private expense, that no part is public domain, and that the Software and Documentation are Commercial Computer Software provided with RESTRICTED RIGHTS under Federal Acquisition Regulations and agency supplements to them. Use, duplication, or disclosure by the U.S. Government is subject to restrictions as set forth in subparagraph (c)(1)(ii) of the Rights in Technical Data and Computer Software clause at DFAR 252.227-7013 et. seq. or subparagraphs (c)(1) and (2) of the Commercial Computer Software—Restricted Rights at FAR 52.227-19, as applicable. Contractor is MicroStrategy, Inc., 1850 Towers Crescent Plaza, Vienna, VA 22182. Rights are reserved under copyright laws of the United States with respect to unpublished portions of the Software.The following are either trademarks or registered trademarks of MicroStrategy Incorporated in the United States and certain other countries:
MicroStrategy, MicroStrategy 6, MicroStrategy 7, MicroStrategy 7i, MicroStrategy 7i Evaluation Edition, MicroStrategy 7i Olap Services, MicroStrategy 8, MicroStrategy 9, MicroStrategy Distribution Services, MicroStrategy MultiSource Option, MicroStrategy Command Manager, MicroStrategy Enterprise Manager, MicroStrategy Object Manager, MicroStrategy Reporting Suite, MicroStrategy Power User, MicroStrategy Analyst, MicroStrategy Consumer, MicroStrategy Email Delivery, MicroStrategy BI Author, MicroStrategy BI Modeler, MicroStrategy Evaluation Edition, MicroStrategy Administrator, MicroStrategy Agent, MicroStrategy Architect, MicroStrategy BI Developer Kit, MicroStrategy Broadcast Server, MicroStrategy Broadcaster, MicroStrategy Broadcaster Server, MicroStrategy Business Intelligence Platform, MicroStrategy Consulting, MicroStrategy CRM Applications, MicroStrategy Customer Analyzer, MicroStrategy Desktop, MicroStrategy Desktop Analyst, MicroStrategy Desktop Designer, MicroStrategy eCRM 7, MicroStrategy Education, MicroStrategy eTrainer, MicroStrategy Executive, MicroStrategy Infocenter, MicroStrategy Intelligence Server, MicroStrategy Intelligence Server Universal Edition, MicroStrategy MDX Adapter, MicroStrategy Narrowcast Server, MicroStrategy Objects, MicroStrategy OLAP Provider, MicroStrategy SDK, MicroStrategy Support, MicroStrategy Telecaster, MicroStrategy Transactor, MicroStrategy Web, MicroStrategy Web Business Analyzer, MicroStrategy World, Application Development and Sophisticated Analysis, Best In Business Intelligence, Centralized Application Management, Information Like Water, Insight Is Everything, Intelligence Through Every Phone, Intelligence To Every Decision Maker, Intelligent E-Business, Personalized Intelligence Portal, Query Tone, Rapid Application Development, Strategy.com, MicroStrategy Intelligent Cubes, The Foundation For Intelligent E-Business, The Integrated Business Intelligence Platform Built For The Enterprise, The Intelligence Company, The Platform For Intelligent E-Business, The Scalable Business Intelligence Platform Built For The Internet, Industrial-Strength Business Intelligence, Office Intelligence, MicroStrategy Office, MicroStrategy Report Services, MicroStrategy Web MMT, MicroStrategy Web Services, Pixel Perfect, MicroStrategy Mobile, MicroStrategy Integrity Manager and MicroStrategy Data Mining Services are all registered trademarks or trademarks of MicroStrategy Incorporated.
All other products are trademarks of their respective holders. Specifications subject to change without notice. MicroStrategy is not responsible for errors or omissions. MicroStrategy makes no warranties or commitments concerning the availability of future products or versions that may be planned or under development.
Patent InformationThis product is patented. One or more of the following patents may apply to the product sold herein: U.S. Patent Nos. 6,154,766, 6,173,310, 6,260,050, 6,263,051, 6,269,393, 6,279,033, 6,501,832, 6,567,796, 6,587,547, 6,606,596, 6,658,093, 6,658,432, 6,662,195, 6,671,715, 6,691,100, 6,694,316, 6,697,808, 6,704,723, 6,707,889, 6,741,980, 6,765,997, 6,768,788, 6,772,137, 6,788,768, 6,792,086, 6,798,867, 6,801,910, 6,820,073, 6,829,334, 6,836,537, 6,850,603, 6,859,798, 6,873,693, 6,885,734, 6,888,929, 6,895,084, 6,940,953, 6,964,012, 6,977,992, 6,996,568, 6,996,569, 7,003,512, 7,010,518, 7,016,480, 7,020,251, 7,039,165, 7,082,422, 7,113,993, 7,181,417, 7,127,403, 7,174,349, 7,194,457, 7,197,461, 7,228,303, 7,260,577, 7,266,181, 7,272,212, 7,302,639, 7,324,942, 7,330,847, 7,340,040, 7,356,758, 7,356,840, 7,415,438, 7,428,302, 7,430,562, 7,440,898, 7,457,397, 7,486,780, 7,509,671, 7,516,181, 7,559,048, 7,574,376, 7,617,201, 7,725,811, and 7,801,967. Other patent applications are pending.

iii
Various MicroStrategy products contain the copyrighted technology of third parties. This product may contain one or more of the following copyrighted technologies:Graph Generation Engine Copyright © 1998-2010. Three D Graphics, Inc. All rights reserved.Actuate® Formula One. Copyright © 1993-2010 Actuate Corporation. All rights reserved.XML parser Copyright © 2003-2010 Microsoft Corporation. All rights reserved.Xalan XSLT processor. Copyright © 1999-2010. The Apache Software Foundation. All rights reserved.Xerces XML parser. Copyright © 1999-2010. The Apache Software Foundation. All rights reserved.FOP XSL formatting objects. Copyright © 2004-2010. The Apache Software Foundation. All rights reserved.Portions of Intelligence Server memory management Copyright © 1991-2010 Compuware Corporation. All rights reserved.This product includes software developed by the OpenSSL Project for use in the OpenSSL Toolkit. (http://www.openssl.org/)International Components for UnicodeCopyright © 1999-2010 Compaq Computer CorporationCopyright © 1999-2010 Hewlett-Packard CompanyCopyright © 1999-2010 IBM CorporationCopyright © 1999-2010 Hummingbird Communications Ltd.Copyright © 1999-2010 Silicon Graphics, Inc.Copyright © 1999-2010 Sun Microsystems, Inc.Copyright © 1999-2010 The Open GroupAll rights reserved.Real Player and RealJukebox are included under license from Real Networks, Inc. Copyright © 1999-2010. All rights reserved.

iv

© 2010 MicroStrategy, Inc. v
CONTENTS
Preface Description of Guide .................................................................. xiAbout the Analytics Modules ..................................................xii
About this book ............................................................................ xiiiHow to find business scenarios and examples ......................xivPrerequisites ..........................................................................xivWho should use this guide.....................................................xiv
Resources.....................................................................................xvDocumentation........................................................................xvEducation.............................................................................. xxiiConsulting............................................................................. xxiiInternational support ............................................................. xxiiTechnical Support ................................................................ xxiii
Feedback ..................................................................................xxviii
1. Introduction to the Human Resources Analysis Module
Introduction.................................................................................. 1Business questions that HRAM reports can answer...................... 2
Business analysis areas for HRAM reports ............................. 3
HRAM report features.................................................................... 5
Introduction to reports, dashboards, and documents .................... 7Accessing reports .................................................................... 8About scorecards and dashboards .......................................... 8About Report Services documents ........................................ 10
About definitions for objects on reports ....................................... 11
About the structure of HRAM’s business logic............................. 11Business concepts and measurements ................................. 12Relationships among business concepts............................... 12

Contents Human Resources Analysis Module Reference
vi © 2010 MicroStrategy, Inc.
Porting an analytics module to your data source................... 13
Introduction to HRAM’s physical data storage............................. 13
2. HRAM Scorecards and Dashboards
Introduction................................................................................ 15Scorecards and dashboards........................................................ 16
Attrition Scorecard ................................................................. 16Compensation Scorecard ...................................................... 17HR Director Dashboard.......................................................... 19HR Performance Management Dashboard............................ 20HR Summary Scorecard ........................................................ 22Human Resources Analysis Dashboard ................................ 24Recruitment Scorecard .......................................................... 25HR Summary Dashboard....................................................... 27
3. Workforce Analysis Introduction................................................................................ 31Workforce analysis area .............................................................. 31
Headcounts and Trends reports .................................................. 32Distribution by Department - Monthly Trend .......................... 33Division Distribution - Yearly Trend........................................ 34Employee Distribution by Department and Region................ 35Employee Distribution by Identity Groups - Yearly Trend...... 36Employee Distribution by Tenure and Division ...................... 37Employee Distribution by Tenure and Region ....................... 38Headcount - Monthly Trend ................................................... 39Region Distribution - Yearly Trend......................................... 40Workforce Tenure - Monthly Trend........................................ 41
Contractor reports........................................................................ 42Contract Expiration Alert ........................................................ 43Contractor Cost Analysis ....................................................... 44Contractors by Region and Division....................................... 45
Transfer reports ........................................................................... 45Transfer Analysis - Monthly Trend......................................... 46Transfers to Employee Base - Monthly Trends...................... 47Transfer Distribution by Department ...................................... 48Transfer Distribution by Location ........................................... 49Employee Flow by Department - Monthly Trend.................... 49Employee Flow by Location - Monthly Trend......................... 50Overall Employee Flow by Department ................................. 51Overall Employee Flow by Location....................................... 52Employee Transfer History by Department............................ 53

Human Resources Analysis Module Reference Contents
© 2010 MicroStrategy, Inc. vii
Employee Transfer History by Location ................................. 54
Employee Profile Analysis reports ............................................... 55Employee Profile by Department - Monthly Trend................. 55Employee Profile by Region - Monthly Trend ........................ 56Employee Profile by Tenure................................................... 57Employee Profile Distribution................................................. 58Employee Birthday Alert ........................................................ 59Employee Anniversary Alert................................................... 60
4. Compensation Analysis
Introduction................................................................................ 63Compensation analysis area ....................................................... 63
Compensation reports ................................................................. 65Compensation Distribution by Division .................................. 65Compensation Distribution by Region.................................... 66Compensation Items - Yearly Trend ...................................... 67Salary and Bonus Distribution by Department ....................... 67Salary and Bonus Distribution by Location ............................ 69Salary by Employee Level ..................................................... 70Alert - Individual Salaries above Industry Range................... 71Alert - Individual Salaries below Industry Range ................... 71Compensation Distribution by Employee Profile - Yearly Trend72Average Paid Salary to Industry Mode - Yearly Trend........... 73Top Performers' Salary to Industry Mode .............................. 74
Overtime reports .......................................................................... 75Overtime Analysis - Monthly Trend........................................ 76Overtime Cost Analysis.......................................................... 77Overtime Cost - Monthly Trend.............................................. 78Jobs with Highest Overtime ................................................... 79
Planning reports........................................................................... 80Planned to Actual Difference and Variance - Quarterly Trend81Planned Headcount and Compensation to Actual - Quarterly Trend ..................................................................................... 81Planned Headcount and Compensation by Department........ 82Planned Headcount and Compensation by Region............... 83
5. Benefit Analysis Introduction................................................................................ 85Benefit analysis area ................................................................... 85
Benefit reports ............................................................................. 86Benefit Usage and Costs - Quarterly Trend........................... 86

Contents Human Resources Analysis Module Reference
viii © 2010 MicroStrategy, Inc.
Most Used Benefits by Number of Participants ..................... 87Benefit Usage by Employee Profile ....................................... 88Time Off Overview by Department......................................... 89
6. Attrition Analysis Introduction................................................................................ 91Attrition analysis area .................................................................. 91
Attrition reports ............................................................................ 92Employee Attrition - Monthly Trend........................................ 92Departed Employees by Position Status - Monthly Trend ..... 93Departures by Division - Monthly Trend................................. 94Departures by Region - Monthly Trend.................................. 95Reasons for Departure .......................................................... 96Alert: Upcoming Departures................................................... 97Attrition by Recruiting Source ................................................ 98Departed Employees - Department Transfer Analysis........... 99Departed Employees - Location Transfer Analysis................ 99
7. Recruitment Analysis Introduction.............................................................................. 101Recruitment analysis area ......................................................... 101
Recruitment reports ................................................................... 102Hiring Rate - Monthly Trend................................................. 102New Hires by Division - Monthly Trend................................ 103New Hires by Region - Monthly Trend................................. 104New Hires by Position Status - Monthly Trend .................... 105Recent Hires ........................................................................ 106Hires by Recruiting Sources ................................................ 107
Hiring Process reports ............................................................... 108Vacant Positions .................................................................. 108Recruiting Pipeline............................................................... 109Position Open Days ............................................................. 110Positions Opened and Closed Through Transfers............... 111
8. Workforce Development and Productivity Analysis
Introduction.............................................................................. 113Workforce Development and Productivity analysis area ........... 114
Employee Qualification reports.................................................. 115Employee Qualification by Division and Region .................. 115Employees by Qualification Type......................................... 115Qualifications by Department and Location ......................... 117
Employee Performance reports ................................................. 118

Human Resources Analysis Module Reference Contents
© 2010 MicroStrategy, Inc. ix
Employee Performance Appraisal ....................................... 118Performance by Department - Yearly Trend........................ 119Low Performing Employee Salaries to Industry Mode Comparison ......................................................................... 120
Employee Satisfaction reports ................................................... 121Employee Satisfaction - Survey Results .............................. 121Employee Satisfaction - Yearly Trend.................................. 122
A. Definitions for Objects on Reports: Object Glossaries
Introduction.............................................................................. 125Metrics glossary......................................................................... 125
Employee metrics ................................................................ 126Compensation metrics ......................................................... 129Benefit and Time Off metrics ............................................... 132Transfers metrics ................................................................. 133Qualifications, Performance, and Satisfaction metrics......... 133Position metrics ................................................................... 134Dates metrics....................................................................... 135
Filters glossary........................................................................... 136Employee filters ................................................................... 136Compensation and Benefit filters ......................................... 138Position filters ...................................................................... 139Time filters ........................................................................... 139
Prompts glossary ....................................................................... 140
Consolidations glossary............................................................. 140
Custom Groups glossary ........................................................... 141
B. Structure of HRAM’s Business Logic: Logical Data Model
Introduction.............................................................................. 143Prerequisites.............................................................................. 144
HRAM logical schema ............................................................... 144
Business hierarchies.................................................................. 146Employee and Contractor hierarchies.................................. 146Compensation hierarchy...................................................... 167Benefit hierarchy.................................................................. 168Position hierarchy ................................................................ 169Time Off hierarchy ............................................................... 174Survey Field hierarchy ......................................................... 175Qualification hierarchy ......................................................... 175Leave Reason hierarchy...................................................... 177Time hierarchy ..................................................................... 178

Contents Human Resources Analysis Module Reference
x © 2010 MicroStrategy, Inc.
Facts .......................................................................................... 180Employee, Level, and Contractor facts ................................ 181Compensation facts ............................................................. 185Benefit and Time Off facts ................................................... 187Vacant Positions facts ......................................................... 188Qualification Level, Performance, and Satisfaction Score facts191Table-specific facts .............................................................. 192
C. Data Storage: Physical Schema and Data Dictionary
Introduction.............................................................................. 195Prerequisites.............................................................................. 195
HRAM physical schema............................................................. 196
Table information ....................................................................... 198
Table column information .......................................................... 200
Glossary ................................................................................... 215
Index ......................................................................................... 227

© 2010 MicroStrategy, Inc. xi
PREFACE
Description of Guide
This guide is a reference for the MicroStrategy Human Resources Analysis Module (HRAM), part of the MicroStrategy Analytics Modules that come with MicroStrategy Architect. This guide provides a description, usage scenarios, and screen shots for all the packaged reports for HRAM. It also provides descriptions of the module’s logical data model and physical schema tables and columns, as well as glossaries for the public objects (metrics, filters, and consolidations) and schema objects (attributes and facts).
• Chapter 1, Introduction to the Human Resources Analysis Module presents an introduction to HRAM and provides descriptions and basic procedures to help you understand and work with HRAM.
• Chapter 2, HRAM Scorecards and Dashboards presents the HRAM scorecards and provides scorecard usage information and screen shots.
• Chapter 3, Workforce Analysis presents the HRAM reports for the Workforce analysis area.
• Chapter 4, Compensation Analysis presents the HRAM reports for the Compensation analysis area.
• Chapter 5, Benefit Analysis presents the HRAM reports for the Benefits analysis area.
• Chapter 6, Attrition Analysis presents the HRAM reports for the Attrition analysis area.
• Chapter 7, Recruitment Analysis presents the HRAM reports for the Recruitment analysis area.

Preface Human Resources Analysis Module Reference
xii © 2010 MicroStrategy, Inc.
• Chapter 8, Workforce Development and Productivity Analysis presents the HRAM reports for the Workforce Development and Productivity analysis area.
• Appendix A, Definitions for Objects on Reports: Object Glossaries presents the HRAM object glossaries, which provide definitions for all of the attributes, metrics, filters, prompts, and consolidations used in the module.
• Appendix B, Structure of HRAM’s Business Logic: Logical Data Model presents HRAM’s logical data model, including a diagram and details for working with attributes and facts.
• Appendix C, Data Storage: Physical Schema and Data Dictionary presents HRAM’s default physical schema, including a diagram and details on the schema’s tables and columns.
Consult the Installation and Porting Guide for steps to install and configure your Analytics Modules, and for information on setting up (porting) an Analysis Module to work with your existing data warehouse. The Installation and Porting Guide also provides best practices concepts and procedures for designing and building your own analytical applications using the Analytics Modules as templates.
About the Analytics Modules
MicroStrategy helps you build analytical applications by offering a rapid application development framework consisting of analytical starter kits, development products, and design and development methodologies. There are five Analytics Modules that are built to be portable. You can choose to deploy the Analytics Modules against your existing data warehouse, use one of the packaged physical schemas as the basis of a new data warehouse, or use the modules as templates to build analytical applications.
The components are:
• Analytics Modules
Prepackaged metadata: Best practices reports, scorecards, dashboards, key performance indicators, attributes, business metrics, filters, and custom groups
Default physical and logical data model: Analytics that are designed to work with your physical schemas and data model or with the module’s packaged data warehouse schema

Human Resources Analysis Module Reference Preface
© 2010 MicroStrategy, Inc. About this book xiii
Reference guides: Documentation on each Analysis Module’s data model, the individual analysis areas, metadata object definitions, data dictionary, and individual report use scenarios
• Implementation methodology
Documentation that guides you step-by-step through implementing Analytics Modules against existing data warehouses (known as porting)
Design rules and tenets for designing and developing portable analytical applications
MicroStrategy Architect: A development tool that allows you to map Analytics Modules to existing data warehouses
Documentation for MicroStrategy Desktop and MicroStrategy Architect is available on your MicroStrategy disk, as described fully in the Resources section in this chapter. See the Installation and Porting Guide for a detailed discussion of the Analytics Modules. The Installation and Porting Guide also provides procedures and methodologies to make full use of the Analytics Modules.
About this bookThis book is divided into chapters and reference appendices. Each chapter begins with a brief overview of the chapter’s content.
The following sections provide the location of examples, list prerequisites for using this book, and describe the user roles the information in this book was designed for.
Dates in the MicroStrategy Tutorial project are updated to reflect the current year. The sample documents and images in this guide, as well as the procedures, were created with dates that may no longer be available in the Tutorial project. Replace them with the first year of data in your Tutorial project.

Preface Human Resources Analysis Module Reference
xiv About this book © 2010 MicroStrategy, Inc.
How to find business scenarios and examples
For examples of report features and a basic introduction to the MicroStrategy business intelligence system, use the MicroStrategy Tutorial, which is MicroStrategy’s sample warehouse, metadata, and project. Information about the MicroStrategy Tutorial can be found in the MicroStrategy Basic Reporting Guide.
For extensive examples of metrics, filters, and other report objects, see the MicroStrategy Advanced Reporting Guide.
Prerequisites
How you use this document depends on the type of user you are and on your goals for working with the Analytics Modules. See Who should use this guide in this chapter for a description of the various approaches to the Analytics Modules product.
If you intend to evaluate the business value of the modules, you should have:
• Experience with MicroStrategy reports and metrics using MicroStrategy technology
If you intend to implement and customize the modules, you should have:
• Experience with logical data modeling and creating business intelligence applications using MicroStrategy technology
• A basic understanding of relational database management system (RDBMS) concepts and data modeling
Who should use this guide
This document is designed for:
• End users working with the packaged reports that come with the Analytics Modules
• Advanced users and administrators evaluating the business value of the Analytics Modules
• Consultants and developers implementing and customizing the Analytics Modules

Human Resources Analysis Module Reference Preface
© 2010 MicroStrategy, Inc. Resources xv
Resources
Documentation
MicroStrategy provides both manuals and online help; these two information sources provide different types of information, as described below.
Manuals: In general, MicroStrategy manuals provide:
• Introductory information and concepts
• Examples
• Checklists and high-level procedures to get started
Help: In general, MicroStrategy help provides:
• Detailed steps to perform procedures
• Descriptions of each option on every software screen
Manuals
The following manuals are available from your MicroStrategy disk or the machine where MicroStrategy was installed. The steps to access them are below.
Adobe Acrobat Reader is required to view these manuals. If you do not have Acrobat Reader installed on your computer, you can download it from www.adobe.com/products/acrobat/readstep2_allversions.html.
The best place for all users to begin is with the MicroStrategy Basic Reporting Guide.
MicroStrategy Overview
• Introduction to MicroStrategy: Evaluation Guide
Instructions for installing, configuring, and using the MicroStrategy Evaluation Edition of the software. This guide also includes a detailed, step-by-step evaluation process of MicroStrategy features, where you

Preface Human Resources Analysis Module Reference
xvi Resources © 2010 MicroStrategy, Inc.
perform reporting with the MicroStrategy Tutorial project and its sample business data.
• MicroStrategy Quick Start Guide
Overview of the installation and evaluation process, and additional resources.
• Evaluate MicroStrategy for Linux Guide
Evaluate MicroStrategy for Linux, in a Microsoft Windows or Linux environment, with the MicroStrategy Evaluation Edition Virtual Appliance. This guide provides all details to download, activate, and evaluate MicroStrategy software running in a Linux environment.
• MicroStrategy Reporting Suite Quick Start Guide
Evaluate MicroStrategy as a departmental solution. Provides detailed information to download, install, configure, and use the MicroStrategy Reporting Suite.
• MicroStrategy Jump-Start Project Guide
Create a starter Business Intelligence project with pre-built reports and dashboards available with the Jump-Start project. This project can also be used to create proof-of-concept projects using your own data.
Manuals for Query, Reporting, and Analysis
• MicroStrategy Installation and Configuration Guide
Information to install and configure MicroStrategy products on Windows, UNIX, Linux, and HP platforms, as well as basic maintenance guidelines.
• MicroStrategy Upgrade Guide
Instructions to upgrade existing MicroStrategy products.
• MicroStrategy Project Design Guide
Information to create and modify MicroStrategy projects, and understand facts, attributes, hierarchies, transformations, advanced schemas, and project optimization.

Human Resources Analysis Module Reference Preface
© 2010 MicroStrategy, Inc. Resources xvii
• MicroStrategy Basic Reporting Guide
Instructions to get started with MicroStrategy Desktop and MicroStrategy Web, and how to analyze data in a report. Includes the basics for creating reports, metrics, filters, and prompts.
• MicroStrategy Advanced Reporting Guide
Instructions for advanced topics in the MicroStrategy system, building on information in the Basic Reporting Guide. Topics include reports, Freeform SQL reports, Query Builder reports, filters, metrics, Data Mining Services, custom groups, consolidations, and prompts.
• MicroStrategy Report Services Document Creation Guide
Instructions to design and create Report Services documents, building on information in the Basic Reporting Guide and Advanced Reporting Guide.
• MicroStrategy OLAP Services Guide
Information on MicroStrategy OLAP Services, which is an extension of MicroStrategy Intelligence Server. OLAP Services features include Intelligent Cubes, derived metrics, derived elements, dynamic aggregation, view filters, and dynamic sourcing.
• MicroStrategy Office User Guide
Instructions for using MicroStrategy Office to work with MicroStrategy reports and documents in Microsoft® Excel, PowerPoint, Word, and Outlook, to analyze, format, and distribute business data.
• MicroStrategy Mobile User Guide
Instructions for using MicroStrategy Mobile to view and analyze data, and perform other business tasks with MicroStrategy reports and documents on a mobile device. Covers installation and configuration of MicroStrategy Mobile and how a designer working in MicroStrategy Desktop or MicroStrategy Web can create effective reports and documents for use with MicroStrategy Mobile.
• MicroStrategy System Administration Guide Volume 1
Concepts and high-level steps to implement, deploy, maintain, tune, and troubleshoot a MicroStrategy business intelligence system.
• MicroStrategy System Administration Guide Volume 2
Concepts and high-level steps for using various administrative tools such as MicroStrategy Command Manager, MicroStrategy Enterprise

Preface Human Resources Analysis Module Reference
xviii Resources © 2010 MicroStrategy, Inc.
Manager, MicroStrategy Integrity Manager, and MicroStrategy Health Center.
• MicroStrategy Functions Reference
Function syntax and formula components; instructions to use functions in metrics, filters, attribute forms; examples of functions in business scenarios.
• MicroStrategy MDX Cube Reporting Guide
Information to integrate MicroStrategy with MDX cube sources. You can integrate data from MDX cube sources such as SAP BW, Microsoft Analysis Services, and Hyperion Essbase into your MicroStrategy projects and applications.
• MicroStrategy Web Services Administration Guide
Concepts and tasks to install, configure, tune, and troubleshoot MicroStrategy Web Services.
Manuals for Analytics Modules
• Analytics Modules Installation and Porting Guide
• Customer Analysis Module Reference
• Sales Force Analysis Module Reference
• Financial Reporting Analysis Module Reference
• Sales and Distribution Analysis Module Reference
• Human Resources Analysis Module Reference
Manuals for Information Delivery and Alerting Products
• MicroStrategy Narrowcast Server Getting Started Guide
Instructions to work with the tutorial to learn Narrowcast Server interfaces and features.
• MicroStrategy Narrowcast Server Installation and Configuration Guide
Information to install and configure Narrowcast Server.
• MicroStrategy Narrowcast Server Application Designer Guide
Fundamentals of designing Narrowcast Server applications.

Human Resources Analysis Module Reference Preface
© 2010 MicroStrategy, Inc. Resources xix
• MicroStrategy Narrowcast Server System Administrator Guide
Concepts and high-level steps to implement, maintain, tune, and troubleshoot Narrowcast Server.
• MicroStrategy Narrowcast Server Upgrade Guide
Instructions to upgrade an existing Narrowcast Server.
Software Development Kits
• MicroStrategy Developer Library (MSDL)
Information to understand the MicroStrategy SDK, including details about architecture, object models, customization scenarios, code samples, and so on.
• MicroStrategy Web SDK
The Web SDK is available in the MicroStrategy Developer Library, which is sold as part of the MicroStrategy SDK.
• Narrowcast Server SDK Guide
Instructions to customize Narrowcast Server functionality, integrate Narrowcast Server with other systems, and embed Narrowcast Server functionality within other applications. Documents the Narrowcast Server Delivery Engine and Subscription Portal APIs, and the Narrowcast Server SPI.
To access the installed manuals and other documentation sources, see the following procedures:
• To access installed manuals on Windows, page xix
• To access installed manuals on UNIX and Linux, page xx
To access installed manuals on Windows
1 From the Windows Start menu, choose Programs (or All Programs), MicroStrategy, then Product Manuals. A page opens in your browser showing a list of available manuals in PDF format and other documentation sources.
2 Click the link for the desired manual or other documentation source.

Preface Human Resources Analysis Module Reference
xx Resources © 2010 MicroStrategy, Inc.
3 The Narrowcast Services SDK Guide must be downloaded. When you select this guide, the File Download dialog box opens. Select Open this file from its current location, and click OK.
If bookmarks are not visible on the left side of an Acrobat (PDF) manual, from the View menu click Bookmarks and Page. This step varies slightly depending on your version of Adobe Acrobat Reader.
To access installed manuals on UNIX and Linux
1 Within your UNIX or Linux machine, navigate to the directory where you installed MicroStrategy. The default location is /opt/MicroStrategy, or $HOME/MicroStrategy/install if you do not have write access to /opt/MicroStrategy.
2 From the MicroStrategy installation directory, open the Documentation folder.
3 Open the Product_Manuals.htm file in a web browser. A page opens in your browser showing a list of available manuals in PDF format and other documentation sources.
4 Click the link for the desired manual or other documentation source.
5 The Narrowcast Services SDK Guide must be downloaded. When you select this guide, the File Download dialog box opens. Select Open this file from its current location, and click OK.
If bookmarks are not visible on the left side of an Acrobat (PDF) manual, from the View menu click Bookmarks and Page. This step varies slightly depending on your version of Adobe Acrobat Reader.
Help
MicroStrategy provides several ways to access help:
• Help button: Use the Help button or ? (question mark) icon on most software windows to see help for that window.
• Help menu: From the Help menu or link at the top of any screen, select MicroStrategy Help to see the table of contents, the Search field, and the index for the help system.

Human Resources Analysis Module Reference Preface
© 2010 MicroStrategy, Inc. Resources xxi
• F1 key: Press F1 to see context-sensitive help that describes each option in the software window you are currently viewing.
Documentation standards
MicroStrategy online help and PDF manuals (available both online and in printed format) use standards to help you identify certain types of content. The following table lists these standards.
These standards may differ depending on the language of this manual; some languages have rules that supersede the table below.
Type Indicates
bold • button names, check boxes, options, lists, and menus that are the focus of actions or part of a list of such GUI elements and their definitions
• text to be entered by the userExample: Click Select Warehouse.Example: Type cmdmgr -f scriptfile.scp and press ENTER.
italic • new terms defined within the text and in the glossary• names of other product manuals• when part of a command syntax, indicates variable information to be replaced by the
userExample: The aggregation level is the level of calculation for the metric.Example: Type copy c:\filename d:\foldername\filename
Courier font
• calculations• code samples• registry keys• path and file names• URLs• messages displayed in the screen
Example: Sum(revenue)/number of months.
+ A keyboard command that calls for the use of more than one key (for example, SHIFT+F1)
A note icon indicates helpful information for specific situations.
A warning icon alerts you to important information such as potential security risks; these should be read before continuing.

Preface Human Resources Analysis Module Reference
xxii Resources © 2010 MicroStrategy, Inc.
Education
MicroStrategy Education Services provides a comprehensive curriculum and highly skilled education consultants. Many customers and partners from over 800 different organizations have benefited from MicroStrategy instruction. For a detailed description of education offerings and course curriculums, visit www.microstrategy.com/Education.
Consulting
MicroStrategy Consulting Services provides proven methods for delivering leading-edge technology solutions. Offerings include complex security architecture designs, performance and tuning, project and testing strategies and recommendations, strategic planning, and more. For a detailed description of consulting offerings, visit www.microstrategy.com/Consulting.
International support
MicroStrategy supports several locales. Support for a locale typically includes native database and operating system support, support for date formats, numeric formats, currency symbols, and availability of translated interfaces and certain documentation.
MicroStrategy is certified in homogeneous configurations (where all the components lie in the same locale) in the following languages—English (US), French, German, Italian, Japanese, Korean, Portuguese (Brazilian), Spanish, Chinese (Simplified), Chinese (Traditional), Danish, and Swedish. For information on specific languages supported by individual MicroStrategy system components, see the MicroStrategy readme.
MicroStrategy also provides limited support for heterogeneous configurations (where some of the components may lie in different locales). Please contact MicroStrategy Technical Support for more details.
A translated user interface is available in each of the above languages.

Human Resources Analysis Module Reference Preface
© 2010 MicroStrategy, Inc. Resources xxiii
Technical Support
If you have questions about a specific MicroStrategy product, you should:
1 Consult the product guides, Help, and readme files. Locations to access each are described above.
2 Consult the MicroStrategy Knowledge Base online at https://resource.microstrategy.com/support.
A technical administrator in your organization may be able to help you resolve your issues immediately.
3 If the resources listed in the steps above do not provide a solution, contact MicroStrategy Technical Support directly. To ensure the most productive relationship with MicroStrategy Technical Support, review the Policies and Procedures document in your language, posted at http://www.microstrategy.com/Support/ Policies. Refer to the terms of your purchase agreement to determine the type of support available to you.
MicroStrategy Technical Support can be contacted by your company’s Support Liaison. A Support Liaison is a person whom your company has designated as a point-of-contact with MicroStrategy’s support personnel. All customer inquiries and case communications must come through these named individuals. Your company may designate two employees to serve as their Support Liaisons, and can request to change their Support Liaisons two times per year with prior written notice to MicroStrategy Technical Support.
It is recommended that you designate Support Liaisons who have MicroStrategy Administrator privileges. This can eliminate security conflicts and improve case resolution time. When troubleshooting and researching issues, MicroStrategy Technical Support personnel may make recommendations that require administrative privileges within MicroStrategy, or that assume that the designated Support Liaison has a security level that permits them to fully manipulate the MicroStrategy projects and has access to potentially sensitive project data such as security filter definitions.

Preface Human Resources Analysis Module Reference
xxiv Resources © 2010 MicroStrategy, Inc.
Ensure issues are resolved quickly
Before logging a case with MicroStrategy Technical Support, the Support Liaison may follow the steps below to ensure that issues are resolved quickly:
1 Verify that the issue is with MicroStrategy software and not a third party software.
2 Verify that the system is using a currently supported version of MicroStrategy software by checking the Product Support Expiration Schedule at http://www.microstrategy.com/Support/ Expiration.asp.
3 Attempt to reproduce the issue and determine whether it occurs consistently.
4 Minimize the complexity of the system or project object definition to isolate the cause.
5 Determine whether the issue occurs on a local machine or on multiple machines in the customer environment.
6 Discuss the issue with other users by posting a question about the issue on the MicroStrategy Customer Forum at https://resource.microstrategy.com/forum/.
The following table shows where, when, and how to contact MicroStrategy Technical Support. If your Support Liaison is unable to reach MicroStrategy Technical Support by phone during the hours of operation, they can leave a voicemail message, send email or fax, or log a case using the Online Support

Human Resources Analysis Module Reference Preface
© 2010 MicroStrategy, Inc. Resources xxv
Interface. The individual Technical Support Centers are closed on certain public holidays.
North America Email: [email protected] Web: https://resource.microstrategy.com/support Fax: (703) 842–8709 Phone: (703) 848–8700 Hours: 9:00 A.M.–7:00 P.M. Eastern Time, Monday–Friday except holidays
EMEA:EuropeThe Middle EastAfrica
Email: [email protected] Web: https://resource.microstrategy.com/support Fax: +44 (0) 208 711 2525 The European Technical Support Centre is closed on national public holidays in each country.Phone:
• Belgium: + 32 2792 0436• France: +33 17 099 4737• Germany: +49 22 16501 0609• Ireland: +353 1436 0916• Italy: +39 023626 9668• Poland: +48 22 321 8680• Scandinavia & Finland: +46 8505 20421• Spain: +34 91788 9852• The Netherlands: +31 20 794 8425• UK: +44 (0) 208 080 2182• International distributors: +44 (0) 208 080 2183
Hours:• United Kingdom: 9:00 A.M.–6:00 P.M. GMT, Monday-Friday except holidays• EMEA (except UK): 9:00 A.M.–6:00 P.M. CET, Monday-Friday except holidays
Asia Pacific Email: [email protected] Web: https://resource.microstrategy.com/support Phone:
• Australia: +61 2 9333 6499• Korea: +82 2 560 6565 Fax: +82 2 560 6555• Japan: +81 3 3511 6720 Fax: +81 3 3511 6740• Singapore: +65 6303 8969 Fax: +65 6303 8999• Asia Pacific (except Australia, Japan, Korea, and Singapore): +86 571 8526 8067 Fax: +86
571 8848 0977Hours:
• Japan and Korea: 9:00 A.M.–6:00 P.M. JST (Tokyo), Monday-Friday except holidays• Asia Pacific (except Japan and Korea): 7 A.M.-6 P.M. (Singapore) Monday-Friday except
holidays
Latin America Email: [email protected] Web: https://resource.microstrategy.com/support Phone:
• LATAM (except Brazil and Argentina): +54 11 5222 9360 Fax: +54 11 5222 9355• Argentina: 0 800 444 MSTR Fax: +54 11 5222 9355• Brazil: +55 11 3054 1010 Fax: +55 11 3044 4088
Hours: • Latin America (except Brazil): 9:00 A.M.–7:00 P.M. (Buenos Aires), Monday-Friday except
holidays • Brazil: 9 A.M. - 6 P.M. (São Paulo), Monday–Friday except holidays

Preface Human Resources Analysis Module Reference
xxvi Resources © 2010 MicroStrategy, Inc.
Support Liaisons should contact the Technical Support Center from which they obtained their MicroStrategy software licenses or the Technical Support Center to which they have been designated.
Required information when calling
When contacting MicroStrategy Technical Support, please provide the following information:
• Personal information:
Name (first and last)
Company and customer site (if different from company)
Contact information (phone and fax numbers, e-mail addresses)
• Case details:
Configuration information, including MicroStrategy software product(s) and versions
Full description of the case including symptoms, error messages(s), and steps taken to troubleshoot the case thus far
• Business/system impact
If this is the Support Liaison’s first call, they should also be prepared to provide the following:
• Street address
• Phone number
• Fax number
• Email address
To help the Technical Support representative resolve the problem promptly and effectively, be prepared to provide the following additional information:
• Case number: Please keep a record of the number assigned to each case logged with MicroStrategy Technical Support, and be ready to provide it when inquiring about an existing case
• Software version and product registration numbers of the MicroStrategy software products you are using

Human Resources Analysis Module Reference Preface
© 2010 MicroStrategy, Inc. Resources xxvii
• Case description:
What causes the condition to occur?
Does the condition occur sporadically or each time a certain action is performed?
Does the condition occur on all machines or just on one?
When did the condition first occur?
What events took place immediately prior to the first occurrence of the condition (for example, a major database load, a database move, or a software upgrade)?
If there was an error message, what was its exact wording?
What steps have you taken to isolate and resolve the issue? What were the results?
• System configuration (the information needed depends on the nature of the problem; not all items listed below may be necessary):
Computer hardware specifications (processor speed, RAM, disk space, and so on)
Network protocol used
ODBC driver manufacturer and version
Database gateway software version
(For MicroStrategy Web-related problems) browser manufacturer and version
(For MicroStrategy Web-related problems) Web server manufacturer and version
If the issue requires additional investigation or testing, the Support Liaison and the MicroStrategy Technical Support representative should agree on certain action items to be performed. The Support Liaison should perform any agreed-upon actions before contacting MicroStrategy Technical Support again regarding the issue. If the Technical Support representative is responsible for an action item, the Support Liaison may call MicroStrategy Technical Support at any time to inquire about the status of the issue.

Preface Human Resources Analysis Module Reference
xxviii Feedback © 2010 MicroStrategy, Inc.
FeedbackPlease send any comments or suggestions about user documentation for MicroStrategy products to:
Send suggestions for product enhancements to:
When you provide feedback to us, please include the name and version of the products you are currently using. Your feedback is important to us as we prepare for future releases.

© 2010 MicroStrategy, Inc. 1
11.INTRODUCTION TO THE HUMAN RESOURCES ANALYSIS MODULE
Introduction
Human resource departments support a wide variety of business functions that are critical to their company’s success. At the same time, companies must maintain a focus on the security, confidentiality, and accuracy of human resources data. The MicroStrategy Human Resources Analysis Module (HRAM) allows users to analyze human resources data from the lowest level of detail on employees and positions to the highest summarized level, to gain insight into recruiting, training, managing, and retaining the best employees for the appropriate business functions.
HRAM is designed around six basic human resource business functions, and enables companies to
• Maximize the effectiveness of the recruiting process
• Optimize employee skills
• Align compensation costs with industry standards
• Manage attrition
• Analyze employee benefit usage and costs

Introduction to the Human Resources Analysis Module Human Resources Analysis Module Reference1
2 Business questions that HRAM reports can answer © 2010 MicroStrategy, Inc.
• Improve workforce productivity
Business questions that HRAM reports can answer
HRAM is designed to provide insight into many aspects of a workforce, including fine-grained employee analysis, details about compensation and benefits, measurements for employee recruitment and attrition, as well as general workforce development and productivity. Knowledge can be gleaned from packaged MicroStrategy analytics, which include reports, scorecards (a specific collection of related reports), and dashboards (a collection of related reports customized for optimum display). In addition, some reports show summarized information while others display very specific, detailed data about your company’s workforce.
The analytics in HRAM can be used to answer questions such as the following:
• How long are employees staying with the company? How can the best people be attracted, retained, and motivated?
• Are compensation and benefits correctly related to titles and job descriptions? How do they relate to market standards?
• Are performance appraisals used efficiently?
• What are our current and future staffing needs?
• What is the executive-to-employee ratio? How has that ratio changed over time?
• What employee training and skills are available to the company? Are training and skills sufficient for current or upcoming projects?
• Have we achieved our goal of non-discrimination in our hiring?
• Which employee benefits are the most popular, and which can we pare down? Are human resources utilized productively?
• How long does it take us to fill vacant positions? Which point in the hiring process presents the longest delay?
• What does our recruiting pipeline look like? How effective is our recruitment process?

Human Resources Analysis Module Reference Introduction to the Human Resources Analysis Module 1
© 2010 MicroStrategy, Inc. Business questions that HRAM reports can answer 3
Business analysis areas for HRAM reports
HRAM covers the analytical needs of major human resources functions, as well as many important business metrics:
• Workforce headcounts: Analyze overall trends in workforce numbers, as well as details of employee functional areas, training, geographical location, tenure, and many others. Combine trend analysis, such as hiring by department, with detailed analysis, such as attrition levels for individual departments, to gain insight into company growth. An analysis of attrition rate by recruiting source combined with an analysis of number of hires by recruiting source can yield important information on the value of your recruiting sources.
• Employee profiles: Analyze employee geographical distribution based on gender, age, ethnic group, and many other factors. Use this information to locate employee-related trends related to tenure, vacancies, the executive-to-employee ratio, your turnover/attrition/hire rate, and so on. Monitor goals toward non-discrimination with identity group distribution analysis.
• Compensation and benefit analysis: Analyze how different departments or regions distribute salaries and bonuses, and compare employee compensation to industry standards. Use information to motivate actions that prevent top employees from leaving. Analyze overtime pay based on number of hours worked and positions with the most overtime. Analyze company targets for headcount and compensation.
• Recruitment analysis: Analyze hiring trends and company needs. Understand trends for new full-time and part-time employees over time. Detailed analysis includes information on vacant positions, as well as recruitment source and recruitment pipeline analysis. Understand hiring in terms of number of resumes received, number of interviews conducted, and number of offers made, accepted, and rejected, to analyze whether your company is processing recruits too slowly or not interviewing enough people, for example.
• Workforce development and productivity: Analyze employee qualification skills to align them with project requirements. Analyze details related to employee performance for data to support bonus and promotion goals. Analyze overall trends from corporate surveys on employee satisfaction, in combination with detailed reports, to discover whether a survey result represents a consistent response or an average of very different responses.

Introduction to the Human Resources Analysis Module Human Resources Analysis Module Reference1
4 Business questions that HRAM reports can answer © 2010 MicroStrategy, Inc.
HRAM analysis areas
HRAM divides the human resources analytical area into the following analysis areas:
• Workforce analysis
This area provides a general analysis of employee trends and profiles. This area is further broken down into two sections:
Headcount and Trends: This section analyzes workforce trends and distributions by employee function, location, length of service (tenure) and other employees' categories. The two subsections of the Headcount and Trends section are dedicated to contractor details and analysis of employee transfers.
Employee Profile Analysis: This section analyzes the distribution of employees by gender, age, ethnic group, and all other employee profile characteristics.
For Workforce analysis reports, see Chapter 3, Workforce Analysis.
• Compensation analysis
This area provides a targeted analysis of employee compensation costs. The reports in this area enable organizations to monitor trends, be alerted to significant deviations from industry standards, and to align compensations costs to individual performance. The two subsections in the Compensation analysis area are dedicated to overtime cost analysis and planning.
For Compensation analysis reports, see Chapter 4, Compensation Analysis.
• Benefit analysis
Analytics in this area are designed to help you examine and improve the management of costs associated with providing non-cash benefits for employees.
For Benefit analysis reports, see Chapter 5, Benefit Analysis.
• Attrition analysis
This area provides insight into employee attrition by identifying attrition trends and profiles of employees who leave, so that an organization can pro-actively improve retention rates and minimize the loss of key talent.
For Attrition analysis reports, see Chapter 6, Attrition Analysis.

Human Resources Analysis Module Reference Introduction to the Human Resources Analysis Module 1
© 2010 MicroStrategy, Inc. HRAM report features 5
• Recruitment analysis
This analysis area is designed to optimize the recruitment process by identifying hiring trends, profiles, and organization needs.
For Recruitment analysis reports, see Chapter 7, Recruitment Analysis.
• Workforce development and productivity
This set of analytics includes several different subsections:
Employee Qualification: This subsection identifies employees by their qualified skills, and enables organizations to quickly align required project skills with employee qualifications.
Employee Performance: This subsection provides analysis of individual employee performance in relation to meeting individual and corporate goals. These analytics enable organizations to align salary increases and bonus payments with attaining targeted goals.
Employee Satisfaction: This subsection allows organizations to analyze the results of corporate surveys on employee satisfaction.
For Workforce development and productivity reports, see Chapter 8, Workforce Development and Productivity Analysis.
The analysis areas listed above are independent and can be implemented separately. Since all HRAM reports are aligned with one of the analysis areas, only the data corresponding to the given area is required to take full advantage of HRAM’s reports.
HRAM report featuresHRAM queries human resources data optimized for OLAP reporting and analysis, and is deployed on top of a your existing HR management system. HRAM is built using the MicroStrategy business intelligence platform and takes advantage of the rich reporting and analytical features of MicroStrategy products.
• Reporting flexibility: Prompts allow you to define report templates dynamically and select filter conditions to be used at run time.
• Rich formatting: Reports use advanced MicroStrategy formatting features, such as thresholds to highlight important trends, page-by to move quickly to summary information, graphs to display data three-dimensionally or with a line or column, and so on. For example, the

Introduction to the Human Resources Analysis Module Human Resources Analysis Module Reference1
6 HRAM report features © 2010 MicroStrategy, Inc.
Alert: Individual Salaries above Industry Range report includes a threshold, so that data is highlighted when the difference between an employee’s salary and the industry standard salary is greater than $5,000.
• Segmentation and custom grouping capabilities: You can define sets of elements (segments) that meet certain conditions, and view data on the defined segments. For example, you can group employees in a particular way, such as by a specific Ethnicity and Gender, and then view information for the defined custom group.
• Ad hoc analysis: You can create additional reports based on existing attributes or metrics, or create new reports to address specific reporting needs.
• Dashboards: You can combine data from different sources into one HTML document and display the data graphically at a high level, making it visually appealing and easy to understand. You can combine grids, graphs, text, and special dashboard images to create a quick overview of key performance indicators (KPIs).
• Scorecards: You can combine several reports into one HTML document, including different display modes such as graph, grid, and so on.
• Report Services documents: A document is a set of data with extensive formatting properties applied. When creating a document, you can specify what data appears, control how it will be laid out and formatted, and how it should be grouped. You can insert pictures and draw borders in the document. All of these capabilities allow you to create reports that are suitable for presentation to management or printing for boardroom quality material.
• Advanced metrics: Advanced metrics include, for example, Industry Mode, which presents the most frequent industry standard salary (or market value) assigned to a certain employee level at a certain time, or Participants, which calculates the number of people participating in a particular employee benefit. This number may be different from the number of enrolled employees if employees can enroll family members.
• Advanced drilling: You can navigate (or drill) through the data in reports, from highly summarized information down to attributes and other data details.
For a more in-depth introduction to MicroStrategy query and reporting features as well as an interactive tutorial, see the MicroStrategy Basic Reporting Guide.
Human Resources Analysis Module Reference Introduction to the Human Resources Analysis Module 1
© 2010 MicroStrategy, Inc. Introduction to reports, dashboards, and documents 7
Introduction to reports, dashboards, and documents
This reference guide describes the reports and documents that summarize the HRAM analysis areas. This guide also describes the general analysis areas within HRAM and presents the reports within each analysis area that come with HRAM.
Each general analysis area provides a short introduction to the area, explaining the analysis challenges and presenting the list of packaged reports that belong to that general reporting area.
For each report, scorecard, or document, this guide provides:
• A description of its business value
• Typical usage scenarios
• A screen shot with sample data
The sample data warehouse that supplies information for the sample reports is updated regularly. As a result, data that appears in images in this guide may not always coincide exactly with the data returned for a sample report in the software.
• A description of how data is qualified
• Typical drill paths
• Tips about how the report, scorecard, or document can be customized and extended to fit user requirements
Report Services documents can only be displayed in a server connection (a three-tier environment). You must be connected to MicroStrategy Intelligence Server. Additionally, to display a Report Services document, you must have MicroStrategy Report Services. See the MicroStrategy Installation and Configuration Guide for information on connecting to Intelligence Server and the MicroStrategy Report Services Document Creation Guide for details on Report Services documents.

Introduction to the Human Resources Analysis Module Human Resources Analysis Module Reference1
8 Introduction to reports, dashboards, and documents © 2010 MicroStrategy, Inc.
Accessing reports
All the HRAM reports and scorecards are stored in the Reports folder of the Human Resources Analysis Module project.
To access reports
1 From the Windows Start button, point to Programs, then MicroStrategy, then Desktop, and select Desktop.
2 Enter your user name and password, and click OK. The default user name is Administrator with the password field left blank. If your system administrator has changed this, contact that person to get a user name and password.
3 From the Folder List area, expand the Analytics Modules.
4 Expand the Human Resources Analysis Module.
5 Expand Public Objects, and expand Reports. All HRAM reports and scorecards are located in this Reports folder.
About scorecards and dashboards
Scorecards and dashboards are popular ways to display and distribute data from business intelligence projects. In MicroStrategy, dashboards and scorecards are Report Services documents.
A Report Services document is a set of data and formatting properties that, when executed, can produce an attractive presentation-quality report. For more information on Report Services documents, see About Report Services documents, page 10.
The information in this section is intended as a brief overview of scorecards and dashboards.

Human Resources Analysis Module Reference Introduction to the Human Resources Analysis Module 1
© 2010 MicroStrategy, Inc. Introduction to reports, dashboards, and documents 9
Scorecards
Scorecards provide you with a high-level summary of key performance indicators (KPIs) for a given analysis area. They accomplish this by displaying data of actual performance compared to planned targets and benchmarks.
Scorecards are made up of several combined base reports. Scorecards are a good starting point for any Analysis Module because scorecards comprise the most common or most important reports within a given analysis area. From the data returned on a scorecard, you can formulate ideas for more detailed exploration. See Accessing Reports in this chapter for steps to open an HRAM scorecard.
Scorecards are laid out to help you with the information-gathering process. The most general information is found at the top left of the scorecard, and the reports get more detailed as you move from left to right, top to bottom. The scorecards that come with HRAM are described in Chapter 2, HRAM Scorecards and Dashboards.
Dashboards
Dashboards, like scorecards, are made up of a group of reports and metrics that are tied together by business logic. Scorecards typically follow a specific methodology and focus on key metrics within a business area. Dashboards, on the other hand, also provide key metrics but tend to summarize business intelligence information more widely.
Dashboards allow you to display information customized to your audience. Audiences might include executives, managers, or particular groups within the company such as Marketing or Sales. In some cases, you may choose to provide information to partners or customers. Among other things, dashboards let you:
• Add interactivity to a document, so that analysts can select various options directly on the document to display the specific data they are interested in
• Choose a uniform coloring scheme or display information using your company’s standard Web page style
• Add links wherever necessary
• Choose the appropriate graphs, images, and colors for better presentation and to highlight specific data, trends, and deviation from certain trends, as well as to provide visual cues

Introduction to the Human Resources Analysis Module Human Resources Analysis Module Reference1
10 Introduction to reports, dashboards, and documents © 2010 MicroStrategy, Inc.
• Share the dashboard using Desktop, Web, or via e-mail using Narrowcast Server
About Report Services documents
A MicroStrategy Report Services document is a set of data and formatting properties that, when executed, can produce an attractive presentation-quality report. There are several types of Report Services documents, including the following:
• Scorecards and dashboards: Designed for visual impact, these documents provide a distilled view of the business, organized in adaptive sections or zones.
• Managed metrics reports: With a quantitative focus, these documents present lists of metrics or process-driven tabular views of the business.
• Production and operational reports: Designed for production operations management, these documents present data in hierarchical categories or bands and can span across hundreds of printed pages.
• Invoices and statements: These documents use the transaction and sub-transaction level data necessary for billing, collection, and customer service.
• Business reports: Designed for financial and other statutory business reporting, these documents present comprehensive data in print and electronic forms.
See the other MicroStrategy Analytics Modules and the MicroStrategy Tutorial for examples of the various types of Report Services documents.
Accessing documents
To open a document that has already been created
1 From a project in MicroStrategy Desktop or Web, navigate to the folder containing the document.
2 Do one of the following depending on which interface you are using:
• In MicroStrategy Web, click the document name or icon. The document displays.

Human Resources Analysis Module Reference Introduction to the Human Resources Analysis Module 1
© 2010 MicroStrategy, Inc. About definitions for objects on reports 11
• In MicroStrategy Desktop, double-click the document name or icon. It opens in PDF View.
For complete details on viewing, creating, and working with documents, see the MicroStrategy Report Services Document Creation Guide.
About definitions for objects on reportsThe objects used in the HRAM reports are presented in glossaries in Appendix A of this reference guide. The glossaries include descriptions of the public objects (metrics, filters, prompts, consolidations, and custom groups) that make up HRAM.
For details, see Appendix A, Definitions for Objects on Reports: Object Glossaries. For complete details on any HRAM object, see the MicroStrategy project definitions in the Schema Objects and Public Objects folders.
About the structure of HRAM’s business logicHRAM’s logical data model (sometimes also called the multidimensional model) is presented in Appendix B of this reference guide. The logical data model is the group of attributes (business concepts) and facts (measures, or logical pieces of data that can be analyzed) that make up an Analysis Module, arranged in specific sequences to reflect a business structure or business logic. A logical data model also shows how that business logic maps to the physical schema (data elements in a data warehouse). For details about logical data modeling, see the data modeling section of the MicroStrategy Basic Reporting guide.
The logical schema diagram is available in an Erwin file, located in Program Files\MicroStrategy\Analytics Modules\Hram\Hram.er1. For additional details, see Appendix B, Structure of HRAM’s Business Logic: Logical Data Model.
The documentation assumes you have prior experience with logical data modeling and creating business intelligence applications using MicroStrategy technology.
Introduction to the Human Resources Analysis Module Human Resources Analysis Module Reference1
12 About the structure of HRAM’s business logic © 2010 MicroStrategy, Inc.
Business concepts and measurements
Business concepts, such as year or customer, are generally represented in MicroStrategy as attributes. Measurements, such as profit or revenue, are usually represented as facts.
To get full details about any attribute or fact in any Analysis Module, use the Attribute Editor. You can view information that includes definitions, properties, mapping methods, source tables, and so on.
To view attribute or fact details
1 From MicroStrategy Desktop, open the Financial Reporting Analysis Module.
2 Open the Schema Objects folder.
• Attributes can be found in the Attributes folder.
• Facts can be found in the Facts folder.
3 Double-click the individual attribute or fact. The Attribute Editor automatically opens and displays details about the selected object.
Relationships among business concepts
The attributes and facts in the logical data model are arranged in a specific sequence to reflect business logic. This arranged structure is called a hierarchy (sometimes also called a dimension).
The analysis hierarchies for each module include a number of hierarchies through which data can be summarized.
Default analysis hierarchies can be easily customized and extended to support analysis structures required for each company. See the Logical Data Model appendix and Physical Schema and Data Dictionary appendix in this guide for additional details.

Human Resources Analysis Module Reference Introduction to the Human Resources Analysis Module 1
© 2010 MicroStrategy, Inc. Introduction to HRAM’s physical data storage 13
Porting an analytics module to your data source
The MicroStrategy Analytics Modules are designed around the concept of portability. Portability is the ability of an analytical application to be integrated into an existing data warehouse. Porting a given analytical application involves remapping the application’s logical data model to an existing physical data warehouse schema while retaining the logical data model definition.
The MicroStrategy Analytics Modules are designed to be independent from data structures. HRAM’s logical data model and reports can work with the physical data schema they come with, or with almost any other physical schema (such as your own data warehouse) containing the same or similar data elements. See the Installation and Porting Guide for more information on porting and detailed steps to use this feature.
Introduction to HRAM’s physical data storageThe physical schema for HRAM’s default data warehouse is presented in Appendix C of this reference guide.
You can use the default warehouse in the following ways:
• You can use it as a starting point for creating your own data warehouse in the customer analysis area.
• You can use it as a template for building analytical applications
• You can port HRAM’s logical data model to your own existing data warehouse.
See the Installation and Porting Guide for details on any of these three approaches to the Analytics Modules.
This reference guide contains the physical schema diagram for the default data warehouse and also provides descriptions of all the tables and columns in the default data warehouse, as well as their purposes.
The default physical schema definition is also available in an Erwin file, which is located in Program Files\MicroStrategy\Analytics Modules\Hram\Hram.er1.
The documentation assumes you are familiar with basic RDBMS concepts and Erwin data modeling.

Introduction to the Human Resources Analysis Module Human Resources Analysis Module Reference1
14 Introduction to HRAM’s physical data storage © 2010 MicroStrategy, Inc.

© 2010 MicroStrategy, Inc. 15
22.HRAM SCORECARDS AND DASHBOARDS
Introduction
Scorecards provide a high-level summary of key performance indicators (KPIs) for a given analysis area. They accomplish this by displaying actual performance data compared to planned targets and benchmarks. Scorecards are made up of several base reports (called datasets) that, when combined, provide you with a general overview of a given analysis area. These datasets are displayed in a MicroStrategy Report Services document.
A document is a set of data and formatting properties that, when executed, display an attractive, presentation-quality report. A dashboard is a type of document in MicroStrategy.
This chapter provides information, usage scenarios, screen shots, and options for the Human Resource Analysis Module’s (HRAM’s) scorecards and documents. The scorecards and documents are available in the HRAM Reports folder; see Accessing reports, page 8.
Report Services documents can only be displayed in a server connection (a three-tier or four-tier environment). You must be connected to MicroStrategy Intelligence Server. Additionally, to display a Report Services document, you must have the MicroStrategy Report Services product. See the MicroStrategy Installation and

HRAM Scorecards and Dashboards Human Resources Analysis Module Reference2
16 Scorecards and dashboards © 2010 MicroStrategy, Inc.
Configuration Guide for information on connecting to Intelligence Server and the MicroStrategy Report Services Document Creation Guide for details on Report Services documents.
Scorecards and dashboards
Attrition Scorecard
This scorecard summarizes employee attrition data from the most general level of employee information, such as attrition trends and geographic distributions, to the most detailed, such as which employees leave and why.
Scorecard layout and display

Human Resources Analysis Module Reference HRAM Scorecards and Dashboards 2
© 2010 MicroStrategy, Inc. Scorecards and dashboards 17
The datasets in this scorecard include:
• Attrition by Department
• Reasons for Departure
• Departed Employees
• Employee Attrition - Quarterly Trend
• Average Attrition Rate
• Department with Maximum Attrition Rate
Usage scenarios
This scorecard is useful to get a general picture of employee departures. It also provides an alert when attrition in any department reaches a certain threshold.
Compensation Scorecard
This scorecard displays an overview of compensation data from the most general level, showing annual trends and the relative distribution of compensation items by division, to the most detailed level, such as salary statistics by employee level, employee profile, and market salary differences.

HRAM Scorecards and Dashboards Human Resources Analysis Module Reference2
18 Scorecards and dashboards © 2010 MicroStrategy, Inc.
Scorecard layout and display
The datasets in this scorecard include:
• Salary by Employee Level
• Top Performers’ Salary to Industry Mode
• Compensation Items - Quarterly Trend
• Compensation Distribution by Division
Usage scenarios
Use this scorecard to:
• Compare employee compensation against the industry as a whole.
• Track compensation by division and department within the company.
• View compensation trends over time, broken into salary, awards, bonuses, and average salaries.

Human Resources Analysis Module Reference HRAM Scorecards and Dashboards 2
© 2010 MicroStrategy, Inc. Scorecards and dashboards 19
HR Director Dashboard
This interactive dashboard provides the Human Resources director with an overview of trends in employee movement, broken down by organizational division (such as by Sales, Marketing, and Corporate) and by geographical region. You can look at employee transfers and other employee movement within the organization. At the same time you can view employee satisfaction survey results for various workplace measures.
This dashboard showcases several MicroStrategy widgets, including the Microcharts widget, which combines a grid of data with chart visualization.
Dashboard layout and display
The datasets within this dashboard include:
• Division Breakdown
• KPIs (key performance indicators)
• Region Breakdown
• Region From-To Transfers

HRAM Scorecards and Dashboards Human Resources Analysis Module Reference2
20 Scorecards and dashboards © 2010 MicroStrategy, Inc.
• Survey Results
• Trends by Division
Usage scenarios
Use this interactive dashboard to track the status of your department’s progress toward targets and key performance indicators such as headcounts, average salary numbers, number of vacant positions, and number of new employees. The colored grid highlights transfers from one region to another, and shows the numbers of employees involved in transfers from those regions. Finally, use the survey results to keep track of employee satisfaction about such workplace measures as atmosphere, quality and quantity of work, and compensation and benefits.
HR Performance Management Dashboard
This dashboard presents a graphical display of human resources performance measurements for employee recruitment, hiring, and distribution, compensation and benefits, productivity and development, attrition and retention, and resource optimization.

Human Resources Analysis Module Reference HRAM Scorecards and Dashboards 2
© 2010 MicroStrategy, Inc. Scorecards and dashboards 21
Dashboard layout and display
The datasets within this dashboard include:
• 401K Plan Participation Rate
• Attrition Rate
• Compensation: Actual as % Planned
• Internal Transfer as % All Positions Filled
• Involuntary Departures: Minority Group to All Involuntary Departures (normalized)
• New Employees as % Total
• New Hires: Minority Group to All New Hires (normalized)
• Overtime per Employee (hours)
• Training Rate
• Turnover Rate

HRAM Scorecards and Dashboards Human Resources Analysis Module Reference2
22 Scorecards and dashboards © 2010 MicroStrategy, Inc.
• Turnover Rate (Including Transfers)
• Vacant Position as % Total
Usage scenarios
This dashboard provides insight into human resources department performance against targets for recruitment, hiring, compensation, benefits, productivity, and development. It can also be helpful for optimizing resources and ensuring fair labor practices.
Dashboard details
This document includes a static filter on the last quarter of data in the sample data warehouse.
HR Summary Scorecard
This scorecard provides an overview of important human resources activities and performance, including a summary of headcounts, projected attrition rates, and vacant positions. A graphical view helps identify trends in departing employees, new employees, and overall attrition and hiring rates. The scorecard also includes details on training objectives, minority group goals, span of management targets, and employee satisfaction.

Human Resources Analysis Module Reference HRAM Scorecards and Dashboards 2
© 2010 MicroStrategy, Inc. Scorecards and dashboards 23
Scorecard layout and display
The datasets within this scorecard include:
• Headcount and Average Tenure by Department
• Attrition, Hire, and Turnover Rate
• Headcount and Average Tenure by Quarter
Usage scenarios
This scorecard is helpful to get a general overview of important human resources activities.
Scorecard details
• Qualifications: This document includes a static filter on the last year of data in the sample data warehouse.

HRAM Scorecards and Dashboards Human Resources Analysis Module Reference2
24 Scorecards and dashboards © 2010 MicroStrategy, Inc.
Human Resources Analysis Dashboard
This interactive dashboard analyzes employee headcount, attrition, recruitment, and compensation across the enterprise.
Scorecard layout and display
The datasets included in this dashboard are:
• Headcount - KPIs
• Headcount vs. Planned - Monthly Trend
• Attrition - KPIs
• Compensation - KPIs
• Compensation - Quarterly Trends
• Attrition - Quarterly Trends

Human Resources Analysis Module Reference HRAM Scorecards and Dashboards 2
© 2010 MicroStrategy, Inc. Scorecards and dashboards 25
• Hiring - Quarterly Trends
• Headcount by Department
• Headcount by Region
• Reasons for Departure - Quarter
• Hires by Education - Quarter
• Hires by Recruiting Sources - Quarter
• Compensation by Department
• Compensation by Department - Quarterly Trends
Usage scenarios
Use this interactive dashboard to display summary data related to headcount, attrition, hiring, and compensation. To do this, click any of the tabs at the top.
Use the other interactive features within the dashboard to further explore details you are interested in. For example, on the Headcount Summary tab, use the slider below the graph to view actual headcounts compared to planned headcounts, for a given time period. You can change the time period by moving the slider, and change the span of time by moving one end of the slider closer to or further from the other end.
Recruitment Scorecard
This scorecard summarizes hiring data from a general level of employee-related information, such as recruitment trends and geographic distributions, to a detailed level, such as the major hiring sources and who was hired.

HRAM Scorecards and Dashboards Human Resources Analysis Module Reference2
26 Scorecards and dashboards © 2010 MicroStrategy, Inc.
Scorecard layout and display
The datasets included in this scorecard are:
• Hires by Department
• Hiring Rate - Quarterly Trend
• Recruiting Sources
• Q4 Hires
Usage scenarios
This scorecard is helpful to get a general picture of newly hired employees.
Scorecard details
This document includes a static filter on the last year or the last quarter of data in the sample data warehouse.

Human Resources Analysis Module Reference HRAM Scorecards and Dashboards 2
© 2010 MicroStrategy, Inc. Scorecards and dashboards 27
HR Summary Dashboard
This dashboard provides an overview of important human resource activities, employee attrition data, compensation data, and recruitment trends. The dashboard is organized into four tabs; each tab contains an individual scorecard for a particular user group or for a particular area of human resources. Click any of the tabs to view a scorecard. The scorecard details are as follows:
• HR Summary: This scorecard provides an overview of important human resources activities and performance, including a summary of headcounts, projected attrition rates, and vacant positions.
• Attrition: This scorecard summarizes employee attrition data from the general level of employee information, such as attrition trends and geographic distributions, to a detailed level, such as which employees leave and why.
• Compensation: This scorecard displays an overview of compensation data from the general level, showing annual trends and the relative distribution of compensation items by division, to a detailed level, such as salary statistics by employee level, employee profile, and market salary differences.
• Recruitment: This scorecard summarizes hiring data from a general level of employee-related information, such as recruitment trends and geographic distributions, to a detailed level, such as the major hiring sources and who was hired.

HRAM Scorecards and Dashboards Human Resources Analysis Module Reference2
28 Scorecards and dashboards © 2010 MicroStrategy, Inc.
Dashboard layout and display
The datasets included in this dashboard are:
• Headcount and Average Tenure by Department
• Attrition, Hire, and Turnover Rate
• Headcount and Average Tenure by Quarter
• Attrition by Department
• Reasons for Departure

Human Resources Analysis Module Reference HRAM Scorecards and Dashboards 2
© 2010 MicroStrategy, Inc. Scorecards and dashboards 29
• Departed Employees
• Employee Attrition - Quarterly Trend
• Average Attrition Rate
• Department with Maximum Attrition Rate
• Salary by Employee Level
• Top Performers' Salary to Industry Mode
• Compensation Items - Quarterly Trend
• Compensation Distribution by Division
• Hires by Department
• Hiring Rate - Quarterly Trend
• Recruiting Sources
• Q4 Hires
Usage scenarios
Use this interactive dashboard to view data related to human resources activities, attrition levels in each department, employee compensation comparison, and general recruitment scenarios. Click any of the tabs at the top to view the relevant data. For example, on the HR Summary tab, managers can get a general overview of important human resource activities.
Dashboard details
This document includes a static filter on the last year of data in the sample data warehouse.

HRAM Scorecards and Dashboards Human Resources Analysis Module Reference2
30 Scorecards and dashboards © 2010 MicroStrategy, Inc.

© 2010 MicroStrategy, Inc. Workforce analysis area 31
33.WORKFORCE ANALYSIS
Introduction
This chapter provides reference information for the Workforce analysis area reports that come with the Human Resource Analysis Module (HRAM). It presents detailed information on each report in this analysis area, including usage scenarios, screen shots, and reporting details. The reports are available in the HRAM Reports folder; see Accessing reports, page 8.
For information on the attributes, metrics, and filters included in the HRAM reports, see Appendix A, Definitions for Objects on Reports: Object Glossaries.
Workforce analysis areaThis area provides general analysis of employee trends and profiles.
The Workforce analysis area is divided into the following subsections, each with its own focused reports:

Workforce Analysis Human Resources Analysis Module Reference3
32 Headcounts and Trends reports © 2010 MicroStrategy, Inc.
• Headcount and Trends analysis focuses on workforce trends and distributions by employee function, location, length of service (tenure), and other employee categories. The two subsections of the Headcount and Trends section are dedicated to contractor-specific details and analysis of employee transfers.
• Employee Profile analysis looks at the distribution of employees by gender, age, ethnic group, and other employee profile characteristics.
Headcounts and Trends reportsThe Headcounts and Trends analysis area includes the following reports:
• Distribution by Department - Monthly Trend
• Division Distribution - Yearly Trend
• Employee Distribution by Department and Region
• Employee Distribution by Identity Groups - Yearly Trend
• Employee Distribution by Tenure and Division
• Employee Distribution by Tenure and Region
• Headcount - Monthly Trend
• Region Distribution - Yearly Trend
• Workforce Tenure - Monthly Trend
The Headcounts and Trends area also contains a Contractors subsection, which includes the following reports:
• Contract Expiration Alert
• Contractor Cost Analysis
• Contractors by Region and Division
The Headcounts and Trends area contains a second subsection called Transfers, which includes the following reports:
• Transfer Analysis - Monthly Trend
• Transfers to Employee Base - Monthly Trend
• Transfer Distribution by Department

Human Resources Analysis Module Reference Workforce Analysis 3
© 2010 MicroStrategy, Inc. Headcounts and Trends reports 33
• Transfer Distribution by Location
• Employee Flow by Department - Monthly Trend
• Employee Flow by Location - Monthly Trend
• Overall Employee Flow by Department
• Overall Employee Flow by Location
• Employee Transfer History by Department
• Employee Transfer History by Location
Distribution by Department - Monthly Trend
This detailed report shows employee status across company departments. This report can provide information on possible employee status changes over time.
Usage scenarios
This report highlights trends in employee status distribution, and monitors whether the number of temporary employees and part-time employees is proportional to the number of full-time employees. You can select the months (grouped by quarter) to view.

Workforce Analysis Human Resources Analysis Module Reference3
34 Headcounts and Trends reports © 2010 MicroStrategy, Inc.
Report layout and display
This report appears as a grid.
Report details
• Qualification: You are prompted to select a quarter to analyze.
• Drill path: No drill path is recommended.
Division Distribution - Yearly Trend
This simple report helps you see workforce trends across company divisions.
Usage scenarios
Use this report to see how your part-time and full-time employee numbers change by company division, over time. You can select the years to view.

Human Resources Analysis Module Reference Workforce Analysis 3
© 2010 MicroStrategy, Inc. Headcounts and Trends reports 35
Report layout and display
This report appears as a grid.
Report details
• Qualification: You are prompted to select one or more years to analyze.
• Drill path: No drill path is recommended.
Employee Distribution by Department and Region
This report provides a snapshot of the company’s employee distribution by geographical region and department.
Usage scenarios
This report helps you see workforce distribution across departments and locations.

Workforce Analysis Human Resources Analysis Module Reference3
36 Headcounts and Trends reports © 2010 MicroStrategy, Inc.
Report layout and display
This report appears as a grid.
Report details
Drill path: You can drill down to Location or Department.
Employee Distribution by Identity Groups - Yearly Trend
This report shows employee distribution by self-declared identity group.
Usage scenarios
Use this report to monitor your goals for identity group distribution. You can select the years to analyze.

Human Resources Analysis Module Reference Workforce Analysis 3
© 2010 MicroStrategy, Inc. Headcounts and Trends reports 37
Report layout and display
This report appears as a graph with vertical bars.
Report details
• Qualifications: You are prompted to select a year to analyze.
• Drill path: No drill path is recommended.
Employee Distribution by Tenure and Division
This report provides a snapshot of the company’s employee distribution by employee tenure level and company division.
Usage scenarios
This report helps you see workforce distribution across employee tenure levels and company divisions.

Workforce Analysis Human Resources Analysis Module Reference3
38 Headcounts and Trends reports © 2010 MicroStrategy, Inc.
Report layout and display
This report appears as a graph using a set of pie charts, one per division.
Report details
• Drill path: You can drill down to Department.
Employee Distribution by Tenure and Region
This report provides a snapshot of the company’s employee distribution by employee tenure and geographical region.
Usage scenarios
This report helps you see workforce distribution across employee tenure and geographical region.
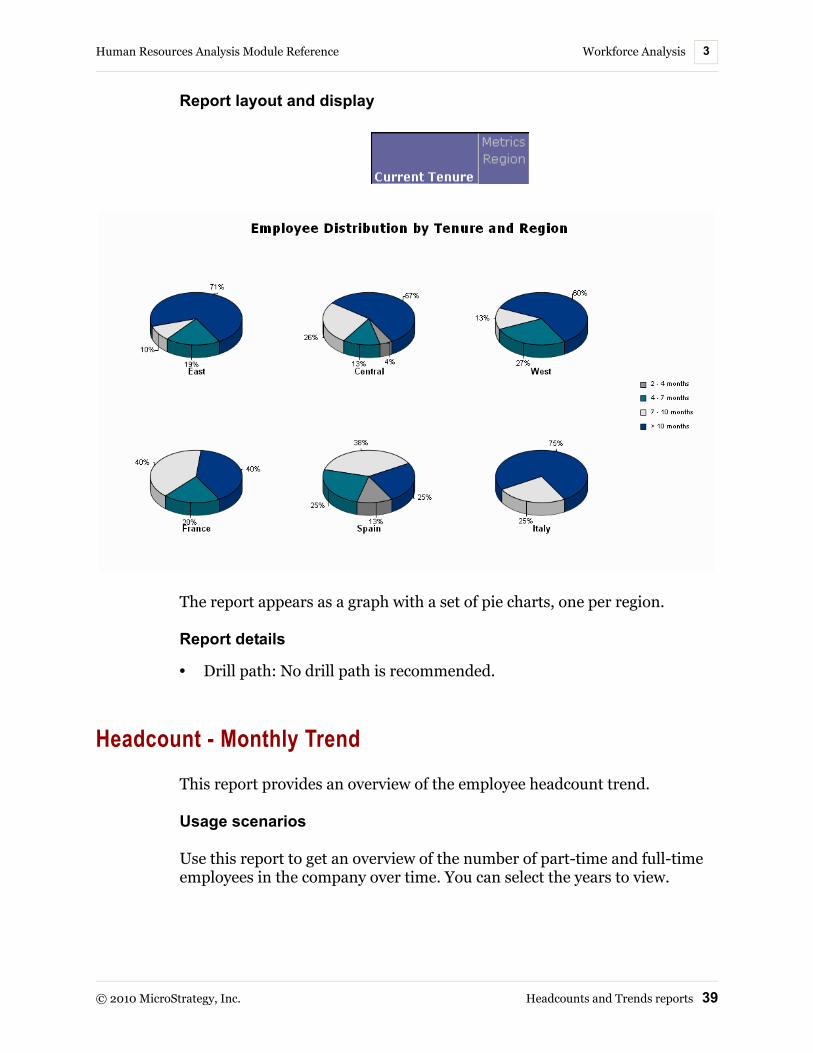
Human Resources Analysis Module Reference Workforce Analysis 3
© 2010 MicroStrategy, Inc. Headcounts and Trends reports 39
Report layout and display
The report appears as a graph with a set of pie charts, one per region.
Report details
• Drill path: No drill path is recommended.
Headcount - Monthly Trend
This report provides an overview of the employee headcount trend.
Usage scenarios
Use this report to get an overview of the number of part-time and full-time employees in the company over time. You can select the years to view.

Workforce Analysis Human Resources Analysis Module Reference3
40 Headcounts and Trends reports © 2010 MicroStrategy, Inc.
Report layout and display
The report appears as a graph with stacked vertical bars, and with Totals on.
Report details
• Qualification: You are prompted to select a year to analyze.
• Drill path: No drill path is recommended.
Region Distribution - Yearly Trend
This simple report helps you see workforce distribution trends for full- and part-time employees across geographic regions.
Usage scenarios
Use this report to see trends in how your company workforce is distributed across geographic regions. This report distinguishes between full-time and part-time employees. You can select the years to view.

Human Resources Analysis Module Reference Workforce Analysis 3
© 2010 MicroStrategy, Inc. Headcounts and Trends reports 41
Report layout and display
The report appears as a grid.
Report details
• Qualification: You are prompted to select one or more years to analyze.
• Drill path: No drill path is recommended.
Workforce Tenure - Monthly Trend
This cross-tabbed report provides information on the length of service of employees and aging of the staff across months.
Usage scenarios
This report can be used to gain insight into how the organization’s employee base is distributed by tenure and time. It can also be the starting point of an attrition/retention analysis.

Workforce Analysis Human Resources Analysis Module Reference3
42 Contractor reports © 2010 MicroStrategy, Inc.
Report layout and display
The report appears as a graph with vertical bars.
Report details
• Qualification: You are prompted to select a year to analyze.
• Drill path: No drill path is recommended.
Contractor reportsThe Headcounts and Trends area contains a Contractors subsection, which includes the following reports:
• Contract Expiration Alert
• Contractor Cost Analysis
• Contractors by Region and Division

Human Resources Analysis Module Reference Workforce Analysis 3
© 2010 MicroStrategy, Inc. Contractor reports 43
Contract Expiration Alert
This report helps monitor the expiration of contractors' assignments.
Usage scenarios
Managers can be alerted when the contract expiration date approaches. They can then take immediate action to have the contract renewed, or they can take other appropriate actions.
Report layout and display
The report appears as a grid.
Report details
• Qualification: This report is filtered by upcoming contract expirations.
• Drill path: No drill path is recommended.

Workforce Analysis Human Resources Analysis Module Reference3
44 Contractor reports © 2010 MicroStrategy, Inc.
Contractor Cost Analysis
This report helps you monitor the cost of contractors by job title, and compare contractor cost to regular employees’ compensation.
Usage scenarios
You can view annualized contractor rates and compare them to regular employees’ wages. The report can be customized by adding a filter on Contract Duration greater than a certain number of days.
Report layout and display
The report appears as a grid.
The Annualized Employee Equivalents column includes a threshold that highlights data when values are greater than 3. These values appear in red.
Report details
• Qualifications: The report includes a static filter on the year and a static filter on Avg Annualized Contract Cost per Contractor greater than 0.
• Drill path: No drill path is recommended.

Human Resources Analysis Module Reference Workforce Analysis 3
© 2010 MicroStrategy, Inc. Transfer reports 45
Contractors by Region and Division
This report provides a snapshot of the company’s contractor distribution by geographical region and company division.
Usage scenarios
This report helps you monitor the presence of contractors by department and location, and see out-of-range values or peaks.
Report layout and display
The report is displayed as a grid.
Report details
• Drill path: You can drill down to contractor departments, locations, or names.
Transfer reportsThe Headcounts and Trends area contains a second subsection called Transfers, which includes the following reports:
• Transfer Analysis - Monthly Trend
• Transfers to Employee Base - Monthly Trend
• Transfer Distribution by Department
• Transfer Distribution by Location
• Employee Flow by Department - Monthly Trend
• Employee Flow by Location - Monthly Trend

Workforce Analysis Human Resources Analysis Module Reference3
46 Transfer reports © 2010 MicroStrategy, Inc.
• Overall Employee Flow by Department
• Overall Employee Flow by Location
• Employee Transfer History by Department
• Employee Transfer History by Location
Transfer Analysis - Monthly Trend
This report provides a high-level overview of the number of employee position transfers, with a breakdown showing location and department transfers.
Usage scenarios
Use this report to see trends over time in employee transfers, and the number of transfers between company departments and locations. You can select the year to analyze.
Report layout and display
This report appears as a grid, with Totals on.
Report details
• Qualification: You are prompted to select one or more years to analyze.

Human Resources Analysis Module Reference Workforce Analysis 3
© 2010 MicroStrategy, Inc. Transfer reports 47
• Drill path: No drill path is recommended.
Transfers to Employee Base - Monthly Trends
This report provides a high-level overview of the number of transferred employees compared to the entire employee base.
Usage scenarios
Use this report to see monthly trends in transferred employees compared to the employee base. The report also shows percentages. You can select the years to analyze.
Report layout and display
This report appears as a bar and line graph.

Workforce Analysis Human Resources Analysis Module Reference3
48 Transfer reports © 2010 MicroStrategy, Inc.
Report details
• Qualification: You are prompted to select a year to analyze.
• Drill path: No drill path is recommended.
Transfer Distribution by Department
This report displays details on employee transfers within selected departments and time frames.
Usage scenarios
Use this report to highlight any transfer trends within departments that differ from trends shown in other departments. You can select the years to analyze.
Report layout and display
This report appears as a grid, with Totals on.
Report details
• Qualification: You are prompted to select a year to analyze.
• Drill path: No drill path is recommended.

Human Resources Analysis Module Reference Workforce Analysis 3
© 2010 MicroStrategy, Inc. Transfer reports 49
Transfer Distribution by Location
This report displays details on employee transfers within selected company locations and time frames.
Usage scenarios
Use this report to highlight any transfer trends within company locations that differ from trends shown in other locations. You can select the years to analyze.
Report layout and display
This report appears as a grid, with Totals on.
Report details
• Qualification: You are prompted to select a year to analyze.
• Drill path: No drill path is recommended.
Employee Flow by Department - Monthly Trend
This report displays details on employee transfers within a selected department and time frame.
Usage scenarios
Use this report to analyze variations and patterns in staffing over time, within a company department. You can select the year and the department to analyze.

Workforce Analysis Human Resources Analysis Module Reference3
50 Transfer reports © 2010 MicroStrategy, Inc.
Report layout and display
This report appears as a grid, with Totals on.
Report details
• Qualification: You are prompted to select a year and a department to analyze.
• Drill path: No drill path is recommended.
Employee Flow by Location - Monthly Trend
This report displays details on employee transfers within a selected company location and time frame.
Usage scenarios
Use this report to analyze variations and patterns in staffing over time, within a company location. You can select the year and the location to analyze.

Human Resources Analysis Module Reference Workforce Analysis 3
© 2010 MicroStrategy, Inc. Transfer reports 51
Report layout and display
This report appears as a grid, with Totals on.
Report details
• Qualification: You are prompted to select a year and a location to analyze.
• Drill path: No drill path is recommended.
Overall Employee Flow by Department
This report displays cumulative data on employee counts and employee transfers by department.
Usage scenarios
Use this report to see all employee hiring, departure, and transfer information for a department. The report reflects all stored data up to the most recent data collection.

Workforce Analysis Human Resources Analysis Module Reference3
52 Transfer reports © 2010 MicroStrategy, Inc.
Report layout and display
This report appears as a grid, with Totals on.
Report details
• Drill path: No drill path is recommended.
Overall Employee Flow by Location
This report displays cumulative data on employee counts and employee transfers by company location.
Usage scenarios
Use this report to see all employee hiring, departure, and transfer information for a location. The report reflects all stored data up to the most recent data collection.

Human Resources Analysis Module Reference Workforce Analysis 3
© 2010 MicroStrategy, Inc. Transfer reports 53
Report layout and display
This report appears as a grid, with Totals on.
Report details
• Drill path: No drill path is recommended.
Employee Transfer History by Department
This report displays the history of individual employee transfers across departments.
Usage scenarios
Use this report to identify employees with a large number of transfers between departments. You can customize the information by viewing transfers within a specific time frame.

Workforce Analysis Human Resources Analysis Module Reference3
54 Transfer reports © 2010 MicroStrategy, Inc.
Report layout and display
This report appears as a grid.
Report details
• Qualification: This report contains a static filter on Department Transfer.
• Drill path: No drill path is recommended.
Employee Transfer History by Location
This report displays the history of individual employee transfers across company locations.
Usage scenarios
Use this report to identify employees with a large number of transfers between locations. You can customize the information by viewing transfers within a specific time frame.

Human Resources Analysis Module Reference Workforce Analysis 3
© 2010 MicroStrategy, Inc. Employee Profile Analysis reports 55
Report layout and display
This report appears as a grid.
Report details
• Qualification: This report contains a static filter on Location Transfer.
• Drill path: No drill path is recommended.
Employee Profile Analysis reportsThe Employee Profile Analysis area includes the following reports:
• Employee Profile by Department - Monthly Trend
• Employee Profile by Region - Monthly Trend
• Employee Profile by Tenure
• Employee Profile Distribution
• Employee Birthday Alert
• Employee Anniversary Alert
Employee Profile by Department - Monthly Trend
This report shows employee profile distribution by company department, monthly.

Workforce Analysis Human Resources Analysis Module Reference3
56 Employee Profile Analysis reports © 2010 MicroStrategy, Inc.
Usage scenarios
This report can be useful to monitor specific employee profiles like gender, or categories like minority groups, in the context of company departments.
Report layout and display
The report is displayed as a grid, with Totals on.
Report details
• Qualifications:
You are prompted to select a time frame to analyze.
You are prompted to select a demographic profile to analyze, such as employee age range, degree type, education, ethnicity, gender, marital status, or nationality.
• Drill path: Drill to other Employee attributes.
Employee Profile by Region - Monthly Trend
This report shows the monthly employee profile distribution by geographical region.
Usage scenarios
Use this report to monitor specific employee profiles like gender, or categories like minority groups, in the context of geographical region.

Human Resources Analysis Module Reference Workforce Analysis 3
© 2010 MicroStrategy, Inc. Employee Profile Analysis reports 57
Report layout and display
The report is displayed as a grid, with Totals on.
Report details
• Qualifications:
You are prompted to select a time frame to analyze.
You are prompted to select a demographic profile to analyze, such as employee age range, degree type, education, ethnicity, gender, marital status, or nationality.
• Drill path: You can drill to other Employee attributes.
Employee Profile by Tenure
This report provides a snapshot of the current relationship between employee tenure and employee profile.
Usage scenarios
This report helps you see the relationships between employee tenure and employee profiles.

Workforce Analysis Human Resources Analysis Module Reference3
58 Employee Profile Analysis reports © 2010 MicroStrategy, Inc.
Report layout and display
The report is displayed as a grid.
Report details
• Qualification: You are prompted to select an employee profile to analyze, such as employee age range, degree type, education, ethnicity, gender, marital status, or nationality.
• Drill path: You can drill to other Employee attributes.
Employee Profile Distribution
This report provides a snapshot of the current distribution among most frequently analyzed employee profiles.
Usage scenarios
This report helps you see workforce distribution across employee tenure and employee profile.
Report layout and display

Human Resources Analysis Module Reference Workforce Analysis 3
© 2010 MicroStrategy, Inc. Employee Profile Analysis reports 59
The report is displayed as a 3-D pyramid graph.
Report details
• Qualification: You are prompted to select an employee profile to analyze, such as employee age range, degree type, education, ethnicity, gender, marital status, or nationality.
• Drill path: No drill path is recommended.
Employee Birthday Alert
This simple report reminds colleagues of employee birth dates.
Usage scenarios
This report should run on a periodic basis (on the first day of each month, for example) and could be distributed though a MicroStrategy Narrowcast Server integration.

Workforce Analysis Human Resources Analysis Module Reference3
60 Employee Profile Analysis reports © 2010 MicroStrategy, Inc.
Report layout and display
The report is displayed as a grid.
Report details
• Qualification: This report includes a filter on Upcoming Birthdays and Employee Current Status Active.
• Drill path: No drill path is recommended.
Employee Anniversary Alert
This simple report reminds human resources managers, supervisors, and/or colleagues of employee anniversary dates.
Usage scenarios
This report should run on a periodic basis (monthly, for example). It could also be triggered a few days before the anniversary date if it is distributed to supervisors and HR managers. This report can be distributed though a MicroStrategy Narrowcast Server integration.
Report layout and display

Human Resources Analysis Module Reference Workforce Analysis 3
© 2010 MicroStrategy, Inc. Employee Profile Analysis reports 61
The report is displayed as a grid.
Report details
• Qualification: This report includes a filter on Upcoming Anniversaries and Employee Current Status Active.
• Drill path: No drill path is recommended.

Workforce Analysis Human Resources Analysis Module Reference3
62 Employee Profile Analysis reports © 2010 MicroStrategy, Inc.

© 2010 MicroStrategy, Inc. Compensation analysis area 63
44.COMPENSATION ANALYSIS
Introduction
This chapter provides reference information for the Compensation analysis area reports that come with the Human Resource Analysis Module (HRAM). It presents detailed information on each report in this analysis area, including usage scenarios, screen shots, and reporting details. The reports are available in the HRAM Reports folder, see Accessing reports, page 8.
For information on the attributes, metrics, prompts, consolidations, and filters included in the reports, see Appendix A, Definitions for Objects on Reports: Object Glossaries.
Compensation analysis areaThis area provides targeted analysis of employee compensation costs. The reports in this area enable organizations to monitor trends, to be alerted to significant deviations from industry standards, and to align employee compensations costs to individual performance.

Compensation Analysis Human Resources Analysis Module Reference4
64 Compensation analysis area © 2010 MicroStrategy, Inc.
The Compensation analysis area also contains two subsections, Overtime analysis and Planning analysis. Overtime analysis tracks and analyzes employee working hours. Planning analysis compares estimated compensation costs and employee headcounts with actual values.
The Compensation analysis area includes the following reports:
• Compensation Distribution by Division
• Compensation Distribution by Region
• Compensation Items - Yearly Trend
• Salary and Bonus Distribution by Department
• Salary and Bonus Distribution by Location
• Salary by Employee Level
• Alert - Individual Salaries Above Industry Range
• Alert - Individual Salaries Below Industry Range
• Compensation Distribution by Employee Profile - Yearly Trend
• Average Paid Salary to Industry Mode - Yearly Trend
• Top Performers' Salary to Industry Mode
The Overtime analysis subsection contains the following reports:
• Overtime Analysis - Monthly Trend
• Overtime Cost Analysis
• Overtime Cost - Monthly Trend
• Jobs with Highest Overtime
The Planning analysis subsection contains the following reports:
• Planned to Actual Difference and Variance - Quarterly Trend
• Planned Headcount and Compensation to Actual - Quarterly Trend
• Planned Headcount and Compensation by Department
• Planned Headcount and Compensation by Region

Human Resources Analysis Module Reference Compensation Analysis 4
© 2010 MicroStrategy, Inc. Compensation reports 65
Compensation reports
Compensation Distribution by Division
This report analyzes salary distribution at various levels.
Usage scenarios
Use this report to see how different divisions distribute individual compensation items such as base salary and regular bonus. You can select the year to view.
Report layout and display
The report is displayed as a grid, with Totals on.
Report details
• Qualification: You are prompted to select a year to analyze.

Compensation Analysis Human Resources Analysis Module Reference4
66 Compensation reports © 2010 MicroStrategy, Inc.
• Drill path: You can drill down to Department and Employee.
Compensation Distribution by Region
This report analyzes salary distribution at various levels.
Usage scenarios
Use this report to see how individual compensation items like base salary and regular bonus are distributed by geographical region. You can select the year to view.
Report layout and display
The report is displayed as a grid, with Totals on.
Report details
• Qualification: You are prompted to select a year to analyze.
• Drill path: You can drill down to Location and Employee.

Human Resources Analysis Module Reference Compensation Analysis 4
© 2010 MicroStrategy, Inc. Compensation reports 67
Compensation Items - Yearly Trend
This report shows trends in the company’s overall compensation cost, as well as the average compensation by employee.
Usage scenarios
This report can be helpful when you project next year's compensation expenses.
Report layout and display
The report is displayed as a grid, with Subtotals on.
Report details
• Drill path: No drill path is recommended.
• Attributes: Avg. Compensation Cost is the Compensation Cost / Number of Employees.
Salary and Bonus Distribution by Department
This report displays the paid salary and bonus for employees across different departments of the organization.

Compensation Analysis Human Resources Analysis Module Reference4
68 Compensation reports © 2010 MicroStrategy, Inc.
Usage scenarios
Use this report to compare paid salary and paid bonuses for employees across different departments of the organization. You can select the year to view.
Report layout and display
The report is displayed as a horizontal bar graph.
Report details
• Qualification: You are prompted to select a year to analyze.
• Drill path: You can drill down to Employee.
• Metrics: Paid Salary and Paid Bonus are conditional metrics built off Compensation Cost.

Human Resources Analysis Module Reference Compensation Analysis 4
© 2010 MicroStrategy, Inc. Compensation reports 69
Salary and Bonus Distribution by Location
This report displays the paid salary and bonuses for employees across the different locations of the organization.
Usage scenarios
Use this report to compare paid salary and paid bonuses for employees across different locations of the organization. You can select the year to view.
Report layout and display
The report is displayed as a horizontal bar graph.
Report details
• Qualification: You are prompted to select a year to analyze.
• Drill path: You can drill down to Employee.
• Metrics: Paid Salary and Paid Bonus are conditional metrics built off Compensation Cost.

Compensation Analysis Human Resources Analysis Module Reference4
70 Compensation reports © 2010 MicroStrategy, Inc.
Salary by Employee Level
This report compares the average salary, the most common salary, and the median salary across employee level and company department, and compares them to the industry mode and range.
Usage scenarios
This report can be run before the employee's performance review or before performing a salary adjustment.
Report layout and display
The report is displayed as a grid.
Report details
• Qualifications:
You are prompted to select a year to analyze.
The report includes a static filter on the year and an optional static filter on Employee's Current Status = Active.
• Drill path: You can drill to Employee.

Human Resources Analysis Module Reference Compensation Analysis 4
© 2010 MicroStrategy, Inc. Compensation reports 71
Alert - Individual Salaries above Industry Range
This report lists any employees whose salary is greater than the industry maximum for the employee’s level.
Usage scenarios
This report can be run before performing a salary adjustment, and you can select the year to view.
Report layout and display
The report appears as a grid.
You can include thresholds in the Industry Max Salary - Salary column to highlight values above or below a selected number.
Report details
• Qualification:
You are prompted to select a year to analyze.
The report displays those employees with Employee Current Status Active, Maximum Salary - Salary < 0.
• Drill path: No drill path is recommended.
Alert - Individual Salaries below Industry Range
This report lists employees whose salary is lower than the industry minimum for the employee’s level.

Compensation Analysis Human Resources Analysis Module Reference4
72 Compensation reports © 2010 MicroStrategy, Inc.
Usage scenarios
This report can be run before performing a salary adjustment. You can select the year to view.
Report layout and display
The report is displayed as a grid.
You can include thresholds in the Salary - Industry Min. Salary column to highlight values above or below a selected number.
Report details
• Qualification:
You are prompted to select a year.
The report displays employees with Employee Current Status Active, Salary - Minimum Salary < 0.
• Drill path: No drill path is recommended.
Compensation Distribution by Employee Profile - Yearly Trend
This report compares the distribution of compensation costs across years, based on employee profile.
Usage scenarios
This report helps you identify the employee profiles that are responsible for the largest compensations. You can also add the metric Average Compensation Cost per Employee.

Human Resources Analysis Module Reference Compensation Analysis 4
© 2010 MicroStrategy, Inc. Compensation reports 73
Report layout and display
The report appears as a grid, with Totals on.
Report details
• Qualifications:
You are prompted to select a year to analyze.
You are prompted to select an employee profile to analyze, such as age range, degree type, education, ethnicity, gender, marital status, or nationality.
• Drill path: You can drill to other Employee attributes.
Average Paid Salary to Industry Mode - Yearly Trend
This report compares the average salary per employee, based on employee level, with published industry standard salaries across years.
Usage scenarios
Use this report to identify trends that may increase the gap between actual paid salaries and industry standards.

Compensation Analysis Human Resources Analysis Module Reference4
74 Compensation reports © 2010 MicroStrategy, Inc.
Report layout and display
The report appears as a grid.
You can include thresholds in the Salary to Industry Mode Variance column to highlight values above or below a selected percentage.
Report details
Drill path: No drill path is recommended.
Top Performers' Salary to Industry Mode
This report compares the average salary of top performing employees to industry standard salaries.
Usage scenarios
You can use this report to trigger actions that prevent top performing employees from leaving the company for salary reasons.

Human Resources Analysis Module Reference Compensation Analysis 4
© 2010 MicroStrategy, Inc. Overtime reports 75
Report layout and display
The report appears as a grid.
You can include thresholds in the Salary to Industry Mode Variance column to highlight values above or below a selected percentage.
Report details
• Qualification:
You are prompted to select a year to analyze.
The report includes a filter on Performance Score between 4 and 5.
• Drill path: No drill path is recommended.
Overtime reportsOvertime analysis tracks and analyzes employee working hours.
The Overtime analysis subsection contains the following reports:
• Overtime Analysis - Monthly Trend
• Overtime Cost Analysis
• Overtime Cost - Monthly Trend
• Jobs with Highest Overtime

Compensation Analysis Human Resources Analysis Module Reference4
76 Overtime reports © 2010 MicroStrategy, Inc.
Overtime Analysis - Monthly Trend
This report shows the number of hours of overtime worked, by month. It also shows how those hours are distributed among the non-exempt workforce.
Usage scenarios
Use this report to see an overview of overtime hours worked, such as the average number of overtime hours per employee, and to determine trends across time.

Human Resources Analysis Module Reference Compensation Analysis 4
© 2010 MicroStrategy, Inc. Overtime reports 77
Report layout and display
This report appears as a line and bar graph.
Report details
• Drill path: No drill path is recommended.
Overtime Cost Analysis
This report displays the cost of overtime based on an employee’s monthly salary.
Usage scenarios
Use this report to identify the employees who are earning overtime and what percentage of their monthly salary the overtime pay reflects. You select the months to analyze.

Compensation Analysis Human Resources Analysis Module Reference4
78 Overtime reports © 2010 MicroStrategy, Inc.
Report layout and display
This report appears as a grid in Outline mode.
The report displays thresholds (highlighted in red) on overtime contributions greater than 20%.
Report details
• Qualification: You are prompted to select a year to analyze.
• Drill path: No drill path is recommended.
Overtime Cost - Monthly Trend
This report displays the monthly trends for overtime hours and costs.
Usage scenarios
Use this report to see trends in the number of overtime hours worked, and the amount of paid overtime. You select the years to analyze.

Human Resources Analysis Module Reference Compensation Analysis 4
© 2010 MicroStrategy, Inc. Overtime reports 79
Report layout and display
This report appears as a bar graph.
Report details
• Qualification: You are prompted to select a year to analyze.
Jobs with Highest Overtime
This report displays the jobs with the highest number of overtime hours.
Usage scenarios
Use this report to see the job titles and the departments that have the highest overtime hours. You select the months and the number of jobs you want to analyze.

Compensation Analysis Human Resources Analysis Module Reference4
80 Planning reports © 2010 MicroStrategy, Inc.
Report layout and display
This report appears as a grid.
Report details
• Qualifications: You are prompted to select the months and the number of top job titles to analyze.
• Drill path: You can drill down to Employee to see the distribution of overtime hours.
Planning reportsPlanning analysis compares estimated compensation costs and headcounts with actual values.
The Planning analysis subsection contains the following reports:
• Planned to Actual Difference and Variance - Quarterly Trend
• Planned Headcount and Compensation to Actual - Quarterly Trend
• Planned Headcount and Compensation by Department
• Planned Headcount and Compensation by Region

Human Resources Analysis Module Reference Compensation Analysis 4
© 2010 MicroStrategy, Inc. Planning reports 81
Planned to Actual Difference and Variance - Quarterly Trend
This report compares the actual headcount numbers and employee compensation costs to the planned (target) values. The comparison is facilitated by metrics for difference and variance.
Usage scenarios
Use this report to determine trends in how closely your organization achieves targets for headcount numbers and compensation costs.
Report layout and display
This report appears as a grid.
The report displays a threshold (highlighted in red) when the data in the Compensation Variance column is less than -15 percent.
Report details
• Drill path: No drill path is recommended.
Planned Headcount and Compensation to Actual - Quarterly Trend
This graphical report lets you visually compare actual headcount numbers and employee compensation costs to planned (target) values, across quarters.
Usage scenarios
Use this report to analyze how well your organization is achieving targets for headcount numbers and compensation costs.

Compensation Analysis Human Resources Analysis Module Reference4
82 Planning reports © 2010 MicroStrategy, Inc.
Report layout and display
This report appears as a line and bar graph.
Report details
• Drill path: No drill path is recommended.
Planned Headcount and Compensation by Department
This report displays actual headcount numbers and employee compensation costs, as well as planned (target) values, by department.
Usage scenarios
Use this report to compare actual headcount numbers and employee compensation costs to your organization’s target values, with results listed by department. You choose the quarter to analyze.

Human Resources Analysis Module Reference Compensation Analysis 4
© 2010 MicroStrategy, Inc. Planning reports 83
Report layout and display
This report appears as a grid, with subtotals on.
The report displays a threshold (highlighted in red) when the data in the Compensation Variance column is less than -15 percent.
Report details
• Qualification: You are prompted to select a quarter to analyze.
• Drill path: No drill path is recommended.
Planned Headcount and Compensation by Region
This report displays the actual headcount numbers and employee compensation costs, as well as planned (target) values, by region.
Usage scenarios
Use this report to compare actual headcount numbers and employee compensation costs to your organization’s target values, with results listed by region. You choose the quarter to analyze.

Compensation Analysis Human Resources Analysis Module Reference4
84 Planning reports © 2010 MicroStrategy, Inc.
Report layout and display
This report appears as a grid, with subtotals on.
The report displays a threshold (highlighted in red) when data in the Compensation Variance column is higher than -15 percent.
Report details
• Qualification: You are prompted to select a quarter to analyze.
• Drill path: No drill path is recommended.

© 2010 MicroStrategy, Inc. Benefit analysis area 85
55.BENEFIT ANALYSIS
Introduction
This chapter provides reference information for the Benefit analysis area reports that come with the Human Resource Analysis Module (HRAM). It presents detailed information on each report in this analysis area, including usage scenarios, screen shots, and reporting details. The reports are available in the HRAM Reports folder; see Accessing reports, page 8.
For information on the attributes, metrics, and filters included in the reports, see Appendix A, Definitions for Objects on Reports: Object Glossaries.
Benefit analysis areaAnalytics in this area are designed to help you examine and improve the management of costs associated with providing non-cash benefits for employees.
The Benefit analysis area includes the following reports:

Benefit Analysis Human Resources Analysis Module Reference5
86 Benefit reports © 2010 MicroStrategy, Inc.
• Benefit Usage and Costs - Quarterly Trend
• Most Used Benefits by Number of Participants
• Benefit Usage by Employee Profile
• Time Off Overview by Department
Benefit reports
Benefit Usage and Costs - Quarterly Trend
This detailed report analyzes the trends for benefit use and costs across the organization, by time.
Usage scenarios
This report shows any changes in benefit costs over time, and can show to what degree employees make use of a particular benefit. You can select the years to view.

Human Resources Analysis Module Reference Benefit Analysis 5
© 2010 MicroStrategy, Inc. Benefit reports 87
Report layout and display
The report appears as a grid.
Report details
• Qualification: You are prompted to select a year to analyze.
• Drill path: No drill path is recommended.
• Attributes: Participation Rate is the Number of Enrolled Employees / Total Number of Employees *100.
Most Used Benefits by Number of Participants
This report identifies the most frequently used employee benefits, based on the number of participants.
Usage scenarios
This report can help you make decisions about implementing changes to company benefits. You enter the number of most used benefits to retrieve, and select the quarter to analyze.

Benefit Analysis Human Resources Analysis Module Reference5
88 Benefit reports © 2010 MicroStrategy, Inc.
Report layout and display
The report is displayed as a grid, sorted in descending order by the number of participants.
Report details
• Qualification:
You are prompted to select the number of benefits to analyze; the ranking is according to number of participants.
You are prompted to select a quarter to analyze.
• Drill path: No drill path is recommended.
• Attributes: Participation Rate is the Number of Enrolled Employees / Total Number of Employees *100.
Benefit Usage by Employee Profile
This detailed report analyzes key benefits, based on employee profile.
Usage scenarios
This report helps identify the best benefit mix for each employee profile. A typical analysis might be performed for marital status and age. You select the quarter and the employee profile to analyze.

Human Resources Analysis Module Reference Benefit Analysis 5
© 2010 MicroStrategy, Inc. Benefit reports 89
Report layout and display
The report is displayed as a grid.
Report details
• Qualifications:
You are prompted to select a quarter to analyze.
You are prompted to select an employee profile to analyze, such as age range, degree type, education, ethnicity, gender, marital status, or nationality.
• Drill path: No drill path is recommended.
• Attributes: Participation Rate is the Number of Enrolled Employees / Total Number of Employees *100.
Time Off Overview by Department
This report shows accrued and used vacation days, sick days, and other types of leave days by department.
Usage scenarios
This report is useful to view peaks in time-off use by department, and can aid in deciding when to address a drop in personnel by assigning extra resources such as contractors.

Benefit Analysis Human Resources Analysis Module Reference5
90 Benefit reports © 2010 MicroStrategy, Inc.
Report layout and display
The report is displayed as a grid, in Outline mode with totals on.
You can include thresholds that highlight data in the Available Days column when values are above or below a selected number.
Report details
• Qualification: The report displays information on those employees with Employee Current Status = Active.
• Drill path: You can drill down to Employee.

© 2010 MicroStrategy, Inc. Attrition analysis area 91
66.ATTRITION ANALYSIS
Introduction
This chapter provides reference information for the Attrition analysis area reports that come with the Human Resource Analysis Module (HRAM). It presents detailed information on each report in this analysis area, including usage scenarios, screen shots, and reporting details. The reports are available in the HRAM Reports folder; see Accessing reports, page 8.
For information on the attributes, metrics, and filters included in the reports, see Appendix A, Definitions for Objects on Reports: Object Glossaries.
Attrition analysis areaThis area provides insight on employee attrition by identifying attrition trends and profiles of employees who leave, so that an organization can pro-actively improve retention rates and minimize the loss of key talent.
The Attrition analysis area includes the following reports:

Attrition Analysis Human Resources Analysis Module Reference6
92 Attrition reports © 2010 MicroStrategy, Inc.
• Employee Attrition - Monthly Trend
• Departed Employees by Position Status - Monthly Trend
• Departures by Division - Monthly Trend
• Departures by Region - Monthly Trend
• Reasons for Departure
• Alert: Upcoming Departures
• Attrition by Recruiting Source
• Departed Employees - Department Transfer Analysis
• Departed Employees - Location Transfer Analysis
Attrition reports
Employee Attrition - Monthly Trend
This report provides an overview of the number of voluntarily departed employees and the employee attrition rate, by month.
Usage scenarios
This report can help you define certain times of the year when employees are more likely to leave the company, which can allow you to prepare for potential employee gaps. You can select the years to view.

Human Resources Analysis Module Reference Attrition Analysis 6
© 2010 MicroStrategy, Inc. Attrition reports 93
Report layout and display
The report is displayed as a grid. You can also display it as a vertical bar graph.
You can include thresholds in the Attrition Rate column to highlight values that appear above a certain percentage.
Report details
• Qualification: You are prompted to select a year to analyze.
• Drill path: No drill path is recommended.
• Attributes: Attrition Rate is the Number of Voluntary Departed Employees / Number of Employees.
Departed Employees by Position Status - Monthly Trend
This report gives an overview of the number of departed employees by month and position status.
Usage scenarios
This report helps you see the employee positions that are less fully staffed. You can select the years to view.

Attrition Analysis Human Resources Analysis Module Reference6
94 Attrition reports © 2010 MicroStrategy, Inc.
Report layout and display
The report appears as a grid, with totals.
Report details
• Qualification: You are prompted to select a year to analyze.
• Drill path: No drill path is recommended.
Departures by Division - Monthly Trend
This report provides an overview of employee turnover by division, by month, within the chosen year.
Usage scenarios
Use this report to see trends in employee turnover, based on company division and time. You can select the year to view.

Human Resources Analysis Module Reference Attrition Analysis 6
© 2010 MicroStrategy, Inc. Attrition reports 95
Report layout and display
The report appears as a grid.
Report details
• Qualification: You are prompted to select a year to analyze.
• Drill path: You can drill down to Department.
Departures by Region - Monthly Trend
This report provides an overview of employee turnover by region, by month, within the chosen year.
Usage scenarios
Use this report to see trends in employee turnover based on geographical region, over time. You can select the year to view.

Attrition Analysis Human Resources Analysis Module Reference6
96 Attrition reports © 2010 MicroStrategy, Inc.
Report layout and display
The report appears as a grid.
Report details
• Qualification: You are prompted to select a year to analyze.
• Drill path: You can drill down to Location.
Reasons for Departure
This report provides insight into the major reasons for employee departures.
Usage scenarios
Use this report to see the main reasons for employee departure. Examples include salary requirements, better career opportunities, conflicts with co-workers, personal reasons, retirement, and reduction in force. The report can be customized to display voluntarily departed employees only.

Human Resources Analysis Module Reference Attrition Analysis 6
© 2010 MicroStrategy, Inc. Attrition reports 97
Report layout and display
The report appears as a pie chart.
Report details
• Drill path: No drill path is recommended.
Alert: Upcoming Departures
This alert report tracks any upcoming employee departures.
Usage scenarios
This report can be run periodically, or can be triggered by an action or event such as the resignation of an employee. The report could then be distributed to the employee's supervisors and human resources managers though a MicroStrategy Narrowcast Server integration.

Attrition Analysis Human Resources Analysis Module Reference6
98 Attrition reports © 2010 MicroStrategy, Inc.
Report layout and display
The report appears as a grid.
Report details
• Qualification: The report includes a filter to display those employees with upcoming departures.
• Drill path: No drill path is recommended.
Attrition by Recruiting Source
This report highlights where employee attrition rate is highest, based on the recruiting source.
Usage scenarios
This report can be helpful when you assess your recruitment processes. You can select the years to analyze.
Report layout and display
The report is displayed as a grid, sorted by ascending Attrition Rate.

Human Resources Analysis Module Reference Attrition Analysis 6
© 2010 MicroStrategy, Inc. Attrition reports 99
Report details
• Qualification: You are prompted to select the years to analyze.
• Drill path: No drill path is recommended.
Departed Employees - Department Transfer Analysis
This report highlights any relationship between department transfers and employee departures.
Usage scenarios
This report can help you see the possible relationship between department transfers of employees and employee departures from the company. You can customize this report to show only those employees who have had more than one transfer, for example.
Report layout and display
The report is displayed as a grid.
Report details
• Qualification: This report is filtered on Departed Employees and Department Transfer.
• Drill path: No drill path is recommended.
Departed Employees - Location Transfer Analysis
This report highlights any relationship between location transfers and employee departures.

Attrition Analysis Human Resources Analysis Module Reference6
100 Attrition reports © 2010 MicroStrategy, Inc.
Usage scenarios
This report can help you see the possible relationship between location transfers of employees and employee departures from the company. You can customize this report to show only those employees who have had more than one transfer, for example.
Report layout and display
The report is displayed as a grid.
Report details
• Qualification: This report is filtered on Departed Employees and Location Transfer.
• Drill path: No drill path is recommended.

© 2010 MicroStrategy, Inc. Recruitment analysis area 101
77.RECRUITMENT ANALYSIS
Introduction
This chapter provides reference information for the Recruitment analysis area reports that come with the Human Resources Analysis Module (HRAM). It presents detailed information on each report in this analysis area, including usage scenarios, screen shots, and reporting details. The reports are available in the HRAM Reports folder; see Accessing reports, page 8.
For information on the attributes, metrics, and filters included in the reports, see Appendix A, Definitions for Objects on Reports: Object Glossaries.
Recruitment analysis areaThis analysis area is designed to optimize the recruitment process by identifying hiring trends, profiles, and organization needs.

Recruitment Analysis Human Resources Analysis Module Reference7
102 Recruitment reports © 2010 MicroStrategy, Inc.
The Recruitment analysis area is broken down into two sections which include the main set of Recruitment reports, and a subsection called Hiring Process. The reports included in the main set of Recruitment reports are
• Hiring Rate - Monthly Trend
• New Hires by Division - Monthly Trend
• New Hires by Region - Monthly Trend
• New Hire by Position Status - Monthly Trend
• Recent Hires
• Hires by Recruiting Source
The Hiring Process subsection includes the following reports:
• Vacant Positions
• Recruiting Pipeline
• Position Open Days
• Positions Opened and Closed through Transfers
Recruitment reports
Hiring Rate - Monthly Trend
This report provides an overview of the number of new employees by month, and the monthly hiring rate.
Usage scenarios
This report helps you see hiring trends over time. You can select the years to view.

Human Resources Analysis Module Reference Recruitment Analysis 7
© 2010 MicroStrategy, Inc. Recruitment reports 103
Report layout and display
The report is displayed as a grid. You can also display it as a vertical bar graph to see trends graphically.
You can include a threshold in the Hiring Rate column to highlight values that appear above a selected percentage.
Report details
• Qualification: You are prompted to select a year to analyze.
• Drill path: No drill path is recommended.
• Attributes: Hiring Rate is the Number of New Employees with Tenure = 1 month / Total Number of Employees.
New Hires by Division - Monthly Trend
This report provides an overview of the new hires by company division.
Usage scenarios
This report helps you see trends in hiring by division, over time. You can select the year to view.

Recruitment Analysis Human Resources Analysis Module Reference7
104 Recruitment reports © 2010 MicroStrategy, Inc.
Report layout and display
The report appears as a grid.
Report details
• Qualification: You are prompted to select a year to analyze.
• Drill path: You can drill down to Department.
New Hires by Region - Monthly Trend
This report provides an overview of the new hires by geographical region.
Usage scenarios
This report helps you see trends in hiring by geographical region, over time. You can select the year to view.

Human Resources Analysis Module Reference Recruitment Analysis 7
© 2010 MicroStrategy, Inc. Recruitment reports 105
Report layout and display
The report appears as a grid.
Report details
• Qualification: You are prompted to select a year to analyze.
• Drill path: You can drill down to Location.
New Hires by Position Status - Monthly Trend
This report provides an overview of the new hires by position status and month of hire.
Usage scenarios
This report helps you see the number of full-time and part-time new hires over time. You can select the years to view.

Recruitment Analysis Human Resources Analysis Module Reference7
106 Recruitment reports © 2010 MicroStrategy, Inc.
Report layout and display
The report appears as a grid, with Totals on.
Report details
• Qualification: You are prompted to select a year to analyze.
• Drill path: You can drill to Location or Department.
Recent Hires
This report distributes information about new hires to the employees’ supervisors and to human resources managers.
Usage scenarios
You can select the beginning of the time period, with the end of the period being today's date. Alternatively, this report can be run periodically or can be triggered by an action or event, such as the hiring of a new employee.

Human Resources Analysis Module Reference Recruitment Analysis 7
© 2010 MicroStrategy, Inc. Recruitment reports 107
The report could then be distributed to each employee's supervisor and human resources managers though a MicroStrategy Narrowcast Server integration.
Report layout and display
The report appears as a grid.
Report details
• Qualification:
The report includes a static filter on Recent Hires.
You are prompted to select a date as the beginning of the period to analyze.
• Drill path: No drill path is recommended.
Hires by Recruiting Sources
This report shows all recruiting sources, with the number of employees hired through that source.
Usage scenarios
This report displays the recruiting sources of employees, such as by advertisement, internal referral, headhunter, and so on.

Recruitment Analysis Human Resources Analysis Module Reference7
108 Hiring Process reports © 2010 MicroStrategy, Inc.
Report layout and display
The report appears as a pie chart.
Report details
• Drill path: No drill path is recommended.
Hiring Process reports
Vacant Positions
This report lists open positions by position characteristics.
Usage scenarios
This report is intended to be used together with the following Recruiting Pipeline report. You can select the job characteristic, such as Department, Location, Security Clearance, or Number of Years of Experience at run time.

Human Resources Analysis Module Reference Recruitment Analysis 7
© 2010 MicroStrategy, Inc. Hiring Process reports 109
This analysis can also be run for time comparisons, such as this month/this year compared to this month/last year, for example.
Report layout and display
The report appears as a grid.
Report details
• Qualifications:
The Job Close Date is null.
You are prompted to select a job characteristic to analyze.
• Drill path: No drill path is recommended.
Recruiting Pipeline
This report monitors how the recruitment process is proceeding.
Usage scenarios
You can select the time of analysis and view the results by position.
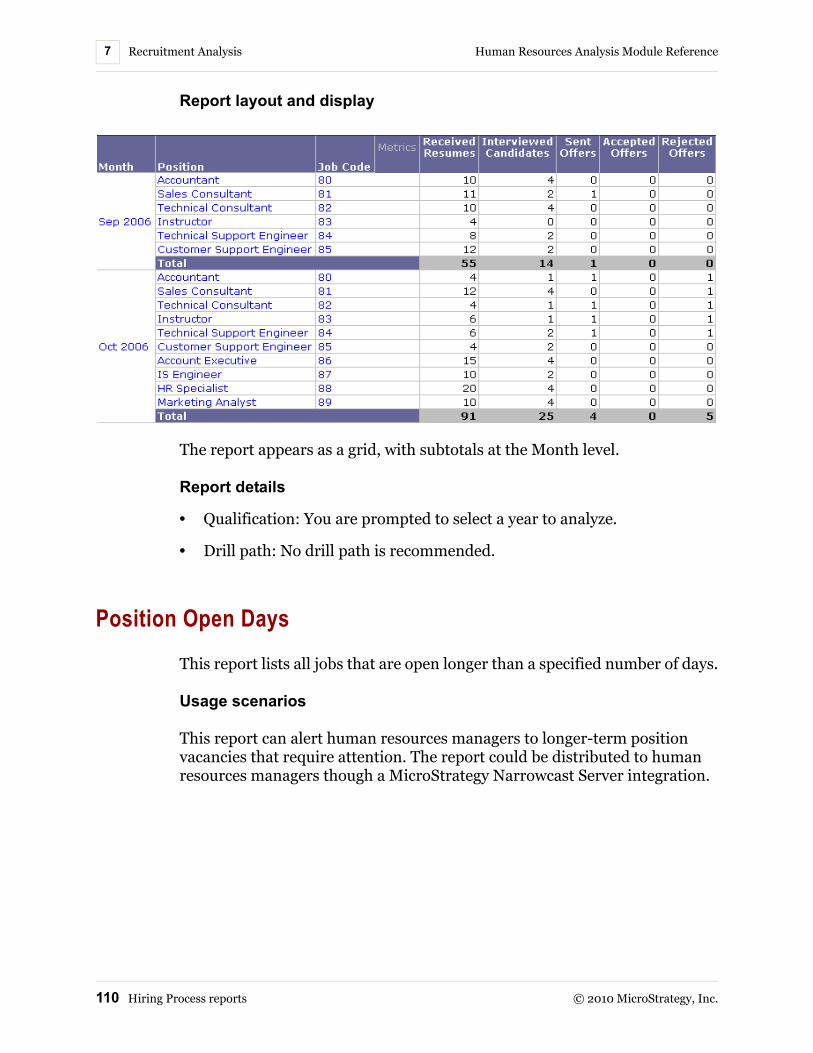
Recruitment Analysis Human Resources Analysis Module Reference7
110 Hiring Process reports © 2010 MicroStrategy, Inc.
Report layout and display
The report appears as a grid, with subtotals at the Month level.
Report details
• Qualification: You are prompted to select a year to analyze.
• Drill path: No drill path is recommended.
Position Open Days
This report lists all jobs that are open longer than a specified number of days.
Usage scenarios
This report can alert human resources managers to longer-term position vacancies that require attention. The report could be distributed to human resources managers though a MicroStrategy Narrowcast Server integration.

Human Resources Analysis Module Reference Recruitment Analysis 7
© 2010 MicroStrategy, Inc. Hiring Process reports 111
Report layout and display
The report appears as a grid.
Report details
• Qualification: This report contains a filter on Job Close Date, not null.
• Drill path: No drill path is recommended.
Positions Opened and Closed Through Transfers
This report lists all jobs that are opened or closed due to an internal transfer.
Usage scenarios
This report can be used to determine how many vacancies are created due to employee transfers, and how many positions are closed due to transfers.
Report layout and display
The report appears as a grid.
Report details
• Qualification: This report contains a filter on Job Open Reason = Backfill from Transfer or Job Close Reason = Transfer.

Recruitment Analysis Human Resources Analysis Module Reference7
112 Hiring Process reports © 2010 MicroStrategy, Inc.
• Drill path: No drill path is recommended.

© 2010 MicroStrategy, Inc. 113
88.WORKFORCE DEVELOPMENT AND PRODUCTIVITY ANALYSIS
Introduction
This chapter provides reference information for the Workforce Development and Productivity analysis area reports that come with the Human Resources Analysis Module (HRAM). It presents detailed information on each report in this analysis area, including usage scenarios, screen shots, and reporting details. The reports are available in the HRAM Reports folder; see Accessing reports, page 8.
For information on the attributes, metrics, and filters included in the reports, see Appendix A, Definitions for Objects on Reports: Object Glossaries.

Workforce Development and Productivity Analysis Human Resources Analysis Module Reference8
114 Workforce Development and Productivity analysis area © 2010 MicroStrategy, Inc.
Workforce Development and Productivity analysis area
This analysis area includes the following subsections:
• Employee Qualification: This subsection identifies employees by their qualified skills, and enables organizations to quickly align required project skills with employee qualifications.
• Employee Performance: This subsection provides analysis of individual employee performance in relation to meeting individual and corporate goals. These reports enable organizations to align salary increases and bonus payments with targeted goals.
• Employee Satisfaction: This subsection allows organizations to analyze the results of corporate surveys on employee satisfaction.
The Workforce Development and Productivity analysis area reports are subdivided into the same subsections as those listed previously.
• The Employee Qualifications subsection includes the following reports:
Employee Qualification by Division and Region
Employees by Qualification Type
Qualifications by Department and Location
• The Employee Performance subsection includes the following reports:
Performance Appraisal
Performance by Department - Yearly Trend
Low Performing Employee Salaries to Industry Mode Comparison
• The Employee Satisfaction subsection includes the following reports:
Employee Satisfaction - Survey Results
Employee Satisfaction - Yearly Trend

Human Resources Analysis Module Reference Workforce Development and Productivity Analysis 8
© 2010 MicroStrategy, Inc. Employee Qualification reports 115
Employee Qualification reports
Employee Qualification by Division and Region
This report provides information on the regional and divisional distribution of employee job qualifications.
Usage scenarios
You are prompted to select a division and region. Once the report is displayed, you can use the page-by option for Division and Region to view the job qualifications obtained by employees in other divisions or regions.
Report layout and display
The report appears as a grid, with a page-by option for Division and Region.
Report details
• Qualification: You can place a filter on Currently Active Employees to count only those employees who are currently active.
• Drill path: You can drill across to Employee details, such as name, ID, or title.
Employees by Qualification Type
This matrix report provides a list of employees who possess specific job qualifications.

Workforce Development and Productivity Analysis Human Resources Analysis Module Reference8
116 Employee Qualification reports © 2010 MicroStrategy, Inc.
Usage scenarios
You can use this report to view a list of employees with specified qualifications and skills. You can select the qualification type at run time.

Human Resources Analysis Module Reference Workforce Development and Productivity Analysis 8
© 2010 MicroStrategy, Inc. Employee Qualification reports 117
Report layout and display
The report appears as a grid.
Report details
• Qualification: You are prompted to select a qualification type to analyze.
• Drill path: No drill path is recommended.
Qualifications by Department and Location
This report provides a list of qualified employees for a specific company department and location.
Usage scenarios
You are prompted to select a department and location. Once the report is displayed, you can use the page-by option for Department and Location to view the job qualifications obtained by employees in other departments or locations.

Workforce Development and Productivity Analysis Human Resources Analysis Module Reference8
118 Employee Performance reports © 2010 MicroStrategy, Inc.
Report layout and display
The report appears as a grid, with a page-by option for Department and Location.
Report details
• Qualification: You are prompted to select a department and location to analyze.
• Drill path: No drill path is recommended.
Employee Performance reports
Employee Performance Appraisal
This report provides information on employee performance over a specified period.
Usage scenarios
This report can be run based on a company’s review cycles. By selecting the year, managers can view each employee's compensation and performance, and make decisions on potential career or salary enhancements. This report can also be useful to fine tune compensations or allocate bonuses.
This report can also be used as an alert, with the company review cycle triggered by the employee hire date. The report can then be distributed to the employee's supervisors and human resources managers though a MicroStrategy Narrowcast Server integration.

Human Resources Analysis Module Reference Workforce Development and Productivity Analysis 8
© 2010 MicroStrategy, Inc. Employee Performance reports 119
Report layout and display
The report appears as a grid, with a page-by option for Supervisor.
Report details
• Qualifications:
You are prompted to select a year to analyze.
The report contains a filter on Active Employees.
• Drill path: No drill path is recommended.
• Attributes: Performance Score can be a placeholder for any important company metric, such as the number of cases resolved per day per tech support call, or the number of billable hours per consultant per quarter, and so on.
Performance by Department - Yearly Trend
This report provides information on the performance trend of company departments, based on individual employee performance.
Usage scenarios
This report can provide information on overall department performance. You can select the years to view.

Workforce Development and Productivity Analysis Human Resources Analysis Module Reference8
120 Employee Performance reports © 2010 MicroStrategy, Inc.
Report layout and display
The report appears as a grid, with banding.
Report details
• Qualification: You are prompted to select a year to analyze. By default, all years are selected.
• Drill path: You can drill down to Employee, to identify positive or negative trends.
Low Performing Employee Salaries to Industry Mode Comparison
This report provides information on low performing employees and how their salaries compare to the industry mode (industry standard).
Usage scenarios
Use this report to gather information on how the salaries of low performing employees compare to industry standard salaries, and see highlighted data for any salary-to-industry ratio that exceeds 100 percent. You can select the year to view.

Human Resources Analysis Module Reference Workforce Development and Productivity Analysis 8
© 2010 MicroStrategy, Inc. Employee Satisfaction reports 121
Report layout and display
The report appears as a grid.
You can include thresholds in the Salary Ratio to Industry Mode column to highlight values that are greater than or equal to 100 percent.
Report details
• Qualifications:
You are prompted to select a year to analyze.
The report includes a filter on Performance Score less than or equal to 2, and on Active Employees.
• Drill path: You can drill to Employee Department.
Employee Satisfaction reports
Employee Satisfaction - Survey Results
This report provides information on employee satisfaction levels by department.
Usage scenarios
This report is useful to identify areas of improvement for the company. The results can be gathered yearly through an anonymous survey. You can select the year to view.

Workforce Development and Productivity Analysis Human Resources Analysis Module Reference8
122 Employee Satisfaction reports © 2010 MicroStrategy, Inc.
Report layout and display
The report appears as a grid, with Totals and Averages on.
You can include a threshold in the Average Satisfaction Score column to highlight values that are above or below a selected number.
Report details
• Qualification: You are prompted to select a year to analyze.
• Drill path: No drill path is recommended.
Employee Satisfaction - Yearly Trend
This report provides information on employee satisfaction trends over time.
Usage scenarios
This report is useful to monitor whether the overall employee satisfaction level is improving or not for the whole company. The results can be gathered yearly though an anonymous survey.

Human Resources Analysis Module Reference Workforce Development and Productivity Analysis 8
© 2010 MicroStrategy, Inc. Employee Satisfaction reports 123
Report layout and display
The report appears as a graph with vertical bars.
Report details
• Drill path: No drill path is recommended.

Workforce Development and Productivity Analysis Human Resources Analysis Module Reference8
124 Employee Satisfaction reports © 2010 MicroStrategy, Inc.

© 2010 MicroStrategy, Inc. Metrics glossary 125
AA.DEFINITIONS FOR OBJECTS ON REPORTS: OBJECT GLOSSARIES
Introduction
This appendix presents glossaries for all the Human Resources Analysis Module (HRAM) objects used in the HRAM reports. The glossaries include descriptions, examples, and formulas for the public objects (metrics, filters, prompts, consolidations, and custom groups) that comprise HRAM.
For additional details on any object listed, see the MicroStrategy project definitions in the Public Objects folder or the Schema Objects folder. You can also find additional object definitions in Appendix B, Structure of HRAM’s Business Logic: Logical Data Model.
Metrics glossaryThe following tables list all metrics (also known as key performance indicators, or KPIs) used in HRAM.
All metrics object definitions are located in the Public Objects\Metrics folder in the MicroStrategy project. Metrics are organized into the following tables:

Definitions for Objects on Reports: Object Glossaries Human Resources Analysis Module ReferenceA
126 Metrics glossary © 2010 MicroStrategy, Inc.
• Employee glossary
• Compensation glossary
• Benefit and Time Off glossary
• Transfers glossary
• Qualifications, Performance, and Satisfaction glossary
• Position glossary
• Dates glossary
Employee metrics
The following metrics are used in most Human Resources analytics, and appear particularly in the Workforce analysis reports. See the object definition for details. (Open MicroStrategy Desktop, navigate to the Human Resources Analysis Module, navigate to the metric you are interested in, and double-click on the metric to see details.)
Metric/KPI Description Formula
Employees - Current
Total number of employees currently working for the company.
Count(Employee) {~} <[Active Employee (Current)]>
FTE Number of full-time equivalent employees. Sum([FTE Coefficient]) {~}
Contractors Number of contractors working for the company.
Count(Contractor) {~, Time} <[Active Contractor]>
Avg. Current Tenure (months)
Average of employees' current tenure (at a level higher than employee).
Avg([Current Tenure]) {~}
Departed Employees - Current
Number of employees who left the company.
Count(Employee) {~} <[Inactive Employee (Current)]>
Involuntary Departed Employees - Current
Number of employees who involuntarily left the company.
Count(Employee) {~} <[Involuntary Departed and Inactive Current]>
Voluntary Departed Employees - Current
Number of employees who voluntarily left the company.
Count(Employee) {~} <[Voluntary Departed and Inactive Current]>
Employees - All Identity Groups
Number of employees with no grouping on gender and ethnicity, and with filtering set to Ignore.
Count(Employee) {Gender, Ethnicity} <[Active Employee (Current)]>

Human Resources Analysis Module Reference Definitions for Objects on Reports: Object Glossaries A
© 2010 MicroStrategy, Inc. Metrics glossary 127
Contribution to Identity Group
See formula to the right. (([Employees - Current] * 1.0001) / ([Employees - All Identity Groups] * 1.0001))
Contractors (for Access outer join)
Number of contractors working for the company.
Count(Contractor) {~, Time} <[Active Contractor]>
Employees with Minority Group
Total number of employees working for the company who belong to a minority group.
Count(Employee) {~, Time} <[Active Employees with Minority Group (Hist)]>
Employees with Minority Group to Employee Base
Number of employees with a minority group, divided by the total number of employees.
(((1.001 * [Employees with Minority Group]) / Employees) * 1.001)
Employees with Minority Group to All Employees
Number of new employees with a minority group, divided by the total number of employees.
(((1.001 * [New Employees with Minority Group]) / Employees) * 1.001)
Minority Group Hiring Score
See formula to the right. (((1.001 * [New Employees with Minority to All New Employees]) / [Employees with Minority Group to Employee Base]) * 1.001)
Involuntary Departed Employees with Minority
Total number of involuntarily departed employees who belong to a minority group.
Count(Employee) {~} <[Involuntary Departed Employees with Minority]>
Involuntary Departed Employees with Minority Group to All Involuntary Departed Employees
See formula to the right. ((1.001 * [Involuntary Departed Employees with Minority]) / ([Involuntary Departed Employees] * 1.001))
Minority Group Involuntary Departure Score
See formula to the right. (((1.001 * [Involuntary Departed Employees with Minority to All Involuntary Departed Employees]) / [Employees with Minority Group to Employee Base]) * 1.001)
Employees Total number of employees working for the company during a particular month.
Count(Employee) {~, Time} <[Active Employee (Hist)]>
Departed Employees
Total number of employees who left the company in a certain month.
Count(Employee) {~} <[Departed Employees (Hist)]>
Involuntary Departed Employees
Number of employees who involuntarily left the company in a certain month.
Count(Employee) {~} <[Involuntary Departed Employees]>
Metric/KPI Description Formula

Definitions for Objects on Reports: Object Glossaries Human Resources Analysis Module ReferenceA
128 Metrics glossary © 2010 MicroStrategy, Inc.
Voluntary Departed Employees
Number of employees who voluntarily left the company in a certain month.
Count(Employee) {~} <[Voluntary Departed Employees]>
Attrition Rate See formula to the right. ((1.0001 * [Voluntary Departed Employees]) / (1.0001 * (Employees + [Voluntary Departed Employees])))
Turnover See formula to the right. ([New Employees] - [Departed Employees])
Turnover Rate New and departed employees, divided by the total number of employees.
(((1.001 * ([New Employees] + [Departed Employees])) / Employees) * 1.001)
Transferee Turnover Rate
New, departed, and transferred employees, divided by the total number of employees.
(((1.001 * (([New Employees] + [Departed Employees]) + [Transferred Employees])) / Employees) * 1.001)
Tenure (months) Employee tenure. Max(Tenure) {~}
Avg. Tenure (months)
Average employee tenure. Avg(Tenure) {~}
Avg. Executives' Tenure (months)
Average executive tenure. Avg(Tenure) {~} <[Active Executives (Hist)]>
New Employees Total number of employees who joined the company in a selected month and whose tenure is only one month.
Count(Employee) {~} <[Tenure = 1]>
New Employees with Minority Group
Total number of new employees who belong to a minority group.
Count(Employee) {~} <[Tenure =1 and Minority Group]>
New Employees with Minority to All New Employees
Number of new employees with a minority group, divided by all new employees.
(((1.001 * [New Employees with Minority Group]) / [New Employees]) * 1.001)
Hiring Rate See formula to the right. ((1.0001 * [New Employees]) / (1.0001 * Employees))
Full-time Employees
Number of full-time employees working for the company (flag on Position Status = Full Time).
Count(Employee) {~, Time} <[Full-time and Active (Hist)]>
Part-time Employees
Number of part-time employees working for the company (flag on Employment Status = Part-time).
Count(Employee) {~, Time} <[Part-time and active (Hist)]>
Executives Number of executive-level employees working for the company.
Count(Employee) {~, Time} <[Active Executives (Hist)]>
Executives to All Employees Ratio
See formula to the right. ((Executives * 1.0001) / (Employees * 1.0001))
Metric/KPI Description Formula

Human Resources Analysis Module Reference Definitions for Objects on Reports: Object Glossaries A
© 2010 MicroStrategy, Inc. Metrics glossary 129
Compensation metrics
The following metrics are used primarily in the Compensation analysis reports. See the object definition for details.
Metric/KPI Description Formula
Compensation Cost
This is the overall cost of compensation sustained by the company.
Sum([Compensation Cost]) {~}
Avg. Compensation Cost per Employee
See formula to the right. ([Compensation Cost] / Employees)
Compensation Cost to All Functions
Overall compensation cost with no grouping by employee function.
Sum([Compensation Cost]) {~, [Employee Function]}
Compensation Cost to All Locations
Overall compensation cost with no grouping by employee location.
Sum([Compensation Cost]) {~, [Employee Location]}
Compensation Cost to All Profile
Overall compensation cost with no grouping by employee profile.
Sum([Compensation Cost]) {~, [Employee Profile]}
Compensation Cost Contribution to Functions
See formula to the right. ([Compensation Cost] / [Compensation Cost to All Functions])
Compensation Cost Contribution to Locations
See formula to the right. ([Compensation Cost] / [Compensation Cost to All Locations])
Compensation Cost Contribution to Profile
See formula to the right. ([Compensation Cost] / [Compensation Cost to All Profile])
Paid Salary Compensation cost with conditionality on Compensation Type = Salary.
Sum([Compensation Cost]) {~} <[Base Salary]>
Paid Bonus Compensation cost with conditionality on Compensation Type = Bonus.
Sum([Compensation Cost]) {~} <[Regular Bonus]>
Awards Compensation cost with conditionality set on the filter “Awards”.
Sum([Compensation Cost]) {~} <Awards>
Bonus Potential Bonus potential assigned to each employee each year.
Sum([Bonus Potential]) {~}
Annual Salary Annual salary paid to the employee. Sum([Annual Salary]) {~}

Definitions for Objects on Reports: Object Glossaries Human Resources Analysis Module ReferenceA
130 Metrics glossary © 2010 MicroStrategy, Inc.
Avg. Annual Salary per Employee
See formula to the right. ([Annual Salary] / Employees)
Average Annual Salary
Average (function) salary with dimensionality set on Employee.
Avg([Annual Salary]) {~, Employee}
Median Annual Salary
Median (function) salary with dimensionality set on Employee.
Median([Annual Salary]) {~, Employee}
Mode Annual Salary
Mode (function) salary with dimensionality set on Employee.
Mode([Annual Salary]) {~, Employee}
Hourly Rate Salary rate assigned to each active contractor.
Sum([Salary Rate]) {~, Time} <[Active Contractor]>
Contract Cost Total cost of the contract. See formula to the right.
(([Hourly Rate] * 8) * [Contract Duration (days)])
Annualized Contract Cost
Total cost over one year. Usually calculated by multiplying the Hourly Rate by a constant. See formula to the right.
((365 * [Hourly Rate]) * 8)
Avg. Annualized Contract Cost per Contractor
See formula to the right. ([Annualized Contract Cost] / Contractors)
Annualized Employee Equivalents
See formula to the right ([Avg. Annualized Contract Cost per Contractor] / [Avg. Annual Salary per Employee])
Industry Mode Most frequent industry salary or market value assigned to a certain employee level at a certain time (year).
Avg([Level Industry Standard]) {~}
Industry Min Salary
Minimum industry salary related to a certain employee level at a certain time (year).
Min([Level Min Salary]) {~}
Industry Max Salary
Maximum industry salary related to a certain employee level at a certain time (year).
Max([Level Max Salary]) {~}
Industry Max Salary - Annual Salary
See formula to the right. ([Industry Max Salary] - [Annual Salary])
Annual Salary - Industry Min Salary
See formula to the right. ([Annual Salary] - [Industry Min Salary])
Salary to Industry Mode Ratio
See formula to the right. ([Avg. Annual Salary per Employee] / [Industry Mode])
Metric/KPI Description Formula

Human Resources Analysis Module Reference Definitions for Objects on Reports: Object Glossaries A
© 2010 MicroStrategy, Inc. Metrics glossary 131
Salary to Industry Mode Variance
See formula to the right. (([Avg. Annual Salary per Employee] - [Industry Mode]) / [Industry Mode])
Overtime (hours) Number of hours of overtime worked. Sum([Extra Hours]) {~}
Employees with Overtime
Number of employees working overtime.
Count(Employee) {~, Time} <[Active Employee (Hist)]>
Non-exempt Employees
Number of non-exempt employees. Count(Employee) {~, Time} <[Non-Exempt and Active Employee (Hist)]>
Employees with Overtime to all Non-exempt Employees
See formula to the right. ((1.0001 * [Employees with Overtime]) / (1.0001 * [Non-Exempt Employees]))
Average Overtime per Employee (hours)
See formula to the right. ([Overtime (hours)] / [Employees with Overtime])
Hourly Equivalent Salary
Equivalent hourly salary, obtained by dividing the monthly salary by a constant.
(Sum([Compensation Cost]) / (30 * 8)) {~} <[Base Salary]>
Paid Overtime See formula to the right. (([Overtime (hours)] * [Hourly Equivalent Salary]) * 1.5)
Paid Overtime Contribution to Monthly Salary
See formula to the right. ([Paid Overtime] / [Paid Salary])
Overtime per Employee (h)
See formula to the right. ([Overtime (hours)] / [Non-Exempt Employees])
Planned Headcount
Target headcount planned by quarter. Sum([Planned Employees]) {~}
Planned Compensation
Target compensation cost planned by quarter.
Sum([Planned Compensation]) {~}
Planned - Actual Headcount
See formula to the right. ([Planned Headcount] - Employees)
Planned - Actual Compensation
See formula to the right. ([Planned Compensation] - [Compensation Cost])
Planned - Actual Compensation Variance
See formula to the right. ([Planned - Actual Compensation] / [Planned Compensation])
Actual as % Planned Compensation
See formula to the right. ([Compensation Cost] / [Planned Compensation])
Metric/KPI Description Formula

Definitions for Objects on Reports: Object Glossaries Human Resources Analysis Module ReferenceA
132 Metrics glossary © 2010 MicroStrategy, Inc.
Benefit and Time Off metrics
The following metrics are used primarily in the Benefits analysis area. See the object definition for details.
Metric/KPI Description Formula
Company Cost Cost to the company of a benefit per employee, by quarter.
Sum([Company Cost]) {~}
Employee Cost Cost to the employee of a benefit per employee, by quarter.
Sum([Employee Cost]) {~}
Participants Number of people participating in a benefit. This can be different from the number of enrolled employees since employees can enroll their family members.
Sum([Number of Participants]) {~}
Enrolled Employees
Number of employees enrolled in a certain benefit.
Count(Employee) {~, Time}
Participation Rate
See formula to the right. ((1.0001 * [Enrolled Employees]) / (1.0001 * Employees))
Avg. Company Cost per Enrolled Employee
See formula to the right. (Sum([Company Cost]) {~} / [Enrolled Employees])
Avg. Company Cost per Participant
See formula to the right. (Sum([Company Cost]) {~} / Participants)
Accrued Days Number of days accrued per employee, per time off type.
NullToZero(Sum([Number of Accrued Days])) {~}
Available Days See formula to the right. ([Accrued Days] - [Used Days])
Used Days Number of days used per employee per year.
Sum([Number of Used Days]) {~}

Human Resources Analysis Module Reference Definitions for Objects on Reports: Object Glossaries A
© 2010 MicroStrategy, Inc. Metrics glossary 133
Transfers metrics
The following metrics are used primarily in the Workforce Analysis reports. See the object definition for details.
Qualifications, Performance, and Satisfaction metrics
The following metrics are used primarily in the Workforce Development analysis area. See the object definition for details.
Metric/KPI Description Formula
Department Transfers
Number of department transfers. Sum([Department Transfer]) {~}
Location Transfers Number of location transfers. Sum([Location Transfer]) {~}
Transfers See formula to the right. ([Location Transfers] + [Department Transfers])
Transfers to Employee Base
See formula to the right. ((1.0001 * [Transferred Employees]) / (1.0001 * Employees))
Department Transferred In Employees
Number of employees who transferred to a certain department.
Count(Employee) {~} <[Department Transfer]>
Department Transferred Out Employees
Number of employees who transferred from a certain department.
Count(Employee) {~} <[Department Transfer]>
Location Transferred In Employees
Number of employees who transferred to a certain location.
Count(Employee) {~} <[Location Transfer]>
Location Transferred Out Employees
Number of employees who transferred from a certain location.
Count(Employee) {~} <[Location Transfer]>
Transferred Employees
Number of distinct employees with a department or location transfer.
Count(Employee) {~} <[Department Transfer or Location Transfer]>
Metric/KPI Description Formula
Qualification Level Level associated to a qualification obtained by an employee. This can be a numeric value, percentage, or text description.
Max([Qualification Level]) {~}
Qualified Employees
Number of employees who obtained a certain qualification.
Count(Employee) {~}

Definitions for Objects on Reports: Object Glossaries Human Resources Analysis Module ReferenceA
134 Metrics glossary © 2010 MicroStrategy, Inc.
Position metrics
The following metrics are primarily used in the Recruitment analysis area. See the object definition for details.
Avg. Performance Score
Performance score associated with an employee at a certain time. It can be a numeric value or text description.
Avg([Employee Performance Score]) {~}
Avg. Satisfaction Score
Avg. Satisfaction Score Avg([Satisfaction Score]) {~}
Satisfaction Score Standard Deviation
Standard deviation among the different satisfaction scores assigned by time and survey fields.
Stdev([Satisfaction Score]) {~}
Participants Number of received surveys. Sum([Survey Count]) {~}
Participation Rate See formula to the right. (((Participants * 1.0001) / Employees) * 1.0001)
N. Training Number of distinct employees who attended at least one training session or event.
Count(Employee) {~} <[Active Employee (Current)]>
Training Rate See formula to the right. ((1.001 * [N. Training]) / ([Employees - Current] * 1.001))
Metric/KPI Description Formula
Metric/KPI Description Formula
Vacant Positions Number of currently vacant positions within the organization.
Count([Job Code]) {~} <[Job Close Date is Null]>
Vacant Positions as % Total
See formula to the right. (1.001 * (([Vacant Positions] / ([Employees - Current] + [Vacant Positions])) * 1.001))
Received Resumes
The number of resumes received for a certain position during a certain period.
Sum([Number of Received Resumes]) {~}
Interviewed Candidates
The number of candidates interviewed for a certain position during a certain period.
Sum([Number of Interviewed Candidates]) {~}
Sent Offers The number of offers sent for a certain position during a certain period.
Sum([Number of Sent Offers]) {~}
Rejected Offers The number of offers rejected for a certain position during a certain period.
Sum([Number of Rejected Offers]) {~}
Accepted Offers The number of offers accepted for a certain position during a certain period.
Sum([Number of Accepted Offers]) {~}
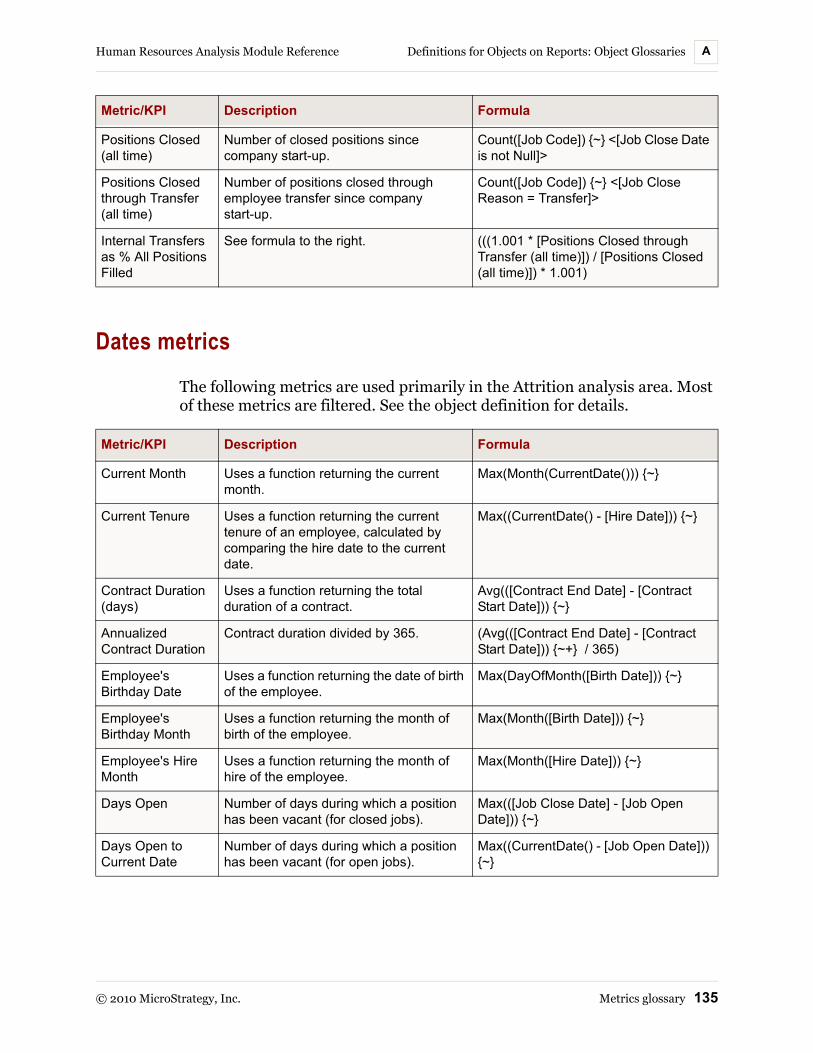
Human Resources Analysis Module Reference Definitions for Objects on Reports: Object Glossaries A
© 2010 MicroStrategy, Inc. Metrics glossary 135
Dates metrics
The following metrics are used primarily in the Attrition analysis area. Most of these metrics are filtered. See the object definition for details.
Positions Closed (all time)
Number of closed positions since company start-up.
Count([Job Code]) {~} <[Job Close Date is not Null]>
Positions Closed through Transfer (all time)
Number of positions closed through employee transfer since company start-up.
Count([Job Code]) {~} <[Job Close Reason = Transfer]>
Internal Transfers as % All Positions Filled
See formula to the right. (((1.001 * [Positions Closed through Transfer (all time)]) / [Positions Closed (all time)]) * 1.001)
Metric/KPI Description Formula
Metric/KPI Description Formula
Current Month Uses a function returning the current month.
Max(Month(CurrentDate())) {~}
Current Tenure Uses a function returning the current tenure of an employee, calculated by comparing the hire date to the current date.
Max((CurrentDate() - [Hire Date])) {~}
Contract Duration (days)
Uses a function returning the total duration of a contract.
Avg(([Contract End Date] - [Contract Start Date])) {~}
Annualized Contract Duration
Contract duration divided by 365. (Avg(([Contract End Date] - [Contract Start Date])) {~+} / 365)
Employee's Birthday Date
Uses a function returning the date of birth of the employee.
Max(DayOfMonth([Birth Date])) {~}
Employee's Birthday Month
Uses a function returning the month of birth of the employee.
Max(Month([Birth Date])) {~}
Employee's Hire Month
Uses a function returning the month of hire of the employee.
Max(Month([Hire Date])) {~}
Days Open Number of days during which a position has been vacant (for closed jobs).
Max(([Job Close Date] - [Job Open Date])) {~}
Days Open to Current Date
Number of days during which a position has been vacant (for open jobs).
Max((CurrentDate() - [Job Open Date])) {~}

Definitions for Objects on Reports: Object Glossaries Human Resources Analysis Module ReferenceA
136 Filters glossary © 2010 MicroStrategy, Inc.
Filters glossaryThis section lists all the filters used in HRAM.
All filter definitions are located in the Public Objects\Filters folder in the MicroStrategy project. Filters are organized into the following subfolders in the MicroStrategy project. These divisions are reflected in the tables below:
• Employee
• Compensation and Benefit
• Position
• Time
Employee filters
This table contains all the attribute qualification filters based on a specified set of elements. The attribute is Employee-based.
Filter Description
Full-time Position Status in list “Full-time”
Part-time Position Status in list “Part-time”
Recent Hires Date between prompted value and today's date
Active Contractor Contract activity in list "Active"
Executive Level Level in list "Executive"
Executive Employees
Set of employees where Level=Executive, relate by table F_EMP_LEVEL
Involuntary Departure
Leave Reason in list "Reduction in Force"
Voluntary Departure Leave Reason in list "Retirement, Better Opportunity, Relocation, Personal Reasons, Other Reasons"
Exempt Exempt status in list “1”
Non-exempt Exempt status in list “0”
Tenure <= 2 months Tenure in list "1, 2"
Tenure 3 - 4 months Tenure in list "3, 4"

Human Resources Analysis Module Reference Definitions for Objects on Reports: Object Glossaries A
© 2010 MicroStrategy, Inc. Filters glossary 137
Tenure 5 - 7 months Tenure in list "5, 6, 7"
Tenure 8 -10 months Tenure in list "8, 9, 10"
Tenure > 10 months Tenure in list "11, 12, 13, 14, 15, 16, 17, 18"
Active Employee (Current)
Current Status in list "Active"
Inactive Employee (Current)
Current Status in list "Inactive"
Involuntary Departed and Inactive Current
Inactive Employee (Current) AND Involuntary Departure
Voluntary Departed and Inactive Current
Inactive Employee (Current) AND Voluntary Departure
Active Employee (Hist)
Historical Status in list "Active"
Departed Employees (Hist)
Historical Status in list "Inactive"
Involuntary Departed Employees
Set of employees where Leave Reason = Reduction in force, relate by table L_EMPLOYEE AND Departed Employees (Hist)
Voluntary Departed Employees
Set of Employees where Leave Reason = "Retirement, Better Opportunity, Relocation, Personal Reasons, Other Reasons", relate by table L_EMPLOYEE AND Departed Employees (Hist)
Departed Employees by Leave Reason
Set of Employees, Year, Leave Reason where Departed Employees >0 relate by table L_EMPLOYEE
Departed Employees > 0 (Hist)
Evaluate the set at the report level where (Departed Employees greater than 0)
Active Executives (Hist)
Executive Employees AND Active Employee (Hist)
Full-time and Active (Hist)
Full-time AND Active Employee (Hist)
Part-time and Active (Hist)
Position Status In list (Part-time) AND Historical Status In list (Active)
Tenure = 1 Tenure in list "1"
Non-exempt and Active Employee (Hist)
Active Employee (Hist) AND Non-Exempt
Men Gender in list "M"
Women Gender in list "F"
White Ethnicity in list "White"
Filter Description

Definitions for Objects on Reports: Object Glossaries Human Resources Analysis Module ReferenceA
138 Filters glossary © 2010 MicroStrategy, Inc.
Compensation and Benefit filters
Minority Ethnicity in list "Asian, African, Hispanic, Indian, Other"
Minority Men Minority AND Men
Minority Women Minority AND Women
White Men White AND Men
White Women White AND Women
Minority Group is Not Null
Minority Group (ID) is Not Null
Active Employees with Minority Group (Hist)
Active Employee (Hist) AND Minority Group is Not Null
Tenure=1 and Minority Group
Tenure = 1 AND Minority Group is Not Null
Involuntary Departed Employees with Minority
Set of Employees where Leave Reason = Reduction in Force AND Departed Employees (Hist) AND Minority Group is Not Null
Department Transfer Department Transfer in list “1”
Location Transfer Location Transfer in list “1”
Employees with Department Transfer
Set of Employees where {Department Transfers}=1, Relate by the Table F_EMP_HIST
Department Transfer or Location Transfer
Department transfer OR location transfer
Active Transfers (Hist)
Active Employee (Hist) AND Department Transfer or Location Transfer
Filter Description
Base Salary Compensation item in list "Base Salary".
Awards Compensation item in list "Other Monetary Awards, Non-monetary Awards".
Regular Bonus Compensation item in list "Regular Bonus ".
Base Salary and Regular Bonus
Compensation item in list "Base Salary, Regular Bonus".
Maximum Salary - Salary < 0
Evaluate the Set at the Metric level where (Industry Max Salary - Annual Salary less than 0)
Filter Description

Human Resources Analysis Module Reference Definitions for Objects on Reports: Object Glossaries A
© 2010 MicroStrategy, Inc. Filters glossary 139
Position filters
This table contains metric-based filters.
Time filters
This table contains one filter based on attribute qualification ID with the use of operators and dynamic dates. The attribute is Date.
Salary - Minimum Salary < 0
Evaluate the Set at the Metric level where (Annual salary - Industry Min Salary less than 0)
Top Benefits by Participants
Evaluate set at default metric level where Rank of 'Participants' Top prompted value.
Pension Plan Benefit Type in list “Pension Plan”
Top Overtime Evaluate set of titles where Rank of ‘Overtime” (hours) Top prompted value.
Filter Description
Filter Description
Job Close Date is Null Job Close Date ID Is Null.
Job Close Date is not Null Job Close Date ID Is not Null.
Job Close Reason = Transfer Job Close Reason in list “Transfer”
Filter Description
Upcoming Anniversaries
Evaluate the set at Report level where Employee's Hire Month = Current Month.
Upcoming Birthdays Evaluate the set at Report level where Employee's Birthday Month = Current Month.
Upcoming Contract Expirations
Contract Expiration ID greater than Today. This filter can be easily customized to Current Month.
Upcoming Departures Leave Date ID greater than Today. This filter can be easily customized to Current Month.

Definitions for Objects on Reports: Object Glossaries Human Resources Analysis Module ReferenceA
140 Prompts glossary © 2010 MicroStrategy, Inc.
Prompts glossaryThis section lists all the prompts used in HRAM reports. The majority of the HRAM reports have prompts as embedded filters, allowing you to select the report qualification from a list of elements at run time. Prompts always require an answer for reports to run.
Consolidations glossaryConsolidations enable attribute elements to be grouped so they can be placed on a report and displayed like any other attribute. Consolidation elements must usually be re-edited to satisfy specific customer grouping requirements.
Prompt Description
Department Elements prompt: One or more departments can be selected
Location Elements prompt: One or more locations can be selected
Profile Object prompt: Dynamic selection of attributes defining the report layout. One or more profiles can be selected
Profile (only one, required)
Object prompt: Dynamic selection of attributes defining the report layout. One profile must be selected
Department (only one, required)
Elements prompt: One department must be selected
Location (only one, required)
Elements prompt: One location must be selected
Job Characteristics
Object prompt: Dynamic selection of attributes defining the report layout. One or more job characteristics can be selected
Qualification Type Elements prompt: One or more qualification types can be selected
User Login Text Prompt: A system prompt is automatically answered with the current user's Login name. Use this prompt to insert a Login name into a filter or metric expression.
Month Elements prompt: One or more months can be selected
Quarter Elements prompt: One or more quarters can be selected
Quarter (only one, required)
Elements prompt: One quarter must be selected
Year Elements prompt: One or more years can be selected
Year (only one, required)
Elements prompt: One year must be selected

Human Resources Analysis Module Reference Definitions for Objects on Reports: Object Glossaries A
© 2010 MicroStrategy, Inc. Custom Groups glossary 141
This section describes the consolidation used in HRAM reports.
Custom Groups glossaryThis section describes the custom groups used in HRAM reports.
Consolidation Description
Identity Groups • White {Ethnicity = Caucasian}• Minority (((({Ethnicity=Asian} + {Ethnicity=African}) + {Ethnicity=Hispanic})
+ {Ethnicity=Indian}) + {Ethnicity=Other})
Custom Group Description
Current Tenure
• < 2 months: Set of employees where Current Tenure < 60• 2-4 months: Set of employees where Current Tenure Between 60 and 120• 4-7 months: Set of employees where Current Tenure Between 121 and 210• 7-10 months: Set of employees where Current Tenure Between 211 and 300• > 10 months: Set of employees where Current Tenure > 300
Tenure • <=2 months: Filter on tenure <= 2 months• 2-4 months: Filter on tenure 3-4 months• 4-7 months: Filter on tenure 5-7 months• 7-10 months: Filter on tenure 8-10 months• > 10 months: Filter on tenure > 10 months
Identity Group • Minority M: Filter on minority men• Minority F: Filter on minority women• White M: Filter on white men• White F: Filter on white women
Compensation Item
• Salary: Filter on Base Salary• Bonus: Filter on Regular Bonus• Awards: Filter on Awards

Definitions for Objects on Reports: Object Glossaries Human Resources Analysis Module ReferenceA
142 Custom Groups glossary © 2010 MicroStrategy, Inc.

© 2010 MicroStrategy, Inc. 143
BB.STRUCTURE OF HRAM’S BUSINESS LOGIC: LOGICAL DATA MODEL
Introduction
This appendix presents the logical data model on which the Human Resources Analysis Module (HRAM) is built.
This appendix provides a description for
• business hierarchies, including attributes and relationships, and their metadata objects definitions
• module facts
For a general description, basic procedures, and additional details about understanding and working with HRAM’s logical data model, see About the structure of HRAM’s business logic, page 11.
Information can also be found by accessing each attribute’s definition using the Attribute Editor. The attributes can be found in the Schema Objects\Attributes folder. Double-click an attribute to open the Attribute Editor.

Structure of HRAM’s Business Logic: Logical Data Model Human Resources Analysis Module ReferenceB
144 Prerequisites © 2010 MicroStrategy, Inc.
PrerequisitesThis appendix assumes you have prior experience with logical data modeling and creating business intelligence applications using MicroStrategy technology.
HRAM logical schemaThe following diagram is similar to the logical model shipped with HRAM. The logical schema diagram is available in an Erwin file, located in Program Files\MicroStrategy\Analytics Modules\Hram\Hram.er1.

Human Resources Analysis Module Reference Structure of HRAM’s Business Logic: Logical Data Model B
© 2010 MicroStrategy, Inc. HRAM logical schema 145
Structure of HRAM’s Business Logic: Logical Data Model Human Resources Analysis Module ReferenceB
146 Business hierarchies © 2010 MicroStrategy, Inc.
Business hierarchiesHRAM is designed to provide in-depth knowledge of corporate human resources information. HRAM accomplishes this partly through a set of attributes (business concepts) and their relationships to each other. These attributes are arranged in a specific sequence according to a business structure, in an arrangement called a hierarchy.
The key business hierarchies in the human resources process are
• Employee: Employee, Profile (Age Range, Gender, Nationality, Ethnicity, Education and Degree Type, Marital Status), Hire Date, Leave Date, Date of Birth, Title, Address, Minority Group, Immigration Status, Clearance Status, Position Status, Department, Division, Location, Region, Identification Number, Number of years of experience, Salary Range Level, and Supervisor
• Qualification: Qualifications, Qualification Type, and Level
• Compensation: Compensation Type or Component
• Benefit: Benefit Type and Component
• Position: Job Open Date, Job Close Date, Position, and Job Code
• Survey Field
• Leave Reason
• Time Off Type
• Time: Year, Quarter, Month, and Day
Each hierarchy listed previously is described in detail in the following sections. For additional information on the hierarchies, see the MicroStrategy project definitions in HRAM’s Schema Objects\Attributes and Schema Objects\Facts folders. From one of these folders, double-click an attribute or fact to view definitions, properties, source tables, and so on.
Employee and Contractor hierarchies
This hierarchy represents the employee, and is subdivided into Employee and Contractor. In the logical data model, Contractor is available within the Employee hierarchy.

Human Resources Analysis Module Reference Structure of HRAM’s Business Logic: Logical Data Model B
© 2010 MicroStrategy, Inc. Business hierarchies 147
Employee hierarchy
This hierarchy has the largest number of attributes in the model. Employee is the lowest level attribute and all other attributes are either a characteristic or a parent of Employee. The attributes and relationships, as well as main parent branches, can be seen in the following figure.
Attribute Description Example
Employee Name of the individual working for the company, receiving salary and benefits in return.
John Smith.
Profile Group of attributes that define the personal profile of an employee. See the following Profile table.
Age, nationality, and so on. See the following Profile table.
Address Group of attributes that define the home address of an employee. See the following Address table.
Street, City, and so on. See the following Address table.
Department / Previous Department
Employee's company department.• This is a parent of Employee and Month (joint
children) and belongs to the Function hierarchy.
Production consulting, pre-sales consulting, finance administration, HR administration, and so on.

Structure of HRAM’s Business Logic: Logical Data Model Human Resources Analysis Module ReferenceB
148 Business hierarchies © 2010 MicroStrategy, Inc.
Division / Previous Division
Employee's division.• This is a parent of Department and belongs to
the Function hierarchy.
Administration, consulting, and so on.
Location / Previous Location
Employee's work site.• This can either be the zip+4 code (the nine
digit numeric zip code), or the name of the city, depending on the type of company.
• This is a parent of Employee and Month (joint children) and belongs to the employee's Geography hierarchy.
22180-1234, 22182-2345Vienna, McLean, New York City, Washington DC, and so on.
Region / Previous Region
This is a parent of Location and belongs to the employee's Geography hierarchy.
Virginia, California, and so on.
Immigration Status
Employee's immigration status. None, H1B Visa, Green Card, and so on.
Clearance Status
Employee's security clearance status. Top-secret, secret, none, and so on.
Exempt Status Exempt status of the employee. Parent of Employee.
Exempt, Non-exempt.
Work Experience
Employee's work experience (in years) within relevant fields prior to hire date.
1, 2, 3 and so on.
Minority Group Employee's minority group. Veteran, disabled, none, more than 1, and so on.
Position Status / FTE Coefficient
Status of employee’s position.A coefficient can be used to further clarify Position Status:
• 1 if full-time.• Between 0 and 1 if part-time.
Full-time, part-time0, 0.5, 0.8, 1
Level Employee's general job level (not a specific title). Executive, manager, engineer, and so on.
Hire Date Employee's start date with the company. 12/24/2002
Leave Date Employee's last date with the company. 12/24/2003
Title Employee's job title. Product Manager, Program Manager, and so on.
Supervisor Name of the employee's supervisor. David Smith
Birth Date Date of birth of the employee. 12/24/1980
ID Employee identification number.• The attribute’s relationship is one to one with
Employee.
1234, 1225, and so on.
Attribute Description Example

Human Resources Analysis Module Reference Structure of HRAM’s Business Logic: Logical Data Model B
© 2010 MicroStrategy, Inc. Business hierarchies 149
Employee Status
Indicates whether the employee is active/hired, terminated voluntarily, or terminated involuntarily.
• Active (hired)• Inactive (voluntarily departed, involuntarily departed).
Recruiting Source
Source used to recruit and hire the employee. Head-hunter, referral, job posting on Internet, job posting in Newspaper, and so on.
Tenure Length of employment. 1 month, 1 year, 5 years, and so on.
Location Transfer
Flag indicating whether the employee had a location transfer during a specific month.
0, 1
Department Transfer
Flag indicating whether the employee had a department transfer during a specific month.
0, 1
Attribute Description Example
Profile Attribute Group Description Example
Age Range Age range for the employee. 18-30, 31-40, 41-50, 50+
Gender Gender of the employee. F, M
Nationality Nationality of the employee. U.S. citizen, Italian, and so on.
Ethnicity Ethnicity or race of the employee, if known. Caucasian, Asian, African, and so on
Education Education level of the employee. Doctorate, Master, and so on
Degree Type Education degree type of the employee, if any. Computer Science, Finance, and so on
Marital Status Marital status of the employee. Single, married
Address Attribute Group Description Example
Address Employee's street address. 123 Sunrise Avenue, McLean VA 22180
ZIP Code Employee's ZIP Code 22180
Phone Number Employee's home phone number. 703-573 2270
City Employee's city. Vienna, McLean, and so on.
State Employee's state or region. VA, MD
Country Employee's country. USA, Italy, and so on.

Structure of HRAM’s Business Logic: Logical Data Model Human Resources Analysis Module ReferenceB
150 Business hierarchies © 2010 MicroStrategy, Inc.
The detailed definition of each attribute in the MicroStrategy metadata listed previously is shown in the following tables.
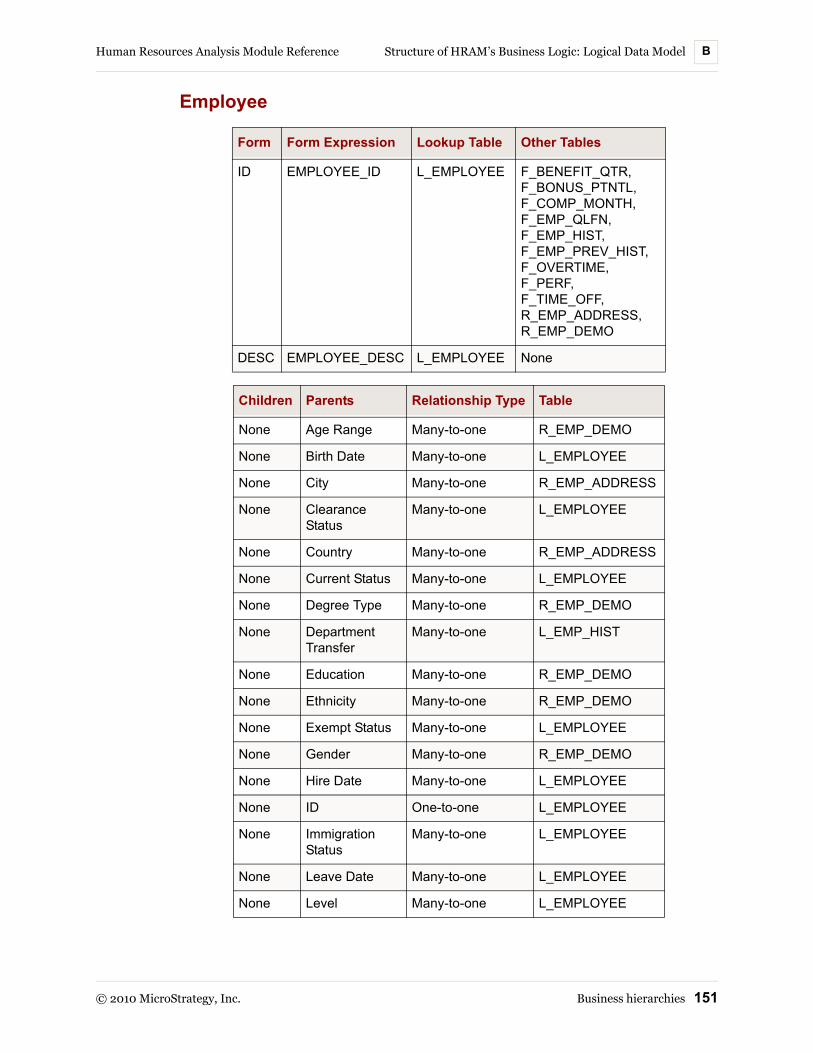
Human Resources Analysis Module Reference Structure of HRAM’s Business Logic: Logical Data Model B
© 2010 MicroStrategy, Inc. Business hierarchies 151
Employee
Form Form Expression Lookup Table Other Tables
ID EMPLOYEE_ID L_EMPLOYEE F_BENEFIT_QTR, F_BONUS_PTNTL, F_COMP_MONTH, F_EMP_QLFN, F_EMP_HIST, F_EMP_PREV_HIST, F_OVERTIME, F_PERF, F_TIME_OFF, R_EMP_ADDRESS, R_EMP_DEMO
DESC EMPLOYEE_DESC L_EMPLOYEE None
Children Parents Relationship Type Table
None Age Range Many-to-one R_EMP_DEMO
None Birth Date Many-to-one L_EMPLOYEE
None City Many-to-one R_EMP_ADDRESS
None Clearance Status
Many-to-one L_EMPLOYEE
None Country Many-to-one R_EMP_ADDRESS
None Current Status Many-to-one L_EMPLOYEE
None Degree Type Many-to-one R_EMP_DEMO
None Department Transfer
Many-to-one L_EMP_HIST
None Education Many-to-one R_EMP_DEMO
None Ethnicity Many-to-one R_EMP_DEMO
None Exempt Status Many-to-one L_EMPLOYEE
None Gender Many-to-one R_EMP_DEMO
None Hire Date Many-to-one L_EMPLOYEE
None ID One-to-one L_EMPLOYEE
None Immigration Status
Many-to-one L_EMPLOYEE
None Leave Date Many-to-one L_EMPLOYEE
None Level Many-to-one L_EMPLOYEE

Structure of HRAM’s Business Logic: Logical Data Model Human Resources Analysis Module ReferenceB
152 Business hierarchies © 2010 MicroStrategy, Inc.
Tenure
Level
None Location Transfer
Many-to-one L_EMP_HIST
None Marital Status Many-to-one R_EMP_DEMO
None Minority Group Many-to-one L_EMPLOYEE
None Nationality Many-to-one R_EMP_DEMO
None Phone Number Many-to-one R_EMP_ADDRESS
None Position Status Many-to-one L_EMPLOYEE
None Recruiting Source
Many-to-one L_EMPLOYEE
None State Many-to-one R_EMP_ADDRESS
None Street Many-to-one R_EMP_ADDRESS
None Supervisor Many-to-one L_EMPLOYEE
None Title Many-to-one L_EMPLOYEE
None Work Experience
Many-to-one L_EMPLOYEE
None Zip Code Many-to-one R_EMP_ADDRESS
Form Form Expression Lookup Table Other Tables
ID SENIORITY F_EMP_HIST None
Form Form Expression Lookup Table Other Tables
ID EMP_LEVEL_ID L_EMP_LEVEL F_EMP_LEVEL, L_EMPLOYEE
DESC EMP_LEVEL_DESC L_EMP_LEVEL None
Children Parents Relationship Type Table
Employee None One-to-many L_EMPLOYEE
Children Parents Relationship Type Table

Human Resources Analysis Module Reference Structure of HRAM’s Business Logic: Logical Data Model B
© 2010 MicroStrategy, Inc. Business hierarchies 153
City
Country
Phone Number
State
Form Form Expression Lookup Table Other Tables
ID EMP_CITY R_EMP_ADDRESS None
Children Parents Relationship Type Table
Employee None One-to-many R_EMP_ADDRESS
Form Form Expression Lookup Table Other Tables
ID EMP_CONTRY R_EMP_ADDRESS None
Children Parents Relationship Type Table
Employee None One-to-many R_EMP_ADDRESS
Form Form Expression Lookup Table Other Tables
ID EMP_PHONE_NUM R_EMP_ADDRESS None
Children Parents Relationship Type Table
Employee None One-to-many R_EMP_ADDRESS
Form Form Expression Lookup Table Other Tables
ID EMP_STATE R_EMP_ADDRESS None
Children Parents Relationship Type Table
Employee None One-to-many R_EMP_ADDRESS

Structure of HRAM’s Business Logic: Logical Data Model Human Resources Analysis Module ReferenceB
154 Business hierarchies © 2010 MicroStrategy, Inc.
Street
Zip Code
Birth Date
Hire Date
Form Form Expression Lookup Table Other Tables
ID EMP_STREET R_EMP_ADDRESS None
Children Parents Relationship Type Table
Employee None One-to-many R_EMP_ADDRESS
Form Form Expression Lookup Table Other Tables
ID EMP_ZIP R_EMP_ADDRESS None
Children Parents Relationship Type Table
Employee None One-to-many R_EMP_ADDRESS
Form Form Expression Lookup Table Other Tables
ID EMP_BIRTH_DATE L_EMPLOYEE None
Children Parents Relationship Type Table
Employee None One-to-many L_EMPLOYEE
Form Form Expression Lookup Table Other Tables
ID HIRE_DATE L_EMPLOYEE None
Children Parents Relationship Type Table
Employee None One-to-many L_EMPLOYEE

Human Resources Analysis Module Reference Structure of HRAM’s Business Logic: Logical Data Model B
© 2010 MicroStrategy, Inc. Business hierarchies 155
Leave Date
Department
Previous Department
Form Form Expression Lookup Table Other Tables
ID LEAVE_DATE L_EMPLOYEE None
Children Parents Relationship Type Table
Employee None One-to-many L_EMPLOYEE
Form Form Expression Lookup Table Other Tables
ID EMP_DPTM_ID, LAST_DPTM_ID, CNTR_DPTM_ID
L_EMP_DPTM, F_EMP_PREV_HIST, L_CONTRACTOR
F_EMP_HIST, F_SURVEY, F_PLAN, L_EMPLOYEE
DESC EMP_DPTM_DESC L_EMP_DPTM None
Children Parents Relationship Type Table
Contractor None One-to-many L_CONTRACTOR
Employee, Month
None One-to-many F_EMP_HIST
None Division Many-to-one L_EMP_DPTM
Form Form Expression Lookup Table Other Tables
ID EMP_DPTM_ID, LAST_DPTM_ID
L_LAST_DPTM, F_EMP_HIST
None
DESC EMP_DPTM_DESC L_LAST_DPTM None
Children Parents Relationship Type Table
Employee None One-to-many F_EMP_HIST
None Previous Division
Many-to-one L_LAST_DPTM

Structure of HRAM’s Business Logic: Logical Data Model Human Resources Analysis Module ReferenceB
156 Business hierarchies © 2010 MicroStrategy, Inc.
Division
Previous Division
Location
Form Form Expression Lookup Table Other Tables
ID EMP_DIVISION_ID L_EMP_DIVISION L_EMP_DPTM
DESC EMP_DIVISION_DESC L_EMP_DIVISION None
Children Parents Relationship Type Table
Department None One-to-many L_EMP_DPTM
Form Form Expression Lookup Table Other Tables
ID EMP_DIVISION_ID L_LAST_DIVISION L_LAST_DPTM
DESC EMP_DIVISION_DESC L_LAST_DIVISION None
Children Parents Relationship Type Table
Previous Department
None One-to-many L_LAST_DPTM
Form Form Expression Lookup Table Other Tables
ID EMP_LOCATION_ID, LAST_LOCATION_ID, CNTR_ LOCATION_ID
L_EMP_LOCATION, F_EMP_PREV_HIST, L_CONTRACTOR
F_EMP_HIST, F_PLAN, L_EMPLOYEE
DESC EMP_DPTM_DESC L_EMP_LOCATION None
Children Parents Relationship Type Table
Contractor None One-to-many L_CONTRACTOR
Employee, Month
None One-to-many F_EMP_HIST
None Region Many-to-one L_EMP_LOCATION

Human Resources Analysis Module Reference Structure of HRAM’s Business Logic: Logical Data Model B
© 2010 MicroStrategy, Inc. Business hierarchies 157
Previous Location
Region
Previous Region
Form Form Expression Lookup Table Other Tables
ID EMP_LOCATION_ID, LAST_LOCATION_ID
L_LAST_LOCATION, F_EMP_HIST
None
DESC LAST_LOCATION_ DESC
L_LAST_LOCATION None
Children Parents Relationship Type Table
Employee None One-to-many F_EMP_HIST
None Previous Region
Many-to-one L_LAST_LOCATION
Form Form Expression Lookup Table Other Tables
ID EMP_REGION_ID L_EMP_REGION L_EMP_ LOCATION
DESC EMP_REGION _DESC L_EMP_REGION None
Children Parents Relationship Type Table
Location None One-to-many L_EMP_LOCATION
Form Form Expression Lookup Table Other Tables
ID EMP_REGION_ID L_LAST_REGION L_LAST_ LOCATION
DESC EMP_REGION _DESC L_LAST_REGION None
Children Parents Relationship Type Table
Location None One-to-many L_LAST_LOCATION

Structure of HRAM’s Business Logic: Logical Data Model Human Resources Analysis Module ReferenceB
158 Business hierarchies © 2010 MicroStrategy, Inc.
Age Range
Degree Type
Education
Form Form Expression Lookup Table Other Tables
ID EMP_AGE_RNG_ID L_EMP_AGE_RANGE R_EMP_DEMO
DESC EMP_AGE_RNG_ DESC
L_EMP_AGE_RANGE None
Children Parents Relationship Type Table
Employee None One-to-many R_EMP_DEMO
Form Form Expression Lookup Table Other Tables
ID EMP_DGR_TYPE_ID L_EMP_DGR_TYPE R_EMP_DEMO
DESC EMP_DGR_TYPE_ DESC
L_EMP_DGR_TYPE None
Children Parents Relationship Type Table
Employee None One-to-many R_EMP_DEMO
Form Form Expression Lookup Table Other Tables
ID EMP_EDU_ID L_EMP_EDU R_EMP_DEMO
DESC EMP_EDU_ID L_EMP_EDU None
Children Parents Relationship Type Table
Employee None One-to-many R_EMP_DEMO

Human Resources Analysis Module Reference Structure of HRAM’s Business Logic: Logical Data Model B
© 2010 MicroStrategy, Inc. Business hierarchies 159
Ethnicity
Gender
Marital Status
Form Form Expression Lookup Table Other Tables
ID EMP_ETHN_ID L_EMP_ETHNICITY R_EMP_DEMO
DESC EMP_ETHN_DESC L_EMP_ETHNICITY None
Children Parents Relationship Type Table
Employee None One-to-many R_EMP_DEMO
Form Form Expression Lookup Table Other Tables
ID EMP_GENDER_ID L_EMP_GENDER R_EMP_DEMO
DESC EMP_GENDER_DESC L_EMP_GENDER None
Children Parents Relationship Type Table
Employee None One-to-many R_EMP_DEMO
Form Form Expression Lookup Table Other Tables
ID EMP_MRTL_STS_ID L_EMP_MRTL_STS R_EMP_DEMO
DESC EMP_MRTL_STS_ DESC
L_EMP_MRTL_STS None
Children Parents Relationship Type Table
Employee None One-to-many R_EMP_DEMO

Structure of HRAM’s Business Logic: Logical Data Model Human Resources Analysis Module ReferenceB
160 Business hierarchies © 2010 MicroStrategy, Inc.
Nationality
Clearance
Exempt Status
Form Form Expression Lookup Table Other Tables
ID EMP_NTNLTY_ID L_EMP_NTNLTY R_EMP_DEMO
DESC EMP_NTNLTY_DESC L_EMP_NTNLTY None
Children Parents Relationship Type Table
Employee None One-to-many R_EMP_DEMO
Form Form Expression Lookup Table Other Tables
ID EMP_CLEARANCE_ID L_CLEARANCE L_EMPLOYEE
DESC EMP_CLEARANCE_DESC L_CLEARANCE None
Children Parents Relationship Type Table
Employee None One-to-many L_EMPLOYEE
Form Form Expression Lookup Table Other Tables
ID EXEMPT_FLG L_EMPLOYEE None
Children Parents Relationship Type Table
Employee None One-to-many L_EMPLOYEE

Human Resources Analysis Module Reference Structure of HRAM’s Business Logic: Logical Data Model B
© 2010 MicroStrategy, Inc. Business hierarchies 161
Current Status
Historical Status
ID
Immigration Status
Form Form Expression Lookup Table Other Tables
ID EMP_CURR_STS_ID, EMP_STS_ID
L_EMPLOYEE; L_EMP_STS_HIST
None
DESC EMP_STS_DESC L_EMP_STS_HIST None
Children Parents Relationship Type Table
Employee None One-to-many L_EMPLOYEE
Form Form Expression Lookup Table Other Tables
ID EMP_STS_ID L_EMP_STS F_EMP_HIST
DESC EMP_STS_DESC L_EMP_STS None
Form Form Expression Lookup Table Other Tables
ID EMP_ID_N L_EMPLOYEE L_EMPLOYEE
Children Parents Relationship Type Table
Employee None One to one L_EMPLOYEE
Form Form Expression Lookup Table Other Tables
ID EMP_IMM_STS_ID L_EMP_IMM_STS L_EMPLOYEE
DESC EMP_IMM_STS_DESC L_EMP_IMM_STS None
Children Parents Relationship Type Table
Employee None One-to-many L_EMPLOYEE

Structure of HRAM’s Business Logic: Logical Data Model Human Resources Analysis Module ReferenceB
162 Business hierarchies © 2010 MicroStrategy, Inc.
Minority Group
Position Status
Recruiting Source
Form Form Expression Lookup Table Other Tables
ID EMP_MNRTY_GRP_ ID
L_EMP_MNRTY_GRP L_EMPLOYEE
DESC EMP_MNRTY_GRP_ DESC
L_EMP_MNRTY_GRP None
Children Parents Relationship Type Table
Employee None One-to-many L_EMPLOYEE
Form Form Expression Lookup Table Other Tables
ID EMP_PSTN_STS_ID L_EMP_PSTN_STS L_EMPLOYEE
DESC EMP_PSTN_STS_ DESC
L_EMP_PSTN_STS None
Children Parents Relationship Type Table
Employee None One-to-many L_EMPLOYEE
Form Form Expression Lookup Table Other Tables
ID RCRTNG_SOURCE_ ID
L_RCRTNG_SOURCE L_EMPLOYEE
DESC RCRTNG_SOURCE_ DESC
L_RCRTNG_SOURCE None
Children Parents Relationship Type Table
Employee None One-to-many L_EMPLOYEE

Human Resources Analysis Module Reference Structure of HRAM’s Business Logic: Logical Data Model B
© 2010 MicroStrategy, Inc. Business hierarchies 163
Supervisor
Title
Work Experience (Years)
Form Form Expression Lookup Table Other Tables
ID SUPERVISOR_IDEMPLOYEE_ID
L_EMPLOYEE,L_EMP_SUPERVISOR
None
DESC EMPLOYEE_DESC L_EMP_SUPERVISOR None
Children Parents Relationship Type Table
Employee None One-to-many L_EMPLOYEE
Form Form Expression Lookup Table Other Tables
ID EMP_TITLE_ID, CNTR_TILE_ID
L_EMP_TITLEL_CONTRACTOR
L_EMPLOYEE
DESC EMP_TITLE_DESC L_EMP_TITLE None
Children Parents Relationship Type Table
Employee None One-to-many L_EMPLOYEE
Form Form Expression Lookup Table Other Tables
ID EMP_WORK_EXP L_EMPLOYEE None
Children Parents Relationship Type Table
Employee None One-to-many L_EMPLOYEE

Structure of HRAM’s Business Logic: Logical Data Model Human Resources Analysis Module ReferenceB
164 Business hierarchies © 2010 MicroStrategy, Inc.
Department Transfer
Location Transfer
Contractor hierarchy
The Contractor hierarchy is available within the Employee hierarchy. In HRAM, the Contractor hierarchy shares the following parents with Employee:
• Department
• Division
• Location
• Region
• Title
Form Form Expression Lookup Table Other Tables
ID DPTM_TRANSFER_FLG F_EMP_HIST F_EMP_PREV_ HIST
Children Parents Relationship Type Table
Employee None One-to-many L_EMPLOYEE
Form Form Expression Lookup Table Other Tables
ID LOC_TRANSFER_FLG F_EMP_HIST F_EMP_PREV_ HIST
Children Parents Relationship Type Table
Employee None One-to-many L_EMPLOYEE

Human Resources Analysis Module Reference Structure of HRAM’s Business Logic: Logical Data Model B
© 2010 MicroStrategy, Inc. Business hierarchies 165
In other scenarios, the Contractor hierarchy can also share other parents with Employee, such as Supervisor. The attributes and relationships in the following figure represent the Contractor hierarchy.
The detailed definition of each attribute in the MicroStrategy metadata listed previously is shown in the following tables.
Attribute Description Example
Contractor Individual working for the company under a time-term contract, receiving salary in return.
John Smith
Department Contractor's department. Production Consulting, Pre-sales Consulting
Division Contractor's division. Administration, Consulting
Location Contractor's work site. Washington DC
Region Contractor's region. Virginia
Contract Activity Status
Status of the contract.• Active• Inactive (terminated or expired)
Active, Inactive
Title Contractor's job title. Consultant, Product Manager, Program Manager, and so on
Contract Start Date Contract start date. 12/24/2002
Contract Expiration Date
Contract end date. 12/24/2003

Structure of HRAM’s Business Logic: Logical Data Model Human Resources Analysis Module ReferenceB
166 Business hierarchies © 2010 MicroStrategy, Inc.
Contractor
Contract Activity
Form Form Expression Lookup Table Other Tables
ID CONTRACTOR_ID L_CONTRACTOR None
DESC CONTRACTOR_DESC L_CONTRACTOR None
Children Parents Relationship Type Table
None Contractor Activity Many-to-one L_CONTRACTOR
None Contract Expiration Date
Many-to-one L_CONTRACTOR
None Contract Start Date
Many-to-one L_CONTRACTOR
None Contract End Date Many-to-one L_CONTRACTOR
None Department Many-to-one L_CONTRACTOR
None Location Many-to-one L_CONTRACTOR
Form Form Expression Lookup Table Other Tables
ID EMP_STS_IDCNTR_ACTIVITY
L_CNTR_STSL_CONTRACTOR
None
DESC EMP_STS_DESC L_CNTR_STS None
Children Parents Relationship Type Table
Contractor None One-to-many L_CONTRACTOR

Human Resources Analysis Module Reference Structure of HRAM’s Business Logic: Logical Data Model B
© 2010 MicroStrategy, Inc. Business hierarchies 167
Contract Expiration Date
Contract Start Date
Compensation hierarchy
This hierarchy represents the types of monetary compensation paid to employees. This hierarchy consists of a single attribute.
The detailed definition of the attribute in the MicroStrategy metadata listed previously is shown in the following table.
Form Form Expression Lookup Table Other Tables
ID CONTRACT_END_DATE L_CONTRACTOR None
Children Parents Relationship Type Table
Contractor None One-to-many L_CONTRACTOR
Form Form Expression Lookup Table Other Tables
ID CONTRACT_START_DATE L_CONTRACTOR None
Children Parents Relationship Type Table
Contractor None One-to-many L_CONTRACTOR
Attribute Description Example
Compensation Item
Type of monetary compensation given to the employee per month. See examples for typical values for this attribute.
Base salary, regular bonus, allowance, and so on.

Structure of HRAM’s Business Logic: Logical Data Model Human Resources Analysis Module ReferenceB
168 Business hierarchies © 2010 MicroStrategy, Inc.
Compensation Item
Benefit hierarchy
This hierarchy represents the benefits available to employees. The attributes and relationships in the following figure represent the Benefit hierarchy.
The detailed definition of each attribute in the MicroStrategy metadata listed previously is shown in the following tables.
Form Form Expression Lookup Table Other Tables
ID COMP_TYPE_ID L_COMP_TYPE F_COMP_MONTH
DESC COMP_TYPE_DESC L_COMP_TYPE None
Attribute Description Example
Benefit Type General type of benefit offered to employees; see the examples for typical values of the different benefit types.
1. Health Care2. Insurance3. Time Off4. FSA
Benefit Specific benefit offered to employees; see the examples for typical values for this sub-type.
1. Dental, prescription2. Life insurance, disability insurance3. Number of vacation days, number of sick days, and so on.

Human Resources Analysis Module Reference Structure of HRAM’s Business Logic: Logical Data Model B
© 2010 MicroStrategy, Inc. Business hierarchies 169
Benefit
Benefit Type
Position hierarchy
This hierarchy represents the open positions available. For common attributes, it can be built using the structure used in Employee. The attributes and relationships in the following figure represent the Position hierarchy.
Form Form Expression Lookup Table Other Tables
ID BENEFIT_ID L_BENEFIT F_BENEFIT_QTR
DESC BENEFIT_DESC L_BENEFIT None
Children Parents Relationship Type Table
None Benefit Type Many-to-one L_BENEFIT
Form Form Expression Lookup Table Other Tables
ID BENEFIT_TYPE_ID L_BENEFIT_TYPE L_BENEFIT
DESC BENEFIT_TYPE_DESC L_BENEFIT_TYPE None
Children Parents Relationship Type Table
Benefit None One-to-many L_BENEFIT

Structure of HRAM’s Business Logic: Logical Data Model Human Resources Analysis Module ReferenceB
170 Business hierarchies © 2010 MicroStrategy, Inc.
The detailed definition of each attribute in the MicroStrategy metadata listed previously is shown in the following tables.
Attribute Description Example
Position Can be vacant or occupied; one or more employees can be assigned to a position.A copy of L_EMP_TITLE can be used as a lookup table.
Programmer, head of marketing
Job Open Reason
Reason related to a job opening; parent of Job Code. New, backfill, backfill from transfer
Transfer Out Name of transferred employee, if position is open due to transfer.
John Smith
Job Close Reason
Reason related to a job closing; parent of Job Code. Transfer, obsolete
Transfer In Name of transferred employee, if position is closed due to transfer.
John Smith
Job Code When a position is vacant, a job code is associated with it; when the recruitment starts, an open date is also established.
1234, 4567
Job Department
Department in which the vacant position corresponding to the job code is open; parent of Job Code.
Finance, marketing
Job Location Location where the vacant position corresponding to the job code is open; parent of Job Code.
New York, Washington, Boston
Job Clearance Clearance necessary to perform the duties of the vacant position corresponding to the job code; parent of Job Code.
Secret, top secret
Job Work Experience
Number of years of experience necessary to perform the duties of the vacant position corresponding to the job code; parent of Job Code.
2, 5, and so on.
Job Open Date Date on which the position advertisement begins.The attribute’s relationship is one to one with Job Code.
12/12/02
Job Close Date
Date on which the position advertisement is ended (when the position becomes obsolete or is filled).The attribute’s relationship is one to one with Job Code.
1/1/03

Human Resources Analysis Module Reference Structure of HRAM’s Business Logic: Logical Data Model B
© 2010 MicroStrategy, Inc. Business hierarchies 171
Job Code
Job Clearance
Form Form Expression Lookup Table Other Tables
ID JOB_CODE_ID L_JOB_CODE F_POSITION
Children Parents Relationship Type Table
None Job Clearance Many-to-one L_JOB_CODE
None Job Close Reason Many-to-one L_JOB_CODE
None Job Close Date One-to-one L_JOB_CODE
None Job Open Date One-to-one L_JOB_CODE
None Job Open Reason Many-to-one L_JOB_CODE
None Job Department Many-to-one L_JOB_CODE
None Job Location Many-to-one L_JOB_CODE
None Position Many-to-one L_JOB_CODE
None Job Work Experience Many-to-one L_JOB_CODE
Form Form Expression Lookup Table Other Tables
ID EMP_CLEARANCE_IDJOB_CLEARANCE_ID
L_JOB_CLEARANCEL_JOB_CODE
None
DESC EMP_CLEARANCE_ DESC
L_JOB_CLEARANCE None
Children Parents Relationship Type Table
Job Code Job Clearance One-to-many L_JOB_CODE

Structure of HRAM’s Business Logic: Logical Data Model Human Resources Analysis Module ReferenceB
172 Business hierarchies © 2010 MicroStrategy, Inc.
Job Close Date
Job Open Date
Job Department
Form Form Expression Lookup Table Other Tables
ID JOB_CLOSE_DATE L_JOB_CODE None
Children Parents Relationship Type Table
Job Code None One-to-one L_JOB_CODE
Form Form Expression Lookup Table Other Tables
ID JOB_OPEN_DATE L_JOB_CODE None
Children Parents Relationship Type Table
Job Code None One-to-one L_JOB_CODE
Form Form Expression Lookup Table Other Tables
ID JOB_DPTM_ID, EMP_DPTM_ID
L_JOB_CODEL_JOB_DPTM
None
DESC EMP_DPTM_DESC L_JOB_DPTM None
Children Parents Relationship Type Table
Job Code None One-to-many L_JOB_CODE

Human Resources Analysis Module Reference Structure of HRAM’s Business Logic: Logical Data Model B
© 2010 MicroStrategy, Inc. Business hierarchies 173
Job Location
Job Work Experience
Position
Form Form Expression Lookup Table Other Tables
ID JOB_LOCATION_ID, EMP_LOCATION_ID
L_JOB_CODEL_JOB_LOCATION
None
DESC EMP_LOCATION_DESC L_JOB_LOCATION None
Children Parents Relationship Type Table
Job Code None One-to-many L_JOB_CODE
Form Form Expression Lookup Table Other Tables
ID JOB_WORK_EXP L_JOB_CODE None
Children Parents Relationship Type Table
Job Code None One-to-many L_JOB_CODE
Form Form Expression Lookup Table Other Tables
ID POSITION_ID L_POSITION L_JOB_CODE
DESC POSITION_DESC L_POSITION None
Children Parents Relationship Type Table
Job Code None One-to-many L_JOB_CODE

Structure of HRAM’s Business Logic: Logical Data Model Human Resources Analysis Module ReferenceB
174 Business hierarchies © 2010 MicroStrategy, Inc.
Job Open Reason
Job Close Reason
Time Off hierarchy
This hierarchy represents the different types of time off that an employee can accrue and use. This hierarchy consists of a single attribute.
The detailed definition of the attribute in the MicroStrategy metadata listed previously is shown in the following table.
Form Form Expression Lookup Table Other Tables
ID JOB_OPEN_RSN_ ID
L_JOB_OPEN_RSN L_JOB_CODE
DESC JOB_OPEN_RSN_ DESC
L_JOB_OPEN_RSN None
Children Parents Relationship Type Table
Job Code None One-to-many L_JOB_CODE
Form Form Expression Lookup Table Other Tables
ID JOB_CLOSE_RSN_ ID
L_JOB_CLOSE_RSN L_JOB_CODE
DESC JOB_CLOSE_RSN_ DESC
L_JOB_CLOSE_RSN None
Children Parents Relationship Type Table
Job Code None One-to-many L_JOB_CODE
Attribute Description Example
Time Off Type Employee's type of time off. Vacation, sick, unpaid leave, and so on.

Human Resources Analysis Module Reference Structure of HRAM’s Business Logic: Logical Data Model B
© 2010 MicroStrategy, Inc. Business hierarchies 175
Time Off Type
Survey Field hierarchy
This hierarchy represents the survey questions (fields) that an employee is asked to respond to. This hierarchy consists of a single attribute.
The detailed definition of the attribute in the MicroStrategy metadata listed previously is shown in the following table.
Survey Field
Qualification hierarchy
For HRAM, this hierarchy represents the different job qualifications related to vacant positions. More detailed analysis can be done with this hierarchy,
Form Form Expression Lookup Table Other Tables
ID TIME_OFF_TYPE_ID L_TIME_OFF_TYPE F_TIME_OFF
DESC TIME_OFF_TYPE_ DESC
L_TIME_OFF_TYPE None
Attribute Description Example
Survey Field Set of company characteristics on which the employee is asked to give a satisfaction score; they can be accompanied by a description.
Work atmosphere, quality of work, salary
Form Form Expression Lookup Table Other Tables
ID SURVEY_FIELD_ID L_SURVEY_FIELDS None
DESC SURVEY_FIELD_DESC L_SURVEY_FIELDS None

Structure of HRAM’s Business Logic: Logical Data Model Human Resources Analysis Module ReferenceB
176 Business hierarchies © 2010 MicroStrategy, Inc.
depending on specific customer needs. The attributes and relationships in the following figure represent the Qualification hierarchy.
The detailed definition of each attribute in the MicroStrategy metadata listed previously is shown in the following tables.
Qualification Type
Attribute Description Example
Qualification Type
Type of qualification; parent of Qualification. Programming, Languages
Qualification A specific qualification; child of qualification type and parent of Employee.
Programming Fundamentals, Advanced Programming
Form Form Expression Lookup Table Other Tables
ID QLFN_TYPE_ID L_QLFN_TYPE L_QLFN
DESC QLFN__TYPEDESC L_QLFN_TYPE None
Children Parents Relationship Type Table
Qualification None One-to-many L_QLFN

Human Resources Analysis Module Reference Structure of HRAM’s Business Logic: Logical Data Model B
© 2010 MicroStrategy, Inc. Business hierarchies 177
Qualification
Leave Reason hierarchy
This hierarchy represents an employee’s reason for leaving the company or the reason for employee termination. This hierarchy includes both voluntary and involuntary end-of-employment reasons. This hierarchy consists of a single attribute.
The detailed definition of the attribute in the MicroStrategy metadata listed previously is shown in the following table.
Leave Reason
Form Form Expression Lookup Table Other Tables
ID QLFN_ID L_QLFN F_EMP_QLFN
DESC QLFN_DESC L_QLFN None
Children Parents Relationship Type Table
None Qualification Type Many-to-one L_QLFN
Attribute Description Example
Leave Reason
Reason why the employee left the company; for voluntary end-of-employment, more details may be obtained though an exit interview.
Retirement, RIF, better career opportunity, personal/family reasons, relocation, and so on.
Form Form Expression Lookup Table Other Tables
ID LEAVE_RSN_ID L_LEAVE_RSN L_EMPLOYEE
DESC LEAVE_RSN_DESC L_LEAVE_RSN None

Structure of HRAM’s Business Logic: Logical Data Model Human Resources Analysis Module ReferenceB
178 Business hierarchies © 2010 MicroStrategy, Inc.
Time hierarchy
This hierarchy represents the calendar time used for tracking employee- and job-related processes. The attributes and relationships in the following figure represent the Time hierarchy.
The detailed definition of each attribute in the MicroStrategy metadata listed previously is shown in the following tables.
Attribute Description Example
Date Calendar date that is used to track the different processes and also used for entries in to the general ledger.
01/01/03
Month Calendar month. Jan 2003
Quarter A period of 3 months. Q1 2003
Year Calendar year. 2002, 2003

Human Resources Analysis Module Reference Structure of HRAM’s Business Logic: Logical Data Model B
© 2010 MicroStrategy, Inc. Business hierarchies 179
Date
Month
Quarter
Form Form Expression Lookup Table Other Tables
ID DATE_ID L_CAL_DATE F_EMP_QLFN
Children Parents Relationship Type Table
None Month Many-to-one L_CAL_DATE
Form Form Expression Lookup Table Other Tables
ID MONTH_ID L_CAL_MONTH L_CAL_DATE, F_POSITION, F_EMP_HIST
DESC MONTH_DESC L_CAL_MONTH None
Children Parents Relationship Type Table
Date None One-to-many L_CAL_DATE
None Quarter Many-to-one L_CAL_MONTH
Form Form Expression Lookup Table Other Tables
ID QTR_ID L_CAL_QTR L_CAL_DATE, L_CAL_MONTH, F_BENEFIT_QTR
DESC QTR_DESC L_CAL_QTR None
Children Parents Relationship Type Table
Month None One-to-many L_CAL_MONTH
None Year Many-to-one L_CAL_QTR

Structure of HRAM’s Business Logic: Logical Data Model Human Resources Analysis Module ReferenceB
180 Facts © 2010 MicroStrategy, Inc.
Year
FactsThis section describes the facts used in HRAM.
The main facts groups are:
• Headcounts: Number of employees, number of voluntarily departed employees, number of involuntarily departed employees, attrition rate, hiring rate, number of new employees or new hires
• Position: Number of vacancies, number of resumes received, number of interviewed candidates, number of offers sent, number of offers accepted, number of offers rejected
• Compensation: Compensation cost, compensation cost contribution, average compensation cost, salary, bonus, overtime cost, planned compensation
• Benefits: Company cost, employee cost, number of participants, number of enrolled employees, participation rate, average company cost per enrolled employee
• Time Off: Number of accrued days, number of used days, number of available days, open days or number of days to fill position
Form Form Expression Lookup Table Other Tables
ID YEAR_ID L_CAL_YEAR L_CAL_DATE, L_CAL_MONTH, L_CAL_QTR, F_SURVEY, F_PERF, F_EMP_LEVEL, F_COMP, F_BONUS_PTNTL
Children Parents Relationship Type Table
Quarter None One-to-many L_CAL_QTR

Human Resources Analysis Module Reference Structure of HRAM’s Business Logic: Logical Data Model B
© 2010 MicroStrategy, Inc. Facts 181
• Qualifications: Number of qualified employees, qualification level
• Performance Score, Tenure, Satisfaction Score
For additional details, see the MicroStrategy project definitions in the Schema Objects\Attributes and Schema Objects\Facts folders. Double-click any attribute or fact to view definitions, properties, source tables, and so on.
Employee, Level, and Contractor facts
FTE Coefficient
This fact is used to calculate the number of Full Time Equivalents.
Fact: FTE Coefficient
Comment: None
Definition:
Tenure
This fact is used to calculate the maximum tenure of departed employees.
Fact: Tenure
Comment: None
Definition:
Department Transfer
Expression Mapping Method Source Table Name
EMP_FTE_COEF Automatic L_EMPLOYEE
Expression Mapping Method Source Table Name
SENIORITY Automatic F_EMP_HIST

Structure of HRAM’s Business Logic: Logical Data Model Human Resources Analysis Module ReferenceB
182 Facts © 2010 MicroStrategy, Inc.
This fact is used to calculate the total number of department transfers.
Fact: Department Transfer
Comment: None
Definition:
Location Transfer
This fact is used to calculate the total number of location transfers.
Fact: Location Transfer
Comment: None
Definition:
Birth Date
Birth Date, Hire Date, and Leave Date are useful as functions arguments.
Fact: Birth Date
Comment: None
Definition:
Hire Date
Birth Date, Hire Date, and Leave Date are useful as functions arguments.
Expression Mapping Method Source Table Name
DPTM_TRANSFER_FLG Automatic F_EMP_HIST
Expression Mapping Method Source Table Name
LOC_TRANSFER_FLG Automatic F_EMP_HIST
Expression Mapping Method Source Table Name
EMP_BIRTH_DATE Automatic L_EMPLOYEE

Human Resources Analysis Module Reference Structure of HRAM’s Business Logic: Logical Data Model B
© 2010 MicroStrategy, Inc. Facts 183
Fact: Hire Date
Comment: None
Definition:
Leave Date
Birth Date, Hire Date, and Leave Date are useful as functions arguments.
Fact: Leave Date
Comment: None
Definition:
Salary Rate
The Salary Rate, Contract Start Date, and Contract End Date facts are typical elements of an employee contract.
Fact: Salary Rate
Comment: None
Definition:
Contract Start Date
The Salary Rate, Contract Start Date, and Contract End Date facts are typical elements of an employee contract.
Expression Mapping Method Source Table Name
HIRE_DATE Automatic L_EMPLOYEE
Expression Mapping Method Source Table Name
LEAVE_DATE Automatic L_EMPLOYEE
Expression Mapping Method Source Table Name
SALARY_RATE Automatic L_CONTRACTOR

Structure of HRAM’s Business Logic: Logical Data Model Human Resources Analysis Module ReferenceB
184 Facts © 2010 MicroStrategy, Inc.
Fact: Contract Start Date
Comment: None
Definition:
Contract End Date
The Salary Rate, Contract Start Date, and Contract End Date facts are typical elements of an employee contract.
Fact: Contract End Date
Comment: None
Definition:
Level Industry Mode
The Level Industry Mode, Level Max Salary, and Level Min Salary facts are used to compare actual employee salaries to market salaries.
Fact: Level Industry Mode
Comment: None
Definition:
Expression Mapping Method Source Table Name
CONTRACT_START_DATE
Automatic L_CONTRACTOR
Expression Mapping Method Source Table Name
CONTRACT_END_DATE Automatic L_CONTRACTOR
Expression Mapping Method Source Table Name
LEVEL_IND_STD Automatic F_EMP_LEVEL

Human Resources Analysis Module Reference Structure of HRAM’s Business Logic: Logical Data Model B
© 2010 MicroStrategy, Inc. Facts 185
Level Max Salary
The Level Industry Mode, Level Max Salary, and Level Min Salary facts are used to compare actual employee salaries to market salaries.
Fact: Level Max Salary
Comment: None
Definition:
Level Min Salary
The Level Industry Mode, Level Max Salary, and Level Min Salary facts are used to compare actual employee salaries to market salaries.
Fact: Level Min Salary
Comment: None Definition:
Compensation facts
Compensation Cost
The Compensation Cost amount is calculated as the sum of the fact COMP_AMT, stored at Compensation Type, Month, and Employee Level.
Fact: Compensation Cost
Comment: None
Expression Mapping Method Source Table Name
LEVEL_MAX_SALARY Automatic F_EMP_LEVEL
Expression Mapping Method Source Table Name
LEVEL_MIN_SALARY Automatic F_EMP_LEVEL

Structure of HRAM’s Business Logic: Logical Data Model Human Resources Analysis Module ReferenceB
186 Facts © 2010 MicroStrategy, Inc.
Definition:
Annual Salary
The Annual Salary is available in another fact table, at Employee level and Year level.
Fact: Compensation Cost
Comment: None Definition:
Bonus Potential
The Bonus Potential is available in another fact table, at Employee level and Year level.
Fact: Bonus Potential
Comment: None
Definition:
Expression Mapping Method Source Table Name
COMP_AMT Automatic F_COMP_MONTH
Expression Mapping Method Source Table Name
ANNUAL_SALARY_AMT Automatic F_BONUS_PTNTL
Expression Mapping Method Source Table Name
BONUS_PTNTL_AMT Automatic F_BONUS_PTNTL

Human Resources Analysis Module Reference Structure of HRAM’s Business Logic: Logical Data Model B
© 2010 MicroStrategy, Inc. Facts 187
Benefit and Time Off facts
Company Cost
The cost of benefits to both the company (Company Cost) and the employee (Employee Cost) are stored in F_BENEFIT, along with the Number of Participants, associated with each employee.
Fact: Company Cost
Comment: None Definition:
Employee Cost
The cost of benefits to both the company (Company Cost) and the employee (Employee Cost) are stored in F_BENEFIT, along with the Number of Participants, associated with each employee.
Fact: Employee Cost
Comment: None
Definition:
Number of Participants
The cost of benefits to both the company (Company Cost) and the employee (Employee Cost) are stored in F_BENEFIT, along with the Number of Participants, associated with each employee.
Fact: Number of Participants
Expression Mapping Method Source Table Name
CO_COST_AMT Automatic F_BENEFIT_QTR
Expression Mapping Method Source Table Name
EMP_COST_AMT Automatic F_BENEFIT_QTR

Structure of HRAM’s Business Logic: Logical Data Model Human Resources Analysis Module ReferenceB
188 Facts © 2010 MicroStrategy, Inc.
Comment: None
Definition:
Number of Accrued Days
Facts relevant to Benefit Type with the Time Off value are stored in the fact table F_TIME_OFF.
Fact: Number of Accrued Days
Comment: None
Definition:
Number of Used Days
Facts relevant to Benefit Type with the Time Off value are stored in the fact table F_TIME_OFF.
Fact: Number of Used Days
Comment: None
Definition:
Vacant Positions facts
This section contains the facts defined for open job positions.
Expression Mapping Method Source Table Name
N_PARTICIPANTS Automatic F_BENEFIT_QTR
Expression Mapping Method Source Table Name
N_ACCRUED_DAYS Automatic F_TIME_OFF
Expression Mapping Method Source Table Name
N_USED_DAYS Automatic F_TIME_OFF

Human Resources Analysis Module Reference Structure of HRAM’s Business Logic: Logical Data Model B
© 2010 MicroStrategy, Inc. Facts 189
Number of Received Resumes
Fact: Number of Received Resumes
Comment: None
Definition:
Number of Interviewed Candidates
Fact: Number of Interviewed Candidates
Comment: None
Definition:
Number of Sent Offers
Fact: Number of Sent Offers
Comment: None
Definition:
Number of Accepted Offers
Fact: Number of Accepted Offers
Comment: None
Expression Mapping Method Source Table Name
N_REC_RESUMES Automatic F_POSITION
Expression Mapping Method Source Table Name
N_INTERVIEWED Automatic F_POSITION
Expression Mapping Method Source Table Name
N_SENT_OFFERS Automatic F_POSITION

Structure of HRAM’s Business Logic: Logical Data Model Human Resources Analysis Module ReferenceB
190 Facts © 2010 MicroStrategy, Inc.
Definition:
Number of Rejected Offers
Fact: Number of Rejected Offers
Comment: None
Definition:
Job Open Date
Fact: Job Open Date
Comment: None
Definition:
Job Close Date
Fact: Job Close Date
Comment: None
Definition:
Expression Mapping Method Source Table Name
N_ACCPTD_OFFERS Automatic F_POSITION
Expression Mapping Method Source Table Name
N_RJCTD_OFFERS Automatic F_POSITION
Expression Mapping Method Source Table Name
JOB_OPEN_DATE Automatic L_JOB_CODE
Expression Mapping Method Source Table Name
JOB_CLOSE_DATE Automatic L_JOB_CODE

Human Resources Analysis Module Reference Structure of HRAM’s Business Logic: Logical Data Model B
© 2010 MicroStrategy, Inc. Facts 191
Qualification Level, Performance, and Satisfaction Score facts
The Employee Performance Score and Employee Satisfaction Score are stored by Year Level in two different fact tables.
Qualification Level
Fact: Qualification Level
Comment: None
Definition:
Employee Performance Score
Fact: Employee Performance Score
Comment: None
Definition:
Employee Satisfaction Score
Fact: Employee Satisfaction Score
Comment: None
Definition:
Expression Mapping Method Source Table Name
QLFN_LEVEL_ID Automatic F_QLFN_LEVEL
Expression Mapping Method Source Table Name
EMP_PRF_SCORE_ID Automatic F_PERF
Expression Mapping Method Source Table Name
SATISFACTION_SCORE Automatic F_SURVEY

Structure of HRAM’s Business Logic: Logical Data Model Human Resources Analysis Module ReferenceB
192 Facts © 2010 MicroStrategy, Inc.
Survey Count
Fact: Survey Count
Comment: None
Definition:
Table-specific facts
The facts in this section are used to drive the count of employees to a specific table.
L_EMPLOYEE
Fact: L_EMPLOYEE
Comment: None
Definition:
F_EMP_HIST
Fact: F_EMP_HIST
Comment: None
Expression Mapping Method Source Table Name
SURVEY_COUNT Automatic F_SURVEY
Expression Mapping Method Source Table Name
EMPLOYEE_ID Manual L_EMPLOYEE

Human Resources Analysis Module Reference Structure of HRAM’s Business Logic: Logical Data Model B
© 2010 MicroStrategy, Inc. Facts 193
Definition:
F_EMP_PREV_HIST
Fact: F_EMP_PREV_HIST
Comment: None
Definition:
F_OVERTIME
Fact: F_OVERTIME
Comment: None
Definition:
F_EMP_QLFN
Fact: F_EMP_QLFN
Comment: None
Definition:
Expression Mapping Method Source Table Name
EMPLOYEE_ID Manual F_EMP_HIST
Expression Mapping Method Source Table Name
EMPLOYEE_ID Manual F_EMP_PREV_HIST
Expression Mapping Method Source Table Name
EMPLOYEE_ID Manual F_OVERTIME
Expression Mapping Method Source Table Name
EMPLOYEE_ID Manual F_EMP_QLFN

Structure of HRAM’s Business Logic: Logical Data Model Human Resources Analysis Module ReferenceB
194 Facts © 2010 MicroStrategy, Inc.
F_BENEFIT_QTR
Fact: Survey Count
Comment: None
Definition:
Expression Mapping Method Source Table Name
EMPLOYEE_ID Manual F_BENEFIT_QTR

© 2010 MicroStrategy, Inc. Prerequisites 195
CC.DATA STORAGE: PHYSICAL SCHEMA AND DATA DICTIONARY
Introduction
This appendix provides a diagram of the physical schema that comes with the Human Resources Analysis Module (HRAM). This appendix also provides descriptions of all the tables and columns in the default data warehouse, and their purposes.
PrerequisitesThis appendix was written for consultants and developers implementing and customizing the HRAM application, and those building ETL routines to populate the data warehouse. It assumes that you are familiar with basic RDBMS concepts and Erwin data modeling.

Data Storage: Physical Schema and Data Dictionary Human Resources Analysis Module ReferenceC
196 HRAM physical schema © 2010 MicroStrategy, Inc.
HRAM physical schemaThe following diagram is similar to the physical schema shipped with HRAM. The physical schema is available in an Erwin file, located in Program Files\MicroStrategy\Analytics Modules\hram\HRAM.er1.

Human Resources Analysis Module Reference Data Storage: Physical Schema and Data Dictionary C
© 2010 MicroStrategy, Inc. HRAM physical schema 197

Data Storage: Physical Schema and Data Dictionary Human Resources Analysis Module ReferenceC
198 Table information © 2010 MicroStrategy, Inc.
Table informationThis section describes each physical table used in HRAM.
Table Name Table Comment Area
F_BENEFIT_QTR Stores the cost of the benefit component for employer and employees at quarter level. Only employees participating in the benefits are listed in this table.
Benefit
F_BONUS_PTNTL Stores employees' bonus potential and annual salary for every employee and year.
Compensation
F_COMP_MONTH Stores monthly compensation amounts per each compensation type for each employee.
Compensation
F_EMP_HIST Stores historical information for employees at month level. Employee
F_EMP_LEVEL Tracks employee levels by year, with related salary ranges and salary industry mode.
Employee
F_EMP_QLFN Stores information on the employee's qualifications, skills, and skill level.
Qualification
F_OVERTIME Stores the number of extra hours worked per employee per month. Only non-exempt employees with overtime are present in this table.
Overtime
F_PERF Stores the yearly performance scores for each employee. Performance
F_PLAN Stores planned compensation costs and target number of employees at quarter level.
Planning
F_PLAN_EMP_ MONTH
Stores information on the planned headcount by month. Employee
F_POSITION Tracks the details of the hiring process, from resume gathering, to interviewing of candidates, to job offers and job offer acceptance. The history of the job code is tracked from open date to close date.
Position
F_SURVEY Stores the number of returned surveys and the results per year, department, and survey field.
Survey
F_TIME_OFF Tracks the time-off accrued and used by the employees. Only current values are shown.
Time Off
L_BENEFIT Stores the benefit components offered to the employees. Benefit
L_BENEFIT_TYPE Stores all the benefit types offered to the employees. Benefit
L_CAL_DATE Dimension/look-up table for TIME at the Day Level. Time
L_CAL_MONTH Dimension/look-up table for TIME at the Month Level. Time
L_CAL_QTR Dimension/look-up table for TIME at the Quarter Level. Time

Human Resources Analysis Module Reference Data Storage: Physical Schema and Data Dictionary C
© 2010 MicroStrategy, Inc. Table information 199
L_CAL_YEAR Dimension/look-up table for TIME at the Year Level. Time
L_COMP_TYPE Stores all the compensation types or components. Compensation
L_CONTRACTOR Stores information on contractors. Employee
L_EMP_AGE_RANGE Stores the age ranges of employees and needs to be updated from time to time.
Employee
L_EMP_CLEARANCE Stores information on security clearance level of employees. Employee
L_EMP_DGR_TYPE Sores information on the type of education degree of employees.
Employee
L_EMP_DIVISION Stores the divisions in which employees work. Employee
L_EMP_DPTM Includes information on the department to which the employee belongs.
Employee
L_EMP_EDU Stores the information on the type of education of employee. Employee
L_EMP_ETHNICITY Stores information on the ethnicity of employee. Employee
L_EMP_GENDER Stores information on the gender of employee. Employee
L_EMP_IMM_STS Stores information on the immigration status of employee. Employee
L_EMP_LEVEL Stores information on the level of employee. Employee
L_EMP_LOCATION Stores information on the employee’s work location Employee
L_EMP_MNRTY_GRP Tracks the minority group to which some employees might belong. This is useful to match law requirements.
Employee
L_EMP_MRTL_STS Stores the marital status of employees and needs to be updated from time to time.
Employee
L_EMP_NTNLTY Stores information on the nationality of employee. Employee
L_EMP_PSTN_STS Indicates the position status of employee. Employee
L_EMP_REGION Stores the regions in which employees work. Employee
L_EMP_STS Indicates whether the employee is active/hired or inactive/terminated.
Employee
L_EMP_TITLE Includes the title of the employee. Employee
L_EMPLOYEE Lists the individual working for the company who receives salary and benefits in return.
Employee
L_JOB_CLOSE_ RSN
Stores the reasons for closing jobs. Position
L_JOB_CODE Stores all the job codes associated with positions and their open and close dates. Every vacant position will have one associated job code.
Position
Table Name Table Comment Area

Data Storage: Physical Schema and Data Dictionary Human Resources Analysis Module ReferenceC
200 Table column information © 2010 MicroStrategy, Inc.
Table column informationThis section describes each physical table column used in HRAM.
The Data Type column information in the following table reflects an Oracle database-specific format; depending on what database type you use, your data type may appear differently. You can use the Erwin
L_JOB_OPEN_ RSN
Stores the reasons for opening jobs. Position
L_LEAVE_RSN Stores all the reasons for termination. Leave Reason
L_POSITION Stores the information about positions in the company. Position
L_QLFN Stores information on the qualifications or skills available to employees.
Qualification
L_QLFN_TYPE Stores information on the type of qualifications or skills available to employees.
Qualification
L_RCRTNG_ SOURCE
Stores the recruiting sources used to hire new employees. Employee
L_SURVEY_FIELDS Stores all the survey fields. Survey
L_TIME_OFF_TYPE Stores the different types of time off. Time Off
R_EMP_ADDRESS Stores all the details on employee addresses. Employee
R_EMP_DEMO Stores information on the demographic attributes of the employees.
Employee
Table Name Table Comment Area

Human Resources Analysis Module Reference Data Storage: Physical Schema and Data Dictionary C
© 2010 MicroStrategy, Inc. Table column information 201
file (see the HRAM physical schema section above) to easily convert this information to another database type.
Table Name Column Name Data Type Column Comment
F_BENEFIT_ QTR
BENEFIT_ID Numeric (38,0) Unique identifier of the benefit component offered to the employee.
CO_COST_AMT Numeric (15,6) Cost of the benefit component per employee per quarter paid by the employer.
EMP_COST_AMT Numeric (15,6) Cost of the benefit component per quarter paid by the employee.
EMPLOYEE_ID Numeric (38,0) Unique identifier of individual working for the company.
N_PARTICIPANTS Numeric (38,0) Number of participants per employee. The minimum value for this field is 1.
QTR_ID Numeric (38,0) Unique identifier for the quarter. This is a time hierarchy table. The default format for the quarter id is YYYYQ and is stored as an integer.
F_BONUS_ PTNTL
ANNUAL_SALARY_AMT
Numeric (15,6) Annual salary specific to an employee in a certain year.
BONUS_PTNTL_ AMT
Numeric (15,6) Bonus potential specific to an employee in a certain year.
EMPLOYEE_ID Numeric (38,0) Unique identifier of individual working for the company.
YEAR_ID Numeric (38,0) Unique identifier for the year. This is a time hierarchy table. The default format for the year id is YYYY and is stored as an integer.
F_COMP_ MONTH
COMP_AMT Numeric (15,6) Compensation amount monthly paid to the employee.
COMP_TYPE_ID Numeric (38,0) Unique identifier of the compensation type or item
EMPLOYEE_ID Numeric (38,0) Unique identifier of individual working for the company.
MONTH_ID Numeric (38,0) Unique identifier for the month. This is a time hierarchy table. The default format for the month id is YYYYMM and is stored as an integer.

Data Storage: Physical Schema and Data Dictionary Human Resources Analysis Module ReferenceC
202 Table column information © 2010 MicroStrategy, Inc.
F_EMP_ HIST
DPTM_ TRANSFER_FLG
Numeric (38,0) Identifies whether a department transfer occurred for an employee.
EMP_DPTM_ID Numeric (38,0) Unique identifier of the department where the employees work.
EMP_LOCATION_ ID
Numeric (38,0) Unique identifier of the office location of employees.
EMP_STS_ID Numeric (38,0) Unique identifier of the employee status.
EMPLOYEE_ID Numeric (38,0) Unique identifier of an individual working for the company.
LAST_DPTM_ID Numeric (38,0) Unique identifier of the previous departments of the employees.
LAST_LOCATION_ID Numeric (38,0) Unique identifier of the previous locations of employees.
LOC_TRANSFER_FLG
Numeric (38,0) Identifies whether a transfer of location occurred for an employee.
MONTH_ID Numeric (38,0) Unique identifier for the month. This is a time dimension table. The default format for the month id is YYYYMM and is stored as an integer.
SENIORITY Numeric (38,0) Stores the months of seniority for each employee.
F_EMP_ LEVEL
EMP_LEVEL_ID Numeric (38,0) Unique identifier of the employee's level.
LEVEL_IND_STD Numeric (38,0) Indicates the mode of the industry or market standard salary for every employee level.
LEVEL_MAX_ SALARY
Numeric (38,0) Maximum salary given to a specific level of employee.
LEVEL_MIN_ SALARY
Numeric (38,0) Minimum salary given to a specific level of employee.
YEAR_ID Numeric (38,0) Unique identifier for the year. This is a time hierarchy table. The default format for the year id is YYYY and is stored as an integer.
Table Name Column Name Data Type Column Comment

Human Resources Analysis Module Reference Data Storage: Physical Schema and Data Dictionary C
© 2010 MicroStrategy, Inc. Table column information 203
F_EMP_ QLFN
DATE_ID TimeStamp (0) Tracks all the dates in the system. All valid calendar dates for reporting purposes will have to be defined here.
EMPLOYEE_ID Numeric (38,0) Unique identifier of individual working for the company.
QLFN_ID Numeric (38,0) Unique identifier of the employee's qualifications.
QLFN_LEVEL_ID Numeric (38,0) Level or score assigned to an employee with a specific qualification.
F_OVERTIME EMPLOYEE_ID Numeric (38,0) Unique identifier of an individual working for the company.
EXTRA_HOURS Numeric (15,6) Number of extra hours worked per employee per month. Value is obtained by multiplying the number of effective extra hours worked by a chosen coefficient.
MONTH_ID Numeric (38,0) Unique identifier for the month. This is a time hierarchy table. The default format for the month id is YYYYMM and is stored as an integer.
F_PERF EMP_PRF_ SCORE_ID
Numeric (38,0) Performance score assigned to the employee.
EMPLOYEE_ID Numeric (38,0) Unique identifier of an individual working for the company.
YEAR_ID Numeric (38,0) Unique identifier for the year. This is a time dimension table. The default format for the year id is YYYY and is stored as an integer.
F_PLAN EMP_DPTM_ID Numeric (38,0) Unique identifier of the department where employees work.
EMP_LOCATION_ ID
Numeric (38,0) Unique identifier of the office location of employees.
PLANNED_COMP_AMT
Numeric (15,6) Amount planned for employee compensations.
PLANNED_N_ EMP
Numeric (38,0) Target number of employees.
QTR_ID Numeric (38,0) Unique identifier for the quarter. This is a time dimension table. The default format for the quarter id is YYYYQ and is stored as an integer.
Table Name Column Name Data Type Column Comment

Data Storage: Physical Schema and Data Dictionary Human Resources Analysis Module ReferenceC
204 Table column information © 2010 MicroStrategy, Inc.
F_POSITION JOB_CODE_ID Numeric (38,0) Unique identifier of the job.
MONTH_ID Numeric (38,0) Unique identifier for the month. This is a time hierarchy table. The default format for the month id is YYYYMM and is stored as an integer.
N_ACCPTD_ OFFERS
Numeric (38,0) Number of accepted offers.
N_INTERVIEWED Numeric (38,0) Number of interviewed candidates per position.
N_REC_ RESUMES
Numeric (38,0) Number of received resumes per position.
N_RJCTD_ OFFERS
Numeric (38,0) Number of rejected offers.
N_SENT_OFFERS Numeric (38,0) Number of offers sent per position.
F_SURVEY EMP_DPTM_ID Numeric (38,0) Unique identifier of the department to which the employee belongs.
SATISFACTION_ SCORE
Numeric (15,6) Satisfaction score by survey fields, year and department.
SURVEY_COUNT Numeric (38,0) Number of returned surveys. For every returned survey, the number 1 is entered.
SURVEY_FIELD_ ID
Numeric (38,0) Unique identifier of the survey field.
YEAR_ID Numeric (38,0) Unique identifier for the year. This is a time hierarchy table. The default format for the year id is YYYY and is stored as an integer.
SEQ_KEY_ID Numeric Sequential key not used in the project, to ensure no duplicate rows in the table.
F_TIME_OFF EMPLOYEE_ID Numeric (38,0) Unique identifier of individuals working for the company.
N_ACCRUED_ DAYS
Numeric (15,6) Total number of days accrued by the employee. This number can be calculated by multiplying the employee tenure with a company-specific value.
N_USED_DAYS Numeric (15,6) Total number of days used by the employee.
TIME_OFF_TYPE_ID Numeric (38,0) Unique identifier of the type of time off.
Table Name Column Name Data Type Column Comment

Human Resources Analysis Module Reference Data Storage: Physical Schema and Data Dictionary C
© 2010 MicroStrategy, Inc. Table column information 205
F_PLAN_EMP_ MONTH
MONTH_ID Numeric (38,0) Unique identifier for the month. This is a time hierarchy table. The default format for the month id is YYYYMM and is stored as an integer.
PLANNED_N_EM Numeric(38,0) Target number of employees.
L_BENEFIT BENEFIT_DESC VarChar (30) Textual description of the benefit component offered to the employee.
BENEFIT_ID Numeric (38,0) Unique identifier of the benefit component offered to the employee.
BENEFIT_TYPE_ ID
Numeric (38,0) Unique identifier of the type of benefit offered to the employee.
L_BENEFIT_ TYPE
BENEFIT_TYPE_ DESC
VarChar (30) Textual description of the type of benefit offered to the employee.
BENEFIT_TYPE_ ID
Numeric (38,0) Unique identifier of the type of benefit offered to the employee.
L_CAL_DATE DATE_ID TimeStamp (0) Tracks all the dates in the system. All valid calendar dates for reporting purposes must be defined here.
MONTH_ID Numeric (38,0) Unique identifier for the month. This is a time hierarchy table. The default format for the month id is YYYYMM and is stored as an integer.
QTR_ID Numeric (38,0) Unique identifier for the quarter. This is a time hierarchy table. The default format for the quarter id is YYYYQ and is stored as an integer.
YEAR_ID Numeric (38,0) Unique identifier for the year. This is a time hierarchy table. The default format for the year id is YYYY and is stored as an integer.
Table Name Column Name Data Type Column Comment

Data Storage: Physical Schema and Data Dictionary Human Resources Analysis Module ReferenceC
206 Table column information © 2010 MicroStrategy, Inc.
L_CAL_ MONTH
LAST_MONTH_ID Numeric (38,0) ID of the previous month. For example, for December 2003 it is November 2003. This is stored in the same format as the MONTH_ID (YYYYMM).
MONTH_DESC VarChar (30) Textual description of the month.
MONTH_ID Numeric (38,0) Unique identifier for the month. This is a time hierarchy table. The default format for the month id is YYYYMM and is stored as an integer.
QTR_ID Numeric (38,0) Unique identifier for the quarter. This is a time hierarchy table. The default format for the quarter id is YYYYQ and is stored as an integer.
YEAR_ID Numeric (38,0) Unique identifier for the year. This is a time hierarchy table. The default format for the year id is YYYY and is stored as an integer.
L_CAL_QTR LAST_QTR_ID Numeric (38,0) ID of the previous quarter. For example, for Q4 2003 it is Q3 2003. This is stored in the same format as the QTR_ID (YYYYQ).
QTR_DESC VarChar (30) Textual description of the quarter.
QTR_ID Numeric (38,0) Unique identifier for the quarter. This is a time hierarchy table. The default format for the quarter id is YYYYQ and is stored as an integer.
YEAR_ID Numeric (38,0) Unique identifier for the year. This is a time hierarchy table. The default format for the year id is YYYY and is stored as an integer.
L_CAL_YEAR LAST_YEAR_ID Numeric (38,0) The id of the previous year. For example, for 2003 it is 2002. This is stored in the same format as the YEAR_ID (YYYY).
YEAR_ID Numeric (38,0) Unique identifier for the year. This is a time hierarchy table. The default format for the year id is YYYY and is stored as an integer.
L_COMP_ TYPE
COMP_TYPE_ DESC
VarChar (30) Textual description of the compensation type.
COMP_TYPE_ID Numeric (38,0) Unique identifier of the compensation type or item.
Table Name Column Name Data Type Column Comment

Human Resources Analysis Module Reference Data Storage: Physical Schema and Data Dictionary C
© 2010 MicroStrategy, Inc. Table column information 207
L_ CONTRACTOR
CNTR_ACTIVITY Numeric (38,0) Flag indicating whether the contract is active or not.
CNTR_DEPT_ID Numeric (38,0) Department where the contractor is working.
CNTR_LOCATION_ID
Numeric (38,0) Location where the contractor is working.
CNTR_TITLE_ID Numeric (38,0) Job title of the contractor.
CONTRACT_END_DATE
TimeStamp (0) Date on which the contract ended or will end.
CONTRACT_ START_DATE
TimeStamp (0) Date on which the contract starts.
CONTRACTOR_ DESC
VarChar (30) Textual description or name of the contractor.
CONTRACTOR_ID Numeric (38,0) Unique identifier of the individual or company working as contractor.
SALARY_RATE Numeric (15,6) Salary rate of the contractor as $/h.
L_EMP_AGE_ RANGE
EMP_AGE_RNG_DESC
VarChar (30) Textual description of the employee's age range.
EMP_AGE_RNG_ ID
Numeric (38,0) Unique identifier of the employee's age range.
L_EMP_ CLEARANCE
EMP_ CLEARANCE_ DESC
VarChar (30) Textual description of the level of security clearance of the employee.
EMP_ CLEARANCE_ID
Numeric (38,0) Unique identifier of the level of security clearance of the employee.
L_EMP_DGR_ TYPE
EMP_DGR_TYPE_DESC
VarChar (30) Textual description of the employee's degree type.
EMP_DGR_TYPE_ID Numeric (38,0) Unique identifier of the employee's degree type.
L_EMP_ DIVISION
EMP_DIVISION_ DESC
VarChar (30) Textual description of the employee’s division.
EMP_DIVISION_ID Numeric (38,0) Unique identifier of the employee’s division.
Table Name Column Name Data Type Column Comment

Data Storage: Physical Schema and Data Dictionary Human Resources Analysis Module ReferenceC
208 Table column information © 2010 MicroStrategy, Inc.
L_EMP_DPTM EMP_DPTM_ DESC
VarChar (30) Textual description of the employee’s department.
EMP_DPTM_ID Numeric (38,0) Unique identifier of the employee’s department.
EMP_DIVISION_ID Numeric (38,0) Unique identifier of the employee’s division.
L_EMP_EDU EMP_EDU_DESC VarChar (30) Textual description of the employee's education.
EMP_EDU_ID Numeric (38,0) Unique identifier of the employee's education.
L_EMP_ ETHNICITY
EMP_ETHN_ DESC
VarChar (30) Textual description of the employee's ethnicity.
EMP_ETHN_ID Numeric (38,0) Unique identifier of the employee's ethnicity.
L_EMP_ GENDER
EMP_GENDER_ DESC
VarChar (30) Textual description of the employee's gender.
EMP_GENDER_ID Numeric (38,0) Unique identifier of the employee's gender.
L_EMP_IMM_ STS
EMP_IMM_STS_ DESC
VarChar (20) Textual description of the employee’s immigration status.
EMP_IMM_STS_ ID
Numeric (38,0) Unique identifier of the employee’s immigration status.
L_EMP_LEVEL EMP_LEVEL_ DESC
VarChar (30) Textual description of the employee's level.
EMP_LEVEL_ID Numeric (38,0) Unique identifier of the employee's level.
L_EMP_ LOCATION
EMP_LOCATION_DESC
VarChar (30) Textual description of the employee’s office location.
EMP_LOCATION_ ID
Numeric (38,0) Unique identifier of the employee’s office location.
EMP_REGION_ID Numeric (38,0) Unique identifier of the employee’s region.
L_EMP_ MNRTY_GRP
EMP_MNRTY_ GRP_DESC
VarChar (30) Textual description of the employee’s minority group.
EMP_MNRTY_ GRP_ID
Numeric (38,0) Unique identifier for the employee’s minority group.
Table Name Column Name Data Type Column Comment

Human Resources Analysis Module Reference Data Storage: Physical Schema and Data Dictionary C
© 2010 MicroStrategy, Inc. Table column information 209
L_EMP_MRTL_ STS
EMP_MRTL_STS_DESC
VarChar (30) Textual description of the employee’s marital status.
EMP_MRTL_STS_ID Numeric (38,0) Unique identifier of the employee’s marital status.
L_EMP_ NTNLTY
EMP_NTNLTY_ DESC
VarChar (30) Textual description of the employee's nationality.
EMP_NTNLTY_ID Numeric (38,0) Unique identifier of the employee's nationality.
L_EMP_PSTN_ STS
EMP_PSTN_STS_DESC
VarChar (30) Textual description of the employee’s position status
EMP_PSTN_STS_ID Numeric (38,0) Unique identifier of the employee’s position status.
L_EMP_ REGION
EMP_REGION_ DESC
VarChar (30) Textual description of the employee’s region.
EMP_REGION_ID Numeric (38,0) Unique identifier of the employee’s region.
L_EMP_STS EMP_STS_DESC VarChar (30) Textual description of the employee’s status.
EMP_STS_ID Numeric (38,0) Unique identifier of the employee’s status.
L_EMP_TITLE EMP_TITLE_ DESC
VarChar (30) Textual description of the nature of work or level of the employee.
EMP_TITLE_ID Numeric (38,0) Unique identifier of the nature of work or level of the employee.
Table Name Column Name Data Type Column Comment
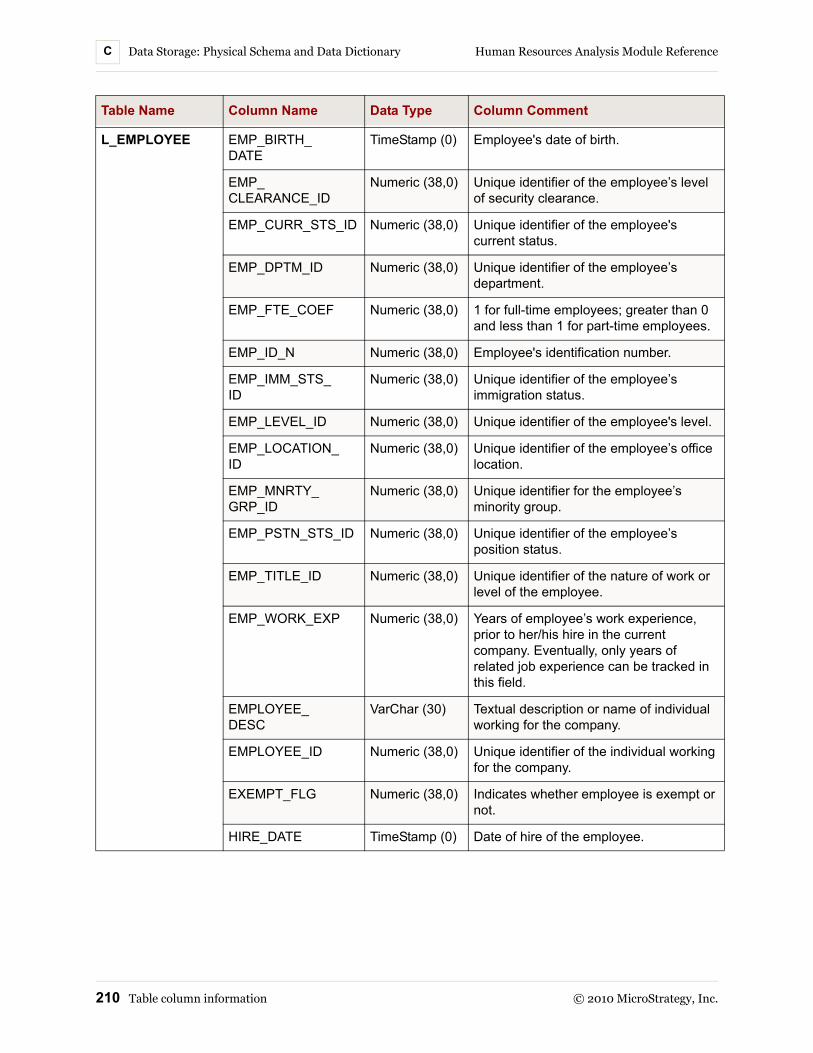
Data Storage: Physical Schema and Data Dictionary Human Resources Analysis Module ReferenceC
210 Table column information © 2010 MicroStrategy, Inc.
L_EMPLOYEE EMP_BIRTH_ DATE
TimeStamp (0) Employee's date of birth.
EMP_ CLEARANCE_ID
Numeric (38,0) Unique identifier of the employee’s level of security clearance.
EMP_CURR_STS_ID Numeric (38,0) Unique identifier of the employee's current status.
EMP_DPTM_ID Numeric (38,0) Unique identifier of the employee’s department.
EMP_FTE_COEF Numeric (38,0) 1 for full-time employees; greater than 0 and less than 1 for part-time employees.
EMP_ID_N Numeric (38,0) Employee's identification number.
EMP_IMM_STS_ ID
Numeric (38,0) Unique identifier of the employee’s immigration status.
EMP_LEVEL_ID Numeric (38,0) Unique identifier of the employee's level.
EMP_LOCATION_ ID
Numeric (38,0) Unique identifier of the employee’s office location.
EMP_MNRTY_ GRP_ID
Numeric (38,0) Unique identifier for the employee’s minority group.
EMP_PSTN_STS_ID Numeric (38,0) Unique identifier of the employee’s position status.
EMP_TITLE_ID Numeric (38,0) Unique identifier of the nature of work or level of the employee.
EMP_WORK_EXP Numeric (38,0) Years of employee’s work experience, prior to her/his hire in the current company. Eventually, only years of related job experience can be tracked in this field.
EMPLOYEE_ DESC
VarChar (30) Textual description or name of individual working for the company.
EMPLOYEE_ID Numeric (38,0) Unique identifier of the individual working for the company.
EXEMPT_FLG Numeric (38,0) Indicates whether employee is exempt or not.
HIRE_DATE TimeStamp (0) Date of hire of the employee.
Table Name Column Name Data Type Column Comment

Human Resources Analysis Module Reference Data Storage: Physical Schema and Data Dictionary C
© 2010 MicroStrategy, Inc. Table column information 211
L_EMPLOYEE (continued)
LEAVE_DATE TimeStamp (0) Date on which the employee left the company.
LEAVE_RSN_ID Numeric (38,0) Unique identifier of the reasons for departure.
RCRTNG_ SOURCE_ID
Numeric (38,0) Unique identifier for the recruiting source used to hire employees.
SUPERVISOR_ID Numeric (38,0) Unique identifier of the employee's supervisor.
L_JOB_CLOSE_RSN
JOB_CLOSE_RSN_DESC
VarChar (30) Textual description of the reasons for closing a job search.
JOB_CLOSE_RSN_ID
Numeric (38,0) Unique identifier of the reason for closing a job search.
L_JOB_CODE EMP_TRANSFER_IN VarChar (20) Mapped to the employee ID that closed the job opening by internal transfer.
EMP_TRANSFER_OUT
Numeric (38,0) Mapped to the employee ID that caused the job opening by internal transfer.
JOB_CLEARANCE_ID
Numeric (38,0) Level of clearance required by the specific job.
JOB_CLOSE_ DATE
TimeStamp (0) Date on which job associated with the vacant position was filled.
JOB_CLOSE_RSN_ID
Numeric (38,0) Unique identifier of the reason for closing a job search.
JOB_CODE_ID Numeric (38,0) Unique identifier of the job.
JOB_DPTM_ID Numeric (38,0) Department in which the specific job is available.
JOB_LOCATION_ ID
Numeric (38,0) Location where the specific job is available.
JOB_OPEN_DATE TimeStamp (0) Day in which a vacant position was assigned a job code and the recruitment process began.
JOB_OPEN_RSN_ID Numeric (38,0) Unique identifier of the reason for starting a job search.
JOB_WORK_EXP Numeric (38,0) Number of years of experience required to fill the specific job.
POSITION_ID Numeric (38,0) Unique identifier of the job position in the company.
Table Name Column Name Data Type Column Comment

Data Storage: Physical Schema and Data Dictionary Human Resources Analysis Module ReferenceC
212 Table column information © 2010 MicroStrategy, Inc.
L_JOB_OPEN_ RSN
JOB_OPEN_RSN_ DESC
VarChar (30) Textual description of the reasons for starting a job search.
JOB_OPEN_RSN_ID Numeric (38,0) Unique identifier of the reason for starting a job search.
L_LEAVE_RSN LEAVE_RSN_ DESC
VarChar (30) Textual description of the reasons for departure.
LEAVE_RSN_ID Numeric (38,0) Unique identifier of the reasons for departure.
L_POSITION POSITION_DESC VarChar (30) Textual description of job positions in the company.
POSITION_ID Numeric (38,0) Unique identifier of job positions in the company.
L_QLFN QLFN_DESC VarChar (30) Textual description of employee's qualifications.
QLFN_ID Numeric (38,0) Unique identifier of employee's qualifications.
QLFN_TYPE_ID Numeric (38,0) Unique identifier of employee's qualification types.
L_QLFN_TYPE QLFN_TYPE_ DESC
VarChar (30) Textual description of employee's qualification types.
QLFN_TYPE_ID Numeric (38,0) Unique identifier of employee's qualification types.
L_RCRTNG_ SOURCE
RCRTNG_ SOURCE_DESC
VarChar (30) Textual description for the recruiting source used to hire employees.
RCRTNG_ SOURCE_ID
Numeric (38,0) Unique identifier for the recruiting source used to hire employees.
L_SURVEY_ FIELDS
SURVEY_FIELD_DESC
VarChar (30) Textual description of the survey field.
SURVEY_FIELD_ ID
Numeric (38,0) Unique identifier of the survey field.
L_TIME_OFF_ TYPE
TIME_OFF_TYPE_DESC
VarChar (30) Textual description of the type of time off.
TIME_OFF_TYPE_ID Numeric (38,0) Unique identifier of the type of time off.
Table Name Column Name Data Type Column Comment

Human Resources Analysis Module Reference Data Storage: Physical Schema and Data Dictionary C
© 2010 MicroStrategy, Inc. Table column information 213
R_EMP_ ADDRESS
EMP_CITY VarChar (30) Employee's city home address.
EMP_COUNTRY Numeric (38,0) Employee's country.
EMP_PHONE_ NUM
Numeric (38,0) Employee's home phone number.
EMP_STATE VarChar (30) Employee's state home address.
EMP_STREET VarChar (20) Employee's street home address.
EMP_ZIP Numeric (38,0) Employee's home address ZIP code.
EMPLOYEE_ID Numeric (38,0) Unique identifier of individual working for the company.
R_EMP_DEMO EMP_AGE_RNG_ ID
Numeric (38,0) Unique identifier of the employee's age range.
EMP_DGR_TYPE_ID Numeric (38,0) Unique identifier of the employee's degree type.
EMP_EDU_ID Numeric (38,0) Unique identifier of employee's education.
EMP_ETHN_ID Numeric (38,0) Unique identifier of the employee's ethnicity.
EMP_GENDER_ID Numeric (38,0) Unique identifier of the employee's gender.
EMP_MRTL_STS_ID Numeric (38,0) Unique identifier of the employee’s marital status.
EMP_NTNLTY_ID Numeric (38,0) Unique identifier of the employee's nationality.
EMPLOYEE_ID Numeric (38,0) Unique identifier of individual working for the company.
Table Name Column Name Data Type Column Comment

Data Storage: Physical Schema and Data Dictionary Human Resources Analysis Module ReferenceC
214 Table column information © 2010 MicroStrategy, Inc.

© 2010 MicroStrategy, Inc. Glossary: ad hoc query 215
GLOSSARY
ad hoc query A SQL query dynamically constructed by desktop tools and whose results are not known before it is sent to the server. The user is asking a new question that has not been answered by an existing report.
analyst The user category of a person who accesses reports, performs drilling, does exception reporting, generates report requirements, and is aware of the necessary analysis. An analyst receives useful data from information devices like alphanumeric pagers, fax machines, and e-mail without fully understanding how such information is derived or delivered.
analytics Predefined tools that allow analysis within each Analysis Module's functional areas. Analytics include reports (graph, grid, and so on), scorecards, dashboards, and so on.

Glossary Human Resources Analysis Module Reference
216 Glossary: attribute © 2010 MicroStrategy, Inc.
attribute A data level defined by the system architect and associated with one or more columns in a data warehouse lookup table. Attributes include data classifications like Region, Order, Customer, Age, Item, City, and Year. They provide a means for aggregating and filtering data at a given level.
See also:
• form
• expression
• child attribute
• parent attribute
attrition rate The number of lost employees divided by the number of employees in a given time period.
axes, axis 1) A vector along which data is displayed. There are three axes—Row, Column, and Page. When a user defines a template for a report, he places template units—attributes, dimensions, metrics, consolidations, and custom groups—along each axis.
2) One part of a multi-part graphical diagram. Many SDAM reports display data on more than one graphical axis, such as the Quotation Activity Summary report and the Quarterly Conversion Summary report.
business intelligence (BI) system
A system that facilitates the analysis of volumes of complex data by providing the ability to view data from multiple perspectives.
category See hierarchy.
child attribute The lower-level attribute in an attribute relationship.
See also:
• parent attribute
• relationship

Human Resources Analysis Module Reference Glossary
© 2010 MicroStrategy, Inc. Glossary: column 217
column 1) A one-dimensional vertical array of values in a table.
2) The set of fields of a given name and data type in all rows of a given table.
3) MicroStrategy object in the schema layer that can represent one or more physical table columns or no columns.
See also axis.
conditional metric A metric containing filter criteria in its definition.
consolidation An object that can be placed on a template and is made up of an ordered collection of elements called consolidation elements. Each element is a grouping of attribute elements that accommodates inter-row arithmetic operations.
Compare custom group.
custom group An object that can be placed on a template and is made up of an ordered collection of elements called custom group elements. Each element contains its own set of filtering qualifications.
data modeling A method used to define and analyze data requirements needed to support the business functions of an enterprise. These data requirements are recorded as a conceptual data model with associated data definitions. Data modeling defines the relationships between data elements and data structures.
data warehouse 1) A database, typically very large, containing the historical data of an enterprise. Used for decision support or business intelligence, it organizes data and allows coordinated updates and loads.
2) A copy of transaction data specifically structured for query, reporting, and analysis.

Glossary Human Resources Analysis Module Reference
218 Glossary: decile, deciling © 2010 MicroStrategy, Inc.
decile, deciling The method by which a group is broken up into ten groups of equal elements. The first decile consists of the top ten percent; the second, the 11th to 20th percent; the third, the 21st to 30th percent; and so on.
demographics, demographic data
Data that locates, identifies, and describes a population and its properties; for example, data describing the age groups of people living in certain geographical areas or income categories. Other dimensions of demographic data include race, religion, political preference, spending preferences, and family size.
dimension An element or factor making up a complete entity or variable (a quantity that may assume any one of a set of values). For example, product types, times, and regions are three dimensions pertaining to sales. Different product types are sold over different time zones in different regions.
document 1) A container for formatting, displaying, and distributing multiple grid and graph reports from a single request.
2) The MicroStrategy object that supports such functionality.
drill A method of obtaining supplementary information after a report has been executed. The new data is retrieved by re-querying the Intelligent Cube or database at a different attribute or fact level.
See also:
• page-by
• sort
• subtotal
editor A dialog used to create and edit MicroStrategy Objects. There is a Filter Editor, Template Editor, Attribute Editor, Metric Editor, Report Editor, and so on.

Human Resources Analysis Module Reference Glossary
© 2010 MicroStrategy, Inc. Glossary: ETL 219
ETL Extraction, transformation, and loading.
1) The process used to populate a data warehouse from disparate existing database systems.
2) Third-party software used to facilitate such a process.
entry level The lowest level set of attributes at which a fact is available for analysis.
expression Formulas built from functions, attributes, facts, metrics, and consolidations that can be used to define attribute forms, fact calculations, metrics, or filters.
fact 1) A measurement value, often numeric and typically aggregatable, stored in a data warehouse.
2) A schema object representing a column in a data warehouse table and containing basic or aggregated numbers—usually prices, or sales in dollars, or inventory quantities in counts.
See also metric.
fact table A database table containing numeric data that may be aggregated along one or more dimensions. Fact tables may contain atomic or summarized data.
filter A MicroStrategy object that specifies a set of criteria used to limit the data returned in a report. Specifically, it limits the returned values of an attribute in the result set to a specified range. It is normally implemented in the SQL WHERE clause. Examples include: “2003”, “All weekdays in May”, “Stores in the Northeast”.
folder A MicroStrategy object used for grouping and storing in a single place a set of objects that are similar, such as filters, templates, and reports.

Glossary Human Resources Analysis Module Reference
220 Glossary: folder list © 2010 MicroStrategy, Inc.
folder list A portion of the interface that lists all the folders found in the project in a hierarchical fashion. It helps a user to visualize and browse through a MicroStrategy project.
form One of several columns associated with an attribute that are different aspects of the same thing. For example, ID, Name, Last Name, Long Description, and Abbreviation could be forms of the attribute Customer. Every attribute supports its own collection of forms.
graph analytic An analytic showing data as points, lines, or bars, arranged according to axes based on the chosen metrics. Although not all analytics can be displayed in every graph type available, many analytics can be viewed in several ways. Choices for graph display include bars, lines, area graphs, and three-dimensional graphs.
grid analytic An analytic consisting of rows and columns. Each row or column has a heading, and each heading represents a prompt from the analytic. Grid analytics can be modified easily, by drilling, moving columns, converting columns to rows, sorting, and using page-by to display subsets of the analytic data as separate pages.
hierarchy A set of attributes defining a meaningful path for element browsing or drilling. The order of the attributes is typically—though not always—defined such that a higher attribute has a one-to-many relationship with its child attributes.
KPI (key performance indicator)
An indicator gauging how well a company progresses in numerous areas such as finance, customer service, and product availability and distribution.

Human Resources Analysis Module Reference Glossary
© 2010 MicroStrategy, Inc. Glossary: level 221
level 1) In a data warehouse, facts are said to be stored at a particular level defined by the attribute IDs present in the fact table. For example, if a fact table has a Date column, an Item_ID column, and a fact column, that fact is stored at the Date/Item level.
2) With regard to metric calculation, the level is the level of calculation for the metric. For example, a metric on a report with Year and Store attributes would be calculated at the Year/Store level.
logical data model A graphical representation of data that is arranged logically for the general user, as opposed to the physical data model or warehouse schema, which arranges data for efficient database use.
lookup table A database table used to uniquely identify attribute elements. They typically consist of descriptions of dimensions. Lookup tables are usually joined to fact tables to group the numeric facts in the fact table by dimensional attributes in the lookup tables.
metadata A repository whose data associates the tables and columns of a data warehouse with user-defined attributes and facts, to enable the mapping of the business view, terms, and needs to the underlying database structure. Metadata can reside on the same server as the data warehouse or on a different database server. It can even be held in a different RDBMS.
metric 1) A business calculation defined by an expression built with functions, facts, attributes, or other metrics. For example: sum(dollar_sales) or [Sales] - [Cost].
2) The MicroStrategy object that contains the metric definition.
See also fact.

Glossary Human Resources Analysis Module Reference
222 Glossary: MicroStrategy Analytics Modules © 2010 MicroStrategy, Inc.
MicroStrategy Analytics Modules
A group of MicroStrategy projects with prepackaged metadata, reports, scorecards, and dashboards; default physical and logical data models to allow the modules to work with an external physical schema and data model or with the module’s packaged data warehouse schema; and reference guides for each Analysis Module’s data model, the individual analysis areas, metadata object definitions, data dictionary, and individual report use scenarios.
MicroStrategy Intelligence Server
Core of the MicroStrategy architecture; manages and organizes users, projects, and database connections; coordinates, prioritizes, and executes all user requests; and allocates the resources necessary to complete them. MicroStrategy Intelligence Server tracks schedules, manages security, and provides the ability to monitor and analyze the daily activity of the entire decision support environment.
multidimensional analysis
A form of analysis of the data in a data warehouse that includes many relationships, each representing a dimension. For example, a retail analysis may seek to understand the relationships among sales by region, by quarter, by demographic distribution (income, education level, gender), and by product. Multidimensional analysis provides results for these complex relationships.
object Conceptually, the highest grouping level of information about one concept, used by the user to achieve the goal of specified data analysis. More concretely, an object is any item that can be selected and manipulated, including folders, reports, facts, metrics, and so on.
outline mode Report viewing mode that creates indented, collapsible groupings of related elements to make reports neater and easier to read.
Human Resources Analysis Module Reference Glossary
© 2010 MicroStrategy, Inc. Glossary: page-by 223
page-by Segmenting the data in a grid report by placing available attributes, consolidations, and metrics on a third axis called the Page axis. Since a grid is two-dimensional, only a slice of the cube can be seen at any one time. The slice is characterized by the choice of elements on the Page axis. By varying the selection of elements, the user can page through the cube.
See also:
• drill
• sort
• subtotal
parent attribute The higher-level attribute in an attribute relationship with one or more children.
See also:
• child attribute
• relationship
productivity analysis A process that measures company productivity and identifies ways to increase it.
project The highest-level intersection of a data warehouse, metadata repository, and user community, containing reports, filters, metrics, and functions.
prompt MicroStrategy object in the report definition that is incomplete by design. The user is asked during the resolution phase of report execution to provide an answer that completes the information. A typical example with a filter is choosing a specific attribute on which to qualify.
query A request for data from a database or data warehouse. A report is a database query.

Glossary Human Resources Analysis Module Reference
224 Glossary: ranking © 2010 MicroStrategy, Inc.
ranking A type of OLAP function that returns the rank of a value in a group of values. Rows with equal values with respect to the ordering are assigned the same rank.
relate table A table containing the ID columns of two or more attributes, thus defining associations between them.
relationship An association specifying the nature of the connection between one attribute (the parent) and one or more other attributes (the children). For example, City is a child attribute of State.
See also:
• parent attribute
• child attribute
report The central focus of any decision support investigation. A report allows users to query for data, analyze that data, and then present it in a visually pleasing manner.
retention, employee The process of maintaining or securing employee loyalty to minimize loss of key talent.
schema 1) The set of tables in a data warehouse associated with a logical data model. The attribute and fact columns in those tables are considered part of the schema itself.
2) The layout or structure of a database system. In relational databases, the schema defines the tables, the fields in each table, and the relationships between fields and tables.
schema object MicroStrategy object created, usually by a project designer, that relates the information in the logical data model and physical warehouse schema to the MicroStrategy environment. These objects are developed in MicroStrategy Architect, which can be accessed from MicroStrategy Desktop. Schema objects directly reflect the warehouse structure and include attributes, facts, functions, hierarchies, operators, partition mappings, tables, and transformations.

Human Resources Analysis Module Reference Glossary
© 2010 MicroStrategy, Inc. Glossary: scorecard 225
scorecard A type of tally sheet displaying a company's performance using key performance indicators (KPIs) that gauge how well a company progresses in areas such as finance, customer service, and product availability and distribution.
See also KPI (key performance indicator).
segmentation A technique for deriving clusters and classes by creating two-way and multi-way splits from a dataset according to specified variables.
sort Arranging data according to some characteristic of the data itself (alphabetical descending, numeric ascending, and so forth).
See also:
• drill
• page-by
• subtotal
subtotal A totaling operation performed for a portion of a result set.
See also:
• drill
• page-by
threshold Used to create conditional formatting for metric values. For example, if dollar sales is greater than $200, format that cell to have a blue background with bold type.
transformation A schema object that encapsulates a business rule used to compare results of different time periods. Transformations are used in the definition of a metric to alter the behavior of that metric.

Glossary Human Resources Analysis Module Reference
226 Glossary: user hierarchy © 2010 MicroStrategy, Inc.
user hierarchy Named sets of attributes and their relationships, arranged in specific sequences for a logical business organization. They are user-defined and do not need to follow the logical model.
© 2010 MicroStrategy, Inc. 227
INDEX
Aad hoc analysis 6advanced metrics 6analysis areas 4analytics defined on 2Analytics Modules defined on xiiattributes defined on 11attrition
analysis 91reports 92
Bbenefits
analysis 85by employee profile 88filters 138most used 87reports 86
benefits and time off
facts 187metrics 132
Ccolumns 200
compensation
above industry maximum 71analysis 63average 73by department 67by employee level 70by region 66cost 67distribution 65facts 185filters 138metrics 129reports 65
configuring the modules xiiconsolidations glossary 140contractor
cost 44distribution 45expiration 43
custom groups
about 6glossary 141
Ddashboards 2, defined on 9

Index Human Resources Analysis Module Reference
228 © 2010 MicroStrategy, Inc.
dashboards, about 6data warehouse
and porting 13default, tables and columns 195options 13populating 195
dates metrics 135definitions
object 12, 143project 11
designing analytical applications xiiidimension defined on 12documents 6, defined on 10drilling defined on 6
Eeditor 12employee
anniversaries 60attrition 92attrition/retention 41birthdays 59departure reasons 96distribution 35, 40facts 181filters 136headcount 39identity group 36metrics 126performance 118profile 55profile distribution 58qualifications 115recruitment 98salary 71satisfaction 121status 33
tenure 37, 41, 57top performers 74
employee profile
reports 55Erwin file
logical schema 11, 144physical schema 13, 196
ETL routines 195expression, form 151
Ffacts defined on 11, 180
benefits and time off 187compensation 185employee 181level 181qualification, performance,
satisfaction 191table-specific 192vacant positions 188
filter 5filters
compensation and benefits 138employee 136glossary 136time 139vacant positions 139
folder
public objects 8reports 8schema objects 146
form expression 151formatting, reports 5
Gglossaries
consolidations 140

Human Resources Analysis Module Reference Index
© 2010 MicroStrategy, Inc. 229
custom groups 141filters 136metrics 125prompts 140
Hheadcounts and trends
reports 32hierarchies 12, defined on 146
benefits 168compensation 167employee and contractor 146leave reason 177position 169qualification 175survey field 175time 178time off 174
hiring
by position 105by region 104new 103rate 102
HRAM. See MicroStrategy Human Re-sources Analysis Module.
Iinstalling the modules xiiiinternational support xxiiintroduction 1
Kkey performance indicators 6, 9KPI. See key performance indicator.
Llevel facts 181logical data model defined on 11, 143logical schema diagram 144lookup tables 151
Mmapping methods 12metadata defined on xii
definitions 150metrics defined on 125
advanced, about 6benefits and time off 132compensation 129dates 135employee 126glossary 125qualification, performance,
satisfaction 133transfers 133vacant positions 134
MicroStrategy Human Resources Analysis Module
about 1analysis areas 4features 5solutions 2
MicroStrategy Narrowcast Server
departure alert 97employee anniversary alert 60employee birthday alert 59new hire alert 107performance appraisal alert 118position vacancy alert 110
MicroStrategy Report Services 7module
about xii

Index Human Resources Analysis Module Reference
230 © 2010 MicroStrategy, Inc.
configuring xiiinstalling xiiiporting xiii
multidimensional 11
Oobject
definitions 11glossary 125properties 12
Ppage-by defined on 5physical schema
about 13diagram 196
populating a data warehouse 195position
filters 139metrics 134
positions, vacant 108prerequisites xivproject
accessing 8definitions 11, 125
prompts defined on 5glossary 140
properties, object 12public objects folder 8
Qqualification, performance, & satisfaction
facts 191metrics 133
RRDBMS 195recruitment
analysis 101pipeline 109reports 102top sources 107
reports
accessing 8folder 8formatting 5usage scenarios 7
resources xvretention analysis 41
Ssalary reports 72schema
logical 144physical 196
schema objects folder 146scorecards 2, defined on 9, 15segmentation defined on 6solutions 2source tables 12support
international xxiisupport. See technical support.
Ttable columns 200tables, physical 198table-specific facts 192technical support xxiiithresholds defined on 5time filters 139

Human Resources Analysis Module Reference Index
© 2010 MicroStrategy, Inc. 231
time off reports 89transfers metrics 133
Vvacant positions
facts 188
Wworkforce
analysis 31trends in numbers 34
workforce development & productivity
analysis 114reports 115

Index Human Resources Analysis Module Reference
232 © 2010 MicroStrategy, Inc.