Microsoft Word - Trail Making Test Manual - cogquiz.com Making Test Manual.d… · Web viewThe...
45
Trail Making Test CogQuiz Neuropsychological Assessment Tests Figure 1 CONTENTS: 1) COGQUIZ Neuropsychological Assessment Tests…………. 3 2) History of the Trail Making Test…………………………….... 3 1
Transcript of Microsoft Word - Trail Making Test Manual - cogquiz.com Making Test Manual.d… · Web viewThe...

Trail Making TestCogQuiz Neuropsychological
Assessment Tests
Figure 1
CONTENTS:
1) COGQUIZ Neuropsychological Assessment Tests…………. 3
2) History of the Trail Making Test…………………………….... 3
3) Data Management…………………………………………….. 5
1

• Participant Database set-up…………………………… 5• User Privileges………………………………………….. 8• Adding a New or Editing an Existing
Participant……………………………………………….. 8• Text Output……………………………………………… 9• Backup Participant File………………………………… 10
4) Executing a Trail Making Test………………..……………… 10
5) Analysis of Results…………………………………………….. 14
6) Creating and Editing a Trail Making Test…………………….16• Add/edit Trials screen…………………………………... 17• Token Edit Tool………………………………………….. 21
7) Normative Data………………………………………………… 23
8) References………………………………………………….….. 30
9) Index…………………………………………………………….. 32
2

COGQUIZ Neuropsychological Assessment Tests’ Trail Making Test
COGQUIZ Neuropsychological Assessment Tests’ Trail Making Test (TMT) provides considerable flexibility in the design of a TMT. The user has control over the number of tokens in a test trial, their placement on the screen, the color of each token, each token’s shape (circle, square, or text box), each token’s caption or image, and a subset of tokens can function as “lures.” In addition, custom instructions can be written for each trial; even the few built-in directional messages can either be altered to reflect the language needs of the Participant population or icons can be used in place of the printed messages.
Trials can be specified as either timed (i.e., the trial is terminated after a determined amount of time has elapsed) or untimed. Participants can be prompted, at the test author’s discretion, to respond after a specified time period of not responding. The system provides the user with a running record of test events including all relevant stimulus events, participant responses, and the time (to the nearest millisecond) that the system detected the event. The COGQUIZ TMT’s summary analysis provides the total time to complete a trail as well as the number of correct and incorrect responses and the number of prompts issued.
As part of an ongoing research program on normal cognitive aging, a substantial number of test results have been obtained using a COGQUIZ computerized version of the traditional paper and pencil TMT, Part A and Part B. The descriptive statistics, broken out in five and ten year cohorts, are provided at the end of this manual in the “normative data” section.
History of the Trail Making Test
The TMT, widely used in neuropsychological assessment (Rabin, Barr, & Burton, 2005), was originally devised in 1938. Originally known as the “Partington’s Pathways Test” or the “Divided Attention Test” (Partington & Leiter, 1949), it was initially part of a battery of tests (Army Individual Test Battery) used to assess “a variety of intellectual functions different from those measured by the Wechsler-Bellevue Intelligence Scale” (Spreen & Strauss, 1998). It was subsequently added by Reitan (1979) to the Halstead Battery of Neuropsychological Tests. While the test is typically administered in its original form, alternative forms have been developed over time to meet the testing needs of either alternative clinical populations or cognitive science research agendas.
An example of an alternate form of the Trail Making Test is the Color Trails Test.Initially developed as part of a neuropsychological test battery for the World Health
3

Organization’s cross-cultural study of HIV-1 infection (Maj, et al., 1991), the Color Trails Test was subsequently modified for use with children (Williams et al., 1995). In both cases the modifications are presumed to minimize the cultural bias introduced by the use of Roman letters in part B of the more traditional TMT (Maj, et al., 1991). In addition, the original TMT was frequently duplicated, with such duplication introducing anomalies in the reproduced image and thereby reducing standardization and the ability to directly compare clinical and research findings. The use of color was, in part, designed to discourage this kind of duplication (D’Elia, et al., 1994).
The TMT is thought to provide some assessment of attention, visual scanning, speed of eye-hand coordination and information processing; in addition, Part B also assesses the ability to alternate between stimulus sets and, as such, is a measure of “executive function” (Mitrushina, et al., 1999). Salthouse, et al. (2000), argues that the standard TMT has flaws that compromise its use as a measurement of executive function and proposes a “variant of a trail-making-type test that is based on the Zahlen Verbindsung Test, which was introduced by Oswald and Roth (1978) and has been described in Vernon (1993).” In his view the Connections Test mitigates many of those flaws.
The TMT and its variants require the Participant to link, in the correct order, an array of tokens that are labeled in such a way as to indicate that order. For example, Part A of the standard TMT contains an array of 25 circles containing the numbers 1 - 25. In the paper and pencil version of the test, the Participant draws a line from the circle containing the number 1 to the circle containing the number 2 and then to the circle containing the number 3 and so on until he/she reaches the circle containing the number 25. If during this process an error is made (e.g., drawing a line to a circle that is not the next one in the sequence), the error is pointed out and corrected, and the Participant then continues to the next correct circle. If the Participant fails to respond for some period of time, he/she is prompted as to the next correct response and testing continues.
Computer based versions of the TMT function in the same way except that, instead of using a pencil, the Participant uses the computer’s mouse pointer to “click” on (or, with a touch screen, a finger to touch) each token on the screen until he/she has traversed all of the displayed tokens. All trail-type tests use some form of this basic methodology with alternate forms changing either the number of tokens to be traversed (15 in the Children’s Color Trails Test™, 49 in Salthouse’s Connection Test, and even more if distractor objects in the Comprehensive Trail-Making Test™ are counted); token characteristics (e.g. color, shape, position and captions); and/or some procedural differences (e.g. timed versus untimed trials, prompt on error, test termination criteria).
4

Data ManagementAll COGQUIZ Neuropsychological Assessment Tests share a single Participant Database. Whether you are using only one of our tests or all of them, all participant information and test results are stored in a single database file called the “Participant Database.” This approach greatly facilitates the management of participant information as well as security of the data. To assure the privacy of each participant, access to this database is usercode/password protected.
In order to personalize access to and control over this database, a user must create and set up a Participant Database administrator. Therefore, if a user starts to run a test and generate data before setting up an administrator for the Database, the user will be prompted to read this section of the manual before proceeding further.
Participant Database Set-upSetting up one’s own administration of the COGQUIZ Participant Database requires only a few simple steps but, since this process both determines access and insures the security of the database, the process is important and, as such, is highlighted in red below.
PLEASE NOTE: Since all COGQUIZ tests share the same Participant Database, if you have previously installed any other COGQUIZ test(s) then setup of the Participant Database was already done in that previous CogQuiz test installation and this step can be skipped.
If, however, this is the first installation of a COGQUIZ Neuropsychological Test then a unique participant database administrator will need to be set up. The test comesprogrammed with a single generic database administrator already assigned a preprogrammed USER NAME, USER CODE, and PASSWORD. The pre-programmedUser Name is “CogQuiz Administrator,” the User Code is the word “admin,” and the Password is “CogQuiz.” For database security, we recommend that the user create a new Database Administrator and then, when that has been successfully accomplished, that the generic, pre-programmed CogQuiz Administrator be deleted. The following steps will guide you through this process.
From the test’s WELCOME screen (Figure 1), login to the PARTICIPANT DATA MANAGEMENT window by clicking the Participant Database button to the right of the screen. This will result in the display of the LOGIN window shown below in Figure 2.
5

Figure 2
In the User Code box type in the word “admin” and in the Password box type the word “sanzen” (no quotation marks). Both user codes and passwords are case sensitive so be sure to use lower-case. Now press the OK button.
Pressing the OK button will result in the display of the PARTICIPANT DATA MANAGEMENT window shown in Figure 3, below.
Figure 3
6

On the opening CogQuiz window click the System Administration button to open the ADMINISTER USERCODES/PASSWORD window shown in Figure 4.
Figure 4
You are going to create a new administrator. First, click the Add New User button. Now enter a User Name that can identify this user from others. Then enter a unique login User Code and “Password” for this user. Under the “Access Privileges” box, be sure to give this user Administrator (All) privileges as only users with this level of privilege can get access to this screen to create new or delete existing users. (User privileges will be explained in more detail below). Click the Update button and then Exit the ADMINISTER USERCODES/PASSWORD window.
Return to the WELCOME screen and click on the Participant Database button. Now attempt to login to the database administration system using the User Code/Password
7

you have just created. This should allow you access to the PARTICIPANT DATA MANAGEMENT window.
Once you have ascertained that your new login information will allow you access to the ADMINISTER USERCODES/PASSWORD window, it is then safe to delete the preprogrammed sanzen administrator. In the ADMINISTERUSERCODES/PASSWORD window, select “Sanzen Administrator” from the Select User pull down list and click the Delete User button to delete the pre-assigned Sanzen Administrator. You may simply want to leave the Sanzen Administrator in place as you know this usercode and password.
A word of warning: only users with Administrator (All) privileges can create new users, so don’t lose this usercode/password. You can, of course, consistent with your own security policy, create as many Administrator (All) accounts as you wish. See the section on User Privileges below for a discussion of the access rights of the other two levels of security.
User Privileges
From the ADMINISTER USERCODE/PASSWORDS window (accessed, as described above, via the opening window) an administrative user can create new users and determine their level of access to the system. A user can be assigned any one of three levels of access.
At the lowest level, Data Entry Only, the user can only enter information for a new participant. They cannot print, edit or even view other participant records. This is a level likely to be assigned to an individual whose only responsibility is to test participants.
At the Data Administrator level, the user can enter new participant information, view and edit all participant records, delete a participant, and print participant records.
Users with Administrator (All) privileges can do all that a Data Administrator can do but can also add new users to the database security system.
Adding New or Editing Existing Participants
From the PARTICIPANT DATA MANAGEMENT window (Figure 3, above), add a newparticipant by first clicking the Add New Participant button. The Participant Information frame will be cleared, and the cursor will be positioned in the first field “First Name.” At a minimum, a first and last name must be entered to register a Participant. After entering
8

the relevant information, click the Update button and the new Participant will be added to the Participant Database.
Alternatively, an existing Participant’s information can be displayed and/or edited by selecting a Participant from the pull-down list located immediately above the Add New Participant button. The Participant’s current information and a list of the tests they have taken will be displayed. Of course, all of this can be done only by a user who has “Data Administrator” or “Administrator” privileges.
Text Output
Participant data cannot be printed directly from the data management system, however, clicking the Output to Text File button (on the PARTICIPANT DATA MANAGEMENT window, Figure 3) allows the user to write to a file’s selected information in formats compatible either with popular word processors, spreadsheets or statistical packages. Figure 5 (below) shows the window for selecting and formatting the text file.
Figure 5
9

The “Select Participant” box on the left side of the screen automatically and alphabetically lists all participants currently in the system. A scroll bar will appear to the right of this list if there are more participants than can be accommodated in the visible area. Directly beneath this list, the user can choose to send to the text file either the entire list of Participants or only a selected subset by “checking” either All Participants or Only Selected Participants.
If the “Only Selected Participants” option is chosen, clicking on the name of each selected participant in the left-hand Participant list will cause that name to appear in the Selected Participants list on the right side of the screen.
Double-clicking on a participant’s name in the Selected Participant list will remove that name from the list.
Once the list of selected participants has been generated then the data items to be included in the list (Participant ID, Name and Address, etc.) can be selected by “checking” the appropriate boxes.
Finally, the user can specify whether the data is to be formatted in either a “standard” multiline text format suitable for either a text editor or a spreadsheet, or as a single line (one for each participant selected) comma delimited format suitable for being read by popular “statistical” packages. Clicking the Export/Print button will show a standard “save file” dialog box.
Backup Participant FileIt is important that from time-to-time a backup copy of the Participants’ database be made. Loss of data can, at the very least, be frustrating and though today’s computers and disk drives are very reliable, they do still sometimes fail. Clicking the BackupParticipant File produces a “save file dialog” allowing a copy of the Participants Database to be made. This copy should be made to some external storage device such as an external (usb) disk drive or to a “thumb drive.”
Executing a Trail Making TestExecute a Trail Making Test by first selecting a test from the “Select a Test” pull down menu at the bottom right of the WELCOME screen (Figure 1). This list will initially display only the COGQUIZ TMT tests preloaded with the test software, but subsequently will display all tests created by the user as well. The COGQUIZ TMT
10

comes loaded with the following TMT tests: Standard A & B, Reflected A & B, Inverted A & B, Reflected and Inverted A & B, Shapes, Connections 1, Color Number Trails, and Complex Trails.
Once a test has been selected it will open the SELECT PARTICIANT window (Figure 6, shown below). Select a participant from the pull-down list and, if protocol requires it, type in the name of the tester in the text box initially containing “Anonymous”. As noted in the window, if the participant to be tested has not yet been entered into the Participant Database, it will be necessary to Cancel to exit out of this window, return to the WELCOME screen, click the Participant Database button, and enter the participant’s information into the database via the PARTICIPANT DATA MANAGEMENT window.
Figure 6
Clicking the Cancel button will return program control to the WELCOME screen (Figure1).
11

Clicking the Run Test button will execute the test and the instructions for the first trial will be presented. The instruction displayed in Figure 7 was written for a test using a touch screen. When a mouse is employed for Participant input the instruction should be amended to substitute “click” for “touch”.
Figure 7
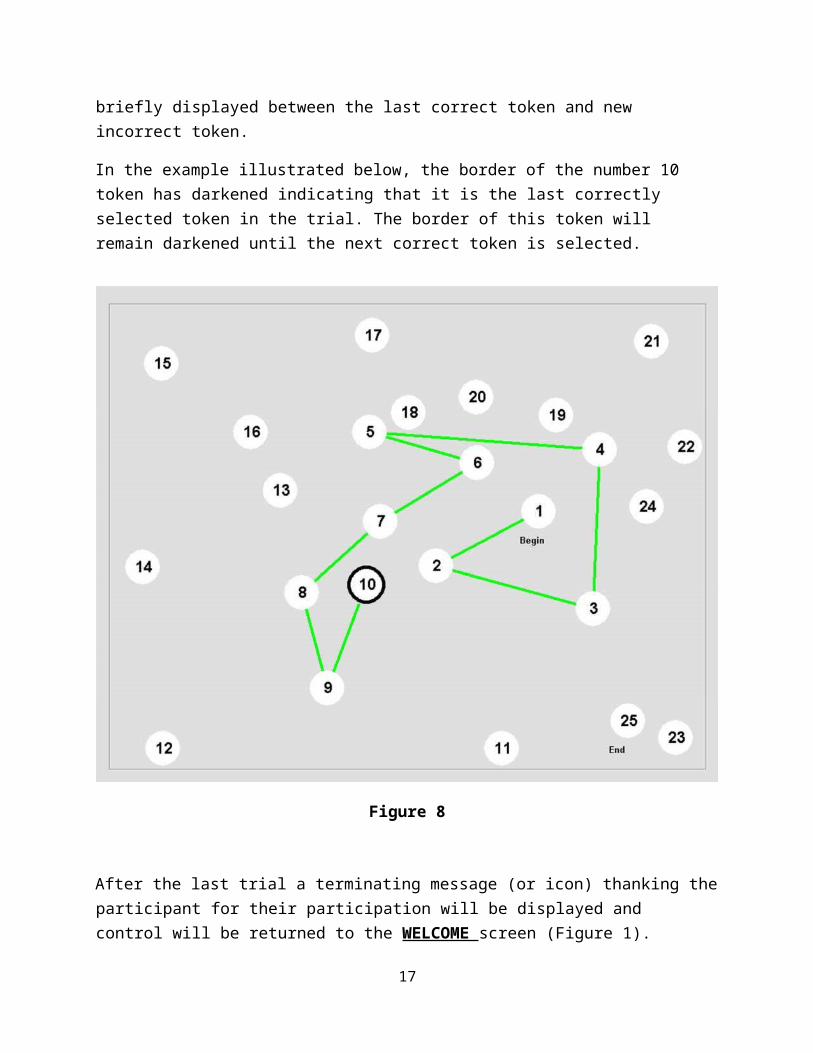
When the Participant clicks on (or touches) the instruction display, it will close and the trail screen appropriate for the current trial will be displayed. Figure 8, shown below, is a partially completed run of the second or “A” trail (the first is an eight item practice trail) from the “Standard Test” (provided as a preprogramed test with the test package).
When the Participant clicks on the correct token a line is drawn from the previously selected correct token to the newly selected correct token. If the Participant incorrectly clicks a token other than the next one in the sequence, a red line will be briefly displayed between the last correct token and new incorrect token.
12

In the example illustrated below, the border of the number 10 token has darkened indicating that it is the last correctly selected token in the trial. The border of this token will remain darkened until the next correct token is selected.
Figure 8
After the last trial a terminating message (or icon) thanking the participant for their participation will be displayed and control will be returned to the WELCOME screen (Figure 1).
TERMINATING A TEST: If the test needs to be terminated prior to its completion the tester can do so by pressing <ctrl>x. This will terminate the test and no data collected during the terminated test will be saved.
13

Analysis of ResultsClicking the Analyze Trail Making test button on the WELCOME screen (Figure 1) will produce a screen like the one shown below (Figure 9).
Figure 9
To see a Participant’s data, select the Participant’s name from the “Select a Participant” pull-down list. A list of all versions of the Trail Making Tests the selected Participant has taken will appear in the “Trail Making Test(s) Taken” box at the bottom right of the screen. Click on the specific test to be analyzed, and the selected test’s data will automatically display.
Clicking the Print button will send a copy of the results to the printer along with the Participant’s unique identification number (assigned at the time the Participant was entered into the Participant Database), the test version name, the date and time the test was administered, the date and time the report was generated, and the name of the person administering the test (if it was entered).
Checking the “Suppress Participant Identification Information” box for the Participant(s) selected will suppress all personal identifying information and will include only the nonpersonal identifying information outlined in the paragraph above -- that is, the contents of the text box above the grid (on the left side of the screen) will not appear on the printout. This is useful when printed copies of the data may need to be kept in less secure environments. The linkage between suppressed Participant information and test
14

results can always be recovered by those having at least “Data Administrator” level access to the Participant Database, or by reprinting the analysis with the “Suppress Participant Identification Information” box unchecked.
Clicking the Export to Clipboard button will place a spreadsheet compatible copy of the summary table on the clipboard.
The grid located on the right side of the panel contains what is essentially a “real time” record of the Participant’s performance for the analyzed test. This record is provided in case the test user wishes to perform an analysis not given by summary statistics. The grid provides information about all the salient events that occurred during the test.
The first column is simply the event’s i.d. number and reflects its occurrence position in the test. The second column displays the nature of the event. The third column contains an “argument” qualifying the nature of the event. And the fourth column contains a “timestamp” indicating to the nearest millisecond when the system detected the event.
For example, event 1 is Start Trial, an event occurring coincidentally with the display of the trail, and the argument “1” indicates that it is the start of trial 1. This event occurred 609,717,078 milliseconds after the last start time for the computer running the test. (The computer maintains a running clock indicating the time in milliseconds since it was last started.) Event 2 was a correct response, indicated by the event designation “Correct;” and the argument “1” indicates the “index” (chronological order) of the token the Participant clicked. If any other token had been clicked, the event designation would have been “Incorrect” and the argument would have contained the index of the token incorrectly selected.
The contents of this grid can be printed by clicking the Print button. Alternatively, by clicking the Export button, the grid’s contents can be sent to the clipboard in a format that can be pasted into a spreadsheet.
Creating and Editing a Trail Making TestCreating or editing a Trail Making Test is initiated by clicking the Create/Edit Test button on the WELCOME screen (Figure 1). This will display the two left windows of the TEST DEFINITION screen seen in Figure 10. Create a new test by clicking the Create New Test button or edit an already created test by selecting a test from the Select Test pull down list. Either of these actions will result in the display of the right hand vertical pane seen in Figure 10.
If you are creating a new test, the Test Name and Test Author fields will be blank and must be filled in. There are several options (discussed below) which can be set on this
15

screen (flash frequency, screen color, random color), although you can simply accept the default options.
Figure 10
Test Messages: Other than the customizable written instructions (about which more will be said later), this test utilizes only three printed on-screen messages. At the test designer’s prerogative, all three of these messages can be changed to accommodate languages other than English that utilize the Roman alphabet. Another option is to check the “Use Icons” box which will substitute the three printed messages with the three provided icons instead.
Flash Frequency: If the Flash Frequency is set to a value other than “0,” then a randomly selected token’s background color will be temporarily (as defined by the token’s “flash time”) changed to either its “flash color” (more will be said about both flash time and flash color when we get to token defaults and the Token Edit tool) or, if the “Random Color” box has been checked, to a randomly selected color. (“Flash frequency” specifies how frequently a token will be selected from the pool of available tokens to be flashed; “flash time” specifies how long that flash will last.) If, for example, the Flash Frequency is set to 100 msecs. (i.e. 1/10 of a second), then a token will be randomly selected every 1/10th of a second from the pool of tokens that are not
16
currently showing their flash color. (The maximum allowable value for Flash Frequency is 60,000 or one minute.) While we do not yet know whether this feature is going to be useful, we do have some preliminary data suggesting that a flashing trail is differentially more difficult for an older population than for a younger one.
Screen Color: Screen Color allows the test author to determine the color of the screen used during testing. Clicking on the white box immediately to the right of Screen Color opens a color selection palette. Selecting a color will add that screen color to the selected test’s parameters and will then subsequently display in the screen color box. For any selected test, therefore, the color displayed in the screen color box for a selected test will indicate the background screen color that will be presented to the participant when that test is run.
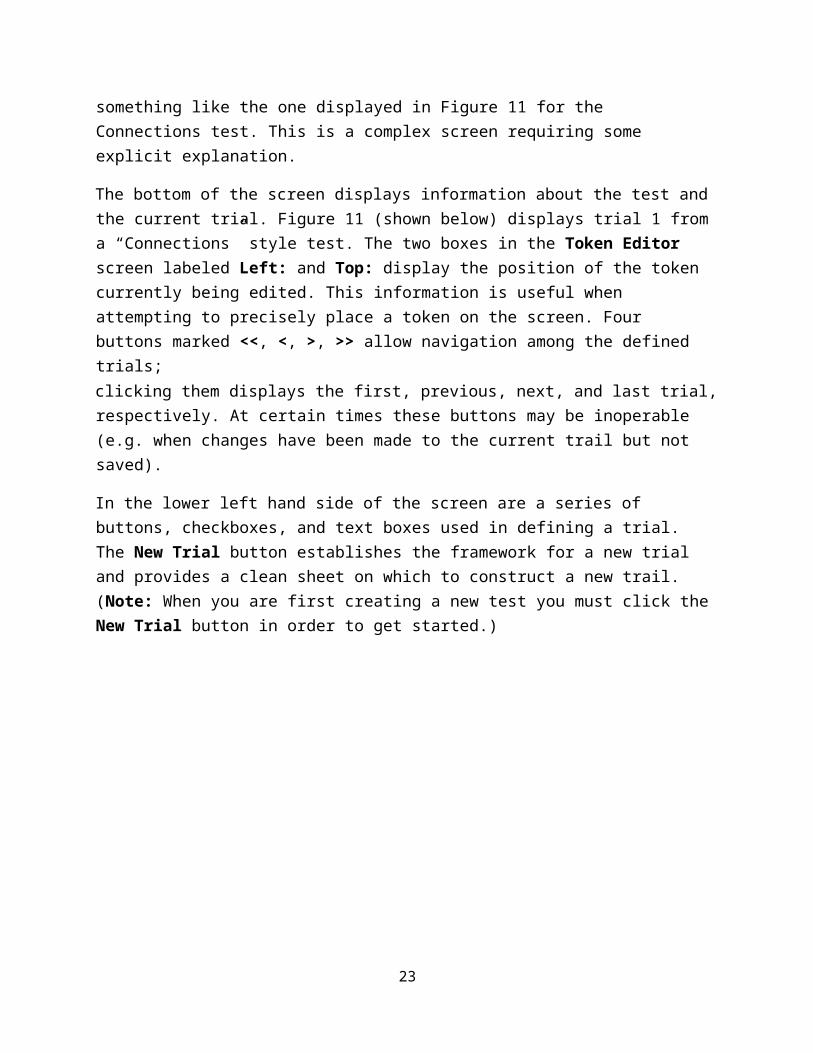
Add/Edit Trials screenOnce the overall test parameters have been defined and saved by clicking the Save Test button, individual trials can be defined by clicking the New Trial button which displays the right hand screen where tokens and their parameters can be set. When creating a new test, clicking this button produces a screen in which the trail field will be blank. If editing an already existing test, clicking this button produces a screen that looks something like the one displayed in Figure 11 for the Connections test. This is a complex screen requiring some explicit explanation.
The bottom of the screen displays information about the test and the current trial. Figure 11 (shown below) displays trial 1 from a “Connections” style test. The two boxes in the Token Editor screen labeled Left: and Top: display the position of the token currently being edited. This information is useful when attempting to precisely place a token on the screen. Four buttons marked <<, <, >, >> allow navigation among the defined trials;clicking them displays the first, previous, next, and last trial, respectively. At certain times these buttons may be inoperable (e.g. when changes have been made to the current trail but not saved).
In the lower left hand side of the screen are a series of buttons, checkboxes, and text boxes used in defining a trial. The New Trial button establishes the framework for a new trial and provides a clean sheet on which to construct a new trail. (Note: When you are first creating a new test you must click the New Trial button in order to get started.)
17

Figure 11
Adding Tokens: Tokens are added to a trial by left clicking twice on the right hand window. A new token with its “index” (more about indexes later) as its caption will appear in the upper right corner of the trail area. The token can then be moved to another location by positioning the cursor over the token, depressing and holding down the left mouse button, “dragging” the token to the desired location and releasing the button. If you accidentally click the button several times without first moving a newly created token, the new tokens will invisibly pile up one on top of the other and can be moved later.
Set Token Defaults: Right clicking on a token opens a window called the Token Editor tool.
Setting a trial’s token defaults in the Token Editor Tool sets the initial characteristics of all tokens added to a trail after the defaults have been set. These defaults can be kept the same for all tokens within a given trial or can be changed for any subsequent tokens added within the same trial by again clicking the Token Editor Tool and setting new defaults. For instance, setting a green fore color and red back color at the outset of creating a trial will set those as the default colors for all tokens added after those defaults are set unless/until the default color settings are changed. If midway through designing the trial the default colors were changed, then all subsequently added tokens
18

would reflect the new default settings for color while the tokens added initially would remain on the screen with the initial settings of a green fore color and red back color.
To change the characteristics of individual tokens rather than groups of tokens, left click on a specific token and the Token Edit tool will open next to that token. The token’s index number is displayed in the “cue index” box in the upper left corner of the Token Edit tool window. The specific options available through the Token Edit tool is discussed below under the Edit Token Edit tool section.
I nstructions : The test creator has two options for creating a new instruction. An instruction file created at an earlier time can be imported using the Load/Import Text From File capability, or a new instruction can be typed directly into the edit field of the Instruction Editor. The “load/import text from file” approach is preferred when the same or a similar instruction is going to be used for several different tests, or when the instruction’s text format is particularly complex. If an external text editor is used, it must be capable of saving the file in Richtext (rtf) format.
Figure 12
Maximum TIme: Entering a time in this box causes a trial to terminate after the time specified in the box has elapsed.
Prompt for Response: Checking the “Prompt for Response” box causes the system to cue the Participant for the next correct response by flashing the border of the next
19

correct token for 1.5 seconds. The time between the Participant’s last correct response and the appearance of the prompt is set (in seconds) in the “Prompt Delay” box.
Last Token: Last Token specifies the index of the last token to be used as a valid token in the trail. Any token with an index higher than Last Token can be used as a “lure” and, if clicked, will result in an error display (flashing red line) as well as an error being recorded in the data record for that participant.
Show/Hide Grid: The Show Grid option allows the test author to display a set of grid lines on the trail space area, facilitating the placing of tokens on that space. Clicking the Show Grid button will result in the display of the Display Grid Lines box which allows for the specification of the number of horizontal and vertical lines to be used in editing the grid. The grid can subsequently be hidden by clicking the Hide Grid button (aka Show Grid button).
Save Trial: The Save Trial button saves the trial as currently defined to the test definition database. Clicking the Save Trial button saves all of the test author’s changes.
EXIT: The EXIT button allows the user to exit from the Add/Edit Trials screen. If changes to a trial have not been saved before the user attempts to exit the current trial (either using the navigation buttons to move to the next or a previous trial, or to completely exit the Add/Edit Trials screen) a dialog box will open reminding the user to save new changes before exiting. If a user chooses to exit without saving, then changes to the current trial will not be saved.
Token Edit Tool
To allow further editing of token characteristics, the Token Edit Tool can be opened inside the Add/Edit Trials screen (see Figure 11). Open this by placing the mouse pointer over the token to be edited and clicking the right mouse button. (In Figure 11 the tool has been opened for token 24, and that number is therefore currently displayed in the Token Edit tool window’s “Cue Index” in the lower left of the window).
As previously noted, tokens can be positioned on the screen by simply “dragging” them to the desired position and then “dropping” them. Alternatively, they can be precisely positioned using the Token Edit tool. The Top and Left edit boxes allow for precisely locating a token on the trail space. (The area of the trail space is 10,520 units high by 13,360 units wide. Each circle or square token has a width and height of 735 units, while a text token has a width of 1850 and height of 495 units.)
20

Token Indexes: A token added to a trail is assigned an index, beginning with index 1 for the first token added; each token subsequently added is assigned the next sequentially available index. (Note: this index is independent of token captions). This is important because, when the test runs, the correct trail is determined by token indexes. Token 1 is the first correct token, token 2 the next correct token and so on through token Last Token. Clicking any token other than the token with the next Cue Index will result in the display of an error indication (a red line). A token’s Cue Index cannot be edited, but any other characteristic of the token can be changed to meet the test author’s need.
The Token Type can be selected from among three types of tokens: a circle (such as those displayed in Figure 8); a square (similar in size to the circle); and a text box (an elongated rectangle suitable for displaying text up to approximately ten characters in length).
Token Captions: Token captions can be numbers, letters, or text. The Select Caption Font pull-down list allows for the selection of any font installed on the computer to be used in the display of a token’s caption. Once a font is selected, choose the “caption” option (beneath the caption box), and then edit a token’s caption by clicking inside the caption edit box. Captions for circular and square tokens can be any combination of keyboard characters up to three characters in length (depending on the font size selected), while text for a text box token can be up to ten characters in length.
The Icon Color, Token Color and Flash Color determine, respectively, the color in which the caption will be displayed, the color of the token, and, if flashing has been enabled, the color which the token will flash. (See the description of flashing in “Flash Frequency”). Set any of the colors by left clicking the color box located immediately to the right of the color description label. This will open the color selection palette. Click on a color to select it, then click OK. The color box will be painted with the selected color, as will the token once editing has been completed.
Flash Time sets the amount of time in milliseconds that the flash color will be displayed if flashing has been enabled (by activating the “flash frequency” box on the Add/Edit trials screen, Figure 10) and the token is selected for flashing. Note that every token can have a different flash time and color.
Normative DataComputerized versions of the TMT have been found in the literature, but the extent to which their measurements correspond to measurements produced by traditional paper and pencil versions of the TMT remains unclear. In developing a computerized test our
21

initial step was to compare performance on a computerized version of the TMT to the paper-pencil version across the lifespan. We have used the “Standard Test,” included as a preprogramed test in your distribution package of the CogQuiz Neuropsychological Assessment Tests implementation of the “Trail Making Test,” in an extended study of normal cognitive changes across the lifespan.
Table 1 shows the means and standard deviations for Participants (N = 829) between the ages of 5 and 90 on time-to-completion. Participants were recruited from a college student population, relatives of students, or from a local senior center. Participants under 18 years of age received five dollars per hour and participants over 60 years of age received 10 dollars per hour. Participants between the ages of 18 and 59 received extra course credit for their participation. Participants reported no head injuries, neurological diseases, or psychiatric illnesses which they believed would affect their performance. All Participants were given both the standard paper and pencil version of the TMT and our computerized implementation of that standard test as part of a comprehensive package of tests assessing normal cognitive functioning. The order in which the alternative forms of the test were administered was randomly determined for each participant and administration of the two test forms occurred on different days.
22
Part A Part B
Version n M SD M SD
Paper-pencil 829 30.01 15.82 68.65 47.23
Computer 829 33.83 15.25 60.78 34.44Table 1
Table 2 shows the correlations between the time-to-completion measurement for the paper and pencil version on the TMT and the computerized version.
Table 2 CorrelationsTrail Making
Part A Test
Time
Trail Making
Part B Test
Time
computer trail
making part a
test time
computer trail
making part b
test time
Trail Making Part A Test
Time
Pearson Correlation 1 .761** .663** .686**
Significance(2-tailed) .000 .000 .000
N 829 829 829 829
Trail Making Part B Test
Time
Pearson Correlation .761** 1 .686** .753**
Significance(2-tailed) .000 .000 .000
N 829 829 829 829
computer trail making part
a test time
Pearson Correlation .663** .686** 1 .815**
Significance(2-tailed) .000 .000 .000
N 829 829 829 829
computer trail making part
b test time
Pearson Correlation .686** .753** .815** 1
Significance(2-tailed) .000 .000 .000
N 829 829 829 829
**. Correlation at 0.01(2-tailed):...
Tables 3. 4 and 5(below) give descriptive statistics for time-to-completion broken out by age for both Part A and Part B of the CogQuiz Neuropsychological Assessments test’s Trail Making Test, “Standard Test.” The data are shown for males, females, and males and females combined.
23

Table 3. Male Trials A and B Times
N Mean
Std.
Deviation Std. Error
95% Confidence Interval for
Mean
Minimum MaximumLower Bound Upper Bound
computer
trail
making
part a test
time
5 to 9 31 74.0230 27.20353 4.88590 64.0446 84.0013 32.71 133.56
10 to 14 53 36.6646 10.33125 1.41911 33.8170 39.5122 14.55 70.16
15 to 19 106 28.1259 7.15758 .69521 26.7474 29.5044 15.22 53.77
20s 122 26.1538 5.12539 .46403 25.2351 27.0725 16.45 42.88
30s 35 29.4760 12.31558 2.08171 25.2454 33.7066 19.78 90.00
40s 25 30.5884 9.21006 1.84201 26.7867 34.3902 18.20 55.13
50s 12 32.9508 8.34451 2.40885 27.6490 38.2527 21.11 48.13
60s 26 37.3517 12.88597 2.52715 32.1469 42.5564 16.78 85.52
70s 25 41.1617 12.33978 2.46796 36.0681 46.2553 19.47 66.43
80s 16 49.8863 16.07499 4.01875 41.3206 58.4521 29.30 96.91
Total 451 34.1468 16.58474 .78094 32.6120 35.6815 14.55 133.56
computer
trail
making
part b test
time
5 to 9 31 149.4363 61.88845 11.11549 126.7355 172.1372 48.22 312.97
10 to 14 53 71.4983 28.05685 3.85391 63.7648 79.2317 26.58 153.95
15 to 19 106 48.2654 14.91125 1.44831 45.3936 51.1371 24.56 110.65
20s 122 45.7000 12.40709 1.12329 43.4761 47.9238 24.41 100.63
30s 35 46.2800 14.68881 2.48286 41.2342 51.3258 26.95 100.00
40s 25 50.2130 24.25854 4.85171 40.1996 60.2264 23.67 144.58
50s 12 54.1903 10.00004 2.88676 47.8366 60.5441 39.34 69.81
60s 26 64.4760 20.18720 3.95904 56.3222 72.6298 39.02 123.18
70s 25 81.6370 23.42068 4.68414 71.9695 91.3046 45.66 131.00
80s 16 95.0188 41.49043 10.37261 72.9101 117.1275 48.33 205.63
Total 451 61.8104 36.63081 1.72488 58.4205 65.2002 23.67 312.97
24

Table 4 Female Trails A and B Performance Times
N Mean
Std.
Deviation
Std.
Error
95% Confidence Interval
for Mean
Minimu
m
Maximu
m
Lower
Bound
Upper
Bound
computer trail making
part a test time
5 to 9 46 75.2961 47.31036 6.97553 61.2466 89.3455 33.25 296.20
10 to
14
39 31.6635 6.46164 1.03469 29.5688 33.7581 19.00 50.03
15 to
19
252 27.1767 5.43709 .34250 26.5022 27.8513 15.70 62.66
20s 305 27.6969 5.68018 .32525 27.0568 28.3369 13.72 50.14
30s 68 28.8945 7.60371 .92209 27.0540 30.7349 16.85 69.87
40s 37 30.2018 8.89003 1.46151 27.2377 33.1658 16.78 63.79
50s 36 32.1542 7.03137 1.17190 29.7751 34.5333 19.13 54.92
60s 48 39.4802 10.54974 1.52272 36.4169 42.5435 18.45 65.85
70s 47 43.0522 13.97103 2.03788 38.9502 47.1543 21.84 94.31
80s 29 50.0062 15.47702 2.87401 44.1191 55.8934 20.47 78.08
Total 907 32.6385 17.09870 .56775 31.5242 33.7527 13.72 296.20
computer trail making
part b test time
5 to 9 46 152.714
6
76.43033 11.2690
4
130.0176 175.4116 53.70 373.65
10 to
14
39 59.0399 16.71276 2.67618 53.6223 64.4576 32.58 117.29
15 to
19
252 44.4032 11.01984 .69418 43.0360 45.7703 24.07 92.80
20s 305 47.0122 14.54152 .83265 45.3737 48.6507 22.84 139.59
30s 68 46.5212 14.76141 1.79008 42.9482 50.0942 24.89 102.28
40s 37 49.5907 16.11927 2.64999 44.2162 54.9651 27.94 103.94
50s 36 54.5031 16.70446 2.78408 48.8511 60.1551 34.72 104.05
60s 48 70.7722 23.66716 3.41606 63.9000 77.6445 35.24 149.32
70s 47 83.0665 32.61335 4.75715 73.4909 92.6422 44.22 186.66
80s 29 108.831
4
43.34142 8.04830 92.3452 125.3176 54.56 197.30
Total 907 57.6334 35.62931 1.18305 55.3115 59.9552 22.84 373.65
25

Table 5 Male and Female Trails A and B Performance Times
N Mean
Std.
Deviation
Std.
Error
95% Confidence Interval
for Mean
Minimu
m
Maximu
m
Lower
Bound
Upper
Bound
computer trail
making part a test
time
5 to 9 77 74.7835 40.22194 4.58372 65.6543 83.9128 32.71 296.20
10 to
14
93 34.5670 9.15035 .94885 32.6825 36.4515 14.55 70.16
15 to
19
358 27.4577 6.00339 .31729 26.8338 28.0817 15.22 62.66
20s 427 27.2560 5.56534 .26933 26.7266 27.7854 13.72 50.14
30s 103 29.0921 9.41339 .92753 27.2523 30.9318 16.85 90.00
40s 62 30.3577 8.94721 1.13630 28.0855 32.6298 16.78 63.79
50s 48 32.3534 7.29625 1.05312 30.2347 34.4720 19.13 54.92
60s 74 38.7324 11.38286 1.32323 36.0952 41.3695 16.78 85.52
70s 72 42.3958 13.36989 1.57566 39.2540 45.5376 19.47 94.31
80s 45 49.9636 15.50901 2.31195 45.3042 54.6230 20.47 96.91
Total 1359 33.1419 16.93257 .45932 32.2409 34.0430 13.72 296.20
computer trail
making part b test
time
5 to 9 77 151.394 70.52213 8.03674 135.3882 167.4013 48.22 373.65
10 to
14
93 66.1508 24.46657 2.53707 61.1120 71.1896 26.58 153.95
15 to
19
358 45.5467 12.40537 .65564 44.2573 46.8361 24.07 110.65
20s 427 46.6373 13.96331 .67573 45.3091 47.9655 22.84 139.59
30s 103 46.4392 14.66504 1.44499 43.5731 49.3054 24.89 102.28
40s 62 49.8416 19.62064 2.49182 44.8589 54.8243 23.67 144.58
50s 48 54.4249 15.20586 2.19478 50.0096 58.8402 34.72 104.05
60s 74 68.5600 22.56891 2.62358 63.3312 73.7888 35.24 149.32
70s 72 82.5702 29.58040 3.48608 75.6191 89.5212 44.22 186.66
26

80s 45 103.920 42.74302 6.37175 91.0788 116.7617 48.33 205.63
Total 1359 59.0213 35.99208 .97633 57.1061 60.9366 22.84 373.65
27
16
References
Army Individual Test Batters: Manual of directions and scoring (1944). Washington, D. C.: War Department, Adjutant General’s Office.
Lezak, Muriel Deutsch (1995). Neuropsychological assessment (Third Edition). New York, NY: Oxford University Press.
Maj, M., Janssen, R., Satz, P., Zaudig, M., Starace, F., Boor, d., Sughondhabirom, B., Bing, E. G., Lauabeya, M. K., Ndetei, D., Riedel, R., Shulte, G., & Sartorius, N. (1991). The world health organization’s cross-cultural study on neuropsychiatric aspects of infection with the human immunodeficiency virus 1 (HIV-1). British Journal of Psychiatry, 159, 351-356.
Mitrushina, Maura N., Boone, Kyle N., & D’Elia, Louis F. (1999). Handbook of normative data for neuropsychological assessment. New York, NY: Oxford University Press.
Oswald, W. D., Roth, E. (1978). Der Zahlen-Verbindungs Test (ZVT). Gottingen, Germany: Hogrefe.
Partington, J. E., & Leiter, R. G. (1949). Partington’s Pathway Test. The Psychological Service Center Bulletin, 1, 9-20.
Rabin, L. A., Barr, W. H., & Burton, L. A. (2005). Assessment practices of clinical neuropsychologists in the United States and Canada: A survey of INS, NAN, and APA Division 40 members. Archives of Clinical Neuropsychology, 20, 33-65.
Reitan, R.M. (1979). Manual for Administration of Neuropsychological Test Battery forAdults and Children. Tucson, AZ: Neuropsychology Laboratory
Salthouse, Timothy A., Toth, Jeffrey, Daniels, Karen, Parks, Collen, Pak, Richard, Wolbrette, Michelle, & Hocking, Kellie J. (2000). Effects of aging on efficiency of task switching in a variant of the trail making test. Neuropsychology, 14, 1, 102111.
Salthouse, T. A. (2011). What cognitive abilities are involved in trail-making performance? Intelligence, 39, 222-232.
28

Strauss, E., Sherman, E. M. S., & Spreen, O. (2006). A compendium of neuropsychological tests: Administration, norms, and commentary (Third Edition). New York, NY: Oxford University Press.
Vernon, P. A. (1993). Der Zahlen-Verbindsungs Test and other trail-making correlates of general intelligence. Personality and Individual Differences, 14, 35-40.
Williams, Jane, Rickert, Vaughn, Hogan, John, Zolton, A.J., Satz, Paul, D’Elia, Louis F., Asarnow, Robert F., Zaucha, Ken, & Light, Roger. (1995). Children’s Color Trails.Archives of Clinical Neurology, 10, 3, 211-223.
29

INDEX
Adding new or Editing Participants, 8
Add/Edit Trials, 17
Add/Edit Trials screen, 17
Adding tokens, 19
Administrator (database)
• Setup, 5-8• Administrator (all) user, 7, 8• Pre-programmed, COGQUIZ, 5
Analysis, 14
Analysis screen, 14
Analysis summary table, 15
Analysis running record grid, 15-16
Back-up Participant file, 10
Captions (on tokens), 22
Color:
• Flash, 17, 23• Random, 7• Selecting (for) Test Screen, 17
Create/Edit TMT test, 16
Create/Edit a test screen, 16
Data Administrator (user), 8
Data backup, 10
Data Entry only (user), 8
Data management:
• Administer UserCodes/password window, 7• Administrator set-up, 5-8• Analysis, 14• Analysis, export, 16• Analysis, export to clipboard, 15• Analysis, print, 15, 16
30

• Analysis, running record, 15-16• Analysis, summary table, 15• Back-up, 10• Login, 5-6• Participant data Output to Text file, 9• Participant database window, 6• Password, 6, 7• Print, 15, 16• Shared database, 5• User code, 6, 7• User name, 6, 7• User privileges, 8
Data, normative data, 23
Edit:
• A test, 16-17 A trial, 17-23• Participant information, 8-9• Trial instructions, 19-20
Executing a Trail Making Test, 10-16
Exit:
• (terminating) an executed test, 14• the Add/edit trials screen, 21
Exporting (data), 15-16
Flash:
• Color, 17, 23• Frequency, 17• Time, 23
Font:
• Dingbat, 23• (for) instruction editor, 22• (for) text box token, 22
Grid (show/hide), 20
History of Trail Making Test, 3
Icons
• Instead of printed messages, 17• use on tokens (dingbats), 22
Indexes (for tokens), 21
31

Instruction Editor, 19-20
Instructions (writing/importing), 19-20
Login, 5-6
Messages (written or icon), 17
Mouse (using for input), 12
Navigation buttons, 18
Output to text file (participant data),
9
Participant:
• Adding new, 8• Database, 5• Data management window, 6• Data Output to Text File, 9• Editing an existing, 8• Identification, editing, 8-9• Identification, suppressing, 15• Information, identifying, 8, 15• Response options, 12• Selecting to edit data file, 9• Selecting to execute a test, 11• Selecting for Output to Text File, 9
Participant Database
• Add new user, 8• Administration of, 5-8• Shared, 5• User name, 5-6• User Password, 5-6• User Code, 5-6• Set-up, 5
Participant information:
• Add, 8-9 Edit, 8-9• Suppress, 15
Passwords, 5-6Printing:
• Participant data (output to text file), 9• Analysis results, summary table, 15• Analysis results, running record, 16
32

Prompt delay, 20
Prompt for Response, 20
Random color, 17
Results (see Analysis)
Screen color, 17
Screens (and windows):
• Add/edit Trials, 17-18• Administer UserCode/passwords, 7• Analyze (data), 14• Create/edit Trail Making Test, 16-17• Login, 6• Instructions (test example), 12• Instruction Editor, 19-20• Participants to Text File, 9• Participant Data Management, 6• Select Participant, 11• Test (example Trail), 13• Welcome, 1
Select (a) participant
• Data for output to text file, 9• (for) Testing, 11• (for) Data analysis,14-15• Screen, 11• Suppressing identifying information, 15
Suppressing (participant info), 5
Terminating (an executed test), 14
Test:
• Add/edit trials, 17• Analysis, 14-16• Captions, 22• Creating a test, 16-17• Editing a test, 16-17• Executing (running), 10• Exiting, 14• Exporting data, 16• Exporting to clipboard, 15• Flash Color, 17, 23• Flash Frequency, 17• Flash Time, 23• Grids, 20
33

• Icons and dingbat fonts, 22• Instructions, 19-20• Installation and setup, 5• Last Token, 20• Messages, 17• Navigation buttons, 18• Printing data, 15, 16• Prompt delay, 20• Prompt for response, 20• Screen color, 17• Selecting to analyze (a participant’s) data, 14• Selecting to edit (a test), 16• Selecting to execute (a test), 10• Timed, 20• Tokens, 19• Token defaults, 19
Text box (tokens), 22
Text file (participant data), 9
Timed trial, 20
Token:
• Add/delete, 19• Captions, 22• Color (fore-color, back-color, flash), 23• Color (screen), 17• Cue index, 21• Defaults (setting), 19• Dingbat fonts, 22• Edit tool, 21• Flash color, 17, 23• Flash frequency, 17• Flash time, 23• Grid (show/hide), 20• Icons/dingbat fonts, 22• Indexes, 21• Last token, 20• Left/top boxes (for positioning), 21• Positioning, 19, 21• Positioning using left/top boxes, 21• Set defaults, 19• Shapes, 22• Text box, 22• Types, 22
34

Token Edit tool, 21 Touchscreen
(using for input), 12
Trial:
• Add,17• Duration, 20• Edit, 17-23• Exit, 21• Instructions, 19-20• Navigation buttons, 17-18• Print, 21• Prompt delay, 20• Prompt for response, 20• Save, 21• Timed, 20
User:
• Administrator set-up, 5• Levels of privilege, 8
User Code, 5-6
UserCode/password screen, 7
User Privileges (levels of), 8
Webdings, 22
35