Literature Search and Survey Report On Recycled Asphalt Pavement and Recycled Concrete Aggregate
Upload
trankhuongCategory
view
216download
3
Report of One Care MHRM Survey
Aggregate Plan ResultsApril 2015
Prepared by:
Office of Survey ResearchUniversity of Massachusetts Medical School 333 South StreetShrewsbury, MA 01545 http://chpr.umassmed.edu/survey

Office of Survey Research | Report of One Care MHRM Survey | Aggregate Plan Results | April 2015
Contents
Background........................................................................................................................................ 1
Methods............................................................................................................................................. 1
MHRM Summary Measures...............................................................................................................2
MHRM Item Level‐ Responses............................................................................................................3
Additional Topics................................................................................................................................8
Respondent Profile.............................................................................................................................9
Appendix I – Survey Response Rate and Final Disposition Summary...............................................10
Appendix II – Sample Counts............................................................................................................11

Office of Survey Research | Report of One Care MHRM Survey | Aggregate Plan Results | April 2015 Page 1
Background
This report presents findings from the One Care MHRM Survey, which was conducted on behalf of MassHealth to obtain quality of life information for One Care members with severe mental illness diagnoses.
MethodsThe survey was conducted from January to March 2015 by the Office of Survey Research (OSR) at the University of Massachusetts Medical School (UMMS) in collaboration with the MassHealth Quality Office, the One Care Program, and the Disability, Health and Employment Policy Unit.
Survey Content
The Mental Health Recovery Measure (MHRM) was utilized for this study, which assesses an individual’s mental health recovery process across the following eight conceptual domains:
Overcoming Stuckness Self Empowerment‐ Learning and Self Redefinition‐ Basic Functioning Overall Well Being‐ New Potentials Spirituality Advocacy/Enrichment
Sample
MassHealth provided the Center for Health Policy and Research (CHPR) at UMMS with a data set of member IDs and contact information for all currently enrolled One Care members. CHPR then used the member ID to query the MassHealth data warehouse to create a list of members with severe mental illness diagnoses. OSR screened this list to remove members without telephone numbers and used simple random sampling to draw a total sample of 2,500 One Care members – 1,000, 1,000, and 500 for Commonwealth Care Alliance, Fallon Total Care, and Network Health Unify, respectively.
Data Collection
OSR administered the survey to One Care members through a two wave mail protocol with telephone ‐follow up for non respondents. Sampled patients received a survey packet containing a cover letter ‐ ‐and questionnaire in English and Spanish and a postage paid return envelope. The cover letter ‐included a toll free phone number for respondents to call in case they needed help answering the‐ survey.Members who did not return the initial questionnaire received a second survey packet approximately two weeks later. Approximately two weeks after the second mailing, OSR’s professional interviewing staff began contacting non respondents by telephone to complete the survey over the phone. To ‐maximize response rates, the telephone protocol included at least five attempts to reach members, with calls made on different days and different times of day, including evenings and weekends. A Spanish speaking interviewer was available for respondents who preferred to answer the survey in ‐Spanish. The response rate for the total sample was 31.5%. A full description of survey disposition codes is included in Appendix I.

15%
16%
19%
Office of Survey Research | Report of One Care MHRM Survey | Aggregate Plan Results | April 2015 Page 2
MHRM Summary Measures
Survey results on each key dimension of the mental health recovery process are summarized below. These summary measures reflect an aggregation of multiple items within each domain. The chart displays the distribution of responses observed among total respondents across all three One Care plans. Blue shading represents the positive range of responses (agree/strongly agree) while red shading represents the negative range (disagree/strongly disagree). The table to the right of the chart shows the positive responses by each plan for comparison purposes, with blinded plan names.
Respondents report mixed progress in their mental health recovery. Overall, respondents are most positive about their progress in Learning and Self Redefinition and Overcoming Stuckness. The ‐Advocacy/Enrichment dimension yields the most negative scores overall. These findings are generally consistent across all three plans.
Overcoming Stuckness
Self Empowerment‐
Learning and Self‐Redefinition
Basic Functioning
Total Sample
Strongly Disagree/Disagree Not Sure Agree/Strongly Agree
Overall Well Being‐ 25% 20% 55%
New Potentials 21% 21% 58%
Spirituality 23% 16% 61%
Advocacy/Enrichment 35% 20% 46%
22%
11%
11%33%
16%
% Agree/StronglyAgree by PlanA B C
67 68 68
60 58 60
77 73 73
55 57 55
57 55 54
59 58 57
61 59 68
45 47 45
68%
59%
74%
56%

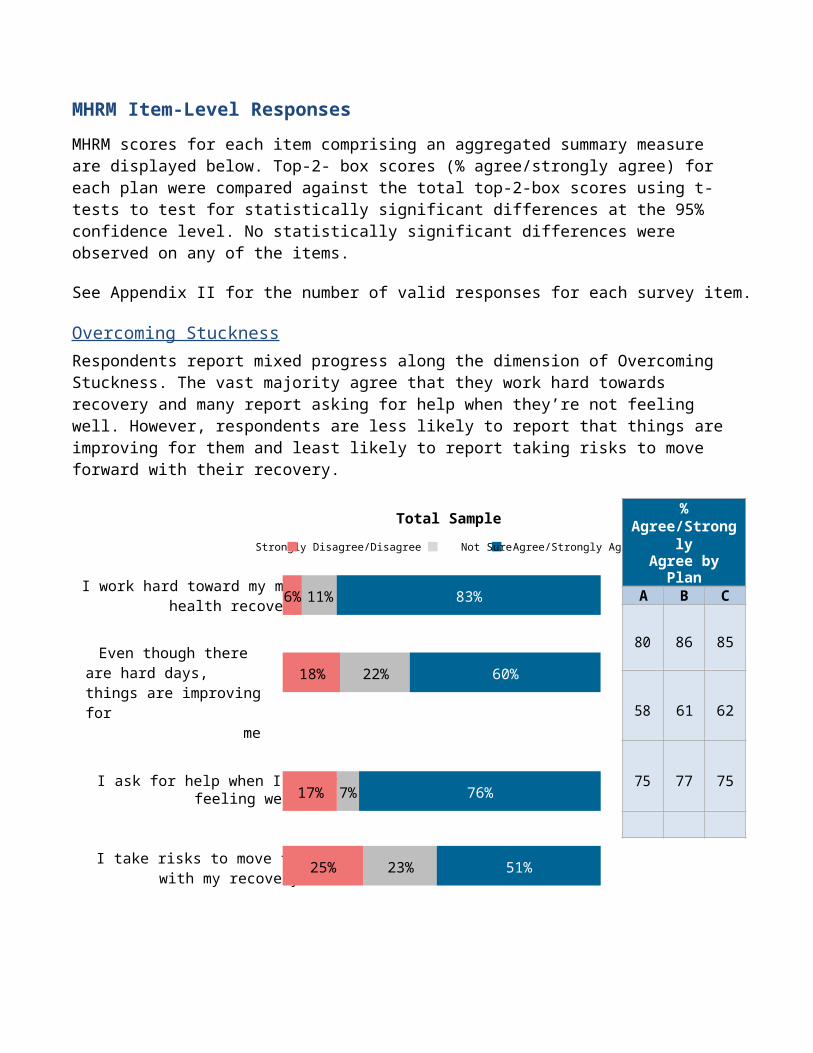
MHRM Item Level Responses‐MHRM scores for each item comprising an aggregated summary measure are displayed below. Top‐2 box scores (% agree/strongly agree) for each plan were compared against the total top 2 box ‐ ‐ ‐scores using t tests to test for statistically significant differences at the 95% confidence level. No ‐statistically significant differences were observed on any of the items.
See Appendix II for the number of valid responses for each survey item.
Overcoming StucknessRespondents report mixed progress along the dimension of Overcoming Stuckness. The vast majority agree that they work hard towards recovery and many report asking for help when they’re not feeling well. However, respondents are less likely to report that things are improving for them and least likely to report taking risks to move forward with their recovery.
Total Sample
Strongly Disagree/Disagree Not Sure Agree/Strongly Agree
I work hard toward my mentalhealth recovery
Even though there are hard days, things are improving for
me
I ask for help when I am notfeeling well
I take risks to move forwardwith my recovery
% Agree/StronglyAgree by PlanA B C
80 86 85
58 61 62
75 77 75
55 50 49
11%6% 83%
22%18% 60%
7%17% 76%
23%25% 51%

Self Empowerment‐Along the Self Empowerment dimension, respondents display more positive ratings on believing in self‐ and being in control of their lives. However, only about half the respondents feel they have control over their mental health problems. The extent of socializing is also low in this group as indicated by over one third disagreeing that they socialize and make friends.‐
Total Sample
Strongly Disagree/Disagree Not Sure Agree/Strongly Agree
I believe in myself
I have control over my mentalhealth problems
I am in control of my life
I socialize and make friends
Learning and Self Redefinition‐The Learning and Self Redefinition measure of mental health recovery shows the most positive ratings,‐ with nearly three in four respondents expressing agreement on all four attributes.‐ ‐
Total Sample
Strongly Disagree/Disagree Not Sure Agree/Strongly Agree
Every day is a new opportunityfor learning
I still grow and change in positive ways despite my mental health problems
Even though I may still have problems, I value myself as a
person of worth
I understand myself and have a good sense of who I am
% Agree/StronglyAgree by PlanA B C
73 67 68
55 51 52
62 61 64
51 52 54
17%13% 70%
24%23% 52%
22%16% 62%
12%36% 52%
% Agree/StronglyAgree by PlanA B C
80 76 76
73 72 70
77 73 76
76 70 67
13%10% 78%
16%12% 72%
14%11% 75%
17%11% 72%

Basic Functioning
23%
16%
21%
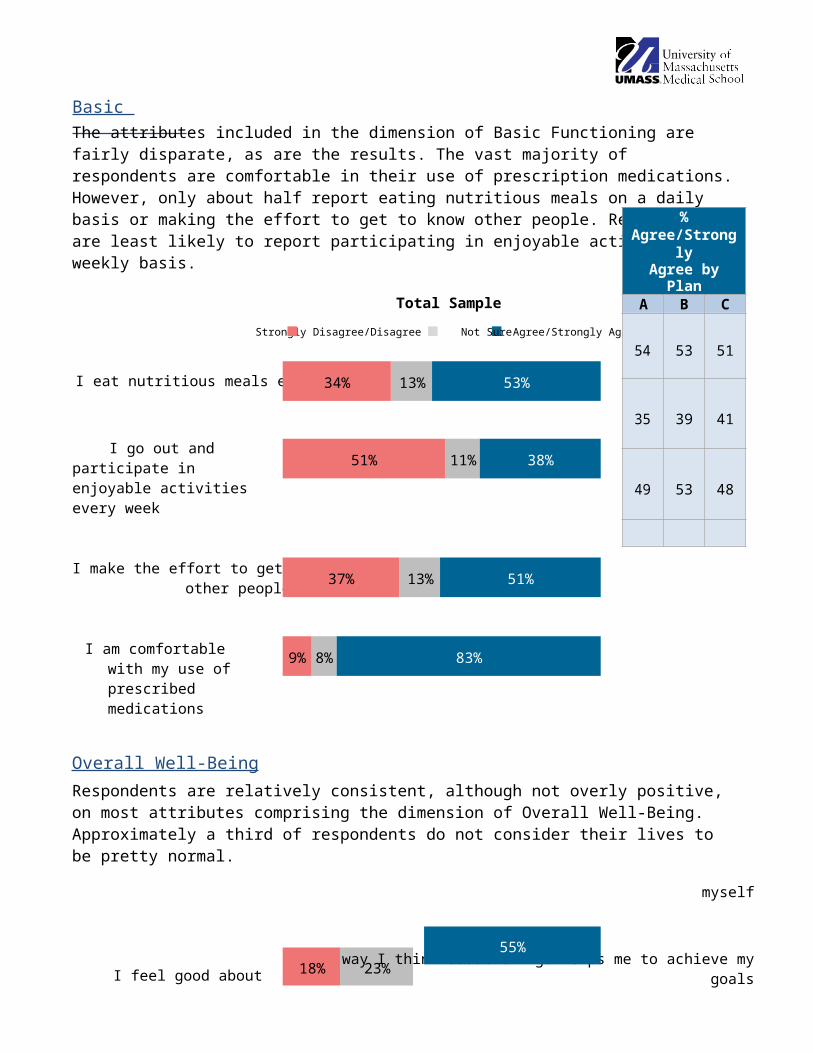
The attributes included in the dimension of Basic Functioning are fairly disparate, as are the results. The vast majority of respondents are comfortable in their use of prescription medications. However, only about half report eating nutritious meals on a daily basis or making the effort to get to know other people. Respondents are least likely to report participating in enjoyable activities on a weekly basis.
Total Sample
Strongly Disagree/Disagree Not Sure Agree/Strongly Agree
I eat nutritious meals every day
I go out and participate in enjoyable activities every week
I make the effort to get to knowother people
I am comfortable with my use of prescribed medications
Overall Well Being‐Respondents are relatively consistent, although not overly positive, on most attributes comprising the dimension of Overall Well Being. Approximately a third of respondents do not consider their lives to be‐ pretty normal.
I feel good about myself
The way I think about things helps me to achieve my goals
My life is pretty normal
I feel at peace with myself
Total Sample
Strongly Disagree/Disagree Not Sure Agree/Strongly Agree
% Agree/StronglyAgree by PlanA B C
54 53 51
35 39 41
49 53 48
83 84 82
13%34% 53%
11%51% 38%
13%37% 51%
8%9% 83%
55%
18%
19%25%
% Agree/StronglyAgree by PlanA B C
60 56 55
62 57 58
51 48 48
55 56 53
21% 57%
59%
34% 49%
New Potentials
15%
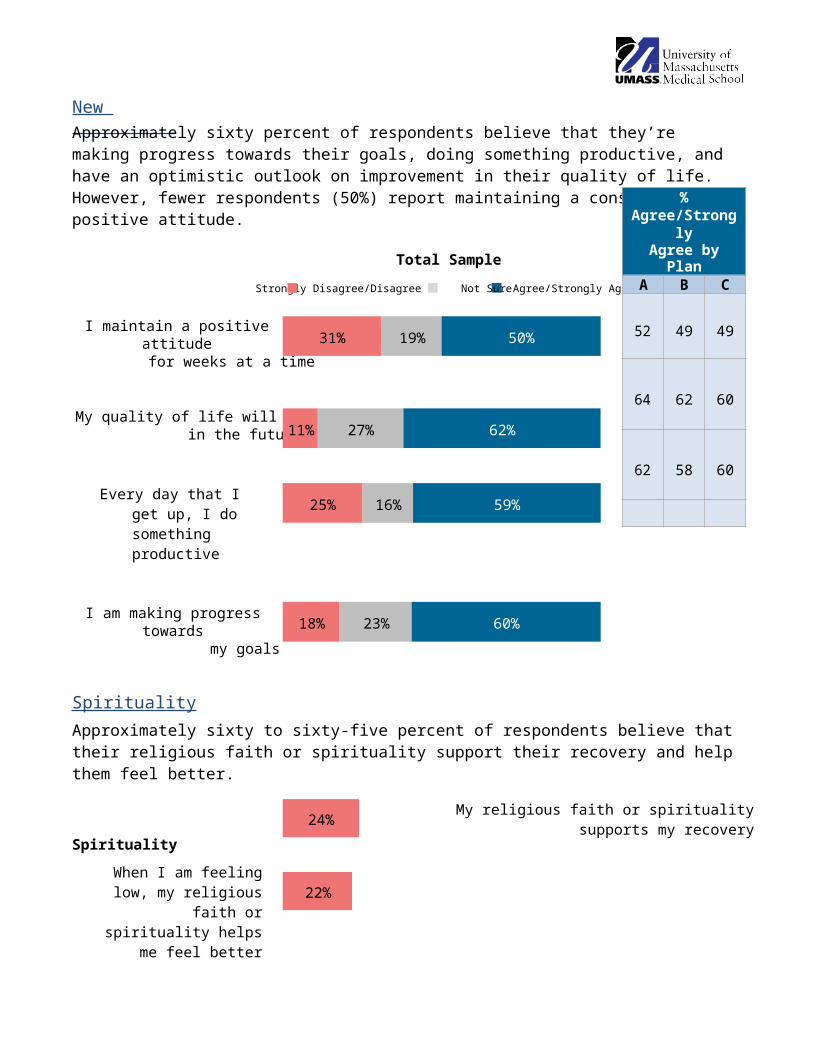
Approximately sixty percent of respondents believe that they’re making progress towards their goals, doing something productive, and have an optimistic outlook on improvement in their quality of life. However, fewer respondents (50%) report maintaining a consistently positive attitude.
Total Sample
Strongly Disagree/Disagree Not Sure Agree/Strongly Agree
I maintain a positive attitudefor weeks at a time
My quality of life will get betterin the future
Every day that I get up, I do something productive
I am making progress towardsmy goals
SpiritualityApproximately sixty to sixty five percent of respondents believe that their religious faith or spirituality‐ support their recovery and help them feel better.
Spirituality
When I am feeling low, my religious faith or spirituality
helps me feel better
My religious faith or spiritualitysupports my recovery
Total Sample
Strongly Disagree/Disagree Not Sure Agree/Strongly Agree
% Agree/StronglyAgree by PlanA B C
52 49 49
64 62 60
62 58 60
58 62 57
19%31% 50%
27%11% 62%
16%25% 59%
23%18% 60%
22%
24% 17% 59%
% Agree/StronglyAgree by PlanA B C
62 61 71
59 56 66
64%

Advocacy/EnrichmentRespondents report mixed views on the Advocacy/Enrichment dimension. Six in ten report ‐ ‐advocating for the rights of people with mental health problems and roughly half report coping effectively with the stigma associated with having a mental health problem. However, there is less agreement on the enrichment attributes. Less than half engage in enrichment activities and two thirds‐ report that they do not have enough money to spend towards personal enrichment.
Total Sample
Strongly Disagree/Disagree Not Sure Agree/Strongly Agree
I advocate for the rights of myself and others with mental
health problems
I engage in work or other activities that enrich myself and
the world around me
I cope effectively with stigma associated with having a mental health problem
I have enough money to spend on extra things or activities that
enrich my life
% Agree/StronglyAgree by PlanA B C
65 61 60
41 49 50
52 53 51
21 25 18
22%16% 62%
17%36% 46%
28%19% 52%
11%67% 22%

Additional TopicsLess than half the respondents report being satisfied with their lives while nearly thirty percent are dissatisfied. Socializing is relatively infrequent in this group of One Care members, with only a quarter of the respondents reporting that they socialize on a daily basis and twenty percent reporting the lowest levels of socializing (a few times a year or not at all).
Total SampleVery dissatisfied/Dissatisfied Neither satisfied or dissatisfied Satisfied/Very satisfied
Overall satisfaction with life
Total SampleNot at all/A few times a yearLess than once a month/At least once a month At least once a weekAt least once a day
Frequency of socializing*
* During the past 12 months, how often did you talk to or get together with family and/or friends?
% Satisfied/Very Satisfied by Plan
A B C
49 47 4524%28% 47%
% At Least Once a Day by Plan
A B C
26 25 2120% 24%24% 32%
Respondent ProfileThe table below shows respondents’ self reported demographic information. Roughly three quarters ‐ ‐of respondents are 45 or older, fifty five percent are female, and nearly sixty percent are white (non ‐Hispanic). Spanish is the most dominant language after English and just over three quarters of the ‐respondents hold a high school degree or higher. Employment levels are relatively low, with fewer than one in five respondents being employed in the last 12 months; however, the majority of those ‐ ‐who were employed have remained employed. Under one tenth of respondents experienced ‐homelessness in the last 12 months.
In terms of demographics by plan, Plans B skews a bit older while Plan A skews younger. Plan C has the highest percentage of female respondents (60%) and Plan A has the highest percentage of white (non‐ Hispanic) respondents (63%). There are no differences by plan on members’ language or education; however, Plan B skews slightly higher on employment.
Age18 to 44 years 24 32 19 2245 to 54 years 35 34 35 3655 or older 41 34 46 42
GenderMale 45 46 46 40Female 55 54 53 60Other <0.5 <0.5 1 0
Race/Ethnicity
White (non Hispanic)‐ 57 63 58 42Hispanic or Latino 15 17 12 17Black (non Hispanic)‐ 11 5 13 18Other race/ethnicity 17 15 17 23
Primary LanguageEnglish 82 82 82 81Spanish 16 17 14 17Other language 2 1 3 2
EducationSome high school or less 24 22 26 24High school graduate or GED 35 38 32 33Some college or higher 41 40 42 43
Worked for pay in the last 12 months 17 15 20 11
Currently working for pay (among those whoworked for pay in the last 12 months) 69 59 80 47
Experienced homelessness in last 12 months 8 8 7 11
Received help completing mail survey 10 10 11 6
%Total A B C

Appendix I – Survey Response Rate and Final Disposition Summary
Office of Survey Research | Report of One Care MHRM Survey | Aggregate Plan Results | April 2015 Page 10
The survey response rate (31.5%) was calculated by dividing the total completed surveys by the total sample, excluding ineligible cases. Ineligible cases are sample members who are deceased or were not able to complete the survey due to a language barrier or a mental or physical reason. See the table below for a complete list of final disposition codes in total and by plan.
Final Survey Status/Disposition CodesTotal
SampleCommonwealth
Care AllianceFallon
Total CareNetwork
Health Unify
Sample Counts 2500 1000 1000 500
Completed Interviews:Mail 18.6% 22.6% 14.8% 18.4%CATI 12.3% 12.2% 12.0% 13.2%Partial Interview (All modes) 0.3% 0.5% 0.2% 0.0%Total Completed Interviews 31.2% 35.3% 27.0% 31.6%
Non Interviews‐Refused 3.7% 4.2% 3.5% 3.0%Unknown Eligibility:
No Reply 20.2% 18.6% 21.5% 21.0%Reached Answering Machine 16.3% 15.2% 18.3% 14.4%Wrong Telephone Number 14.6% 12.9% 15.6% 15.8%Busy 5.2% 5.9% 4.1% 6.0%Disconnected 4.8% 4.8% 5.6% 3.2%Bad Address and Wrong Telephone Number 1.8% 1.1% 2.4% 2.2%Respondent Not Available 1.0% 0.7% 1.2% 1.0%Reached Fax Machine 0.5% 0.7% 0.4% 0.4%
Total Unknown Eligibility 64.4% 59.9% 69.1% 64.0%Ineligible:
Mental or Physical Incapacity 0.3% 0.3% 0.2% 0.6%Language Difficulty (other than Spanish) 0.2% 0.2% 0.0% 0.6%Deceased 0.2% 0.1% 0.2% 0.2%
Total Ineligible 0.7% 0.6% 0.4% 1.4%Total Non Interviews‐ 68.8% 64.7% 73.0% 68.4%
Response Rate (Completed Interviews/(Total Sample‐ Ineligible Sample)) 31.5% 35.5% 27.1% 32.0%
Total number of people with wrong telephonenumbers* 7.2% 12.9% 15.6% 15.8%
Total number of people with bad addresses* 16.6% 14.6% 17.7% 18.4%* Since people with a bad address or wrong telephone number could also be included in other disposition categories, these numbers are reported separately.
Appendix II – Sample Counts
Office of Survey Research | Report of One Care MHRM Survey | Aggregate Plan Results | April 2015 Page 11
The following table provides the number of valid responses for each survey question in total and by plan.
Response Count*
Total Commonwealth Care Alliance
Fallon Total Care
Network Health Unify
1.1 I work hard toward my mental health recovery 754 340 264 150
1.2Even though there are hard days, things are improving for me 758 339 265 154
1.3 I ask for help when I am not feeling well 759 339 265 155
1.4 I take risks to move forward with my recovery 740 330 262 148
1.5 I believe in myself 751 336 263 152
1.6 I have control over my mental health problems 743 330 260 153
1.7 I am in control of my life 752 335 264 153
1.8 I socialize and make friends 746 334 261 151
1.9 Every day is a new opportunity for learning 752 338 261 153
1.10I still grow and change in positive ways despite my mental health problems 751 331 265 155
1.11Even though I may still have problems, I value myself as a person of worth 752 336 265 151
1.12I understand myself and have a good sense of who I am 755 338 265 152
1.13 I eat nutritious meals every day 750 334 264 152
1.14I go out and participate in enjoyable activities every week 749 334 262 153
1.15 I make the effort to get to know other people 749 334 265 150
1.16I am comfortable with my use of prescribed medications 752 336 263 153
1.17 I feel good about myself 750 337 261 152
1.18The way I think about things helps me to achieve my goals 751 337 260 154
1.19 My life is pretty normal 747 332 263 152* 13 respondents were identified as constant raters (i.e., they gave the same rating across all MHRM items). These respondents were excluded from the analysis to ensure data quality.

Office of Survey Research | Report of One Care MHRM Survey | Aggregate Plan Results | April 2015 Page 12
Response Count
Total Commonwealth Care Alliance
Fallon Total Care
Network Health Unify
1.20 I feel at peace with myself 741 330 263 148
1.21 I maintain a positive attitude for weeks at a time 744 333 261 150
1.22 My quality of life will get better in the future 742 332 258 152
1.23Every day that I get up, I do something productive 745 333 260 152
1.24 I am making progress towards my goals 746 332 260 154
1.25When I am feeling low, my religious faith or spirituality helps me feel better 746 334 260 152
1.26My religious faith or spirituality supports my recovery 744 334 256 154
1.27I advocate for the rights of myself and others with mental health problems 733 328 255 150
1.28I engage in work or other activities that enrich myself and the world around me 738 328 257 153
1.29I cope effectively with stigma associated with having a mental health problem 723 321 253 149
1.30I have enough money to spend on extra things or activities that enrich my life 747 332 261 154
2 Overall, how satisfied are you with your life? 763 344 263 156
3During the past 12 months, how often did you talk to or get together with family and/orfriends?
746 341 255 150
4 What is your age now? 768 345 265 158
5 What is your gender? 765 342 266 157
6 Are you of Hispanic or Latino origin or descent? 751 337 263 151
7 What is your race? 774 348 268 158
8 What language do you mainly speak at home? 730 328 257 145
9 What is the highest grade or level of school youhave completed? 750 340 257 153
10 Have you worked for pay in the last 12 months? 763 342 265 156
11 Are you currently working at a job for pay? 123 69 37 17
12 During the past 12 months, have youexperienced homelessness? 761 344 262 155
13 Did someone help you complete this survey? 458 222 147 89