Microsoft Word - Final UWMP 12-12-05.doc · Web viewFINAL. URBAN WATER MANAGEMENT PLAN. GOLETA...
130
FINAL URBAN WATER MANAGEMENT PLAN GOLETA WATER DISTRICT DECEMBER 20, 2005 Corrected December 10, 2007 Prepared for: Goleta Water District 4699 Hollister Avenue Goleta, California 93110 Contact: Mr. Kevin Walsh, General Manager 805-964-6761 www.goletawater.com
Transcript of Microsoft Word - Final UWMP 12-12-05.doc · Web viewFINAL. URBAN WATER MANAGEMENT PLAN. GOLETA...
FINALURBAN WATER MANAGEMENT PLAN
GOLETA WATER DISTRICTDECEMBER 20, 2005
Corrected December 10, 2007
Prepared for:Goleta Water District4699 Hollister Avenue
Goleta, California 93110Contact: Mr. Kevin Walsh, General Manager
805-964-6761www.goletawater.com
Prepared by:URS Corporation
130 Robin Hill Road, Suite 100Goleta, California 93117Contact: Dr. John Gray
805-964-6010
Table of Contents
1.0 INTRODUCTION.....................................................................................................................12.0 DESCRIPTION OF SERVICE AREA......................................................................................23.0 WATER SOURCES .................................................................................................................6
3.1 CACHUMA PROJECT ......................................................................................................63.2 STATE WATER PROJECT ...............................................................................................73.3 RECYCLED WATER.........................................................................................................83.4 GROUNDWATER .............................................................................................................83.4.1 Overview...........................................................................................................................8
3.4.2 Basin Description .......................................................................................................83.4.3 Groundwater Occurrence............................................................................................93.4.4 Water Levels ............................................................................................................123.4.5 Storage......................................................................................................................123.4.6 Groundwater Production ..........................................................................................133.4.7 Production Rights......................................................................................................133.4.8 District Wells............................................................................................................13
3.5 SUMMARY OF WATER SUPPLY..................................................................................143.6 WHOLESALE WATER SUPPLIER PROJECTIONS ....................................................15
4.0 WATER SUPPLY RELIABILITY .........................................................................................184.1 RELIABILITY ESTIMATES ...........................................................................................184.2 SUMMARY OF FACTORS AFFECTING RELIABILITY.............................................20
5.0 OPPORTUNITIES FOR EXCHANGES OR TRANSFERS .................................................225.1 EXCHANGES OR TRANSFERS ....................................................................................225.2 INTERCONNECTIONS ...................................................................................................235.3 WATER WHEELING AGREEMENTS...........................................................................23
6.0 PAST, CURRENT, AND FUTURE WATER USE BY SECTOR.........................................246.1 HISTORIC AND CURRENT WATER USE ...................................................................246.2 PROJECTED WATER USE .............................................................................................25
7.0 WATER CONSERVATION, INCLUDING DEMAND MANAGEMENT MEASURES....268.0 FUTURE WATER SUPPLY PROJECTS...............................................................................28
8.1 IMPROVEMENTS FOR SYSTEM RELIABILITY - NORMAL OPERATIONS..........288.2 IMPROVEMENTS FOR SYSTEM RELIABILITY DURING EMERGENCIES...........28
9.0 DEVELOPMENT OF DESALINATED WATER..................................................................3010.0 URBAN WATER SHORTAGE CONTINGENCY PLAN ..................................................31
10.1 STAGES OF ACTION....................................................................................................3110.2 MINIMUM WATER SUPPLY FOR THE NEXT THREE YEARS..............................3410.3 PREPARATION FOR CATASTROPHIC WATER SUPPLY INTERRUPTION.........3410.4 PROHIBITIONS, RESTRICTIONS, AND PENALTIES .............................................3510.5 ANALYSIS OF REVENUE IMPACTS OF REDUCED SALES..................................3610.6 WATER SHORTAGE CONTINGENCY ORDINANCE/RESOLUTION....................3610.7 USE MONITORING ......................................................................................................37
11.0 RECYCLED WATER PLAN ...............................................................................................3811.1 WASTEWATER TREATMENT SYSTEM DESCRIPTION .......................................3811.2 ENCOURAGING WATER USE....................................................................................39
12.0 WATER QUALITY IMPACTS ON RELIABILITY............................................................4212.1 SURFACE WATER........................................................................................................4212.2 GROUND WATER ........................................................................................................42
13.0 WATER SERVICE RELIABILITY......................................................................................4313.1 NORMAL YEAR RELIABILITY..................................................................................43
13.2 CRITICALLY DRY YEAR RELIABILITY...................................................................4313.3 MULTIPLE DRY YEAR RELIABILITY.......................................................................44
14.0 AGENCY COORDINATION...............................................................................................4615.0 PUBLIC PARTICIPATION .................................................................................................4716.0 REFERENCES .....................................................................................................................48
Appendix A Water Use Projections............................................................................................49
Appendix B Wright Suit, Tenth Annual Report in the Wright v. Goleta Water District,
Safe Ordinance 1991, Safe Ordinance Amendment 1994.....................................65
Appendix C CUWCC Reports...................................................................................................70
C-1 CUWCC BMP Activity Reports for 2001-2004..........................................................70
C-2 CUWCC Coverage Reports for 2003-2004.................................................................75
C-3 CUWCC Coverage Calculator for the District............................................................80
C-4 Ordinance 91-3.............................................................................................................85
Appendix D Goleta Water District System Reliability Study, Section 7.1................................90
Appendix E Adoption Resolution, Public Notice......................................................................92
1.0 INTRODUCTION
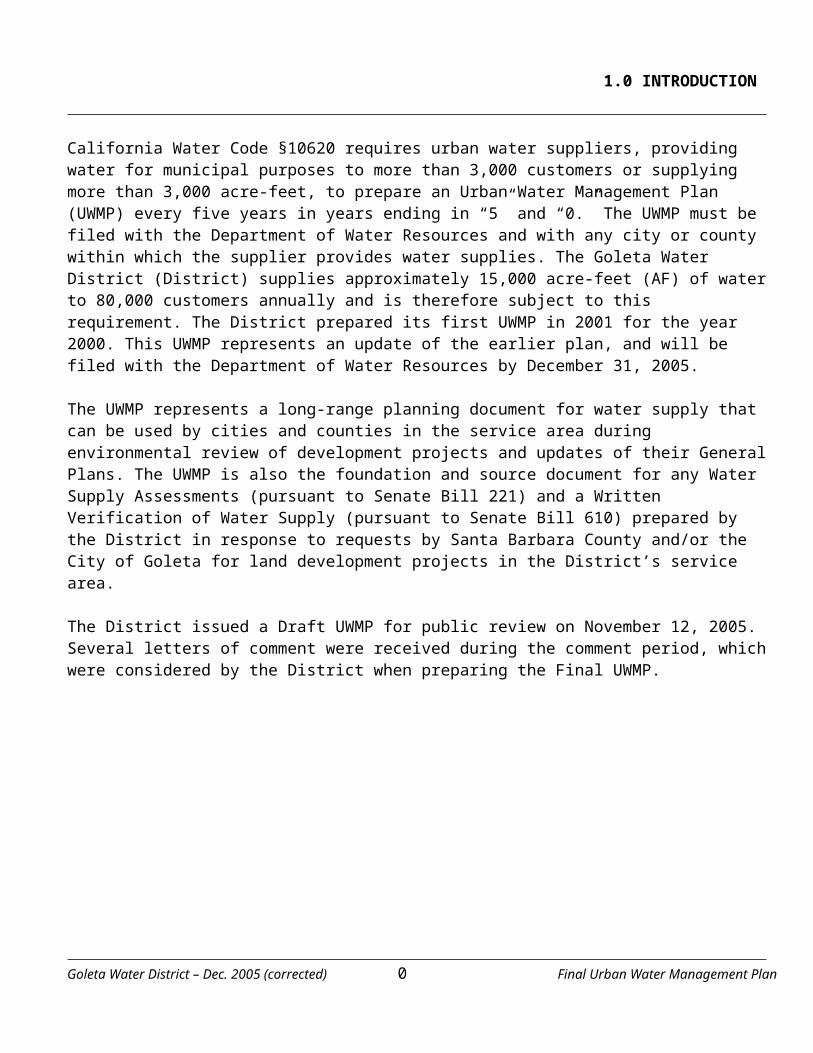
California Water Code §10620 requires urban water suppliers, providing water for municipal purposes to more than 3,000 customers or supplying more than 3,000 acre-feet, to prepare an Urban Water Management Plan (UWMP) every five years in years ending in “5” and “0.” The UWMP must be filed with the Department of Water Resources and with any city or county within which the supplier provides water supplies. The Goleta Water District (District) supplies approximately 15,000 acre-feet (AF) of water to 80,000 customers annually and is therefore subject to this requirement. The District prepared its first UWMP in 2001 for the year 2000. This UWMP represents an update of the earlier plan, and will be filed with the Department of Water Resources by December 31, 2005.
The UWMP represents a long-range planning document for water supply that can be used by cities and counties in the service area during environmental review of development projects and updates of their General Plans. The UWMP is also the foundation and source document for any Water Supply Assessments (pursuant to Senate Bill 221) and a Written Verification of Water Supply (pursuant to Senate Bill 610) prepared by the District in response to requests by Santa Barbara County and/or the City of Goleta for land development projects in the District’s service area.
The District issued a Draft UWMP for public review on November 12, 2005. Several letters of comment were received during the comment period, which were considered by the District when preparing the Final UWMP.
Goleta Water District – Dec. 2005 (corrected) 0 Final Urban Water Management Plan
2.0 DESCRIPTION OF SERVICE AREA
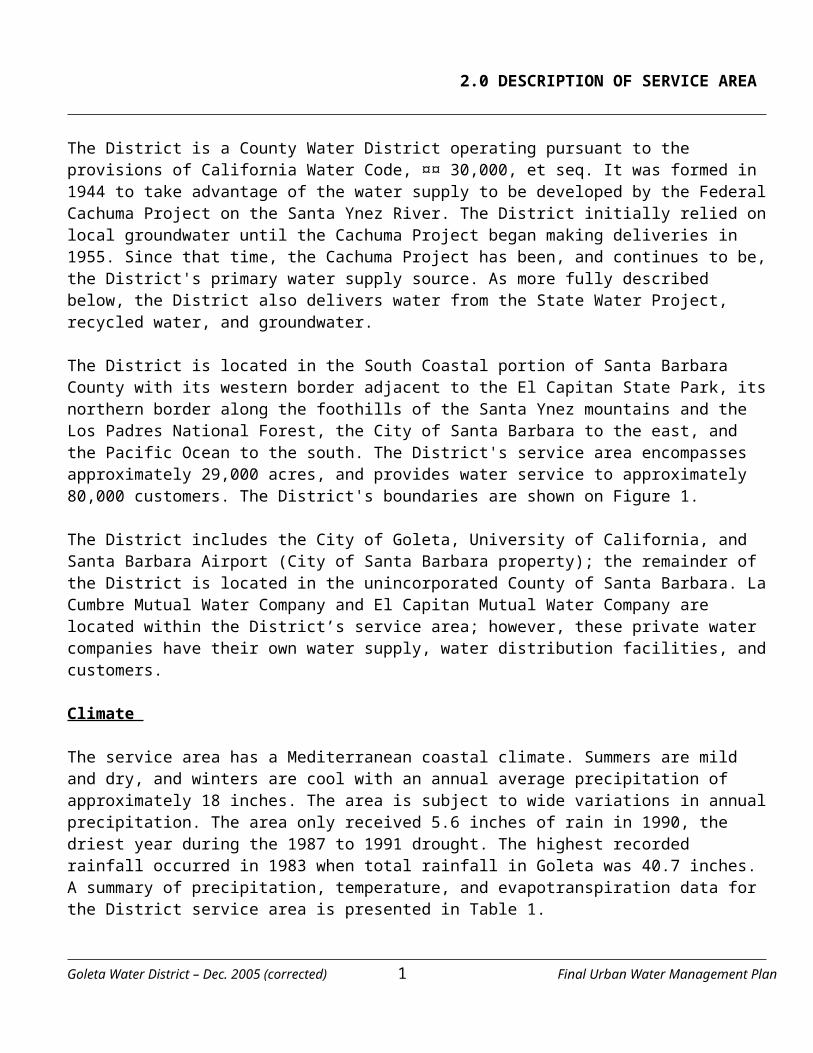
The District is a County Water District operating pursuant to the provisions of California Water Code, ¤¤ 30,000, et seq. It was formed in 1944 to take advantage of the water supply to be developed by the Federal Cachuma Project on the Santa Ynez River. The District initially relied on local groundwater until the Cachuma Project began making deliveries in 1955. Since that time, the Cachuma Project has been, and continues to be, the District's primary water supply source. As more fully described below, the District also delivers water from the State Water Project, recycled water, and groundwater.
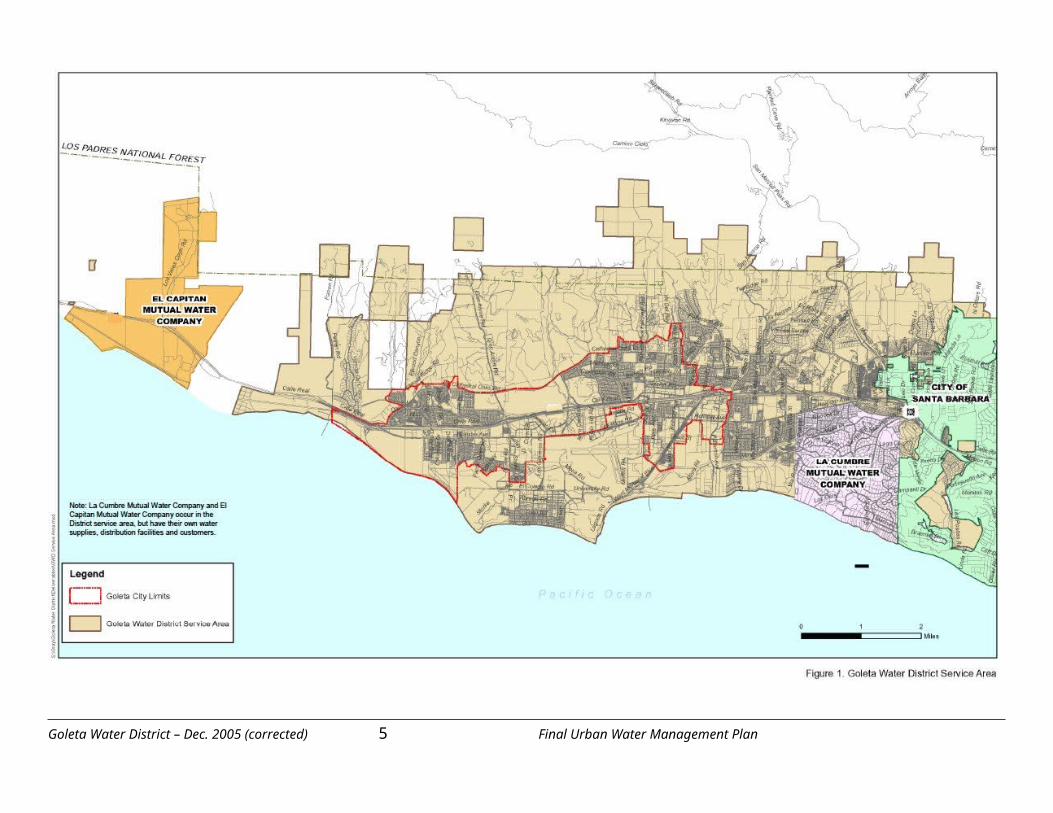
The District is located in the South Coastal portion of Santa Barbara County with its western border adjacent to the El Capitan State Park, its northern border along the foothills of the Santa Ynez mountains and the Los Padres National Forest, the City of Santa Barbara to the east, and the Pacific Ocean to the south. The District's service area encompasses approximately 29,000 acres, and provides water service to approximately 80,000 customers. The District's boundaries are shown on Figure 1.
The District includes the City of Goleta, University of California, and Santa Barbara Airport (City of Santa Barbara property); the remainder of the District is located in the unincorporated County of Santa Barbara. La Cumbre Mutual Water Company and El Capitan Mutual Water Company are located within the District’s service area; however, these private water companies have their own water supply, water distribution facilities, and customers.
Climate
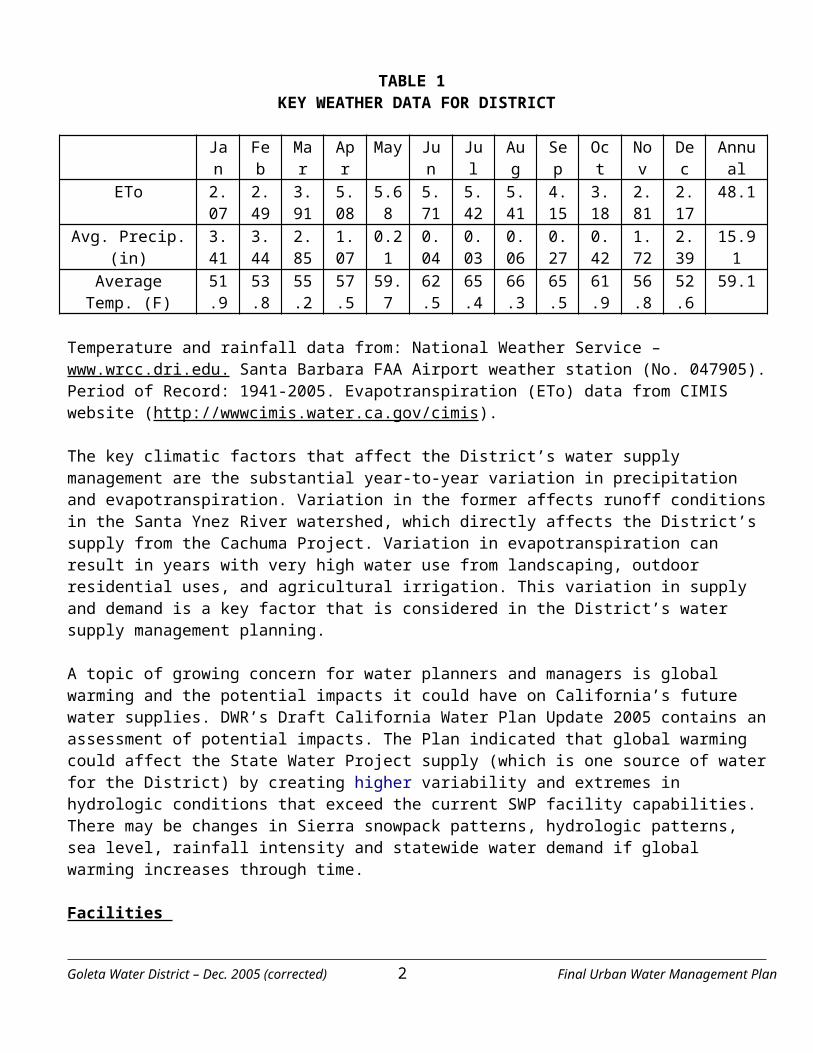
The service area has a Mediterranean coastal climate. Summers are mild and dry, and winters are cool with an annual average precipitation of approximately 18 inches. The area is subject to wide variations in annual precipitation. The area only received 5.6 inches of rain in 1990, the driest year during the 1987 to 1991 drought. The highest recorded rainfall occurred in 1983 when total rainfall in Goleta was 40.7 inches. A summary of precipitation, temperature, and evapotranspiration data for the District service area is presented in Table 1.
TABLE 1 KEY WEATHER DATA FOR DISTRICT
Jan Feb Mar Apr May Jun Jul Aug Sep Oct Nov Dec Annual ETo 2.07 2.49 3.91 5.08 5.68 5.71 5.42 5.41 4.15 3.18 2.81 2.17 48.1
Avg. Precip. (in) 3.41 3.44 2.85 1.07 0.21 0.04 0.03 0.06 0.27 0.42 1.72 2.39 15.91 Average Temp.
(F) 51.9 53.8 55.2 57.5 59.7 62.5 65.4 66.3 65.5 61.9 56.8 52.6 59.1
Temperature and rainfall data from: National Weather Service – www.wrcc.dri.edu. Santa Barbara FAA Airport weather station (No. 047905). Period of Record: 1941-2005. Evapotranspiration (ETo) data from CIMIS website (http://wwwcimis.water.ca.gov/cimis).
The key climatic factors that affect the District’s water supply management are the substantial year-to-year variation in precipitation and evapotranspiration. Variation in the former affects runoff conditions in the Santa Ynez River watershed, which directly affects the District’s supply from the Cachuma Project. Variation in evapotranspiration can result in years with very high water use from landscaping, outdoor
Goleta Water District – Dec. 2005 (corrected) 1 Final Urban Water Management Plan
residential uses, and agricultural irrigation. This variation in supply and demand is a key factor that is considered in the District’s water supply management planning.
A topic of growing concern for water planners and managers is global warming and the potential impacts it could have on California’s future water supplies. DWR’s Draft California Water Plan Update 2005 contains an assessment of potential impacts. The Plan indicated that global warming could affect the State Water Project supply (which is one source of water for the District) by creating higher variability and extremes in hydrologic conditions that exceed the current SWP facility capabilities. There may be changes in Sierra snowpack patterns, hydrologic patterns, sea level, rainfall intensity and statewide water demand if global warming increases through time.
Facilities
The District's water distribution system includes over 200 miles of pipelines ranging in size from two inches to 42 inches in diameter. The District's water supply from the Cachuma Project and the State Water Project is treated through the District's Corona Del Mar Water Treatment Plant. This plant provides coagulation and flocculation, filtration, and disinfection treatment and has a nominal treatment capacity of 24 million gallons per day. The District maintains eight reservoirs ranging in individual capacity from 0.3 million gallons to over 6 million gallons, with a total combined capacity of approximately 20.2 million gallons.
Demographic Factors
The Goleta Water District was formed by a vote of the people within the District on December 17, 1944. The District was established as a legal entity to represent the Goleta Valley and to contract with the Santa Barbara County Water Agency and the Bureau of Reclamation to participate in the Cachuma Project. The Santa Barbara County Water Agency was formed in 1945 and soon thereafter contracted with the Bureau of Reclamation to develop the Cachuma Project, which included Bradbury Dam, Tecolote Tunnel, and the South Coast Conduit. The project was authorized by the Secretary of the Interior in 1948 and construction of the project began in 1950. The Cachuma Project began serving water to member agencies in 1956.
During the 1987 to 1992 drought, it became evident that Lake Cachuma would not be able to supply enough water in the event of a prolonged drought. In 1991, the District's customers voted to participate in the State Water Project (SWP). In 1968, the SWP built a canal known as the Coastal Branch Phase I to deliver water from the California Aqueduct to Kern County. The Central Coast Water Authority (CCWA) was formed in 1991 to construct, manage and operate the Santa Barbara County SWP facilities. The Coastal Branch Phase II was completed by DWR in 1997 with its terminus at Vandenberg Air Force Base. The CCWA built a pipeline extension from Vandenberg Air Force Base and various other treatment and distribution facilities to deliver water to Lake Cachuma. The CCWA facilities were completed in 1997.
Goleta Water District – Dec. 2005 (corrected) 2 Final Urban Water Management Plan
Goleta Water District – Dec. 2005 (corrected) 3 Final Urban Water Management Plan
Goleta Water District – Dec. 2005 (corrected) 4 Final Urban Water Management Plan
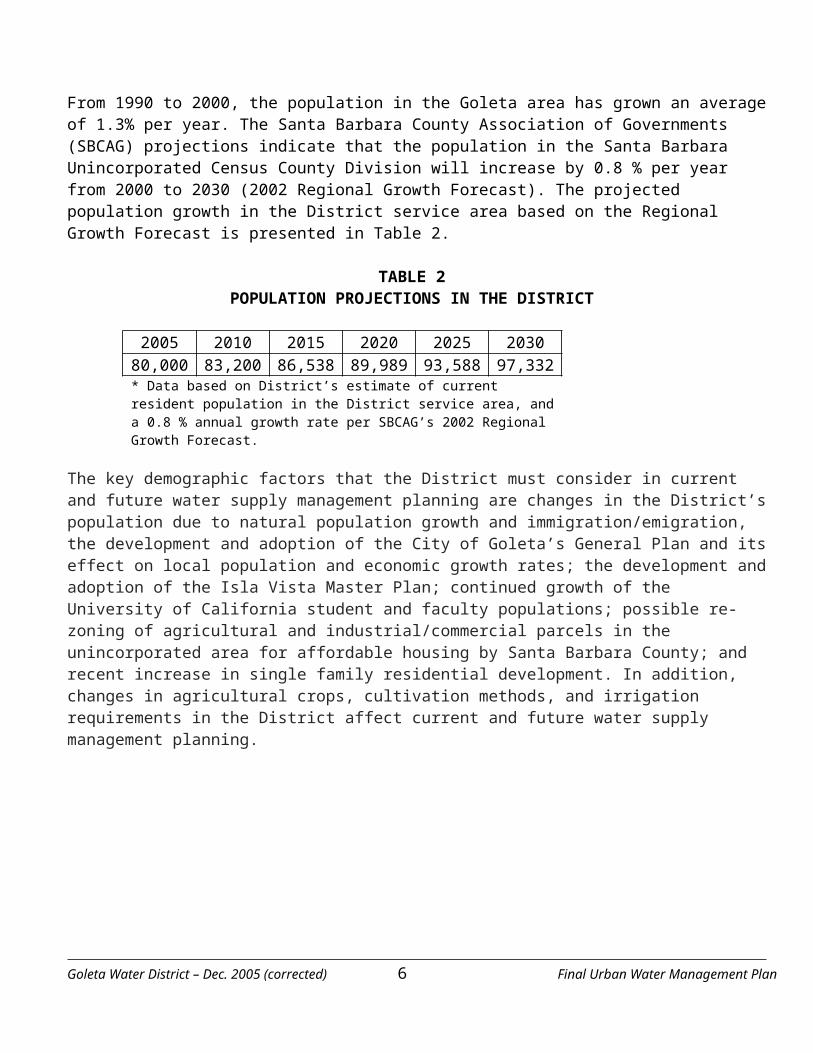
From 1990 to 2000, the population in the Goleta area has grown an average of 1.3% per year. The Santa Barbara County Association of Governments (SBCAG) projections indicate that the population in the Santa Barbara Unincorporated Census County Division will increase by 0.8 % per year from 2000 to 2030 (2002 Regional Growth Forecast). The projected population growth in the District service area based on the Regional Growth Forecast is presented in Table 2.
TABLE 2 POPULATION PROJECTIONS IN THE DISTRICT
2005 2010 2015 2020 2025 2030 80,000 83,200 86,538 89,989 93,588 97,332
* Data based on District’s estimate of current resident population in the District service area, and a 0.8 % annual growth rate per SBCAG’s 2002 Regional Growth Forecast.
The key demographic factors that the District must consider in current and future water supply management planning are changes in the District’s population due to natural population growth and immigration/emigration, the development and adoption of the City of Goleta’s General Plan and its effect on local population and economic growth rates; the development and adoption of the Isla Vista Master Plan; continued growth of the University of California student and faculty populations; possible re-zoning of agricultural and industrial/commercial parcels in the unincorporated area for affordable housing by Santa Barbara County; and recent increase in single family residential development. In addition, changes in agricultural crops, cultivation methods, and irrigation requirements in the District affect current and future water supply management planning.
Goleta Water District – Dec. 2005 (corrected) 5 Final Urban Water Management Plan
3.0 WATER SOURCES
The District delivers water from the Cachuma Project, the State Water Project, groundwater from the Goleta North/Central Groundwater Basin, and recycled water. Each of the water supply sources is described below.
3.1 CACHUMA PROJECT
The majority of the District's water supply is from the Cachuma Project that the Federal Government through the Bureau of Reclamation constructed on the Santa Ynez River in the early 1950’s. The District receives approximately 9,322 acre-feet per year (AFY) from the Cachuma Project. The Cachuma Project consists of Bradbury Dam, Tecolote Tunnel, South Coast Conduit, and various water conveyance facilities. The dam impounds water along the Santa Ynez River, approximately 45 miles from its outlet at the ocean. The reservoir had an original capacity of approximately 205,000 acre-feet but has been reduced to approximately 190,000 acre-feet as a result of siltation. This capacity amount does not include surcharge for the purposes of storage for fish releases (see below).
Water is diverted from Lake Cachuma to the South Coast through the Tecolote Tunnel, which extends approximately 6.4 miles through the Santa Ynez Mountains to the head works of the South Coast Conduit (SCC) at Glen Annie Reservoir. The SCC extends for a distance of approximately 24 miles along the South Coast from Goleta to Carpinteria, and includes four regulating reservoirs. The SCC delivers Cachuma Project raw water to the District at the Corona del Mar Treatment Plant where it is treated for domestic water use. A turnout at Glen Annie Reservoir supplies raw water that is chlorinated by District prior to delivery to agricultural customers in the Goleta West Zone, using the Goleta West Conduit.
Water is provided to the Cachuma Project Member Units for irrigation, domestic, and municipal and industrial water uses. The Member Units include the District, City of Santa Barbara, Montecito Water District, the Carpinteria Valley Water District, and the Santa Ynez River Water Conservation District Improvement District #1. The project is the principal water supply for Santa Barbara South Coast communities and portions of the Santa Ynez Valley. Since the drought of 1987-1991, the average annual deliveries from the Cachuma Project to the Member Units have been approximately 27,000 acre-feet per year (AFY). The amount of Cachuma Project water delivered to the Member Units varies from year to year, depending on winter runoff, lake storage, water demand, downstream releases for fish, and other water supply sources. The City of Santa Barbara and the District receive the largest quantity of water from the project.
The current total Cachuma Project operational yield is 25,714 AFY, based on a water shortage of up to 20% during dry years, and taking into account the requirements for downstream releases for fish, described below. The District's share of this yield is 36.25% or 9,322 AFY.
In 1997, the southern steelhead trout was listed as an endangered species, including the population along the lower Santa Ynez River. A Biological Opinion ("BO") was issued for Cachuma Project operations in September 2000. The BO concludes that operations of the Cachuma Project consistent with the BO would not jeopardize the continued existence of the southern steelhead. The BO includes mandatory terms and conditions that require the Bureau of Reclamation to implement reasonable and prudent measures to minimize take of the southern steelhead. The Cachuma Member Units, including the District, are implementing the requirements in the BO that include releases from Bradbury Dam to support fish rearing and passage, various scientific studies, and several habitat improvement projects. The Cachuma Project
Goleta Water District – Dec. 2005 (corrected) 6 Final Urban Water Management Plan
Member Units surcharge (temporarily raise the water level) Cachuma Lake during spill years to store additional water to be use for releases from the dam for fish.
For several years, a water rights hearing regarding the Cachuma Project has been pending before the State Water Resources Control Board (State Board). The primary evidentiary hearings were held before the State Board in 2003 concerning whether the water rights permit for the Cachuma Project should be modified. A draft EIR was issued in the same year. The State Board is expected to complete a decision regarding the water rights permits and a final EIR in 2006. Historic water right disputes on the Santa Ynez River were resolved through a Settlement Agreement between the Cachuma Member Units and downstream Santa Ynez River water users during the course of the State Board hearings, and there are no water right disputes now pending. The two remaining key issues include the amount of water to be released to provide for this species downstream of the dam, and the need, if any, to provide passage through Cachuma Lake to the upstream watershed.
During spill years, the District and other Cachuma Project Member Units have the ability to take spill water from the Bureau of Reclamation, as available. The District has often taken spill water for direct use, for injection into the groundwater basin, or to defer groundwater pumping. The District does not include spill water in the estimate of the long-term water supply from the Cachuma Project (see Table 8 below) because spill water is not considered a reliable source for long-term water supply planning as it varies with climatic conditions and its availability is subject to factors such as District’s ability to inject or use the spill water during the spill year.
3.2 STATE WATER PROJECT
In 1991, the residents in the District service area voted to purchase a project allotment of 4,500 AFY from the State Water Project (SWP). The SWP conveyance facilities to the Santa Ynez Valley and Cachuma Lake (where SWP water is conveyed through the Tecolote Tunnel) were completed in 1997 by the Central Coast Water Authority (CCWA). The CCWA is a California Joint Powers Agency formed by its nine public agency members, including the District. The CCWA was formed to construct the necessary facilities to deliver State Water Project water to its members, and now operates and maintains the facilities. All of the Cachuma Project Member Units are also members of CCWA. SWP water deliveries to Santa Barbara County, including the District, began in 1997. SWP water is commingled with Cachuma Project water and conveyed through the Tecolote Tunnel to the SCC where it is delivered to the Corona del Mar Water Treatment Plant.
The District receives SWP water through a Water Supply Agreement with the CCWA. The District’s annual project allotment is a portion of the Santa Barbara County contract (also called “Table A Amount”) and is 4,500 AFY. Table A refers to the table in each SWP contract that lists the maximum amount of water an agency may request each year. The District also has a drought buffer amount of 450 AFY through CCWA. In 1994, the District customers voted to purchase an additional 2,500 AFY of SWP allotment to supplement the original allotment and the 450 AFY drought buffer. Hence, the District’s total allotment is 7,450 AFY. Under the District’s agreement with CCWA, the District’s share of the SWP conveyance facilities that deliver SWP water to Cachuma Lake is only 4,500 AFY. The long-term average SWP delivery is about 77 percent due to shortages related to year-to-year variation in runoff in the Sacramento-San Joaquin Delta. Hence, the District's 7,450 AFY allotment significantly improves the reliability of the SWP to deliver the District’s planned for 4,500 AFY supply.
Goleta Water District – Dec. 2005 (corrected) 7 Final Urban Water Management Plan
3.3 RECYCLED WATER
In 1995, the District began making deliveries from a newly developed recycled water project developed in cooperation with the Goleta Sanitary District, a separate public agency. The recycled water project has a current treatment and distribution capacity of approximately 1,500 AFY. The District is currently delivering approximately 1,000 AFY to the University of California campus, several golf courses, and other irrigation users, most of whom were previously using District potable water for irrigation. The District anticipates that recycled water use will increase, particularly by the University of California, in future years. However, it is unlikely that recycled water production will increase over 1,500 AFY due to limits in the available market and the high cost of increasing treatment capacity.
3.4 GROUNDWATER
3.4.1 Overview
The Groundwater Management Plan/Program (GWMP) for the Goleta Groundwater Basin consists of a court decision known as the Wright Judgment (Martha H. Wright vs. Goleta Water District, June 16, 1989, Santa Barbara Superior Court, Case No. SM57969). The SAFE Ordinance approved by the District voters in 1991 and modified in 1994. This ordinance sets certain requirements and restrictions on the operation of the basin and governs the release of water for new and additional uses. A copy of the SAFE Ordinance (as modified in 1994) and relevant portions of the Wright Judgment are provided in Appendix B.
The District’s right to produce groundwater from the local Goleta North/Central Basin has been adjudicated through a court judgment in 1989 entitled Wright et al v. Goleta Water District (Appendix B). The District has an adjudicated right to produce 2,350 AFY and any surplus water available. The Wright Judgment also provides the District with the right to defer producing its annual groundwater entitlement, and considers that water as the District's stored water for later use during dry years, droughts, and emergencies. The Wright Judgment also provides the District with the right to inject surface water supplies and claim that as the District's stored water, in addition to its annual entitlement. When the Cachuma Project spills, the District may receive "spill water" in addition to its annual entitlement without direct cost, and whenever Cachuma spills the District uses that water for injection. The spill in 2005 allowed the District to inject Cachuma Project water. At this time, the District does not anticipate the need to regularly produce groundwater for at least several years. Emergency and other operational situations could dictate producing groundwater on a short-term basis. The District uses Cachuma Project water as the first priority source, and then State Water Project and recycled water; groundwater is only produced when necessary to meet demand when other sources are insufficient. The District now has rights to over 35,000 acre-feet of stored groundwater in addition to its annual production.
The SAFE ordinance provides that: “Unless and until the Central Basin Water level rises to 100% of its 1972 levels, the District shall be required to make its Annual Buffer Commitment. Thereafter, for so long as the District maintains the Central Basin at or above 1972 levels, the District may utilize the yield of the Central Basin to lower the cost of water service to existing customers”.
The groundwater levels are measured periodically by the U.S.G.S. and by at least December of 2004 had returned to their 1972 levels or greater. The District releases only one percent of its available water supply annually for new connections, and in accordance with the provisions of the SAFE Ordinance has increased its minimum groundwater storage contribution to include 2/3 of the release amount.
Goleta Water District – Dec. 2005 (corrected) 8 Final Urban Water Management Plan
The key elements of the District’s Groundwater Management Program are summarized as follows:
Wright Judgmento Goleta Central Sub-Basin Safe Yield 3,410 AFYo Perennial Yield 3,700 AFYo Defines Parties Rights to Central Basin Watero Provides for Exchange of Rights
Wright Annual Reporto Goleta Water District Central Sub-Basin appropriative right 2,350 AFYo Storage Accounting – Goleta Water District over 30,000 AF
Safe Ordinance o Reliable water supplyo Mandates Groundwater Storage o Provides for Drought Buffero Limits Use of Drought Buffero Limits new water service connections
U.S.G.S. Groundwater Level Monitoring Water Level and Spill Monitoring of Lake Cachuma Injection and Extraction Well Operation and Maintenance Water Quality Monitoring Conjunctive Use of Groundwater and Surface Supplies Numeric Groundwater Model (Future)
o Integrated Groundwater Management Plano Manage Extractions (Pumping Schedules) for Optimum Efficiencieso Manage Injections for Optimum Efficiencieso Analyze Scenarios for Conjunctive Useo Optimize Locations for New Wells
3.4.2 Basin Description
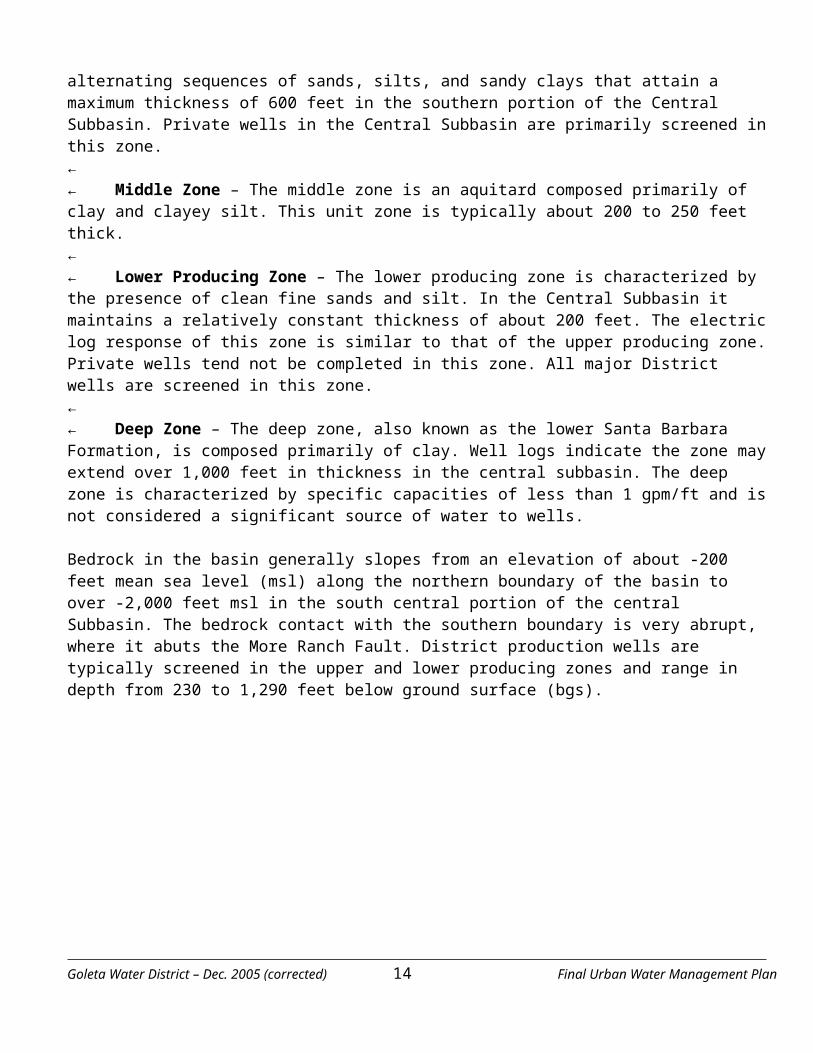
The Goleta Groundwater Basin (GGWB) underlies the Goleta Coastal Plain (Figure 2). The basin is bounded on the north by bedrock of the Santa Ynez Mountains, and to the south by uplifted bedrock along the More Ranch Fault. Tertiary-age bedrock forms the western boundary. The eastern boundary consists of bedrock uplifted along the Modoc Fault. The basin is approximately 8 miles long and 3 miles wide. Basin groundwater rights were adjudicated in Wright Judgment. In the Judgment, the basin is subdivided into two sub-basins: the North-Central Subbasin, and the West Subbasin. In much of the technical literature the basin is divided into three sub-basins: the North, Central, and West sub-basins. Because it retains some technical advantages, nomenclature used in this report follows the later nomenclature of three sub-basins.
The GGWB is drained by the Cieneguitas, Atascadero, San Antonio, Maria Ygnacio, San Jose, Las Vegas, San Pedro, Carneros, and Tecolotito creeks. The lower reaches of these creeks are intermittent where they flow across permeable sediments of the North Subbasin. This is an active area of groundwater recharge for the basin. Remaining creek flow runs off into the Pacific Ocean with relatively minor recharge of more fine-grained shallow sediments in the Central and West sub-basins.
The majority of useable groundwater in storage in the GGWB is present within the Central Subbasin, which is about 4 miles long and 2 miles wide (Figure 2). The Central Subbasin is separated from the North
Goleta Water District – Dec. 2005 (corrected) 9 Final Urban Water Management Plan
Subbasin by a fault that appears to form a hydraulic impediment to groundwater flow. The boundary between the North and West sub-basins is characterized by significant changes in water quality and hydraulic characteristics that may be related to an overall facies change and/or change in source rock material in underlying sediments.
3.4.3 Groundwater Occurrence
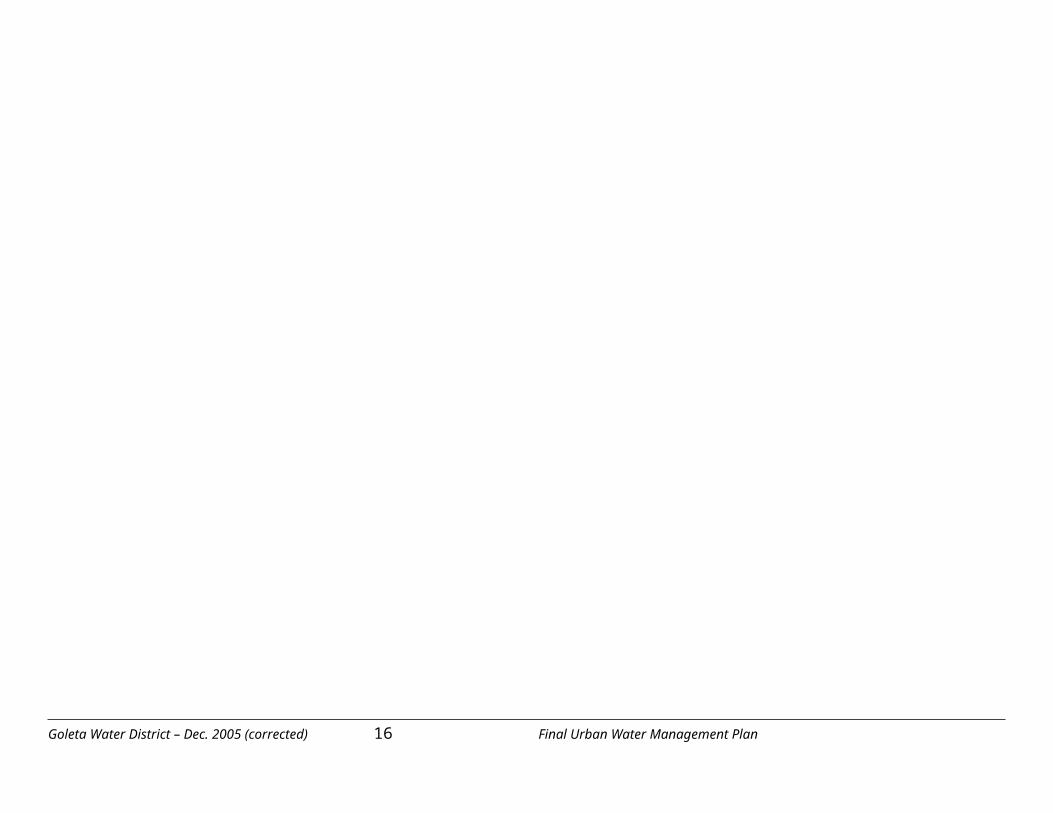
Water-bearing deposits of the GGWB consist of young alluvium of Quaternary and Holocene age, terrace deposits, older alluvium, and the Santa Barbara Formation of Pleistocene age (Figure 3). The Santa Barbara Formation is the primary water-bearing unit, and is composed of sand, silt, and clay. The hydrostratigraphy of the Basin has been characterized during earlier District investigations, which resulted in identification of five principal hydrostratigraphic zones. Evidence of these zones is apparent in geologic and geophysical logs. From youngest to oldest, these zones are as follows (also see Figure 3):
← Shallow Zone – The shallow zones consists of unconsolidated alluvium ranging in thickness from 100 to 150 feet, being thickest in the southeast portion of the basin. Groundwater in the shallow zone is locally perched indicating vertical impedance to flow. The shallow zone is typically fine-grained and locally confines underlying units. This unit is not an important source of groundwater to wells. ←← Upper Producing Zone – The upper producing zone consists of alternating sequences of sands, silts, and sandy clays that attain a maximum thickness of 600 feet in the southern portion of the Central Subbasin. Private wells in the Central Subbasin are primarily screened in this zone. ←← Middle Zone – The middle zone is an aquitard composed primarily of clay and clayey silt. This unit zone is typically about 200 to 250 feet thick. ←← Lower Producing Zone – The lower producing zone is characterized by the presence of clean fine sands and silt. In the Central Subbasin it maintains a relatively constant thickness of about 200 feet. The electric log response of this zone is similar to that of the upper producing zone. Private wells tend not be completed in this zone. All major District wells are screened in this zone. ←← Deep Zone – The deep zone, also known as the lower Santa Barbara Formation, is composed primarily of clay. Well logs indicate the zone may extend over 1,000 feet in thickness in the central subbasin. The deep zone is characterized by specific capacities of less than 1 gpm/ft and is not considered a significant source of water to wells.
Bedrock in the basin generally slopes from an elevation of about -200 feet mean sea level (msl) along the northern boundary of the basin to over -2,000 feet msl in the south central portion of the central Subbasin. The bedrock contact with the southern boundary is very abrupt, where it abuts the More Ranch Fault. District production wells are typically screened in the upper and lower producing zones and range in depth from 230 to 1,290 feet below ground surface (bgs).
Goleta Water District – Dec. 2005 (corrected) 10 Final Urban Water Management Plan
Goleta Water District – Dec. 2005 (corrected) 11 Final Urban Water Management Plan
Goleta Water District – Dec. 2005 (corrected) 12 Final Urban Water Management Plan
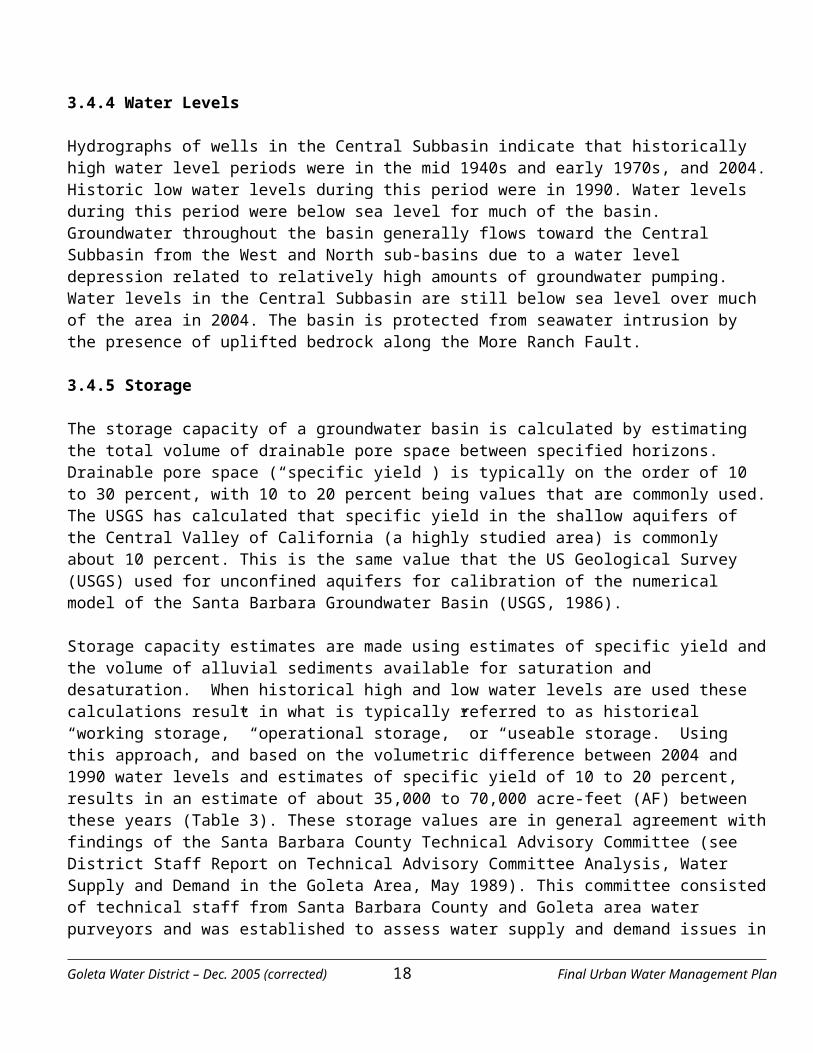
3.4.4 Water Levels
Hydrographs of wells in the Central Subbasin indicate that historically high water level periods were in the mid 1940s and early 1970s, and 2004. Historic low water levels during this period were in 1990. Water levels during this period were below sea level for much of the basin. Groundwater throughout the basin generally flows toward the Central Subbasin from the West and North sub-basins due to a water level depression related to relatively high amounts of groundwater pumping. Water levels in the Central Subbasin are still below sea level over much of the area in 2004. The basin is protected from seawater intrusion by the presence of uplifted bedrock along the More Ranch Fault.
3.4.5 Storage
The storage capacity of a groundwater basin is calculated by estimating the total volume of drainable pore space between specified horizons. Drainable pore space (“specific yield”) is typically on the order of 10 to 30 percent, with 10 to 20 percent being values that are commonly used. The USGS has calculated that specific yield in the shallow aquifers of the Central Valley of California (a highly studied area) is commonly about 10 percent. This is the same value that the US Geological Survey (USGS) used for unconfined aquifers for calibration of the numerical model of the Santa Barbara Groundwater Basin (USGS, 1986).
Storage capacity estimates are made using estimates of specific yield and the volume of alluvial sediments available for saturation and desaturation. When historical high and low water levels are used these calculations result in what is typically referred to as historical “working storage,” “operational storage,” or “useable storage.” Using this approach, and based on the volumetric difference between 2004 and 1990 water levels and estimates of specific yield of 10 to 20 percent, results in an estimate of about 35,000 to 70,000 acre-feet (AF) between these years (Table 3). These storage values are in general agreement with findings of the Santa Barbara County Technical Advisory Committee (see District Staff Report on Technical Advisory Committee Analysis, Water Supply and Demand in the Goleta Area, May 1989). This committee consisted of technical staff from Santa Barbara County and Goleta area water purveyors and was established to assess water supply and demand issues in the Goleta Valley area. During this work, the District calculated that there were about 45,000 acre-feet of “working storage” in the Goleta Groundwater Basin in 1987. The County calculated a value of 34,000 acre-feet. The estimated amount of water the District has stored in the basin since the early 1990s (about 40,000 AF; see Table 4) is in line with the estimate of working storage for this same period (35,000 to 70,000 AFY; see Table 3).
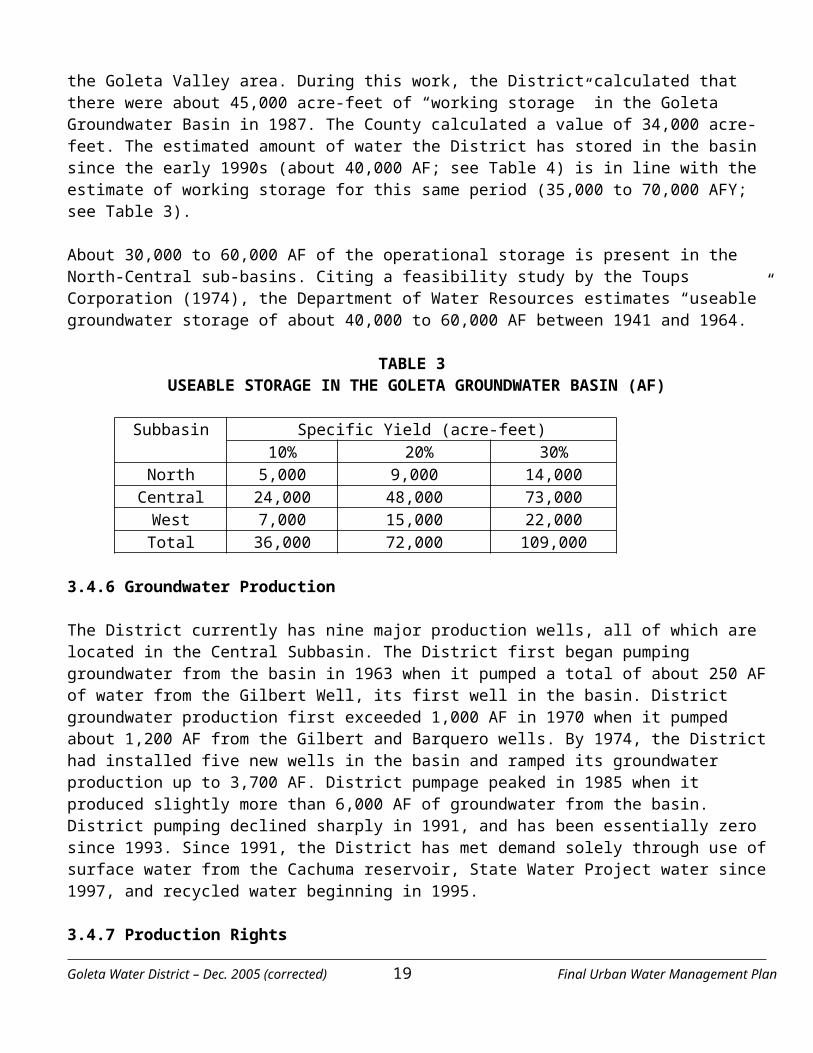
About 30,000 to 60,000 AF of the operational storage is present in the North-Central sub-basins. Citing a feasibility study by the Toups Corporation (1974), the Department of Water Resources estimates “useable” groundwater storage of about 40,000 to 60,000 AF between 1941 and 1964.
TABLE 3 USEABLE STORAGE IN THE GOLETA GROUNDWATER BASIN (AF)
Subbasin Specific Yield (acre-feet)10% 20% 30%
North 5,000 9,000 14,000Central 24,000 48,000 73,000West 7,000 15,000 22,000Total 36,000 72,000 109,000
Goleta Water District – Dec. 2005 (corrected) 13 Final Urban Water Management Plan
3.4.6 Groundwater Production
The District currently has nine major production wells, all of which are located in the Central Subbasin. The District first began pumping groundwater from the basin in 1963 when it pumped a total of about 250 AF of water from the Gilbert Well, its first well in the basin. District groundwater production first exceeded 1,000 AF in 1970 when it pumped about 1,200 AF from the Gilbert and Barquero wells. By 1974, the District had installed five new wells in the basin and ramped its groundwater production up to 3,700 AF. District pumpage peaked in 1985 when it produced slightly more than 6,000 AF of groundwater from the basin. District pumping declined sharply in 1991, and has been essentially zero since 1993. Since 1991, the District has met demand solely through use of surface water from the Cachuma reservoir, State Water Project water since 1997, and recycled water beginning in 1995.
3.4.7 Production Rights
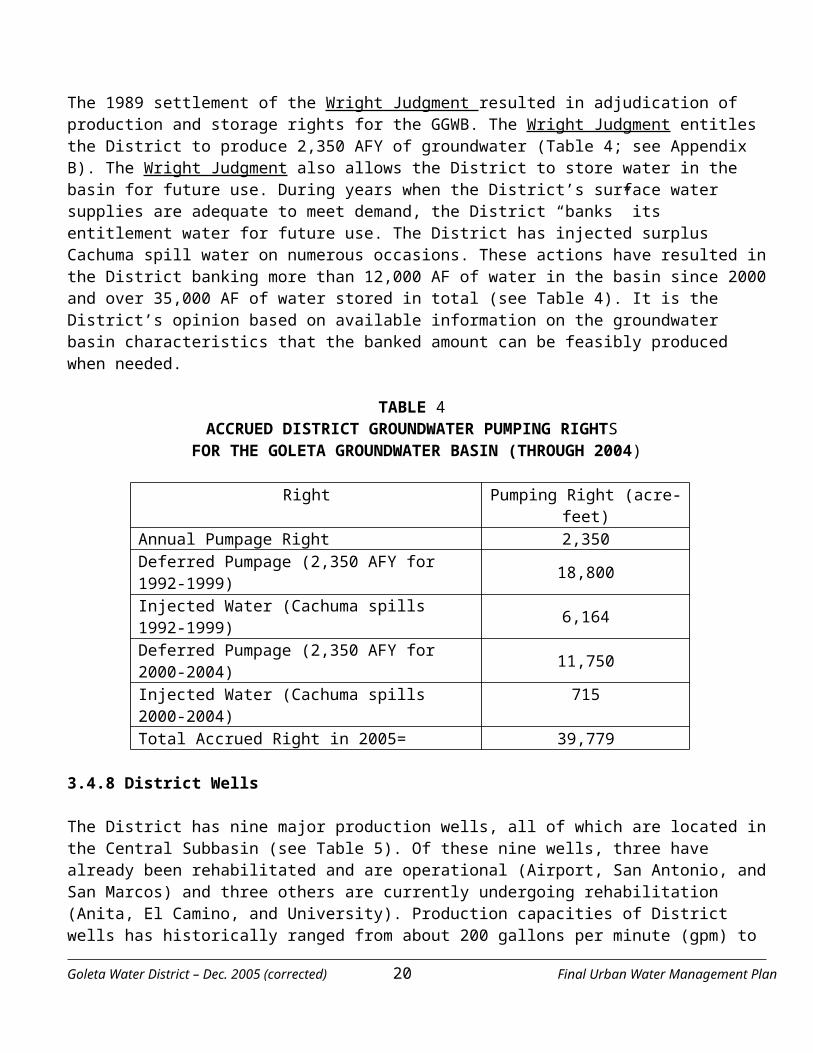
The 1989 settlement of the Wright Judgment resulted in adjudication of production and storage rights for the GGWB. The Wright Judgment entitles the District to produce 2,350 AFY of groundwater (Table 4; see Appendix B). The Wright Judgment also allows the District to store water in the basin for future use. During years when the District’s surface water supplies are adequate to meet demand, the District “banks” its entitlement water for future use. The District has injected surplus Cachuma spill water on numerous occasions. These actions have resulted in the District banking more than 12,000 AF of water in the basin since 2000 and over 35,000 AF of water stored in total (see Table 4). It is the District’s opinion based on available information on the groundwater basin characteristics that the banked amount can be feasibly produced when needed.
TABLE 4 ACCRUED DISTRICT GROUNDWATER PUMPING RIGHTS
FOR THE GOLETA GROUNDWATER BASIN (THROUGH 2004)
Right Pumping Right (acre-feet)Annual Pumpage Right 2,350 Deferred Pumpage (2,350 AFY for 1992-1999) 18,800 Injected Water (Cachuma spills 1992-1999) 6,164 Deferred Pumpage (2,350 AFY for 2000-2004) 11,750 Injected Water (Cachuma spills 2000-2004) 715 Total Accrued Right in 2005= 39,779
3.4.8 District Wells
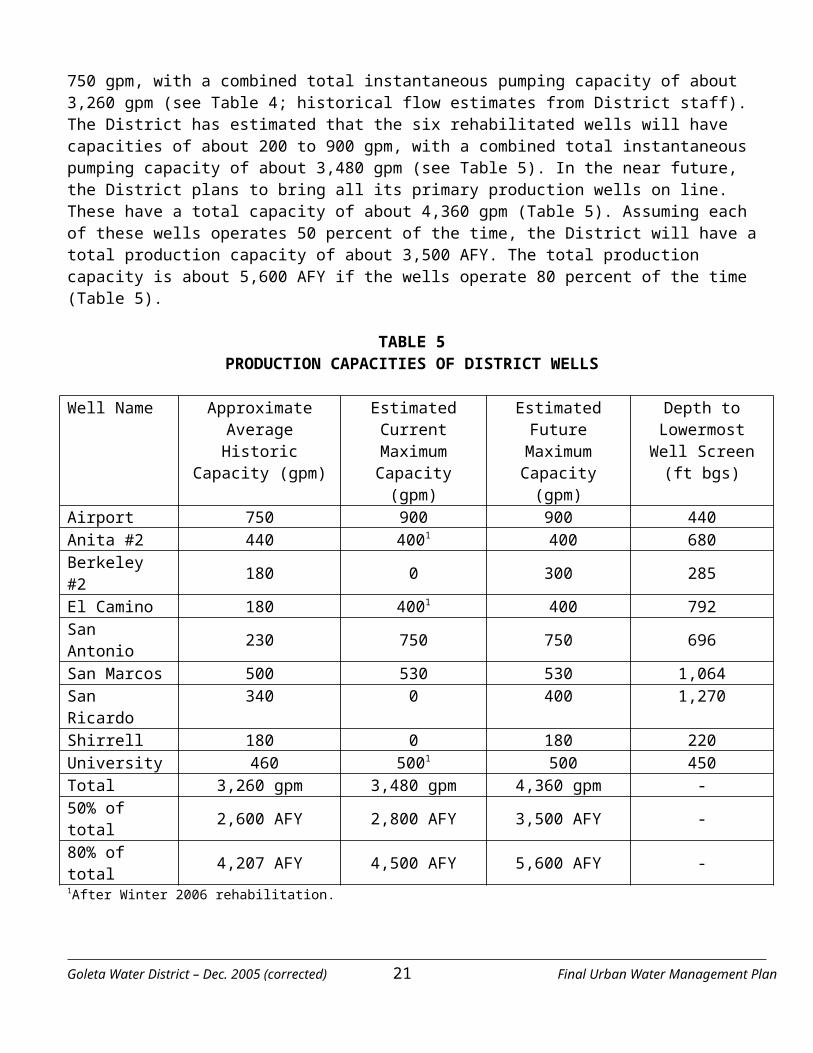
The District has nine major production wells, all of which are located in the Central Subbasin (see Table 5). Of these nine wells, three have already been rehabilitated and are operational (Airport, San Antonio, and San Marcos) and three others are currently undergoing rehabilitation (Anita, El Camino, and University). Production capacities of District wells has historically ranged from about 200 gallons per minute (gpm) to 750 gpm, with a combined total instantaneous pumping capacity of about 3,260 gpm (see Table 4; historical flow estimates from District staff). The District has estimated that the six rehabilitated wells will have capacities of about 200 to 900 gpm, with a combined total instantaneous pumping capacity of about 3,480 gpm (see Table 5). In the near future, the District plans to bring all its primary production wells on line. These have a total capacity of about 4,360 gpm (Table 5). Assuming each of these wells operates 50 percent
Goleta Water District – Dec. 2005 (corrected) 14 Final Urban Water Management Plan
of the time, the District will have a total production capacity of about 3,500 AFY. The total production capacity is about 5,600 AFY if the wells operate 80 percent of the time (Table 5).
TABLE 5 PRODUCTION CAPACITIES OF DISTRICT WELLS
Well Name Approximate Average Historic Capacity
(gpm)
Estimated Current Maximum Capacity
(gpm)
Estimated Future Maximum Capacity
(gpm)
Depth to Lowermost Well Screen (ft bgs)
Airport 750 900 900 440 Anita #2 440 4001 400 680 Berkeley #2 180 0 300 285 El Camino 180 4001 400 792 San Antonio 230 750 750 696 San Marcos 500 530 530 1,064 San Ricardo 340 0 400 1,270 Shirrell 180 0 180 220 University 460 5001 500 450 Total 3,260 gpm 3,480 gpm 4,360 gpm -50% of total 2,600 AFY 2,800 AFY 3,500 AFY -80% of total 4,207 AFY 4,500 AFY 5,600 AFY -1After Winter 2006 rehabilitation.
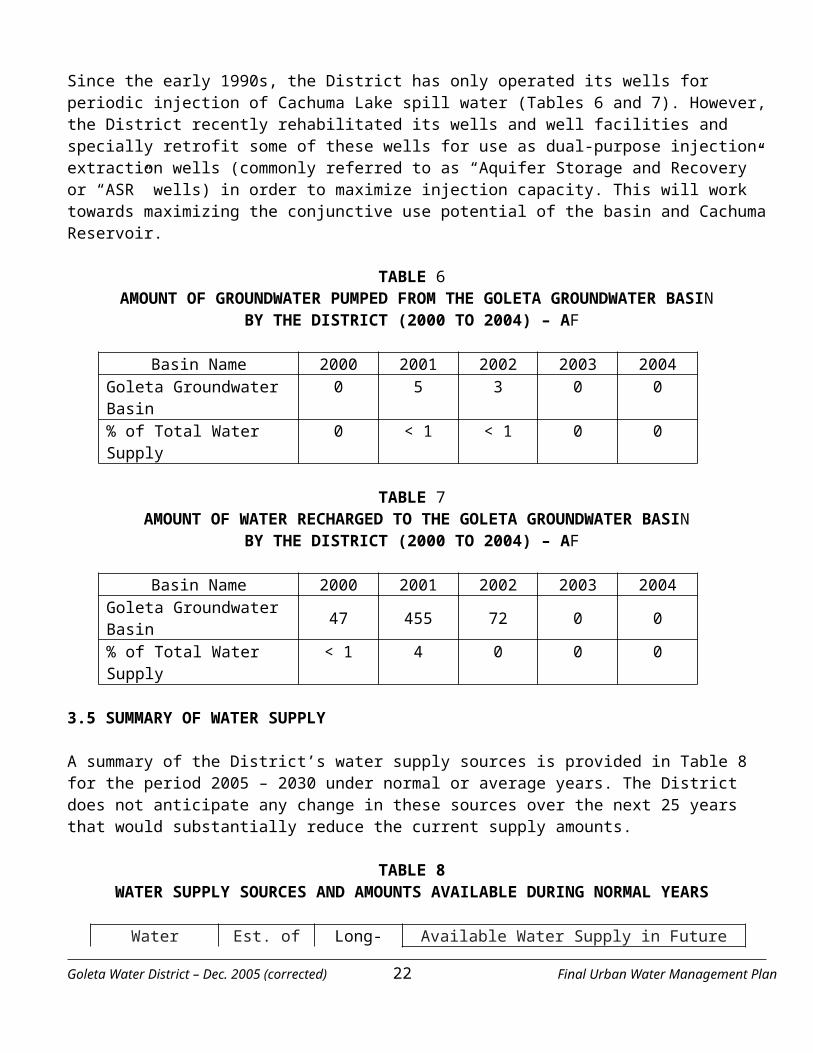
Since the early 1990s, the District has only operated its wells for periodic injection of Cachuma Lake spill water (Tables 6 and 7). However, the District recently rehabilitated its wells and well facilities and specially retrofit some of these wells for use as dual-purpose injection-extraction wells (commonly referred to as “Aquifer Storage and Recovery” or “ASR” wells) in order to maximize injection capacity. This will work towards maximizing the conjunctive use potential of the basin and Cachuma Reservoir.
TABLE 6 AMOUNT OF GROUNDWATER PUMPED FROM THE GOLETA GROUNDWATER BASIN
BY THE DISTRICT (2000 TO 2004) – AF
Basin Name 2000 2001 2002 2003 2004Goleta Groundwater Basin 0 5 3 0 0 % of Total Water Supply 0 < 1 < 1 0 0
TABLE 7 AMOUNT OF WATER RECHARGED TO THE GOLETA GROUNDWATER BASIN
BY THE DISTRICT (2000 TO 2004) – AF
Basin Name 2000 2001 2002 2003 2004Goleta Groundwater Basin 47 455 72 0 0 % of Total Water Supply < 1 4 0 0 0
3.5 SUMMARY OF WATER SUPPLY
Goleta Water District – Dec. 2005 (corrected) 15 Final Urban Water Management Plan
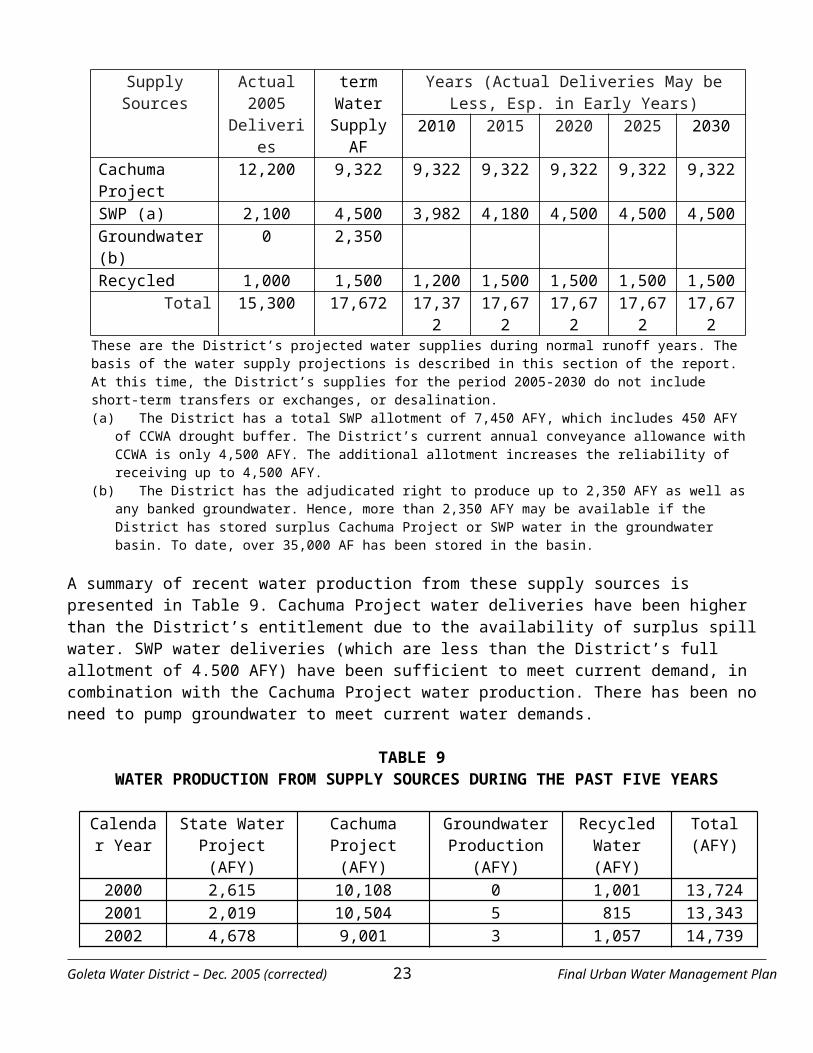
A summary of the District’s water supply sources is provided in Table 8 for the period 2005 – 2030 under normal or average years. The District does not anticipate any change in these sources over the next 25 years that would substantially reduce the current supply amounts.
TABLE 8 WATER SUPPLY SOURCES AND AMOUNTS AVAILABLE DURING NORMAL YEARS
Water Supply Sources
Est. of Actual 2005Deliveries
Long-termWater
Supply AF
Available Water Supply in Future Years (Actual Deliveries May be Less, Esp. in Early Years)
2010 2015 2020 2025 2030 Cachuma Project 12,200 9,322 9,322 9,322 9,322 9,322 9,322 SWP (a) 2,100 4,500 3,982 4,180 4,500 4,500 4,500 Groundwater (b) 0 2,350 Recycled 1,000 1,500 1,200 1,500 1,500 1,500 1,500
Total 15,300 17,672 17,372 17,672 17,672 17,672 17,672These are the District’s projected water supplies during normal runoff years. The basis of the water supply projections is described in this section of the report. At this time, the District’s supplies for the period 2005-2030 do not include short-term transfers or exchanges, or desalination. (a) The District has a total SWP allotment of 7,450 AFY, which includes 450 AFY of CCWA drought buffer. The
District’s current annual conveyance allowance with CCWA is only 4,500 AFY. The additional allotment increases the reliability of receiving up to 4,500 AFY.
(b) The District has the adjudicated right to produce up to 2,350 AFY as well as any banked groundwater. Hence, more than 2,350 AFY may be available if the District has stored surplus Cachuma Project or SWP water in the groundwater basin. To date, over 35,000 AF has been stored in the basin.
A summary of recent water production from these supply sources is presented in Table 9. Cachuma Project water deliveries have been higher than the District’s entitlement due to the availability of surplus spill water. SWP water deliveries (which are less than the District’s full allotment of 4.500 AFY) have been sufficient to meet current demand, in combination with the Cachuma Project water production. There has been no need to pump groundwater to meet current water demands.
TABLE 9 WATER PRODUCTION FROM SUPPLY SOURCES DURING THE PAST FIVE YEARS
Calendar Year
State Water Project (AFY)
Cachuma Project (AFY)
Groundwater Production (AFY)
Recycled Water (AFY)
Total (AFY)
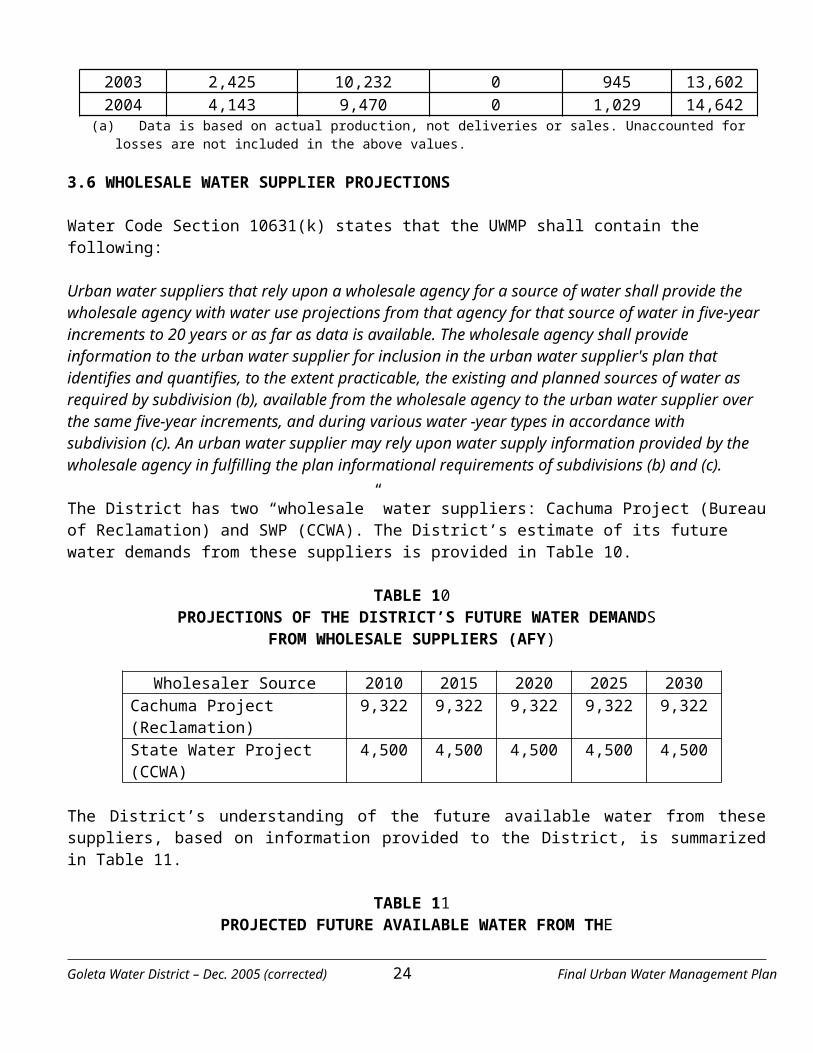
2000 2,615 10,108 0 1,001 13,724 2001 2,019 10,504 5 815 13,343 2002 4,678 9,001 3 1,057 14,739 2003 2,425 10,232 0 945 13,602 2004 4,143 9,470 0 1,029 14,642
(a) Data is based on actual production, not deliveries or sales. Unaccounted for losses are not included in the above values.
3.6 WHOLESALE WATER SUPPLIER PROJECTIONS
Water Code Section 10631(k) states that the UWMP shall contain the following:
Urban water suppliers that rely upon a wholesale agency for a source of water shall provide the wholesale agency with water use projections from that agency for that source of water in five-year increments to 20
Goleta Water District – Dec. 2005 (corrected) 16 Final Urban Water Management Plan
years or as far as data is available. The wholesale agency shall provide information to the urban water supplier for inclusion in the urban water supplier's plan that identifies and quantifies, to the extent practicable, the existing and planned sources of water as required by subdivision (b), available from the wholesale agency to the urban water supplier over the same five-year increments, and during various water -year types in accordance with subdivision (c). An urban water supplier may rely upon water supply information provided by the wholesale agency in fulfilling the plan informational requirements of subdivisions (b) and (c).
The District has two “wholesale” water suppliers: Cachuma Project (Bureau of Reclamation) and SWP (CCWA). The District’s estimate of its future water demands from these suppliers is provided in Table 10.
TABLE 10 PROJECTIONS OF THE DISTRICT’S FUTURE WATER DEMANDS
FROM WHOLESALE SUPPLIERS (AFY)
Wholesaler Source 2010 2015 2020 2025 2030Cachuma Project (Reclamation) 9,322 9,322 9,322 9,322 9,322 State Water Project (CCWA) 4,500 4,500 4,500 4,500 4,500
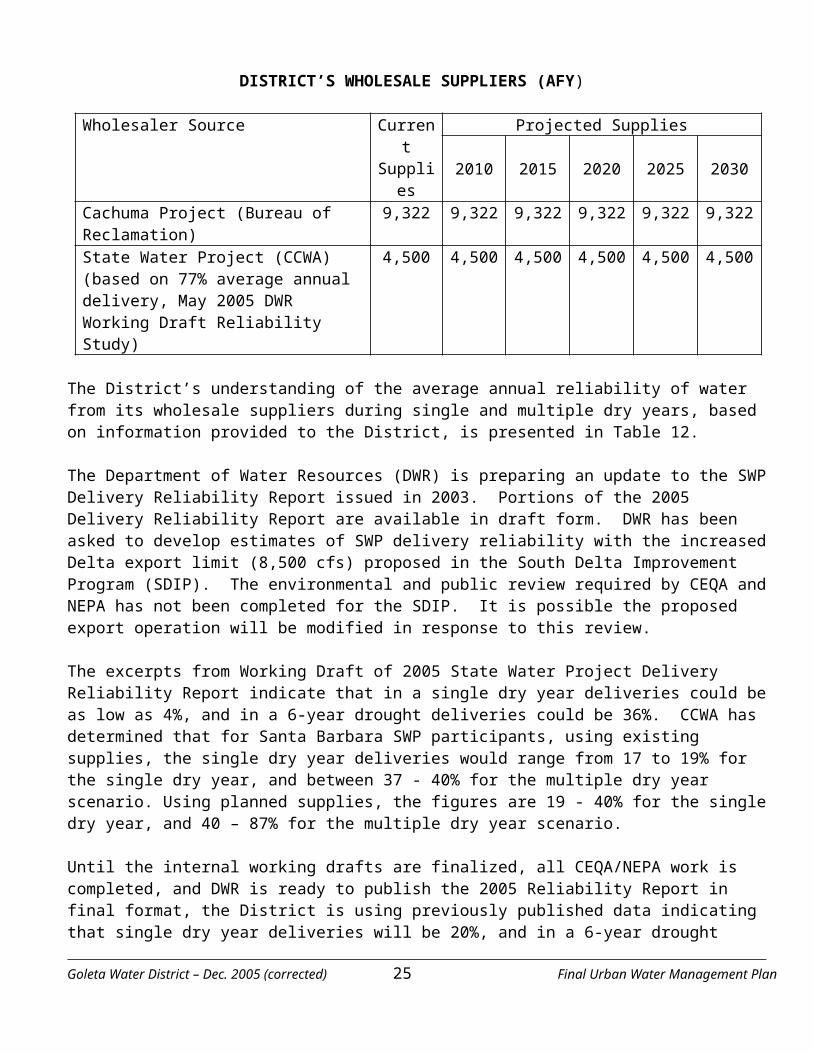
The District’s understanding of the future available water from these suppliers, based on information provided to the District, is summarized in Table 11.
TABLE 11 PROJECTED FUTURE AVAILABLE WATER FROM THE
DISTRICT’S WHOLESALE SUPPLIERS (AFY)
Wholesaler Source Current Supplies
Projected Supplies 2010 2015 2020 2025 2030
Cachuma Project (Bureau of Reclamation) 9,322 9,322 9,322 9,322 9,322 9,322 State Water Project (CCWA) (based on 77% average annual delivery, May 2005 DWR Working Draft Reliability Study)
4,500 4,500 4,500 4,500 4,500 4,500
The District’s understanding of the average annual reliability of water from its wholesale suppliers during single and multiple dry years, based on information provided to the District, is presented in Table 12.
The Department of Water Resources (DWR) is preparing an update to the SWP Delivery Reliability Report issued in 2003. Portions of the 2005 Delivery Reliability Report are available in draft form. DWR has been asked to develop estimates of SWP delivery reliability with the increased Delta export limit (8,500 cfs) proposed in the South Delta Improvement Program (SDIP). The environmental and public review required by CEQA and NEPA has not been completed for the SDIP. It is possible the proposed export operation will be modified in response to this review.
The excerpts from Working Draft of 2005 State Water Project Delivery Reliability Report indicate that in a single dry year deliveries could be as low as 4%, and in a 6-year drought deliveries could be 36%. CCWA has determined that for Santa Barbara SWP participants, using existing supplies, the single dry year deliveries would range from 17 to 19% for the single dry year, and between 37 - 40% for the multiple dry
Goleta Water District – Dec. 2005 (corrected) 17 Final Urban Water Management Plan
year scenario. Using planned supplies, the figures are 19 - 40% for the single dry year, and 40 – 87% for the multiple dry year scenario.
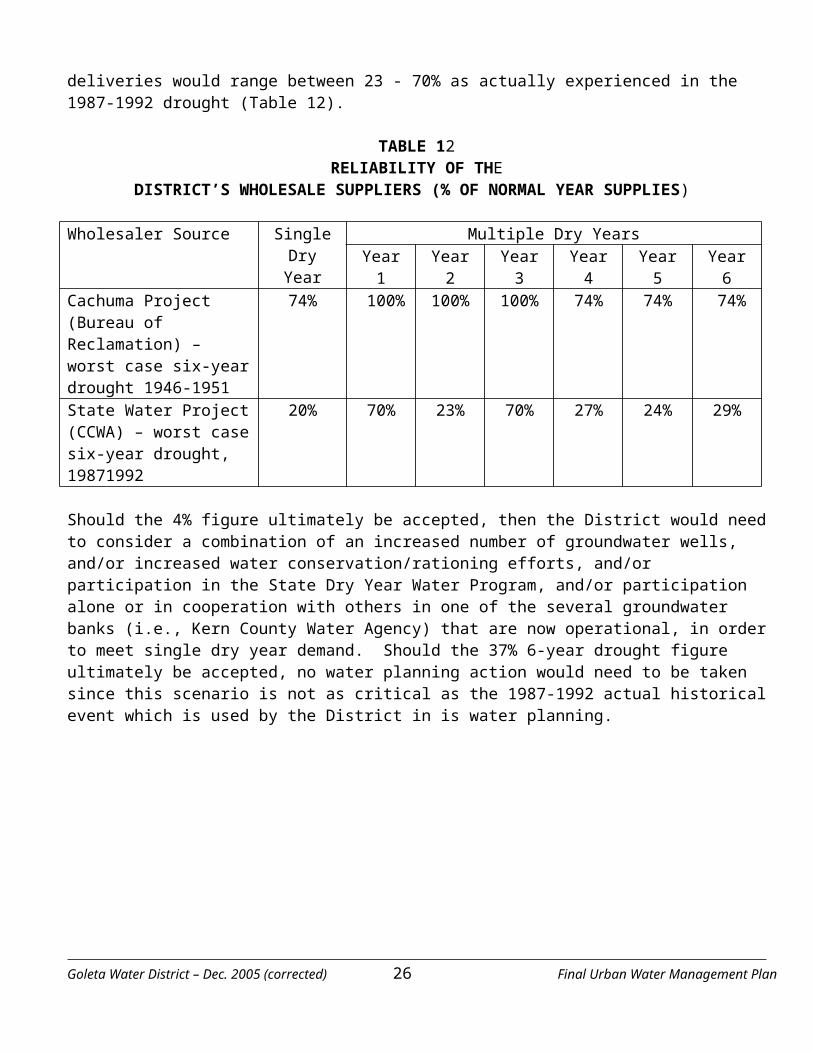
Until the internal working drafts are finalized, all CEQA/NEPA work is completed, and DWR is ready to publish the 2005 Reliability Report in final format, the District is using previously published data indicating that single dry year deliveries will be 20%, and in a 6-year drought deliveries would range between 23 - 70% as actually experienced in the 1987-1992 drought (Table 12).
TABLE 12 RELIABILITY OF THE
DISTRICT’S WHOLESALE SUPPLIERS (% OF NORMAL YEAR SUPPLIES)
Wholesaler Source Single Dry Year
Multiple Dry Years Year 1 Year 2 Year 3 Year 4 Year 5 Year 6
Cachuma Project (Bureau of Reclamation) – worst case six-year drought 1946-1951
74% 100% 100% 100% 74% 74% 74%
State Water Project (CCWA) – worst case six-year drought, 19871992
20% 70% 23% 70% 27% 24% 29%
Should the 4% figure ultimately be accepted, then the District would need to consider a combination of an increased number of groundwater wells, and/or increased water conservation/rationing efforts, and/or participation in the State Dry Year Water Program, and/or participation alone or in cooperation with others in one of the several groundwater banks (i.e., Kern County Water Agency) that are now operational, in order to meet single dry year demand. Should the 37% 6-year drought figure ultimately be accepted, no water planning action would need to be taken since this scenario is not as critical as the 1987-1992 actual historical event which is used by the District in is water planning.
Goleta Water District – Dec. 2005 (corrected) 18 Final Urban Water Management Plan
4.0 WATER SUPPLY RELIABILITY
4.1 RELIABILITY ESTIMATES
The District’s water supply is affected by climatic conditions that can result in shortages in supply during periods with low rainfall and runoff. Shortages can occur for different supply sources depending upon the extent and location of the reduced rainfall and runoff. Low rainfall years in northern California can affect the SWP deliveries to the District. Similarly, low runoff in the Santa Ynez River watershed will reduce supplies from the Cachuma Project. The reliability of the District’s water supply is described in this section by estimating the District’s water supply during normal years, a single critically dry year, and a series of dry years. These conditions are defined below:
Normal Years - For purposes of this assessment, normal years are those years when runoff conditions are considered average or above average, and surface water supplies in both northern California (source of SWP water) and Santa Barbara County (runoff into Cachuma Lake) are sufficient for the District to receive its regular entitlement from the Cachuma Project of 9,322 AFY and 4,500 AFY from the State Water Project (which is 60% of the District's allotment). In normal years, the District would also produce recycled water as necessary, up to its current maximum capacity of 1,500 AFY. Finally, groundwater would be produced in an average year only if other supplies were insufficient to meet demand. For this analysis, the District’s full 2,350 AFY groundwater entitlement would be available in a normal year.
Critical Dry Year -The critical dry year is defined as the year with the lowest runoff in the watersheds that affect the District’s surface water supplies. While this condition is considered extreme for water supply planning, is should be noted that a single critical dry year may or may not have any impact on the District's water supply for that year. In some cases, a very dry year may be a single event in a series of many normal and wet years. Historically, the driest years do not necessarily occur in the middle of a multi-year drought. The following assumptions were used to develop the critical dry year conditions for the District’s water supply.
The driest year of record in northern California (1977) was used for calculating the SWP water deliveries to the District, which would be 20% of the District’s full entitlement. The critical dry year for the Cachuma Project is 1951 that was the driest year of record on the Santa Ynez River. Based on computer simulation modeling, Cachuma Project deliveries to the District during this year would have been 74% of the District’s full project allotment. This year also represented the last year of a 6-year drought period (1946 to 1951), and as such, the deliveries from the Cachuma Project were less than deliveries if the critical dry year occurred after a normal or wet year. Normal year groundwater production during the critical dry year would not be reduced, as groundwater supplies would not be immediately affected by a single dry year, and because the District has sufficient banked groundwater to meet demands in single and multiple dry years. It is assumed that the District would not reduce production of recycled water in a single dry year.
Multiple Dry Years -Multiple dry years are defined as a sequence of six years with the lowest combined total runoff over the period of record in the watersheds affecting the District’s surface water supplies. For SWP water deliveries, the multiple dry year scenario is defined by the Department of Water Resources as the period 1987-1992 inclusive. Under this six-year scenario, SWP water deliveries to the District would be 23% to 70% of the District’s allotment.
Goleta Water District – Dec. 2005 (corrected) 19 Final Urban Water Management Plan
←The multiple dry year scenario for Cachuma Lake was developed by the Santa Barbara County Flood Control & Water Conservation District's Santa Ynez River Hydrology Model. This model uses hydrologic data for the period of 1917 through 1993 to estimate reservoir water levels and system yields to the Cachuma Project Member Units. The worst-case multiple dry year scenario on the Santa Ynez River occurred during the six-year period 1946-1951 inclusive. Under these conditions, the model predicts that the District would receive 74 to 100% of its Cachuma Project allotment. As is the case for the critical dry year, water to meet demand during the multiple dry year scenarios would be met with banked groundwater from the conjunctive use program, which currently has over 35,000 acre feet of banked groundwater.
The projections of water supplies under normal, single dry year, and multiple dry year conditions are presented in Table 13.
TABLE 13 PROJECTIONS OF AVAILABLE WATER SUPPLIES
IN NORMAL, CRITICAL, AND MULTIPLE DRY YEARS
Available Supply in AFY (actual production would be less to match demand) Normal
YearCritical Dry
Year (a)Multiple Dry Years (a)
Year l Year 2 Year 3 Year 4 Year 5 Year 6 Cachuma Project 9,322 8,390 9,322 9,322 9,322 6,898 6,898 6,898
Lake Cachuma Deliveries (% of normal
of normal year)
90% 100% 100% 100% 74% 74% 74%
State Water Supply (a) 4,500 1,490 4,500 1,714 4,183 2,012 1,788 2,161State Water Deliveries
(% of normal year) 20% 70% 23% 70% 27% 24% 29%
Groundwater (annual legal entitlement) (b)
2,350 2,350 2,350 2,350 2,350 2,350 2,350 2,350
Banked Groundwater (c) [if needed] 3,250 3,250 3,250 3,250 3,250 3,250 3,250Recycled Water (maximum production)
1,500 1,500 1,500 1,500 1,500 1,500 1,500 1,500
TOTAL 17,672 16,980 20,922 18,136 20,605 16,010 15,786 16,159(a) Critical dry year defined as driest year during the SWP history (1977), and the driest year from the 6-year drought of record
(1946-51 along the Santa Ynez River.(b) The District’s total SWP allotment and CCWA drought buffer supply is 7,450 AFY. Shortages are calculated using this
amount. SWP shortages for multiple dry years are based on worst 6-year drought of record (1946-1951) inclusive. Actual deliveries generally cannot exceed 4,500 AFY.
(c) The Court determined the District’s average annual entitlement to be 2,350 AFY. Groundwater is only used after Cachuma Project and SWP water are fully utilized. The District’s maximum pumping capability will be 5,600 AFY.
(d) The Court determined storage that may be pumped in addition to the District’s annual pumping entitlement. Banked groundwater is not considered an annual supply source and is currently not required to meet current annual demands in normal years. It is available in extraordinary circumstances such a drought. Banked groundwater is generated by injected Cachuma Project and/or SWP water, use of SWP water to meet demand in-lieu of pumping, and natural recharge in excess of demand during wet cycles due to surplus Cachuma Project water to meet demand. The number of years that banked groundwater can be pumped depends on stored amounts. To date, over 35,000 acre-feet have been stored in the Goleta groundwater basin for future uses during dry years. The SAFE ordinance provides that: “Unless and until the Central Basin Water level rises to 100% of its 1972 levels, the District shall be required to make its Annual Buffer Commitment.” And, “The Drought Buffer may be pumped and distributed by the District only to existing customers and only in the event that a drought on the South Coast causes a reduction in the District’s annual deliveries from Lake Cachuma.”
Goleta Water District – Dec. 2005 (corrected) 20 Final Urban Water Management Plan
The District’s base year assumptions for the different water year types are presented in Table 14.
TABLE 14 BASIS OF WATER YEAR TYPE FOR WATER SUPPLY PROJECTIONS
Water Year Type SWP Cachuma ProjectNormal Year 2004 2004 Single Dry Year 1977 1951 Multiple Dry Years 1987-1992 (6 years) 1946-1951 (6 years)
4.2 SUMMARY OF FACTORS AFFECTING RELIABILITY
Water Code Section 10631(c) requires that the District describe the reliability of its water supplies, and any vulnerability to seasonal or climatic shortages. Two of the District’s water sources are subject to year-to-year variation in production, and are also vulnerable to shortages – Cachuma Project and State Water Project. The factors that affect their reliability and vulnerability to shortages are legal, environmental, and climatic, as summarized in Table 15. The District has considered the variation in supply from these sources by using long-term average annual water production projections for both sources that take into account dry years. Hence, the District’s water supply planning has addressed the inherent issues of reliability and vulnerability in these water supplies. Shortages in these two water supply sources would be offset by water conservation and use of banked groundwater.
TABLE 15 FACTORS AFFECTING RELIABILITY OF WATER SUPPLY
Water Source
Legal Environmental Water Quality Climatic
Cachuma Project
Current and future water production is subject to ongoing jurisdiction of the State Water Board
over water rights permits issued to the Bureau of
Reclamation, and ongoing compliance with federal Endangered Species Act
Diversion and storage under water rights must
comply with environmental laws and regulations to
protect public trust resources and endangered
species. Possible new endangered species or resource issues in the
future could affect water supply.
No major factors affecting
reliability. Water quality from this
source is relatively
consistent and not vulnerable to major changes
Reliability of this source is
dependent on climatic
conditions. Project is
vulnerable to shortages due to low runoff years.
State Water Project
SWP is subject to a myriad of state and
federal laws and regulations that affect the current and future water
production from the Sacramento-San Joaquin
Delta. Many of these laws and regulations could be
Diversions from the Sacramento-San Joaquin Delta must comply with
various environmental laws and regulations to protect public trust resources and
endangered species. Possible new endangered species or resource issues
No major water quality factors
affecting reliability.
Ongoing concern about
disinfection by products that is
manageable.
Reliability of this source is
dependent on climatic
conditions. Project is
vulnerable to shortages due to low runoff years.
Goleta Water District – Dec. 2005 (corrected) 21 Final Urban Water Management Plan
affected by political factors.
in the future could affect water supply.
Ground water
There are no legal uncertainties or factors that could reduce the
reliability of this source, as the District’s
groundwater supply has been determined by
adjudication.
Well facilities are generally resistant to damage from earthquakes making local groundwater one of the more reliable sources of
water during these events.
No major water quality factors
affecting reliability.
Groundwater contamination is not considered a significant threat
in the basin.
In general, climatic variation would not have a significant effect
on this source because the District has
stored groundwater to use in multiple
dry years. Recycled No legal factors would
affect the reliability of this source. There is excess production
capacity and untapped markets at this time under
current regulations for recycled water use. Future
regulations are not expected to reduce
allowable uses.
None. Recycled water is treated to meet
current standards. Future
changes in treatment
standards, while not anticipated, could affect the
costs of producing
recycled water.
None. Current and projected recycled water
use is not expected to be substantially
affected by dry year conditions.
Goleta Water District – Dec. 2005 (corrected) 22 Final Urban Water Management Plan
5.0 OPPORTUNITIES FOR EXCHANGES OR TRANSFERS
5.1 EXCHANGES OR TRANSFERS
The District has, on occasion, considered or completed the sale or purchase of water with other water purveyors. In all cases, the transactions involved short-term needs or opportunities. The District considers exchanges and transfers to be opportunities that will be considered when the need arises, and the circumstances and financial arrangements are favorable to the District. The District is considering no long-term sales or purchases of water.
The District would consider purchasing water on a short-term basis from a willing seller in the event of a projected or actual water shortage. The District would consider selling unneeded water on a short-term basis when projected or actual supplies exceed the District’s demand and ability to inject groundwater. Completion of an exchange, transfer, purchase or sale of water involving an outside agency or party would require approval by the Board of Directors. The District actually initiated the process to purchase available water from rice farmers in the Central Valley last year. That transaction became unnecessary with this winter's rains and Cachuma filling and spilling.
The District has two categories of water exchange or transfers to supplement water supply, as described below.
Exchanges or Transfers With Cachuma Project Member Units - The District has the ability to purchase water from other Cachuma Project Member Units in the event of a need, or to sell unneeded water to other Cachuma Member Units. The Cachuma Member Units include the District, Carpinteria Valley Water District, Montecito Water District, City of Santa Barbara, and Santa Ynez River Water Conservation District, Improvement District No. 1. The type of transaction would occur when there is a willing seller and buyer. It can occur without the approval of the Bureau of Reclamation. The Cachuma Member Units can readily transfer water to one another because all of the Member Units have water stored in Cachuma Lake. In the past, the District has engaged in transactions with other Cachuma Project Member Units involving Cachuma Project water.
Exchanges or Transfers With Other SWP Contractors - The District can purchase SWP water from other SWP contractors in the state under the Department of Water Resources’ (DWR’s) Turnback Pool Program in which SWP contractors can sell water at anytime to other SWP contractors, provided the buyer has the ability to convey the water in addition to the buyer’s existing SWP deliveries. This type of transaction is coordinated by the Central Coast Water Authority (CCWA) on behalf of the local SWP contractors. Each year, DWR notifies CCWA of the anticipated SWP deliveries to its members, including any SWP water for sale by other SWP contractors. At that time, the District can purchase the additional water, provided the SWP and CCWA conveyance facilities can accommodate the additional deliveries. To date, the District has not purchased any additional SWP water through this program. The purchase of SWP water from other contractors will remain a potential short-term source for the District in the event of a prolonged southern California drought combined with normal to wet year conditions in northern California in which excess SWP water may be available.
It should be noted that the District can offer to sell a portion of its SWP water deliveries in any given year to other SWP contractors as a short-term transaction. The District can only sell up to the amount of SWP water that is available to the District in the particular year. The sale is subject to approval by CCWA. The CCWA
Goleta Water District – Dec. 2005 (corrected) 23 Final Urban Water Management Plan
contractors can also sell and exchange water amongst themselves. The District has in the past sold water to other CCWA contractors.
DWR also administers the “Dry Year Program” in which DWR will deliver water from agricultural users in the Central Valley when their fields are idled in dry years. The agricultural users will sell unused water from their DWR contracts (not part of the SWP project), and DWR will convey the water through the SWP system if there is available capacity.
5.2 INTERCONNECTIONS
The District maintains five potable water interconnections with the City of Santa Barbara. One of the interconnections, Modoc, supplies the District's customers in the City of Santa Barbara's La Vista 440 pressure zone. The other four interconnections are available for emergency use. Should the District lose a transmission main such as the 42-inch lateral, or a local supply source such as the wells, the emergency interconnections can be used to supply the District with water. The District and the City share Lake Cachuma as a major water supply source. If the Lake Cachuma supply is interrupted, both agencies will have a water shortage emergency. In this case, the interconnections will likely not be available.
5.3 WATER WHEELING AGREEMENTS
The District is a party to three Agreements entered into pursuant to the requirements of Water Code ¤¤ 1810 et. seq. The Water Code requires that public agencies with excess capacity in their distribution system make that excess capacity available to parties holding a water entitlement who need to use that excess capacity for delivery of that water. The Agreements provide for use of the District's treatment and distribution facilities by the three parties, who pay the reasonable treatment and conveyance costs to the District for use of the facilities. The three parties to those Agreements are Santa Barbara Research Center, Camino Real LLC, and Morehart Land Company.
The Santa Barbara Research Center is a business entity with operations in the Goleta service area. Santa Barbara Research Center holds rights to 50 acre feet per year of State Water Project allotment that is delivered to the District facilities in the same manner as the District's State Water Project allotment.
The Morehart Land Company holds 200 acre-feet per year of State Water Project allotment. Pursuant to the terms of the Water Conveyance Agreement, a connection to the District's Goleta West Conduit facilities has been completed for delivery of that State Water Project water to Morehart. Currently only a small amount of that water is delivered. A land use application for a development project that proposes to use that allotment, is currently pending before the County of Santa Barbara.
Camino Real, LLC, holds rights to 100 acre-feet per year of Cachuma Project water. That water is delivered to the District, treated and then delivered to the Camino Real property, referred to as the Camino Real Marketplace, the major shopping center in the City of Goleta. To the extent that the Camino Real Marketplace does not need the entire 100 acre feet per year, the District is entitled under the terms of the Agreement to use that water.
These Water Conveyance Agreements have no impact on the District's long-term water supply or demand. Each of the Agreements specifically state that the District has no obligation to deliver water in excess of that which each of the three parties is entitled to and receives through their agreements with others.
Goleta Water District – Dec. 2005 (corrected) 24 Final Urban Water Management Plan
6.0 PAST, CURRENT AND FUTURE WATER USE BY SECTORS
6.1 HISTORIC AND CURRENT WATER USE
The District provides water to a variety of municipal, industrial, and agricultural users. Historic annual treated and untreated water deliveries (sales) show variation from year to year due to climatic factors. For example, water deliveries during the drought years of 1989 – 1992 were greatly reduced due to a combination of reduced demands, and mandatory reductions by the District. Water usage since 1993 has slowly increased to near pre-drought levels due to a combination of increased population and changes in land and use practices by District residents.
Recent water deliveries during the period 1999-2004 are presented in Table 16 by water use sector. These data were derived from District sales records. They also include unaccounted for losses, which were estimated to be 6 to 8 percent of the District’s total water production based on a recent system audit (JBS Associates, 2005). These losses include unavoidable leakages, meter inaccuracy, unmetered connections, unbilled water use, and record keeping errors. Total average annual water use during the past six years in the District has been 14,318 AFY.
TABLE 16 RECENT WATER SALES/DELIVERIES (ACRE-FEET PER YEAR), 1999-2004
Water Use Sectors (per Water Code) 1999 2000 2001 2002 2003 2004 Average
Single family residential 4,533 4,690 4,425 4,842 4,597 4,974 4,677 Multiple family residential 2,277 2,302 2,090 2,088 2,066 2,110 2,155 Commercial 2,083 2,141 1,940 2,021 1,927 2,082 2,032IndustrialInstitutional/governmental 536 508 564 571 562 606 558 Landscape 316 348 302 310 275 327 313 Agriculture 2,495 2,348 2,091 2,889 2,444 2,953 2,537
Subtotal 12,240 12,338 11,413 12,720 11,871 13,053 12,272
Additional Water Uses: Recycled water 928 1,003 839 1,083 968 1,051 979 Unaccounted for losses at 8% 1,064 1,073 992 1,106 1,032 1,135 1,067 Wholesale 0 0 0 0 0 0 0
TOTAL 14,232 14,414 13,244 14,909 13,871 15,239 14,318
The number of accounts in the District during recent years is shown in Table 17.
TABLE 17 NUMBER OF ACCOUNTS, 2005
Types of Accounts 1999 2000 2001 2002 2003 2004 2005Single Family Residence 12,380 12,667 12,894 13,023 13,076 13,078 13,109 Multiple Family Residential 1,159 1,164 1,171 1,167 1,278 1,530 1,550 Commercial, including SB Airport 986 1,054 1,203 1,010 1,024 1,019 1,027 Goleta Water District – Dec. 2005 (corrected) 25 Final Urban Water Management Plan
UCSB 5 5 5 5 7 7 7 Landscape 67 73 90 111 130 143 153 Agriculture 207 204 168 155 155 158 162 Recycled Water, including UCSB 23 23 28 29 31 30 31
TOTAL 14,827 15,190 15,559 15,500 15,701 15,965 16,039
6.2 PROJECTED WATER USE
Predicting future water use is very difficult, particularly over a 20-year period, because there are many factors that influence water demand, including economic conditions, population growth, land use policies, political factors, and water costs. Hence, the District has used several different methods to project future water use by sector in order to increase the confidence in the projections. The following methods to project future water use by sector for the years 2010, 2015, 2020, 2025, and 2030 were used:
1. Use prior District water use projections 2. Apply a regional population growth rate to predict future residential water demand 3. Use recent historic water use growth rates as a predictor of future water demand4. Develop water use projections using data from land use jurisdictions in the District service area –
City of Goleta, University of California, Santa Barbara Airport (City of Santa Barbara), and Santa Barbara County (Isla Vista and other unincorporated areas).
The calculations and assumptions for each method are presented in Appendix A. Each method of projecting future water use has inherent limitations and potential errors. To reduce the uncertainty in these predictions, the average estimated total annual water use derived from each method was calculated to provide a final estimate of future water use in the District from 2010 to 2030, as shown in Table 18.
TABLE 18
ESTIMATED FUTURE WATER USE (AFY), 2010-2030
Customer Class 2010 2015 2020 2025 2030Single family residential 5,007 5,248 5,488 5,761 6,034 Multiple family residential 2,410 2,509 2,609 2,710 2,785 Commercial (+ Airport) 2,138 2,188 2,239 2,287 2,311 UCSB 598 605 612 620 629 Park & landscape irrigation 314 316 317 319 320 Agriculture 2,556 2,604 2,654 2,708 2,763 Recycled water (+ UCSB) 1,109 1,177 1,251 1,328 1,412 UAW at 6% beginning in 2010 844 875 906 940 971 Grand Total 14,977 15,522 16,076 16,673 17,225
Source: Table A-18 from Appendix A.
Goleta Water District – Dec. 2005 (corrected) 26 Final Urban Water Management Plan
7.0 WATER CONSERVATION, INCLUDING DEMAND MANAGEMENT MEASURES
The District is a member of the California Urban Water Conservation Council (CUWCC) and signed the Memorandum of Understanding on December 23, 1994. As a signatory, the District implements all of the cost effective Best Management Practices (BMPs) set forth in the MOU and is on track according to the schedule of implementation. A summary of each BMP implemented as a demand management measure is provided below.
← BMP 1: WATER SURVEY PROGRAMS FOR SINGLE-FAMILY RESIDENTIAL AND MULTIFAMILY RESIDENTIAL CUSTOMERS. The District currently offers residential water surveys to its customers free of charge and is on track to meet the required number of audits within the next two years. ←← BMP 2: RESIDENTIAL PLUMBING RETROFIT. The Goleta Water District gave free low flow showerheads to customers during the drought from 1988-1992. In 1992, low flow showerheads became mandatory. As part of the residential water surveys, the Goleta Water District measures the flow of each showerhead. According to those results, the percent of households in Goleta Water District with low flow showerheads is 83%. In addition, the Goleta Water District provides a free 1.7-gallon per minute showerhead at each residential water survey where a high flow showerhead is discovered. ←← BMP 3: SYSTEM WATER AUDITS, LEAK DETECTION AND REPAIR. Each year, the Goleta Water District completes a pre-screening audit of our water system. In 2004, the prescreening audit estimated 5% unaccounted for water losses. Even though it is not required for UAW of less 10% or less, in January of 2005, JBS Associates, Inc. completed a Water Distribution System Audit for the Goleta Water District. In the study, the District unaccounted for water loss was found to be from 6% to 8% of total production, thus confirming the system pre-screening system audit findings. Because the system losses are less than 10%, the District does not implement a system leak detection program at this time. ←← BMP 4: METERING WITH COMMODITY RATES FOR ALL NEW CONNECTIONS AND RETROFIT OF EXISTING CONNECTIONS. Every service connection within the Goleta Water District is metered and billed by volume-of-use. Therefore, the implementation of this BMP is complete. ←← BMP 5: LARGE LANDSCAPE CONSERVATION PROGRAMS AND INCENTIVES. The District currently offers landscape surveys to large landscape customers. In addition, the District is in the beginning stages of developing water budgets for these customers in coordination with the Santa Barbara County Water Agency. The water budgets are expected to be sent to customers by 2006. ←← BMP 6: HIGH-EFFICIENCY CLOTHES WASHING MACHINE FINANCIAL INCENTIVE PROGRAMS. The District currently offers a $100 rebate to CII customers who purchase a qualifying washing machine. ←← BMP 7: PUBLIC INFORMATION PROGRAMS. The Goleta Water District currently maintains an active public information program to promote and educate customers about water conservation. District staff provides conservation materials at several public events throughout the year such as the Lemon Festival, Earth Day, and the Sustainable Landscape Fair. ←← BMP 8: SCHOOL EDUCATION PROGRAMS. The District currently implements a school education program in conjunction with the Santa Barbara County Water Agency. Approximately 2530 classroom presentations are given each year to a total of about 600-700 students. To view a list of the
Goleta Water District – Dec. 2005 (corrected) 27 Final Urban Water Management Plan
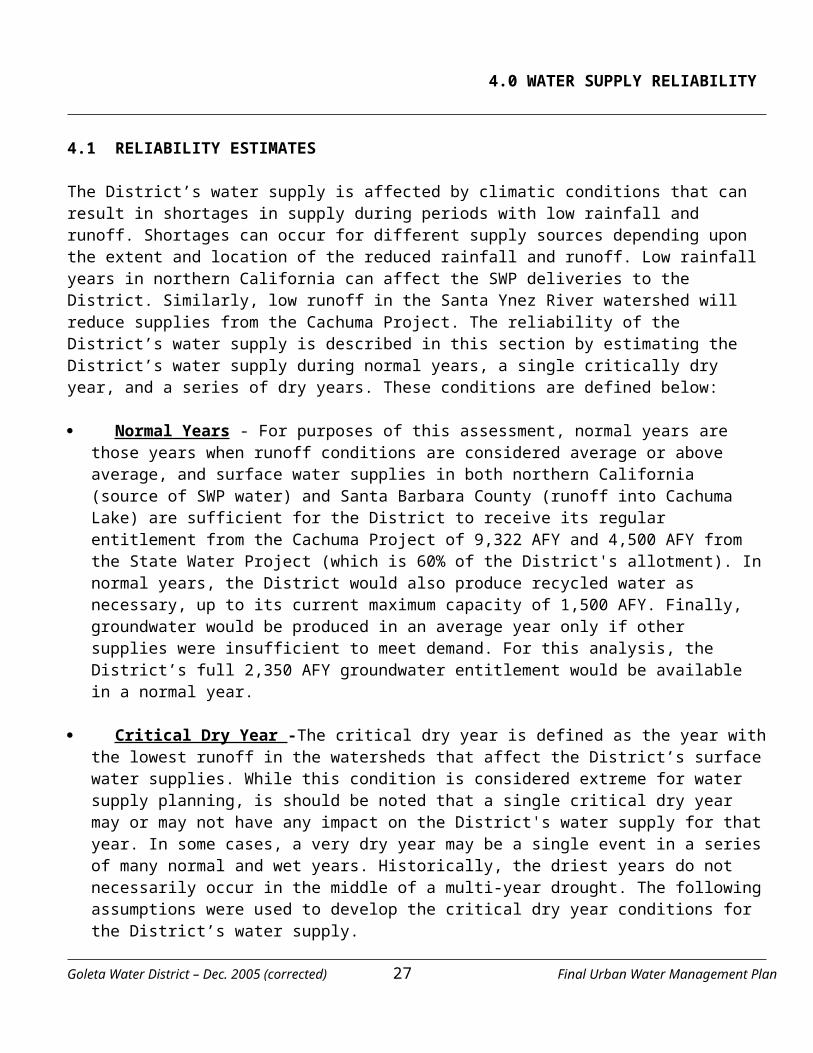
presentations, visit www.sbwater.org. ←← BMP 9: CONSERVATION PROGRAMS FOR COMMERCIAL, INDUSTRIAL, AND INSTITUTIONAL (CII) ACCOUNTS. The District is in the process of re-ranking our customers as Commercial, Industrial, and Institutional according to use. In addition, the District offers water use surveys to all of our customers. CII customers can also qualify to receive CII rebates for qualifying ULFTs, ULF urinals, zero water urinals and high efficiency washing machines. ←← BMP 10: WHOLESALE AGENCY ASSISTANCE PROGRAMS (Revised March 10, 2004) District does is not a wholesale water provider. Therefore, BMP 10 is not applicable to the District. ←← BMP 11: CONSERVATION PRICING. The District currently implements conservation pricing in that all water is sold at a uniform volumetric rate. Some members of the District’s Citizen’s Rate Committee have commented that the existing rate structure was water conserving. To improve upon this BMP, the District is currently conducting a rate study to determine if it would be feasible to implement an increasing block volumetric rate in the future. ←← BMP 12: CONSERVATION COORDINATOR. The District has implemented this BMP by designating Misty Gonzales as the full-time Conservation Coordinator for District. ←← BMP 13: WATER WASTE PROHIBITION. The Goleta Water District code 6.20.070 prohibits the waste of district water and thus has implemented this BMP. ←← BMP 14: RESIDENTIAL ULFT REPLACEMENT PROGRAMS. During the drought from 19881992, the Goleta Water District implemented a $2 million ULFT rebate and distribution program and has completed implementation for this BMP. ←The BMP Activity Reports for 2001-2004 are included in Appendix C-1. The Coverage Reports for 2003-2004 are presented in Appendix C-2. A copy of the CUWCC Coverage Calculator for the District is included in Appendix C-3.
Goleta Water District – Dec. 2005 (corrected) 28 Final Urban Water Management Plan
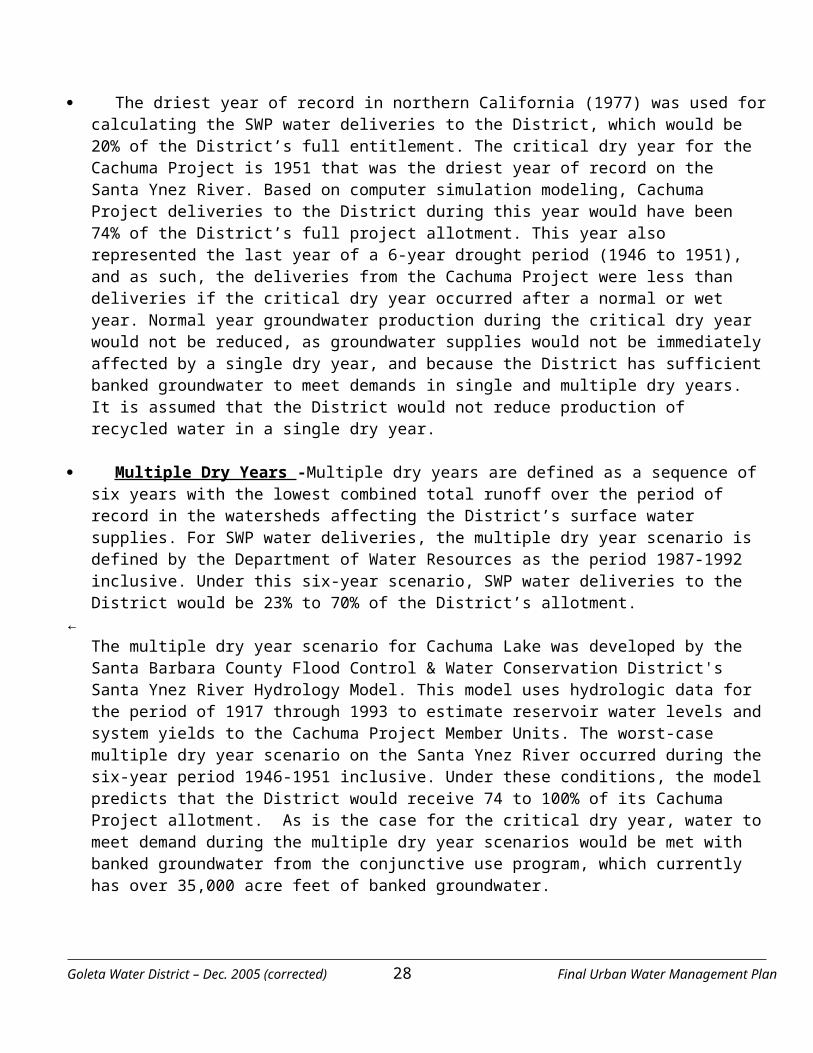
8.0 FUTURE WATER SUPPLY PROJECTS
As shown in Section 13, the District’s water supply will meet the expected demand over the next 20 years. As such, the District is not planning to develop new water supply projects. The District will continue to implement its conjunctive use program in which surplus surface water from the Cachuma Project and SWP will be stored in the local groundwater basin for use during dry years.
The District has an on-going 20 year Capital Improvement program which is reviewed on an annual basis and identifies the water system improvements required to ensure reliability during normal operations by replacing old facilities and correcting existing system deficiencies; emergency scenarios that could affect water deliveries; and system improvements to improve service during emergencies. The following improvements are scheduled:
8.1 IMPROVEMENTS FOR SYSTEM RELIABILITY DURING NORMAL OPERATIONS
Near Term through Year 2010 Upgrades and replacement of Corona Del Mar Water Treatment Plant facilities. Rehabilitation of San Marcos, San Antonio, Airport, El Camino, Anita and University wells to
conduct conjunctive use operations and meet emergency demands. Annual water main replacement of pipeline identified in priority of replacement need. Groundwater modeling of Goleta Groundwater Basin to improve and maximize conjunctive use of
groundwater and surface water supplies. Repair of Goleta West Conduit transmission main for reliable flow to west agricultural area of the
District. Interior coating of Corona Del Mar Reservoir to eliminate leakage.
Long Term through Year 2030 New wells in accordance with analysis of groundwater modeling to optimize use of groundwater
basin. A 3 million gallon reservoir to add storage and reduce deficiencies in eastern portion of District. Ellwood Reservoir, a 2 million gallon reservoir to add and improve storage for fire fighting,
emergency and supply operation in the lower Ellwood pressure zone. Meter installation downstream of District reservoirs to improve accuracy in measurement of water
supply efficiencies. Pipeline in Kellogg Drive south of freeway to improve distribution flows to old town Goleta area. One million gallon storage tank and Hollister booster pump improvements to improve supply of
recycled water to golf courses and landscape users.
8.2 IMPROVEMENTS FOR SYSTEM RELIABILITY DURING EMERGENCIES
The District has determined that the most effective way to improve reliability during a drought or other emergency water shortage is to expand the District's conjunctive use program. The District is rehabilitating six wells within the Central Basin to increase the total well extraction capacity to 5.2 mgd. This would provide a total of nine operational wells, and should provide enough water supply capacity to avoid an expansion of the Corona Del Mar WTP. In order to meet emergency and drought conditions, two new wells should be constructed, and the Glen Annie Reservoir Pump Station should be rehabilitated. The proposed system reliability improvements for emergency needs are as follows:
Goleta Water District – Dec. 2005 (corrected) 29 Final Urban Water Management Plan
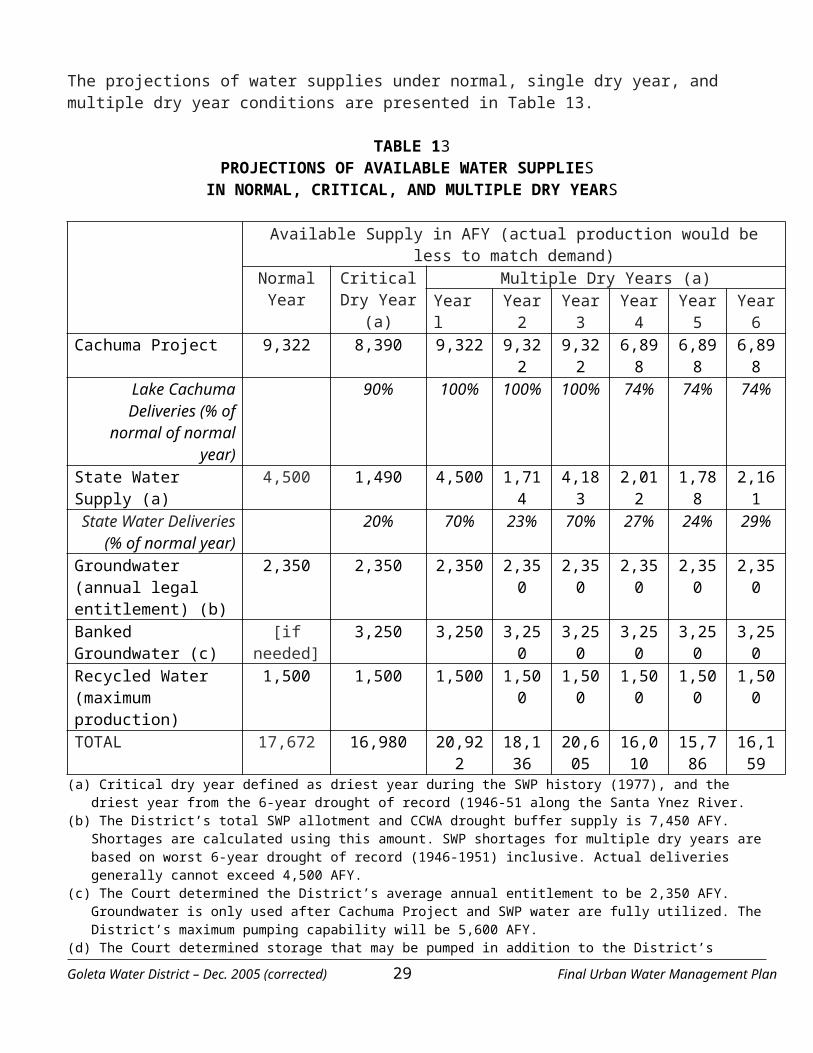
Rehabilitate and/or replace the San Ricardo well Rehabilitate and/or replace the Shirrell well Rehabilitate and /or replace the Berkeley well Construct two new wells to meet an emergency or drought condition Rehabilitate the Glen Annie Reservoir Pump Station to deliver water from Glen Annie Reservoir to the
Corona Del Mar WTP for use during times of emergency or drought←To improve the District's ability to distribute water should a transmission main fail, a 24-inch diameter bypass pipeline and pressure reducing station along Cathedral Oaks Road could be built to provide service between the 230, Ellwood and Corona pressure zones←
Goleta Water District – Dec. 2005 (corrected) 30 Final Urban Water Management Plan
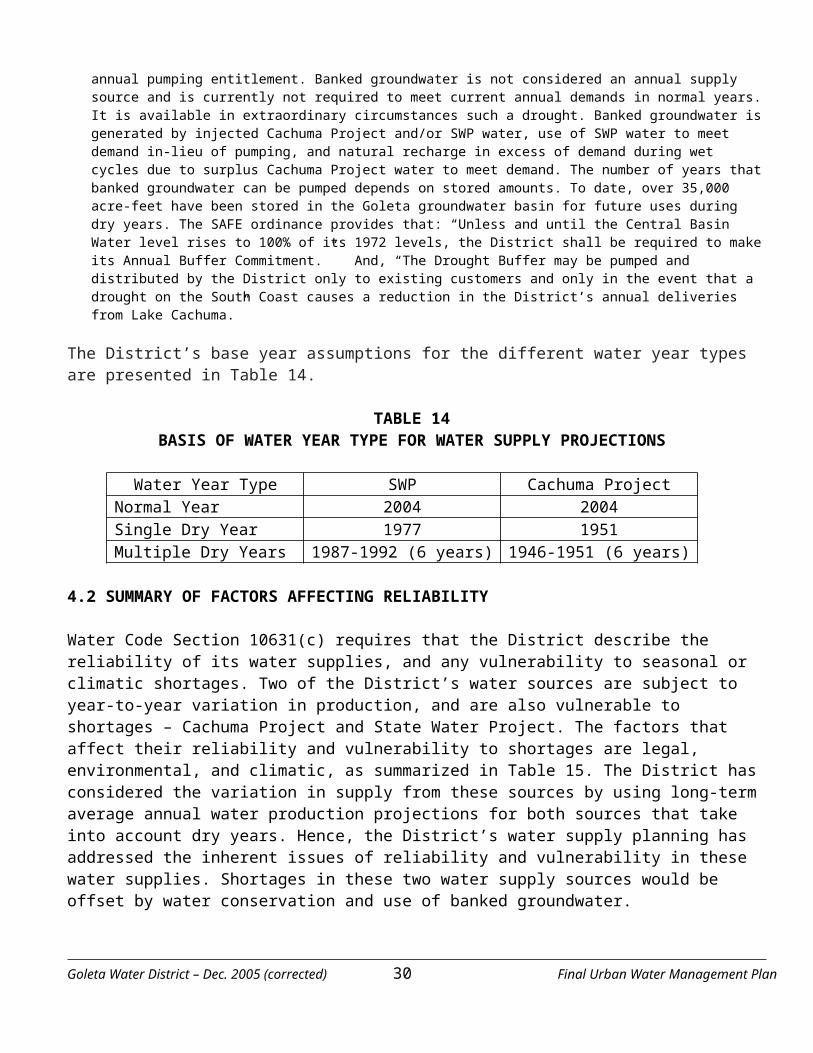
9.0 DEVELOPMENT OF DESALINATED WATER
As shown in Section 13, the District’s water supply will meet the expected demand over the next 20 years. As such, the District is not planning to develop new water supply projects, including desalinated water. The District participated in the financing of the City of Santa Barbara’s desalination plant during the 1987-1992 drought. The drought ended before the plant was needed. Although the City of Santa Barbara’s desalination plant remains decommissioned and available for future droughts, the District no longer has any financial or institutional arrangements with the City of Santa Barbara for desalinated water in the future.
In the 1980s, the District studied potential desalinated water opportunities, but these opportunities were determined to be financially infeasible in light of other sources of supplemental water supplies. While the District does not foresee a need for desalinated water in the next 20 years, it will continue to re-evaluate the feasibility of this supplemental water source over time.
Goleta Water District – Dec. 2005 (corrected) 31 Final Urban Water Management Plan
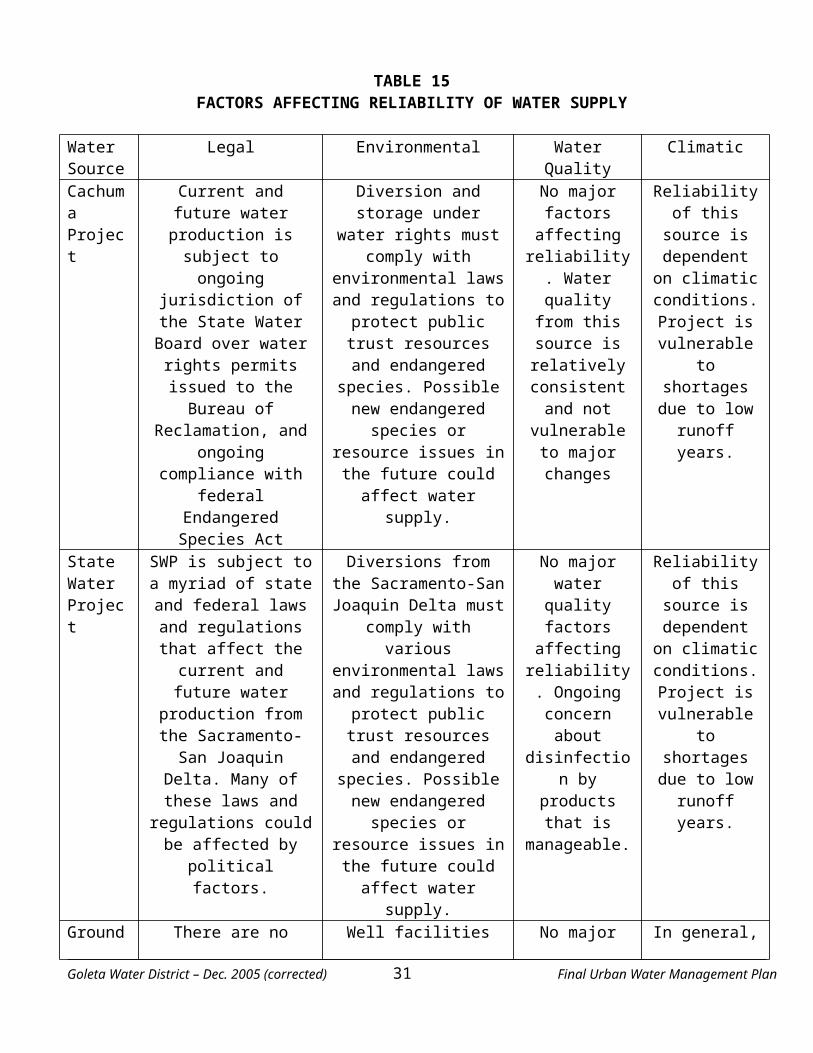
10.0 URBAN WATER SHORTAGE CONTINGENCY PLAN
The District's current Water Shortage Contingency Plan is summarized in this section.
10.1 STAGES OF ACTION
The stages of action for the District are based on water demand reduction goals, priority of use and health and safety requirements.
Rationing Stages and Reduction Goals
The District has developed a four-stage water-rationing plan to implement during a declared water shortage emergency. The plan includes voluntary and mandatory rationing depending on the causes, severity and anticipated duration of the supply shortage. Table 19 presents the District's water rationing stages and reduction goals.
TABLE 19 WATER RATIONING STAGES AND REDUCTION GOALS
Stage Supply Shortage Condition
Customer Reduction Demand Goal
Type of Rationing Program
IIIIIIIV
Up to 15%15% -25%25% - 35%35% - 50%
15% 25% 35%
50% or greater
Voluntary Mandatory Mandatory Mandatory
Priority by Use
Priorities for use of available potable water during shortages are based on the District's experience during the 1987 through 1992 drought and legal requirements set forth in the California Water Code, Sections 350-358. Water allocations are established for all customers according to the following ranking system (listed from highest to lowest priority):
1. Minimum health and safety allocations for interior residential needs (includes single-family residential, multifamily residential, hospitals and convalescent facilities, retirement and mobile home communities, student housing, fire fighting and public safety)
2. Commercial, industrial, institutional/ governmental operations (where water is used for manufacturing and for minimum health and safety allocations for employees and visitors), to maintain jobs and economic base of the community (not for landscape uses)
3. Permanent agriculture (orchards, vineyards, and other commercial agriculture which would require at least five years to return to production)
4. Annual agriculture (floriculture, strawberries, other truck crops) 5. Existing landscaping 6. New customers, proposed projects without permits when a shortage is declared
Goleta Water District – Dec. 2005 (corrected) 32 Final Urban Water Management Plan
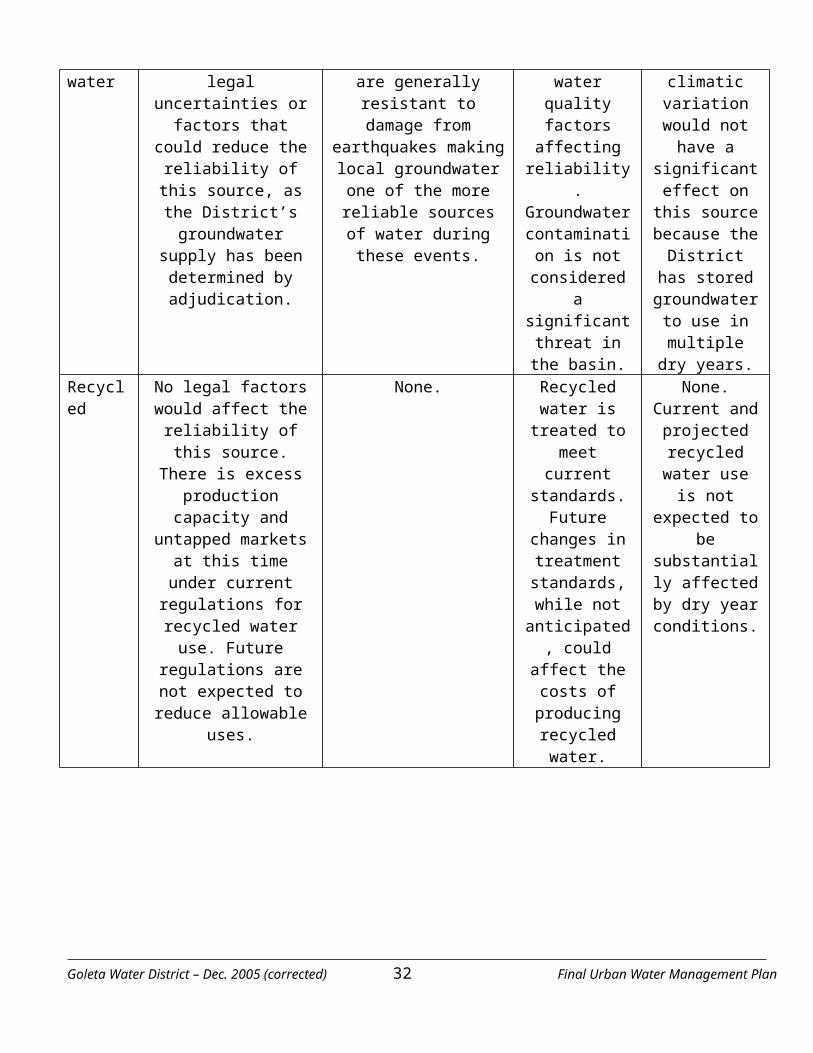
Health and Safety Requirements
Table 20 presents per capita health and safety water requirements based on estimates of interior residential water use in the United States. In Stage 1 shortages, customers may adjust either interior or outdoor water use (or both) in order to meet the voluntary water reduction goal.
TABLE 20 PER CAPITA HEALTH AND SAFETY WATER QUANTITY CALCULATIONS
Allocated Health and Safety use of 50 gallons-per-person-per-dayNon-conserving fixtures Habit Change Conserving fixtures
Toilets 5 flushes x 5.5 gpf 27.5 3 flushes x 5.5 gpf 16.5 5 flushes x 1.6 gpf 8.0
Shower 5 min x 4.0 gpm 20.0 4 min x 4.0 gpm 12.0 5 min x 2.0 gpm 10.0 Washer 12.5 gpcd 12.5 11.5 gpcd 11.5 11.5 gpcd 11.5Kitchen/Other 4 gpcd 4.0 4 gpcd 4.0 4 gpcd 4.0Other 4 gpcd 4.0 4 gpcd 4.0 4 gpcd 4.0Total, gpcd 4 gpcd 68.0 Total, gpcd 48.0 Total, gpcd 37.5
Total, HCF per capita per year 33.0 23.0 18.0 Note: These estimates are consistent with estimates developed by the California Department of Water Resources
Water Shortage Stages and Triggering Mechanisms
As the water purveyor, the District must provide the minimum health and safety water needs of the community at all times. The water shortage response is designed to provide a minimum of 50 percent of normal supply during a severe or extended water shortage. The rationing program triggering levels shown in Table 21 were established to ensure that this goal is met.
Rationing stages may be triggered by a shortage in one water source or a combination of sources. If it appears that it may be a dry year, the District may contact its agricultural customers in March, so that they can minimize potential financial impacts.
The District's potable water sources are groundwater, local surface water and State Water. Rationing stages may be triggered by a supply shortage or by contamination in one source or a combination of sources. Specific criteria for triggering the District's rationing stages are also shown in Table 20.
TABLE 21
WATER SHORTAGE STAGES AND TRIGGERING MECHANISMS
Supply Parameter
Water Supply Condition (percent reduction of supply)
Stage 1(Up to 15%) Stage II (15% -25%) Stage III (25% - 35%) Stage IV (35% - 50%)
Current Supply
Total supply is 85% - 90% of normal. And Below normal year is
Total supply is 75% - 85% of normal. And Below normal year is declared. Or
Total supply is 65% - 75% of normal Or Fifth consecutive below normal year is
Total supply is less than 65% of normal. Or Sixth consecutive below normal year is
Goleta Water District – Dec. 2005 (corrected) 33 Final Urban Water Management Plan
declared. Or declared. Or declared. Or Future Supply
Projected supply is insufficient to provide 80% of normal deliveries for the next two years. Or
Projected supply is insufficient to provide 75% of normal deliveries for the next two years. Or
Projected supply is insufficient to provide 65% of normal deliveries for the next two years. Or
Projected supply is insufficient to provide 50% of normal deliveries for the next two years. Or
Groundwater No groundwater pumping undertaken. Or
First year of banked groundwater taken, must be "replaced" consistent with the District's groundwater conjunctive use program. Or
Second year of banked groundwater taken, must be "replaced" consistent with the District's groundwater conjunctive use program. Or
No banked groundwater pumping available. Or Reduced groundwater pumping due to replenishment of previously pumped groundwater.
Water Quality
Contamination of 10% of water supply (exceeds primary drinking water standards).
Contamination of 20% of water supply (exceeds primary drinking water standards).
Contamination of 30% of water supply (exceeds primary drinking water standards).
Or
Disaster Loss
Disaster loss such as failure of the Tecolote Tunnel
Water Allotment Methods
During the 1987 to 1992 drought, the District adopted Ordinance 91-3, which established methods to determine customer water allocations during the 1987 to 1992 drought. In the future, if necessary, similar allocation methods will be adopted and implemented as summarized in Table 22.
TABLE 22 WATER ALLOTMENT METHODS
Customer Type Allotment MethodSingle Family Hybrid of Per-capita and Percentage Reduction Multifamily Hybrid of Per-capita and Percentage Reduction Commercial Percentage Reduction Industrial Percentage Reduction Government/Institutional Percentage Reduction Agricultural-Permanent Percentage Reduction - vary by efficiency Agricultural-Annual Percentage Reduction - vary by efficiency Recreational Percentage Reduction - vary by efficiency New Customers Per-capita (no allocation for new landscaping during a
declared water shortage.)
Goleta Water District – Dec. 2005 (corrected) 34 Final Urban Water Management Plan
Based on current and projected customer demand, water is allocated to each customer type by priority and rationing stage during a declared water shortage.
Individual customer allotments are based on the past five years of water use record. This gives the District a more accurate view of the usual water needs of each customer and provides additional flexibility in determining allotments and reviewing appeals. However, no allotment may be greater than the amount used in the most recent year of the five-year base period.
The District has classified each customer and calculated each customer's allotment according to the methods outlined in Ordinance 91-3. The allotments reflect seasonal patterns. Each customer will be notified of his or her classification and allotment by mail before the effective date of the Water Shortage Emergency. New customers were notified at the time the application for service was made.
In a disaster, prior notice of allotment may not be possible; notice will be provided by other means. Any customer may appeal the District's classification on the basis of use or the allotment on the basis of incorrect calculation.
10.2 MINIMUM WATER SUPPLY FOR THE NEXT THREE YEARS
Water Code Section 10632 (b) requires that the UWMP include an estimate of the minimum water supply available during each of the next three water years based on the driest three-year historic sequence for the agency's water supply. The Goleta Water District has four sources of water: Lake Cachuma, State Water Project, groundwater and recycled water. The driest three-year sequence with the greatest effect on the District supply was 1989 to 1992 when there was a statewide drought. The estimated water supply for the next three years, assuming dry year conditions from 1986-1992, is provided below in Table 23.
TABLE 23 MINIMUM WATER SUPPLY DURING A SEVEN-YEAR DRY PERIOD
IN THE IMMEDIATE FUTURE
Supply Source
Available Supply in AFY (actual production may be less to match demand)Normal
Year 2006* 2007* 2008*
Cachuma Project 9,322 6,898 6,898 6,898 Lake Cachuma Deliveries (% of normal year supply) 74% 74% 74%State Water Supply 4,500 2,012 1,788 2,161 State Water Deliveries (% of normal year supply) 27% 24% 29%Groundwater (annual legal entitlement) 2,350 2,350 2,350 2,350 Banked Groundwater 3,250 3,250 3,250 Recycled Water* 1,000 1,000 1,000 Total 16,172 15,510 15,286 15,659
*Data from years 4-6 of the six year dry year period shown in Table 13, with the exception that the recycled water productions is 1,000 AFY because capacity is not expected to reach 1,500 AFY by 2008.
10.3 PREPARATION FOR CATASTROPHIC WATER SUPPLY INTERRUPTION
Goleta Water District – Dec. 2005 (corrected) 35 Final Urban Water Management Plan
The District has four main sources of water - Lake Cachuma, the State Water Project, groundwater, and recycled water. These sources provide the District with a highly reliable water supply that is sufficient to meet demands. However, this reliability is not guaranteed and water supply shortages or interruptions can occur. The Contingency Plan was developed to ensure that the District is adequately prepared should such an emergency water shortage or other situation occur. See Appendix D for relevant sections of the District’s System Reliability Report.
During an emergency condition in which electrical power is unavailable, The District has a number of its facilities with standby generators to provide the facility with electrical power for operation. There are standby generators at the District’s Corona Del Mar Water Treatment Plant that supplies most of the District’s supply including all water from Lake Cachuma and the State Water Project. There is also a standby generator for providing electrical power to the District’s main office building for administration, customer service, operations and engineering.
Most of the District’s water distribution system is pressurized by the elevation of the water treatment plant; however, there are a few booster pump stations. The three main booster pump stations each have their own standby generator for emergency electrical power. The District also has two mobile emergency generators that can be used to provide electrical power to the District’s groundwater wells.
In the event of a water supply shortage or interruption, the District's Board of Directors has the power to declare a water shortage emergency and implement the appropriate measures to offset the supply shortage. Depending on the severity of the shortage, the District may implement voluntary or mandatory water rationing and/or increase well production.
Development of temporary supplemental water supplies can also increase system reliability during a water shortage emergency. Possible supplemental supplies include banked groundwater and temporary water purchases from other Cachuma Project Member Units, or participants in the SWP.
10.4 PROHIBITIONS, PENALTIES, AND CONSUMPTION REDUCTION METHODS
Mandatory Prohibitions on Water Wasting
Ordinance 91-3 includes prohibitions on various wasteful water uses such as lawn watering during midday hours, washing sidewalks and driveways with potable water, and allowing plumbing leaks to go uncorrected more than 8 hours after customer notification.
Excessive Use Penalties
Any customer violating the regulations and restrictions on water use that are in effect receives a written warning for the first violation. Upon a second violation, the customer receives a written warning and the District may install a flow-restrictor in the service. If a flow-restrictor is installed, the violator pays the cost of the installation and removal. Any willful violation occurring subsequent to the issuance of the second written warning constitutes a misdemeanor and may be referred to the Santa Barbara County District Attorney's office for prosecution. If water service is disconnected, it will be restored only upon payment of the turn-on charge fixed by the Board of Directors.
Consumption Reduction Methods
Goleta Water District – Dec. 2005 (corrected) 36 Final Urban Water Management Plan
Table 24 provides examples of consumption reduction methods and the stage when the method becomes effective.
TABLE 24 CONSUMPTION REDUCTION METHODS
Examples of Consumption Reduction Methods Stage When Method Takes Effect Demand reduction program All Stages Restrict for only priority uses All Stages Use prohibitions All Stages Water shortage pricing All Stages Incentives to reduce water consumption All Stages Education program All Stages Voluntary rationing Stage 1 Restrict new service connections Stages II, III, IV Plumbing fixture replacement Stages II, III, IV Mandatory rationing Stages II, III, IV Percentage reduction by customer type Stages II, III, IV Reduce pressure in water lines Stages III, IV Per capita allotment by customer type Stages III, IV Flow restriction Stages II, III, IV
10.5 ANALYSIS OF REVENUE IMPACTS OF REDUCED SALES DURING SHORTAGES
When consumption reduction methods are implemented during Stages I, II, III and IV the District will implement an accompanying rate change (see Table 25). The rate adjustment would be implemented in such a manner that users who achieve the called for reduction would not have increased water bills. This temporary rate adjustment, combined with possible use of District reserves, would mitigate the financial impact of reduced sales and revenues. In addition, the rate adjustment would send a “price signal” to water users during water shortage conditions. Water costs would not increase for water users that achieve the called for reductions.
TABLE 25Mitigation Plan for reduced Revenue
Reduction in Sales % Rate Increase % normal revenueStage 1 15% None 98%Stage 2 25% 15% 95%Stage 3 35% 20% 92%Stage 4 50% 43% 90%
Table 26 shows how operating expenses are expected to change by Stage.
TABLE 26Expected Change in Operating Expense by Rationing Stage
Goleta Water District – Dec. 2005 (corrected) 37 Final Urban Water Management Plan
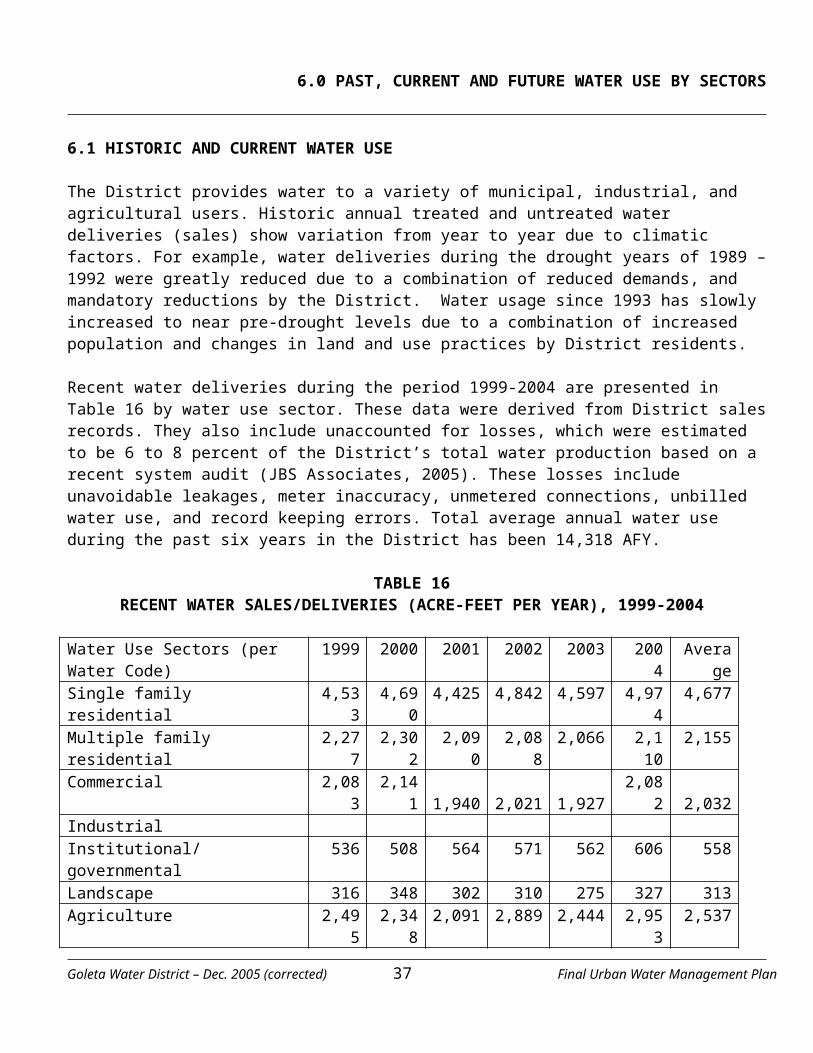
Operating Expenses Normal Stage 1 Stage 2 Stage 3 Stage 4overhead expense $647,000 $647,000 $647,000 $647,000 $647,000 source of supply $11,141,200 $10,684,640 $10,762,784 $10,601,375 $10,355,768 product. & purification $2,200,000 $1,874,745 $1,250,590 $799,089 $516,888 trans. & distribution $2,500,000 $2,500,000 $2,500,000 $2,500,000 $2,500,000 customer accounts expense $800,000 $900,000 $950,000 $1,000,000 $1,000,000 general & admin. expense $3,000,000 $3,090,000 $3,090,000 $3,090,000 $3,090,000 Conservation $175,000 $500,000 $900,000 $900,000 $900,000 depreciation $3,900,000 $3,900,000 $3,900,000 $3,900,000 $3,900,000 capital projects $1,000,000 $750,000 $0 $0 $0
Total Operating expense $25,363,200 $24,846,385 $24,000,373 $23,437,464 $22,909,656
10.6 WATER SHORTAGE CONTINGENCY ORDINANCE/RESOLUTION
The District issued a moratorium on new service connections in 1972 due to inadequate water supplies to serve a large amount of new development. The moratorium remained in effect until 1997. Between 1979 and 1992, the District instituted a number of water use restrictions. In 1989, the District declared a drought emergency and a water-rationing program was put in place until February 1992. The District adopted Ordinance 90-2 in 1990, which established water shortage emergency regulations. Ordinance 902 was superseded by Ordinance 91-3 in 1991. Based on these past experiences, the District may adopt similar ordinances in the future should another water shortage emergency arise.
10.7 USE MONITORING
Under normal water supply conditions, potable water production figures are recorded daily. The District includes monthly water production totals as part of their monthly report to the State Department of Health Services. During a drought or water shortage emergency, to ensure that reduction goals are being met.
Goleta Water District – Dec. 2005 (corrected) 38 Final Urban Water Management Plan
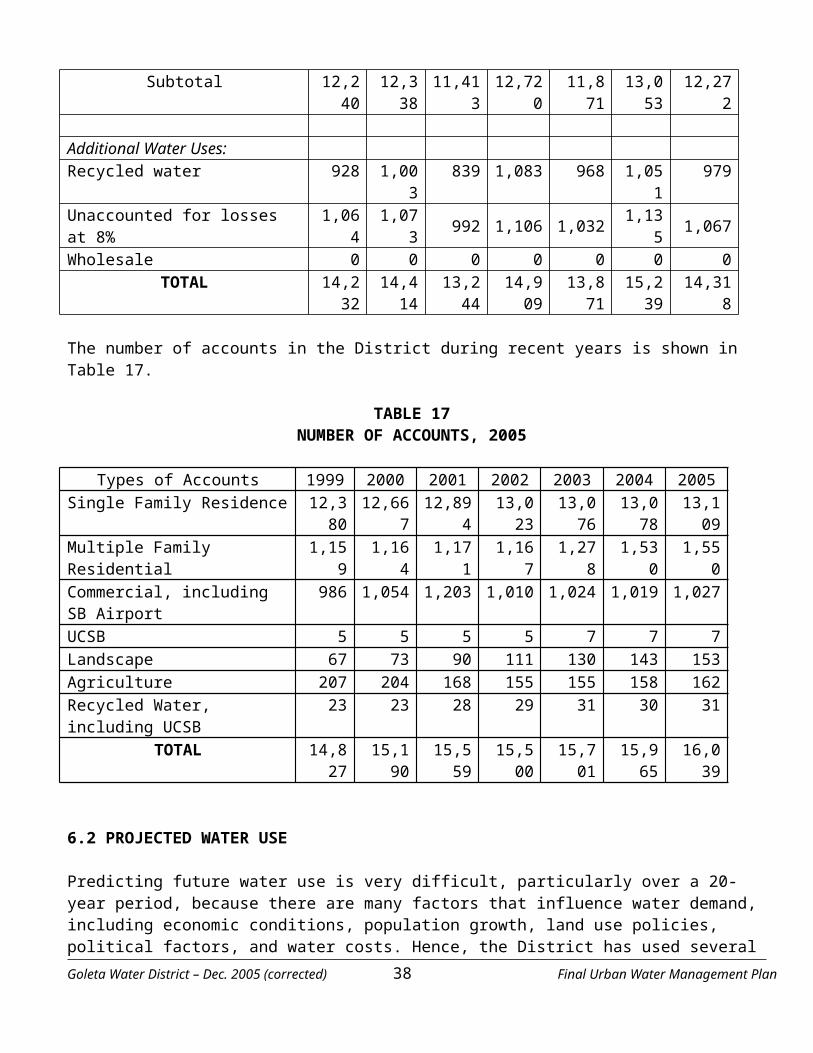
11.0 RECYCLED WATER PLAN
The District, working in partnership with the Goleta Sanitary District (GSD) completed a recycled water project study in 1999. This study built upon prior studies and investigations of the Goleta reclamation system to assess existing reclamation treatment and distribution system facilities and to further the means of enhancing the reclamation program. Such enhancements may include additional recycled water markets, recycled water demand management, (time of use management) increased and diversified supply sources and infrastructure improvements.
11.1 RECYCLED SYSTEM DESCRIPTION
Recycled water service within Goleta began in 1994 in response to the drought conditions of the early 1990s and the Wright suit settlement. The existing reclamation system includes a wastewater treatment plant (WWTP) owned and operated by GSD. This treatment plant can produce up to 3 million gallons per day (mgd) of tertiary effluent for recycling. The WWTP is permitted to treat an average annual influent flow rate of 7.64 mgd, although the plant is constructed to handle a peak dry weather flow of 9.7 mgd. Major treatment processes at the plant include primary sedimentation, secondary treatment by a trickling filter/solids contact process, secondary sedimentation, plant effluent chlorination/dechlorination, and tertiary filtration for water reclamation.
A portion of the WWTP's secondary effluent is directed to the tertiary treatment process for filtration and subsequent reuse. The remaining treated effluent is discharged to the Pacific Ocean through an ocean outfall. Tertiary effluent from the plant enters a 3.4 million gallon storage reservoir. From the reservoir, a 500 horsepower pump station delivers the water to the recycled water distribution system. A second booster pump station delivers water to a higher-pressure zone that extends to the west of the reclamation system, that is, west of Glen Annie Road. Approximately 40,000 feet of pipeline ranging in diameter from 2 to 18 inches deliver water to 16 existing customers.
TABLE 27WASTEWATER COLLECTED AND TREATED (AFY), CURRENT AND PROJECTED
Type of Wastewater 2000 2005 2010 2015 2020 2025 2030Wastewater collected & treated in service area 6,273 5,825 6,861 7,211 7,578 7,965 8,371
Volume that meets recycled water standard 1,500 1,500 1,500 1,500 1,500 1,500 1,500
TABLE 28DISPOSAL OF WASTEWATER
Method of disposal
Treatment Level 2005 2010 2015 2020 2025 2030
Ocean outfall Blended Secondary 4,841 5,656
Ocean outfall Full Secondary 5,901 6,078 6,465 6,871
TOTAL 4,841 5,656 5,901 6,078 6,465 6,871
Goleta Water District – Dec. 2005 (corrected) 39 Final Urban Water Management Plan
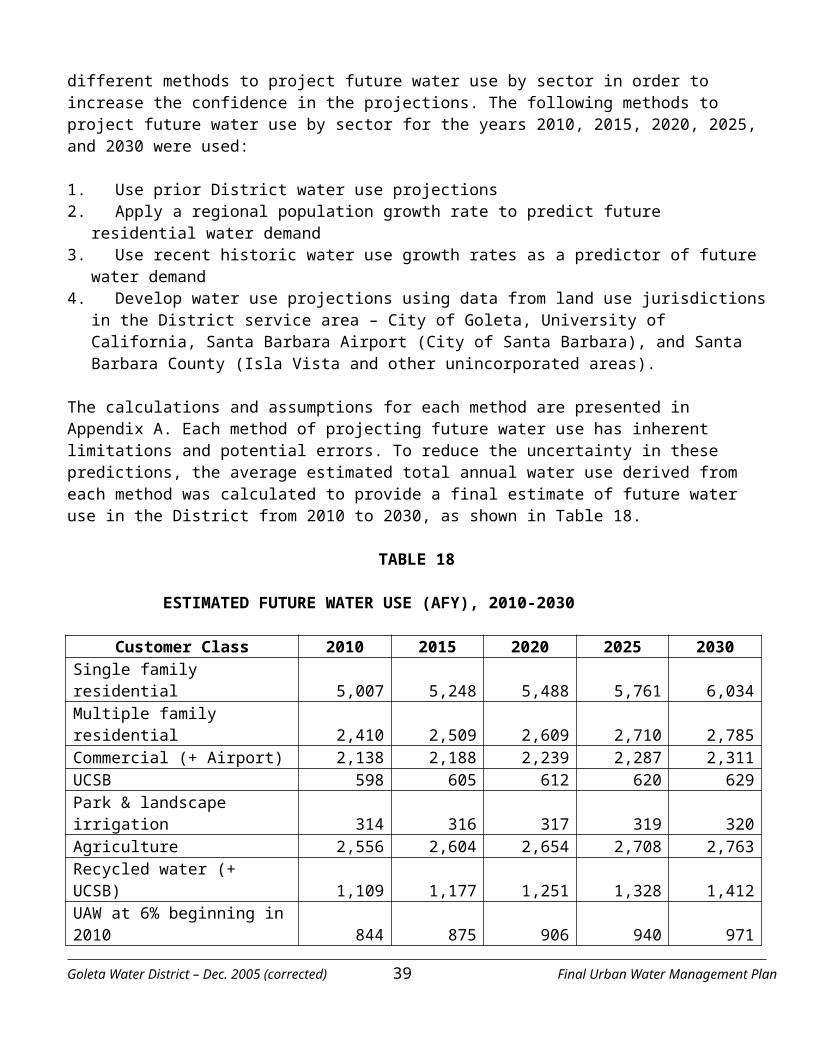
TABLE 29RECYCLED WATER USES – ACTUAL AND POTENTIAL
User type Treatment Level 2005 2010 2015 2020 2025 2030
Agriculture Tertiary Landscape Tertiary 980 1,200 1,300 1,490 1,490 1,490 Wildlife Habitat Tertiary Wetlands Tertiary Industrial Tertiary Groundwater Recharge Tertiary Toilet Flushing Tertiary 5 5 10 10 10 10
TOTAL 985 1,205 1,310 1,500 1,500 1,500
TABLE 30PROJECTED FUTURE USE OF RECYCLED WATER IN THE SERVICE AREA
2010 2015 2020 2025 2030Projected use of Recycled Water 1,205 1,310 1,500 1,500 1,500
11.2 ENCOURAGING RECYCLED WATER USE
The District currently serves recycled water to 19 customers with a total existing reclaimed water demand of about 1,000 AFY. A survey of potential recycled water markets was conducted between April and July 1999. This survey identified twenty-eight potential customers within the current recycled water system boundaries, many of which are now under contract to receive recycled water. The potential markets consist of 136 irrigated acres with an estimated annual water use of 280 AFY. The market survey addressed the potential for providing recycled water service to golf courses; landscaped areas, agricultural areas, and commercial use. To further benefit users of the recycled water supply a financial incentive exists for those customers from a rate price reduction that is 20% below the landscape rate and 40% below the residential and commercial rates. In turn, the district’s encouragement of the use of more recycled water, by additional customers, increases the District’s system reliability during water shortages.
TABLE 31METHODS TO ENCOURAGE RECYCLED WATER USE
Actions AF of use projected to result from this action2010 2015 2020 2025 2030
Financial incentives Improve quality Require for new/existing commercial landscaping & interior non-potable 220 325 515 515 515
Total 220 325 515 515 515
Golf Course Landscape Irrigation
Goleta Water District – Dec. 2005 (corrected) 40 Final Urban Water Management Plan
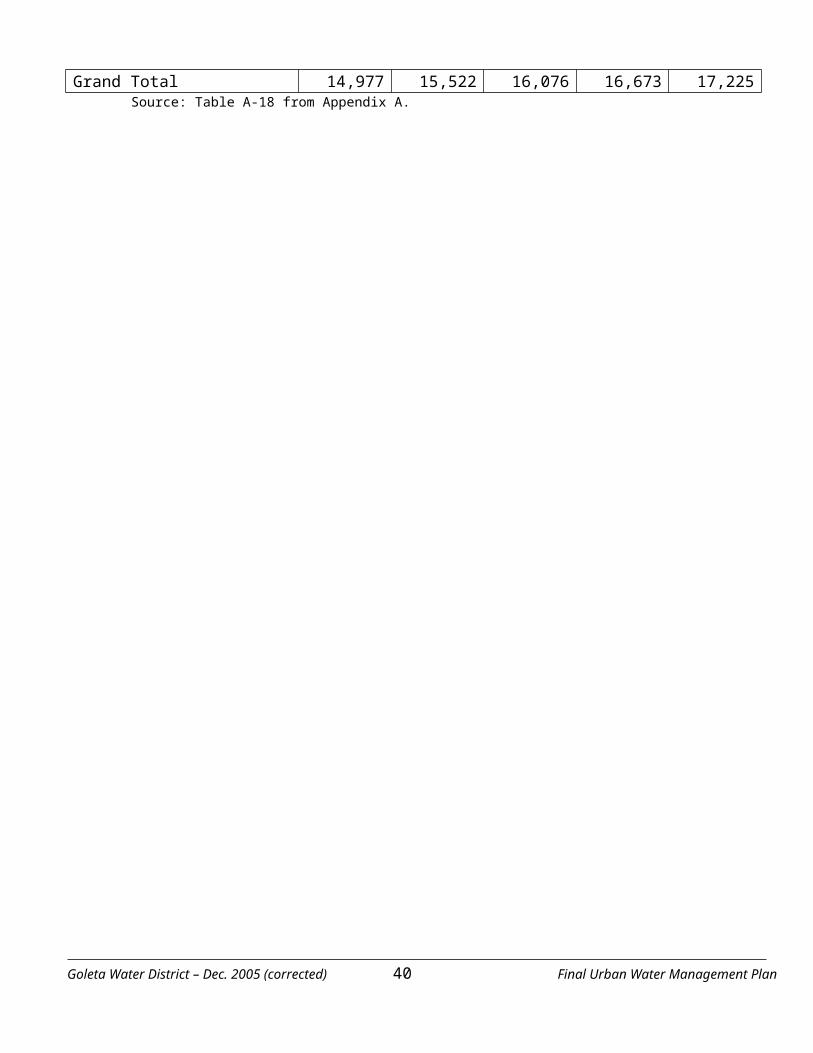
The District provides service to, or is under contract to provide service to, four golf courses within the reclamation program study area. One additional golf course (Twin Lakes) occurs within the study area that could be served by the District. The property is owned by the City of Santa Barbara.
Landscape Irrigation
Twenty-seven potential landscape irrigation markets were identified within the 1999 study area. Landscape irrigation represents the largest market for recycled water, including such uses as the irrigation of parks, playgrounds, landscaped areas along freeways, green belts, schools, open spaces, and for irrigated landscaped cut and fill slopes. Since the 1999 study, seven additional users are now receiving recycled water. Major public open space and parks that are candidates for future recycled water include:
← Camino Corto County Open Space – County of Santa Barbara ← Lake Los Carneros - City of Goleta ← Highway 101 landscaping at Winchester Canyon Rd. - Caltrans ← Santa Barbara Airport landscaping – City of Santa Barbara ← Evergreen Open Space – County of Santa Barbara ←Agriculture
There currently exists a large agricultural market throughout the study area, for which a portion could potentially utilize recycled water. Previous studies identified agricultural markets located near the San Pedro Canyon, Carneros Canyon, and Glen Annie Canyon areas with a reported acreage of 1,497. Currently, agricultural markets generally use raw and/or potable water as their water source. A source of recycled water for irrigation supply would offer the advantage of providing a dependable supply of water to the growers in the area, even during extended periods of drought.
While there is a high agricultural water use in the District, there are obstacles to converting to recycled water for irrigation. The first challenge is that the use of recycled water in fields and orchards where workers could be exposed must comply with applicable water quality and public health regulations. The second obstacle is that many crops are sensitive to the high concentration of dissolved minerals in recycled water. For example, for avocado growers, it would be necessary to irrigate their crops with a combination of recycled and potable water, or to provide periodic flushing with potable water to leach salts that may cause leaf burn.
There are three critical constituent concentration levels in recycled water that determine the ability of agriculture crops to utilize recycled water. These are total dissolved solids (TDS), boron, and percent sodium. For golf course and landscape irrigation, the TDS content is the most critical parameter in determining the suitability of recycled water for irrigation. High TDS content may limit its usefulness significantly for irrigation use. For example, avocado and citrus trees are not tolerant of high concentrations of TDS and routine use may reduce the production yield of these crops.
Conversations with the County of Santa Barbara Agricultural Department indicate that the agricultural community in and around the Goleta Valley consists predominately of avocado and citrus groves, with moderate ornamental flower growers and vegetable production. Avocados are extremely sensitive to TDS concentration, requiring limits below 800 mg/L. The WWTP currently does not provide the quality of recycled water required for avocado grove irrigation (average TDS levels of 1250 mg/L), and would require enhanced treatment such as reverse osmosis in order for this market to be a feasible user. Citrus production is not as sensitive to TDS concentrations as avocado groves, however the water quality for use in this market is
Goleta Water District – Dec. 2005 (corrected) 41 Final Urban Water Management Plan
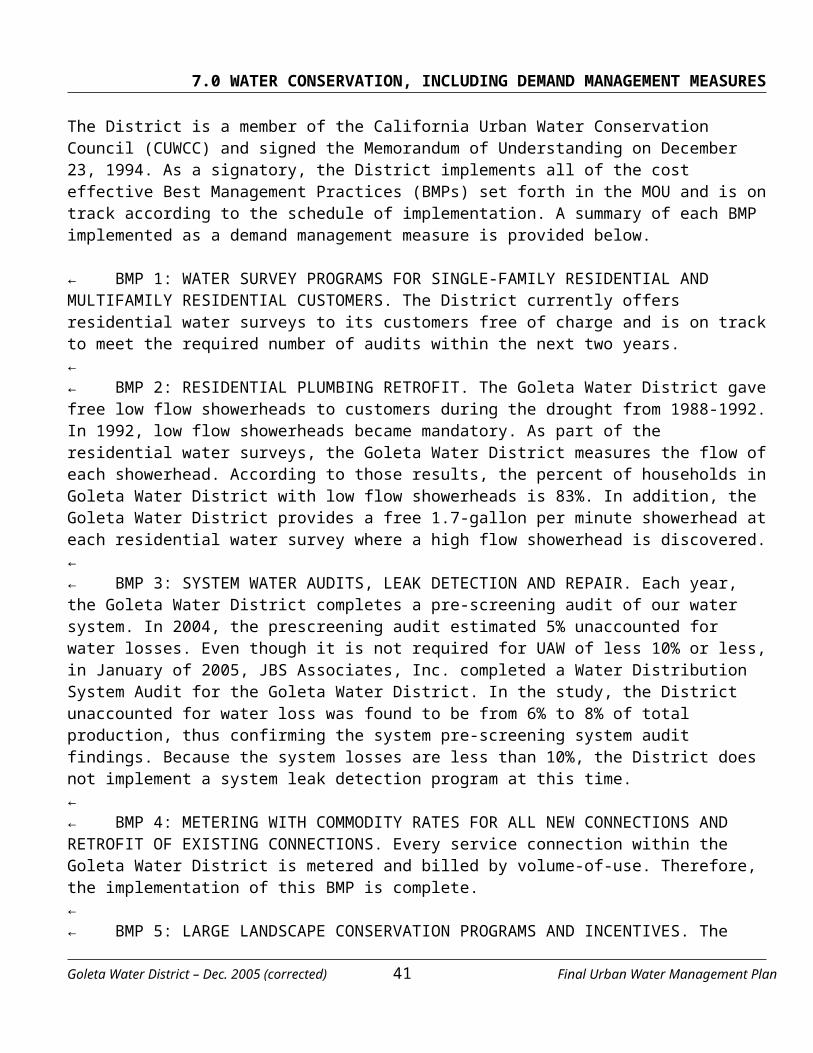
questionable at the present time. As a result, these markets have been not been included in the listing of potential customers at this time.
Current Uses versus Prior Projections
Recycled water use has remained relatively constant (about 1,000A AFY) since 2000. In the District’s 2001 UWMP, recycled water use was projected to increase to about 1,390 AFY by 2005 based on deliveries to customers with existing contracts for recycled water deliveries. The recycled water deliveries in 2004 were 1,051 AF and are projected to be the same in 2005. The reason that recycled water deliveries has not increased as predicted in 2001 is that not all customers who have contracted for recycled water have started taking it.
The District estimates future recycled water use to increase over time as shown below in Table 26. The District believes that recycled water production will not likely increase over 1,500 AFY by 2030 due to limits in the available market and the high cost of increasing treatment capacity.
Goleta Water District – Dec. 2005 (corrected) 42 Final Urban Water Management Plan
12.0 WATER QUALITY IMPACTS ON RELIABILITY
12.1 SURFACE WATER
The District's Corona del Mar WTP processes raw surface water from Lake Cachuma. The raw water contains microbiological and particulate matter that does not meet federal and state primary and secondary drinking water regulations. The treatment plant is required by these regulations to remove these substances via coagulation, sedimentation, filtration and disinfection via chlorination. Chlorination provides a disinfectant residual that is required by federal and state regulations and helps maintain a safe drinking water supply throughout the distribution system. This multi-barrier treatment process has proven sufficient to meet federal and state primary and secondary drinking water regulations. Future upgrades will enable the treatment plant to more effectively reduce the amount of particulate matter in the water and thus continue to meet state and federal regulations in the future, as well as insure an adequate supply of quality water to the public. Hence, the quality of water from the Cachuma Project and the SWP water conveyed through Cachuma Lake is not considered an impediment to water supply reliability.
12.2 GROUNDWATER
The District's wells extract water from the Central Sub-Basin and the East Sub-Basin. The basin water contains iron, manganese and hydrogen sulfide that do not meet federal and state secondary drinking water regulations. The wells are required by these regulations to remove these dissolved substances by utilizing filtration and oxidation via chlorination. Chlorination also provides a disinfectant residual that is required by federal and state regulations and helps maintain a safe drinking water supply throughout the distribution system. This treatment process has proven sufficient to meet federal and state primary and secondary drinking water regulations. Future upgrades will activate more wells to active status and enable the wells to buttress the water supply. Hence, the quality of groundwater is not considered an impediment to water supply reliability.
Goleta Water District – Dec. 2005 (corrected) 43 Final Urban Water Management Plan
13.0 WATER SERVICE RELIABILITY
The reliability of the District’s water service during a normal year, a critically dry year, and a series of dry years are evaluated below. The available water supply during each of these scenarios is compared to the anticipated demand to identify potential shortages in deliveries. This analysis was conducted for the years 2010, 2015, 2020, 2025, and 2030.
13.1 NORMAL YEAR RELIABILITY
Under a normal year over the period 2005-2030, the District estimates that it will have sufficient supplies to meet demands. The District’s available supply is 17,672 AFY, as described in Section 3.0. The normal year demands over the next 25 years will not exceed this amount, as shown in Table 27.
TABLE 32NORMAL YEAR SUPPLY AND DEMAND (AFY)
Current 2010 2015 2020 2025 2030 Supply (total available)* [Table 8] 17,672 17,672 17,672 17,672 17,672 17,672 % of Normal Year Supply 100 100 100 100 100 100
Demand [Table 18] 14,318 14,977 15,522 16,076 16,673 17,225 % of Normal Year Demand 100 105% 108% 112% 116% 120%
Surplus** 3,354 2,695 2,150 1,596 999 447
Surplus as % of supply 19% 15% 12% 9% 6% 3%Surplus as % of demand 23% 18% 14% 10% 6% 3%
* Total available water supplies are shown, but the District will only produce the amount necessary to meet demand. ** The surplus represents the amount of water that the District would not need to produce, which in most instances would be groundwater.
13.2 CRITICALLY DRY YEAR RELIABILITY
The critically dry year supply and demand quantities are shown in Table 28. Water supplies in a critically dry year will meet normal year demands until the year 2020. In that year, and years after, the District will implement demand reduction measures to reduce demands to meet the available supplies in a critically dry year. The maximum demand reduction would be 9% in one year to meet a water supply shortage. If the District increases its groundwater pumping capacity by the year 2020, the predicted shortages may be avoided by producing groundwater at more than the soon-to-be maximum rate of 5,600 AFY, utilizing the District’s annual legal entitlement and banked groundwater.
TABLE 33CRITICALLY DRY YEAR SUPPLY AND DEMAND (AFY)
2010 2015 2020 2025 2030 Available Supply [includes banked groundwater]* [Table 13]
16,980 16,980 16,980 16,980 16,980
Goleta Water District – Dec. 2005 (corrected) 44 Final Urban Water Management Plan
% of Normal Year Supply 96% 96% 96% 96% 96%
Demand** [Table 18] 14,977 15,522 16,076 16,673 17,225 % of Normal Year Demand 105% 108% 112% 116% 120%
Shortage (Supply Minus Demand) 2,003 1,458 904 307 -245
Shortage as % of dry year supply 12% 9% 5% 2% -1%Shortage as % of normal year demand 13% 9% 6% 2% -1%
* Supply includes use of the District’s annual groundwater entitlement (2,350 AFY) plus banked groundwater up to the District’s 5,600 AFY pumping capacity.**Assumes that demand will be reduced in 2020, 2025, and 2030 through voluntary demand reduction measures to meet available supplies.
13.3 MULTIPLE DRY YEAR RELIABILITY
For this analysis, the District used the water supply estimates for the six-year dry period shown in Table 13. The total annual water supply available to the District during each of those dry years ranged from 15,784 AF to 20,921 AF. Water from the SWP and Cachuma Project are greatly reduced and highly variable during this period. However, the District would be able to maximize production in these years by producing groundwater at up to 5,600 AFY.
For the multiple dry year analysis, the District assumed six year dry periods that would end in 2010, 2015, 2020, 2025, or 2030. The estimated future demand in those years was used based on the demand projections in Table 18. Demand is greater in dry year periods at the later years compared to the earlier years.
The multiple dry year supply and demand estimates are shown in Table 29. The District estimates that it will have sufficient supplies to meet the annual demands in a 6-year dry period that occurs during the years 2005-2030. The District does not anticipate any reduction in water deliveries during a six consecutive dry years because the District can utilize banked groundwater (which is now over 35,000 AF) to make up any shortages in surface supplies.
TABLE 34 Projected Supply and Demand Comparison during multiple dry year period ending in 2010 - AF Year
2006 2007 2008 2009 2010 Supply 17,572 15,691 16,666 16,841 15,711
% of projected normal 99% 89% 94% 95% 89% Demand 15,320 15,320 15,320 15,320 15,320
% of projected normal 107% 107% 107% 107% 107%
2006 2007 2008 2009 2010 Supply totals 17,572 15,691 16,666 16,841 15,711 Demand totals 15,320 15,320 15,320 15,320 15,320 Difference 2,252 371 1,346 1,521 391 Difference as % of Supply 13% 2% 8% 9% 2% Difference as % of Demand 15% 2% 9% 10% 3%
TABLE 35 Projected Supply and Demand Comparison during multiple dry year period ending in 2015 - AF Year
Goleta Water District – Dec. 2005 (corrected) 45 Final Urban Water Management Plan
2011 2012 2013 2014 2015 Supply 17,572 18,236 19,006 18,476 16,641
% of projected normal 99% 103% 108% 105% 94% Demand 16,025 16,025 16,025 16,025 16,025
% of projected normal 107% 107% 107% 107% 107%
2011 2012 2013 2014 2015 Supply totals 17,572 18,236 19,006 18,476 16,641 Demand totals 16,025 16,025 16,025 16,025 16,025 Difference 1,547 2,211 2,981 2,451 616 Difference as % of Supply 9% 12% 16% 13% 4% Difference as % of Demand 10% 14% 19% 15% 4%
TABLE 36 Projected Supply and Demand Comparison during multiple dry year period ending in 2020 - AF Year
2016 2017 2018 2019 2020 Supply 17,572 17,652 18,588 17,474 15,055
% of projected normal 99% 100% 105% 99% 85% Demand 16,609 16,609 16,609 16,609 16,609
% of projected normal 107% 107% 107% 107% 107%
2016 2017 2018 2019 2020 Supply totals 17,572 17,652 18,588 17,474 15,055 Demand totals 16,609 16,609 16,609 16,609 16,609 Difference 963 1,043 1,980 866 (1,554) Difference as % of Supply 5% 6% 11% 5% -10% Difference as % of Demand 6% 6% 12% 5% -9%
TABLE 37 Projected Supply and Demand Comparison during multiple dry year period ending in 2025 - AF Year
2021 2022 2023 2024 2025 Supply 17,572 17,060 17,404 15,698 12,687
% of projected normal 99% 97% 98% 89% 72% Demand 17,201 17,201 17,201 17,201 17,201
% of projected normal 107% 107% 107% 107% 107%
2021 2022 2023 2024 2025 Supply totals 17,572 17,060 17,404 15,698 12,687 Demand totals 17,201 17,201 17,201 17,201 17,201 Difference 371 (141) 203 (1,503) (4,515) Difference as % of Supply 2% -1% 1% -10% -36% Difference as % of Demand 2% -1% 1% -9% -26%
Goleta Water District – Dec. 2005 (corrected) 46 Final Urban Water Management Plan
14.0 AGENCY COORDINATION
The District’s consultant preparing this plan met with the staffs of the following agencies during the preparation of the Plan: City of Goleta, University of California, Santa Barbara Airport (City of Santa Barbara), and Santa Barbara County Planning & Development. The District submitted the draft UWMP to these same agencies, as well as to other agencies and parties listed in Table 30 for review and comment.
TABLE 30 SUMMARY OF AGENCY COORDINATION
Participated in
Developing Plan
Commented on Draft Plan
Attended Public
Meeting
Contacted for
Assistance
Sent a Copy of
Draft Plan
Sent Notice of
Draft UWMP
Not Involved/
No Information
Other Local Water Suppliers and Water Management Agencies City of Santa Barbara X X X Montecito Water District
X
Carpinteria Valley Water District
X
Santa Ynez River WCD ID#1
X
Central Coast Water Authority
X X X
La Cumbre Mutual Water Company
X X X X
SB County Water Agency
X X X
Other Public Agencies City of Goleta X X X County of SB, Planning Dept.
X X X
Calif. Coastal Commission
X X
Univ. of California X X X X
Goleta Water District – Dec. 2005 (corrected) 47 Final Urban Water Management Plan
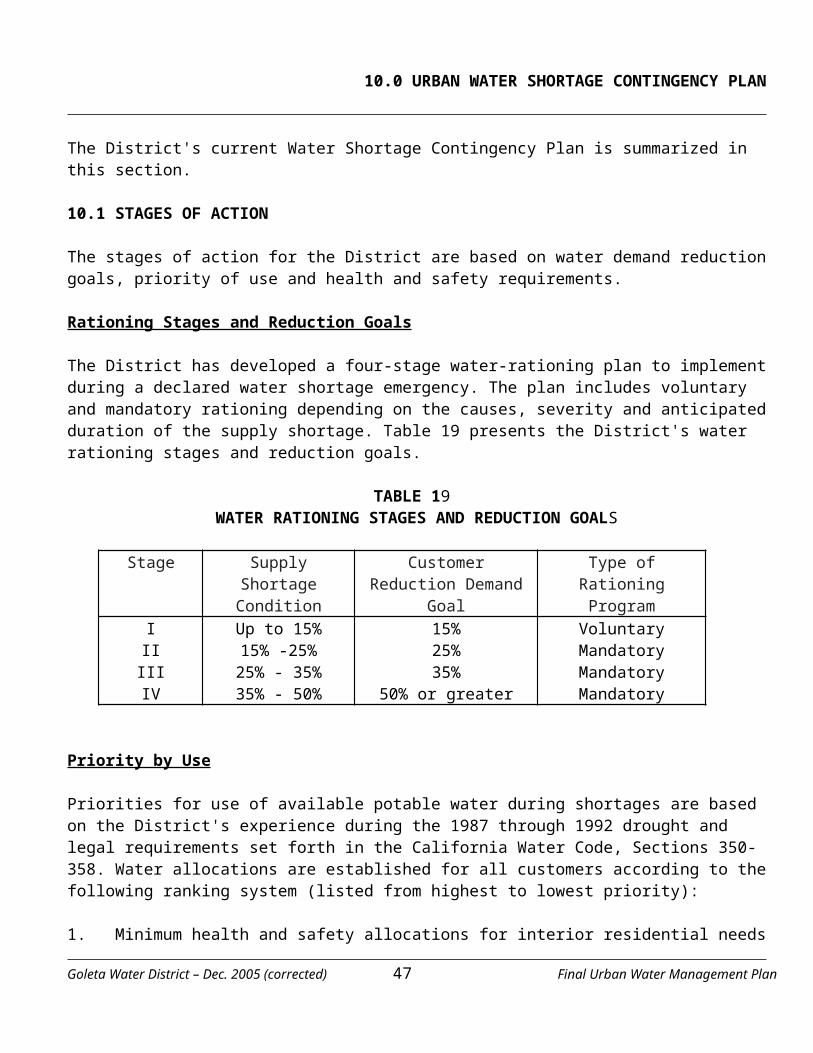
15.0 PUBLIC PARTICIPATION
It is the District's policy to encourage public participation when adopting plans such as the UWMP. Therefore, the District issued the Draft UWMP for public comment on November 12, 2005. The District conducted a public hearing on November 22, 2005 to receive verbal and written comments on the draft document (Appendix E). Notices for the public hearing were written to specifically encourage the involvement of social, cultural and economic community groups and were placed in the local newspaper and were posted at the District's offices and on its website (www.goletawater.com).
Copies of the Draft UWMP were distributed to the County of Santa Barbara, City of Goleta, Santa Barbara Airport, University of California, and other interested agencies and public entities. Written comments on the Draft UWMP were received until November 28, 2005. During this review period, the Draft UWMP was available at the District's offices during normal business hours and on the District’s website. Written comments were received from the following parties: University of California, Ms. Cecilia Brown, and the La Cumbre Mutual Water Company.
The District carefully considered the comments from the public meetings and written comment letters when preparing the Final UWMP. In some instances, the District has revised the plan in light of the comments, while in other instances the District determined that it was not necessary or appropriate to revise the plan in response to a comment.
Goleta Water District – Dec. 2005 (corrected) 48 Final Urban Water Management Plan
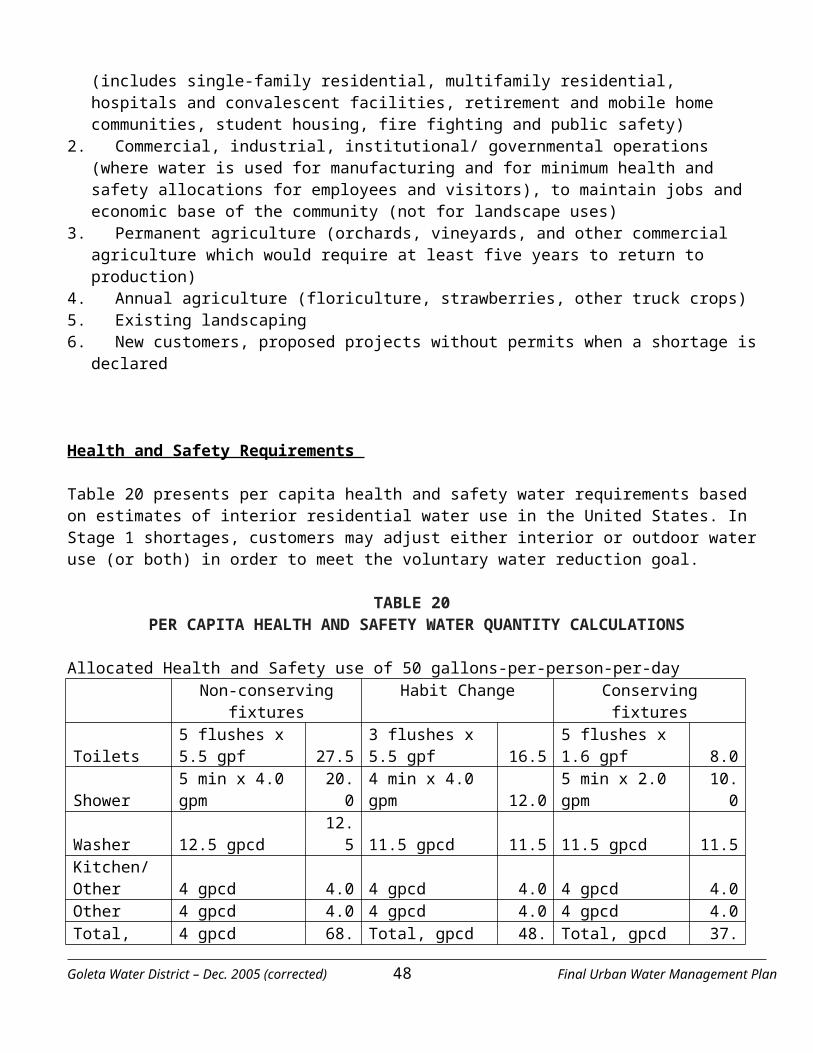
16.0 REFERENCES
Goleta Water District, 2001a. Water System Reliability and Rehabilitation Study. Camp Dresser McKee. Goleta Water District, 2001b. Urban Water Management Plan. Camp Dresser McKee. Goleta Water District, 2005a. Spreadsheet data on historic and current water production and sales. Goleta Water District, 2005b. Water Supply Assessment for the Isla Vista Master Plan. Kennedy Jenks
Consultants. JBS. Associates, 2005. Water Distribution System Audit. Goleta Water District. Santa Barbara County Association of Governments, 2002. Regional Growth Forecast. Toups Corporation, 1974. Water Resources Management Study: South Coast – Santa Barbara County, report
prepared for the ad hoc committee on water supply. Santa Ana, California, Toups Corporation, 219 p. U.S. Geological Survey, 1986. Ground Water Monitoring at Santa Barbara, California: Phase
3Development of a Three-Dimensional Digital Ground-Water Flow. By Peter Martin and Charles Berenbrock. USGS Water-Resources Investigations Report 86-4103, 58 pages.
Goleta Water District – Dec. 2005 (corrected) 49 Final Urban Water Management Plan
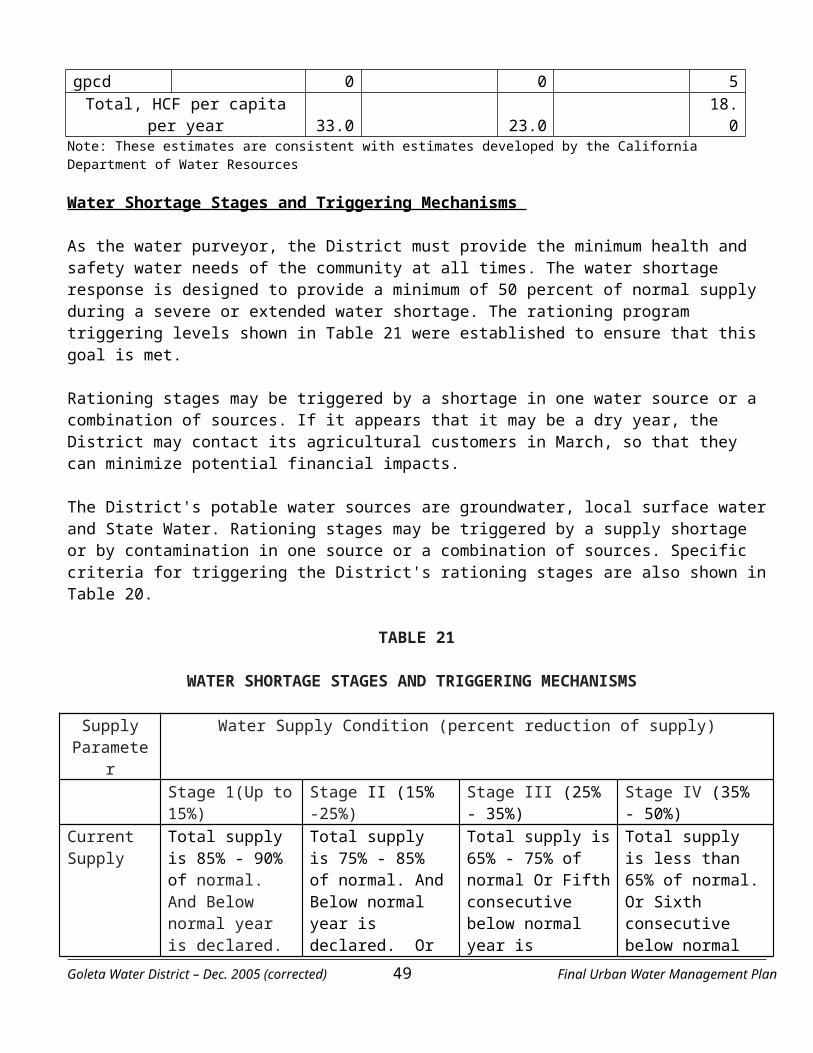
APPENDIX A WATER DEMAND PROJECTIONS
GOLETA WATER DISTRICT – URBAN WATER MANAGEMENT PLAN
Predicting future water use is very difficult, particularly over a 20-year period, because there are many factors that influence water demand, including economic conditions, population growth, land use policies and political factors, and water costs. Hence, the Goleta Water District (District) used several different methods to project future water use by sector in order to increase the confidence in the projections. The following methods to estimate future water use by sector for the years 2010, 2015, 2020, 2025, and 2030 were used in support of the Urban Water Management Plan (UWMP):
1 Use prior District water use projections 2 Apply a regional population growth rate to predict future residential water demand 3 Use recent historic water use growth rates as a predictor of future water demand 4 Develop water use projections using data from land use jurisdictions in the District service area –
City of Goleta, University of California, Santa Barbara Airport (City of Santa Barbara), and Santa Barbara County (Isla Vista and other unincorporated areas).
In accordance with the provisions of the SAFE Ordinance (Appendix B), the District releases only one percent of its total potable water supply annually for new connections. The future water demand projections in Tables A-1 through A-4 are within this one percent limitation. These methods and the resulting future water demand projections are described below.
1.0 USE OF PRIOR PROJECTIONS In 2001, the District completed its System Reliability and Rehabilitation Study (Camp, Dresser & McKee, 2001). The study included projections of total water demand from 2000 to 2020, with the assumption of full build out at the end of the planning horizon, which was 2025. Vacant lands in the District service area were identified along with their current zoning. It was assumed that these parcels would be fully developed by the year 2020 based on their current zoning. CDM (2001) applied water duty factors (gallons per acre per year) for each land use category (i.e., residential, commercial, etc) based on historic water uses in the District. The increased total demand in the District at year 2020 was estimated to be 2,618 AFY.
The water demand projections in the System Reliability and Rehabilitation Study (CDM, 2001) were presented in the Isla Vista Master Plan Water Supply Assessment prepared by the District in March 2005, and updated in November 2005. These projections are shown in Table A-1.
TABLE A-1 PROJECTED WATER DEMAND BY SECTOR (AFY) FROM THE ISLA VISTA MASTER
PLAN WATER SUPPLY ASSESSMENT
Customer Type 2005 2010 2015 2020 2025Single-Family Residential 4,968 5,269 5,570 5,872 6,173 Multi-Family Residential 2,505 2,657 2,809 2,961 3,113 Commercial/Industrial 2,162 2,189 2,216 2,243 2,271 University of California 465 470 475 480 486 Recreation (parks & landscaping) 312 318 324 330 336 Agricultural 2,412 2,444 2,476 2,508 2,539 Recycled 1,100 1,200 1,300 1,400 1,500
TOTAL 13,924 14,547 15,170 15,794 16,418
Goleta Water District – Dec. 2005 (corrected) 50 Final Urban Water Management Plan
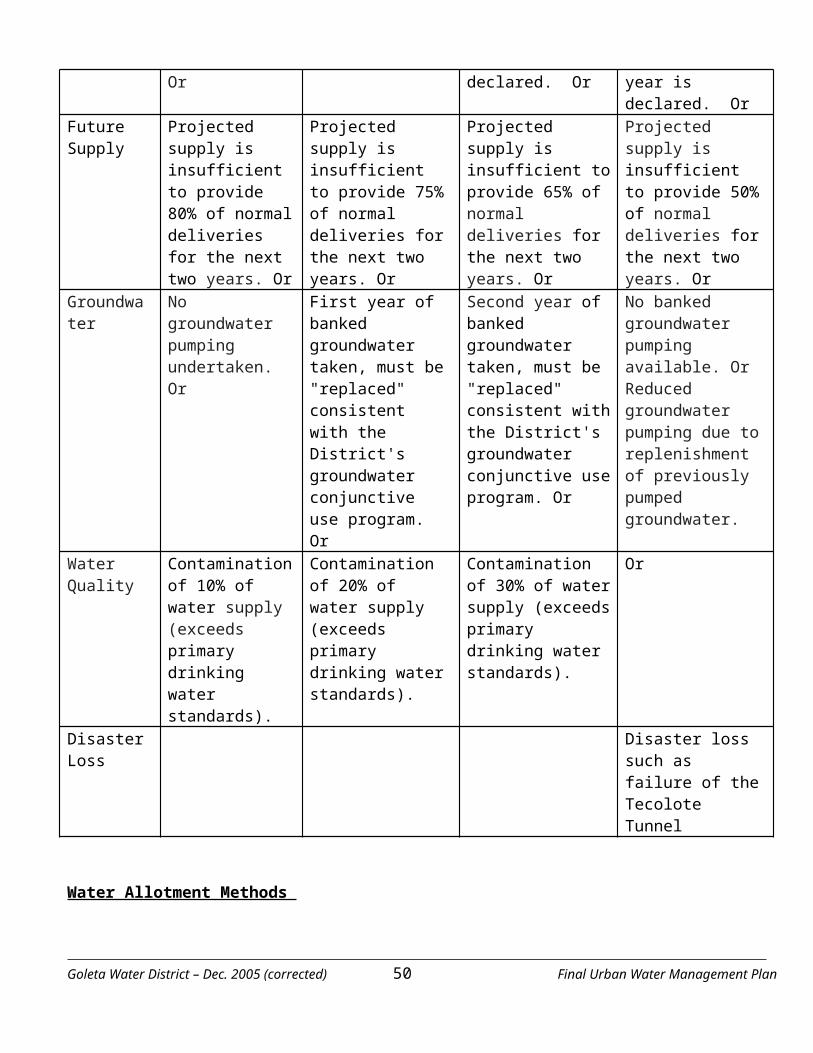
Source: Isla Vista Master Plan Water Supply Assessment CDM (2005).
2.0 PROJECTIONS USING REGIONAL POPULATION GROWTH The most recent Regional Growth Forecast by the Santa Barbara County Association of Governments (SBCAG) was completed in 2002. SBCAG estimated that the average annual population growth in the unincorporated portions of Santa Barbara County on the South Coast, and in the City of Goleta, would be 0.8 % during the period 2000 to 2030. During the past three decades (1970 – 2000), the average annual growth rate has varied from 0.6 to 1.7 %.
The 0.8 % regional growth rate was applied to current water use by: (1) residential (single and multiple family residential); (2) commercial/industrial (including the University of California): and (3) recycled water use sectors. It was assumed that there would be little, if any, increase in recreational water use (i.e., landscaping) and agricultural uses. Unaccounted for losses would be reduced from its current 8% to 6% due to anticipated future improvements in the District’s distribution and metering systems. Data on water use for the year 2005 are not available at this time. A more realistic estimate of “current” water demand was used in this analysis by taking the average water use (i.e., deliveries) during the period 1999-2004.
The current and projected water uses by sector to the year 2030 using the regional population growth rate method are presented in Table A-2.
TABLE A-2 PROJECTED WATER DEMAND BY SECTOR (AFY)
Water Use Type Current (avg. of 1999-2004)
2010 2015 2020 2025 2030
Single family 4,677 4,864 5,156 5,465 5,793 6,141 Multiple family 2,155 2,242 2,309 2,378 2,450 2,523 Commercial, including SB Airport
2,032 2,114 2,198 2,286 2,378 2,473
University of California (potable)
558 580 603 627 652 679
Agriculture 2,537 2,537 2,537 2,537 2,537 2,537 Recreation (park & landscape irrigation)
313 313 313 313 313 313
Recycled water, including UCSB
979 1,018 1,059 1,101 1,145 1,191
UAW (assume 6% beginning in 2010)
1,067 807 837 868 901 936
TOTAL 14,318 14,475 15,012 15,575 16,169 16,793 Based on SBCAG regional population growth rate.
3.0 PROJECTIONS USING RECENT WATER DEMAND TREND LINES Future water demand was also estimated using historic water use growth rates in the District service area. The results of this method are highly dependent on the period of record used to calculate the water use growth rate. For example, the average annual increase in water used during the period 1982 – 2004 was 0.15 %. Water use has very high in the 1980s prior to the drought. Water use was dramatically reduced during the drought and the subsequent years. A trend line to predict future water use based on this period of record is highly affected by these historic events, which probably mask an increase in population at the same Goleta Water District – Dec. 2005 (corrected) 51 Final Urban Water Management Plan
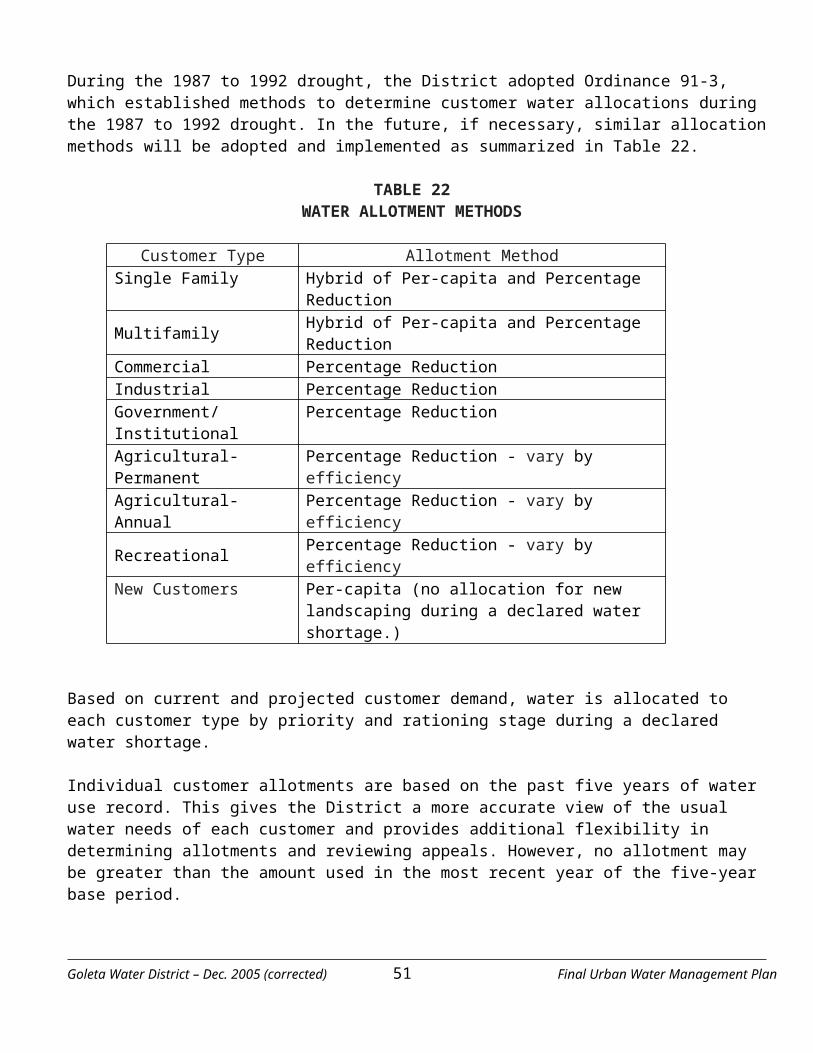
time. An alternative period of record is 1995-2004, which reflects a more typical pattern of water use several years after the drought has ended. The average annual increase in water use during this 10year period was 0.9%.
A more recent analysis of water use was conducted for the period of 1999-2004 for individual water use sector. The average annual increase in total water use was 1.2 % each year during this period, with the following average annual growth rates in water use for individual sectors: ← Single family residential = 1.2% ← Multiple family residential = ~0 ← Commercial/Industrial = ~0 ← University of California=0.3% ← Recreation =~0 ← Agriculture ~ 3.5 % ← Recycled water = 1.9%
Several of these growth rates are difficult to interpret. For example, the lack of increased water use in the multi-family residential sector is unusual because several new apartment and condominium projects were constructed in the District service area during the period 1999-2004. However, the flat water use in this sector may be due to water conservation by new and remodeled multi-family units. The District does not believe that water use for this sector would remain constant in the future.
The high growth rate in agricultural water use during 1999-2004 cannot be readily explained, and is probably due to many factors including change in crops or agricultural activities that require more water, possible expansion of existing agricultural lands after the drought, and possible increase in ancillary water uses on agricultural zoned parcels. The District does not believe that agricultural water use will increase over the next 20 – 25 years. New and expanded use of District water is subject to payment of the fee referred to by the District as the New Water Supply Charge. This fee is charged at a rate of $25,475 per acre foot of demand. For most District agricultural customers, the fee would likely make new or expanded agricultural uses of District water financially infeasible.
A projection of future water use by different sectors is presented in Table A-3 using the recently observed water use growth rates for single family residential (1.2%), the University of California (0.3%), and recycled water (1.9%). In addition, a 0.6% average annual water use growth rate was applied to the multifamily residential sector. It is assumed that the District will reduce unaccounted for losses to 6% over time.
TABLE A-3 PROJECTED WATER DEMAND BY SECTOR (AFY)
Water Use Type Current (avg. of 1999-2004)
2010 2015 2020 2025 2030
Single family 4,677 4,958 5,255 5,571 5,905 6,259 Multiple family 2,155 2,220 2,287 2,355 2,426 2,499 Commercial & Airport 2,032 2,032 2,032 2,032 2,032 2,032 UCSB 558 566 575 583 592 601 Landscape irrigationAgriculture 2,537 2,537 2,537 2,537 2,537 2,537 Recycled water, 979 1,072 1,173 1,285 1,407 1,541 UAW (6%) 1,067 806 830 855 881 909
Goleta Water District – Dec. 2005 (corrected) 52 Final Urban Water Management Plan
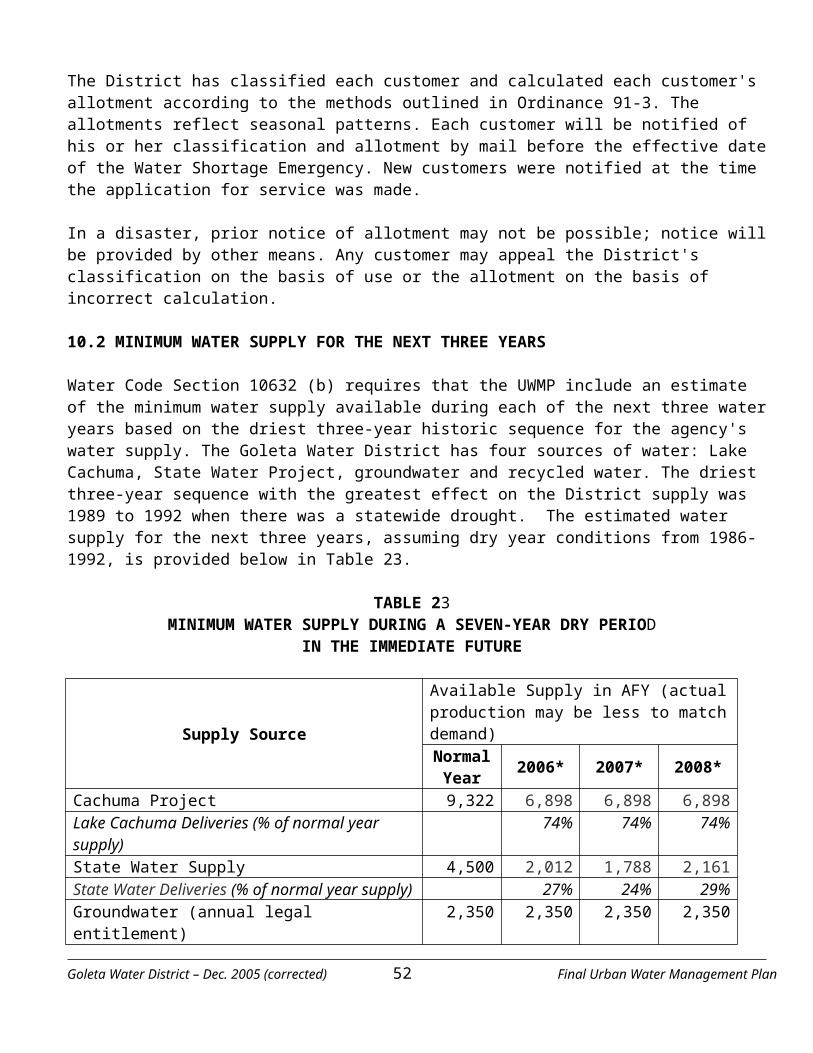
TOTAL 14,318 14,504 15,002 15,531 16,093 16,691 Based on recent increases in water use.
If agricultural water use were to increase each year, as observed over the period of 1999-2004, the total water use projections in Table A-3 would increase. For the sake of analysis, an annual water use growth rate of 1.5% was applied to agricultural water use, along with the growth rates in water use for non-agricultural water uses in Table A-3. The results are shown in Table A-4; the estimated total water demand in 2030 would increase from 16,691 AFY (in Table A-3) to 17,821 AFY.
TABLE A-4 PROJECTED WATER DEMAND BY SECTOR (AFY)
Water Use Type Current (avg.
of 1999-2004)2010 2015 2020 2025 2030
Single family 4,677 4,958 5,255 5,571 5,905 6,259 Multiple family 2,155 2,220 2,287 2,355 2,426 2,499 Commercial, including SB Airport
2,032 2,032 2,032 2,032 2,032 2,032
University of California (potable)
558 558 558 558 558 558
Landscape irrigation 313 313 313 313 313 313 Agriculture 2,537 2,727 2,931 3,151 3,388 3,642 Recycled water, including UCSB
979 1,072 1,173 1,285 1,407 1,541
UAW (assume 6% beginning in 2010)
1,067 818 854 892 933 977
TOTAL 14,318 14,698 15,403 16,157 16,962 17,821 Based on recent increases in water use with an assumed agricultural water use increase over time.
4.0 PROJECTIONS USING DATA FROM LOCAL JURISDICTIONS The final method of estimating future water use by sector involved gathering future water demand data from land use jurisdictions in the District service area – City of Goleta, University of California, Santa Barbara Airport (City of Santa Barbara), and Santa Barbara County (Isla Vista and other unincorporated areas). The data sources and assumptions from each jurisdiction are described below.
City of Goleta The City of Goleta is currently preparing a draft General Plan/Local Coastal Plan to be issued for public review and comment in early 2006, and adopted by the end of 2006. The General Plan will contain several land use alternatives with different zoning patterns and densities. At this time, the City has not presented a preferred alternative for public review. However, the City staff has provided the District with the following projections of full build out (at year 2025) for residential and commercial land uses to be used in this Plan (see Table A-5). These projections reflect the most current staff recommendations for the preferred General Plan land use alternatives, but should not be considered a formal representation of the City’s preferred alternative.
TABLE A-5 PROJECTED FULL BUILD OUT CONDITIONS IN THE CITY OF GOLETA
Land Use Current 2010 2015 2020 2025 (full 2030
Goleta Water District – Dec. 2005 (corrected) 53 Final Urban Water Management Plan
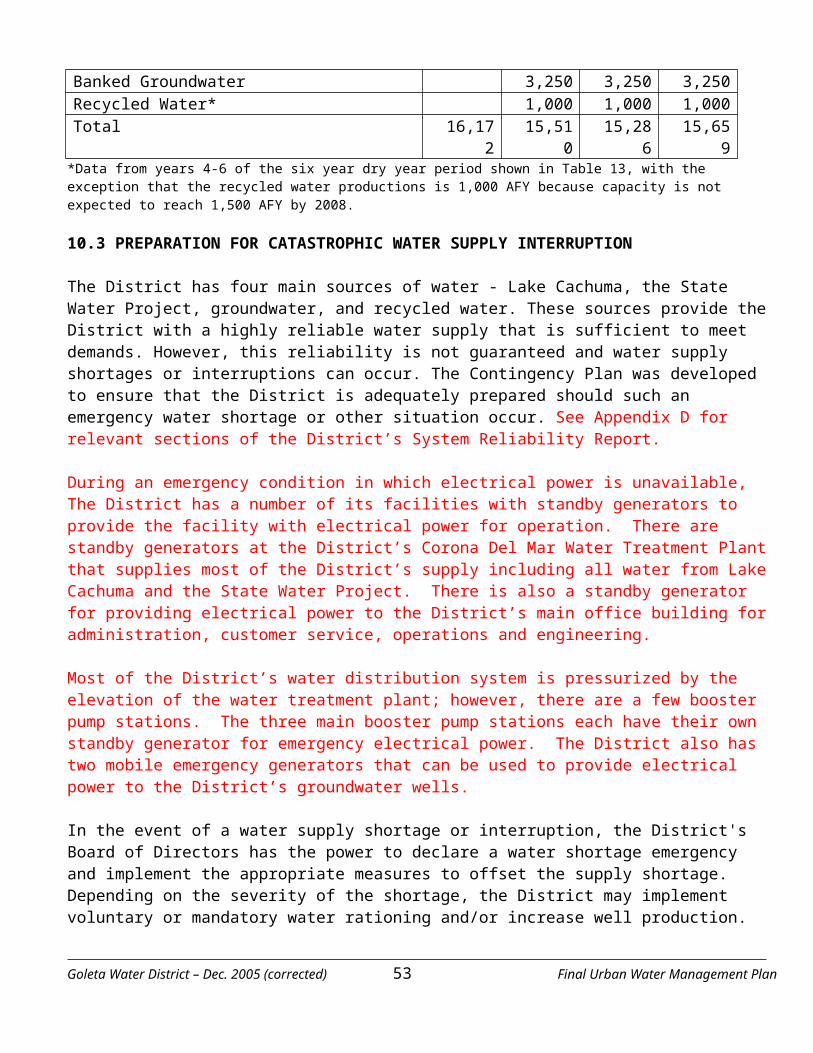
(2005) build out)SF 5,483 5,603
(+120) 5,723 (+120)
5,843 (+120)
5,963 (+120)
5,963 (assume 0)
MF 6,132 6,944 (+812)
7,756 (+812)
8,568 (+812)
9,382 (+814)
9,382 (assume 0)
Commercial (sq. ft.)
2,575,000 2,751,000 (+176,000)
2,927,000 (+176,000)
3,103,000 (+176,000)
3,279,000 (+176,000)
3,279,000 (assume 0)
Industrial (sq. ft.)
9,544,000 9,888,250 (+344,250)
10,232,500 (+344,250)
10,576,750 (+344,250)
10,921,000 (+344,250)
10,921,000 (assume 0)
Data from City of Goleta. Total estimated build out conditions are shown. Increases for each 5-year period are shown in italics. Goleta has not provided any projections beyond year 2025.
Based on the above land use projections, the existing and future water use in the City of Goleta was estimated in Table A-6:
TABLE A-6 PROJECTED FUTURE WATER USE (AFY) IN THE CITY OF GOLETA
Current Water Use
Future Water Use*2010 2015 2020 2025 2030
Single family residential
1,508 1,541 (+33)
1,574 (+33)
1,607 (+33)
1,640 (+33)
1,640 (assume 0)
Multiple family residential
1,233 1,396 (+163)
1,559 (+163)
1,723 (+164)
1,886 (+163)
1,886 (assume 0)
Commercial 592 632 (+40) 673 (+41) 713 (+40) 754 (+41) 754 (assume 0)
Industrial 2,195 2,274 (+79)
2,353 (+79)
2,433 (+80)
2,512 (+79)
2,512 (assume 0)
Total estimated water use is shown for each period. Increases for each 5-year period shown in italics
Santa Barbara Airport The District delivers water to the Santa Barbara Airport pursuant to the 1970 Joint Powers Overlap Agreement (as amended), which has provided for coordination between the City and the District where their jurisdictional boundaries overlap. The 1982 amendment to the Agreement defines the maximum amount of water to be delivered to the Airport as 240 AFY. The Airport property is served by the District through a master meter and six irrigation meters. In addition, individual commercial tenants at the Airport are served directly by the District. Annual water use by the Airport, including commercial tenants, during the period 1999 – 2004 is summarized below in Table A-7:
TABLE A-7 RECENT TOTAL ANNUAL WATER USE (AFY) AT THE AIRPORT
Year 1999 2000 2001 2002 2003 2004 AverageAFY 137 192 120 105 89 93 123
The Santa Barbara Airport has two major projects to be completed in the next 10-15 years. In 1997, the City of Santa Barbara approved the Airport Industrial Specific Plan, which provides for development of research, office, and light industrial land uses north of Hollister Avenue on City-owned lands. The additional water use associated with the Industrial Specific Plan at full build out was projected to be 38 AFY. Only a small
Goleta Water District – Dec. 2005 (corrected) 54 Final Urban Water Management Plan
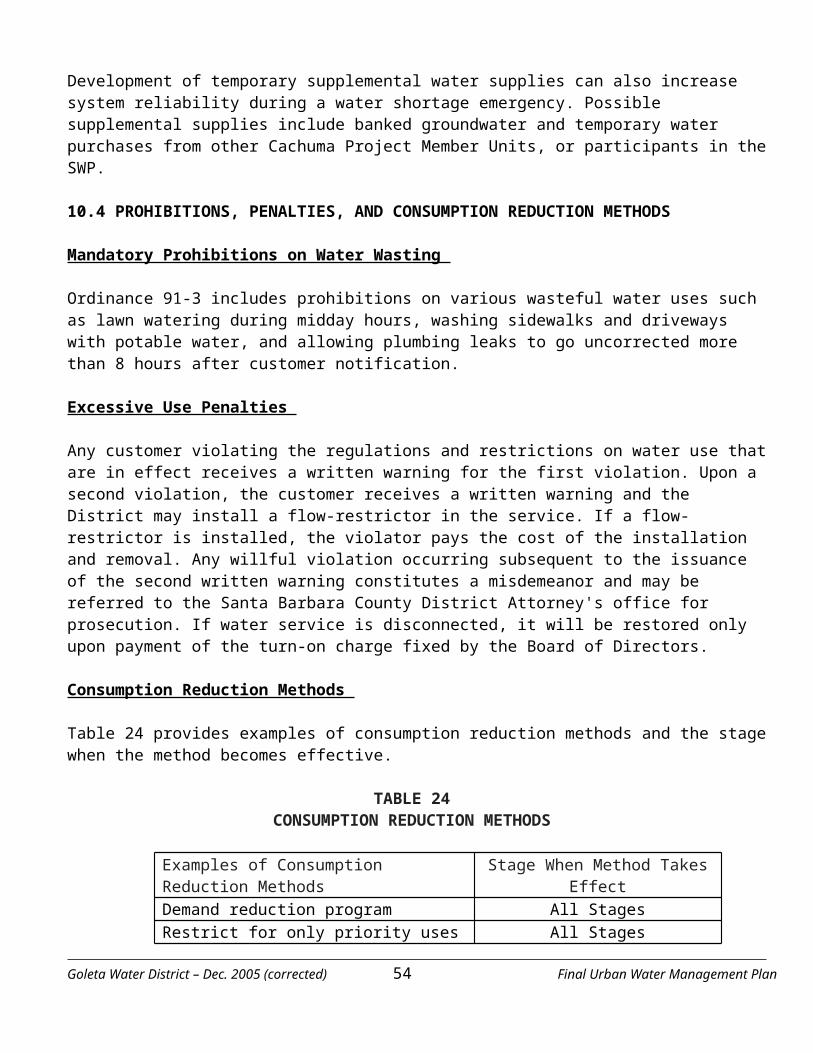
portion of the Industrial Specific Plan has been developed to date; it is anticipated that full build out would not occur until 2020.
The Airport is currently preparing plans for the enlarged terminal building which will provide greater square footage to serve current passengers, and the anticipated increase in passengers over time. The Airport estimates that the increased water use associated with a larger terminal, due to more landscaping, bathrooms, and food service, will be about 6 AFY. The terminal is expected to be completed by the year 2020.
The projected increase in water use at the Airport is shown in Table A-8.
TABLE A-8 PROJECTED TOTAL FUTURE WATER USE (AFY) AT THE AIRPORT
Current (1999-2004 average) 2010 2015 2020 2025 2030123 137 152 167 167 167
Santa Barbara County – Isla Vista In March 2005, the District completed a Water Supply Assessment (WSA) for the County of Santa Barbara’s Isla Vista Master Plan; the analyses were updated in November 2005 to reflect changes in the Master Plan densities. The County is considering updates and rezoning for the 320-acre community of Isla Vista which would result in an additional 2,221 multi-family residential units and 51,485 square feet of commercial property. The District supplies water to this community. Under the provisions of Senate Bill 221, the District must prepare a WSA for the local land use jurisdiction for any proposed project that involves 500 units or more. The assessment must provide verification that sufficient water supply is available prior to action on the project by the County. The District’s assessment includes a description of the District’s water supply sources, current water uses by sector, and projections of future water demand by sector. The WSA contained the following projections of future additional water use at full build out, expected to occur in 2025: ← New residential units (all multiple family) = 2,221 units and 446 AFY ← New commercial properties = 51,485 square feet and 12 AFY
The projected increase in future water use in Isla Vista during the period 2005-2030 is presented below in Table A-9. The WSA assumed that the new demands would be realized by year 2010; however, a more realistic assumption is used below in which the new demands would be realized by the year 2025.
TABLE A-9 PROJECTED TOTAL FUTURE INCREASE IN WATER USE (AFY) IN ISLA VISTA
2010 2015 2020 2025 2030 115 229 343 458 458
The above increases are not additive from period to period. They represent the additional water use anticipated at each time period over and above current (2005) levels.
Other Unincorporated Areas – Development of Vacant Lands & Pending Projects (Current Zoning) Future increases in water use on vacant lands in the unincorporated portions of the District service area, exclusive of Isla Vista, were estimated by the following method. Parcel data for the District service area were provided by the County’s Assessor Office. Parcels were removed from the database that occurred within Isla Vista, City of Goleta, Santa Barbara Airport, the District-City Overlap Area along the western boundary of the City of Santa Barbara, and in the La Cumbre Mutual Water Company service area. The District-City Overlap Area was removed because it is understood that any new development approved in Goleta Water District – Dec. 2005 (corrected) 55 Final Urban Water Management Plan
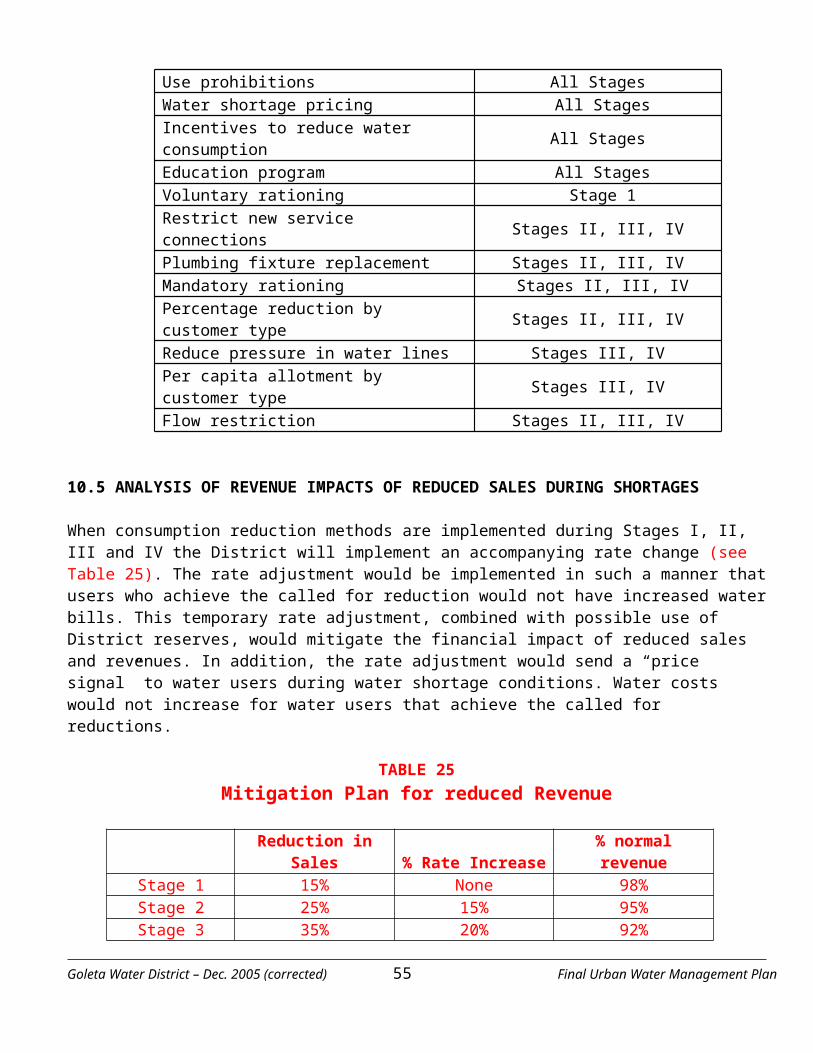
this area would be served by the City of Santa Barbara, not the District. La Cumbre Mutual Water Company service area was removed because it is an independent private water purveyor with its own supply of groundwater and SWP water. Any new development in their service area would be supplied by the La Cumbre Mutual Water Company.
The remaining parcels were sorted as follows: (1) all parcels described as “vacant” were compiled; (2) these parcels were then sorted by zoning and acreage; and (3) parcels owned by the federal government or less than 4,000 square feet were removed. This sorting resulted in 255 vacant parcels in the service area that ranged in size up to 495 acres. The total acreage of the parcels was 6,803 acres. The current zoning was used to project the future number of residences that would be allowed, all of which were assumed to be single family residences. A total of 412 units could be built on these vacant parcels under current zoning, which includes both residential and agricultural. It is assumed that full build out would occur in 2025. The additional water use associated with the development of these parcels is shown in Table A-10:
TABLE A-10 ESTIMATED NEW RESIDENTIAL WATER USE FROM
VACANT PARCELS IN THE UNINCORPORATED AREAS
2010 2015 2020 2025 2030Number of new single family residences 103 206 309 412 412 New water use (AFY) 28 56 85 113 113
The above increases are not additive from period to period. They represent the additional water use anticipated at each time period over and above current (2005) levels.
To supplement the above analysis, the current cumulative project list for the unincorporated portions of the County outside the City of Goleta, but within the District service area, was acquired from the County Planning and Development Department (attached). The projects on this list represent projects that have been approved, or are likely to be approved in the near future. The list includes single family residences, 68 multi-family units, and 141,805 square feet of commercial/industrial facilities. Future water uses was developed for these projects using District water duty factors. The estimated additional water use in the unincorporated area of the District is presented in Table A-11.
TABLE A-11 ESTIMATED NEW WATER USE (AFY) FROM
CURRENTLY IDENTIFIED COUNTY PROJECTS
2010 2015 2020 2025 2030 Single family residences 53 53 53 53 53 Multiple family residences 14 14 14 14 14 Commercial/industrial projects 33 33 33 33 33
The above increases are not additive from period to period. They represent the additional water use anticipated at each time period over and above current (2005) levels.
Other Unincorporated Areas – Affordable Housing Development (Re-zoning) In 2002, the Santa Barbara County Association of Governments (SBCAG) adopted a Regional Housing Needs Assessment (RHNA) that allocated state designated housing needs among county jurisdictions. The RHNA provided each jurisdiction with housing targets for their mandated Housing Element updates, including 6,064 units that were allocated to the unincorporated areas of Santa Barbara County. In 2004, the Board of Supervisors adopted the County's 2003-2008 Housing Element. The document was forwarded to
Goleta Water District – Dec. 2005 (corrected) 56 Final Urban Water Management Plan
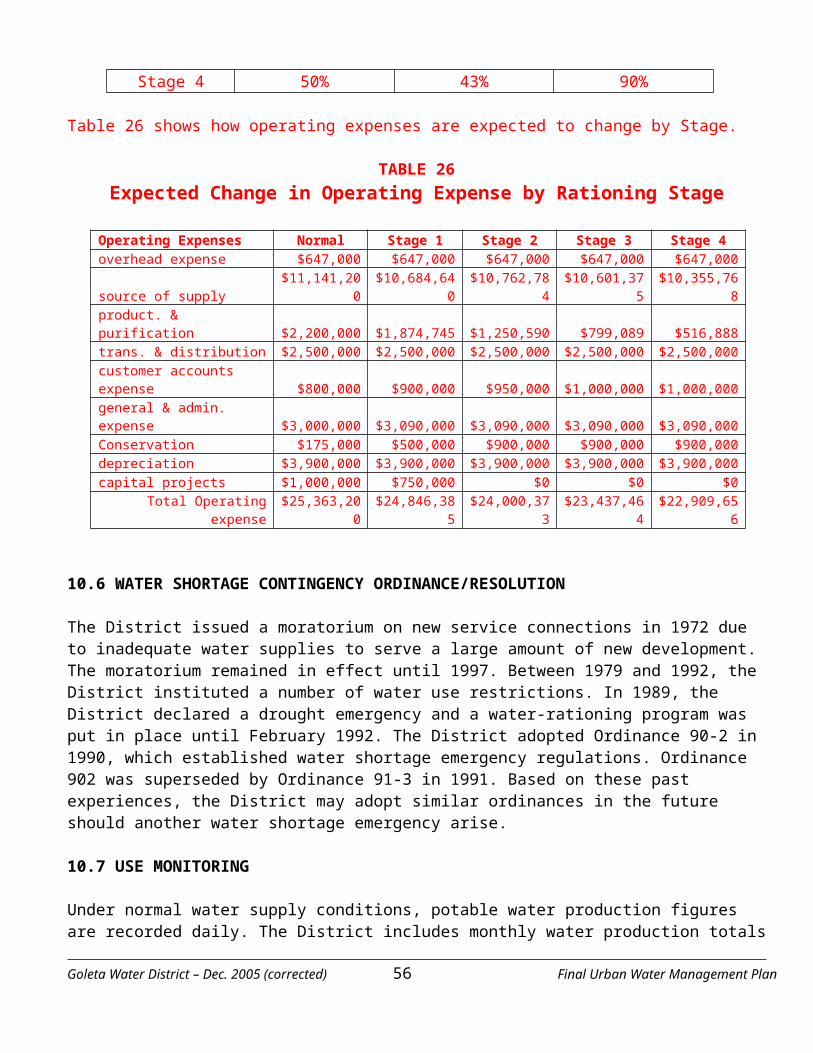
State Department of Housing and Community Development (HCD), which determined that a number of revisions would be required in order to acquire certification. The Board of Supervisors appointed an Ad Hoc Housing Subcommittee in May 2005 to review the Housing Element process to date and to advise staff on how to proceed with implementing and/or updating the Housing Element. The Ad Hoc Housing Subcommittee determined that the County should obtain certification of its Housing Element from State HCD, which will require that the County rezone lands for higher density housing.
State housing law requires that jurisdictions identify adequate land at appropriate densities to accommodate their RHNA for all economic segments of the community. The state does not mandate that jurisdictions build units, only that they ensure existing zoning and development regulations allow units to be built at all affordability levels. The County has adequate vacant residentially zoned land to meet the state's requirements for market rate and moderate income housing but does not have sufficient vacant or underdeveloped land at densities high enough to accommodate the low and very low income housing allocation. Therefore, the County can not meet its entire allocation for housing with existing zoning. The County must rezone an adequate number of acres to residential densities that can accommodate 1,235 housing units for low and very low income households. The adopted Housing Element proposed densities of 20 units per acre for very low income housing and 16 units per acre for low income housing. Given the County's remaining need of 1,235 very low and low income units, the County must rezone 66 acres to be consistent with the requirements of state law. This includes 46 acres at a residential density of 20 units per acre and 20 acres at a density of 16 units per acre.
In November 2005, the Planning Commission reviewed a list of potential rezone sites recommended for further study by the Subcommittee that are located in the Santa Maria, Lompoc, Los Alamos, Montecito, and Carpinteria areas. Sites were not identified in the Eastern Goleta Valley, Isla Vista and the Santa Ynez Valley. Potential sites in Isla Vista and Santa Ynez will be analyzed through their respective community plan processes which are currently ongoing. The Eastern Goleta Valley will participate in a visioning process for their community through which potential sites will be identified and submitted to the Planning Commission in April 2006.
The sites identified by the Planning Commission in the November 2005 hearings and the sites to be identified in the Eastern Goleta Valley in April 2006 will be studied in the Housing Element EIR. In late 2006/early 2007, the Planning Commission will consider the findings of the Housing Element EIR and those determined in the community plan processes and determine which sites are best suited to address the County's affordable housing needs and meet the state's requirement for rezoning 66 acres of land. On October 18, 2005, the Board of Supervisors established a new process to allow the Eastern Goleta Valley community to have additional input into which sites in their community will be considered in the Housing Element EIR. Specifically, the community will be commencing a process to update its community plan which will run concurrently with the beginning of the drafting of the Housing Element EIR. In April 2006, the Eastern Goleta Community will submit a list of potential sites to the Planning Commission for evaluation in the Housing Element EIR. The Planning Commission will review the recommendations and determine which sites will be analyzed in the EIR. The County will then incorporate analysis of Eastern Goleta Valley sites into the EIR and release a draft for public review in Summer 2006.
At this time, the number of affordable housing units that would be recommended in the Eastern Goleta Valley within the District’s service area is unknown and entirely speculative. The County has identified a number of parcels in the area that will be considered during the visioning process, and by the Ad Hoc Housing Subcommittee. They are listed and shown on the attached table and figure, respectively. After the completion of the Housing Element EIR, the County will allocate a number of affordable housing units in Eastern Goleta Valley, which could potentially include several hundred units. Until that the time that the Goleta Water District – Dec. 2005 (corrected) 57 Final Urban Water Management Plan
Board of Supervisors approves the updated Housing Element, the District cannot include the future water demand associated with rezoning parcels in the District’s service area for affordable housing. However, it is possible that the new water demand could range from 60 to 100 AFY based on 300 to 500 multi-family units. The District will consider updating the Urban Water Management Plan when the County has approved the allocation of housing units in the District’s service area.
University of California The District provides potable and recycled water to the University of California. Water service for the University has been subject to the 1991 Agreement between the District and the University. That Agreement has a term through 2010, and was intended to continue in force thereafter unless the District or the University chose to terminate the 1991 Agreement upon one year notice. The University has just filed litigation against the District challenging the District's charges for water service under the terms of the Agreement. The District expects to prevail in that litigation as the District is of the position that the Agreement is binding on the University and has a term through 2010, and all District water service charges have been entirely consistent with the terms and conditions of the Agreement. The Agreement provides the University with a quantified amount of both potable and recycled water for both current uses and to support the new development proposed by the University's Long Range Development Plan (LRDP). Should the University prevail in the litigation, a result of the litigation may be recision of the 1991 Agreement. If the University intends to attempt to avoid its obligations under the Agreement, to pay for water service as agreed, then the District should not be bound by the Agreement either. If the Agreement is terminated, the University would then be treated as all other District customers, and pay the standard fees, for new water service for new development, and the standard costs for recycled water service. The District does not know whether that change in the relationship between the University and the District will have any impact on the University's ability to implement the existing or new LRDPs. Until the litigation is resolved the terms and conditions of the District's long term relationship with the University cannot be known.
Potable water is delivered to the campus at seven meters. The District also provides recycled water to UCSB for landscaping at nine connection points. Recent water deliveries to the University of California are summarized below in Table A-12.
TABLE A-12 RECENT WATER DELIVERIES (AFY) TO THE UNIVERSITY OF CALIFORNIA
1999 2000 2001 2002 2003 2004 Average Potable 536 508 564 571 562 606 558 Recycled 153 138 110 161 142 153 143
Total 689 646 674 732 704 759 701
Most of the University of California campus is located in the Coastal Zone. The development of the campus is governed by the University of California’s Long Range Development Plan (LRDP); a land use plan that must be approved by the California Coastal Commission (CCC). The CCC approved the 1990 LRDP. In 1997, the Regents approved a major amendment to the LRDP to allow for the development of the North Campus area for student and faculty housing; the 1997 amended LRDP was never submitted to the CCC for approval. In 2004, the University of California approved another major amendment to the LRDP that included the 1997 amendments. The current LRDP amendment has been submitted to the CCC for review and approval. The current amendment includes various modifications to the number and location of student and faculty housing on the Main, North, West, and Storke campuses. The primary changes in housing contained in the current LRDP amendment are summarized below in Table A-13 and compared to the 1990 and 1997 versions.
Goleta Water District – Dec. 2005 (corrected) 58 Final Urban Water Management Plan
TABLE A-13 SUMMARY OF LRDP HOUSING PROJECTIONS
LRDP Versions No. of Units No. of Beds Status1990 LRDP Student Housing 649 Faculty Housing 50
Total 6991997 LRDP AmendmentCampus Student Housing 200Storke Campus Student Housing 281Storke Campus Family Student Housing 51North Campus Student/Faculty Housing 351West Campus Student/Faculty Housing 167
Total 1,0501990/1997 LRDP with proposed amendmentsCampus Student Housing 200 800 CompletedStorke Campus Student Housing 371 976 Under constructionStorke Campus Family Student Housing 51 Planning StagesNorth Campus North Parcel Faculty Housing 147 Pending approvals South Parcel Faculty Housing 122 Pending approvals
Storke-Whittier Parcel Family Student Housing 144 Pending approvals
West Campus Faculty Housing 100 Pending approvals
Total 1,135
TABLE A-14 LIST OF CURRENT AND NEAR-TERM UCSB DEVELOPMENT PROJECTS
Campus Project Description/Location Approx.ASF
Schedule
Housing Manzanita Village Student Housing
200 units with 800 bed spaces N/A Completed
San Clemente Graduate Student Housing
371 units for student housing, with 976 bed spaces
N/A Construction planned to start 2005, occupancy scheduled for 2007
North Campus Housing
North Parcel: 147 units for faculty; South Parcel: 122 units for faculty; and Storke-Whittier Parcel: 144 units for family students
N/A Awaiting Coastal Commission approval. Schedule unknown
West Campus Housing
100 units for faculty housing Awaiting Coastal Commission approval. Schedule
Goleta Water District – Dec. 2005 (corrected) 59 Final Urban Water Management Plan
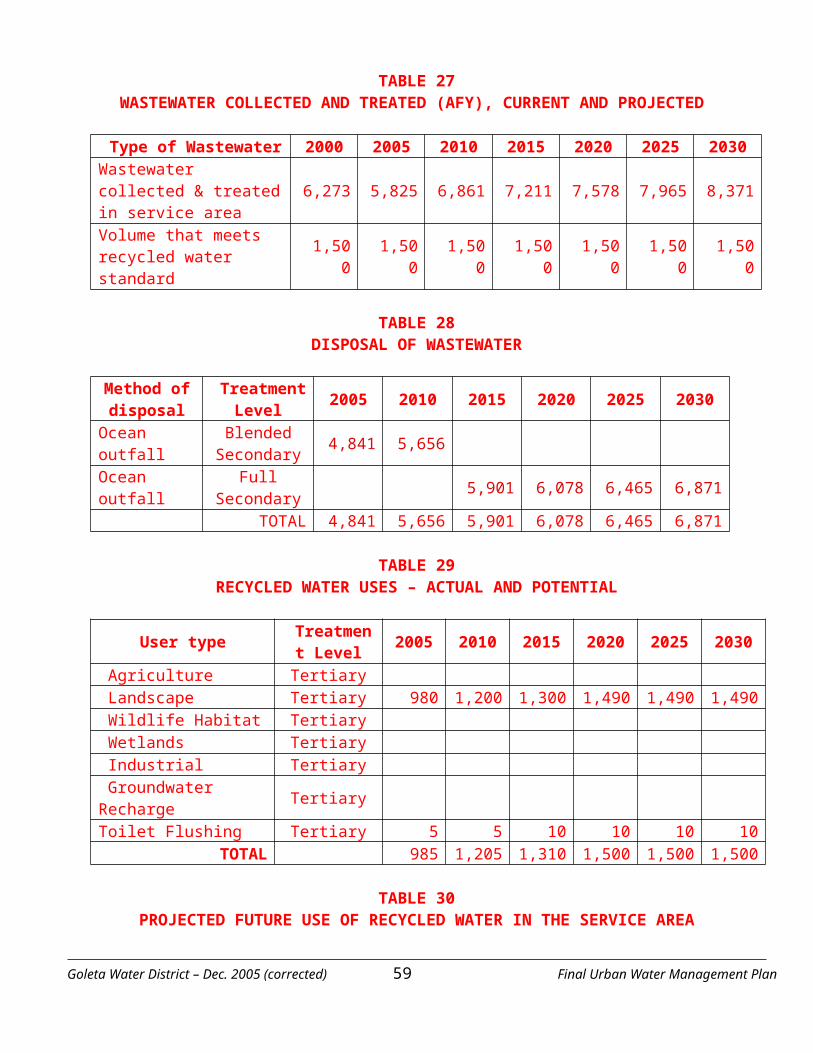
unknown Institutional Facilities Marine Sciences Research Building**
Project is under construction on Lagoon Rd. Building to house research laboratories and laboratory support, academic and administrative offices.
38,000 (61,405 GSF)
Project Complete
Life Sciences Building**
Project is under construction on UCen Rd. Four-story building to house research laboratories, classrooms (including a 150 seat lecture hall), laboratory support, and academic and administrative offices.
47,500 (78,600 GSF)
Under construction, occupancy scheduled for 2005
Intercollegiate Athletics Building**
Project is under construction west of Robertson Gym. To provide new student-athlete training facilities, offices for coaches and administrative facilities.
28,600 (40,000 GSF)
Project Complete
Recreation and Aquatics Center Expansion**
Site west of existing Recreation and Aquatics Center. Facilities include an indoor multi-activity court, climbing wall, locker rooms, weight and cardiovascular training rooms, class and meeting rooms.
37,600 (56,100 GSF)
Project Complete
CNSI Building and Campus Parking Structure 2**
Near the East Gate entrance to Main Campus at existing parking Lot 10. The project includes an auditorium, laboratory, office, classrooms, parking structure for approx. 600 cars and a ground-level cafe in the parking structure.
70,000 Under construction, occupancy scheduled for 2006
Psychology Building Addition **
Addition to existing Psych. Building on UCen Rd.; will house research laboratories, classrooms, laboratory support, and academic and administrative offices.
12,000 (21,268 GSF)
Under construction, occupancy scheduled for 2006
Materials Research Lab Addition**
An approximately 8,100 GSF addition to the eastern end of the Materials Research Lab. The project is north of Engineering I on the Main Campus.
8,100 GSF
Under construction, occupancy scheduled for 2005
Arbor Food Service **
Reconstruction of the existing food service facility located west of Davidson Library. The existing 900 GSF facility would be enlarged to 3,300 ASF.
3,300 GSF
Under Construction estimated completion 2005
Snidecor Hall Office Wing Replacement **
Site located east of Parking Lot 23 and south of the Event Center; addition to existing Snidecor Hall.
7,000 (new ASF)
Under construction, occupancy scheduled for 2006
Student Resource Building**
Site located in the northern portion of Parking Lot 23; to include women’s center, children’s center, dean of
43,100 Under construction, occupancy scheduled
Campus Project Description/Location Approx ASF
Schedule
students, educational opportunity program, for 2006
Goleta Water District – Dec. 2005 (corrected) 60 Final Urban Water Management Plan
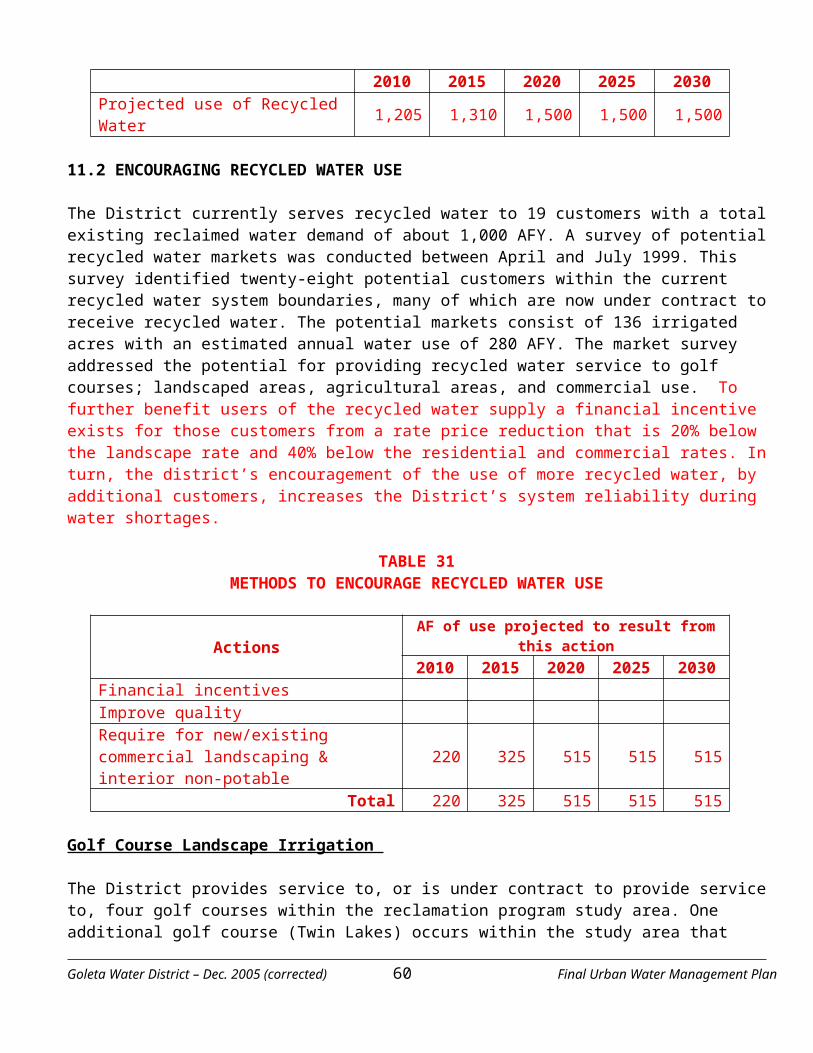
tutorial program, and international student scholars offices.
Campus Parking Structure 3**
Located at the site of existing Parking Lot 22. The structure would hold approximately 1,000 cars.
N/A Under construction, estimated completion 2006
Alumni House Sited at the southeast corner of the intersection of University and Mesa Road in Parking Lot 12.
9,250 Under construction, occupancy scheduled for 2007
Education and Social Sciences Building and Film, TV and New Media Center
Site is across Ocean Rd. from Rob Gym on existing Parking Lot 20-21; project to include approximately 126,000 asf for the Graduate School of Education, the College of Letters and Science, and film theater, editing room, and viewing studios.
125,000 Construction planned for 2005, occupancy scheduled for 2008
East Gate Renovation
Installation of entry feature and landscaping at the east gate to the Main Campus.
N/A Construction planned for 2005
Optical Fiber Extensions
To provide high-speed optical networking between the campus and the California CalREN-2 statewide fiber path.
N/A Construction planned for 2006
Ocean Science Education Bldg.
Site selection and pre-design underway. TBD Schedule unknown
Engineering II Addition
Addition to 4th floor of existing Engineering II building; to include dry research labs and offices for faculty, graduate students, and staff.
7,700 Schedule unknown
Davidson Library Addition
Expansion to main library including study space, office, storage, etc.
72,000 Construction planned for 2008
Faculty Club Expansion
Site located between Parking Lot 23 and the Campus Lagoon; addition may include dining room and kitchen expansion as well as the addition of 50 rooms (lodging).
24,027 Schedule unknown
Extended Learning Services Bldg**
The project would provide office space for the Extended Learning Services program currently located off campus.
12,500 Schedule unknown
Residential Life Resource Center**
Building to be a two-story office-type building providing space for the Office of Residential Life, Student Resident Assignment Services and associated administrative space. Site is adjacent to the Housing and Residential Services Administrative Offices off of Channel Islands Road.
5,700 (9,200 GSF)
Approved, on hold Schedule unknown
Public Safety Building Addition
Addition to existing Public Safety Building on Mesa Road. Will house dispatch/ communications, patrol and investigations, EMT/paramedics quarters and administration.
11,500 Construction planned for 2009
Source: Office of Campus Planning & Design, November, 2004. ASF – Assignable Square Footage GSF – Gross Square Footage * Construction recently completed. Data on recently completed projects is used in the analysis of cumulative water and wastewater impacts. ** Under construction or approved and awaiting construction.
Goleta Water District – Dec. 2005 (corrected) 61 Final Urban Water Management Plan
N/A – Not Applicable. Parking and residential square footage is not monitored under the requirements of the LRDP.
Of the housing units to be constructed under the current LRDP amendment, 200 were constructed five years ago at the Manzanita Student Village. Hence, water use from these additional units is now part of UCSB’s current water use condition. In early 2006, the University of California plans to begin construction of the San Clemente Student Housing with 371 units. Other housing projects on the North and West Campus are pending approval of the CCC.
The University of California is also continuing its expansion of classroom and office facilities in accordance with the 1990 LRDP which included a maximum build out of institutional facilities of 1.2 million square feet. Facilities that are under construction or currently proposed account for about 659,000 square feet (Table A-14).
The total estimated new water use at the University of California associated with continued development of facilities and housing under the current LRDP is about 316 AFY, as presented in Table A-15. It is estimated that about 20% of this demand would be met through recycled water (=63 AFY). It is estimated that the new demand associated with the approved and pending projects listed in Table A-15 would be completed by 2010. After that time, the District does not have information at this time from the University of California to reliably project new water demand to the year 2030.
TABLE A-15 ESTIMATE OF NEW WATER USE AT THE UNIVERSITY OF CALIFORNIA BASED ON
APPROVED OR PENDING PROJECTS
Project * ASF/Units Water Demand Duty Factor
Estimated Water Use (AFY)
Residences Manzanita Village 800 beds Completed N/A San Clemente Graduate Student Housing
971 beds 49 gallons/bed/day or 0.055 AFY
53
North Campus Housing 413 units 0.21 AFY/unit or 185 GPD/unit
86
West Campus Housing 100 units 0.21 AFY/unit or 185 GPD/unit
21
Storke Campus Housing 51 0.21 AFY/unit or 185 GPD/unit
11
Subtotal 171
Classroom/Laboratory Environmental Science Bldg. 49,000 asf 0.233 AFY/1000 sq. ft1 11.4 Engineering Science Bldg. 52,000 asf 0.233 AFY/1000 sq. ft1 12.1 Marine Sciences Research Bldg. 38,000 asf 0.233 AFY/1000 sq. ft1 8.8 Life Sciences Bldg. 47,500 asf 0.233 AFY/1000 sq. ft1 11.0 CNSI Bldg. 70,000 0.233 AFY/1000 sq. ft1 16.3 Psychology Building Addition 12,000 0.233 AFY/1000 sq. ft1 2.8 Kohn Hall Expansion 7,000 asf 0.233 AFY/1000 sq. ft1 1.6 Education/Social Sciences/Film, TV Media Building
125,000 asf 0.233 AFY/1000 sq. ft1 27.7
Goleta Water District – Dec. 2005 (corrected) 62 Final Urban Water Management Plan
Engineering II 7,700 asf 0.233 AFY/1000 sq. ft1 1.8 Physics II 70,000 asf 0.233 AFY/1000 sq. ft1 16.3 Materials Research Lab Addition 6,733 asf 0.233 AFY/1000 sq. ft1 1.6 Snidecor Hall Replacement Facility 9,871 asf 0.233 AFY/100 sq. ft1 2.3
Subtotal 486,300 113.7
Office/Miscellaneous Residential Life Resource Center 5,680 asf 0.135 AFY/1000 sq. ft1 7.7 Student Resources Bldg. 41,500 asf 0.135 AFY/1000 sq. ft1 5.6 Faculty Club Expansion 24,000 asf 0.135 AFY/1000 sq. ft1 3.2 Public Safety Bldg. Addition 11,500 asf 0.135 AFY/1000 sq. ft1 1.5 Davidson Library Addition 55,000 asf 0.135 AFY/1000 sq. ft1 7.4 Rec. and Aquatics Center Expansion 37,600 asf Not applicable 3.45
ICA Building 28,600 asf Not applicable 0.06
Web Hall Expansion 10,000 asf 0.135 AFY/1000 sq. ft.1 1.4 Arbor Food Service 3,300 asf 0.09 AFY/1,000 sq. ft.1 0.3 Harder Stadium Offices 10,165 asf 0.135 AFY/1000 sq. ft.1 1.4
Subtotal 172,345 31.9 TOTAL 316.6
Notes: *The Campus Sea Water and Sewer Renewal projects, parking structures, and Mesa Road Widening project would not result in a substantial long-term increase in Campus-related water use. 1 Source: Recent metered water use data 2Source: San Rafael Housing Addition Project Initial Study/Mitigated Negative Declaration (1998). 3Source: 1990 LRDP Final EIR. 4Assumes an average of three persons per unit. 5Source: Recreation and Aquatics Center Expansion & Intercollegiate Athletics Building Final EIR. Estimated water use for the Recreation Center equals 3.4 AFY.6Source: Recreation and Aquatics Center Expansion & Intercollegiate Athletics Building Final EIR. The ICA Building would consolidate existing athletic uses that are located on the Campus and would not result in an increase in wastewater generation.
Based on the above projections of water use for currently identified projects, the estimate of new water use and total water use at the University of California for the period 2005- 2030 is presented below in Table A-16. Total water use will increase up to 1,017 AFY by year 2010, of which 174 AFY will be provided by recycled water.
TABLE A-16 ESTIMATE OF FUTURE WATER USE (AFY) AT UCSB
Actual Demand Projected Water DemandAvg. 1999-2005 2010 2015 2020 2025 2030
New water use (potable & recycled) – see Table A-15
316 316 316 316 316
Current water use (potable & recycled) from 1999-2004
701 701 701 701 701
Total water use 701 1,017 1,017 1,017 1,017 1,017 -- Potable water use 558 814 814 814 814 814 -- Recycled water use (assumed to be 20% of total in the projections)
143 203 203 203 203 203
Goleta Water District – Dec. 2005 (corrected) 63 Final Urban Water Management Plan
The University of California is currently preparing a new LRDP to replace the 1990 LRDP, and to incorporate recent amendments (1997 and current proposed amendments) and new projects. The new LRDP will be subject to environmental review and submitted to the CCC for public review and approval beginning in 2006. The proposed new LRDP will include a plan for student and faculty housing for the main campus, as well as North, West, and Storke campuses.
In November 2005, the University of California provided information to the Santa Barbara News Press, which was published in an article dated November 8, 2005 concerning a forthcoming Housing Study. The study to be released in late 2005 will present a plan for the type, location, and number of units for future housing projects designed to meet anticipated student and faculty demands by the year 2017. A summary of the housing projects being contemplated is provided below based on the information provided in the newspaper article. The District was unable to acquire this information directly from the University of California for use in the UWMP. Note that the following planned housing units do not include current approved or pending housing projects noted above in Table A-15 (e.g., San Clemente Housing Project, North Campus Housing Project).
Location Planned Housing UnitsOcean Road Site 500-600 townhouses and apartments Storke Apt. Site Replace 342 student-family rentals with 600-700 single family
residences, townhouses, and apartments Main Campus Residence Halls Replace existing halls, add 300-500 units & limited faculty housing West Campus Replace 250 student family units with 400-500 single family
residences, townhouses, and apartments West Campus Mesa Site 100 single family residences Facilities Management Site 650-750 new residence hall units and apartments Francisco Torres Site 150 new townhouses and apartments Santa Ynez Apt. Site Replace 200 family student units with 400-500 apartments
Total new units 2,300-3,000
At this time, the above new housing units are not be included in the future University of California water use projections because they are speculative, and subject to change as the University of California completes its Housing Study and the new LRDP, and submits the LRDP to the CCC for review and action. However, the range of additional housing units suggests that future water demand at the University of California may increase 500-600 AFY over projected future demands (see Table A-16) in the next 10 to 15 years. The District will consider updating the Urban Water Management Plan as the University of California formally proposes, and/or approves, any of the planning housing units noted above.
Summary of Projections of Future Water Use Using Local Jurisdiction Estimates The projections of future water use by the local jurisdictions described above were combined with the current water use values for different water use sectors to predict the total water use in the District service area from 2005 to 2030. These projections are presented in Table A-17. The total water use in 2030 is estimated to be 16,736 AFY.
TABLE A-17 PROJECTED WATER USE BASED ON LOCAL JURISDICTION DATA
Local Jurisdiction Estimate Current 2010 2015 2020 2025 2030
Goleta Water District – Dec. 2005 (corrected) 64 Final Urban Water Management Plan
(build out)
Single family residential 4,677 City of Goleta 255 276 231 298 298 County lands 53 53 53 53 53
Total 4,985 5,006 4,961 5,028 5,028
Multiple family residential 2,155 City of Goleta 404 405 406 407 407 Isla Vista 112 223 334 446 446 County lands (vacant parcel analysis) 28 56 85 113 113 County lands (cumulative list) 14 14 14 14 14
Total 2,713 2,853 2,994 3,135 3,135
Commercial, including SB Airport 2,032 SB Airport 137 152 167 167 167 City of Goleta 120 239 359 479 479 Isla Vista 3 6 9 12 12 County lands (cumulative list) 33 33 33 33 33
Total 2,325 2,463 2,600 2,723 2,723
UCSB 558 Development from LRDP (potable only) 814 814 814 814 814
Agriculture 2,537 2,537 2,537 2,537 2,537 2,537 Recreation (park & landscape irrigation) 313 313 313 313 313 313
Recycled water, including UCSB 979 New UCSB use 203 203 203 203 203
Total 1,182 1,182 1,182 1,182 1,182
UAW at 6% beginning in 2010 1,067 952 974 981 995 995 Grand Total 14,318 15,840 16,151 16,391 16,736 16,736
5.0 SUMMARY As noted earlier, various methods are available to predict future water use, all of which have inherent limitations and potential errors. To reduce the uncertainty in these predictions, the average estimated total annual water use derived from each method was calculated to provide a final estimate of future water use in the District from 2010 to 2030, as shown in Table A-18.
TABLE A-18 AVERAGE OF PROJECTIONS BASED ON DIFFERENT METHODS
Customer Class 2010 2015 2020 2025 2030Single family residential 5,007 5,248 5,488 5,761 6,034 Multiple family residential 2,410 2,509 2,609 2,710 2,785 Commercial (+ Airport) 2,138 2,188 2,239 2,287 2,311
Goleta Water District – Dec. 2005 (corrected) 65 Final Urban Water Management Plan
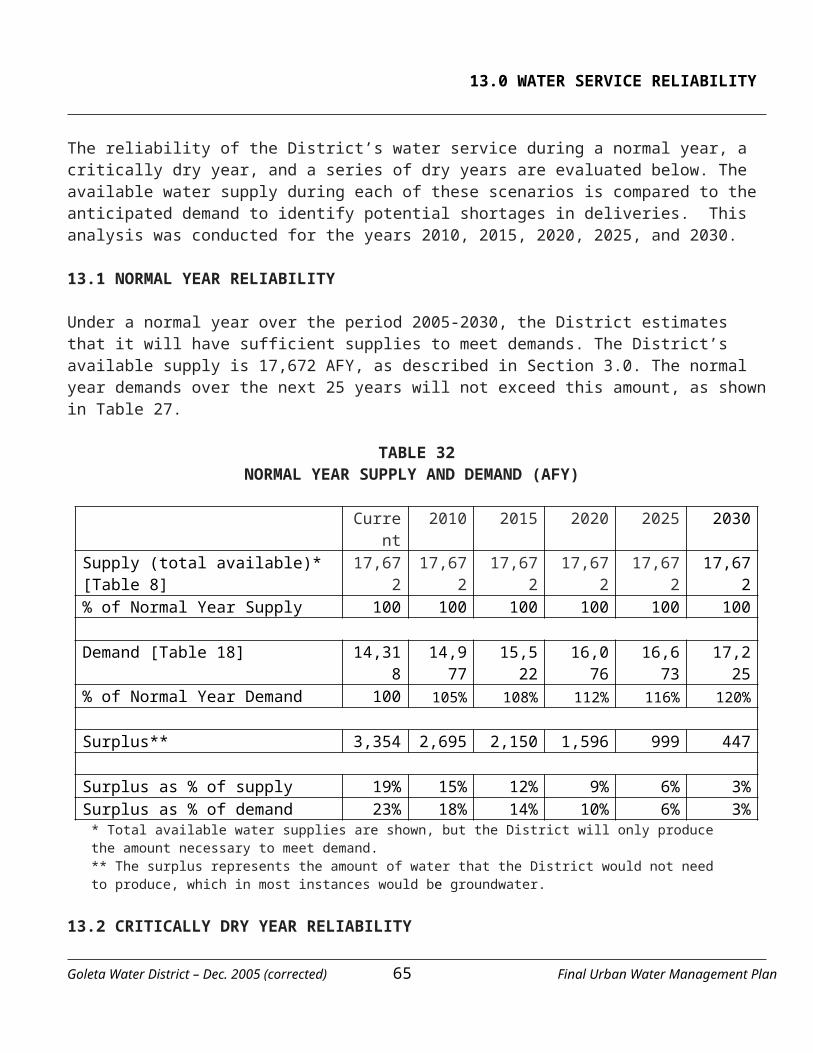
UCSB 598 605 612 620 629 park & landscape irrigation 314 316 317 319 320 Agriculture 2,556 2,604 2,654 2,708 2,763 Recycled water (+ UCSB) 1,109 1,177 1,251 1,328 1,412 UAW at 6% beginning in 2010 844 875 906 940 971 Grand Total 14,977 15,522 16,076 16,673 17,225
Goleta Water District – Dec. 2005 (corrected) 66 Final Urban Water Management Plan
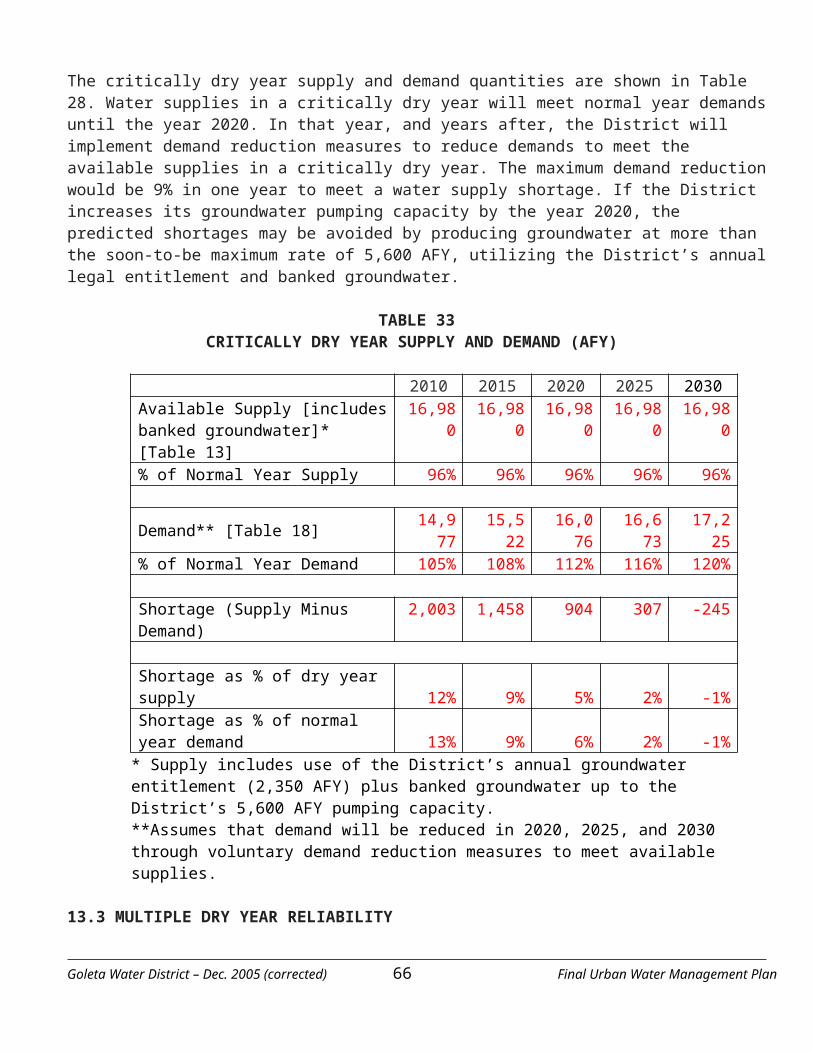
APPENDIX B WRIGHT V. GOLETA WATER DISTRICT
TENTH ANNUAL REPORT IN THE WRIGHT V. GOLETA WATER DISTRICTSAFE WATER SUPPLIES ORDINANCE - 1991
AN AMENDMENT TO THE SAFE WATER SUPPLIES ORDINANCE - 1994
Wright Suit will be included here
TENTH ANNUAL REPORT IN THE WRIGHT V. GOLETA WATER DISTRICT
Russell R. Ruiz, State Bar No. 123414Attorneys for Defendant GOLETA WATER DISTRICT
SUPERIOR COURT OF THE STATE OF CALIFORNIAFOR THE COUNTY OF SANTA BARBARA
MARTHA H. WRIGHT, et alPlaintiffs,
CASE NO. SM57969 GOLETA WATER DISTRICT'S RESPONSE TO OVERLYING OWNERS' REPLY AND OPPOSITION TO THE TENTH ANNUAL REPORT
GOLETA WATER DISTRICT, et al - Defendants.
DATE: July 24, 1998 TIME: 1:30 p.m. DEPT: SB Municipal Court Department One
The Overlying Owners represented by Hatch & Parent (all further references in this Response to Overlying Owners shall refer only to the Overlying Owners represented by Hatch & Parent) raise three main issues:
1. Is there a December 31, 1998 deadline to request Augmented Service or Exchange Service?2. Does the Goleta Water District ("District") have an obligation under the Judgment to file, serve
and have a hearing on an Annual Report, every year in perpetuity?3. Is the District's obligation under the Judgment to provide Augmented Service without quantity
limitation?
We will address each of these issues separately, beginning with the simplest.
1. THERE IS NO DEADLINE TO REQUEST EXCHANGE OR AUGMENTED SERVICEThe District submits with this Response, a revised proposed Odder attached as Exhibit "A", which
includes the language requested by the Overlying Owners on the issue that there is no deadline to request Augmented Service.
2. THE DISTRICT'S OBLIGATION UNDER THE JUDGMENT TO SUBMIT ANNUAL REPORTS ENDS WITH THE TENTH ANNUAL REPORT
Contrary to the statement made by the Overlying Owners that the Judgment does not suggest or imply that the District's annual reporting requirement ceases upon the achievement of Hydrologic Balance
Goleta Water District – Dec. 2005 (corrected) 67 Final Urban Water Management Plan
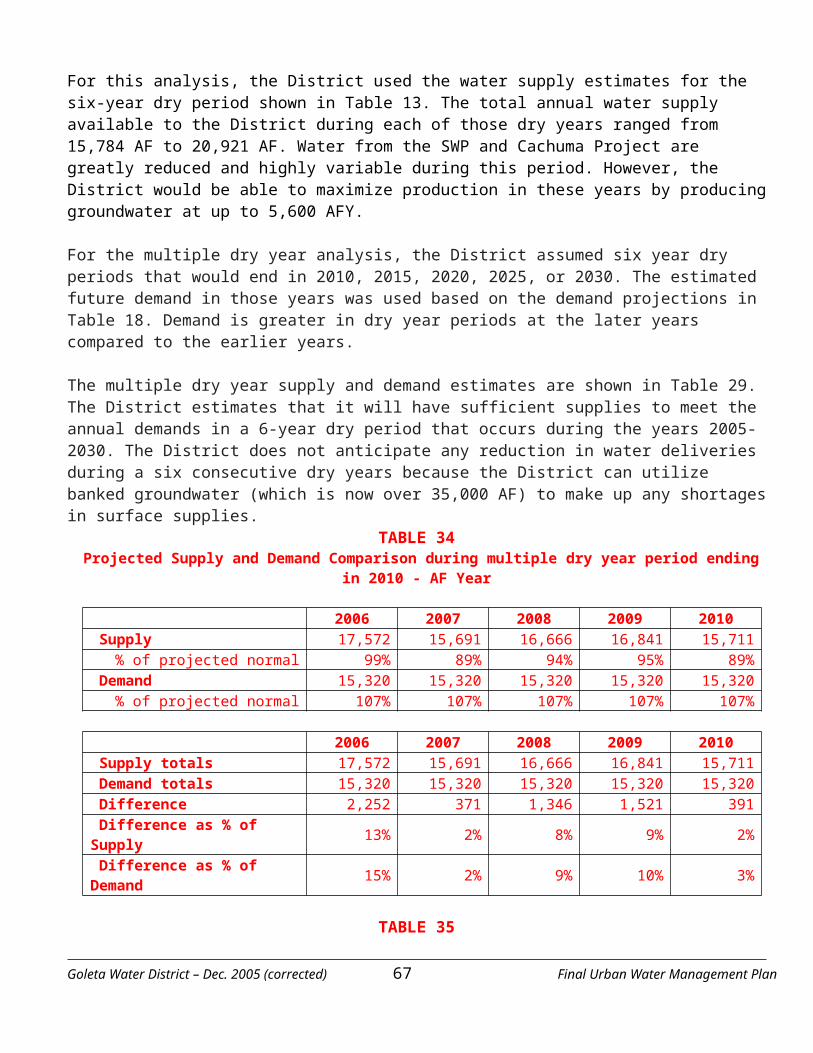
and the conclusion of the Tenth Annual Report hearing, comments made by the Court and several of the parties at the conclusion of the Ninth Annual Report hearing last year, suggest that it is clearly understood that with the achievement of Hydrologic Balance, the District's Annual Report obligation under the Judgment ceases with the Tenth Annual Report. The entire purpose of the Annual Report process is to ensure that the District achieves Hydrologic Balance by December 31, 1998. (Judgment, page 111, paragraph 19(h).) The Judgment also states:
The Water Plan also addresses future water demand, but this Judgment only compels the Water District to achieve Hydrologic Balance and to provide water to Overlying Owners as stated herein.(Judgment, page 112, paragraph 20.)
As demonstrated in the Tenth Annual Report, the District has in fact achieved Hydrologic Balance as defined by the Judgment. The purpose for the Annual Reports is therefore fulfilled.
In addition to satisfying the terms of the Judgment, there are good practical reasons why the Annual Report process need not continue. As demonstrated by the record of these proceedings, water supply planning is not a fast moving process. The District's water supply from the Cachuma Project has been in place for over 40 years and it is not reasonable to expect that the District would take any action to negatively impact that water supply. The District has invested over $100,000,000.00 (One Hundred Million Dollars) in the State Water Project, and there is no reason to believe that there will be any significant changes to that water supply, resulting from any actions taken by the District, in the future. The District has invested approximately $30,000,000.00 (Thirty Million Dollars) in its Reclamation Project and it certainly intends to continue to operate those facilities. The District has stated that its Water Plan includes deferring groundwater extractions for the foreseeable future. There is no evidence before the Court to suggest that there is any need for the Court to oversee the District's groundwater operations for the foreseeable future. The continuing jurisdiction of this Court proposed in the Order, allows any party to notice a motion and bring a matter to the Court should there be compelling evidence to suggest the need for the Court's participation in the District's water supply planning
Substantial District resources, and those of the Court, are required to process the Annual Reports. As there is no compelling reason to continue the Annual Report process, those expenditures of public funds and resources should not be required. We strongly suggest to the Overlying Owners that rather than request that the Court address this issue, they reconsider their position and withdraw their request to require the District to file Annual Reports in perpetuity, and therefore avoid the associated waste of public resources.
The Hatch & Parent law firm is General Counsel to the Central Coast Water Authority and therefore, is thoroughly advised regarding the District's State Water Project operations. The Hatch & Parent law firm is General Counsel to the Santa Ynez River Water Conservation District, Improvement District No. 1, which is a Cachuma Project Member Unit. The Hatch & Parent law firm is therefore readily familiar with Cachuma Project operations. The District is subject to the Public Records Act. Both as a matter of law and as standard Goleta Water District practice, any reasonable request for information will be responded to. Should the Overlying owners have a need or interest in any information regarding the District and its operations, they simply have to request that information and it will be made available. Neither the Judgment, nor current circumstances provide any justification for requiring the District to file Annual Reports under the Judgment, forever!
3. THE DISTRICT'S OBLIGATION TO PROVIDE AUGMENTED SERVICE IS LIMITED TO 500 ACRE FEET PER YEAR.
We will begin this section by agreeing with the Overlying Owners that the issue regarding the District's obligation to provide Augmented Service in excess of 500 AFY, is not yet ripe for adjudication and the question should be deferred. We understand that the Overlying Owners agree with this proposal.
The District has always understood its obligation to provide Augmented Service as being limited to Goleta Water District – Dec. 2005 (corrected) 68 Final Urban Water Management Plan
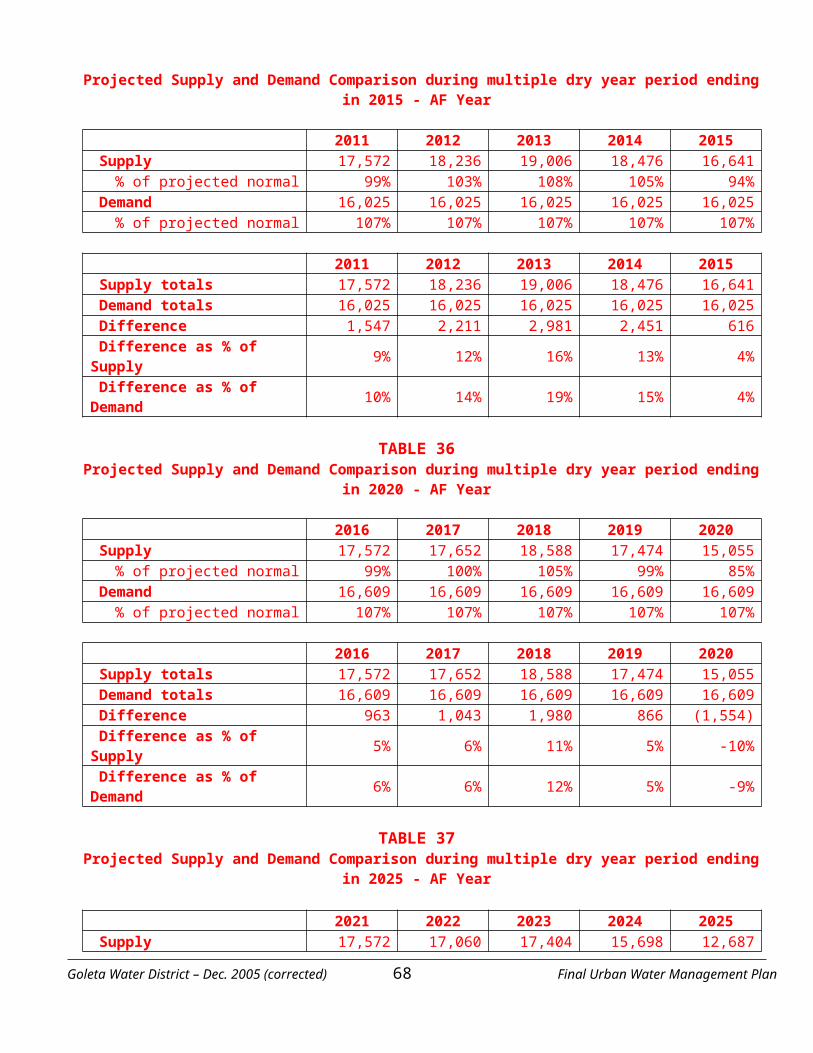
500 acre fee per year ("AFY") - The Judgment at page 133, paragraph 31(a) (4) states that the supply of water necessary to be developed by the Water District to support Augmented Service, "need not exceed an annual supply of 500 AF."
The District's Fourth Annual Report filed on June 15, 1992, states as follows: Under the terms of the Judgment the District has an obligation to provide up to 500 AFY of new water service to the Overlying Owners as "Augmented Service." (Page 12, lines 3-6.)
In another section of the Fourth Annual Report regarding a dispute as to the rights of the Goleta-Union School District to receive Augmented Service, the District states as follows:
District has an obligation to provide a cumulative total of 500 AFY of water for Augmented Service. It is thus immaterial to the District which parties or properties receive that service.' Clearly, the Private Overlying Owners have an interest in this issue since if the School District properties receive Augmented Service, that reduces the "pool" of water available to them. (Fourth Annual Report, page 15, lines 3-8.)
The District has attached as Exhibit "B" the first page of the Fourth Annual Report, and pages 1215 of that Report that address the Augmented Service issue. The Overlying owners responded to the Fourth Annual Report, but nowhere disputed the District's position that the District's obligation to provide Augmented Service is limited to 500 AFY.
At the same time that the Fourth Annual Report was before the Court, the District also filed a Motion Regarding Recognition of Goleta Water District's Water Supply. The specific purpose oil that Motion was to demonstrate the District's ability to provide Augmented Service. In that Motion, the District stated:
It is the purpose of this Motion to request an Order of the Court finding that the District does in fact have adequate water supplies to meet all of its current obligations and in addition, the Augmented Service demand of up to 500 AFY. (Motion, page 2, lines 22-25.)
At page 6 of the Motion, the District identifies Augmented Service as a new 500 AFY demand. At page 8 of the Motion, the District states:
Based on the foregoing, it is established that the District has adequate water supplies to serve all of its existing demand obligations, including the 500 AF for Augmented Service.
A true and correct copy of the Motion is attached as Exhibit "C". The Overlying Owners filed a pleading in support of the District's Motion. Nowhere in that Overlying
Owner pleading is there any dispute with the District's position that its obligation to provide Augmented Service is only 500 AFY.
As a preliminary matter, it is the District's understanding that the 500 AFY limitation on Augmented Service may never become "ripe" for adjudication because it is the District's understanding that the figure was set higher than the estimate of potential demand from the Overlying Owners. That understanding seems to have been borne out by history, as we are now 10 years post Judgment and in the middle of a development boom in the Goleta Water District service area, and only 324.77 AFY of Augmented Service has been requested to date- Even much of the Augmented Service that has been requested and approved has not actually been implemented.
Contrary to the Overlying Owners argument, there is nothing inherent in the Augmented Service limitation that is inconsistent with a Physical Solution or the Overlying Owners' water rights. "The usual purpose of a physical solution is to avoid a waste of water without unreasonably or adversely affecting the rights of the parties. City of Los Angeles v City of San Fernando (1975) 14 Cal.3rd 1999; 123 Cal.Rptr. 1. It Goleta Water District – Dec. 2005 (corrected) 69 Final Urban Water Management Plan
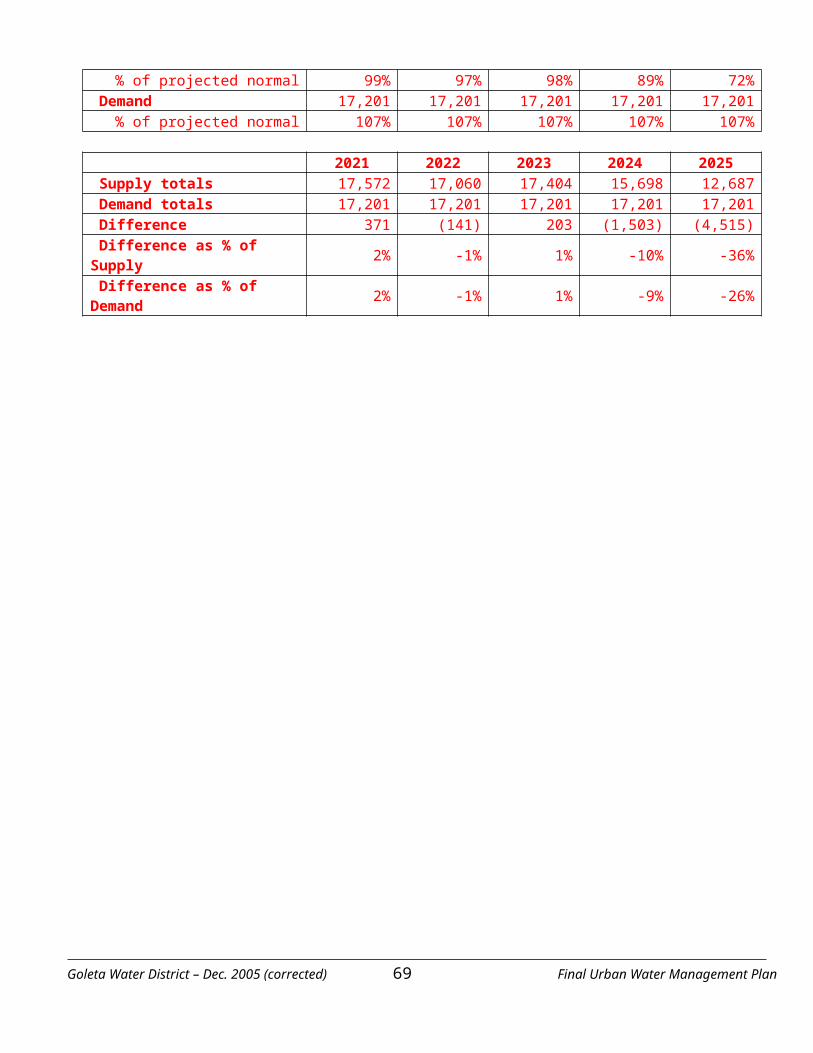
is recognized by the District that should an Overlying Owner have a demand for water after the 500 AFY of Augmented Service has been exhausted, that Overlying Owner may develop private groundwater facilities to serve any reasonable use of water on their property.
At the time Judgment was entered, the District was reliant upon groundwater resources to meet its then existing customer demand. It agreed to provide up to 500 AFY of Augmented Service as part of the physical solution to avoid an injunction. It was absolutely critical at that time that the District's production of groundwater not be enjoined.
Consistent with the physical solution, it will be appropriate in the future should the day come that Augmented Service is exhausted, that the District and the Overlying Owner have the opportunity to decide whether the District wishes to provide additional service consistent with the provision of Augmented Service, or it may be determined that it is preferable for the Overlying Owner to develop its own private groundwater facilities.
It must be recognized that from a financial standpoint, there is not an equal relationship between District service and the Overlying Owners' water rights The District provides regulated, treated water in a conjunctive use operation that allows for the reliable service of high quality treated water, on demand. Today, the District charges a fee to connect to the system of $23,588.00 per acre foot of new demand.. Even that significant connection fee, does not recover the value of the District's facilities necessary to supply water to new development. The District of course generates revenues from its monthly water rates to contribute to the costs of its operations. There is nothing inherent in a physical solution, California water law or the Judgment, that requires the District to provide an extremely valuable service, without limitation, to the Overlying Owners in perpetuity.
The Judgment, as a physical solution, is in the nature of an agreement between the parties. As indicated in the Overlying Owners' Reply, "To put the Judgment in context, each party made some compromise to allow the Physical Solution to work." (Reply, page 7, lines 11-12.) It was reasonable at the time the Judgment was entered, for the District to offer up to 500 AFY of District service to avoid an injunction against its groundwater production. It is understood by the District that should Augmented Service availability be exhausted, the Overlying Owners would retain their water rights to produce groundwater, to serve any new development on the Overlying Owners' property.
CONCLUSION
The District agrees with the Overlying Owners that there is no time limit on a request for Exchange Service or Augmented Service and the proposed Order has been amended to reflect that fact.
The District strongly objects to a reading of the Judgment that would require it to participate in an Annual Report process in perpetuity.
The District requests that the Court defer addressing the 500 AFY Augmented Service limitation until that matter is "ripe" for adjudication. The continuing jurisdiction of the Court stated in the proposed Order provides the Overlying Owners with the opportunity to bring this matter to the Court in the future, should it be necessary.
Date: July 17, 1998 HILL & SANDFORD, LLP
By: Russell R. Ruiz Attorneys for DefendantGOLETA WATER DISTRICT
SAFE WATER SUPPLIES ORDINANCE - 1991
Goleta Water District – Dec. 2005 (corrected) 70 Final Urban Water Management Plan
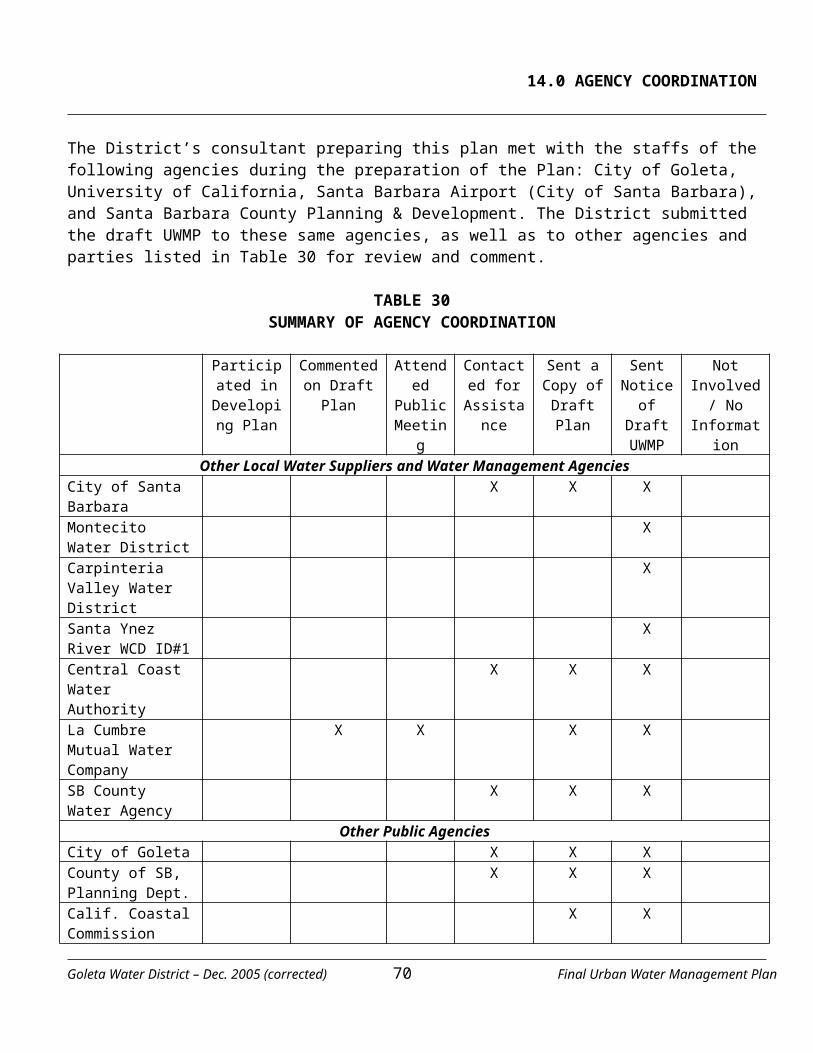
GOLETA WATER DISTRICT Ordinance No. 91-01
SAFE WATER SUPPLIES ORDINANCE
THE PEOPLE OF THE GOLETA WATER DISTRICT, COUNTY OF SANTA BARBARA, STATE OF CALIFORNIA, DO ORDAIN AND ENACT THE FOLLOWING ORDINANCE WHICH SHALL BE KNOWN AS THE SAFE WATER SUPPLIES ORDINANCE.
RECITALS:
Whereas, the Goleta Water District (District) faces a significant shortage of water to meet current sag-term water demands of its customers as determined by the State Department of Water Resources and the Santa Barbara County Flood Control and Water Conservation District in their 1985 Santa Barbara County Water Project Alternatives study, and
Whereas, a drought emergency was declared in Santa Barbara County is 1990 following four years of below normal precipitation within Santa Barbara County and, in the future, the District will continue to be subject to recurring drought cycles which will threaten the ability of the District to meet the health and safety needs of its customers unless new and diversified, long term water projects are developed: and
Whereas, the District relies exclusively on local water supplies to meet its current water demand, which supplies originate entirely within Santa Barbara County and which supplies are all subject to the same climatic conditions: and
Whereas, in the absence of a system limiting the District's authority to provide new and/or additional water service connections without first mandating groundwater storage of water in wet years for use in dry years (a "drought buffer program") District customers may face severe water shortage is the future: and
Whereas, on October t, 1990 the Board at Directors of the Goleta Water District adapted a Water Supply Management Plan which includes use of water supplies from both a desalting plant and the State Water Project: and
Whereas, the District is a party to an agreement with the Santa Barbara County Flood Control and Water Conservation District entitled "Water Supply Retention Agreement" dated December it, 1984 which it executed an June 28, 1986 (the "WSRA") entitling the District to 4560 acre feet per year from the State Water Project, and has executed amendments thereto: and
Whereas, the District is also a party to a "Contract for Preliminary Studies of Financial Feasibility, Preliminary Design and Environmental Review Under State Water Supply Contract" (the "Design and EIR Agreement") dated Jane 2, 1986 but did not identity itself as a proposed participant in the preliminary studies in response to the "Notice of Intent to Request Preliminary Studies" for the Coastal Branch and the Mission Hills Extension at the California Aqueduct given by the City of Santa Maria an or about May 24, 1986: and
Whereas, the WSRA and its amendments and the Design and SIR Agreement contain the ways and means to provide for a long term solution to the existing drought emergency and to the ongoing water shortage within the County of Santa Barbara: and
Whereas, the District has a duty to provide a permanent, reliable water supply to its residents,
NOW, THEREFORE, THE FOLLOWING ORDINANCE IS ENACTED INTO LAW:
I. Drought Buffer
1. In each year, commencing in the first year the State Water Project makes deliveries to the District, the District shall, after providing service to its existing customers, commit at least 2,000 acre feet of its water Goleta Water District – Dec. 2005 (corrected) 71 Final Urban Water Management Plan
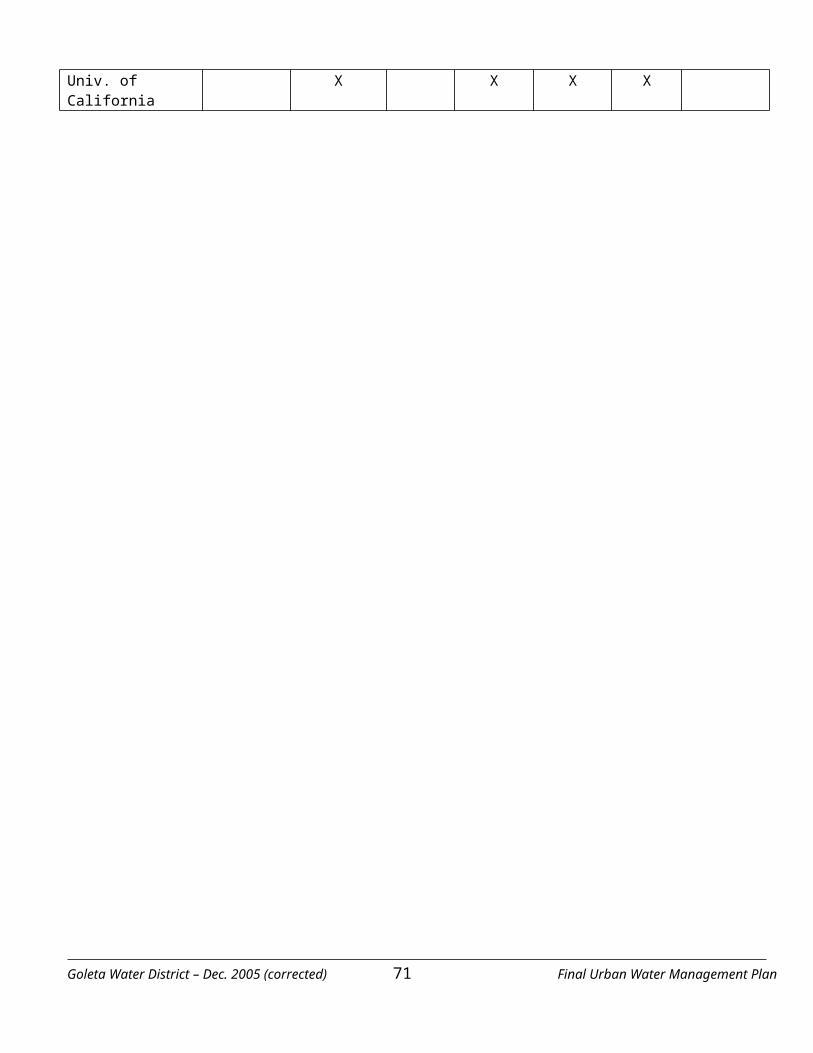
supply (the "Annual Storage Contribution") to the Goleta Central Basin either by direct injection or by reduction in groundwater pumping. The water so stored in the Central Basin shall constitute the District's "Drought Buffer."
2. The Drought Buffer may be pumped and distributed by the District only to existing customers and only in the event that a drought on the South Coast causes a reduction in the District's annual deliveries from Lake Cachuma. The Drought Buffer cannot, under any circumstances, be used by the District as a supplemental water supply to serve new or additional demands for water within the District.
3. Unless and until the Central Basin Water level rises to 100% of its 1972 levels, the District shall be required to make its Annual Storage Commitment. Thereafter, for so long as the District maintains the Central Basin at or above 1972 levels, the District may utilize the yield at the Central Basin to lower the cost of water service to existing customers.
II. Water Supply Distribution Plan
4. The District shall be forbidden from providing new an additional potable water service connections to any property not previously served by the District until all of the following conditions are met:
a. District is receiving 100% of its deliveries normally allowed from the Cachuma Protectb. The District has met its legal obligations required by the judgment in Wright v. Goleta Water
Districtc. Water rationing by the District is eliminatedd. The District has met its obligation to make its Annual Storage Commitment to the drought
buffer
5. For each year in which the conditions of paragraph 4, have been met, the Distinct shall be authorized to release 1% of its total potable water supply to new or additional service connections and if such new releases are authorized, me District shall permanently increase the sine of the Annual Storage Commitment made to the Drought buffer by 2/3 of the amount of any release for new or additional uses so that safe water supplies in times of drought shall not be endangered by any new or additional demands.
III. State Water Supply
6. Due to controversy concerning the physical ability of the State Water Project to deliver its full contractual commitments, District shall plan for delivery of only 2,500 acre feet per year as the amount at the firm new yield from the State Water Project. Any excess water actually delivered shall be stored in the Goleta Groundwater basin for use in drought.
7. The District shall immediately either (a) give Notice of its Intention to Request Construction of Described Protect Facilities under the State Water Contract, as provided for in Section 5(a)(1) of the WSRA or (b) respond to any such notice previously given by any other Contractor at provided for in Section 5(a)(2) of the WSRA that it wishes to participate in the described protect.
8. The Project Facilities to be constructed pursuant to the Notice of Intention shall be the Mission Hills and Santa Ynez Extensions of the Coastal Branch of the California Aqueduct and required water treatment facilities and other appurtenant facilities (herein the "Project Facilities").
9. The District agrees, pursuant to section 5(a)(2) of the WSRA, that the time for determination of participation and sizing of the Protect Facilities may be any date on or after September 1, 1991 agreeable to Goleta Water District – Dec. 2005 (corrected) 72 Final Urban Water Management Plan
the other participants.
10. The District shall, in the shortest time lawfully possible, exercise all of its rights and fulfill all of its obligations under the WSRA, including the payment of any monies requires thereunder.
11. The District shall file a Late Request to Amend, pursuant to Section 3(t) of the Design and EIR Agreement, and agrees to pay its proportionate share of all costs required by said Section 3(f) and any amounts required under Section 3(g) of said Design and EIR Agreement.
12. The District, or the Santa Barbara Water Purveyors Agency, or any other joint powers agency of which the District is a member or may became a member for such purposes, may issue revenue bonds ("bonds") from time to time in an amount not to exceed Forty-Two Million Dollars ($42,000,000.00) to provide funds to finance the District's pro rata share of the costs and expenses under the WSRA and the Design and EIR Agreement. Said bonds shall be used for the purposes of constructing the Project Facilities, including without limitation, any and all necessary facilities required for the delivery of State Project Water pursuant to the WSRA to the District through the Coastal Branch of the California Aqueduct, including any and all expenses incidental thereto or connected therewith, and shall include, without limitation, the cost of acquiring rights of way, the cost of constructing and/or acquiring all buildings, equipment and related personal and real property required to complete the Project Facilities, and the engineering, environmental review, inspection, legal and fiscal agent's fees, costs incurred by the District or joint powers agency in connection with the issuance and sale of such bonds, and reserve fund and bond interest estimated to accrue during the construction period and for a period not to exceed twelve (12) months after completion of construction, such bonds to be payable from the District's water revenues, to bear interest at a rate or rates not to exceed the legal maximum from time to time, and to mature in not more thus forty (40) years from the date of issuance
13. This Ordinance shall be submitted to a vote of the people of the Distinct is compliance with the requirements of Section 5(a)(4)(i) of the WSRA and pursuant to Elections Code Section 5201.
14. All actions taken pursuant to this Ordinance shall be in compliance with all local, state and federal environmental protection laws. Nothing in the Ordinance shall be construed to require such compliance prior to the election provided for herein.
15. This Ordinance shall ad liberally construed and applied in order to folly promote its underlying purposes. If any word, sentence, paragraph or section of this Ordinance is determined to be unenforceable by a court law, it is the intention of the District that the remainder at the Ordinance shall be enforced.
16. IF adopted, this ordinance shall be an amendment to the Responsible Water Policy Ordinance adopted by the people in May, 1973, and may not be modified except pursuant in the vote, of the electorate of the District. Ta the extent that the provisions of this ordinance conflict with that ordinance or any prior ordinance or measure previously enacted by the District on the voters of In u District. the provisions of this ordinance shall control. To the extent that the provisions of this Ordinance conflict with any other ordinance or measure adopted at the some election, the ordinance or measure receiving the highest number of affirmative votes shall control.
17. Nothing herein is intended to affect the rights at any parties nor the obligations of the District pursuant to the judgment is the action known as Wright v. Goleta Water District, Santo Barbara Superior Court Case No. SM57969
Goleta Water District – Dec. 2005 (corrected) 73 Final Urban Water Management Plan
18. This ordinance shall take effect immediately upon being approved by majority vote of the votes cast at the election.
AN AMENDMENT TO THE SAFE WATER SUPPLIES ORDINANCE – 1994
THE PEOPLE OF THE GOLETA WATER DISTRICT, COUNTY OF SANTA BARBARA, STATE OF CALIFORNIA, DO ORDAIN AND ENACT THE FOLLOWING ORDINANCE WHICH SHALL BE AN AMENDMENT TO THE SAFE WATER SUPPLIES ORDINANCE
RECITALS:
WHEREAS, the voters of the Goleta Water District ("District") enacted the SAFE Water Supplies Ordinance ("SAFE") in June, 1991 authorizing the participation by the District in the State Water Project and providing for the bond financing to develop the Project Facilities necessary for delivery of that water to the District: and
WHEREAS, the District is now a member of the Central Coast Water Authority, the members of which are cooperating collectively to develop the Project Facilities which are now under construction: and
WHEREAS, SAFE provides for the creation of a Drought Buffer of water stored in the Goleta groundwater basin to protect against future drought emergencies and a Water Supply Distribution Plan to protect the District's water supplies against new demands until deliveries from the State Water Project are available: and
WHEREAS, this proposed amendment to SAFE maintains all the provisions regarding the protection of water supplies provided by the Drought Buffer and the Water Supply Distribution Plan: and
WHEREAS, pursuant to provisions of the judgment in the lawsuit known as Wright v. Goleta Water District the District is required to develop a Water Plan to provide the necessary water supplies to achieve a balance between supply and demand for water within the District. The District's Water Plan is based on continuing to use the maximum amount of water available from the Cachuma Project; prudent management of the Goleta groundwater basin: use of the newly constructed wastewater reclamation protect to replace existing use of potable water for turf irrigation; a continuing water conservation planning effort: participation in the State Water Project; and the necessary level of commitment to a desalinated seawater project. As a result of the long-term water supply deficit in the District, the District has been operating under a water connection moratorium for over twenty years. Once fully implemented the District's Water Plan should provide adequate supplies to meet long-term water demand in the District; and
WHEREAS, the forty year water service contract with the United States Bureau of Reclamation for delivery of water from the Cachuma Project will expire in May 1995. Negotiations are currently under way to renew that contract, The Bureau of Reclamation has required that the Cachuma Project be subjected to an environmental review process which is now being undertaken, It appears likely that the District's yield from the Cachuma Protect after contract renewal will be less than the current yield as a result of the dedication of water for environmental enhancement purposes on the lower Santa Ynez River; and
WHEREAS, the Southern California Water Company is a Santa Barbara County water purveyor which currently holds rights to an entitlement to 3,000 acre feet per year of water from the Slate Water Project and has given notice of its intent to sell 2,500 acre feel of that entitlement. The Goleta Water District has identified itself as a potential purchaser of the entitlement. It is the intent of this Ordinance to authorize the
Goleta Water District – Dec. 2005 (corrected) 74 Final Urban Water Management Plan
acquisition and use of that entitlement; and
WHEREAS, the District estimates the annual cost of the Southern California Wafer Company entitlement to be S500 per acre-foot of water delivered to the District. The entitlement acquisition is intended to reduce the long-term costs of water to the District and its customers in that alternative supplies that would be available, and necessary to meet the District's long term demand would be more expensive than the water available from Southern California Water Company The District's cost analysis of the acquisition is available at the District office.
NOW. THEREFORE. THE FOLLOWING ORDINANCE IS ENACTED INTO LAW:
1. The District is authorized to secure an additional entitlement to the State Water Project in an amount up to 2,500 acre text per year, which is currently available from the Southern California Water Company. This entitlement will supplement the 4,500 acre-feet per year authorized by the voters in originally adopting the SAFE Water Supplies Ordinance. This authorization shall provide for the payment of all costs of the acquisition and use of any additional entitlement acquired. Due to the controversy concerning the physical ability of the State Water Protect to deliver its full contractual commitments, the District shall plan for the delivery of 3,800 acre feet per year of water as the amount of firm average long-term yield. The Districts total State Water Protect entitlement includes the basic entitlement of 4,500 acre feet per year, the District's share of the drought buffer held by the Central Coast Water Authority and the entitlement acquired pursuant to this authorization. Any excess water actually delivered over 3,800 acre feet per year shall be stored in the Goleta Groundwater Central basin until the basin is replenished to its 1972 level, for use during drought conditions.
2. Enactment of this Ordinance shall comply with all applicable law, including the California Environmental Quality Act.
3. If adopted, this Ordinance shall be an amendment to the SAFE Water Supplies Ordinance adopted by the electorate in June 1991, which amended and superseded the Responsible Water Policy Ordinance, originally adopted by the electorate in 1973. Paragraph 1 of this Ordinance shall amend and fully supersede paragraph 6 of the SAFE Water Supplies Ordinance. All other provisions of the SAFE Ordinance shall remain in full force and effect. It adopted, this Ordinance may not be modified except pursuant to a vote of the electorate of the District.
4. This Ordinance shall be liberally construed and applied in order to fully promote its underlying purposes. If any word, sentence, paragraph or section of this Ordinance is determined to be unenforceable by a court of law, it is the intention of the District that the remainder of the Ordinance shall be enforced.
Goleta Water District – Dec. 2005 (corrected) 75 Final Urban Water Management Plan
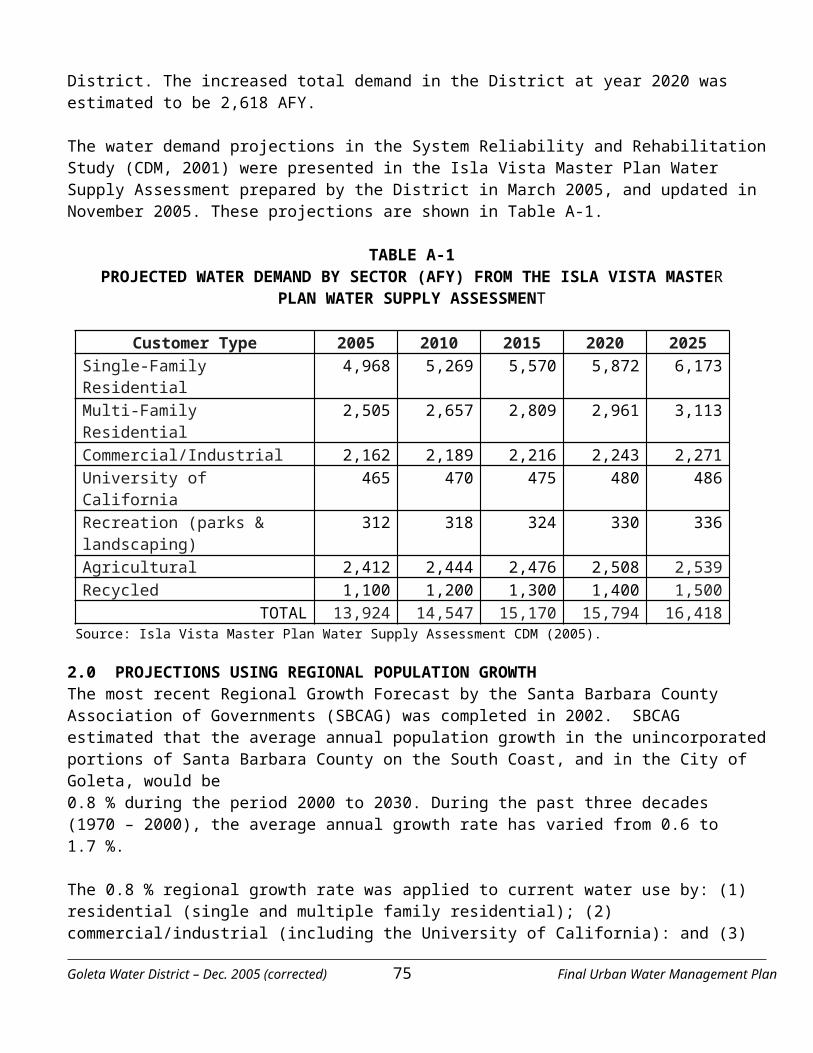
APPENDIX C
C-1 CUWCC BMP ACTIVITY REPORTS FOR 2001-2004 C-2 CUWCC COVERAGE REPORTS FOR 2003-2004
C-3 CUWCC COVERAGE CALCULATOR FOR THE DISTRICT C-4 ORDINANCE 91-3
C-1 CUWCC BMP ACTIVITY REPORTS FOR 2001-2004Will be included in final PDF and Printed versions.
C-2 CUWCC COVERAGE REPORTS FOR 2003-2004Will be included in final PDF and Printed versions.
C-3 CUWCC COVERAGE CALCULATOR FOR THE DISTRICTWill be included in final PDF and Printed versions.
C-4 ORDINANCE 91-3
ORDINANCE NO. 91-3
AN EMERGENCY ORDINANCE OF THEBOARD OF DIRECTORS OF GOLETA WATER DISTRICT
MODIFYING THE ADMINISTRATION OF WATER ALLOTMENT POLICIES
BE IT ORDAINED BY THE BOARD OF DIRECTORS OF GOLETA WATER DISTRICT as follows:
Section 1. Purpose and Scope
This ordinance adopts regulations to deal with the water shortage emergency which the Board has found to exist. These regulations are effective immediately and shall be effective until the Board finds that the drought-induced water shortage no longer exists.
Section 2. Findings
This Board finds, determines and declares that the following facts are true:1. This Board has conducted a noticed public meeting on May 28, 1991 to determine whether a
drought induced water shortage emergency exists and, if so, what regulations should now be adopted in response to that shortage.
2. This Board finds that the demand for water by District customers can be met during water year 1991-92, but only so long as the actual consumption of water remains at a level close to that
Goleta Water District – Dec. 2005 (corrected) 76 Final Urban Water Management Plan
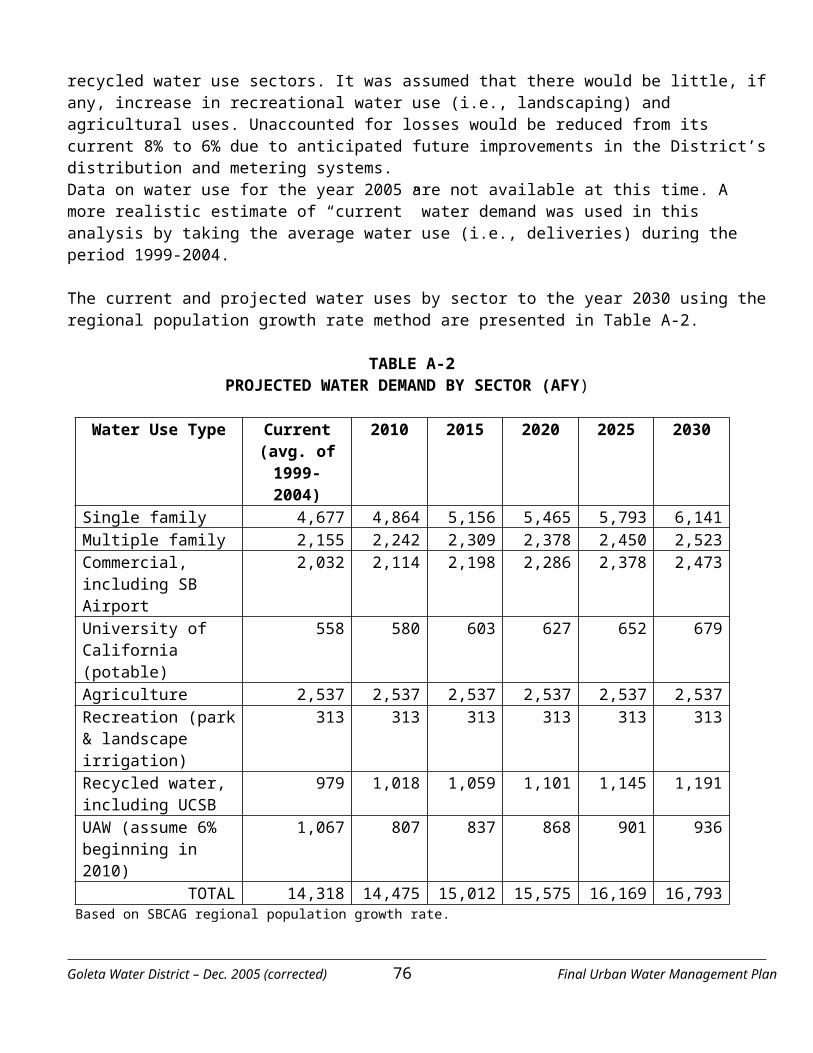
experienced during 1990-91. If, instead, water consumption now returns to the unrestricted level of use that existed before the current drought began, the District will face a substantial shortage.
3. To avoid that shortage, this Board adopts the following regulations, and finds that the regulations set forth herein are necessary and proper to protect the water supply for human consumption, sanitation, and fire protection during the duration of the shortage.
Section 3. Definitions
The following terms are defined for the purposes of the ordinancea. "Customer" means a person receiving water from the water distribution system of the District.b. "District" means Goleta Water District.c. "General Manager" means the general manager of the District, or the Manager's designated. "Seasonally adjusted average annual usage" means the amount of water delivered to each
customer's property during the bimonthly period's from January 1, 1984 to December 31, 1988.
Section 4. Prohibition of Certain Uses
a. No customer shall waste water. As used herein, the term "waste" means:1. Use of potable water to irrigate grass, lawns, ground-cover, shrubbery, crops, vegetation, and
trees between the hours of 10:00 A.M. and 4:00 P.M. or in such a manner as to result in runoff for more than five 5 minutes;
2. Use of potable water to wash sidewalks, walkways, driveways, parking lots, open ground or other hard surfaced areas by direct application;
3. Allowing potable water to escape from breaks within the customer's plumbing system for more than eight hours after the customer is notified or discovers the break.
b. The General Manager may allow potable water to be used for irrigation for commercial nurseries or farms between the hours of 10:00 A.M. and 4:00 P.M.
Section 5. Limits on Certain Uses
a. The following classes of use are hereby created:1. "Single family residential" which consists of water service to land improved with structures
designed to serve as a residence for a single family.2. "Multiple family residential" which consists of water service to land improved with structures
designed to serve as a residence f or more than a single family.3. "Nonresidential" which consists of water service to land improved with structures designed to
serve for other than residential uses. Commercial, recreational, charitable, agricultural and cultural uses are included within this class.
4. "Contractual" which consists of water service to La Cumbre Mutual Water Company, the University of California at Santa Barbara, and the City of Santa Barbara pursuant to contracts with each of these entities.
b. Water use in excess of the monthly amounts established below shall be subject to a charge at an increased rate in accordance with Section 7. herein:1. Each customer in the single family residential class shall receive no more than 11 hundred
cubic feet (HCF) per monthly period plus 55% of the seasonally adjusted average usage in excess of 11 HCF.
Goleta Water District – Dec. 2005 (corrected) 77 Final Urban Water Management Plan
2. Each customer in the multiple family residential class shall receive no more than 7 HCF per billing period plus 40% of the seasonally adjusted average annual usage in excess of 7 HCF.
3. Each customer in the nonresidential class shall receive during each monthly period no more than 85% of the seasonally adjusted average annual usage.
4. Each commercial account used only for ornamental landscaping shall receive 55% of the seasonally adjusted average annual usage.
5. Each customer in the contractual class shall receive during a monthly billing period no more than 85% of the seasonally adjusted average annual usage.
c. The General Manager shall classify each customer and calculate each customer's allotment. The allotment shall reflect seasonal patterns. Each customer shall receive notice of the allotment specified above, or as modified in accordance with Section 6. herein, on each monthly billing for service. Each new customer not already in receipt of an allotment in accordance with previous ordinance No. 90-2, shall be notified of the General Manager's determination by first class mail within 30 days of the commencement of water service.
d. Any customer may contest the General Manager's classification on the basis of use or the General Manager's allotment on the basis of hardship or incorrect calculation. Appeals shall be processed as set forth below.
Section 6. Appeals
a. Any person who wishes to appeal the classification or allotment shall do so in writing by using the forms provided by the District and submitted to the General Manager, or the Manager's designate.
b. If the General Manager and the applicant are unable to reach accord, then the appeal shall be heard by the Resource Management Committee of the Board of Directors with a recommendation for approval or denial.
c. All appeals shall be reported monthly to the Board of Directors as a part of the Water Supply Report.
Section 7. Water Use Subject to Increased Charge
A urban customer who exceeds the allotment established in conformance with Section 5. or 6. herein for any monthly period shall pay for the water consumed in excess of the allotment at a unit rate established from time to time by resolution of this Board of Directors.
An agricultural, recreational or reclamation customer who exceeds the allotment established in conformance with Section 5. or 6. herein for any annual period shall pay for the water consumed in excess of the allotment at a unit rate established from time to time by Resolution of this Board of Directors.
Section 8. Rule Making
The General Manager shall present periodical reports to the Board concerning the effectiveness of this ordinance, including a report within four months of the date of adoption of this ordinance concerning the first 3 months of ordinance administration. Said Reports shall review the nature and scope of appeals and exceptions. The Board shall periodically consider the adoption of rules implementing this ordinance in light of the Manager's reports. Such rules shall be adopted by the Board by resolution and shall deal with the Goleta Water District – Dec. 2005 (corrected) 78 Final Urban Water Management Plan
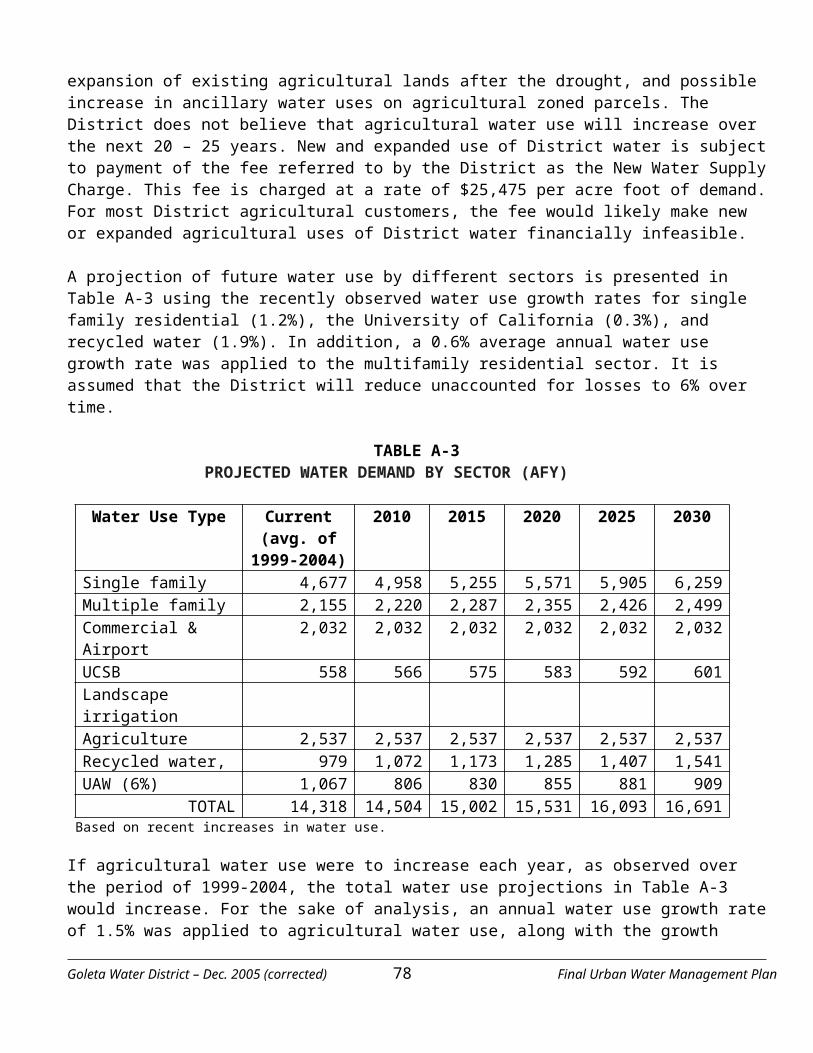
administration of this ordinance. Any proposal to change the meaning of this ordinance shall be adopted by the Board by ordinance following a duly-noticed public hearing.
Section 9. Urgency
This ordinance is an urgency ordinance. It is necessary that the regulations set forth in this ordinance be adopted as .set forth herein in order to protect the supply of water for human consumption, sanitation and fire protection.
Section 10. Miscellaneous
Ordinance No. 90-2 is hereby repealed on the effective date of this ordinance.
Goleta Water District – Dec. 2005 (corrected) 79 Final Urban Water Management Plan
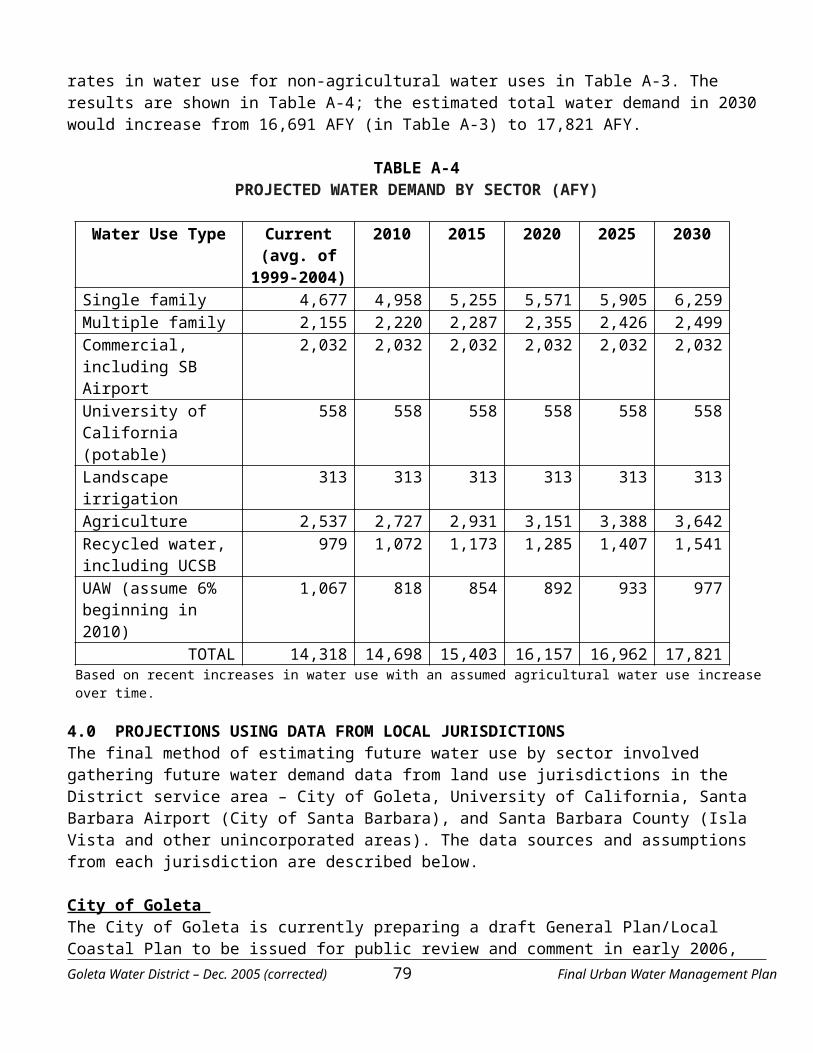
Appendix DRelevant Sections from the Goleta Water District’s System Reliability Report
Relevant Sections from the Goleta Water District’s System Reliability Report
Section 7System Reliability Evaluation
Section 6 addressed the water infrastructure needs for normal operations of the year 2000 and 2020 distribution systems. This section reviews the potential impacts of water supply emergencies and droughts on the District's water supply and water distribution system.
7.1 Description of Emergency and Drought Scenarios
Earthquakes, landslides, floods and other natural events can impact water treatment and conveyance facilities, potentially disrupting water service for an extended period of time. In addition to emergencies caused by natural disasters, water supply and distribution systems can also be impacted by normal flood and drought cycles. Eight emergency/ drought scenarios have been identified to assess how such events could impact the District's water supply and distribution system. Five emergency scenarios have been identified for the purposes of planning for events, which could impact 20 percent or more of the District's customers. Three drought scenarios have also been identified. A summary of each of these scenarios is provided below.
Scenario 1 - Loss of Coastal Branch pipeline (loss of State Project water). Failure of the Coastal Aqueduct or other State Water Project facilities would reduce the District's available water supply by 4,500 AFY. During such an event, it is assumed that the District would receive water from Lake Cachuma and the District wells, and that water would not be available from the City of Santa Barbara interconnections, as the City would be facing a similar water supply emergency. For planning purposes, it is assumed that such an emergency would last for up to 2 months.
Scenario 2 - Loss of Tecolote Tunnel (loss of State Project and Cachuma water). Failure of the Tecolote Tunnel would result in a loss of both State Project and Lake Cachuma water, reducing the District's available water supply by 13,421 AFY. During this scenario, the only available water supply would be the District's groundwater wells. This emergency scenario is assumed to have 4-month duration.
Scenario 3 - Loss of the 42-inch Lateral. The 42-inch lateral is one of the District's two main supply pipelines, delivering water from the Corona Del Mar WTP and Reservoir to the central and east portions of the District. A break in this pipeline would impede the District's ability to move water through the distribution system. For planning purposes, it is assumed that repair of the 42-inch Lateral could take up to 2 months.
Scenario 4 - Loss of the Glen Annie Lateral. The Glen Annie Lateral is the District's second main supply pipeline, delivering water from the Corona Del Mar WTP and the Ellwood Reservoir to the west portion of the water distribution system. It is assumed that the Glen Annie Lateral could require
Goleta Water District – Dec. 2005 (corrected) 80 Final Urban Water Management Plan
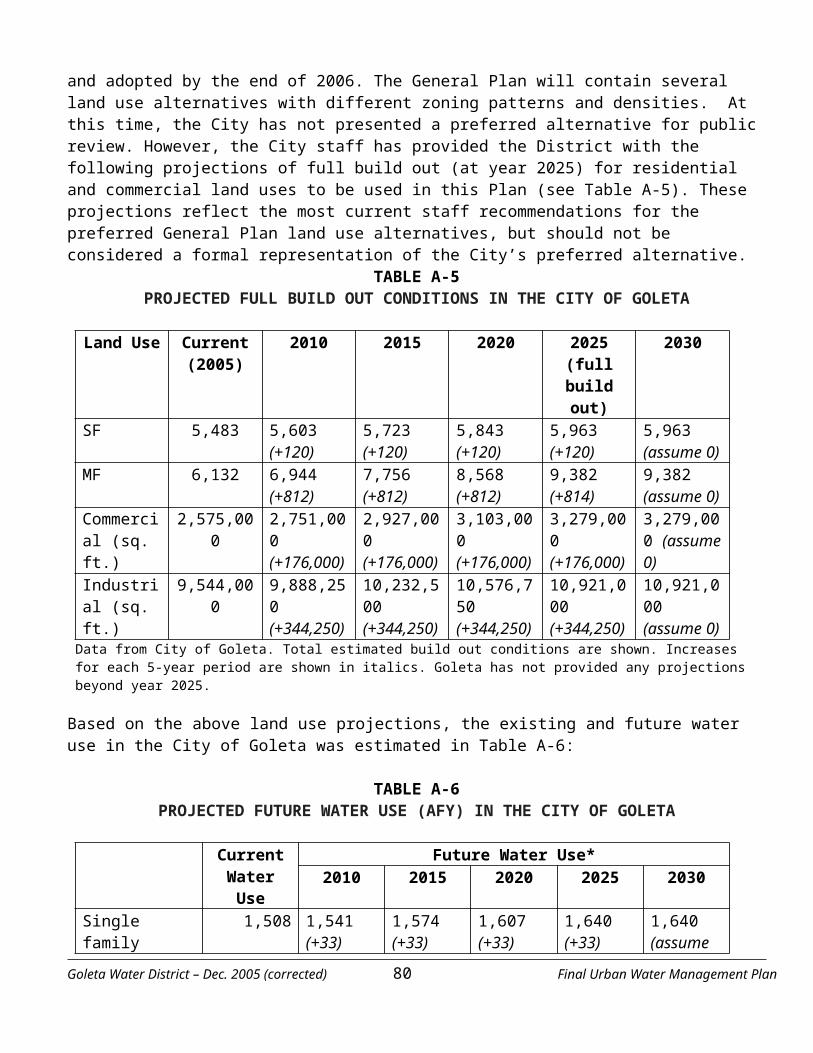
up to I month to repair.
Scenario 5 - Loss of the Corona Del Mar Water Treatment Plant. With the groundwater wells currently offline, the Corona Del Mar WTP is the District's sole potable water source. In the event of a major process failure, fire or severe earthquake, water service from the treatment plant could be interrupted. During such a scenario, it is assumed that the District would utilize its groundwater wells and interconnections with the City of Santa Barbara for water supply. It is assumed that the treatment plant could be offline for up to I month.
The potential drought scenarios include:
Scenario 6 - State Project water cutbacks. During a drought or because of other environmental considerations, the State Water Project could cutback its deliveries of water. These cutbacks are calculated based on the District's State Water Project entitlement of 7,000 AFY.
Scenario 7- Cachuma water cutbacks. Cachuma water supplies are currently being assessed based on a 25,714 AFY yield agreed upon by the COMB member agencies. The District is entitled to 9,421 acre-feet of water in normal water years, that is, when Cachuma storage levels are above 100,000 acre-feet. This 9,421 AFY entitlement includes 100 AFY transferred annually from TD Bishop (Camino Real Shopping Center) in exchange for service. When water levels drop below the 100,000 acre-foot threshold, water deliveries to the member agencies will be cutback.
Scenario 8 - State Project and Cachuma water cutbacks. This scenario addresses the potential for cutbacks of SWP and Cachuma water supplies to occur concurrently.
The last scenario addresses the potential loss of the District's groundwater wells.
Scenario 9- Loss of Groundwater Wells. The District's groundwater supply could be interrupted on a long-term basis due to degradation in the groundwater extraction capacity or water quality, or changes in regulatory requirements for groundwater quality. Service could also be interrupted on a short-term basis due to loss of power, equipment failure, etc.
7.2 Existing System Reliability
A measure of system reliability is its ability to contend with water supply emergencies and droughts. One way to gage this ability is by the level of service (LOS) provided during such events. For the purpose of this study, LOS is defined as the ratio of the water supply capacity during an emergency or drought scenario to the total water demand.
Goleta Water District – Dec. 2005 (corrected) 81 Final Urban Water Management Plan
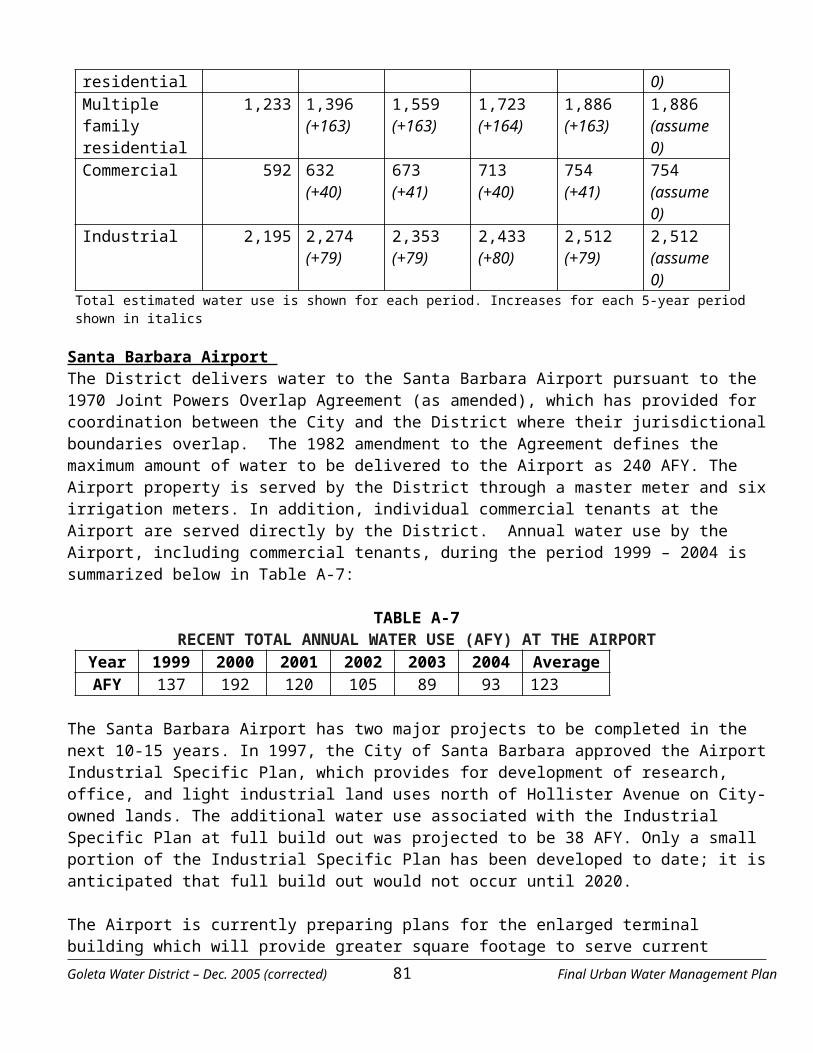
Appendix EBOARD ADOPTION RESOLUTION
NOTICE OF PUBLIC HEARING
BOARD ADOPTION RESOLUTIONBOARD OF DIRECTORS
GOLETA WATER DISTRICTSPECIAL MEETING
MINUTESDECEMBER 15, 2005
The special meeting of the Board of Directors of the Goleta Water District was held at 4699 Hollister Avenue, Goleta, California on December 15, 2005.
CALL TO ORDER: President Evans called the meeting to order at 7:00 p.m.
ROLL CALL: Directors present - Cunningham, De Witt, Evans, Mills, Rogers
ALSO PRESENT WERE: Kevin Walsh, General Manager/Chief Engineer; Russell Ruiz, General
Counsel; Marie Zeman, District Secretary.
PUBLIC INPUT: Mr. Jack Ruskey asked when the Ag rate study will be regenerated.
ITEM 1 APPROVAL OF THE URBAN WATER MANAGEMENT PLAN (UWMP)
Manager of Environmental Services at URS Corporation, Mr. John Gray, PhD and consultant to the District presented the final UWMP for Board approval. The State passed a law that all water districts of a certain size prepare an UWMP. The plans are prepared every five years and the primary purpose is to ensure the responsibility of managing water; therefore, becoming eligible for drought assistance, other programs relating to water conservation and loans and grants. The UWMP needs to be submitted to the State at the end of December from all Water Districts. The plans will be reviewed for completeness and will inform the District if the plans meets the requirements.
After a lengthy review and discussion of the UWMP by the Board, amendments were made to the final plan. Mr. Gray stated that the amendments would be made and would deliver the final plan to the District before the deadline.
The following individuals spoke on this item making suggestions to modify the plan.Ms. Cecilia BrownMr. Bert BertrandoMr. Jack RuskeyDirector Cunningham thanked the three speakers for their suggestions.
ACTION: Director Rogers moved to approve the Final Urban Water Management Plan for the Goleta Water District as modified. Second Director Cunningham.
PASSED: Ayes: Directors Cunningham, De Witt, Evans, Mills, RogersNay: NoneAbstain: NoneAbsent: None
Goleta Water District – Dec. 2005 (corrected) 82 Final Urban Water Management Plan
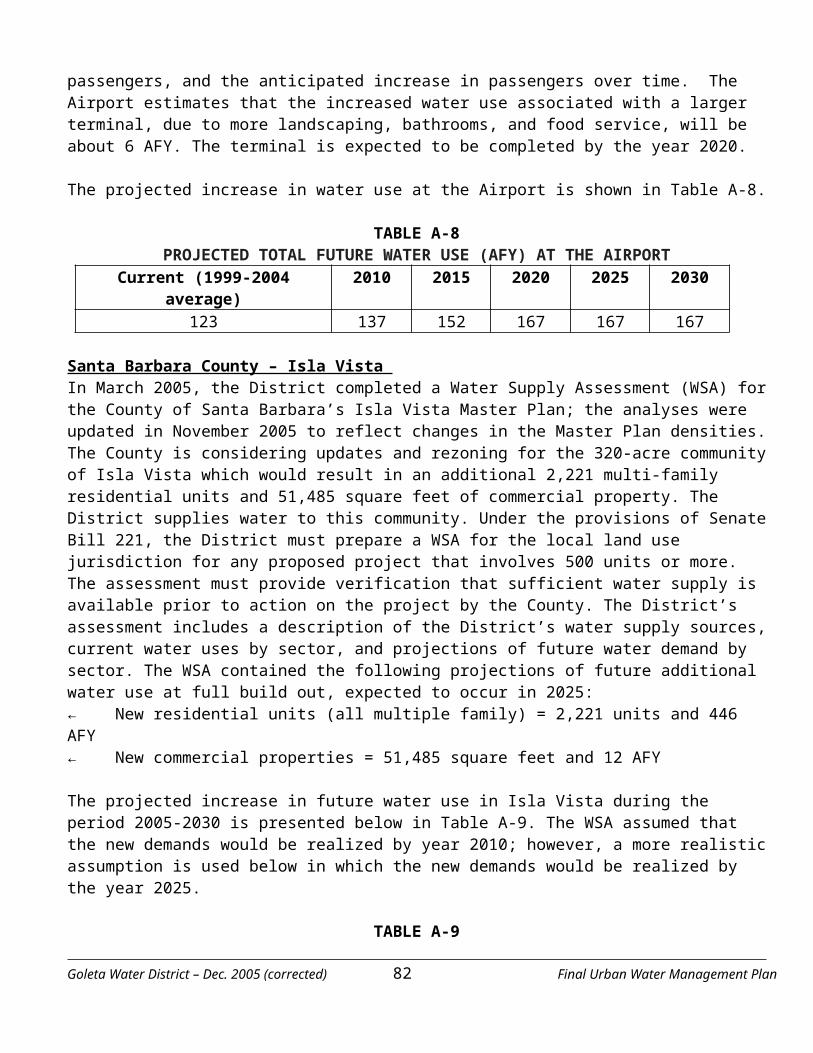
The meeting was adjourned at 8:15 p.m.
DATED: 1-12-06 MINUTES PREPARED BY: MARIE E. ZEMAN, DISTRICT SECRETARYDATE APPROVED: 1-10-06
ATTEST:MARIE E. ZEMAN, DISTRICT SECRETARY CHUCK EVANS, PRESIDENT
NOTICE OF PUBLIC HEARING
GOLETA WATER DISTRICT PUBLIC NOTICEOF MEETINGS TO REVIEW AND APPROVE THE NEW DRAFT
URBAN WATER MANAGEMENT PLAN
The Goleta Water District will be convening two meetings to review the new Draft Urban Water Management Plan ("Draft Plan"). A workshop meeting will be held on November 22, 2005 at 7 p.m. at the Holiday Inn, 5650 Calle Real, Goleta and the Board of Directors will convene a Board meeting to consider approving the Plan an December 15, 2005, 7 p.m. in the Board Room at the District office at 4699 Hollister Avenue, Goleta.
The Draft Plan will be available on the District website as of November 11, 2005, at www.goletawater.com For these without internet service, a copy of the Plan will be available at the District's customer service desk for review. The public is invited to provide written comments to the Draft Plan prior to the meetings. Please address comments to Goleta Water District, attn. Marie Zeman, District Secretary, 4699 Hollister Avenue, Goleta, CA 93110-1999. Public input will also be invited at bath meetings.
Goleta Water District – Dec. 2005 (corrected) 83 Final Urban Water Management Plan