Microsoft PowerPoint - Aspen Institute
10
Evaluating a University’s Effectiveness in Preparing New Teachers to Maximize Learning by All K-12 Students Public Testimony to the NCLB Commission King Alexander, President California State University, Long Beach October 28, 2009
Transcript of Microsoft PowerPoint - Aspen Institute

Evaluating a University’s Effectiveness in
Preparing New Teachers to
Maximize Learning by All K-12 Students
Public Testimony to the NCLB Commission
King Alexander, President
California State University, Long Beach
October 28, 2009

From Their Universities, Newly-Prepared Teachers
Fan-Out in All Directions . . .
CSULB
Slide 1

From Schools, Universities Can
Get Reliable, Valuable Feedback . . .
CSULBEvents
Slide 2
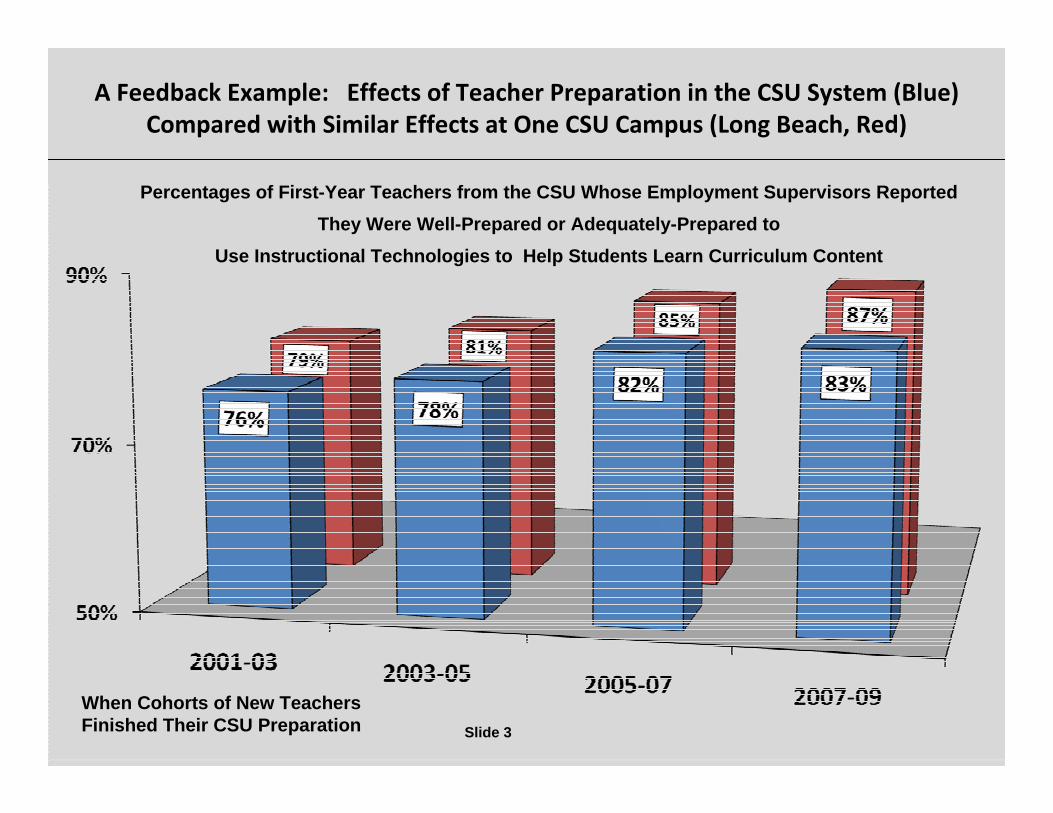
A Feedback Example: Effects of Teacher Preparation in the CSU System (Blue)
Compared with Similar Effects at One CSU Campus (Long Beach, Red)
Percentages of First-Year Teachers from the CSU Whose Employment Supervisors Reported
They Were Well-Prepared or Adequately-Prepared to
Use Instructional Technologies to Help Students Learn Curriculum Content
When Cohorts of New Teachers Finished Their CSU Preparation Slide 3

A Second Example: Profiling a University’s Effectiveness
Across Distinct Domains of Effective Teaching
Percentages of First-Year Teachers from a CSU Campus Whose Employment Supervisors Reported
They Were Well-Prepared or Adequately-Prepared for
Seven Major Responsibilities of Teachers (Defined Below)
Slide 4

Advantages and Limitations of
Judgments by Professional Educators as
Evidence of a University’s Effectiveness
► Judgments of New Teachers are Readily Available to
Universities.
► Judgments of Site-Based Leaders are Somewhat More
Difficult, But Generally Available to Universities.
► Judgments are Relatively Inexpensive to Obtain.
► Judgments Reflect the Views of Knowledgeable
Observers of a University’s Effectiveness.
► Judgments Do Not Directly Measure a University’s
Effectiveness in Value-Added Student Achievement.
Slide 5

Direct Measurement of a University’s
Value-Added Effectiveness in
Promoting Academic Proficiency by All K-12 Students
� CSU has assembled extensive information about preparation
options that many new teachers experienced in the university.
� CSU’s partner school districts have provided academic records of
K-12 students linked to the records of CSU’s teaching graduates.
� CSU is assembling longitudinal records on a student-by-student
basis to assess the value-added effects of CSU-prepared teachers.
� CSU and partner districts are assiduously protecting the privacy of
all teachers and all students while keeping all records secure.
Slide 6

An Illustration of What a Value-Added Analysis of
Teacher Preparation Could Potentially RevealTarget Population: 31,907 Students Who Were Not Measured to be Proficient in Mathematics Prior toBeing Taught by First-Year Elementary Teachers from the CSU During the Period from 1999 Through 2007.Of Students in this Population at Each Grade Level, the Percentage Who Became Proficient in Mathematics andWhose Teachers Completed the Equivalent of . . .
Light Green: Less than 4 Semester Units in Math and No Units in Elementary Math Teaching Methods.
Medium Green: 4 to 7 Semester Units in Math and 1 or 2 Units in Elementary Math Teaching Methods.
Dark Green: 8 or More Semester Units in Math and 3 or More Units in Elementary Math Teaching Methods.
Slide 7

An Illustration of What the California State University System
Could Potentially Learn from a Value-Added Analysis of Teacher Preparation
Target Population: 19,652 Students Measured to be Proficient in Reading for the First Time When Taught byFirst-Year Elementary Teachers from the CSU During the Period from 1999 Through 2007.
Blue = At Each Grade-Level, the Percentage of Students in the Target Population Taught by CSU TeachersWho Earned Their Teaching Credentials at CSU Campuses A, B, C and D.
Green = At Each Grade-Level, the Percentage of Students in the Target Population Taught by CSU TeachersWho Earned Their Teaching Credentials at CSU Campuses 1, 2, 3 and 4.
Slide 8

CSU Contributors:
• King Alexander, President
California State University, Long Beach
• Beverly Young, Assistant Vice-Chancellor
Teacher Education and Public School
Programs
• David Wright, Director
CSU Center for Teacher Quality
Slide 9


![New Microsoft PowerPoint Presentation.ppt [Read …media.mycrowdwisdom.com.s3.amazonaws.com/aaop/Resources/...Microsoft PowerPoint - New Microsoft PowerPoint Presentation.ppt [Read-Only]](https://static.fdocuments.us/doc/165x107/5f798734ccfe2c3952073dc2/new-microsoft-powerpoint-read-mediamycrowdwisdomcoms3amazonawscomaaopresources.jpg)