Microsoft Power BI Sample Dashboards · Slide 1 Confidential Move your business forward. Business...
35
Slide 1 Confidential Move your business forward. Business Intelligence using Power BI Solution examples
Transcript of Microsoft Power BI Sample Dashboards · Slide 1 Confidential Move your business forward. Business...

Slide 1 Confidential
Move your business forward.
Business Intelligenceusing Power BI
Solution examples

Slide 2 Confidential
About Us
We transform business processes,
decisions and outcomes with innovative
digital solutions and services

Slide 3 Confidential
Services & SolutionsData. Analytics. Cloud. Automation. Workflows. Integration. App dev. Managed services.
Leverage data to transform processes
“Intelligent” and cognitive business processes
Analytics-driven Automation
Automation of workflows and business processes driven by
data insights
Scalability & Resilience of the Cloud
Cloud platform based solutions that offer scalability and
extensibility of the solutions
Shared
Services
Platform
Solutions
• Infrastructure Managed Services • Application Support & Managed Services • Database Support & Management
• Project Management • Architecture & Advisory • Business Analysis • Testing & Quality Control
• Live Ink Character Recognition • Healthcare Analytics • Internal Audit • Risk & Compliance
• Data Management (ETL, MDM, Governance) • Data Analysis (Predictive, Cognitive, Machine Learning) • Integration

Slide 4 Confidential
Industry Experience (highlights)Diversity of experience and effective cross-pollination of ideas and solutions
Cross-vertical Solutions
• Sales Automation
• Order 2 Cash
• CRM
• Data Integration
• Workflow Automation
• Collaboration
• Cloud Migration
• Infrastructure Transformation
• Project/Portfolio Management
• Managed Services

Slide 5 Confidential
Core CapabilitiesSolving complex business problems with information technology
Business Insights
Whether on the cloud or on-premise, our teams can redefine your infrastructure on the latest technologies
This along with SLA driven support engagements guarantees worry-free IT
Infrastructure Transformation
Insights from enterprise data using advanced analytics
Automate business process workflows to enhance decision making and business process efficiencies
Application Innovation
Maximize the use of emerging and “Digital” technologies
Visualization & User Experience
Craft innovative user experiences with creative application designs and user interfaces
Enhance business intelligence with data driven dashboards and reports
We go beyond “technology platforms” to create “technology ecosystems”; where data flows seamlessly
through “intelligent” business processes; spurred-on by empirical data driven analytics

Slide 6 Confidential
Enterprise Financial ReportsComprehensive and rich-interactive reports that outline the financial
status of an enterprise. Analysis routines perform automated reviews of
the general ledger and other financial details for the enterprise which is
then visualized using appropriate dashboards and reports.
Slide 7 Confidential
Enterprise View
− Comprehensive view
of all related financial
parameters for an
organization
− Visual indicators for an
intuitive view into the
KPIs
Slide 8 Confidential
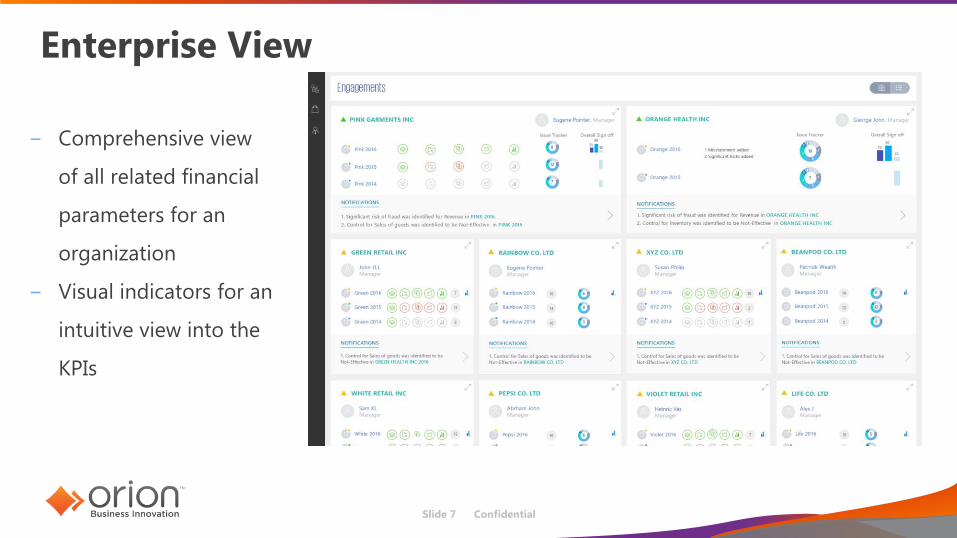
Drill down view into Financial Statements
− Individual sections on
a customized view into
the various areas of
interest
− Can be exported to
PPT and other formats
for distribution
Slide 9 Confidential
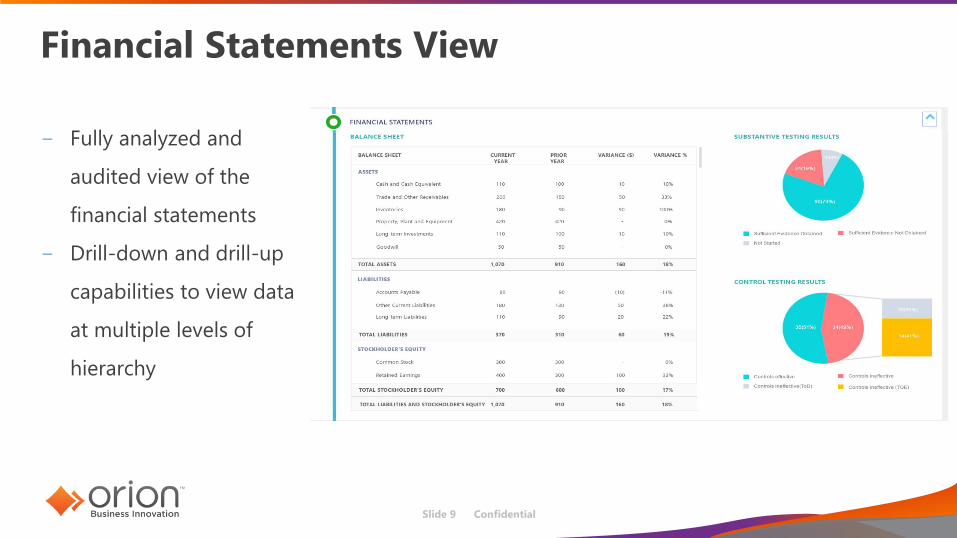
Financial Statements View
− Fully analyzed and
audited view of the
financial statements
− Drill-down and drill-up
capabilities to view data
at multiple levels of
hierarchy
Slide 10 Confidential
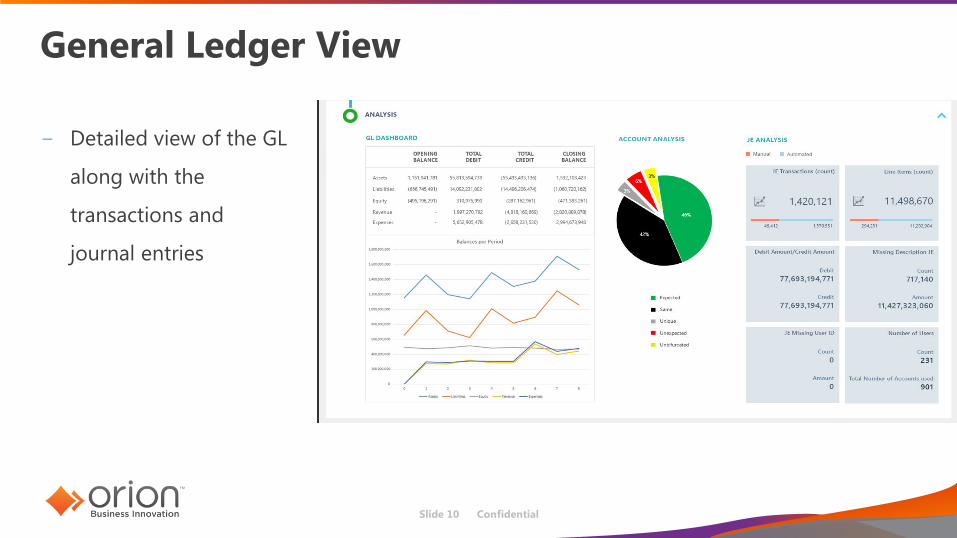
General Ledger View
− Detailed view of the GL
along with the
transactions and
journal entries

Slide 11 Confidential
Journal Entry Analysis
Journal Entry Analysis dashboard provides powerful drill-down
capabilities enabling audit teams to perform journal entry analysis
over 100% of the entity’s journal entry population to identify
potentially higher risk journal entries, highlight patterns and trends,
and screen journal entries using pre-defined or tailored risk
scenarios.
Slide 12 Confidential
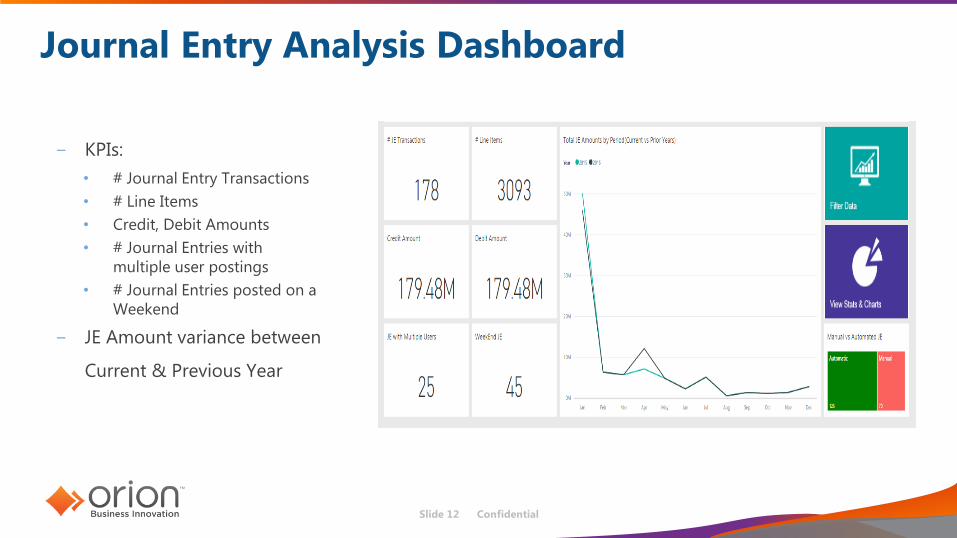
− KPIs:
• # Journal Entry Transactions
• # Line Items
• Credit, Debit Amounts
• # Journal Entries with
multiple user postings
• # Journal Entries posted on a
Weekend
− JE Amount variance between
Current & Previous Year
Journal Entry Analysis Dashboard

Slide 13 Confidential
− Concentration of Automatic &
Manual Journal Entries
− Top 5 users (Based on # of
Postings)
− Comparison of total Journal
Entry amount between current
and previous year
Journal Entry Analysis Dashboard

Slide 14 Confidential
− Manual & Automated
Journal Entry distribution by:
• Period
• User
− Time series Analysis on
Manual posting between
current & previous years
Journal Entry Analysis Dashboard

Slide 15 Confidential
− The charts can be sliced
based on:
• Manual Vs Automated
• Period
• Postings
• Amount
Journal Entry Analysis Dashboard

Slide 16 Confidential
Journal Entry Analysis Dashboard
− Manual & Automated Journal
Entry distribution by:
− Time series Analysis on Manual
posting between current &
previous years
Slide 17 Confidential
Program (and portfolio) ManagementInteractive dashboards used to track timelines, budget and tasks in
order to focus on meeting the organization goals. Also track
resource utilization and resource availability based on the skillsets
and other parameters within the enterprise.

Slide 18 Confidential
KPIs of resources, Projects &
Programs:
− Total Head count is shown
− Total Programs is shown
− Total Projects is shown
− Head count distribution is
shown geographically
− Pattern for Hires Vs
Separations
Program and Portfolio Management Dashboard

Slide 19 Confidential
Report Landing Page :
− Associates View by:
• Designation
• Division
• Experience
• Location
− The Bubble chart shows the
burned hours, budgeted
Program and Portfolio Management Dashboard

Slide 20 Confidential
Active Associates Details:
− Shows the details about the
Active Associates
− Resources allocation along
the projects are also plotted
Program and Portfolio Management Dashboard

Slide 21 Confidential
Associate Details:
− Split up of resources by
Division.
− Associates viewed by:
• Overall Experience
• Organizational Experience
− Distribution of associates
among projects by roles
Program and Portfolio Management Dashboard
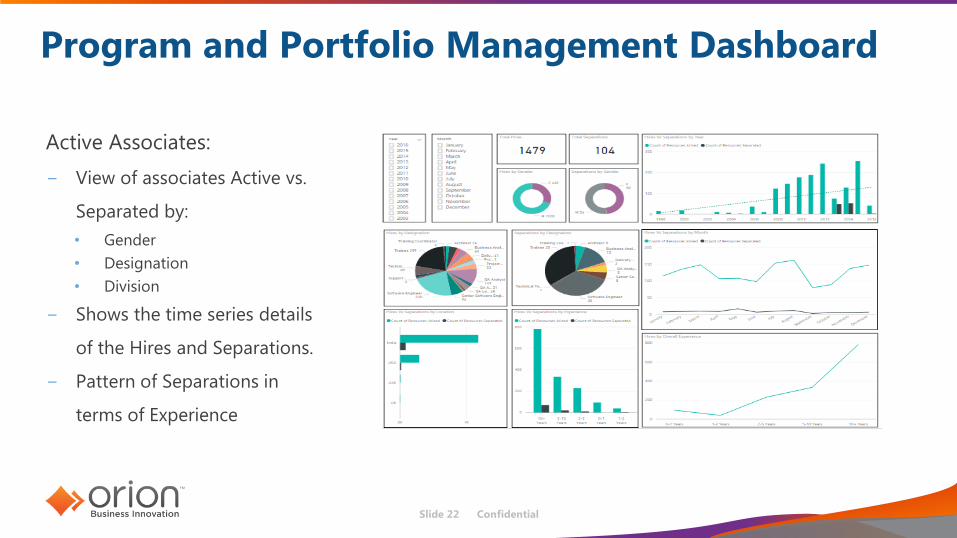
Slide 22 Confidential
Active Associates:
− View of associates Active vs.
Separated by:
• Gender
• Designation
• Division
− Shows the time series details
of the Hires and Separations.
− Pattern of Separations in
terms of Experience
Program and Portfolio Management Dashboard

Slide 23 Confidential
Skills Matrix Details:
− Available Skills and
Distribution along:
• Associates
• Designation
− Skills and Rating along the
Associates.
− Skill set available by Project
Program and Portfolio Management Dashboard

Slide 24 Confidential
Project Details:
− KPIs that shows the solid count of:
• Portfolio
• Program
• Project
− Time distributed, Actual and Allocated.
− Associate distribution among the Portfolio.
− Technology Strength.
Program and Portfolio Management Dashboard
Slide 25 Confidential
Sales Dashboards
Sales dashboard is used to track sales and CRM KPIs and metrics
using interactive and meaningful insights using intuitive graphics
such as charts, gauges, and other visualization.
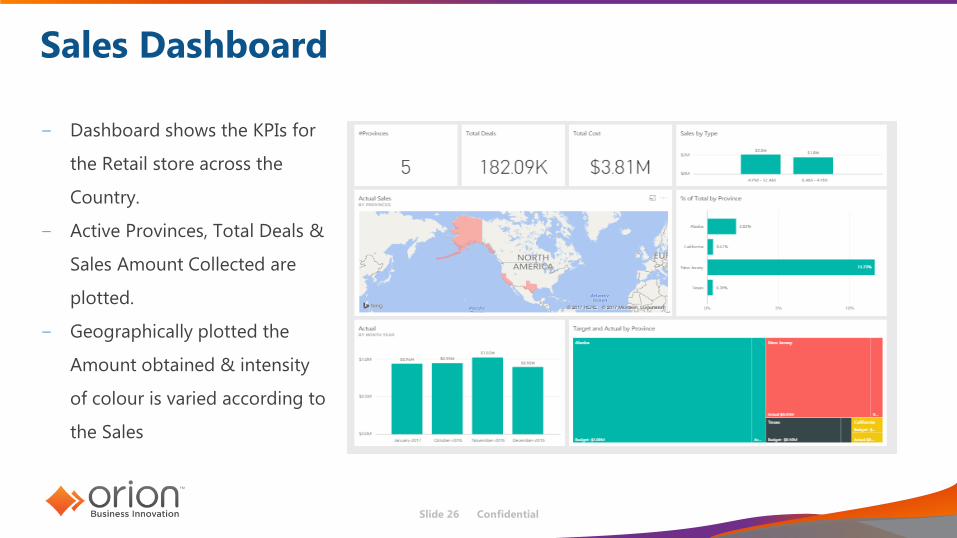
Slide 26 Confidential
− Dashboard shows the KPIs for
the Retail store across the
Country.
− Active Provinces, Total Deals &
Sales Amount Collected are
plotted.
− Geographically plotted the
Amount obtained & intensity
of colour is varied according to
the Sales
Sales Dashboard
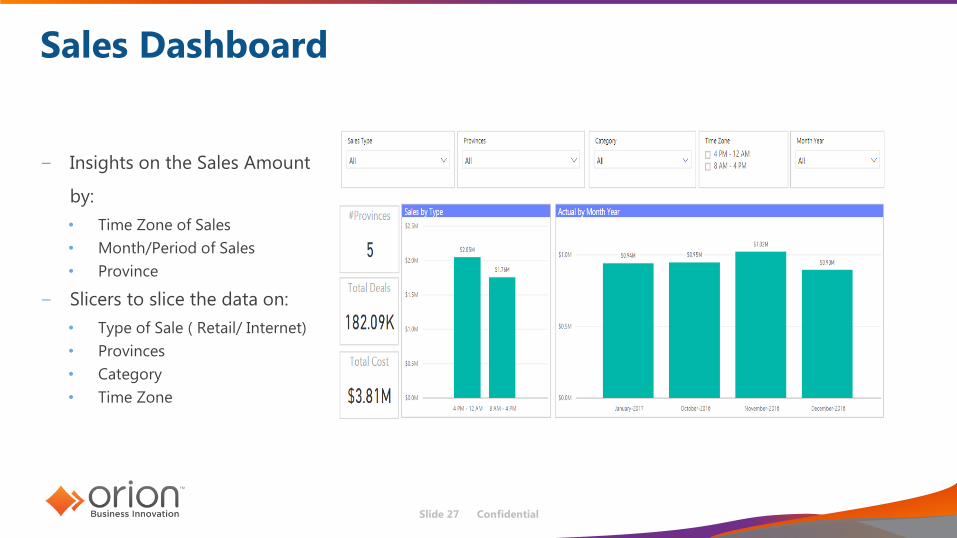
Slide 27 Confidential
− Insights on the Sales Amount
by:
• Time Zone of Sales
• Month/Period of Sales
• Province
− Slicers to slice the data on:
• Type of Sale ( Retail/ Internet)
• Provinces
• Category
• Time Zone
Sales Dashboard

Slide 28 Confidential
− % of Contribution of Sales is
plotted against the Provinces.
− Target Vs Actuals Analysis on
the Sales Amount.
Sales Dashboard
Slide 29 Confidential
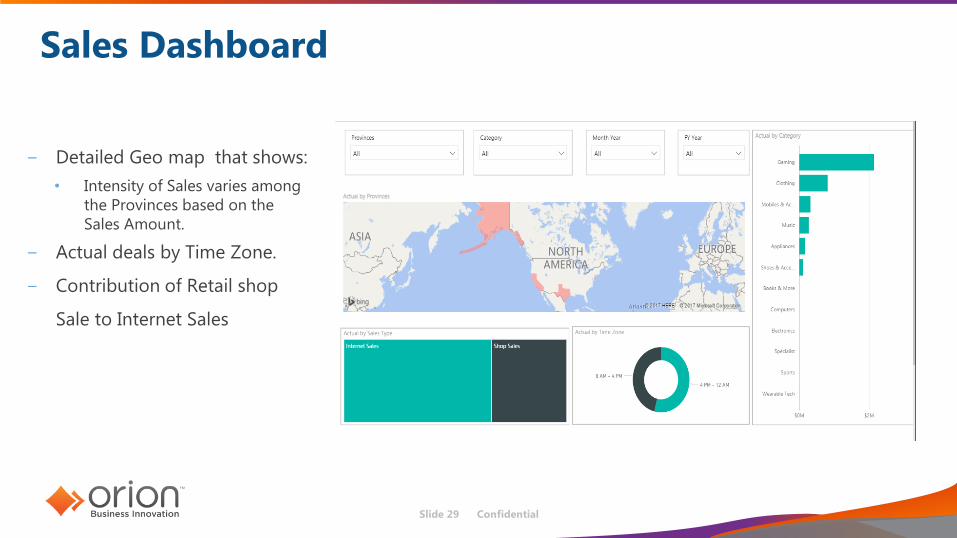
− Detailed Geo map that shows:
• Intensity of Sales varies among
the Provinces based on the
Sales Amount.
− Actual deals by Time Zone.
− Contribution of Retail shop
Sale to Internet Sales
Sales Dashboard
Slide 30 Confidential
Sentiment Analysis
Used to analyze consumer (and end-user) sentiments of the data
that is coming from various social media sources. Twitter and
Facebook data have been used in the creation of these dashboards.

Slide 31 Confidential
Detailed Sentiment Report:
− Volume & Average
Sentiment by:
• Author
• #tag
− Sentiment of Tweets across
Time
− Tweets by Sentiment Bucket
Sentiment Analysis Dashboard
Slide 32 Confidential
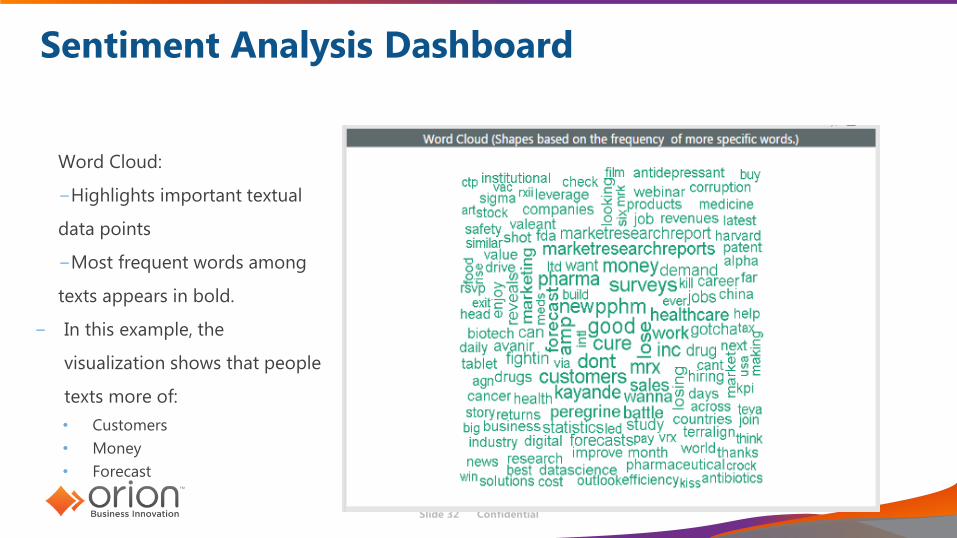
Word Cloud:
−Highlights important textual
data points
−Most frequent words among
texts appears in bold.
− In this example, the
visualization shows that people
texts more of:
• Customers
• Money
• Forecast
Sentiment Analysis Dashboard

Slide 33 Confidential
Dendogram:
− The dendrogram is a branching
diagram that represents the
relationships of similarity among a
group of words
− “R” code has been used to develop the
Dendogram chart
− The diagram in the template shows
“inc” and “new” in the same group.
“mrx” and “surveys” are in another
group
Sentiment Analysis Dashboard

Slide 34 Confidential
Correlation Plot:
− Explains the association
between the words
− For instance, the words
“forecast” and “surveys” have a
positive association.
− The dot colors inside the plot
vary from light to dark based
on the association between
words.
Sentiment Analysis Dashboard
Slide 35 Confidential
Disclaimer: This document is for informational purposes only and is subject to change without notice. This
document and its content herein are believed to be accurate as of its date of publication. However, Orion
Systems Integrators, LLC (herein referred as Orion) makes no guarantee, representations or warranties with
regard to the enclosed information and specifically disclaims the implied warranties of fitness for a
particular purpose and merchantability. As each user of Orion services is likely to be unique in their
requirements in the use of such software solutions and their business processes, users of this document
are always advised to discuss the content of this document with their Orion Representatives.
All other trademarks acknowledged. Copyright @ 2017 Orion Systems Integrators, LLC.
Thank You.
For more Information, please visit: http://www.orioninc.com