Microsoft Excel. Click on “Start,” then “Microsoft Office Excel.”

Microsoft Excel Tutorial

TABLE OF CONTENTS1. Getting Started Page 3
2. Creating A New Document Page 3
3. Saving Your Document Page 4
4. Toolbars Page 4
5. Formatting Page 6
• Working With Cells Page 6
• Changing An Entry Within A Cell Page 6
• Cut, Copy, and Paste Page 6
• Formatting Cells Page 6
• Formatting Rows and Columns Page 7
• Adding Rows and Columns Page 8
• Working With Charts Page 8
• Chart Design Page 9
• Chart Options Page 10
• Chart Style Page 10
6. Inseting Smart Art Graphics Page 10
• Pictures Page 10
• Creating Functions Page 11
7. Printing Page 12
10. Other Helpful Functions Page 12
2
1. GETTING STARTED
Microsoft Excel is one of the most popular spreadsheet applications that helps you manage data, create visually persuasive charts, and thought-provoking graphs. Excel is supported by both Mac and PC platforms. Microsoft Excel can also be used to balance a checkbook, create an expense report, build formulas, and edit them.
Figure 1. Navigation to Microsoft Excel on a PC.
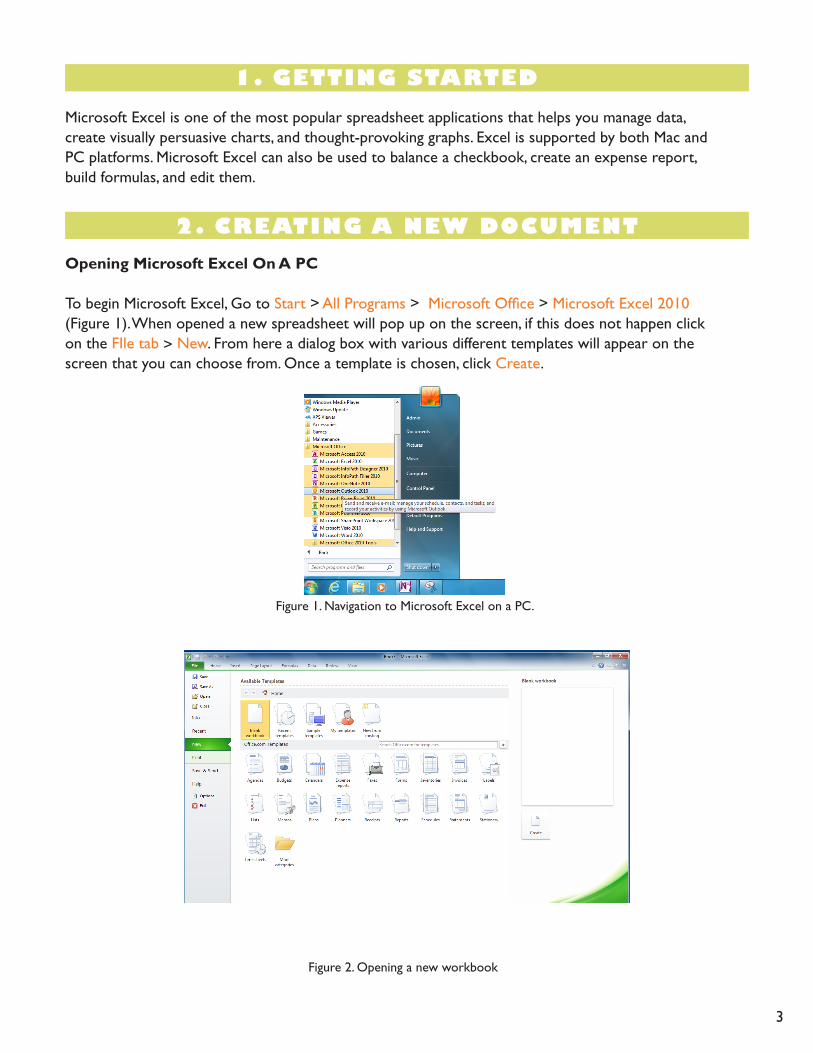
Figure 2. Opening a new workbook
2. CREATING A NEW DOCUMENT
3
Opening Microsoft Excel On A PC
To begin Microsoft Excel, Go to Start > All Programs > Microsoft Office > Microsoft Excel 2010 (Figure 1). When opened a new spreadsheet will pop up on the screen, if this does not happen click on the FIle tab > New. From here a dialog box with various different templates will appear on the screen that you can choose from. Once a template is chosen, click Create.

Computers crash and documents are lost all the time, so it is best to save often.
Saving Initially
Before you begin you should save your document. To do this, click on the File tab > Save . Then Microsoft Excel will open a dialog box (Figure 3) where you can specify the new file’s name, location of where you want it saved, and format of the document. Once you have specified a name, place, and format for your new file, press the Save button.
Note: Specifying your file format will allow you to open your document on a PC as well as a MAC. To do this you use the drop down menu next to the Format option. Also, when you are specifying a file extension (i.e. .doc) make sure you know what you need to use.
Saving Later
After you have initially saved your blank document under a new name, you can begin your project. However, you will still want to periodically save your work as insurance against a computer freeze or a power outage. To save, just click on the floppy disk, or for a shortcut press CTRL + S.
3. SAVING YOUR DOCUMENT
4. TOOLBARS
In Microsoft Excel 2010 for a PC, the toolbars are automatically placed as tabs at the top of the screen. Within these tabs you will find all of your options to change text, data, page layout, and more. To be able access all of the certain toolbars you need to click on a certain tab that is located towards the top of the screen.
4
Figure 3. Saving dialog box.

4. TOOLBARS CONT.
5
Figure 6. Page Layout Tab.
Three Commonly Used Tabs
The Home Tab: (Figure 4). This is one of the most common tabs used in Excel. You are able to format the text in your document, cut, copy, and paste information. Change the alignment of your data, insert, delete, and format cells. The Home Tab also allows you to change the number of your data (i.e. currency, time, date).
The Insert Tab: (Figure 5). This tab is mainly used for inserting visuals and graphics into your document. There are various different things that can be inserted from this tab such as pictures, clip art, charts, links, headers and footers, and word art.
The Page Layout Tab: (Figure 6). Here you are able to add margins, themes to your document, change the orientation, page breaks, and titles. The scale fit of your document is also included as a feature within this tab, if needed.
Figure 4. Home Tab.
Figure 5. Insert Tab.

5. FORMATTING
6
Working With Cells
Cells are an important part of any project being used in Microsoft Excel. Cells hold all of the data that is being used to create the spreadsheet or workbook. To enter data into a cell you simply click once inside of the desired cell, a black border will appear around the cell (Figure 7). This border indicates that it is a selected cell. You may then begin typing in the data for that cell.
Changing An Entry Within A Cell
You may change an entry within a cell two different ways: 1. Click the cell one time and begin typing. The new information will replace any information that was previously entered. 2. Double click the cell and a cursor will appear inside. This allows you to edit certain pieces of information within the cells instead of replacing all of the data.
Cut, Copy, and Paste
You can use the Cut, Copy and Paste features of Excel to change the data within your spreadsheet, to move data from other spreadsheets into new spreadsheets, and to save yourself the time of re-entering information in a spreadsheet. Cut will actually remove the selection from the original location and allow it to be placed somewhere else. Copy allows you to leave the original selection where it is and insert a copy elsewhere. Paste is used to insert data that has been cut or copied.
To Cut or Copy:
Highlight the data or text by selecting the cells that they are held within.Go to the Home Tab > Copy (CTRL + C) or Home Tab > Cut (CTRL + X).Click the location where the information should be placed.Go to Home Tab > Paste (CTRL + V) to be able to paste your information.
Formatting Cells
There are various different options that can be changed to format the spreadsheets cells differently. When changing the format within cells you must select the cells that you wish to format.
To get to the Format Cells dialog box select the cells you wish to change then go to Home Tab > Format > Format Cells. A box will appear on the screen with six different tab options (Figure 8). Explanations of the basic options in the format dialog box are bulleted below.
Figure 7. Entering Data.

7
5. FORMATTING CONT.
Number: Allows you to change the measurement in which your data is used. (If your data is concerned with money the number that you would use is currency)Alignment: This allows you to change the horizontal and vertical alignment of your text within each cell. You can also change the orientation of the text within the cells and the control of the text within the cells as well.Font: Gives the option to change the size, style, color, and effects.Border: Gives the option to change the design of the border around or through the cells.
Formatting Rows and Columns
When formatting rows and columns you can change the height, choose for your information to autofit to the cells, hide information within a row or column, un-hide the information. To format a row or column go to Home Tab > Row Height (or Column Height), then choose which height you are going to use (Figure 9). The cell or cells that are going to be formatted need to be selected before doing this. When changing the row or column visibility (hidden, un-hidden) or autofit, you will go to the Home Tab and click Format. The drop down menu will show these options.
Figure 8. Formatting Cells
Figure 9. Formatting Rows and Columns Height

8
5. FORMATTING CONT.
Figure 10. Inserting Rows
Figure 11. Inserting Columns
Figure 12. Charts Tab
Adding Rows and Columns
When adding a row or column you are inserting a blank row or column next to your already entered data. Before you can add a Row you are going to have to select the row that you wish for your new row to be placed. (Rows are on the left hand side of the spreadsheet) once the row is selected it is going to highlight the entire row that you chose. To insert the row you have to go to Home Tab > Insert > Insert Sheet Rows (Figure 10). The row will automatically be placed on the spreadsheet and any data that was selected in the original row will be moved down below the new row.
Working With Charts
Charts are an important part to being able to create a visual for spreadsheet data. In order to create a chart within Excel the data that is going to be used for it needs to be entered already into the spreadsheet document. Once the data is entered, the cells that are going to be used for the chart need to be highlighted so that the software knows what to include. Next, click on the Insert Tab that is located at the top of the screen. (Figure 12).
Before you can add a Column you are going to have to select a column on the spreadsheet that is located in the area that you want to enter the new column. (Columns are on the top part of the spreadsheet.) Once the column is selected it is going to highlight the entire row that you chose. To insert a column you have to go to Home Tab > Insert > Insert Sheet Column (Figure 11). The column will automatically be place on the spreadsheet and any data to the right of the new column will be moved more to the right.
5. FORMATTING CONT.
9
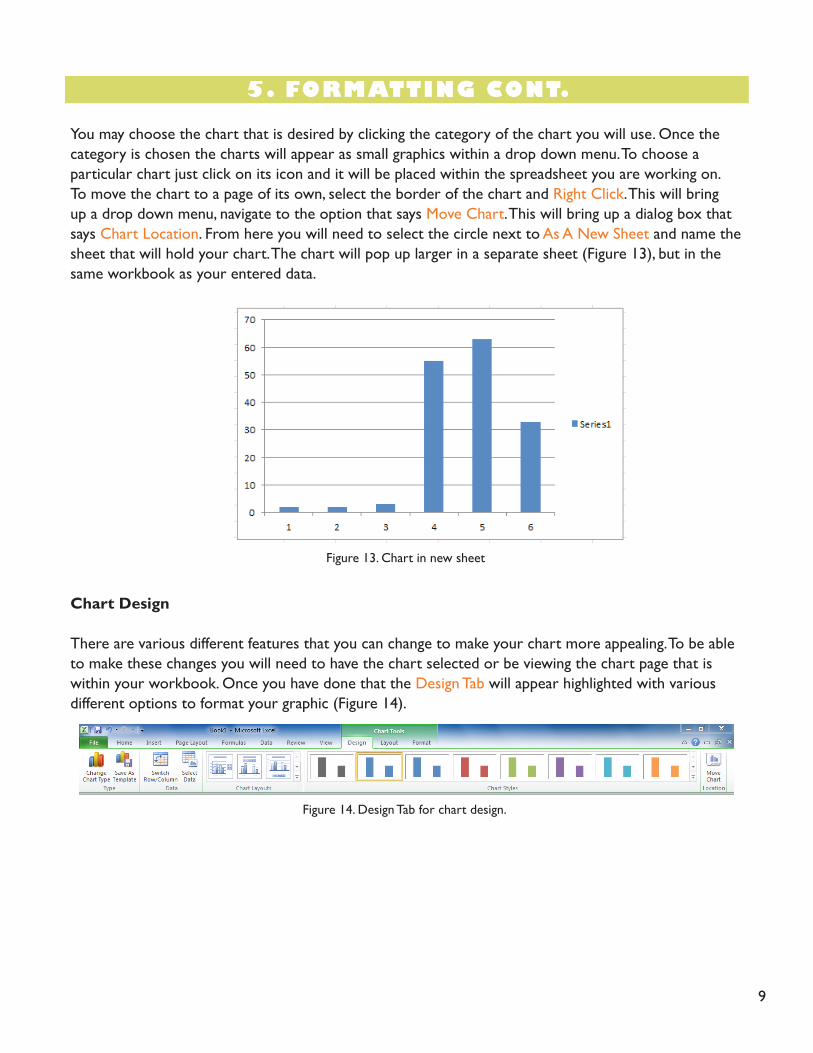
Figure 13. Chart in new sheet
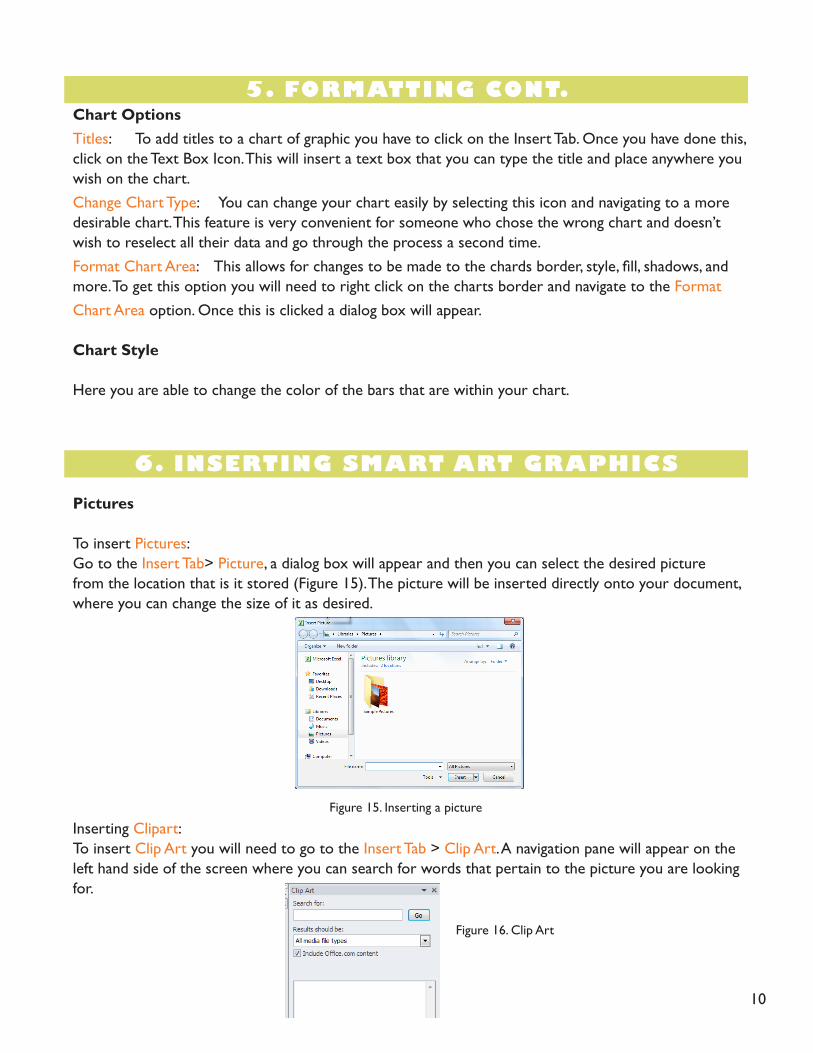
Figure 14. Design Tab for chart design.
You may choose the chart that is desired by clicking the category of the chart you will use. Once the category is chosen the charts will appear as small graphics within a drop down menu. To choose a particular chart just click on its icon and it will be placed within the spreadsheet you are working on. To move the chart to a page of its own, select the border of the chart and Right Click. This will bring up a drop down menu, navigate to the option that says Move Chart. This will bring up a dialog box that says Chart Location. From here you will need to select the circle next to As A New Sheet and name the sheet that will hold your chart. The chart will pop up larger in a separate sheet (Figure 13), but in the same workbook as your entered data.
Chart Design
There are various different features that you can change to make your chart more appealing. To be able to make these changes you will need to have the chart selected or be viewing the chart page that is within your workbook. Once you have done that the Design Tab will appear highlighted with various different options to format your graphic (Figure 14).
10
5. FORMATTING CONT.
6. INSERTING SMART ART GRAPHICS
Figure 15. Inserting a picture
Figure 16. Clip Art
Chart OptionsTitles: To add titles to a chart of graphic you have to click on the Insert Tab. Once you have done this, click on the Text Box Icon. This will insert a text box that you can type the title and place anywhere you wish on the chart. Change Chart Type: You can change your chart easily by selecting this icon and navigating to a more desirable chart. This feature is very convenient for someone who chose the wrong chart and doesn’t wish to reselect all their data and go through the process a second time.Format Chart Area: This allows for changes to be made to the chards border, style, fill, shadows, and more. To get this option you will need to right click on the charts border and navigate to the Format Chart Area option. Once this is clicked a dialog box will appear.
Chart Style
Here you are able to change the color of the bars that are within your chart.
Pictures
To insert Pictures:Go to the Insert Tab> Picture, a dialog box will appear and then you can select the desired picture from the location that is it stored (Figure 15). The picture will be inserted directly onto your document, where you can change the size of it as desired.
Inserting Clipart:To insert Clip Art you will need to go to the Insert Tab > Clip Art. A navigation pane will appear on the left hand side of the screen where you can search for words that pertain to the picture you are looking for.

11
6. INSERTING SMART ART GRAPHICS CONT.
Figure 17. Choosing calculation cell
Figure 18. First calculation display
Creating Functions
When creating a function in Excel you must first have the data that you wish to perform the function with selected. • Select the cell that you wish for the calculation to be entered in (i.e.: if I want to know the sum of B1:B5 I will highlight cell B6 for my sum to be entered into) (Figure 17).
• Once you have done this you will need to select the Formulas Tab located at the top of the screen. • A list of Most Recently Used, Financial, Logical, Text, Date and Time, Math and Trig formulas will appear. To choose one of the formulas click the icon that holds the formula you are looking for. • Once you have clicked your formula this will display a dialog box on your screen. (Figure 18)
In this screen it lists the cells that are being calculated, the values within the cells, and the end result.
• To accept that calculation you can press OK and the result will show up in the selected cell.
12
7. PRINTING
8. OTHER HELPFUL FUNCTIONS
It is important to always save your document before you print!
Printing
To print your document, go to File Tab > Print, select your desired settings, and then click OK. You can also do this by using the shortcut CTRL + P
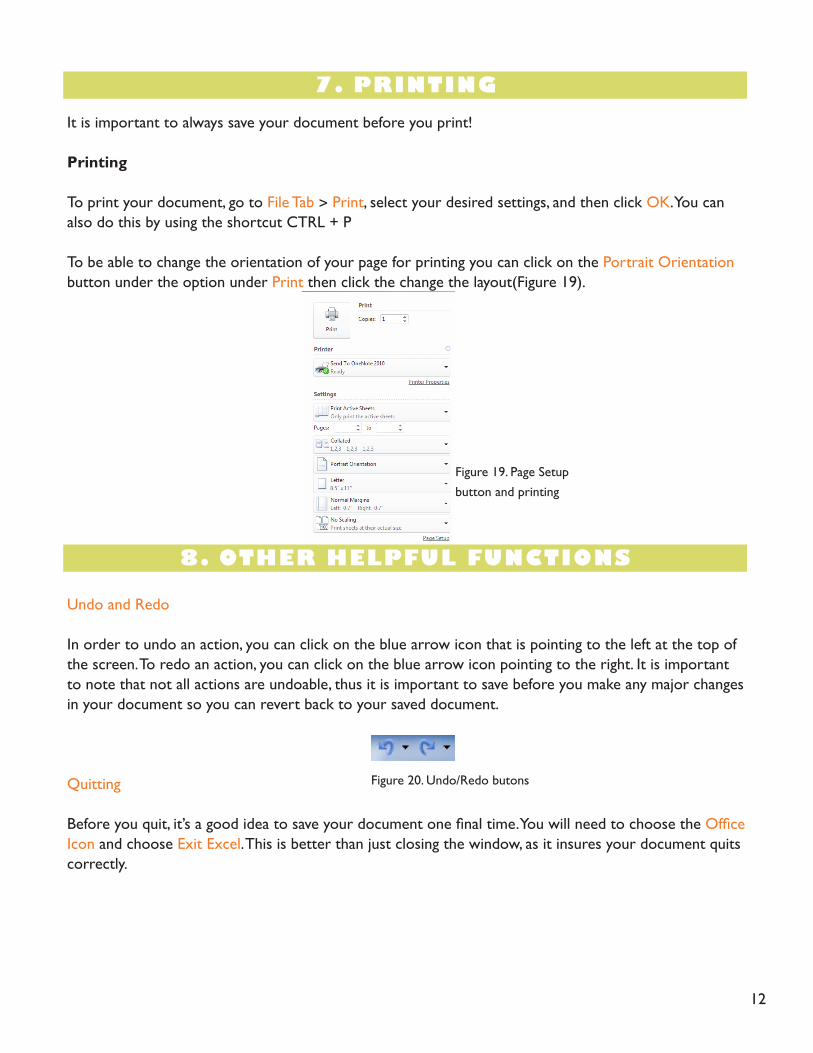
To be able to change the orientation of your page for printing you can click on the Portrait Orientation button under the option under Print then click the change the layout(Figure 19).
Undo and Redo
In order to undo an action, you can click on the blue arrow icon that is pointing to the left at the top of the screen. To redo an action, you can click on the blue arrow icon pointing to the right. It is important to note that not all actions are undoable, thus it is important to save before you make any major changes in your document so you can revert back to your saved document.
Quitting
Before you quit, it’s a good idea to save your document one final time. You will need to choose the Office Icon and choose Exit Excel. This is better than just closing the window, as it insures your document quits correctly.
Figure 19. Page Setup button and printing
Figure 20. Undo/Redo butons