MICRORNA PROFILE OF MEDULLOBLASTOMAS
197
MICRORNA PROFILE OF MEDULLOBLASTOMAS By Ms. RATIKA R. KUNDER [LIFE09200704010] TATA MEMORIAL CENTRE MUMBAI A thesis submitted to the Board of Studies in Life Sciences in partial fulfillment of requirements for the Degree of DOCTOR OF PHILOSOPHY of HOMI BHABHA NATIONAL INSTITUTE May, 2014
Transcript of MICRORNA PROFILE OF MEDULLOBLASTOMAS

MICRORNA PROFILE OF MEDULLOBLASTOMAS
By
Ms. RATIKA R. KUNDER
[LIFE09200704010]
TATA MEMORIAL CENTRE
MUMBAI
A thesis submitted to the
Board of Studies in Life Sciences
in partial fulfillment of requirements
for the Degree of
DOCTOR OF PHILOSOPHY of
HOMI BHABHA NATIONAL INSTITUTE
May, 2014


STATEMENT BY AUTHOR
This dissertation has been submitted in partial fulfillment of requirements for an
advanced degree at Homi Bhabha National Institute (HBNI) and is deposited
in the Library to be made available to borrowers under rules of the HBNI.
Brief quotations from this dissertation are allowable without special permission,
provided that accurate acknowledgement of source is made. Requests for
permission for extended quotation from or reproduction of this manuscript in
whole or in part may be granted by the Competent Authority of HBNI when in
his or her judgment the proposed use of the material is in the interests of
scholarship. In all other instances, however, permission must be obtained from
the author.
Navi Mumbai,
May, 2014.

DECLARATION
I, hereby declare that the investigation presented in the thesis has been
carried out by me. The work is original and has not been submitted earlier
as a whole or in part for a degree / diploma at this or any other Institution /
University
Navi Mumbai,
May, 2014

CERTIFICATE
I certify that the thesis titled ‘MicroRNA profile of Medulloblastomas’ submitted for the
degree of Doctor of Philosophy by Ratika R. Kunder is a record of the research carried out
by her during the period August 2007 to August 2013 under my supervision. This work has
not formed the basis for the award of any degree, diploma, associateship or fellowship at
this or any other institute or university.
Navi Mumbai,
May, 2014

List of Publications arising from the thesis
Journal
1. “Real-time PCR assay based on the differential expression of microRNAs and protein-coding genes for molecular classification of formalin-fixed paraffin embedded medulloblastomas.” Kunder R, Jalali R, Sridhar E, Moiyadi A, Goel N, Goel A, Gupta T, Krishnatry R, Kannan S, Kurkure P, Deopujari C, Shetty P, Biyani N, Korshunov A, Pfister SM, Northcott PA, Shirsat NV. Neuro Oncol., 2013 Dec; 15(12):1644-51.
2. “Distinctive microRNA signature of medulloblastomas associated with the WNT signaling pathway.” Gokhale A, Kunder R, Goel A, Sarin R, Moiyadi A, Shenoy A, Mamidipally C, Noronha S, Kannan S, Shirsat NV. J Cancer Res Ther., 2010 Oct-Dec; 6(4):521-9.
Conferences
1. “Detailed demographic profile of molecular subtypes of Indian medulloblastoma patients.” Rahul krishnatry, Neelam Shirsat, Ratika Kunder, Sridhar Epari, Tejpal Gupta, Purna Kurkure, Tushar Vora, B. Arora, Alisagar Moiyadi, Rakesh Jalali. 15th International Symposium on Pediatric Neuro- Oncology, June 24-27 2012 Toronto, Ontario, Canada. Neuro Oncol. 2012; 14(suppl 1):i43-48.
2. “Outcome analysis based on clinico-pathologic factors and molecular sub-grouping in Indian patients with medulloblastoma treated on prospective clinical trials.” Tejpal Gupta, Rahul Krishnatry, Neelam Shirsat, Sridhar Epari, Ratika Kunder, Purna Kurkure, Tushar Vora, Aliasgar Moiyadi and Rakesh Jalali. 15th International Symposium on Pediatric Neuro-Oncology, June 24-27 2012 Toronto, Ontario, Canada. Neuro Oncol. 2012; 14 (suppl 1):i82-i105.
Navi Mumbai,
May, 2014

ACKNOWLEDGEMENTS
It is definitely about the journey just as much as it is about the goal. I therefore take this opportunity to thank everyone who has been instrumental in making this journey fruitful and a memorable one.
Firstly, I would like to express my sincere gratitude to my mentor Dr. Neelam Shirsat, for introducing me to the field of microRNAs. This thesis would not have been possible without her guidance, critical analysis and encouragement to do better throughout the course of this project. The discussions during the making of the manuscript and her help with the manuscript preparation have been immense and have taught me a great deal. I had the privilege of using the excellent infrastructure of ACTREC, for which I sincerely thank Dr. Rajiv Sarin (Ex-Director, ACTREC), Dr. Surekha Zingde (Ex-Deputy Director, ACTREC) and Dr. S. Chiplunkar (Director, ACTREC). I also thank ICMR and Terry Fox Foundation for funding the project and ACTREC for my fellowship. I am also grateful to the Dept. of Science and Technology (DST) and Patel Kantilal Trust for granting me financial assistance to present my work at an international conference. A special thanks to my Doctoral Committee chairperson Dr. Surekha Zingde (ACTREC) and members Dr. Robin Mukhopadhyaya (ACTREC) and Dr. Sanjay Gupta (ACTREC) for their critical evaluation and valuable comments. I would also like to thank Dr. G.B. Maru (ACTREC) and Dr. Sorab Dalal (ACTREC) who stepped in as the Chairperson and member respectively of my committee for the Viva Voce. I am grateful to all my clinical collaborators Dr. Aliasgar Moiyadi (ACTREC), Dr. Naina Goel (KEM), Dr. Atul Goel (KEM), Dr. Tejpal Gupta (ACTREC), Dr. Rahul Krishnatry (TMH) Dr. Prerna Kurkure (TMH), Dr. Chandrashekhar Deopujari (Bombay Hospital), Dr. Prakash Shetty (ACTREC) and Dr. Naresh Biyani (Bombay Hospital) for providing us with the medulloblastoma tumor specimens, patient clinical details, follow-up data and giving their clinical perspective towards this project. I would especially like to thank Dr. Sridhar for always taking time out of his busy schedule for the histological diagnosis. His enthusiasm towards the project and encouragement was immense. I’m thankful to Dr. Rakesh Jalali for encouraging me to present my work at conferences and being equally enthusiastic towards this project. I’m also grateful to Dr. Paul Northcott, Dr. Stefan Pfister and Dr. Andrey Korshunov from DKFZ, Germany for providing the medulloblastoma FFPE RNA for validation that helped strengthen the manuscript. I am extremely grateful to all the patients for their invaluable contribution by agreeing to be a part of this study and making it possible. I sincerely thank Dr. Rita Mulherkar, in-charge of genomics facility and Mansi for always promptly taking up and solving issues related to the real time PCR. I thank Mr. Chavan and Mr. Sakpal for their help with sectioning and H&E staining. I thank Sadhana Kannan for her help with the statistical analysis. I would like to thank Mr. Dandekar for his proficient assistance in the common instrument facility. I’m grateful to the staff in microscopy, sequencing, photography, IT, library, steno-pool, administration and accounts for their constant help and support. A special thanks to Maya from Program Office, for all her patience and help in managing the HBNI related paperwork. This journey wouldn’t have been half as enjoyable had it not been for the wonderful people of Shirsat lab. A special thanks to Anant, Umesh and Sadaf for their excellent technical help. I thank Anantji for all his help with the RNA extractions and real time and Umesh for the tumor tissue collection. I thank Amit, Saumil, Pratibha, Shailendra and Manoj, for their help and support during the initial years of my Ph.D. I’d also like to thank Pooja, Kedar, Sulochana, Atul, Shibi,

Satish, Sandeep, Annada, Sanket, Raikamal and Shalaka for maintaining a wonderful atmosphere in the lab and making it a fun place to work. I thank Shreyas for his help with real time when it was most needed and Vijay for his help with the PCR for mutation analysis. My time in ACTREC has been more pleasant thanks to my batchmates Gaurav, Sumeer, Hemant, Ajit, Dimpu, Akhil, Soni, Dilip, Vinayak and Harsh. I will cherish the fun times shared with Gaurav and Sumeer and also wish to thank them for being a patient ear and support when most needed. I’m grateful to the student community of ACTREC for their willingness to help always. A heartfelt thanks to my roommates, both past and present, Sanchita, Madhura, Rubina and Sushmita for making hostel like a second home for me. It is important to have a life outside the lab to keep you sane for which I wish to specially thank ‘The Barefeet Project’ team – Amitabha, Hemant, Shaurya, Shreyas, Preetam, Joseph and Vikas for the musical jammings that helped me unwind after a busy day. I’m also grateful to my backpacking buddies in the lab and batch who shared the love for the mountains which led to some amazing Sahyadri treks. My deepest gratitude to my friends especially Chanda, Nikhil, Jings, who have stood by me through the years and patiently listened, even at times when it wouldn’t make much sense to them. Finally, this thesis would not have been possible without the endless support, love, and encouragement by my family. Thank you Mom, Dad and Didi for understanding and bearing with my absence most of the time and also my little nephew Reyansh for always bringing a smile on my face. I’d also like to thank my in-laws- Ma, Baba for being so supportive and encouraging. Lastly, to my good friend and music partner turned life partner Amitabha for being my biggest critic and a constant source of motivation, love and support. Thank You.
-Ratika Kunder

CONTENTS
Page No.
Synopsis…………………………………………………………………………............ i - xvii
List of figures…………………………………………………………………............... xviii
List of tables……………………………………………………………………............ xix
Abbreviations……………………………………………………………...................... xx-xxi
Chapter 1 Introduction………………………………………………….................. 1- 5
Chapter 2 Review of literature………………………………………………......... 6-28
2.1. Medulloblastoma: Brief history and Nomenclature…………….............. 6
2.2. Epidemiology……………………………………………………............. 6
2.3. Classification of medulloblastoma………………………………............ 7
2.4. Risk stratification and treatment…………………………………............ 8
2.5. Challenges in medulloblastoma treatment………………………............ 10
2.6. Molecular genetics of medulloblastoma……………………................... 10
2.6.1. Sonic- Hedgehog signaling pathway…………………….......... 11
2.6.2. WNT signaling pathway……………………………................. 13
2.7. Expression profiling of medulloblastomas………………………........... 15
2.8. Current consensus in medulloblastoma subgrouping……………........... 17
2.8.1. WNT subgroup…………………………………………........... 18
2.8.2. SHH subgroup………………………………………................ 18
2.8.3. Group 3 and Group 4…………………………………….......... 19
2.9. Cell of origin in medulloblastoma………………………………............ 19
2.10. Assays for molecular subgrouping of medulloblastomas......................... 21
2.11. Beyond protein-coding genes: Non-coding RNAs- MicroRNAs............. 22
2.11.1 MicroRNA biogenesis…………………………………............ 24
2.11.2 MicroRNAs in cancer………………………………................. 25
2.12. Application of differential miRNA expression as markers for diagnosis,
prognosis and therapy………………………………............................... 27
Chapter 3 Materials and Methods…………………………………………......... 29 - 71
3.1. Collection of sporadic medulloblastoma tumor tissues…………........... 31
3.2. Extraction of nucleic acids……………………………………............... 32

3.3 Gene expression analysis by real time RT- PCR……………….............. 43
3.4. Quantification of miRNAs……………………………………................ 48
3.5. Mutation analysis of exon 3 from gene encoding β-catenin (CTNNB1)... 56
3.6. Tissue culture media and reagents…………………………….............. 59
3.7. Routine maintenance of cell lines……………………………............... 60
3.8. Freezing and revival of cell cultures…………………………............... 61
3.9. Transient transfection of human medulloblastoma cell line Daoy with
miRNA mimics/siGLO control………………………………................. 62
3.10. Extraction of RNA from tissue cultured cells………………….............. 63
3.11. Thymidine incorporation assay………………………………................ 64
3.12. Clonogenic Assay……………………………………………................. 65
3.13. Soft agar colony formation assay……………………………………….. 65
3.14. Statistical Analysis………………………………………………............ 66 -71
Chapter 4. Results……………………………………………………………........... 72-99
4.1. Identification of differentially expressed miRNAs by miRNA profiling. 75
4.1.1. WNT subgroup………………………………………….......... 78
4.1.2. SHH subgroup……………………………………………….... 79
4.1.3. Group 3 and 4………………………………………................ 79
4.1.4. MiRNAs common to multiple subgroups of medulloblastomas 79
4.2. Validation of the differential miRNA expression in the molecular
subgroups of medulloblastomas…………………………………........... 80
4.2.1. Molecular sub-grouping based on the expression profile of
protein-coding genes………………………………………….. 80
4.2.2. Differential miRNA expression in the molecular subgroups of
medulloblastomas………………………................................... 82
4.3. Functional Significance of WNT- subgroup specific miRNAs on the
growth and malignant potential of medulloblastoma cells……............... 86
4.3.1. Exogenous expression of WNT subgroup miRNAs in Daoy
medulloblastoma cell line........................................................... 87
4.3.2. Effect of expression of WNT- subgroup miRNAs on
proliferation of Daoy cells……….............................................. 87
4.3.3. Effect of expression of WNT- subgroup miRNAs on plating
efficiency and radiation sensitivity of Daoy cells...................... 89
4.3.4. Effect of expression of WNT- subgroup miRNAs on
anchorage - independent growth................................................ 89
4.4 Development of an assay based on real time RT-PCR for molecular
classification of medulloblastomas.......................................................... 90
4.5. Correlation of the molecular subgrouping and miRNA expression with
clinical parameters…………………….................................................... 96
4.5.1. Correlation with age, gender and histology……………........... 96
4.5.2. Correlation with overall survival……………………................ 98
Chapter 5. Discussion…………………………………………………………......... 100-112
5.1. Differential miRNA expression in medulloblastoma…………………... 100
5.1.1 Role of WNT subgroup specific miRNAs……………............. 101
5.1.2. MiRNA with potential oncogenic role in medulloblastomas…. 104
5.1.3. MiRNAs with potential role in neural differentiation…............ 105
5.2. Development of miRNA based assay for molecular classification of
medulloblastomas……………………………......................................... 106
5.3. Correlation of molecular subgroups and demographics in an Indian
medulloblastoma cohort………………………………............................ 108
5.4. Role of miRNAs in prognosis and risk stratification of
medulloblastoma....................................................................................... 110
Chapter 6. Summary and Conclusions…………………………………................. 113-116
Future Implications and therapeutic potential of miRNAs……................ 116-117
References……………………………………………………………………................ 118-125
Appendix I…………………………………………………………………...................
Appendix II……………………………………………………………………..............
Publications………………………………………………………………….................
126-135
136-137
138

SYNOPSIS

i
Homi Bhabha National Institute
Ph. D. PROGRAMME
SYNOPSIS
INTRODUCTION:
Medulloblastoma is the most common malignant pediatric brain tumor that constitutes
approximately 20% of all brain tumors in children.1-2 It originates in the cerebellum and has a
tendency to spread through the cerebrospinal fluid, into the craniospinal axis. Therefore,
standard post-operative treatment not only includes local radiotherapy but also craniospinal
radiation and chemotherapy. All medulloblastomas are classified pathologically as WHO
Grade IV tumors, the highest grade of malignancy, due to its malignant and invasive nature.1
Current risk stratification based solely on clinical parameters like age, metastasis at diagnosis
and extent of post- operative residual disease, is inadequate for accurate prognostication.
Although multimodal treatments have improved the 5-year survival of standard- risk patients
1. Name of the Student: Ratika R. Kunder
2. Name of the Constituent Institution: Tata Memorial Centre, Advanced Centre for
Treatment, Research and Education in Cancer
3. Enrolment No. : LIFE09200704010
4. Title of the Thesis: MicroRNA profile of Medulloblastomas
5. Board of Studies: Life Sciences

ii
to 70 – 80% and that of high- risk patients to 55- 76%, it is still incurable in 1/3rd of the cases.
Most survivors usually suffer from long- term side effects including, neurocognitive,
endocrine, psychiatric and developmental deficits due to the intensive therapies administered
to the developing brain.2 Understanding the molecular biology of these tumors is vital for
development of novel and risk- adapted therapeutic strategies, so that standard risk patients
can be spared from excessive treatment and survival of high risk patients can be improved.
Common genetic alterations like p53 mutation, EGFR amplification, p16 deletion
identified in other cancers, are relatively rare in medulloblastomas. First insights about the
involvement of developmental pathways in medulloblastoma came through the study of two
familial cancer syndromes: Turcot syndrome and Gorlin syndrome. Patients with Turcot and
Gorlin syndrome were found to have a predisposition to develop various cancers, including
medulloblastomas and harbored mutations in genes involved in the Wingless/ Wnt (WNT) and
Sonic Hedgehog (SHH) signaling pathways respectively.2 About 10 – 25 % of sporadic
medulloblastomas show mutations in the WNT and SHH signaling pathway genes.3
Transcriptomic techniques have contributed extensively towards further
characterization of medulloblastomas. Transcriptional profiling data from our lab4 as well as
other reports suggest that medulloblastoma is not just a single disease, but consists of distinct
molecular subgroups.5-7 According to the current consensus, there are four core molecular
subgroups of medulloblastomas which include WNT, SHH, Group 3 and Group 4 that are not
only distinct in their underlying biology but also vary in their clinical characteristics.8
MicroRNAs (miRNAs), a class of small non-coding RNA molecules, function by
regulating target gene expression post-transcriptionally. MiRNAs have been shown to regulate
a wide array of cell functions ranging from cell proliferation, differentiation, apoptosis etc.9 A
Synopsis
iii
single miRNA is predicted to target an average of 100- 200 different protein-coding genes.
Altered miRNA expression has been reported in various cancers. Moreover, miRNA
expression profile has been found to have diagnostic and prognostic potential in the
classification of various cancers.10
AIM:
The aim of the present project was therefore to identify miRNAs that are likely to play a role
in medulloblastoma pathogenesis for further understanding of the molecular mechanism
underlying this tumor.
OBJECTIVES:
1. MicroRNA profiling of medulloblastoma tissues so as to identify distinct molecular
subgroups.
2. Delineate the role of specific miRNAs in medulloblastoma pathogenesis.
MATERIALS AND METHODS:
1. Sample Collection: Fresh frozen tumor tissue specimens of sporadic medulloblastomas
were procured with the approval of the Institutional Review Board after getting informed
consent from the patients. Immediately following surgery, tumor tissues were snap-frozen in
liquid nitrogen and stored at −80°C. This study comprised of a total of 101 cases which
included 42 fresh frozen medulloblastoma tissues and 59 medulloblastomas available as
formalin- fixed paraffin embedded (FFPE) tissues. H&E staining was done to ensure at least
80% tumor content following which the tissues were used for RNA and DNA extraction.
2. RNA and DNA Extraction: Total RNA was extracted from fresh tumor tissues (n = 19)
and normal cerebellar tissues (n = 4) using the mirVana kit (Ambion) as per manufacturer's
protocol. For FFPE tissues, 10 µm sections were de-paraffinized using xylene, followed by

iv
absolute ethanol washes and subsequent digestion with proteinase K at 55ºC overnight in Tris-
SDS-NaCl-EDTA buffer as per the protocol described by Korbler et. al.11 Subsequently, acid
phenol–chloroform or standard phenol-chloroform extraction was done for RNA or DNA
isolation respectively. DNA and RNA quantity and quality was evaluated using a
spectrophotometer (NanoDrop ND-1000, Thermo Scientific) and agarose gel electrophoresis
respectively.
3. Expression Analysis of miRNAs: For miRNA profiling, total RNA (100 ng) was reverse
transcribed using stem-loop RT multiplex primer pools and Taqman MicroRNA Reverse
Transcription Kit (Applied Biosystems). Real time RT- PCR was performed using the Taqman
Universal PCR master mix and Taqman Low Density Arrays (TLDA) v 1.0 as per
manufacturer’s instructions on the ABI Prism 7900HT (Applied Biosystems). Relative
quantity (RQ) of each miRNA in each of the tissue samples as compared to the endogenous
control small RNA, RNU48, was computed by the RQ Manager Software (Applied
Biosystems) using the comparative Ct method, where RQ = 2 -(CtGene
- CtRef
) x 100. For
validation of the differential miRNA expression, reverse transcription was done using 50 ng
total RNA as previously described and the expression of each miRNA was analyzed by real
time PCR using 10 ng cDNA and miRNA specific TaqMan assays (Applied Biosystems). In
case of FFPE tissues, 50- 200 ng RNA was used for reverse transcription followed by Taqman
Real time PCR with 10 - 40 ng cDNA. RNU48 was used as a house-keeping endogenous
small RNA control. The relative quantification of miRNA expression was computed as
described earlier.
4. Expression analysis of protein- coding genes: To validate the expression of a select set of
significantly differentially expressed protein- coding genes, total RNA (1-2 g) was reverse

Synopsis
v
transcribed using random hexameric primers and MMLV-RT (Invitrogen). The primers for
real-time PCR were designed such that they correspond to two adjacent exons, and are located
at exon boundaries to avoid amplification of genomic DNA. The amplicon size was
maintained below 75-80 bp, to enable amplification of the fragmented RNA from FFPE
tissues. The expression was analyzed using Power SYBR Green (Applied Biosystems) using
10 ng cDNA/reaction for frozen tissues and 10 ng - 100 ng cDNA / reaction for FFPE tissues.
The relative quantity of each protein- coding gene as compared to the house- keeping gene
control, GAPDH, was determined by the comparative Ct method as described earlier.
5. Mutation Analysis: Exon 3 of CTNNB1 gene was amplified from the WNT subgroup tumor
tissue genomic DNA and sequenced to identify mutation if any using the ABI Prism 3100
Avant Genetic Analyzer (Applied Biosystems).
6. Development of an assay for molecular Classification of medulloblastomas: The
differential expression of 12 protein- coding genes and 9 miRNAs was analyzed on a total of
101 medulloblastomas that included 59 FFPE tumors tissues. Validation of the assay was done
on total RNA from 34 well- annotated medulloblastoma FFPE tissues obtained from Dr. Paul
Northcott, German Cancer Research Centre (DKFZ), Germany. The nearest shrunken centroid
classifier implemented in the Prediction Analysis of Microarray (PAM) for Excel package12
was used for class prediction analysis as described later.
7. Transient transfection of human medulloblastoma cell line Daoy using miRNA mimics:
Human medulloblastoma cell line Daoy (ATCC) was grown in Dulbecco's Modified Eagle
Medium (DMEM) supplemented with 10% fetal bovine serum (FBS) (Invitrogen) in a
humidified atmosphere of 5% CO2. Daoy cells were transfected with 100 nM of miR-
193a mimic, miR-224 mimic or miR-23b mimic using Dharmafect 2 (Dharmacon) as per

vi
manufacturer's protocol for a period of 48 h. As a negative control, Daoy cells were
transfected with 100 nM of siGLO, a RISC-free control siRNA (Dharmacon). The miRNA
levels in transfected cells were estimated by Real time RT- PCR analysis using RNU48 as the
endogenous small RNA control as described earlier. The transfected cells were allowed to
recover for a period of 24 h before analyzing their growth characteristics.
8. Effect on proliferation by thymidine incorporation assay: 2500 miRNA transfected cells
were plated / well of a 96-well microtiter plate. The cells were incubated in the presence of 1
μCi of tritiated thymidine (specific activity 240 Gbq/mmole, Board of Radiation and Isotope
Technology, Navi Mumbai, India) per well for a period of 20 h before harvesting by
trypsinization. Tritiated thymidine incorporated was estimated by scintillation counting.
9. Effect on plating efficiency and radiation sensitivity by clonogenic assay: 1 x 10³ miRNA
transfected cells were seeded in triplicates/ 55 mm plate and then irradiated at a dose of 6 Gy
(Cobalt-60 gamma irradiator, developed by Bhabha Atomic Research Centre, India). The
medium was changed 24 h later and the cells were allowed to grow for 6-8 days until
microscopically visible colonies formed. The cells were fixed by incubation in chilled
methanol/ acetic acid (3:1) overnight at 4 °C, stained with 0.5 % crystal violet and counted.
10. Effect on anchorage-independent growth by soft agar colony formation assay: 1 x 10⁴
cells were seeded in triplicates in DMEM with 10 % FBS medium containing 0.3 % agarose
over a pre- cast 1% agarose basal layer in a 35 mm plate. After the top layer solidified at room
temperature, the cells were incubated at 37 °C for about 3 – 4 weeks and the colonies formed
were counted.
11. Statistical Analysis: Unsupervised hierarchical clustering and bootstrap analysis of
miRNA profiling data was done using the MeV module of TM4 package. The miRNAs

Synopsis
vii
significantly differentially expressed in each cluster/subgroup were identified by Significance
Analysis of Microarrays (SAM) (http://www.TM4.org ). Descriptive statistics was used for the
subgroup assignment of each tumor tissue based on the expression levels of the marker genes
evaluated by real-time RT-PCR. Statistical significance of the differential expression of each
protein- coding gene/ miRNA obtained by real time RT-PCR across the four molecular
subgroups was determined by Analysis Of Variance (ANOVA). The expression levels of the
marker genes obtained as RQ by real-time RT-PCR were log 2 transformed for PAM analysis.
Robustness of the training set was assessed by cross-validation (random 10% left out at each
cycle). The cross-validation was performed by selecting various thresholds associated with the
lowest error rate on the training set and then used for class prediction of the test set at the
threshold having the least cross validation error rate. Receiver operating characteristic (ROC)
curve analysis was performed using SPSS 15.0 software. Event for overall survival was
calculated from the date of surgery until death or last follow-up date. Survival percentages
were estimated by Kaplan-Meier method and statistical significance between the groups was
estimated by log- rank test using Graph Pad Prism v 5.0. The differences in the performance of
miRNA transfected cells as compared to siGLO control transfected cells were examined by
Student's t-test using GraphPad Prism v 5.0.
RESULTS:
I] MicroRNA profiling of medulloblastoma tissues so as to identify distinct molecular
subgroups.
1. Identification of differentially expressed miRNAs by miRNA profiling: Of the 365
miRNAs assayed, 216 miRNAs were found to be expressed in medulloblastomas.

viii
Unsupervised hierarchical clustering using these 216 miRNAs segregated the tumor tissues
into four molecular subgroups of medulloblastomas, almost identical to that identified by the
genome wide expression profiling of protein-coding genes done previously by our lab4 viz.
WNT, SHH, Group 3 and Group 4. WNT subgroup had the most robust miRNA signature
with a number of miRNAs like miR-193a-3p, miR-224/miR-452 cluster, miR-182/miR-
183/miR-96 cluster, miR-365, miR-135a, miR-148a, miR23b/miR-24/miR-27b cluster, miR-
204, miR-146b, miR-449/miR-449b cluster, miR-335 and miR-328 overexpressed by 3-100
fold almost exclusively in these tumors. MiR-182, miR-135b, and miR-204 were found to be
under-expressed in SHH subgroup medulloblastomas. MiR-135b was found to be over-
expressed in Group 3 and Group 4 tumors. MiR-182 was found to be over- expressed in many
Group 3 and few Group 4 tumors whereas, miR- 204 was seen to be over- expressed in most
Group 4 medulloblastomas.
2. Validation of the differential expression of a select set of miRNAs: Real-time RT-PCR
analysis confirmed the significant expression of 11 representative miRNAs (miR-193a-3p,
miR-224, miR-148a, miR-23b, miR-365, miR-182, miR-135b, miR-204, miR-592, miR-10b,
miR-376a) found to have altered expression in medulloblastomas as per our profiling data as
well as other reports on the differential miRNA expression in medulloblastoma subgroups.4, 7,
13 Based on the miRNA expression pattern, all 101 tumors segregated into one of the 4
subgroups. WNT subgroup tumors showed significant overexpression (p < 0.0001) of miR-
193a-3p, miR-224, miR-148a, miR-23b, miR-365 and miR-10b as compared to other
subgroup medulloblastomas.
3. Development of an assay based on real time RT-PCR for molecular classification of
medulloblastomas: To develop an assay for molecular classification of medulloblastomas, a

Synopsis
ix
total of 42 fresh tumors and 59 FFPE tumor tissues were studied. Due to the lack of sufficient
significantly differentially expressed miRNAs in the non- WNT medulloblastomas, a
combination of a select set of protein-coding genes and miRNAs were tested as markers for
classification. The selection of a set of 12 marker genes (WIF1, DKK2, MYC, HHIP, EYA1,
MYCN, IMPG2, NPR3, GRM8, UNC5D EOMES, OTX2) from the significantly differentially
expressed genes reported in our gene- expression profiling study, was based on the
standardized fold change in the expression of the gene in the particular subgroup from our
data4 as well as that in other published reports.5-6 96/101 cases were classified based on the
expression of the 12 protein- coding genes. Five medulloblastomas were classified primarily
based on their miRNA profile due to poor RNA quality. The set of 42 fresh frozen
medulloblastoma tissues comprised of 10 WNT, 8 SHH, 11 Group 3 and 13 Group 4 cases
while the set of 59 FFPE medulloblastomas consisted of 11 WNT, 22 SHH, 10 Group 3 and
16 Group 4 medulloblastomas. Seven out of eight FFPE WNT subgroup medulloblastomas
which could be analyzed for CTNNB1 exon 3 sequence were found to harbor a single point
mutation that altered D32, S33 or S37 amino acid, validating their subgroup identification. Of
the 11 miRNAs studied, miR-376a and miR-10b expression levels were found to be less
consistent within a subgroup and considerably low as compared to other miRNAs and hence
were not included as markers to be tested by PAM analysis.
3.1. PAM Analysis: Twelve protein-coding genes and 9 miRNAs were tested by PAM as
markers for molecular classification of medulloblastomas. PAM analysis using the set of 101
medulloblastomas as a training set showed a cross-validation accuracy of 99%. Using a
training set of 42 fresh frozen medulloblastomas, all FFPE tumors were accurately classified
with the exception of two SHH subgroup tumors. Four out of five tumors, which were

x
classified primarily based on their miRNA profiles, due to poor RNA quality, were accurately
classified by PAM analysis using both protein-coding genes and miRNAs. The assay was
validated on the DKFZ set of FFPE tumor tissue RNAs (subgroup assignment based on
NanoString assay) 14. PAM analysis using the training set of 42 fresh frozen tumor tissues
accurately classified all DKFZ FFPE tissues with the exception of one Group 4 tumor
misclassified as Group 3 tumor. The present real-time RT-PCR assay was therefore found to
have an overall accuracy of 97% with the Area under Receiver Operating Curve (AUC) of
1.00 for all the four subgroups.
4. Correlation of the molecular subgrouping and miRNA expression with clinical
parameters
4.1. Correlation with age, gender and histology: Of the 101 medulloblastomas studied, 21
belonged to WNT subgroup, 30 to SHH subgroup, 21 to Group 3 and 29 belonged to Group 4.
The overall median age of the cohort was 9 yr. The children of age < 3 yr, belonged to SHH
(67%) and Group 3 (33%). Older children (> 8 yr) belonged primarily to Group 4 (40%) and
WNT subgroup (40%). Adult patients ( 18 yr) belonged to the SHH (65%) and the WNT
(35%) subgroup. The ratio of male: female patients in the WNT subgroup was lowest at ~ 1:1
while 40 out of 50 cases in Group 3 and Group 4 were male patients. Most of the tumors
studied were of classical histology (79%) followed by tumors having large cell/ anaplastic
(10.6%) and desmoplastic (10.6%) histology. While all the desmoplastic tumors belonged to
SHH subgroup, 64% tumors with large cell/anaplastic histology belonged to Group 3.
4.2. Correlation with overall survival: The overall survival data was available for 72
medulloblastoma cases. The patients who expired within the first month after surgery were
excluded from the analysis. Kaplan Meier analysis showed the best survival rate for the WNT

Synopsis
xi
subgroup patients and the worst survival rate for Group 3 patients. Log Rank test showed
survival curves to be significantly different (p = 0.0046) for the four subgroups. The survival
analysis of the histological variants showed significantly (p = 0.0017) worse survival rate for
the tumors with large cell/anaplastic histology as compared to those with classic or
desmoplastic histology. Within the SHH subgroup, tumors with MYCN over-expression
comparable to MYCN amplification levels were found to have significantly (p = 0.0185)
poorer survival rate. In the combined cohort of Group 3 and Group 4 medulloblastomas,
tumors with miR-592 over-expression were found to have significantly (p = 0.0060) better
survival rates while those with miR-182 over-expression were found to have significantly (p =
0.0422) worst survival rates.
II] Delineate the role of specific miRNAs in medulloblastoma pathogenesis.
1. Functional Significance of WNT- subgroup specific miRNAs in the growth and
malignant potential of medulloblastoma cells: MiR-193a-3p and miR-224 were found to be
the most highly and specifically upregulated miRNAs in the WNT subgroup, while miR-23b is
overexpressed in both WNT and SHH subgroup tumors. MiR-193a-3p and miR-224
expression in Daoy cells is comparable to normal developing cerebellar tissues. MiR-
23b expression in Daoy cells is higher than that of miR-193a-3p or miR-224, while it is still
about four-fold lower than that in normal developing cerebellar tissues. Transfection of 100
nM of miRNA mimics in Daoy cells resulted in 10-100 fold increase in miRNA expression.
1.1. Effect on proliferation: A 50-100 fold overexpression of miR-193a-3p in Daoy cells
resulted in 50-60% growth inhibition, while 10-15 fold overexpression of miR-23b resulted in
1.6-1.8 fold increase in proliferation of Daoy cells as judged by thymidine incorporation assay.

xii
On the other hand, a 10-15 fold miR-224 overexpression, showed marginal difference on
proliferation of Daoy cells.
1.2. Effect on plating efficiency and radiation sensitivity: Plating efficiency of miR-
224 transfected Daoy cells was found to be reduced by 50% while that of miR-193a-
3p transfected Daoy cells was reduced by almost 80%. No significant change was observed in
the plating efficiency of miR-23b transfected Daoy cells from control cells. Irradiation at a
dose of 6 Gy resulted in about 70% reduction in the number of colonies formed by control
siGLO transfected Daoy cells in clonogenic assay. MiR-193a-3p overexpressing Daoy cells on
irradiation at a dose of 6 Gy failed to form any colonies, while irradiation of miR-
224 overexpressing Daoy cells resulted in more than 90% reduction in colony formation. No
significant change was observed in the radiation sensitivity of miR-23b overexpressing Daoy
cells.
1.3. Effect on anchorage- independent growth: miR-224 and miR-193a- 3p overexpression in
Daoy cells was found to bring about 60 to 90% reduction in soft agar colony formation while
there was no significant difference in the number of soft agar colonies formed by miR-
23b overexpressing cells as compared to siGLO transfected cells.
DISCUSSION:
MicroRNA profiling of medulloblastomas revealed differential miRNA expression in
the four molecular subgroups (WNT, SHH, Group 3, Group 4) that were identified by
expression profiling of protein–coding genes.4 WNT subgroup medulloblastomas were found
to have the most distinctive miRNA profile having over-expression of a number of miRNAs as
compared to both normal cerebellar tissues as well as other medulloblastoma subgroups.

Synopsis
xiii
Concurrent with our study, two other studies reported miRNA profiling and protein-coding
gene expression profile done in parallel on medulloblastoma tumors.7, 13 While there is
considerable overlap in the miRNA expression profile reported in the three studies, only the
present study reported the distinctive miRNA profile of WNT subgroup tumors and the
segregation of medulloblastomas into the four subgroups based on their miRNA profile. The
present study was carried out using real-time PCR based quantification of miRNA expression
which has higher sensitivity and specificity as compared to the miRNA microarray (Ohio
Cancer Centre) and Illumina bead based array used in the other studies. Further, these studies
lacked sufficient number of WNT subgroup tumors and the miRNA profile was not validated.
In the present study, the differential miRNA profile was validated on FFPE tumor tissues.
Tumors are preserved as FFPE tissues for routine histology based diagnosis. MiRNAs being
small in size are known to be protected from degradation during the process of formalin
fixation.15 In the present study as well, the integrity of miRNAs was found to be considerably
higher (600 fold) than that of protein-coding genes making evaluation of miRNA expression
reliable, reproducible, and sensitive, even in 7 to 8 yr old FFPE tumor tissues.
The four molecular subgroups of medulloblastomas are not only biologically distinct
but also differ significantly in their clinical characteristics. Molecular classification of
medulloblastomas is therefore necessary for better risk stratification in routine clinical
practice. The assay for accurate classification of medulloblastomas based on 12 protein-coding
genes and 9 miRNAs was developed and validated on an independent set of well annotated
FFPE medulloblastomas from DKFZ, Germany. The present assay was found to be
comparable to the reported 98% accuracy of the NanoString assay using 22 subgroup specific
protein-coding genes as markers.14 The real time PCR technology being highly sensitive
xiv
allows analysis of the expression levels of protein-coding genes and miRNAs from FFPE
tissues having considerable RNA degradation. The assay is rapid, inexpensive and uses real-
time PCR technology that is now commonly available in molecular pathology labs across the
world. Further, the assay includes oncogenes like MYCN, MYC and OTX2 which have utility
in further risk stratification. Group 3/Group 4 medulloblastomas over-expressing miR-182 or
under-expressing miR-592 were found to have significantly poor overall survival rates. These
miRNAs could therefore act as surrogate markers for Group 3/Group 4 classification and as
markers for risk stratification of non-WNT, non-SHH FFPE medulloblastomas. Thus,
miRNAs not only served as markers for molecular classification but were also found to be
useful as independent markers for risk stratification.
This is the first comprehensive analysis of medulloblastomas from an Indian cohort.
The age at diagnosis, histology and gender related incidences and the relative survival rates of
the four molecular subgroups in the present Indian cohort were found to be similar to those
reported for the medulloblastomas from the American and European subcontinent, suggesting
uniform mechanisms of medulloblastoma pathogenesis.3 This further validated the use of this
assay for disease sub-classification. The Indian cohort however, showed striking differences
from the reported medulloblastoma incidences. None of the 17 adult patients belonged to
Group 4 in the adult patient age group and the frequency of WNT subgroup tumors was found
to be much higher in the present Indian cohort than reported (22 % v/s 11 %). 3 Genomic
analysis, particularly of WNT subgroup tumors, is necessary to understand the genetic basis if
any for these observed characteristics of the Indian cohort of medulloblastomas.
Medulloblastomas having WNT pathway activation have been reported to have lower
metastatic potential and excellent survival rates.16 Many of the miRNAs associated with the

Synopsis
xv
WNT subgroup in this study have been reported to have potential tumor/ metastasis
suppressive role. Overexpression of miR-224 has been shown to promote apoptosis of
hepatocellular carcinoma cells by targeting API5.17 MiR-193a-3p expression has been found to
be downregulated in oral squamous cell carcinoma cell lines as a result of tumor-specific CpG
island hypermethylation and its ectopic expression has been found to be growth inhibitory to
these cell lines.18 MiR-23b cluster miRNAs inhibit TGF-β signaling by targeting SMAD
proteins.19 In the present study, exogenous expression of miR-193a-3p and miR-224 was
found to inhibit proliferation, increase radiation sensitivity and reduce anchorage-independent
growth of medulloblastoma cells indicating their potential tumor- suppressive role. Detailed
functional studies and target identification is required for these miRNAs to serve as important
biomarkers for risk stratification and as a novel therapeutic strategy in non-WNT
medulloblastomas.
REFERENCES:
1. Polkinghorn WR, Tarbell NJ. Medulloblastoma: tumorigenesis, current clinical paradigm, and efforts to improve risk stratification. Nat Clin Pract Oncol 2007;4(5):295-304.
2. Rossi A, Caracciolo V, Russo G, Reiss K, Giordano A. Medulloblastoma: from molecular pathology to therapy. Clin Cancer Res 2008;14(4):971-6.
3. Kool M, Korshunov A, Remke M, Jones DT, Schlanstein M, Northcott PA, et al. Molecular subgroups of medulloblastoma: an international meta-analysis of transcriptome, genetic aberrations, and clinical data of WNT, SHH, Group 3, and Group 4 medulloblastomas. Acta Neuropathol 2012;123(4):473-84.
4. Gokhale A, Kunder R, Goel A, Sarin R, Moiyadi A, Shenoy A, et al. Distinctive microRNA signature of medulloblastomas associated with the WNT signaling pathway. J Cancer Res Ther 2010;6(4):521-9.
5. Kool M, Koster J, Bunt J, Hasselt NE, Lakeman A, van Sluis P, et al. Integrated genomics identifies five medulloblastoma subtypes with distinct genetic profiles, pathway signatures and clinicopathological features. PLoS One 2008;3(8):e3088.
6. Northcott PA, Korshunov A, Witt H, Hielscher T, Eberhart CG, Mack S, et al. Medulloblastoma comprises four distinct molecular variants. J Clin Oncol 2011;29(11):1408-14.

xvi
7. Cho YJ, Tsherniak A, Tamayo P, Santagata S, Ligon A, Greulich H, et al. Integrative genomic analysis of medulloblastoma identifies a molecular subgroup that drives poor clinical outcome. J Clin Oncol 2011;29(11):1424-30.
8. Taylor MD, Northcott PA, Korshunov A, Remke M, Cho YJ, Clifford SC, et al. Molecular subgroups of medulloblastoma: the current consensus. Acta Neuropathol 2012;123(4):465-72.
9. Ambros V. MicroRNA pathways in flies and worms: growth, death, fat, stress, and timing. Cell 2003;113(6):673-6.
10. Calin GA, Croce CM. MicroRNA signatures in human cancers. Nat Rev Cancer 2006;6(11):857-66.
11. Korbler T, Grskovic M, Dominis M, Antica M. A simple method for RNA isolation from formalin-fixed and paraffin-embedded lymphatic tissues. Exp Mol Pathol 2003;74(3):336-40.
12. Tibshirani R, Hastie T, Narasimhan B, Chu G. Diagnosis of multiple cancer types by shrunken centroids of gene expression. Proc Natl Acad Sci U S A 2002;99(10):6567-72.
13. Northcott PA, Fernandez LA, Hagan JP, Ellison DW, Grajkowska W, Gillespie Y, et al. The miR-17/92 polycistron is up-regulated in sonic hedgehog-driven medulloblastomas and induced by N-myc in sonic hedgehog-treated cerebellar neural precursors. Cancer Res 2009;69(8):3249-55.
14. Northcott PA, Shih DJ, Remke M, Cho YJ, Kool M, Hawkins C, et al. Rapid, reliable, and reproducible molecular sub-grouping of clinical medulloblastoma samples. Acta Neuropathol 2012;123(4):615-26.
15. Doleshal M, Magotra AA, Choudhury B, Cannon BD, Labourier E, Szafranska AE. Evaluation and validation of total RNA extraction methods for microRNA expression analyses in formalin-fixed, paraffin-embedded tissues. J Mol Diagn 2008;10(3):203-11.
16. Ellison DW, Onilude OE, Lindsey JC, Lusher ME, Weston CL, Taylor RE, et al. beta-Catenin status predicts a favorable outcome in childhood medulloblastoma: the United Kingdom Children's Cancer Study Group Brain Tumour Committee. J Clin Oncol 2005;23(31):7951-7.
17. Wang Y, Lee AT, Ma JZ, Wang J, Ren J, Yang Y, et al. Profiling microRNA expression in hepatocellular carcinoma reveals microRNA-224 up-regulation and apoptosis inhibitor-5 as a microRNA-224-specific target. J Biol Chem 2008;283(19):13205-15.
18. Kozaki K, Imoto I, Mogi S, Omura K, Inazawa J. Exploration of tumor-suppressive microRNAs silenced by DNA hypermethylation in oral cancer. Cancer Res 2008;68(7):2094-105.
19. Rogler CE, Levoci L, Ader T, Massimi A, Tchaikovskaya T, Norel R, et al. MicroRNA-23b cluster microRNAs regulate transforming growth factor-beta/bone morphogenetic protein signaling and liver stem cell differentiation by targeting Smads. Hepatology 2009;50(2):575-84.

Synopsis
xvii

xviii
LIST OF FIGURES
Figure No. Title Page No.
Figure 1.1. Anatomy of the brain and location of medulloblastoma. 2 Figure 2.1. The Sonic-Hedgehog signaling pathway 12 Figure 2.2. The canonical WNT signaling pathway 15 Figure 2.3. The four molecular subgroups of medulloblastoma 20 Figure 2.4. Biogenesis of microRNAs 25 Figure 3.1. Stem- loop RT-PCR for miRNA 49 Figure 4.1. Heat map depicting expression of subgroup specific signature
genes for each of the four subgroups 74 Figure 4.2. Heat map showing expression of 54 miRNAs significantly
differentially expressed in the molecular subgroups of medulloblastomas and normal cerebellar tissues as judged by SAM analysis with a False Discovery Rate of 0 %. 76
Figure 4.3. Support tree analysis 78 Figure 4.4. Molecular- subgrouping of medulloblastomas by real- time
RT-PCR using 12 protein- coding genes. 82 Figure 4.5. Mutation analysis of exon 3 of β-catenin (CTNNB1) in the
WNT subgroup FFPE medulloblastomas 83 Figure 4.6. Validation of differential miRNA expression in
medulloblastomas by real time RT-PCR. 85 Figure 4.7. House-keeping gene (GAPDH) and small RNA control
(RNU48) Ct value correlation with age of the block. 86 Figure 4.8. Functional analysis of WNT – specific miRNAs on the
growth and malignant potential of medulloblastoma cells 88 Figure 4.9. Heat map showing differential expression of 12 protein-
coding genes and 9 miRNAs in the 101 tumor tissues 91 Figure 4.10. Centroid plot 92 Figure 4.11. Classification of medulloblastoma samples using PAM 93 Figure 4.12. Heat Map showing expression profile of 12 protein-coding
genes and 9 miRNAs in the DKFZ FFPE medulloblastoma set 94
Figure 4.13. ROC curve Analysis to determine the strength of the classifier 95
Figure 4.14. Demographic profile of the four molecular subgroups. 97 Figure 4.15. Kaplan- Meier survival analysis 99

xix
LIST OF TABLES
Table No. Title Page No.
Table 2.1. Post-operative risk stratification of medulloblastoma patients 8
Table 3.1. Nucleotide sequences of the primers used for SYBR Green Real-time PCR analysis. 43
Figure 4.1. MiRNAs significantly differentially expressed in each medulloblastoma subgroup as compared to both normal cerebellar tissues as well as other subgroups as obtained by SAM analysis at FDR 0 %. 77

xx
ABBREVIATIONS
BCL2 B-cell lymphoma 2
C9ORF3 Chromosome 9 open reading frame 3
CDK4 Cyclin-dependent kinase 4
cDNA complementary deoxyribonucleic acid
COL3A1 Collagen, type III, alpha 1
dATP deoxyadenosine triphosphate
dCTP deoxycytidine triphosphate
DEPC Diethylpyrocarbonate
dGTP deoxyguanosine triphosphate
DMEM Dulbecco’s minimum essential (or modified Eagle) medium
DMSO Dimethyl sulfoxide
DNA Deoxyribonucleic acid
DNase Deoxyribonuclease
dNTP deoxynucleoside triphosphate
DTT Dithiothreitol
dTTP deoxythymidine triphosphate
E2F6 E2F transcription factor 6
EGFR Epidermal growth factor receptor
EDTA Ethylenediaminetetraacetic acid
EtBr Ethidium bromide
FBS Fetal bovine serum
FFPE Formalin-fixed paraffin-embedded
GABRE Gamma-aminobutyric acid receptor subunit epsilon
HBTR Human Brain Tissue Repository
HMGA2 High-mobility group AT-hook 2
IGFBP4 Insulin-like growth factor binding protein 4
ITGA1 Integrin alpha 1
MMLV Moloney murine leukemia virus
MOPS 3- (N-morpholino) propane sulfonic acid

xxi
mRNA messenger ribonucleic acid
miRNA microRNA
OD Optical density
PCR Polymerase chain reaction
PDCD4 Programmed cell death 4
PDGFRB Platelet-derived growth factor receptor beta
PLAU Plasminogen activator, urokinase
PTEN Phosphatase and tensin homolog
RNA Ribonucleic acid
RNase Ribonuclease
RPL10 Ribosomal protein L10
RPL18 Ribosomal protein L18
RQ Relative quantity
RT Reverse transcriptase
SDS Sodium dodecyl sulphate
Tris Tris (hydroxymethyl) aminomethane
TRPM3 Transient receptor potential cation channel subfamily M member 3
UTR Untranslated region
UV Ultraviolet
µl micro liter
µg micro gram
µM micro molar
WHO World Health Organization

INTRODUCTION
Chapter 1
1
INTRODUCTION
Central nervous system (CNS) tumors are the second most common cancers diagnosed in
children after leukemia and continue to be the leading cause of cancer-related mortality in
children [1]. Medulloblastoma, a tumor of the cerebellum, is the most common malignant
brain tumor in children and constitutes approximately 20 % of all pediatric brain tumors
[2]. It typically arises in the roof of the fourth ventricle, grows in the cerebellar vermis,
fills the ventricle and can invade the floor of the ventricle to involve the brainstem (Figure
1.1). In a smaller proportion of patients, the tumor arises in the cerebellar hemisphere [3].
Medulloblastomas have a tendency to spread through the cerebrospinal fluid into the
craniospinal axis and approximately 30 % children show presence of metastasis at
diagnosis. Owing to their aggressive nature, World Health Organization (WHO) classifies
all medulloblastomas pathologically as Grade IV, the highest grade of malignancy [4].
Risk stratification of medulloblastoma patients is based on clinical parameters like
age at diagnosis, presence of metastasis at diagnosis and extent of post-operative residual
disease. Patients less than 3 yrs of age or those with ≥ 1.5 cm2 post-operative residual
tumor or metastasis at diagnosis are classified as high risk, while all others are classified as
average risk [5]. Current treatment regimen for medulloblastoma includes a combination of
surgery, cranio-spinal radiation (for children older than 3 yr) and chemotherapy. With this
multimodal treatment 5-year overall survival of average risk patients has improved to 85 %
and that of high risk patients to 70 % [6]. However, the 5-year disease-free survival
remains low (36 %) for patients with metastasis, and prognosis remains poor for patients
with recurrent medulloblastoma [7]. In addition, most long–term survivors usually suffer
from permanent neurocognitive impairment, endocrine dysfunction, psychiatric and
developmental deficits and in some cases secondary malignancies arising due to the

2
Figure 1.1: Anatomy of the brain and location of medulloblastoma. (A) Sagittal section of the
brain denoting the location of the cerebellum (red arrow), fourth ventricle and the brain stem.
Image take from Understanding brain tumors – ABTA www.abta.org (B) MRI scan of a 4 yr old
child with medulloblastoma (red arrow) [8].
intensive therapies administered to the developing child brain [9]. The current strategy of
risk-stratification is imprecise as it fails to identify 20-30 % of average risk patients with
resistant disease or the average risk patients with excellent prognosis who might be
overtreated with current protocols [5]. Moreover, metastasis does not always serve as a
predictor of high risk as survival of young children with metastatic disease has been
reported to be as favorable as those with non-metastatic disease [10]. Understanding the
molecular biology of medulloblastomas is therefore vital for development of accurate risk
stratification protocols and thereby appropriate treatment strategies.
Medulloblastoma is thought to result from deregulated nervous system
development, as it is prevalent in children and occurs in a region of the brain that develops
post-natally. Common genetic alterations like TP53 mutation, p16INK4A deletion, K-Ras
mutation, EGFR mutation /amplification, identified in other cancers, are either rare or not
known to be present in medulloblastomas [11]. First insight about the involvement of
developmental pathways in medulloblastomas came from the study of two familial cancer
syndromes: Turcot syndrome and Gorlin syndrome. Patients with Turcot and Gorlin

Chapter 1: Introduction
3
syndrome were found to have a predisposition to develop various cancers, including
medulloblastoma and harbored mutations in genes involved in the WNT and Sonic
Hedgehog (SHH) signaling pathways respectively [12-13]. Subsequently, mutations in
WNT pathway genes (CTNNB1, APC, AXIN1) and SHH pathway genes (PTCH1, SUFU,
SMO) were identified in ~10 % and ~25 % of sporadic medulloblastomas respectively,
suggesting the role of aberrantly activated WNT and SHH pathways in medulloblastoma
pathogenesis [14].
Application of genome-wide expression profiling techniques has contributed
extensively towards further characterization of medulloblastoma, which is now recognized
as a molecularly heterogeneous disease rather than just a single entity. Following the initial
discrepancies over the number of medulloblastoma subgroups identified by various studies,
expression profiling data from our lab [15] as well as another report [16], and now the
current consensus suggests that, medulloblastoma consists of four core molecular
subgroups. These include the previously known WNT, SHH and two other subgroups
Group 3 and Group 4. Each of these molecular subgroups exhibit distinct transcriptional
profiles, structural variations, and mutational spectra in addition to diverse clinical profiles
[17]. The current subgrouping structure of medulloblastoma has changed the way this
tumor is studied both in research and in the planning of clinical trials. The advent of next-
generation sequencing technologies in the last couple of years has revolutionized the
understanding of the genomes of various cancers. One of the novel finding emerging from
the next-generation sequencing of cancer genomes is the frequent occurrence of mutations
in chromatin modifying genes in most cancers including medulloblastoma, implicating
deregulation of the epigenome as an important event in its pathogenesis [18]. Epigenetic
alterations include DNA methylation, histone modifications, and microRNA deregulation.
4
MicroRNAs (miRNAs) are a class of small (~22 nucleotides) non-coding RNA
molecules that function by regulating target gene expression post-transcriptionally.
MiRNAs have been shown to regulate a wide array of cell functions ranging from cell
proliferation, differentiation, apoptosis, etc. [19]. A single miRNA is predicted to target an
average of over a 100 different protein-coding genes and therefore deregulation of
miRNAs could lead to significant pathogenic alterations including tumorigenesis [20]. In
fact, most miRNA expression analyses of human cancers have arrived at a common
conclusion that miRNAs are deregulated in cancer [21]. Moreover, miRNA expression
profile has been shown to be useful in classifying tumors based on their differentiation
status, developmental origin and in predicting disease progression, with the conclusion that
miRNA expression profile represents tumor biology better than the expression profile of
protein-coding genes [22]. Specific miRNAs are known to be expressed in the brain and
play a role in nervous system development and their deregulation may thereby contribute
towards the pathogenesis of tumors like medulloblastoma, resulting from deregulated
nervous system development [23].
Hence, for further understanding of the molecular mechanism underlying
medulloblastomas pathogenesis, it is crucial to study the role played by miRNAs and their
functional significance in the development of this tumor. Besides, miRNAs being small in
size are protected from degradation during the process of formalin-fixation and hence can
also be reliably studied in formalin-fixed paraffin-embedded (FFPE) tissues, which
constitute the routine clinical material in most pathology labs worldwide [24]. Several
studies have shown an excellent correlation between miRNA expression in fresh frozen
and FFPE tissues with most of them suggesting miRNAs as better analytes than protein-
coding gene mRNAs for molecular characterization of clinical samples [25-26].
Chapter 1: Introduction
5
AIM
The aim of the present project was therefore to identify miRNAs that are likely to play a
role in medulloblastoma pathogenesis for further understanding of the molecular
mechanism underlying this tumor.
OBJECTIVES
1. MicroRNA profiling of medulloblastoma tissues so as to identify distinct molecular
subgroups.
2. Delineate the role of specific miRNAs in medulloblastoma pathogenesis.
Briefly, the study presented in this thesis involves:
1. miRNA profiling to identify miRNAs differentially expressed in medulloblastomas
using Taqman Low Density Array v 1.0 containing 365 miRNAs
2. Validation of the expression of a select set of miRNAs significantly differentially
expressed in the four molecular subgroups by real time RT-PCR.
3. Elucidation of the functional significance of WNT subgroup specific miRNAs in
the growth and malignant potential of medulloblastoma cells.
4. Development of an assay based on real time RT-PCR for molecular classification
of medulloblastomas using a select set of protein- coding genes and miRNAs as
markers.
5. Correlation of the molecular subgrouping and miRNA expression with clinico-
pathological variables, in an Indian cohort of 103 medulloblastomas.

REVIEW OF LITERATURE
Chapter 2

6
REVIEW OF LITERATURE
2.1. Medulloblastoma: Brief history and Nomenclature
The term ‘medulloblastoma’ was introduced by Percival Bailey and Harvey Cushing in the
June of 1925, during their course of a survey of 400 gliomas from the Peter Bent Brigham
Hospital [27]. Twenty nine patients, primarily children, were reported with “a very cellular
tumor of a peculiar kind” of which in 24 the tumor was in the cerebellar vermis, arising
over the roof of the fourth ventricle. Initially considered a subtype of glioma, this soft,
suckable midline cerebellar lesion was termed as 'spongioblastoma cerebelli'. Globus and
Strauss, however, had used the term ‘spongioblastoma multiforme’ to describe a series of
cerebral tumors that showed considerable cellular differentiation, a feature absent in the
cerebellar tumors. To avoid further confusion, the tumor was renamed as medulloblastoma
to describe the group of undifferentiated tumors, with a distinct microscopic appearance,
that set them apart from all the other tumors of the glioma series [27]. These tumors were
so named, as they were thought to arise from a hypothetical, central nervous system (CNS)
precursor cell, the ‘medulloblast’, with the capacity to differentiate along both glial and
neuronal lines as against the spongioblast and apolar neuroblast [28-29].
2.2. Epidemiology
Medulloblastoma is the most common malignant brain tumor of childhood, accounting for
20 % of all pediatric brain tumors and 40 % of childhood posterior fossa tumors [2, 30].
The overall incidence of medulloblastoma is approximately 1.5 per million population in
the USA per year and the incidence worldwide seems to approximate that in the United
States [31]. Approximately 70 % of medulloblastoma cases occur in childhood (3-15 yr of
age), with 10-15 % cases in infants (< 3 yr of age). Although medulloblastoma is known to
7
occur in adults, they account for <1 % of all adult CNS tumors. There is a bi-modal
distribution in the age of incidence, with peaks at 3-4 years and 8-9 years of age.
Medulloblastomas have been shown to be predominant in males than in females, with a
gender ratio of about 1.5-2:1. Males > 3 yr of age have been reported to have the worst
prognosis [6, 30, 32].
2.3. Classification of medulloblastomas
Although the new term ‘medulloblastoma’ provided uniformity of classification to
pediatric posterior fossa tumors, it was controversial as the existence of the medulloblast
had never been proven [28]. This led Rorke to include medulloblastomas in a group of
histologically similar CNS tumors, called primitive neuroectodermal tumors (PNETs) and
then subdivide them on the basis of location, and other histological or clinical features,
such as evidence for cellular differentiation [33]. Gene-array data by Pomeroy et al,
however, confirmed that medulloblastomas are molecularly distinct from other brain
tumors including PNETs, atypical teratoid / rhabdoid tumors (AT/RTs) and malignant
gliomas [34]. World Health Organization (WHO) classifies medulloblastoma as a grade IV
embryonal tumor owing to its aggressive behavior and further recognizes five distinct
histological variants: classic, desmoplastic / nodular (DN), medulloblastoma with
extensive nodularity (MBEN), large cell and anaplastic medulloblastoma [4].
Classic medulloblastoma is by far the most common and is characterized by sheets
of small uniform cells with a high nuclear-to-cytoplasmic ratio. The desmoplastic / nodular
medulloblastomas in contrast combines nodules of differentiated neurocytic cells with a
low growth fraction separated by reticulin-rich desmopastic inter-nodular zones of
moderately pleiomorphic cells with a high growth fraction. MBEN are closely related to
nodular / desmoplastic medulloblastomas, and contain particularly large nodules and

Chapter 2: Review of Literature
8
advanced neuronal differentiation. This variant presents most often in infants and has been
associated with favorable prognosis. The large-cell medulloblastoma contains groups of
cells with large pleomorphic nuclei, a prominent nucleoli and abundant cytoplasm, high
mitotic and apoptotic rate. The anapastic medulloblastoma is marked by nuclear
pleomorphism, nuclear moulding, cell-cell wrapping, and high mitotic and apoptotic
activity. Both large cell and anaplastic histology in medulloblastomas has been associated
with poor prognosis. Because large-cell and anaplastic medulloblastomas share morpho-
phenotypes and an aggressive biological behavior, they have been typically grouped as
large-cell / anaplastic (LC/A) tumors in studies of medulloblastoma [8, 29].
2.4. Risk stratification and treatment
Risk stratification for the selection of treatment for medulloblastoma places patients into
either average risk or high risk categories based on 3 clinical criteria (i) age at diagnosis,
(ii) extent of resection (iii) Chang metastasis staging (Table 2.1). According to this
classification, patients older than 3 years of age with non-metastatic disease and totally or
near totally resected tumors (<1.5 cm2 of postoperative residual tumor) are considered
‘average risk’ while all others are regarded as ‘high risk’ [5].
Table 2.1: Post-operative risk stratification of medulloblastoma patients.

9
Significant progress has been made over the past 80 years towards the treatment of
what was once considered a fatal disease. Earlier, with surgery as the only treatment, the
survival of medulloblastoma patients was dismal. This was primarily due to the propensity
of medulloblastomas to metastasize and disseminate into the craniospinal axis with
approximately 30% of children demonstrating cerebrospinal fluid (CSF) metastasis at
diagnosis [8]. The first breakthrough in medulloblastoma treatment came with the
introduction of craniospinal irradiation (CSI) in the 1950s [35]. This treatment strategy was
proposed as a result of metastasis in the brain and spinal cord found on postmortem
examination. By treating the whole craniospinal axis to a radiation dose of about 35 Gray
(Gy), delivered in fractions of 1.6 Gy per day, and 50 Gy to the posterior fossa, almost two
thirds of patients went on to become at least 3-year survivors [28]. Average risk
medulloblastoma patients are currently treated with a low-dose craniospinal radiation (24
Gy) in combination with chemotherapy, following surgery [7, 36]. In contrast to other
brain tumors in which the treatment is primarily surgery, medulloblastoma is sensitive to
not only radiation but also chemotherapy. Current treatment therefore includes surgical
resection followed by craniospinal radiation and chemotherapy [37].
Children < 3 yr age are considered a separate group, unfortunately also with a poor
prognosis due to a likely combination of more aggressive disease and lower tolerance to
treatment compared to older children. The devastating effects on the developing brain
caused by the radiotherapy in young children have been well documented. As a result,
surgery followed by chemotherapy alone is the most widely accepted treatment, with the
focus to defer or prevent radiotherapy altogether [37-38]. Recently it was shown that
young children (<5 yr at diagnosis) with desmoplastic / MBEN histology have a favorable
outcome with 8 yr event free survival (EFS) rates of 55 % as compared to 27 % and 14 %
in children with classic and large cell / anaplastic histology respectively [10].

Chapter 2: Review of Literature
10
2.5. Challenges in medulloblastoma treatment
Although the multi-modal treatment has improved the 5-yr survival rate, around one-third
of the patients with medulloblastoma remain incurable. For those that survive, current
treatments have significant morbidity. Surgery carries a high risk of the development of
post-operative cerebellar mutism [39]. Radiation therapy leads to neurocognitive
impairment, endocrine dysfunction, psychiatric and developmental deficits and in some
cases secondary malignancies [9, 40]. Chemotherapy at the current doses used to treat
medulloblastoma patients most often results in hearing loss, infertility and neuropathies
[6]. These treatment sequelae become especially pronounced the younger a patient is at the
time of treatment. The current parameters for risk-stratification are inadequate for
accurately classifying patients to average risk and high risk, thus failing to treat high risk
patients with a more aggressive therapy whilst over-treating the average risk patients
causing unnecessary treatment sequelae [5]. Considerable efforts have been focused
towards identification of molecular markers which could help in better risk-stratification
and treatment, that would ultimately lead to improved patient outcome with reduced long-
term sequelae.
2.6. Molecular genetics of medulloblastoma
Genetic alterations in common oncogenes / tumor suppressor genes, liked TP53 mutation,
EGFR mutation / amplification, p16INK4A deletion are relatively rare in medulloblastoma
[11]. The most common genetic alteration reported in medulloblastoma is the
isochromosome 17q (i17q), a rearrangement that is brought about by simultaneous loss of
chromosome 17p and gain of 17q. i17q has been identified in around 40-50 % of tumors
and has been associated with an unfavorable prognosis [8, 41].

11
Medulloblastoma was thought to be caused by deregulated nervous system
development, due to its prevalence in children, in the region of the brain that develops
post-natally and the presence of both neuronal and glial differentiation markers, suggesting
neural stem cells as the cells of origin [42]. Molecular analysis of two familial cancer
syndromes, Gorlin and Turcot syndromes provided valuable insights into the molecular
pathogenesis of medulloblastoma. Germline mutations in PTCH1 (PATCHED1) gene that
encodes a protein which is a membrane-bound receptor in the Sonic Hedgehog (SHH)
pathway, were identified in patients with Gorlin syndrome, wherein the affected
individuals developed basal cell carcinoma and had an increased incidence of
medulloblastoma [13]. In Turcot syndrome, affected individuals were found to possess
germline mutations in Adenomatous Polyposis Coli (APC), a tumor suppressor gene that
negatively regulates β-catenin, which is the key effector of the WNT signaling pathway.
These patients had a predisposition to develop colorectal cancers and brain tumors,
including medulloblastoma [12]. Through these analyses the SHH and WNT signaling
pathways that are critical for normal cerebellar development, were implicated in the
development of medulloblastoma.
2.6.1. Sonic-Hedgehog signaling pathway
The Hedgehog signaling pathway plays an important role in embryonic development with
involvement in stem-cell maintenance, tissue polarity, cell differentiation and proliferation.
Originally defined in 1980 through genetic analysis in Drosophila melanogaster, the
hedgehog gene (Hh) was named after the short and “spiked” phenotype of the cuticle of
the Hh mutant Drosophila larvae [43]. Subsequently, three mammalian homologues of the
Hh gene were identified: Desert Hedgehog (DHH), Indian Hedgehog (IHH), and Sonic
Hedgehog (SHH), with SHH being the most broadly expressed mammalian Hh signaling
Chapter 2: Review of Literature
12
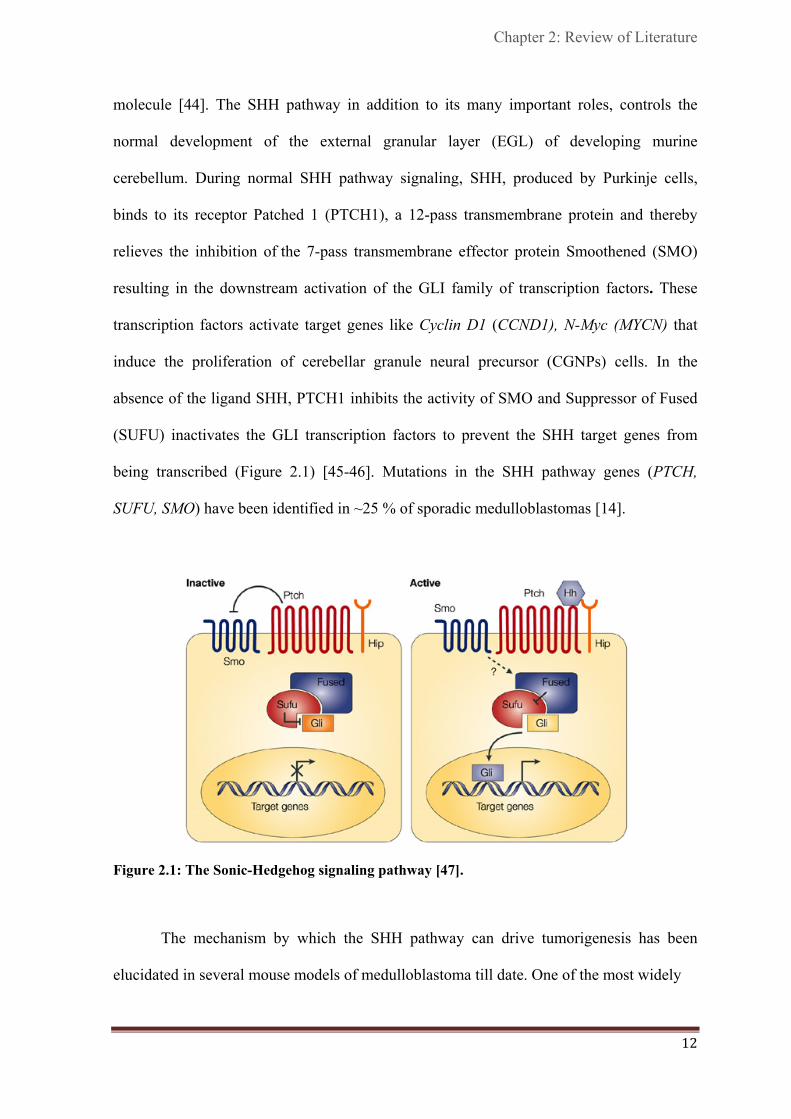
molecule [44]. The SHH pathway in addition to its many important roles, controls the
normal development of the external granular layer (EGL) of developing murine
cerebellum. During normal SHH pathway signaling, SHH, produced by Purkinje cells,
binds to its receptor Patched 1 (PTCH1), a 12-pass transmembrane protein and thereby
relieves the inhibition of the 7-pass transmembrane effector protein Smoothened (SMO)
resulting in the downstream activation of the GLI family of transcription factors. These
transcription factors activate target genes like Cyclin D1 (CCND1), N-Myc (MYCN) that
induce the proliferation of cerebellar granule neural precursor (CGNPs) cells. In the
absence of the ligand SHH, PTCH1 inhibits the activity of SMO and Suppressor of Fused
(SUFU) inactivates the GLI transcription factors to prevent the SHH target genes from
being transcribed (Figure 2.1) [45-46]. Mutations in the SHH pathway genes (PTCH,
SUFU, SMO) have been identified in ~25 % of sporadic medulloblastomas [14].
Figure 2.1: The Sonic-Hedgehog signaling pathway [47].
The mechanism by which the SHH pathway can drive tumorigenesis has been
elucidated in several mouse models of medulloblastoma till date. One of the most widely
13
studied models of medulloblastoma is the Ptc mutant mouse. Mice heterozygous for the
Ptc mutation (Ptc+/-) developed medulloblastomas at an incidence of 10-15 % and
expressed high levels of GLI1, consistent with the activation of SHH pathway [48].
Another mouse model used, Smo, the activator component of the SHH receptor complex
wherein, mice homozygous for activating mutation in Smo were shown to develop
medulloblastomas at an incidence of 94 % by around 2-4 months of age [49]. These
models have been instrumental in the discovery of several drugs, that have entered clinical
trials, which inhibit proteins activated by the SHH pathway. However, efforts have been
undermined largely because of the rapid emergence of resistance mutations [50].
2.6.2. WNT signaling pathway
The WNT signaling pathway has been implicated to play a role in a wide array of vital
biological processes ranging from embryogenesis to stem cell pluripotency and cell fate
decisions during development to cell behavior and in several diseases, especially cancer.
Back in 1982, Roel Nusse and Harold Vamus identified a new proto-oncogene named Int1
(integration 1), upon infecting mice with mouse mammary tumor virus (MMTV) in order
to identify genes that could cause breast cancer. Int1 was found to be conserved across
species from humans to Drosophila. Subsequently, in 1987 it was found that the
mammalian Int1 homologue in Drosophila was actually Wingless (Wg), a segment polarity
gene involved in embryonic development in Drosophila. Therefore, a new hybrid term
‘Wnt’ (for Wingless-related integration site) was coined to denote genes belonging to the
Int1/Wingless family, with Int1, now called Wnt1 [51]. Wnt ligands, a family of secreted
cysteine-rich glycosylated proteins, signal by two pathways: canonical (Wnt-1, Wnt-3a and
Wnt-8) and non-canonical (Wnt-4, Wnt-5a and Wnt-1) [52].

Chapter 2: Review of Literature
14
The key component of the canonical WNT signaling pathway is β-catenin. In the
absence of the Wnt ligands, cytoplasmic β-catenin is recruited into the destruction complex
where it is N-terminal phosphorylated by Casein kinase-1 (CK-1) and Glycogen synthase
kinase – 3 beta (GSK-3β). Upon phosphorylation, β-catenin is recognized by E3 ubiquitin
ligase beta-transducin repeat containing protein (β-TrCP) which targets it for proteasomal
degradation, ensuring that cytoplasmic levels of β-catenin remain low. The T-cell factor /
lymphoid enhancer factors (TCF/LEFs) form a complex with Groucho and histone
acetylases to repress WNT target genes. Activation of the canonical WNT signaling
pathway is initiated by binding of the ligand Wnt to a receptor complex composed of a
seven-pass transmembrane receptor Frizzled (FZD) and its co-receptor low density
lipoprotein receptor-related protein 5 (LRP5) or LRP6 in the plasma membrane. This
interaction can be inhibited by Secreted frizzled-related proteins (SFRPs), Dickkopf
(DKK) family proteins and WNT-inhibitory factor 1 (WIF1) that act as negative regulators
of this pathway. Next, Dishevelled (DSH) is recruited to the plasma membrane where it
interacts with Frizzled to mediate the translocation of AXIN to the membrane and
destabilization of the multiprotein destruction complex, APC/AXIN/GSK-3β. This
inactivation enables the stabilization and further nuclear translocation of β-catenin to the
nucleus where it forms a complex with TCF/LEF transcription factors. Binding of β-
catenin to TCF/LEF alleviates the repressive activity of Groucho, activating WNT target
genes such as MYC, CCND1, etc. (Figure 2.2) [53-54]. Mutations in the WNT pathway
genes [CTNNB1 (β-catenin gene), APC, and AXIN] have been identified in approximately
10 % of sporadic medulloblastomas [14]. β-catenin nucleo-positivity has been reported to
be a predictor of favorable outcome in medulloblastomas with mutations in CTNNB1 being
present exclusively in these nucleo-positive tumors [56].

15
Figure 2.2: The canonical WNT signaling pathway. a) In absence of WNT ligand (Inactive). (b)
In the presence of WNT ligand (Active) [55].
2.7. Expression profiling of medulloblastomas
High-throughput, integrative studies using gene expression profiling, array comparative
genomic hybridization (aCGH) and single nucleotide polymorphism (SNP) have proved
useful in identifying molecular subgroups of medulloblastomas.
Thompson et al. performed expression profiling of 46 medulloblastomas using
Affymetrix gene chip HG-U133A that contains 18,400 transcripts and variants [57]. This
study identified five distinct subgroups of medulloblastomas enriched for specific genetic
alterations. Although the study clearly identified tumors with WNT and SHH pathway
activation profiles, these tumors did not segregate into distinct subgroups. The tumors with
WNT and SHH activation profiles however, were strongly associated with CTNNB1
mutation, monosomy 6 and PTCH1, SUFU mutations respectively using
immunohistochemistry (IHC), fluorescence in situ hybridization (FISH), and mutational
screening data.

Chapter 2: Review of Literature
16
The first study classifying medulloblastoma into distinct molecular subgroups
based on their gene expression profiles came from the study by Kool et al. on 62
medulloblastomas using a more updated Affymetrix chip (HG-U133 plus2.0 array) with
twice as many probe sets than the one used by Thompson [58]. Five molecular subgroups
(A-E) were identified wherein WNT (A) and SHH (B) pathway activated tumors formed
two distinct subgroups. The three remaining subgroups (C/D/E) were more related to each
other and characterized by elevated expression of neuronal differentiation genes, glutamate
and gamma-aminobutyric acid receptors (C/D) and photoreceptor genes (D/E). Both WNT
and SHH subgroup clusters were supported by close to 100 % bootstrap support while the
remaining clusters seemed more closely related and hence with a weaker support.
Importantly, Kool et al. also re-analyzed the data by Thompson et al. and identified four
subgroups of medulloblastomas viz., A (WNT), B (SHH), C and DE. This discrepancy was
due to the inclusion of mismatched probes in the analysis by Thompson et al. that must
have contributed to the false high intensity hybridization signals while Kool et al. used
only one probe set having the highest signal intensity for the analysis. The study by Kool et
al. also for the first time showed a strong association between patient age, gender,
histology and molecular subgroups. Subgroups C/D/E were shown to be more associated
with an increased incidence of metastatic disease.
In 2010, Northcott and colleagues reported a study on 103 samples integrating the
gene expression data with DNA copy number alterations using high density SNP arrays,
confirming results from previous studies [16]. This study was the first comprehensive
study which correlated the molecular subgrouping with survival outcome in addition to
other parameters like demographics, clinical presentation, gene expression profiles and
genetic abnormalities Unsupervised hierarchical clustering identified the same molecular
subgroups as described by Kool et al. except that the two related subgroups C and D, seen

17
as two distinct subgroups in the study of Kool et al., were now seen as one subgroup,
called Group D.
Cho and colleagues, in 2011, performed the largest gene expression and SNP array
analysis on 194 medulloblastomas, and identified six subgroups (c1 to c6) [59]. WNT (c6)
and SHH (c3) subgroups revealed characteristics similar to that reported by other groups.
Importantly, their analysis further subdivided Northcott Group C (c1 and c5) and Group D
(c2 and c4) indicating ‘subgroups within subgroup’. Notably, they showed that subgroup
c1 characterized by high levels of MYC expression was associated with MYC
amplifications as well as increased expression of photoreceptor associated transcripts and
GABRA5, had poorer survival as compared to subgroup c5. Their study thus emphasized
the importance of treatment stratification based on molecular subgroups with intensive
treatment restricted to the c1 component of Group C.
Concurrent with the study by Northcott et al. in 2010, our group also identified 4
molecular subgroups (A-D) of medulloblastoma by performing gene expression profiling
of 19 medulloblastomas using Affymetrix Gene 1.0 ST array. These four molecular
subgroups closely matched those reported in Northcott et al. study. Strikingly, the WNT
tumors appeared to be more common in our cohort as compared to that reported by other
groups [15].
2.8. Current consensus in medulloblastoma subgrouping
Variations in the number and nature of the molecular subgroups reported by different
groups resulted in a meeting of all investigators with the consensus agreement to view
medulloblastoma as four core molecular subgroups: WNT, SHH, Group 3 (Group C) and
Group 4 (Group D) [17]. The consensus meeting led to a meta-analysis of molecular and
clinical data from 550 medulloblastomas from seven independent studies, including those

Chapter 2: Review of Literature
18
described above [14]. The evidence from this analysis consistently pointed towards the
understanding that medulloblastoma is a heterogeneous disease comprised of four core
molecular subgroups with distinct histological features, molecular profiles, and clinical
outcome, which have been detailed below [17, 60].
2.8.1. WNT subgroup
WNT subgroup tumors are characterized by activated WNT signaling pathway, mostly
caused by mutations in CTNNB1. They have an excellent outcome with survival rates of
> 90 %. Genomically they are very stable, except that almost all cases have lost an entire
copy of chromosome 6. WNT subgroups primarily comprise of older children and adults
cases and have an equal male: female ratio. Nearly all WNT tumors are of classic
histology.
2.8.2. SHH subgroup
SHH medulloblastomas are characterized by mutations in PTCH1, SMO, or SUFU, and / or
amplifications of GLI1 or GLI2, which all lead to constitutive activation of the SHH
signaling pathway. Genomically they are characterized by frequent loss of chromosome
arm 9q, which harbors the PTCH1 gene. A subset of SHH tumors show MYCN
amplification, which in this subgroup is associated with a poor outcome. Histologically
these tumors can be classic, desmoplastic or LC/A however, desmoplastic histology is
associated only with SHH tumors. SHH subgroup comprises of all age groups with a
predominance of infants and adult. The gender ratio is equivalent to the WNT subgroup
with almost equal distribution of male and female patients. Although there exist strong
differences in prognosis depending on the histology, as described earlier, these patients in
general have an intermediate outcome.

19
2.8.3. Group 3 and Group 4
Group 3 and Group 4 tumors are less well characterized, with no association with any
signaling pathway. However, most of these tumors have the chromosome 17 aberrations
that are frequently found in medulloblastomas. While Group 3 tumors have been shown to
express retinal differentiation genes, Group 4 tumors express genes involved in neuronal
differentiation. MYC overexpression and amplifications are predominantly seen in Group 3
tumors while Group 4 tumors have relatively low expression of both MYC and MYCN
oncogene. Small subsets of Group 4 tumors show MYCN amplifications too. Both Group 3
and 4 were shown to have overexpression and also amplification of the oncogenes OTX2
and FOXG1B [16]. Group 3 comprises of primarily infants and children while Group 4
comprises of all age group patients with predominance of older children. Metastasis and
LC/A histology, both markers of poor prognosis, are most common in Group 3 cases.
Group 3 cases have been associated with the worst outcome as compared to all other
subgroups, while Group 4 tumors have more of an intermediate outcome similar to the
SHH subgroup. As compared to both the WNT and SHH subgroup, there is a gender
imbalance seen in Group 3 and 4, with predominance of male patients. This probably
explains the known poor prognosis of males with medulloblastomas as compared to
females. Figure 2.3 summarizes the distinguishing characteristics of the four molecular
subgroups of medulloblastoma.
2.9. Cell of origin in medulloblastoma
Originally hypothesized to arise from undifferentiated embryonal precursor cells in the
ependymal lining of the fourth ventricle of the cerebellum [27], refinement in the
understanding of medulloblastoma has led to the proposal that the different subgroups of
medulloblastomas arise from different progenitor cells [29]. There has been intense

Chapter 2: Review of Literature
20
Figure 2.3: The four molecular subgroups of medulloblastoma. The figure shows the distinct
demographics, clinical features, genetics and gene-expression signature characteristic of each
subgroup and the reported studies on medulloblastoma molecular subgrouping [17].
research focused towards understanding the cell of origin in medulloblastoma.
Medulloblastomas showing constitutive activation of the SHH pathway have been
shown to originate from granule cerebellar progenitors (GCPs) in the EGL in murine
models [29, 61]. In their quest to identify the cell of origin of the WNT subgroup tumors,
Gilbertson and colleagues targeted activating mutations of CTNNB1 to specific locations.
While mutations in the cerebellum had little impact on the granule progenitor cell
population, mutations in the dorsal brainstem caused abnormal accumulation of cells.
Moreover, 15 % of mice in which Tp53 was concurrently deleted, developed
medulloblastoma that recapitulated the anatomy and gene expression profiles of the human
WNT subgroup medulloblastoma. The study suggested that WNT-subgroup

21
medulloblastomas arise outside the cerebellum from a distinct germinal zone of the
hindbrain in the lower rhombic lip and embryonic dorsal brainstem that develops into
structures within the brainstem [62-63]. The cellular origins for the two other subgroups
are still unclear. A recent mouse model generated by transducing Trp53-null cerebellar
progenitor cells with Myc closely mimicked the molecular features of the human MYC-
subgroup medulloblastomas (Group 3) which were significantly different from the mouse
models of the SHH and WNT subgroups [64]. In another mouse model of MYC-driven
medulloblastomas it was suggested that cerebellar stem cells can give rise to MYC-driven
medulloblastomas [65]. Further studies on mouse models based on newly identified genetic
alterations could pave way for the development of new targets for therapy [18, 66-67].
2.10. Assays for molecular subgrouping of medulloblastomas
Since the establishment of molecular subgroups of medulloblastoma, efforts have been
underway to develop assays for molecular classification that are essentially rapid, robust,
and more importantly, applicable on formalin-fixed, paraffin- embedded tissues (FFPE), so
that it can be useful in routine clinical practice.
Northcott et al. proposed four antibodies, DKK1, SFRP1, NPR3 and KCNA1 that
could specifically identify the WNT, SHH, Group 3 and Group 4 subgroups, respectively
[16]. The study demonstrated that 98 % of samples stained positive for one antibody,
suggesting a high specificity. Survival analyses in a separate tissue microarray cohort
classified by these antibodies confirmed that Group 3 tumors had the worst prognosis,
regardless of M-stage. Ellison et al. also described an immunohistochemistry (IHC) based
assay using the markers, GAB1, CTNNB1, filamin A, and YAP1, for identification of
WNT, SHH, and non-WNT / non-SHH subgroups. Nuclear and cytoplasmic CTNNB1
staining was exclusive to the WNT tumors [68]. These tumors were immunoreactive to

Chapter 2: Review of Literature
22
filamin A and YAP1, but not GAB1. SHH tumors displayed cytoplasmic staining of
CTNNB1, and exhibited positive immunostaining for filamin A, GAB1, and YAP1. Non-
WNT / non-SHH tumors showed cytoplasmic CTNNB1 staining and were
immunonegative for filamin A, GAB1, and YAP1.
However, transition of these IHC-based assays to the clinics has not been a success
possibly due to lot-to-lot variability of antibodies, differences in tissue fixation and
embedding protocols and technical and image interpretation variability. Schwalbe et al.
suggested an assay for rapid diagnosis of medulloblastoma subgroups based on multiplex
RT-PCR (GeXP assay) and a 13-gene mRNA signature [69]. The assay although rapid and
cost-effective than microarray methodologies, was neither directly evaluated on samples
belonging to published cohorts nor tested on FFPE tissues for its clinical utility. More
importantly the 13-gene signature failed to differentiate between Group 3 and Group 4
tumors, which have been confirmed in multiple studies to be genetically and clinically
distinct [16, 58-59]. More recently, a novel assay for medulloblastoma subgrouping
analyzing 22 subgroup-specific genes using the nanoString technology was described [70].
The nanoString nCounter System is a non-enzymatic multiplexed assay that uses sequence-
specific probes to digitally measure target abundance within a given sample. Using fresh
frozen tumors, the authors reported 98 % accuracy in subgroup assignment and
demonstrated that the assay could reliably predict the subgroups of 88 % of recent FFPE
cases too.
2.11. Beyond protein-coding genes: Non-coding RNAs - MicroRNAs
The last 10 years has seen a surge in the field of microRNA research with miRNAs
emerging as novel regulators of many aspects of cellular biology and development.
MicroRNAs are a class of endogenous, small, non-coding, single-stranded RNA

23
molecules, ~ 22 nucleotides in length. They function by regulating target gene expression
through imperfect base-pairing with the 3’-UTR of target mRNAs leading to translational
repression or mRNA degradation. To date, many miRNAs identified are highly conserved
across species including worms, flies, plants and humans, which implies that these
miRNAs direct essential processes both during development and in the adult body.
MiRNAs have been shown to regulate a wide array of cell functions ranging from cell
proliferation, differentiation, apoptosis, fat metabolism, neuronal development etc. [19].
The first miRNA was discovered in 1993 by the joint efforts of Ambros and
Ruvkun’s laboratories [71-72]. The heterochromic gene, lin-4, was identified in
Caenorhabditis elegans through a genetic screen for defects in the temporal control of
post-embryonic development. Most genes identified from the mutagenesis screens were
protein-coding, but lin-4 was found to encode a 22-nucleotide non-coding RNA that
contained sequences partially complementary to 7 conserved sites located in the 3′-UTR of
the lin-14 mRNA. This complementarity was both necessary and sufficient to inhibit the
translation of the lin-14 mRNA. Almost 7 years after the finding of the first miRNA, let-7,
also required during C. elegans larval development, was identified in the year 2000 [73].
The finding that let-7 was conserved across species from flies to humans [74] and targets
the RAS oncogene homolog in C. elegans [75], triggered a revolution in the research of
miRNAs.
Subsequently, hundreds of miRNAs and their biological functions have been
identified, and thus far (June 2013: Release 20), 24,521 hairpin sequences and 30,424
mature miRNAs, including more than 2000 mature human miRNAs, have been catalogued
in the miRNA database, miRBase (http://microrna.sanger.ac.uk). MiRNAs account for 1-4
% of the currently known genes in the human genome, making them one of the largest
classes of gene regulators. Majority of the human miRNAs are found within introns of

Chapter 2: Review of Literature
24
either protein-coding or noncoding mRNA transcripts. The remaining miRNAs are either
located far from other protein-coding genes in the genome, within the exons of non-coding
RNA genes, within the 3' UTRs of protein-coding genes, or they are clustered with other
miRNA encoding genes [76].
2.11.1. MicroRNA biogenesis
The miRNA biogenesis is a multistep process comprising of three main events: cropping,
nuclear export and dicing (Figure 2.4). The miRNA genes are initially transcribed by RNA
polymerase II in the nucleus into primary capped and polyadenylated precursors called
primary miRNAs (pri-miRNAs) which contain multiple stem loop / hairpin structures and
are typically > 1000 bp long. The enzyme Drosha / DGCR8 then crops the pri-miRNA at
the stem and releases a hairpin-structured 60-100 nucleotides long precursor-miRNA (pre-
miRNA) with a ~2-nt 3' overhang. DGCR8 is a double-stranded RNA-binding protein that
recognizes the proximal ~ 10 bp of the pri-miRNA hairpin stem, positioning the catalytic
sites of the RNase III enzyme Drosha. The ~2-nt 3' overhangs of the pre-miRNA are
further recognized by Ran-GTP and the export receptor Exportin 5 enabling its nuclear
export. Subsequently, another RNase III enzyme, Dicer processes the pre-miRNA in the
cytoplasm to release a ~ 22 nucleotide miRNA: miRNA* duplex. This miRNA duplex is
then loaded into an RNA induced silencing complex (RISC), which includes the Argonaute
proteins, and the mature single-stranded miRNA. The mature miRNA then binds to
complementary sites in the mRNA target to negatively regulate gene expression. The
mechanism of inhibition depends on the degree of miRNA-mRNA complementarity
(imperfect or perfect) that results in inhibition of protein synthesis or mRNA degradation
[20, 77].
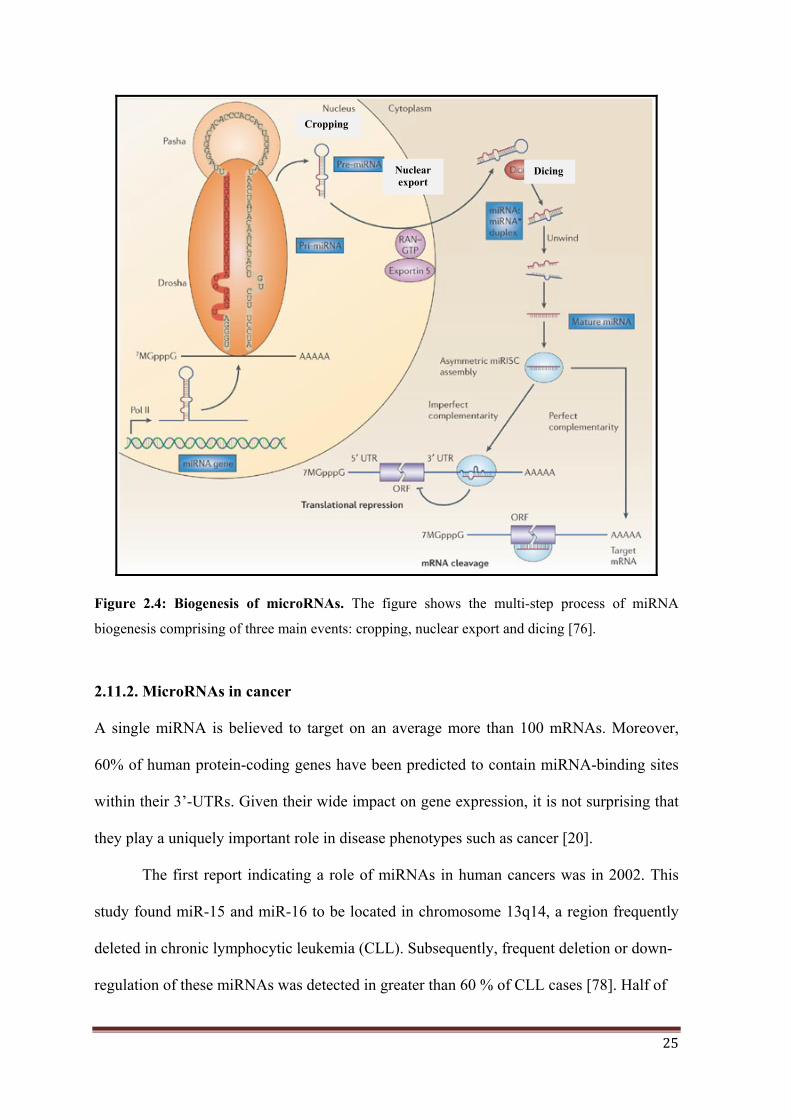
25
Figure 2.4: Biogenesis of microRNAs. The figure shows the multi-step process of miRNA
biogenesis comprising of three main events: cropping, nuclear export and dicing [76].
2.11.2. MicroRNAs in cancer
A single miRNA is believed to target on an average more than 100 mRNAs. Moreover,
60% of human protein-coding genes have been predicted to contain miRNA-binding sites
within their 3’-UTRs. Given their wide impact on gene expression, it is not surprising that
they play a uniquely important role in disease phenotypes such as cancer [20].
The first report indicating a role of miRNAs in human cancers was in 2002. This
study found miR-15 and miR-16 to be located in chromosome 13q14, a region frequently
deleted in chronic lymphocytic leukemia (CLL). Subsequently, frequent deletion or down-
regulation of these miRNAs was detected in greater than 60 % of CLL cases [78]. Half of
Cropping
Dicing Nuclear export

Chapter 2: Review of Literature
26
the known miRNAs were reported to be located inside or close to fragile sites and in
minimal regions of loss of heterozygosity, minimal regions of amplifications, and in
common breakpoint regions associated with cancer [79]. Cimmino et al. reported that miR-
15 and miR-16-1 function as tumor suppressors and their expression inversely correlates
with anti-apoptotic BCL2 expression [80]. Let-7, downregulated in lung cancer, has been
reported to target the proto-oncogene RAS [75]. MiR-34 downregulated in gastric cancer,
lung cancer, ovarian cancer, colon cancer has been reported to induce apoptosis and target
BCL2, NOTCH and HMGA2 [20]. In contrast, there are few miRNAs that have been
identified as oncogenes. MiR-155, one of the first oncogenic miRNAs described, is
overexpressed in several malignancies like breast cancer, colon cancer, lung cancer, CLL,
and acute myeloid leukemia (AML). MiR-21 was the first miRNA to be coined an
oncomiR due to the rather universal overexpression of this miRNA in several cancers
including AML, CLL, breast cancer, glioblastoma, and medulloblastoma, with PTEN and
PDCD4 identified as its targets [81]. Like miR-21, the polycistronic miR-17 / 92 cluster,
also known as oncomiR-1 has also been found to play an oncogenic role in several tumor
types including medulloblastoma [82-83]. The tumor-suppressors PTEN and p21 and the
anti-apoptotic protein BIM have been shown as its targets [81]. There are only a handful of
studies till date that have reported miRNAs deregulated in medulloblastoma and the
functional roles of a few have been demonstrated in medulloblastoma biology. These
studies are discussed in detail in the Discussion chapter.
Transgenic mouse models experimentally demonstrated the causative roles of many
of the miRNAs deregulated in cancer. Transgenic mice overexpressing miR-155 in early
B-cells have been shown to exhibit pre-leukemic expansion of the pre-B-cell population
ultimately resulting in full-blown B cell tumors [84]. Studies in miR-21 knockout mice
have demonstrated reduced lung tumor burden following activation of a mutant K-

27
RasG12D allele [85]. In a separate transgenic line, mice conditionally expressing miR-21
developed a pre-B malignant lymphoid-like phenotype, thus demonstrating its oncogenic
potential [86]. Retroviral overexpression of the miR-17 / 92 cluster has been shown to
accelerate lymphoma formation in collaboration with MYC [87]. Transgenic mice
overexpressing miR-17-92 cluster in B cells have been reported to develop
lymphoproliferative disease and autoimmunity [88]. Loss of miR-17-92 using knockout
mice have shown reduced tumorigenicity and increased cell death and PTEN has been
reported as a target of miR-19 [89-90]. These data clearly suggested that deregulation of a
single miRNA can lead to malignancy.
2.12. Application of differential miRNA expression as markers for diagnosis,
prognosis and therapy
MicroRNA profiling has helped uncover deregulation of miRNA expression in several
cancers to date including colorectal, leukemia, lung, and breast cancer [21]. MiRNA
profiling compared to mRNA expression profiling has been shown to be a more accurate
method of classifying tumor subtypes. MiRNA expression profile has successfully
classified poorly differentiated tumors (of non-diagnostic histology), wherein the mRNA
profile was highly inaccurate [22]. MiR-200 family has been reported to positively
associate with the well-differentiated breast cancer phenotype (luminal) and is
underexpressed in the malignant myoepithelioma of the breast [91]. The miRNA
expression profile has been shown to be associated with tumor development, progression
and response to therapy [22]. In various cancers, miR-21 has been reported as a predictor
of poor outcome [92-93]. High miR-21 expression levels have been shown to be predictive
of response to gemcitabine in pancreatic cancer patients [94]. In lung cancer, a large
miRNA expression analyses reported that the levels of both miR-155 and let-7a-2 were
Chapter 2: Review of Literature
28
associated with poor survival [95]. Upregulation of miR-214 has been shown to cause
increased resistance to cisplatin in ovarian cancer [96]. Liver cancer patients with low
miR-26 expression have been reported to have a shorter overall survival but have been
shown to respond better to interferon-α treatment than patients with high expression of
miR-26 [97]. These reports and many more suggest the possible use of miRNAs as
diagnostic, prognostic and predictive biomarkers. Recently, it has been reported that
alterations in chromatin-modifying genes seems to be a more consistent phenomena that
occurs across all subgroups of medulloblastoma, suggesting a prominent epigenetic
deregulation (DNA methylation, histone modifications, miRNA expression) in
medulloblastoma [18]. Epigenetic therapy is being looked upon as a promising therapeutic
approach in medulloblastoma [98]. MiRNA-based anti-cancer therapies using miRNA
mimics or antagonists are being exploited. Few miRNAs like miR-34 and let-7, which
target a broad spectrum of solid tumors, have already entered pre-clinical development
[99-100]. The ability of the miRNAs to concurrently target multiple-protein coding genes
and function as master regulators of the genome with an apparent lack of adverse effect to
the normal tissue have made miRNAs a promising new class of therapeutics.

MATERIALS AND METHODS
Chapter 3

29
MATERIALS AND METHODS
MATERIALS:
The following chemicals were obtained from Applied Biosystems:
TaqMan Low Density Array (TLDA) Human MicroRNA Panel (Part No. 4384792);
mirVana RNA extraction kit (Cat No. AM1560); TaqMan MicroRNA Reverse
transcription Kit (Part No. 4366596); 10 X TaqMan Multiplex RT: Human Multiplex RT
Pool 3 v 1.0 (Part No. 4383399) and Human Multiplex RT Pool 4 v 1.0 (Part No.
4383401), 2X TaqMan Universal PCR Master Mix (Part No. 4304437); 2X Power SYBR
Green PCR Master Mix (Part No. 4367659), 2X TaqMan PreAmp Master Mix (Part No.
4384266), TaqMan MicroRNA Assays (Part No. 4427975) - Assay IDs for each miRNA
assays are: hsa-miR-193a (000492), hsa-miR-224 (000599), hsa-miR-148a (000470), hsa-
miR-23b (000400), hsa-miR-365 (001020), hsa-miR-204 (000508), hsa-miR-182
(000597), hsa-miR-135b (000461), hsa-miR-592 (001546), hsa-miR-10b (000388), hsa-
miR-376a (000565), RNU48 (001006); MicroAmp optical 384-well Reaction Plate with
Barcode (Part No. 4309849) and MicroAmp Optical Adhesive Film Kit (Part No.
4313663).
The following chemicals were obtained from Dharmacon:
MiRNA mimics, siGLO RISC-Free Control siRNA, miRIDIAN microRNA mimic
negative control 1 and Dharmafect 2 tranfection reagent.
The following chemicals were obtained from Invitrogen:
MMLV-RT 200 U/ul (Cat No. 28025-013), Dulbecco’s modified Eagle medium (Cat. No.
12800-058), DNAse I, amplification grade (Cat No. 18068-015), Fetal bovine serum (Cat

30
No. 16140-071), LMP (low melting point) agarose, Trypsin, L-Glutamine, Formamide
(Cat. No. 15515).
The following chemicals were obtained from Sigma Chemicals:
Agarose, Proteinase K, Guanidium Isothiocyanate (GITC), DEPC, DMSO, EDTA,
Ethidium bromide
The following chemicals were obtained from Amersham Lifesciences:
dATP, dGTP, dTTP, dCTP (100 mM each) (Cat. No.27-2035-01), Random hexamers
pd(N)6 Sodium salt.
The following chemicals were obtained from MBI Fermentas:
10X PCR Buffer, Exonuclease I, Gene Ruler 1 Kb DNA ladder, Shrimp Alkaline
Phosphatase (SAP) (Cat. No. EF0511), 25 mM MgCl2, Taq DNA polymerase (1U/ µl)
(Cat. No. EP0404).
The following chemicals were obtained from Merck, Qualigens or SD fine chemicals:
Xylene, Methanol, Glacial Acetic Acid, Potassium Acetate, Sodium Acetate, N-lauryl
sarcosine.
The water used for the preparation of all solutions and reagents was Ultrapure water
(Resistivity = 18 MΩ cm) obtained from a Milli-Q water plant (Millipore, Billerica, MA,
USA).
Chapter 3: Materials and Methods
31
Disposable plastic ware (certified DNase, RNase, and protease-free) was obtained from
Axygen, California, USA. Disposable sterile plastic ware for tissue culture was obtained
from Nunc, Rochester, NY, USA.
Primers:
All PCR primers were synthesized and obtained from Sigma Genosys in the lyophilized
form.
METHODS:
3.1 Collection of sporadic medulloblastoma tumor tissues and normal cerebellar
tissues
Approval for the project was obtained from the Institutional Review Board and Ethics
Committee of Tata Memorial Hospital (T.M.H) and King Edward Memorial (K.E.M.)
Hospital, Mumbai. Forty-four fresh tumor tissue specimens of sporadic medulloblastoma
were obtained from patients who had undergone surgery at T.M.H and K.E.M. Hospital,
Mumbai, after obtaining informed consent. Standard practice of treatment with surgery
followed by radiation (with the exception of less than 3 yr old children) and chemotherapy
was followed for all the medulloblastoma cases studied. Immediately following surgery,
the tumor tissues were snap-frozen in liquid nitrogen and stored at –80 °C until use. Fifty-
nine formalin-fixed paraffin-embedded (FFPE) medulloblastoma tumors tissues from
T.M.H and K.E.M Hospital were also included in this study. For validation of the assay,
total RNA from 34 FFPE medulloblastoma tumor tissues with known subgroup affiliation
were provided by Dr. Paul A. Northcott, DKFZ, Germany and are hereafter referred to as
the DKFZ FFPE tumors.
Normal cerebellar tissues were obtained from Brain Tissue Repository, NIMHANS

32
Bangalore. Two cerebellar tissues labeled HBTR01 and HBTR02 were from children less
than 1 yr of age while the two labeled as HBTR03 and HBTR04 were from adults.
3.2. Extraction of nucleic acids
Prior to RNA and DNA extraction, cryosections of fresh frozen tumors and 5 µm sections
of FFPE tumor tissues were stained for hematoxylin and eosin and examined by light
microscopy to ensure at least 80 % tumor content.
3.2.1 Total RNA Extraction
a) RNA from normal cerebellum and fresh frozen tumor tissues using mirVana kit
For miRNA profiling, total RNA was extracted from fresh frozen tumor tissues (n=19) and
normal cerebellar tissues (n=4) using mirVana kit as per the manufacturer’s protocol as
described below. The kit enables extraction of highly pure total RNA without the loss of
small RNAs like miRNAs.
1. Briefly, 50-100 mg of tissue was taken in a chilled homogenization collection tube. 10
volumes of Lysis / Binding Buffer was added to the tissue. The tissue was thoroughly
homogenized in the buffer using a motorized rotor-stator homogenizer (REMI). The
sample was homogenized until all visible clumps were dispersed.
2. 1/10 volume of miRNA Homogenate Additive was added to the tissue lysate and mixed
well by vortexing. The mixture was kept on ice for 10 minutes, followed by equal volume
of Acid-Phenol: Chloroform mixture and vortexing for 30-60 sec. For example, for a lysate
volume of 300 µl, 30 µl miRNA Homogenate Additive and 300 µl of Acid-Phenol:
Chloroform was added.
3. The tube was centrifuged for 5 min at maximum speed (10,000 x g) at room temperature
to separate the aqueous and organic phases. After centrifugation, if the interphase was not

Chapter 3: Materials and Methods
33
compact then the centrifugation was repeated.
4. The aqueous (upper) phase was carefully removed without disturbing the lower phase
and transferred to a fresh tube. 1.25 volumes of 100% ethanol was added to the aqueous
phase
5. The lysate/ethanol mixture (from the previous step) was loaded onto a filter cartridge
placed on top of a collection tube (supplied in the kit). Upto 700 µl can be applied to a
filter cartridge at a time, for sample volumes greater than this; the mixture was applied in
successive applications to the same filter.
6. The filter-collection tube assembly was centrifuged at 10,000 rpm for 15 sec to pass the
mixture through the filter. Spinning harder than this may damage the filters.
7. The flow-through was discarded and process repeated until all of the lysate/ethanol
mixture was passed through the filter.
8. MiRNA Wash Solution 1 (working solution mixed with ethanol), 700 µl, was applied to
the filter cartridge and centrifuged for 5-10 sec. Flow-through was discarded from the
collection tube.
9. Wash Solution 2/3 (working solution mixed with ethanol), 500 µl, was applied to the
filter cartridge and centrifuged for 5-10 sec. Flow-through was discarded from the
collection tube. The step was repeated with a second 500 µl aliquot of Wash Solution 2/3.
10. After discarding the flow-through from the last wash, the filter cartridge assembly was
spun for 1 min to remove residual fluid from the filter.
11. The filter cartridge was transferred into a fresh collection tube and 100 µl of pre-heated
(95 °C) Elution buffer was added to the center of the filter. The cartridge assembly was
spun for 30 sec at maximum speed to recover the RNA. The RNA containing eluate was
stored at -80 °C.
12. RNA quantity and quality was assessed using the Agilent Bioanalyzer as per the

34
manufacturer’s protocol. RNA having RNA Integrity Number (RIN) values of more than
7.0 and no detectable genomic DNA contamination was used for miRNA profiling.
b) RNA from fresh frozen tumor tissues by acid guanidinium thiocyanate-phenol
chloroform extraction [101]
For validation of the miRNA profiling data, 25 additional fresh tumor tissues were
included in the study. RNA extraction from these tumor tissues was done as described
below:
Materials:
1. Preparation of DEPC-treated Milli-Q water: Water was collected from the Milli- Q
plant directly in sterile 50 ml NUNC tubes. 50 μl DEPC was added to 50 ml Milli-Q water,
mixed vigorously and left overnight at 37°C, with the tubes loosely capped. The tubes were
autoclaved on the following day. The DEPC-treated Milli-Q water was used for preparing
all the reagents required for RNA extraction.
2. 1 M Sodium citrate, pH 7.0: 14.7 g Sodium citrate, dihydrate was dissolved in about
35 ml autoclaved Milli-Q water. pH was adjusted to 7.0 with few drops of 1 M citric acid
and the volume was made up to 50 ml. (1 M Citric acid was prepared by dissolving 10.5 g
powder in 50 ml DEPC-treated water.) 50 µl of DEPC was added to both 1 M citrate and
citric acid solution, tubes were mixed vigorously and left at 37°C overnight. The solutions
were autoclaved the next day, and stored at room temperature.
3. 10% N-lauryl-sarcosine: 5 g N-lauryl-sarcosine was dissolved in DEPC-treated water
and the final volume was made up to 50 ml. Resulting solution was neither treated with
DEPC, nor autoclaved. It was kept at 65°C for 1 h, and stored at room temperature.
4. 4 M Guanidine Isothiocyanate (GITC): (Prepared in 25 mM Sodium citrate pH 7.0,
0.5% Sarcosyl). 23.6 g of guanidine isothiocyanate was dissolved in 40 ml DEPC-treated

Chapter 3: Materials and Methods
35
water. 1.25 ml of 1 M sodium citrate and 2.5 ml of 10 % sarcosine was added and the final
volume was made up to 50 ml with DEPC-treated water. The final solution was neither
treated with DEPC nor autoclaved. Solution D was prepared from GITC by adding β-
mercaptoethanol at a final concentration of 0.1 M. This solution is stable at room
temperature for one month.
5. Phenol (Saturated with DEPC-treated water): 25 ml DEPC-treated water was added to
25 ml distilled phenol at room temperature in a sterile NUNC tube. The tube was mixed
vigorously by inverting several times. The phenol was kept at 4°C until the two phases
separated (30-60 min). The upper water phase was replaced with fresh DEPC-treated
water, mixed once again and stored at 4°C.
6. 2 M Sodium acetate, pH 4.0: 13.6 g sodium acetate was dissolved in about 25 ml of
Milli-Q water and pH was adjusted to 4.0 with glacial acetic acid. Final volume was made
up to 50 ml with Milli-Q water. 50 µl DEPC was added to the solution, mixed vigorously
and left at 37°C overnight. The solution was autoclaved the following day and stored at
room temperature.
7. Chloroform
8. Absolute alcohol
9. 70 % alcohol
Only RNase free sterile plastic wares were used.
Method:
1. Approximately 30-50 mg of frozen tumor tissue was collected in a chilled
homogenization collection tube. This was homogenized with approximately 2-3 ml of
Solution D.
2. The tissue lysate was collected in a microcentrifuge tube and immediately passed
through a 26-gauge needle at least ten times. The trituration was done until the lysate lost

36
its viscosity, resulting in complete shearing of genomic DNA. At this stage the lysate was
either stored overnight at -20°C or processed further immediately.
3. 50 μl of 2 M Sodium acetate pH 4.0 was added per 0.5 ml lysate and mixed by inverting
the tubes.
4. Next, 0.5 ml DEPC-water-saturated phenol and 0.2 ml chloroform was added
successively to the tube and the contents of the tube were mixed thoroughly by vortexing
for 1 min. The cap of the tube was loosened to release the pressure and then vortexed again
for 30 sec.
5. The tube was kept on ice for 15 min and then centrifuged for 15 min at 4°C at 10,000
rpm in a table-top centrifuge. The upper aqueous layer obtained was transferred to a fresh
microcentrifuge tube and centrifuged once again to settle any traces of phenol.
6. The aqueous phase was then transferred to a fresh tube and an equal volume of
isopropanol (0.5 ml per tube) was added. This was mixed by brief vortexing and kept at
-20°C overnight for precipitation of RNA.
7. Next day, the tube was centrifuged at 12,000 rpm at 4°C for 20 min to pellet down the
precipitated RNA. The supernatant was decanted carefully so as to not disturb the RNA
pellet.
8. The RNA pellet was washed with 0.5 ml of 70 % ethanol, kept at room temperature for
2 min, and re-centrifuged at 12,000 rpm at 4°C for 10 min. The supernatant was decanted,
and the left over alcohol was allowed to dry by keeping the tube open with a clean tissue
paper to cover it. The RNA pellet was air-dried, and dissolved in a minimum of 10 μl
DEPC-treated water. For dissolving the RNA, it was first kept on ice for about 50 min with
intermittent vortexing and spinning, followed by heating at 65°C for 10 min. The dissolved
RNA was subsequently stored at -80°C.
9. RNA was quantified spectrophotometrically (O.D. at 260/280 nm) using the NanoDrop

Chapter 3: Materials and Methods
37
UV-Vis spectrophotometer. The integrity of RNA was ascertained by denaturing agarose
gel electrophoresis. The ratio of 28s rRNA to 18s rRNA is approximately 2:1 in a good
quality RNA.
c) From FFPE tumor tissues (adapted from protocol by Korbler et al., 2003 [102])
In addition to the 25 fresh frozen tumors, 59 FFPE tumor tissues were also included for
validation of the miRNA profiling data. The RNA was extracted from these FFPE tissues
as described below:
Materials:
1. Xylene
2. Absolute alcohol
3. Buffer B ( 10 mM NaCl, 500 mM Tris pH 7.6, 20 mM EDTA, 1% SDS )
4. Proteinase K, 500 μg / ml
Remaining materials were same as those used for RNA extraction by acid guanidinium
thiocyanate-phenol chloroform method.
Method:
1. Depending on the size of the tissue embedded, 3-8 sections of 10 µm were collected in a
microcentrifuge tube.
2. For de-paraffinization, 1ml xylene was added into the tube, vortexed, and then heated at
57 °C for 5 min. The tube was centrifuged at 14,000 rpm for 5 min at room- temperature to
pellet down the tissue and the supernatant was decanted carefully. The step was repeated
two more times to ensure complete removal of the paraffin.
3. Following de-paraffinization, the pellet was washed with 1 ml 100% ethanol, vortexed,
and centrifuged at 14,000 rpm for 10 min at room-temperature. The supernatant was

38
decanted carefully. This step was repeated to ensure that the pellet was free of any traces of
xylene.
4. The pellet was then air-dried to remove the left over alcohol by keeping the tube open
with a clean tissue paper to cover it, without letting it over-dry.
5. The pellet was re-suspended in 500 µl of Buffer B. 5 µl of 50 mg / ml proteinase K was
added to the buffer.
6. The solution was vortexed and incubated overnight in a roller incubator at 55 °C to
allow complete digestion of the tissue.
7. Next day, upon complete digestion of the tissue, the proteinase K was inactivated by
heating at 100 °C for 7 min.
8. Four volumes of Solution D was added to the above solution and was immediately
passed through a sterile syringe fitted with a 26 gauge needle. This was done at least ten
times until the lysate lost its viscosity, resulting in complete shearing of the genomic DNA.
The lysate was processed further immediately for steps 3-8 of the acid guanidinium
thiocyanate-phenol chloroform method as described earlier.
9. As FFPE RNA is known to be considerably degraded, denaturing gels for quality
assessment do not yield significant results. Therefore, RNA quality and quantity was
ascertained spectrophotometrically (O.D.260/280 ratio) using the NanoDrop UV-Vis
spectrophotometer. In addition to this, quality was further ascertained by performing real
time RT-PCR [refer Section 3.3.3 and 3.3.4] for the housekeeping gene GAPDH. Only
those samples with a GAPDH Ct value of < 30 were included in the study.
3.2.2. Preparation of denaturing gels for RNA separation and quality assessment
Formaldehyde containing agarose gel was used for checking the integrity of RNA from
fresh frozen tumor tissues. Unlike DNA, RNA has a high degree of secondary structure,

Chapter 3: Materials and Methods
39
making it necessary to use a denaturing gel. Formaldehyde in the gel disrupts secondary
RNA structure enabling the RNA molecules to be separated by charge migration.
Materials:
1. Agarose
2. 10X MOPS: 41.6 g MOPS, 16.7 ml of 3 M sodium acetate pH 5.0, 20 ml of 0.5 M
EDTA pH 8.0. Adjust pH to 7.0 with 5 M NaOH and make up the volume to 1 litre with
DEPC water. Autoclave the solution and store in an amber colored bottle.
3. Formaldehyde
4. Formamide
5. 10X RNA loading dye: 1mM EDTA pH 8.0, 50 % v/v glycerol, 0.4 % bromophenol
blue.
Method:
1. For a 50 ml volume, 1 % agarose gel was prepared as follows: 0.5 g agarose was
weighed into 35 ml of autoclaved Milli-Q water. The slurry was heated in a microwave
oven until the agarose dissolved completely. 5 ml 10 X MOPS was added make the final
concentration to 1 X and the slurry was mixed properly and placed at 60 ºC for 10 min.
2. Next, 10 ml formaldehyde (37 % solution) – GR grade, was added and the
formaldehyde-agarose slurry was kept at 60 ºC for 15 min.
3. Ethidium bromide to a final concentration of 0.5 μg/ml (2.5 µl), was added to the
agarose mix, and the mixture was poured in a gel tray and allowed to set at room
temperature for 30-45 min.
4. After the gel had completely set, it was placed in the electrophoresis tank filled with 1 X
MOPS buffer (30 ml MOPS + 30 ml formaldehyde-LR grade + 240 ml Milli-Q), just
enough to cover the gel.
5. For sample preparation, RNA was mixed with 10 X MOPS (final concentration 1 X

40
MOPS) and freshly prepared formamide: formaldehyde (3:1) mixture. For example; for
2 µl of 1 µg RNA, 1 µl of 10 X MOPS and 6 µl formamide: formaldehyde (3:1) was
added. This mix was subsequently placed at 60 ºC for 20 - 30 min.
6. 10 X RNA loading dye at 1 X final concentration was added to the above mix and
loaded into the wells of the gel. The gel was electrophoresed at 60 mA constant current, till
the dye had migrated almost to the other end of the gel.
7. The gel was then placed in Milli-Q water overnight to wash off excess of ethidium
bromide. RNA was visualized by observing the gel under a UV transilluminator.
3.2.3. Genomic DNA extraction from FFPE tumor tissues
For mutation analysis of Exon 3 of β-catenin (CTNNB1) gene, genomic DNA was
extracted from the FFPE WNT subgroup medulloblastomas as follows:
Materials:
1. Xylene
2. Absolute alcohol
3. Buffer B ( 10 mM NaCl, 500 mM Tris pH 7.6, 20 mM EDTA, 1 % SDS )
4. Proteinase K, 500 μg/ml
5. Lysis solution ( Solution A: 0.1 M Tris pH 9.0, 0.1 M EDTA, 1 % SDS)
6. 8 M Potassium acetate
7. Isopropanol
8. 70 % ethanol
9. Tris- EDTA containing RNase (50 µg/ml)
Method:
For genomic DNA extraction from FFPE tissues, the steps 1-8 of RNA extraction from
FFPE tissues were first followed including de-paraffinization and digestion with Proteinase

Chapter 3: Materials and Methods
41
K. Upon inactivation of proteinase K, the protocol for DNA extraction was followed as
given below:
1. 4 volumes of Solution A was added and the solution was immediately incubated at
70 °C for 30 min.
2. 8 M potassium acetate, 140 µl, was added per 1.0 ml of the Solution A to the tissue
extract and the tube was shaken vigorously to ensure proper mixing of the reagents,
followed by incubation on ice for 30 min. The extract was centrifuged at 10,000 rpm for
15 min at 4 °C and the supernatant was transferred carefully to a fresh tube using a cut 1
ml pipette tip. DNA was precipitated by addition of 0.5 volumes of isopropanol, followed
by mixing by vigorous shaking and incubation at room temperature for 5-10 min.
3. The precipitated DNA was collected by centrifugation at 10,000 rpm for 10 min at room
temperature. The supernatant was poured off and the DNA pellet was washed with 1 ml of
70 % ethanol by incubating the tube at room temperature for 5 min.
4. The tube was centrifuged at 10,000 rpm for 5 min at room temperature to recover the
pellet. The 70 % ethanol was poured off and the tube was kept inverted on tissue paper to
drain off the remaining droplets.
5. The pellet was air-dried, and 50 µl of TE containing RNase was added. The tube was
incubated at 37 °C for 1-2 h with intermittent tapping to both dissolve the genomic DNA as
well as to digest the RNA.
6. DNA quality and quantity was ascertained spectrophotometrically on the NanoDrop
UV-Vis spectrophotometer, and the DNA was stored at 4 °C until further use.
3.2.4. Agarose gel electrophoresis
Materials:
1. Agarose

42
2. 50 X Tris-acetate-EDTA (TAE) buffer : 242 g Tris, 57.1 ml glacial acetic acid, 100 ml of
0.5 M EDTA, pH 8.0 in 800 ml Milli-Q water and volume made up to 1 litre and
autoclaved. 1 X Tris Acetate EDTA Buffer (40 mM Tris-acetate, 2 mM EDTA, pH 8.0)
3. Ethidium bromide (10 mg/ml stock): 10 mg Ethidium Bromide in 1.0 ml of autoclaved
Milli-Q water.
4. 6 X loading dye: 0.25 % bromophenol blue, 40 % (w / v) sucrose in Milli-Q water and
filter-sterilized.
Method:
1. The appropriate amount of agarose was weighed into a measured volume of 1 X TAE
buffer to make a 1 % gel. The slurry was heated in a microwave oven until the agarose was
dissolved completely and ethidium bromide to a final concentration of 0.5 µg/ml was
added when the gel solution had cooled to about 40 °C.
2. A gel tray was cleaned and the two open sides of the tray were sealed with adhesive
tape. The gel was poured into the gel tray and a clean comb was inserted in the slot
provided in the tray. The gel was allowed to set at room temperature for 30-45 minutes.
3. After the gel had completely set, the adhesive tapes were removed and the gel was
placed in the electrophoresis tank filled with 1 X TAE buffer. The buffer should be just
enough to cover the gel and the comb was carefully removed.
4. The DNA samples were mixed with 6 X loading buffer at 1 X final concentration and
loaded into the wells of the gel. The gel was electrophoresed at 40 mA constant current, till
the dye had migrated about three-fourths of the gel. The DNA was visualized by observing
the gel on a UV transilluminator.

Chapter 3: Materials and Methods
43
3.3. Gene expression analysis by real time RT-PCR
3.3.1. Primer Designing
The primers for real time PCR analysis were designed such that they correspond to two
adjacent exons, and are located at exon boundaries to avoid amplification of genomic
DNA. The amplicon size was maintained below 85 bp, to enable amplification of the
fragmented RNA from FFPE tissues. Primers were designed using the Oligo Explorer
Software v 1.1.2. BLAST (www.ncbi.nlm.nih.gov/BLAST) and e-PCR feature of BiSearch
software were performed to ensure primer specificity. The primers were reconstituted in
TE Buffer, pH 8.0 to a concentration of 100 pmole / µl. For working stock of 10 pmole /
µl, the primers were further diluted 1:10 using TE Buffer. All primers were stored at – 20
°C. Sequences of the primers used in the present study are listed below in Table 3.1.
Gene Name Forward Primer (5' → 3') Reverse Primer (5' → 3')
WIF1 CCTGCCATGAACCCAACAAATGCC GAGGCTGGCTTCGTACCTTTTATTGC
DKK2 GGCGGCAGTAAGAAGGGCA ACCTCCCAACTTCACACTCC
MYC GTAGTGGAAAACCAGCAGCC CGAGTCGTAGTCGAGGTCAT
HHIP TCAAAGTGGAATAAAGGGAGGAGA CTTGTAATTGGGATGGAATGCGAG
EYA1 GCAGTAGTTTCAGCCCACGA TGGGTATGGTCTGTTGGAAGG
MYCN ACACCCTGAGCGATTCAGAT CCACGTCGATTTCTTCCTCTTCAT
NPR3 CTAGGAGCTGGCTTGCTAAT GGGTTCGCCTCTCAATGGTTAT
IMPG2 TGTACTTGAATTTAGGTCCCCC CCTCACCATTGAAGGTAACTGC
OTX2 TTCGGGTATGGACTTGCTGC GTGGCTGCGGGACAAGAAG
EOMES ATTACGAAACAGGGCAGGCG GTGGGCAGTGGGATTGAGTC
GRM8 ACTGGACCAATCAGCTTCATCTAA CGGGTGAGTATGTTCTCTATGAG
UNC5D CAACCAAGGTGAACCCAGCC CCACAGGTGACTTCAGGACTC
GAPDH GAAGGTCGGAGTCAACGGATT GAGTTAAAAGCAGCCCTGGTG
CTNNB1g GAACCAGACAGAAAAGCGGC CCTCAGGATTGCCTTTACCACT
Table 3.1: Nucleotide sequences of the primers used for SYBR Green Real-time PCR
analysis. F and R stand for Forward and Reverse primer respectively. The names ending in ‘g’
denote primers for amplification of genomic DNA.

44
3.3.2. Removal of genomic DNA from total cellular RNA
Any genomic DNA contamination if present in the RNA preparation was removed by
RNase free DNase I treatment. This procedure was avoided for RNA from FFPE tissues, to
avoid further degradation of the already fragmented RNA.
Materials:
1. 10 X DNase I buffer
2. DNase I (1 U/µl)
3. 25 mM EDTA
4. DEPC treated Milli-Q water
Method:
1. All the required reagents were thawed and mixed well by tapping and pulse spinning.
1 µg RNA was treated with 1 U of DNase I in a 5 µl reaction. The reaction contained the
following components:
Components Volume Final Concentration
10 X DNase I buffer 0.5 µl 1 X
DNase I (1 U/µl) 1 µl 1 U/µg of RNA
RNA 1 µg
DEPC treated Milli-Q water Make up volume to 5 µl
Total volume 5 µl
2. The sample was incubated at room temperature for exactly 15 min. Higher temperatures
and longer time can lead to Mg++ mediated degradation of the RNA, hence was avoided
3. The enzyme was inactivated by addition of 0.5 µl 25mM EDTA followed by incubation
at 65 °C for 10 min.
4. The DNase I treated RNA was then used for cDNA synthesis using M-MLV RT.

Chapter 3: Materials and Methods
45
3.3.3. Reverse transcriptase reaction for cDNA synthesis
Materials:
1. 5 X First Strand Buffer
2. M-MLV RT enzyme (200 U/μl)
3. 0.1 M DTT
4. 10 mM dNTP mix,
5. RNase Inhibitor (20 U/μl),
6. Random hexamers p(dN)6 (100 ng/μl)
Method:
1. A 10 μl reaction was set up for the cDNA synthesis from 1 μg of DNase-treated total
RNA
2. First, the following components were added to a nuclease-free microcentrifuge tube:
Components Volume Final Concentration
DNase- treated total RNA 1 μg
10 mM dNTP Mix 0.5 μl 1
100 ng / μl random hexamers p(dN)6 0.5 μl 0.5 mM
DEPC treated Milli-Q water Make up volume to 6 μl
3. RNA was heated at 65 °C for 5 min to denature RNA secondary structures and chilled
on ice for 2 minutes.
4. Reaction mix was prepared on ice by adding the following components:
Components Volume Final Concentration
5X First strand buffer 2 μl 1X
0.1 M DTT 1 μl 0.01 M
RNase Inhibitor (20 U / μl) 0.25 5 U
DEPC treated Milli-Q water Make up volume to 3.5 μl

46
5. The reaction mix was added to the RNA, mixed by gentle pipetting, and incubated at
37 °C for 5 min to allow annealing of random primers to the RNA.
6. 0.5 μl (100 U) of M-MLV RT was added to the reaction tube and mixed by gentle
pipetting. The tubes were transferred to the thermal cycler (Eppendorf) and thereafter the
following conditions were followed:
25 °C 10 min
37 °C 50 min
70 °C 15 min
4 °C ∞
7. The cDNA synthesized was then used for analyzing gene expression levels by real time
PCR or stored at -20 °C.
3.3.4. Real Time PCR
Materials:
1. 2 X Power SYBR Green Master Mix
2. 10 pmole / ul each gene specific Forward and Reverse primers.
3. DEPC- treated Milli-Q water
Method:
1. The cDNA obtained from the reverse transcription reaction was diluted to 5 ng/μl (fresh
frozen tissue) or 50 ng / μl (FFPE tissue) with DEPC-treated Milli-Q water for use in the
PCR reaction. The PCR reaction was set up as follows:
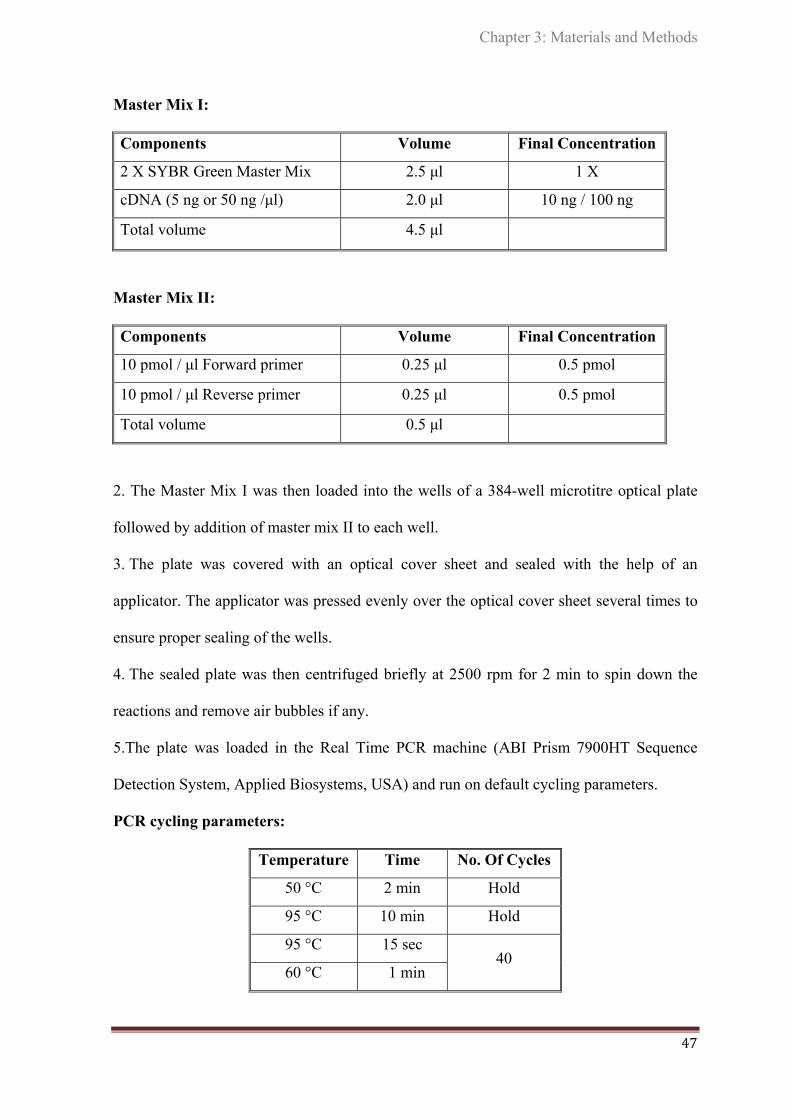
Chapter 3: Materials and Methods
47
Master Mix I:
Components Volume Final Concentration
2 X SYBR Green Master Mix 2.5 μl 1 X
cDNA (5 ng or 50 ng /μl) 2.0 μl 10 ng / 100 ng
Total volume 4.5 μl
Master Mix II:
Components Volume Final Concentration
10 pmol / μl Forward primer 0.25 μl 0.5 pmol
10 pmol / μl Reverse primer 0.25 μl 0.5 pmol
Total volume 0.5 μl
2. The Master Mix I was then loaded into the wells of a 384-well microtitre optical plate
followed by addition of master mix II to each well.
3. The plate was covered with an optical cover sheet and sealed with the help of an
applicator. The applicator was pressed evenly over the optical cover sheet several times to
ensure proper sealing of the wells.
4. The sealed plate was then centrifuged briefly at 2500 rpm for 2 min to spin down the
reactions and remove air bubbles if any.
5.The plate was loaded in the Real Time PCR machine (ABI Prism 7900HT Sequence
Detection System, Applied Biosystems, USA) and run on default cycling parameters.
PCR cycling parameters:
Temperature Time No. Of Cycles
50 °C 2 min Hold
95 °C 10 min Hold
95 °C 15 sec 40
60 °C 1 min
48
6. The 50 °C incubation is to activate UNG glycosylase enzyme that prevents carry over
PCR contamination followed by an initial denaturation step for 10 min with activation of
HotStart Taq polymerase and then 40 cycles of denaturation-annealing-extension. In case
of SYBR Green Assays after completion of 40 cycles, the dissociation curve step of the
amplified products was performed to determine the formation of primer dimers, if any.
7. Amplification data was collected in real time by the machine and stored in the SDS 2.1
software. After completion of the runs, the data was analyzed using SDS 2.1 analysis
software.
8. GAPDH was used as the housekeeping gene control. The expression of the gene of
interest, relative to GAPDH levels was quantified and expressed as Relative Quantity
(RQ), calculated by the comparative Ct method (refer Section 3.14.3).
3.4. Quantification of miRNAs
3.4.1. MiRNA profiling
The Taqman Low Density Arrays (TLDA) v 1.0 for miRNA was used for miRNA
profiling. The array contains 365 human microRNAs and 3 small nucleolar RNAs
(RNU48, RNU44, and RNU6B) as endogenous controls. MiRNA quantification involves a
stem-loop reverse transcription followed by real time PCR. Mature miRNAs are only 20-
23 nucleotides in length. The stem–loop RT primers hybridize to mature miRNA molecule
at the 3’ end and then get reverse transcribed with the help of a reverse transcriptase
enzyme. The RT product is then quantified by conventional Taqman PCR with miRNA
specific forward primer, reverse primer corresponding to part of the stem-loop RT primer
(excludes the loop region) and the TaqMan probe.
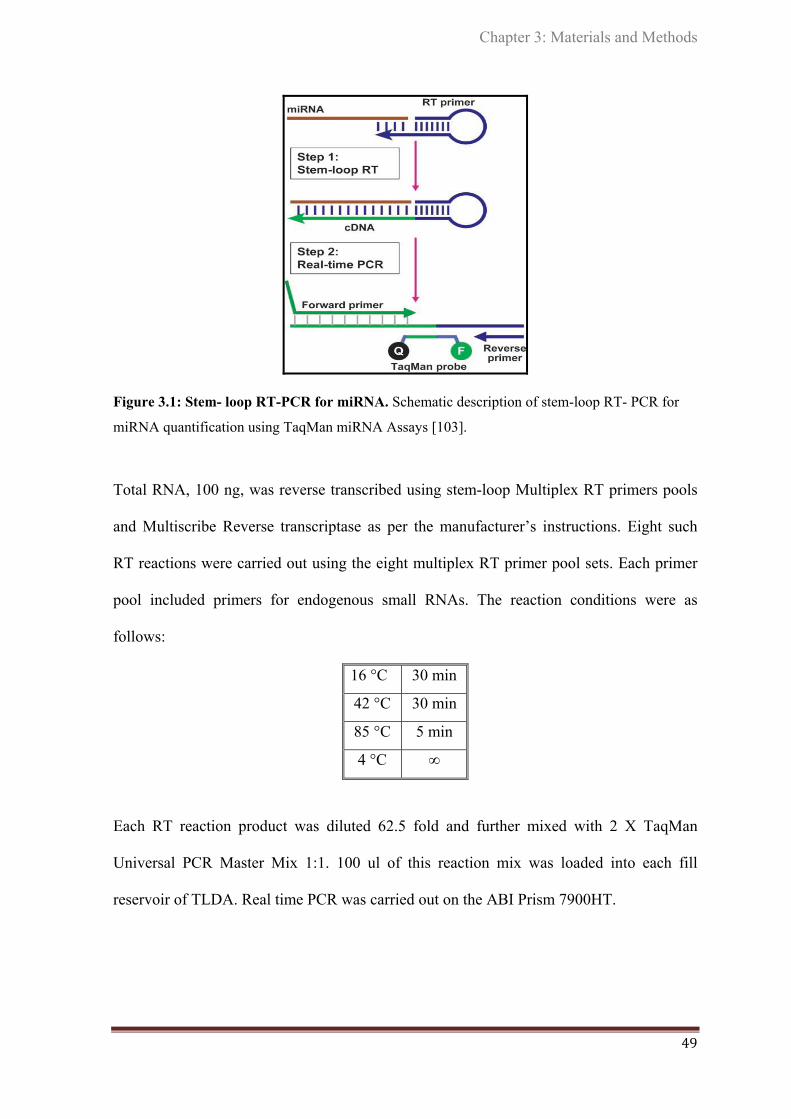
Chapter 3: Materials and Methods
49
Figure 3.1: Stem- loop RT-PCR for miRNA. Schematic description of stem-loop RT- PCR for
miRNA quantification using TaqMan miRNA Assays [103].
Total RNA, 100 ng, was reverse transcribed using stem-loop Multiplex RT primers pools
and Multiscribe Reverse transcriptase as per the manufacturer’s instructions. Eight such
RT reactions were carried out using the eight multiplex RT primer pool sets. Each primer
pool included primers for endogenous small RNAs. The reaction conditions were as
follows:
16 °C 30 min
42 °C 30 min
85 °C 5 min
4 °C ∞
Each RT reaction product was diluted 62.5 fold and further mixed with 2 X TaqMan
Universal PCR Master Mix 1:1. 100 ul of this reaction mix was loaded into each fill
reservoir of TLDA. Real time PCR was carried out on the ABI Prism 7900HT.

50
3.4.2 Validation of differential miRNA expression by real time RT-PCR
(a) Stem- loop Reverse Transcription for miRNA
Materials:
1. 10 X RT Buffer
2. 100 mM dNTP mix
3. 10 X Multiplex RT Primer Pool 3 or Pool 4 / 5 X RT Primer
4. RNase Inhibitor (20 U/μl)
5. Multiscribe M-MLV RT enzyme (50 U/μl)
6. DEPC- treated Milli-Q water
Method:
1. All the reagents required were thawed and mixed well by tapping and pulse spinning.
MiRNA reverse transcription primers were thawed on ice.
2. A 5 µl reaction was set up from 50 ng of fresh frozen or 200 ng of FFPE tissue total
RNA for cDNA synthesis.
3. The reaction contained the following components:
Components Volume Final Concentration
10 X RT Buffer 0.5 µl 1 X
100 mM dNTP mix 0.1 µl 0.5 mM
10 X Multiplex Primer Pool/
5 X RT primer 0.5 µl/ 1 µl 1 X
RNase inhibitor (20 U/ µl) 0.1 µl 2 U
Multiscribe MMLV-RT (50 U/ µl) 1 µl 50 U
Total RNA 50 ng/ 200 ng
DEPC treated MQ water Make up volume to 5 µl

Chapter 3: Materials and Methods
51
4. A master mix was first prepared in a 0.5 ml tube excluding the RNA making up the total
volume to 3 µl.
5. Before adding MMLV-RT, the PCR machine was set and kept on hold at 16 °C and the
lid temperature was set to 105 °C. The contents of the tube were gently mixed by tapping
followed by a pulse spin.
6. 3 μl of master mix was then dispensed into each 0.2 ml tube followed by addition of 2 μl
of the diluted RNA sample (25 ng or 100 ng /µl) to the respective tubes. The reaction mix
was gently tapped and pulse spun and transferred to a thermal cycler. The reaction
conditions were same as that mentioned in Section 3.4.1.
b) Real time PCR
Materials:
1. 2 X Taqman PCR Master Mix
2. 20 X Taqman miRNA Assays (miRNA Primer-Probe)
3. DEPC- treated Milli-Q water
Method:
1. cDNA obtained from the stem- loop reverse transcription reaction was diluted to 5 ng /μl
(Fresh frozen tissue) or 20 ng /μl (FFPE tissue) with DEPC-treated Milli-Q water for use in
the PCR reaction. The PCR reaction was set up as follows:
Master Mix I:
Components Volume Final Concentration
2 X Taqman PCR Master mix 2.5 μl 1 X
cDNA (5 ng or 20 ng /μl) 2.0 μl 10 ng / 40ng
Total volume 4.5 μl

52
Master Mix II:
Components Volume Final Concentration
20 X Probe-Primer Mix 0.25 μl 1 X
DEPC treated Milli-Q water 0.25 μl
Total volume 0.5 μl
The steps following this were same as that in real time PCR for gene expression analysis
[refer Section 3.3.4 steps 2-7]. RNU48 was used as the housekeeping small RNA internal
control for miRNAs. The expression of the miRNA of interest, relative to RNU48 levels
was quantified by the comparative Ct method. (refer Section 3.14.3).
3.4.3. Validation of differential miRNA expression by real time RT-PCR with pre-
amplification
The addition of a preamplification step prior to real time PCR is beneficial when working
with limiting amounts of RNA. Preamplification is particularly recommended for the
detection of low-expressing miRNAs. The standard Taqman MicroRNA Assay protocol
calls for an individual RT reaction for each target miRNA. By incorporating the
preamplification reaction, multiplexed RT step for pools of upto 96 individual RT primers
or Taqman miRNA Assays can be performed. The Ct value of the small RNA endogenous
control, RNU48, obtained upon Real time PCR after preamplification reaction was
comparable to that achieved by use of individual RT primers as well as Multiplex RT
primer pools previously available from ABI.
a) Preparation of custom RT pool
Each Taqman MicroRNA Assay contains one 5 X RT primer. Up to 96 of these primers
can be pooled into one RT reaction as follows:

Chapter 3: Materials and Methods
53
1) Combine 10 μl of each individual 5 X RT primer and add 1 X T.E to make the final
volume to 1000 μl.
Example:
Number of
assays
Total volume
pooled
Volume of 1 X
T.E.
Total volume of RT
primer pool
12 120 μl 880 μl 1000 μl
1 μl of each 5 X RT primer and 99 μl 1 X T.E was prepared for a 100 ul volume.
2) Final concentration of each RT primer in the RT primer pool should be 0.05 X each.
The RT primer pool can be stored at – 20 °C for upto two months.
Note: For custom RT, it is recommended to run a No Template Control (use DEPC Milli-
Q as sample in the RT reaction) reaction for each assay in the pool to check the
background.
b) Preparation of custom preamplification (PreAmp) primer pool
Taqman MicroRNA Assays contain a 20 X mix of forward and reverse primers, and
miRNA-specific probe. The PreAmp primer pool is prepared similar to the custom RT
primer pool. 1 μl of each individual 20 X Taqman MicroRNA Assay was combined and
1 X T.E. was added to make the final volume to100 μl. The final concentration of each
assay in the pool equals 0.2 X. Store the PreAmp primer pool at – 20 °C.
c) Preparation of the RT reaction mix
The Taqman MicroRNA Reverse Transcription Kit contains all the reagents necessary for
the multiplex RT step except the RT primer pool.
1) In a 0.2 μl PCR tube, the following reaction components were added. The reaction mix
was prepared on ice. The custom RT pool (thawed on ice) or Multiscribe Reverse

54
Transcriptase should not be vortexed. A single PCR reaction contained the following
components:
Components Volume Final Concentration
10 X RT Buffer 0.5 µl 1 X
100 mM dNTP mix 0.1 µl 0.5 mM
Custom RT primer pool a 2.0 µl 0.02 X each
RNase inhibitor (20 U/ µl) 0.1 µl 2 U
Multiscribe MMLV-RT (50U/ µl) 1.0 µl 50 U
DEPC treated Milli-Q water Make up volume to 4 µl
2) The components were mixed thoroughly by inverting 6 times followed by pulse spin.
The reaction mix should not be vortexed.
3) 1 µl of 25 ng total RNA was added to the reaction mix for a total reaction volume of 5
µl. The components were mixed by inverting 6 times followed by pulse spin.
4) The reaction was incubated on ice for 5 min and subsequently transferred into a thermal
cycler. The cycling parameters were same as that for stem- loop RT-PCR. The RT product
can be stored at - 20°C for upto one week.
d) Preparation of the PreAmp reaction mix
1) In a 0.2 µl PCR tube, the following components were added:
Components Volume Final Concentration
Taqman PreAmp Master Mix (2 X) 2.5 µl 1 X
PreAmp primer pool b 0.75 µl 0.03 X each
RT Product 0.5 µl 2.5 ng
DEPC treated MQ water Make up volume to 5 µl
2) The reaction components were mixed thoroughly followed by pulse spin. The tubes
were then transferred to a thermal cycler.

Chapter 3: Materials and Methods
55
PCR cycling parameters:
Temperature Time No. Of Cycles
95 °C 10 min Hold
55 °C 2 min Hold
72 °C 2 min Hold
95 °C 15 sec 12
60 °C 4 min
99.9 °C * 10 min Hold
4 °C ∞ Hold
* For enzyme inactivation
3) After the PreAmp PCR the tubes were spun briefly. 2 µl of the PreAmp product was
diluted to 16 µl (1:8 dilution) using 0.1 X T.E., pH 8.0. This is the diluted PreAmp product
which can be stored at - 20°C for upto one week.
e) Preparation of the real time PCR reaction mix
1) The following components were added to a 0.5 µl PCR tube:
Master Mix I:
Components Volume Final Concentration
2 X Taqman PCR Master mix 2.5 μl 1 X
Diluted PreAmp product 0.1 μl
Total volume 2.6 μl
Master Mix II:
Components Volume Final Concentration
20 X Probe-Primer Mix 0.25 μl 1 X
DEPC treated Milli-Q water 2.15 μl
Total volume 2.4 μl

56
The steps following this were same as that in Real time PCR without preamplification for
miRNA expression analysis [refer Section 3.4.2 (b)].
3.5. Mutation analysis of exon 3 from gene encoding β-catenin (CTNNB1)
To screen for mutations in CTNNB1 gene in the WNT subgroup medulloblastomas, exon 3
region was PCR amplified from the genomic DNA of these tumor tissues and sequenced to
identify mutation, if any, using the ABI Prism 3100 Avant Genetic Analyzer.
3.5.1. PCR amplification of Exon 3 region of CTNNB1
Method:
1. The PCR cycling parameters were standardized on Eppendorf MasterCycler 5333
(Eppendorf, Germany). All reagents were thawed and kept on ice.
2. For each PCR reaction 50 ng of the template DNA was added in the end to the 0.2 ml
PCR tube containing the PCR components.
3. The PCR Reaction mix was prepared as follows:
Components Volume Final Concentration
10 X PCR buffer 6 µl 1 X
25 mM MgCl2 3.6 µl 1.5 mM
10 mM dNTP mix 1.2 µl 0.2 mM of each dNTP
CTNNB1 Forward (10 pmol/ µl) 1.2 µl 0.2 pmol
CTNNB1 Forward (10 pmol/ µl) 1.2 µl 0.2 pmol
Taq DNA polymerase (1 U/µl) 1.2 µl 0.2 U
Genomic DNA 50 ng
Autoclaved MQ water Make up volume to 60 µl
Total volume 60 µl

Chapter 3: Materials and Methods
57
4. All precautions were taken to avoid PCR related contamination. All reagents and PCR
products were handled using filter tips.
5. The PCR cycling parameters were as follows:
Temperature Time No. Of Cycles
95 °C 5 min Hold
95 °C 45 sec
30 58 °C 30 sec
72 °C 30 sec
72 °C 10 min Hold
4 °C ∞ Hold
6. 10 µl of the PCR product was run on a 1 % agarose gel and visualized using an UV
transilluminator.
7. PCR products were further treated with Exonuclease I and Shrimp Alkaline Phosphatase
to remove unused primers, dNTPs and given for sequencing.
3.5.2. Removal of unused primers and dNTPs from PCR products by Exonuclease I
and Shrimp Alkaline Phosphatase
PCR amplified products contain unused primers and dNTPs. If not removed these primers
and dNTPs interfere with subsequent reactions. Exonuclease I (Exo) has an exonuclease
activity and degrades any single stranded DNA. Shrimp Alkaline Phosphatase (SAP)
removes the phosphate groups from dNTPs.
Method:
1. To remove unused primers and dNTPs, 1 µl of master mix of Exonuclease I and Shrimp
Alkaline Phosphatase was added for every 10 µl of PCR product as per table below:
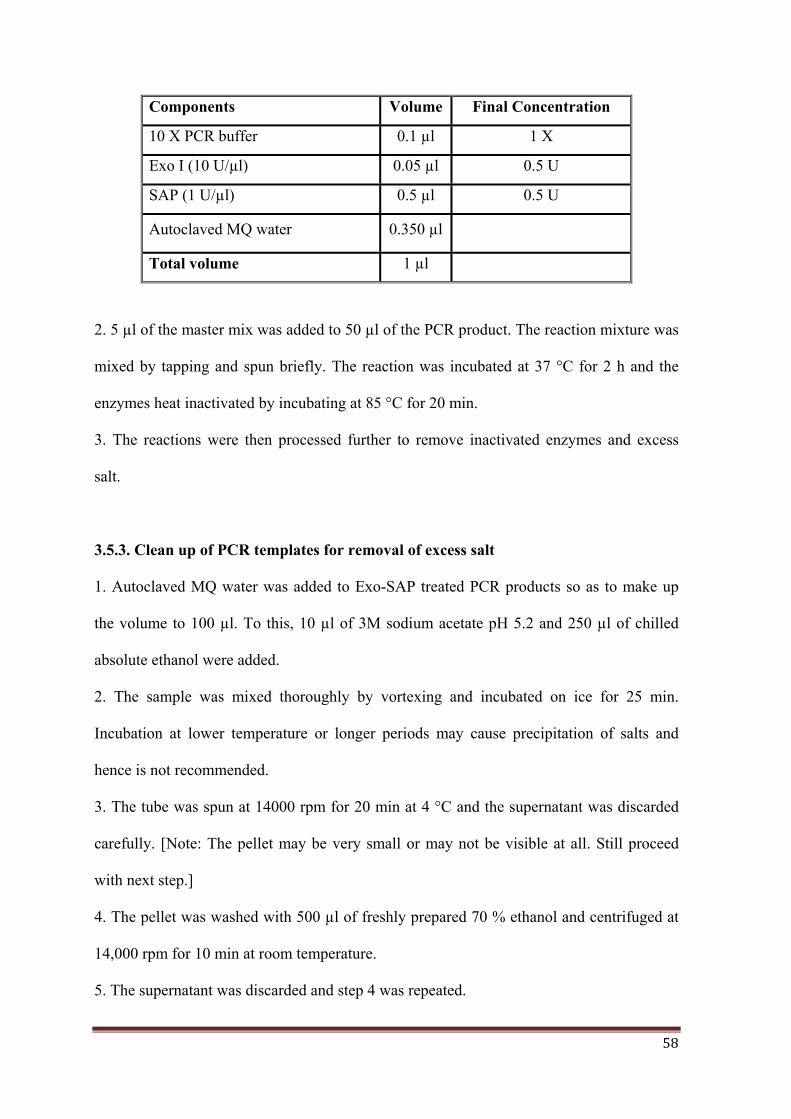
58
Components Volume Final Concentration
10 X PCR buffer 0.1 µl 1 X
Exo I (10 U/µl) 0.05 µl 0.5 U
SAP (1 U/µl) 0.5 µl 0.5 U
Autoclaved MQ water 0.350 µl
Total volume 1 µl
2. 5 µl of the master mix was added to 50 µl of the PCR product. The reaction mixture was
mixed by tapping and spun briefly. The reaction was incubated at 37 °C for 2 h and the
enzymes heat inactivated by incubating at 85 °C for 20 min.
3. The reactions were then processed further to remove inactivated enzymes and excess
salt.
3.5.3. Clean up of PCR templates for removal of excess salt
1. Autoclaved MQ water was added to Exo-SAP treated PCR products so as to make up
the volume to 100 µl. To this, 10 µl of 3M sodium acetate pH 5.2 and 250 µl of chilled
absolute ethanol were added.
2. The sample was mixed thoroughly by vortexing and incubated on ice for 25 min.
Incubation at lower temperature or longer periods may cause precipitation of salts and
hence is not recommended.
3. The tube was spun at 14000 rpm for 20 min at 4 °C and the supernatant was discarded
carefully. [Note: The pellet may be very small or may not be visible at all. Still proceed
with next step.]
4. The pellet was washed with 500 µl of freshly prepared 70 % ethanol and centrifuged at
14,000 rpm for 10 min at room temperature.
5. The supernatant was discarded and step 4 was repeated.
Chapter 3: Materials and Methods
59
6. The supernatant was aspirated and pellet was air dried. Pellet was resuspended in 8-10
µl of 1 M TE Buffer, pH 8.0.
7. To check the quality and quantity of PCR product, 2 µl of the PCR product was loaded
on a 1 % agarose gel and visualized. 50 ng of good quality PCR product was used for
sequencing.
3.5.4. Sequencing of the PCR products
In a 0.2 ml PCR tube, 1.5 pmol of either forward or reverse primer and 50 ng of Exo-SAP
treated PCR amplified product were added. The sequencing reactions were carried out in
Eppendorf Master Cycler using Big Dye Terminator Kit V 3.1, which has different
fluorescent dye for each terminator ddNTP as per manufacturer’s instructions. The
reactions were cleaned up to remove excess salt. The reactions were run in either a 50 cm
or 80 cm capillary filled with POP4 or POP6 polymer (Applied Biosystems, U.S.A) in
3100 Avant Genetic Analyzer (Applied Biosystems, U.S.A). The size of capillary used
depended on the PCR product size. Sequences were checked for sequence alterations
against CTNNB1 gene reference sequence file deposited in NCBI (NG_013302.1; GI:
262072976) using SeqScape Software.
3.6. Tissue culture media and reagents
1. Tissue culture medium: Commercially available powdered medium, Dulbecco’s
Modified Eagle Medium (DMEM) containing high glucose, pyridoxine hydrochloride and
sodium pyruvate (Cat. No. 12800-058, Invitrogen) was prepared as per the manufacturer’s
instructions.
The powdered medium was reconstituted by dissolving it in ~ 800 ml autoclaved Milli-Q
water under sterile conditions. 3.5 g Sodium bicarbonate was added and the pH was

60
adjusted to 7.5 using 1N HCl (about 11 ml). The volume was made up to 1 L in a sterile
volumetric flask and the medium was filter sterilized through a 0.22 µm pore size filter
membrane (Cat no. GSWP04700) fitted in a sterile filtration assembly. The filtered
medium was stored as 500 ml aliquots at 4ºC. The complete medium contained DMEM
supplemented with 10 % fetal bovine serum (FBS), Invitrogen (Cat. No. 16140-071). 1 ml
of the 100 X antibiotic (Penicillin and streptomycin) stock solution was added per 100 ml
of complete medium if required.
2. 100 X antibiotic mix: 10,000 units penicillin G (Alembic Ltd, Vadodara, India) and
10,000 µg streptomycin sulphate, available as injection vials (Abbott Healthcare Pvt. Ltd,
Ahmedabad, India) were dissolved per ml in Milli-Q water, filter sterilized and stored at
4 °C.
3. 10 X phosphate buffered saline (PBS): 80.8 g NaCl, 2 g KCl, 12.6 g Na2HPO4. 2 H2O,
2 g KH2PO4, and 10 g glucose was dissolved in autoclaved Milli-Q water and the volume
made up to 1 L. The solution was filter sterilized and stored at 4 °C.
4. 10 X Trypsin (0.25 %): 2.75 g of trypsin was added to 110 ml of autoclaved Milli-Q
water and allowed to dissolve overnight on a magnetic stirrer. The solution was sterilized
by filtering through a 0.22 µm pore size Millipore filter. The solution was stored as 10 ml
aliquots at -20 ºC. 10 X stocks were diluted to 1 X working solution with 1 X PBS.
Working solution was stored at 4 °C.
3.7. Routine maintenance of cell Lines
All glassware and plastic-ware used for tissue culture work were sterile. For maintenance
and experimental use, all adherent cells (like HEK 293FT, Daoy) were trypsinized and
passaged as follows:

Chapter 3: Materials and Methods
61
1. Spent medium was aspirated out using a Pasteur pipette and the cells in the plate were
rinsed twice with 1 X PBS.
2. 1 X trypsin was added to the tissue culture dish, and was removed after the cells started
to round up but just before the cells started detaching. The cells were collected in 1 X PBS
and the cell suspension was transferred to a centrifuge tube containing about 1 ml complete
medium as serum inhibits trypsin activity and tightly corked.
3. The cell suspension was centrifuged for ~ 2 min at 1000 rpm in REMI bench top
centrifuge. The supernatant was discarded and the cell pellet was loosened by tapping the
tube gently.
4. The cells were suspended in an appropriate volume of complete medium (DMEM
supplemented with 10 % FBS), cell count was taken using a hemocytometer, and the
required cell number was seeded in tissue culture dishes, and incubated at 37 °C in a
humidified 5 % CO2 incubator. The cultures were passaged twice a week (at around 70-
75% confluency) or were frozen when required. The cells were not passaged for too long
and fresh vial of frozen cells was revived at regular time intervals.
3.8. Freezing and revival of cell cultures
1. For freezing of cells, 80-90 % confluent cultures were trypsinized as described above.
The cell pellet was loosened by tapping the tube gently, and the centrifuge tube was placed
on ice for one-two minutes. Pre-chilled freezing medium (90 % FBS + 10 % DMSO) was
added drop wise to the cell pellet (~ 1 x 10⁶ cells / ml of freezing mixture) on ice, with
constant shaking to ensure an even cell suspension and transferred to pre-chilled vials.
These vials were cooled gradually and then stored in liquid nitrogen.
2. To revive the frozen cells, a vial containing frozen cells was removed from liquid
nitrogen and immediately thawed in a water-bath at 37 °C. As soon as the cell suspension

62
thawed, it was transferred to a centrifuge tube containing 5 ml complete medium and
centrifuged at 1000 rpm for 2 min. The supernatant was discarded; cell pellet was loosened
by tapping the tube gently and resuspended in 5 ml complete medium and centrifuged
again. The supernatant was discarded and the cells were re-suspended in an appropriate
volume of complete medium. The medium was replaced after the cells had adhered to the
tissue culture dish, preferably on the same day or next day of revival.
3.9. Transient transfection of human medulloblastoma cell line Daoy with miRNA
mimics / siGLO control
The functional significance of three WNT subgroup specific miRNAs, miR-193a-3p (50
nM), miR-224 (100 nM), and miR-23b (100 nM) was studied on the growth characteristics
of human medulloblastoma cell line Daoy. The miRNAs were overexpressed in Daoy
using synthetic miRNA mimics and Dharmafect 2 transfection reagent as per
manufacturer’s protocol. 100 nM each of siGLO RISC-Free Control siRNA and
miRIDIAN microRNA mimic negative control 1 served as negative controls. The siGLO
RISC-Free Control siRNA is a stable, fluorescent RNAi control that is chemically
modified to impair processing and uptake by RISC, allowing study of cellular effects
related only to miRNA transfection.
Method:
1. The lyophilized miRNA mimics were reconstituted in 250 μl nuclease-free water to a
final concentration of 20 μM and stored as aliquots in -20 °C.
2. One day prior to transfection, 18,000 Daoy cells / well were seeded in triplicates in a 24-
well plate, so that ~ 80-90 % confluency would be achieved at the time of transfection.
3. For each well, 50-100 nM of miRNA mimics/siGLO and Dharmafect-2 (1.25 μl) were
diluted separately in 50 μl plain DMEM gently by pipetting up and down.
Chapter 3: Materials and Methods
63
4. The mix was incubated for 5 min at RT. The diluted miRNA mimics and Dharmafect-2
were then mixed together by gentle pipetting up and down and incubated at room
temperature for 20 min.
5. After 20 min of incubation the miRNA mimic and Dharmafect-2 mix was diluted up to
0.5 ml with complete medium (10 % FBS + 1 X DMEM) and added over the cells
replacing the existing medium. (A master mix was prepared according to the number of
wells to be transfected.)
6. After 48 h of transfection, medium was replaced completely with 0.5 ml complete
medium, and cells were allowed to recover for a period of 24 h before analyzing their
growth characteristics.
7. Next day, i.e. 72 h post-transfection, the cells were trypsinized from one or more wells
depending on experiment requirements and seeded for thymidine incorporation, clonogenic
and soft agar assay as described ahead. RNA lysate was made from the transfected cells
from one well of a 24-well plate to check the miRNA levels by real time RT-PCR.
3.10. Extraction of RNA from tissue cultured cells
Total RNA was extracted from miR-193a-3p, miR-224, miR-23b, siGLO and siRNA
negative control transfected Daoy cells using acid guanidinium thiocyanate-phenol
chloroform method as described before. All solutions were DEPC treated, unless otherwise
stated. Only RNase free sterile plastic wares were used.
Method:
1. The medium was poured off, cells were washed with 1 X PBS twice and 0.5 ml of
Solution D was added for a 35 mm dish.
2. The cell lysate was collected by tilting the plate and was passed immediately through a
sterile syringe fitted with a 26 gauge needle. This was done at least ten times until the

64
lysate lost its viscosity, resulting in complete shearing of the genomic DNA.
3. At this stage the lysate was either stored at -20 °C or processed further immediately in
the same way as the RNA extraction from fresh frozen tumor tissues [refer Section 3.2.1
(b) steps 3-9].
4. The miRNA levels in the transfected cells were estimated by real time RT-PCR using
RNU48 as the endogenous small RNA control similarly as described before.
3.11. Thymidine incorporation assay
Proliferation of miRNA mimic transfected Daoy cells was studied by the thymidine
incorporation assay.
Materials
1. Scintillation fluid: For 2.5 litre, 17.5 gm of PPO and 1.25 gm POPOP was added to 1
litre of toluene. The flask containing the above solution was covered with foil and kept on
a magnetic stirrer overnight. Next day, after the powder had completely dissolved the
volume was made upto 2.5 litre with toluene.
2. Tritiated thymidine
Method:
1. 72 h post transfection, the cells were trypsinized and 2500 cells / well of a 96-well plate
were seeded in triplicates.
2. Next day, the cells were incubated in the presence of 1 μCi of tritiated thymidine
(specific gravity 240 Gbq / mmole, from Board of Radiation and Isotope Technology-
BRIT, India) per well for a period of 20 h before harvesting by trypsinization.
3. Harvesting was done using a cell harvester onto a filter paper (Titertek, Norway).

Chapter 3: Materials and Methods
65
4. The filter paper was allowed to dry at 37 °C and subsequently each harvested well on the
filter paper was carefully cut out using a forcep and dipped in scintillation vials containing
3ml of scintillation fluid
5. The tritiated thymidine incorporated was estimated using a beta scintillation counter.
The average count from three miRNA / control wells was represented as histograms.
3.12. Clonogenic assay:
Clonogenic assay was performed to study the clonogenic potential and radiation sensitivity
of Daoy cells transiently transfected with miRNA mimics.
Method:
1. 72 h post transfection, the cells were trypsinized and 1000 cells were seeded in
triplicates per 55 mm plate.
2. Next day the cells were irradiated at a dose of 6 Gy (Cobalt-60 gamma irradiator,
Bhabhatron, developed by Bhabha Atomic Research Center, India).
3. The medium was changed 24 h later. The cells were allowed to grow for 8-10 days until
microscopically visible colonies formed.
4. The cells were fixed by incubation in chilled methanol: acetic acid (3:1) overnight at
4 °C, stained with 0.5 % crystal violet dye and the colonies were counted using a
stereomicroscope. Average colony count from three miRNA / control plates was
represented as histograms.
3.13. Soft agar colony formation assay
Anchorage-independent growth of Daoy cells transiently transfected with miRNA mimics
was studied by their potential to form colonies in soft agar medium.

66
Method:
1. For the soft agar medium, 2 X DMEM containing 20 % FBS was mixed with an equal
volume of molten 2 % low melting point (LMP) agarose, and 1 ml of this mixture was
poured into a sterile 35 mm dish to obtain a basal layer of 1 % agarose in complete
medium (DMEM + 10 % FBS). The agarose was allowed to set for ~ 1 h at room
temperature before seeding the cells.
2. 10,000 control or miRNA transfected Daoy cells were trypsinized and suspended in 1 X
DMEM supplemented with 10 % FBS.
3. 2 % LMP molten agarose and 2 X DMEM + 20 % FBS were added to the cell
suspension such that the final concentration of agarose in the suspension was 0.4 % and
serum content was 10 %.
4. The contents were mixed properly using a micropipette and 1 ml of this mixture was
added to a 35 mm dish pre-coated with the basal layer.
5. The agar was allowed to solidify for about 1 – 2 h at room temperature and then the
plates were incubated at 37 °C, 5 % CO2.
6. The cells were fed with 0.1 - 0.2 ml complete medium every 3 days throughout the
duration of the experiment.
7. After ~ 4 weeks of incubation, colonies (comprising of 10-15 cells per colony) were
counted under microscope from the entire plate. Average colony count from three miRNA/
control plates was represented as histograms.
3.14. Statistical analysis
3.14.1. Analysis of miRNA profiling data
Data acquisition and analysis was done by the RQ Manager Software of the ABI Prism
7900HT Real time PCR. The relative level of each miRNA was computed by the Δ Ct

Chapter 3: Materials and Methods
67
method. Ct (threshold cycle) value is the number of amplification cycles required to reach
a certain threshold signal level. It is inversely proportional to the log of the initial amount
of target nucleic acid present in the sample and is determined by the SDS 2.1 software. To
obtain the Δ Ct, Ct value of the endogenous control RNA (RNU48) was subtracted from
that of the specific miRNA for each sample. The RQ was then calculated using the
formula: RQ = 2 - (ΔCt)
3.14.2. Cluster analysis and identification of differentially expressed miRNAs
The MultiExperiment (MeV) v 4.3 from the TM4 Microarray Software Suite [104] was
used for identification of differentially expressed miRNAs, clustering, bootstrap analysis
and generation of heat maps as detailed below:
a) Unsupervised Hierarchical Clustering (HCL) [105]
Hierarchical clustering (HCL) allows to group genes as well as samples having similar
expression profiles. Class assignment results from applying a similarity measure (i.e.
distance measure or correlation) and a selected method to calculate the distance of an
object to a class (i.e. single, complete or average linkage). The relationship among samples
are represented by a tree (dendrogram) whose branch lengths reflect the degree of
similarity between the samples. In the present study, unsupervised two-way hierarchical
clustering using Pearson’s correlation and average linkage was performed to identify
clusters of medulloblastoma, defined by differences in their miRNA expression. Log 10
transformed RQ values were used for the clustering analysis.
b) Support Tree analysis (ST) [106]
The ST tool in MeV was used to perform bootstrap analysis to assess the stability of the
clusters identified by unsupervised HCL using the significantly differentially expressed
miRNAs. Bootstrapping is performed by constructing resamples of the observed dataset
68
(and of equal size to the observed dataset), each of which is obtained by random sampling
with replacement from the original dataset. Values in the original dataset may occur more
than once since the selection uses replacement. The number represented on each node of a
cluster, after analysis, denotes the percentage of times a given node was supported over the
re-sampling trials. 100 % bootstrap support indicates highest bootstrap support that is in all
the re-sampling trials the sample was assigned to the same cluster.
c) Significance Analysis of Microarray (SAM) [107]
SAM is a statistical method for identifying significant genes based on the differential
expression between two or more sets of samples. It is useful when there is an a priori
hypothesis that some genes will have significantly different mean expression levels
between different sets of samples. As against the t-test, SAM gives estimates of the False
Discovery Rate (FDR), which is the proportion of genes likely to have been identified by
chance as being significant. In this study, the miRNAs significantly differentially
expressed in each of the four molecular subgroups were identified by SAM analysis using
a False Discovery Rate (FDR) of 0 %.
3.14.3. Real time RT-PCR gene and miRNA expression data analysis
The RQ of each protein coding gene / miRNA as compared to GAPDH / RNU48
respectively was determined by the comparative Ct method, using the formula:
RQ = 2- (ΔCt) x 100; where, ΔCt = Ct (Gene/miRNA) – Ct (GAPDH/RNU48).
The subgroup-specific signature genes that were used for subgroup assignment in the
present study were identified by SAM analysis of our microarray data [15]. Depending on
the expression of a subgroup-specific gene, that was evaluated by real time RT- PCR, a
cut-off value was derived based on the average expression of that gene within its subgroup
as compared to the other subgroups taking into account the confidence interval as well as

Chapter 3: Materials and Methods
69
inter-quartile range. The relative expression of each protein-coding gene/ miRNA across
the four subgroups was log2 transformed and represented as scatter dot plots using
GraphPad Prism v 5.0. Statistical significance of the differential expression of each
protein- coding gene/ miRNA obtained by real time RT-PCR across the four molecular
subgroups was determined by One-way Analysis Of Variance (ANOVA). Student’s t-test
was performed to evaluate the significance of difference in the relative expression of
protein-coding genes / miRNA between two subgroups.
3.14.4. Development of a real time PCR based Assay for molecular subgrouping of
medulloblastomas
a) Prediction Analysis of Microarrays (PAM) [108]
The nearest shrunken centroid classifier implemented in PAM for Excel package performs
class prediction analysis. Briefly, the method computes a standardized centroid for each
class. The centroid is the average gene expression for each gene in each class divided by
the within-class standard deviation for that gene. Nearest centroid classification takes the
gene expression profile of a new sample, and compares it to each of these class centroids.
The class whose centroid it is closest to, in squared distance, is the predicted class for that
new sample. Nearest shrunken centroid classification makes one important modification to
standard nearest centroid classification. It shrinks each of the class centroids towards the
overall centroid for all classes by an amount we call the ‘threshold’. This shrinkage
consists of moving the centroid towards 0 by threshold, setting it equal to zero if it hits 0.
For e.g. If threshold was 2.0, a centroid of 3.2 would be shrunk to 1.2, a centroid of -3.4
would be shrunk to -1.4, and a centroid of 1.2 would be shrunk to 0. After shrinking the
centroids, the new sample is classified by the usual nearest centroid rule, but using the
shrunken class centroids.

70
For selection of a threshold, PAM does a 10-fold cross validation for a range of
threshold values. The samples are divided into 10 random roughly equally sized parts. For
each part, the classifier is built on the other 9 parts then tested on the remaining part for a
range of threshold values. The threshold value giving the minimum cross-validated
misclassification error rate is chosen. The final output of PAM analysis upon class
prediction of the test set includes a test set prediction matrix (true group v/s predicted
group) and the predicted posterior probabilities of all samples across the four subgroups.
In the present study, the expression levels of the subgroup-specific genes and
miRNAs obtained as RQ by real time RT-PCR were log 2 transformed for PAM analysis.
The samples were divided into a training set and test set. Based on the gene scores
obtained by PAM analysis, the minimal set of markers (classifier) giving lowest
misclassification error on cross-validation, from the set of 12 protein- coding genes and 11
miRNAs, were chosen. In addition, the significance of each marker in the assay was
determined by excluding that marker and classifying the training set on the remaining (n-1)
markers. Robustness of the training set was assessed by cross-validation. Predicting
membership within the training cohort enables assessment of classifier performance on the
dataset from which it was derived. Subject to satisfactory performance on the training set,
subsequent classification of the test set (classified primarily as described in Section 3.14.3)
was done. The prediction accuracy of the classifier was determined by testing its ability to
predict the subgroup of 34 DKFZ FFPE medulloblastomas (with known subgroup
affiliation). This served as a validation of the real time RT-PCR based assay.
b) Receiver Operating Characteristic (ROC) Curve [109]
Originally invented for the detection of radar signals during World War II, ROC
curves are now commonly used to evaluate classifiers in biomedical and bioinformatics

Chapter 3: Materials and Methods
71
applications. The ROC curve determines the performance of a classifier. It is a plot of
sensitivity v/s 1- specificity, or true positive (TP) rate v/s false positive (FP) rate where:
TP rate = Positives correctly classified FP rate = Negatives incorrectly classified Total Positives Total Negatives
The Area Under Curve (AUC) of 1 derived from an ROC curve analysis denotes a perfect
classifier i.e. 100 % sensitivity and specificity. In the present study, ROC curve analysis
was performed using SPSS 15.0 software. The predicted posterior probabilities for all the
samples within a subgroup, obtained by PAM analysis, were used as input values to derive
the ROC curve for each subgroup.
3.14.5. Survival analysis
Event for overall survival was calculated from the date of surgery until death or last
follow-up date. Univariate analysis was done to determine the predictors of poor survival
outcome (miRNA, MYCN). The survival data for a particular predictor was divided into
two groups (high vs. low expression) based on the Average expression value + Confidence
Interval (CI) for that predictor across all samples as the cut-off. Hazard ratio and its 95 %
confidence interval for a predictor were computed using the Mantel-Haenszel method in
GraphPad Prism v 5.0. Survival percentages were estimated by Kaplan-Meier method and
statistical significance between the survival curves was estimated by log- rank test using
GraphPad Prism.
3.14.6 Functional significance of miRNAs
The difference in the performance of miRNA transfected cells as compared to siGLO
control transfected cells in thymidine, clonogenic, and soft agar assay, was evaluated by
Student’s t-test using GraphPad Prism v 5.0.

RESULTS
Chapter 4
72
RESULTS
Deregulation of gene expression profiles and disruption of molecular networks is a
hallmark of cancer, and knowledge of this has been vital towards better understanding of a
particular cancer. Gene expression profiling is a useful method for identifying and studying
deregulated gene expression in various cancers. It has proven to be valuable in more
accurately classifying tumors, predicting clinical outcome and thereby deciding treatment
strategies. Genome-wide expression profiling data from our group as well as reports by
other investigators have indicated that medulloblastoma is not a single disease, but is
comprised of molecularly distinct subgroups [15-16, 58-59]. There are four core molecular
subgroups: WNT, SHH, Group 3 and Group 4 according to the current consensus [17].
MicroRNAs (miRNAs) are a class of non-coding RNAs, 18-22 nucleotides in
length that regulate the expression of protein-coding genes. MiRNAs bind to
complementary sequences in the 3’-UTR region of multiple target genes usually resulting
in silencing [19]. Each miRNA is believed to target several hundred genes. Most miRNA
expression analysis of human cancers have arrived at a common conclusion that miRNAs
are deregulated in cancer and miRNA expression profile represents tumor biology better
than the expression profile of protein-coding genes. MiRNA expression profile has been
found to have diagnostic and prognostic potential in the classification of various cancers
[21-22]. Hence, in addition to protein-coding genes, it is crucial to study the role played by
miRNAs and their functional significance in the development of medulloblastoma, for
further understanding the pathogenesis of this tumor. Therefore, in the present study
miRNA expression profiling was carried out on a set of medulloblastomas that were
molecularly subgrouped based on genome-wide expression profiling of protein-coding
genes.

73
The expression profiling study reported using Affymetrix gene 1.0 ST arrays was
performed on 19 medulloblastomas and 4 normal cerebellar tissues [15]. The expression
profile identified the four core subgroups, which are distinguished by their gene expression
profiles. The 19 tumors comprised of 6 WNT, 3 SHH, 2 Group 3, and 8 Group 4 tumors.
The WNT subgroup is best distinguished by overexpression of WNT inhibitory factor 1
(WIF1), Dickkopf (DKK) family, Naked cuticle 1 (NKD1), Lymphoid enhancer-binding
factor 1 (LEF1), AXIN2, MYC etc. and having CTNNB1 mutation and monosomy 6. SHH
subgroup tumors overexpress Hedgehog interacting protein (HHIP), Atonal homolog 1
(ATOH1), Secreted frizzled-related protein 1 (SFRP1), GLI family zinc finger 2 (GLI2),
Patched 1 (PTCH1), MYCN, Eyes absent homolog 1(EYA1), etc. and show
underexpression of Orthodenticle homeobox 2 (OTX2). Group 3 and 4 have an overlapping
gene signature that includes overexpression of transcription factors involved in brain
development like Eomesodermin (EOMES) and Forkhead box G1B (FOXG1B), RNA
binding proteins like LEM domain containing 1 (LEMD1) and KH domain containing,
RNA binding, signal transduction associated 2 (KHDRBS2). Group 3 tumors overexpress
proliferation related genes like MYC, Cyclin D2 (CCND2), TGF-beta signaling
components like Transforming growth factor-beta 1 (TGFB1), retina-specific genes like
Interphotoreceptor matrix proteoglycan 2 (IMPG2), Neural retina leucine zipper (NRL),
Cone-rod homeobox (CRX) and others like Natriuretic peptide receptor 3 (NPR3) while
Group 4 tumors overexpress neuronal differentiation genes like Glutamate receptor,
metabotropic 8 (GRM8), Potassium voltage-gated channel, shaker- related subfamily,
member 1 (KCNA1), Unc-5 homolog D (UNC5D) etc. A heat map depicting the signature
genes for each molecular subgroup is shown in Figure 4.1.

Chapter 4: Results
74
Figure 4.1: Heat map depicting expression of subgroup specific signature genes for each of
the four subgroups. The dendrogram above the heat map clearly shows the four distinct clusters of
medulloblastoma. Blue: WNT subgroup; Red: SHH subgroup; Yellow: Group 3 and Green: Group
4 [15].

75
MicroRNA profiling of medulloblastoma tissues so as to identify distinct molecular
subgroups.
4.1. Identification of differentially expressed miRNAs by miRNA profiling
MiRNA profiling was carried out on the aforementioned 19 sporadic human
medulloblastomas and 4 normal human cerebellar tissues using TaqMan Low Density
Array v 1.0. Of the 365 miRNAs studied, 216 were found to be expressed in the
medulloblastomas and/or normal cerebellar tissues. Significance analysis of Microarrays
(SAM) at FDR 0 % was performed in order to identify the miRNAs significantly
differentially expressed in each subgroup (Appendix I). Figure 4.2 shows a heat map
depicting the expression of 54 miRNAs that are significantly differentially expressed in the
four medulloblastoma subgroups and normal cerebellar tissues. The fold change of the
miRNAs significantly differentially expressed in each medulloblastoma subgroup as
compared to both normal as well as other subgroups is listed in Table 4.1.
Unsupervised hierarchical clustering using the expression data of the 216 miRNAs
segregated the tumors into 4 clusters/subgroups with the normal samples segregating as a
distinct cluster [Figure 4.3 (B)]. Bootstrap analysis was performed to determine the
strength of each cluster. All four normal cerebellar tissues clustered together with a
bootstrap support of 95 %. All 6 WNT subgroup tumors segregated as one distinct cluster
with the highest bootstrap support of 100 %. Group 4 tumors were split as two sub-clusters
on either side of the normal cerebellar tissues, with 5 tumors forming one cluster of support
43 % and 3 tumors forming another with a support of 38 %.

Chapter 4: Results
76
Figure 4.2: Heat map showing expression of 54 miRNAs significantly differentially expressed
in the molecular subgroups of medulloblastomas and normal cerebellar tissues as judged by
SAM analysis with a False Discovery Rate of 0 %. Grey: Normal; Blue: WNT; Red: SHH;
Yellow: Group 3; Green: Group 4. The miRNAs in the yellow box within the heat map represent
the most upregulated/ downregulated miRNAs in each of the four subgroups. MiRNAs forming a
part of a cluster have been shown on the right. The expression levels are represented as log10
transformed RQ values.

77
Table 4.1: MiRNAs significantly differentially expressed in each medulloblastoma subgroup
as compared to both normal cerebellar tissues as well as other subgroups as obtained by
SAM analysis at FDR 0 %. Ratio of the mean expression level of each miRNA in a specific
subgroup with its mean expression level in other subgroups is indicated as fold change (FC). Red
denotes activated/upregulated while green denotes downregulated
The two tumors of Group 3 were clustered together with a bootstrap support of 42 %. Two
of the three tumors of SHH subgroup having MYCN amplification formed one cluster with
63 % bootstrap support. Thus hierarchical cluster analysis on miRNA profile data clustered
all but one SHH subgroup tumor similar to the clusters obtained using expression profile
data of protein-coding genes, although, the overall bootstrap support was not as strong
[Figure 4.3 (A)].

Chapter 4: Results
78
Figure 4.3: Support tree analysis. (A) Bootstrap analysis of microarray profiling data of
medulloblastomas using 1000 high SD genes. Samples were clustered using Pearson correlation
and average linkage [15]. (B) Bootstrap analysis of miRNA profiling data of 19 medulloblastomas
and 4 normal cerebellar tissues done using 216 miRNAs expressed in medulloblastoma tumor
tissues. Analysis was done on log10 transformed miRNA RQ values. The number on each node
denotes the percentage of times a given node was supported following 100 iterations. Grey:
Normal, Blue: WNT subgroup, Red: SHH subgroup, Yellow: Group 3, Green: Group 4.
The specific miRNA profiles of each of the four medulloblastoma subgroups are described
below and depicted in Figure 4.2.
4.1.1. WNT subgroup
The WNT subgroup tumors showed the most robust miRNA signature with 16 miRNAs
differentially expressed as compared to normal cerebellar tissues as well as all other
subgroups. A number of miRNAs like miR-193a, miR-224/ 452 cluster, miR-182/ 183/96
cluster, miR-365, miR-135a, miR-148a, miR-23b/27b/24, miR-204, miR-146b, miR-
449/449b cluster, miR-335, and miR-328 were found to be overexpressed by 3-70 fold
almost exclusively in the tumors associated with the WNT signaling pathway [Figure 4.2
and Appendix I]. Most of the miRNAs belonging to a cluster (group) of miRNAs located
next to each other on a chromosome were found to be co-expressed. MiR-224 and miR-

79
452 belong to a single miRNA cluster located in the intron of GABRE gene coding for
GABA receptor, which is known to be overexpressed in the WNT tumors. Similarly, miR-
23b/27b/24 cluster is located in the intron of C9ORF3 gene, which was found to be
overexpressed in all WNT tumors. These miRNAs therefore appear to be co-expressed
with their host genes.
4.1.2. SHH subgroup
The SHH subgroup tumors were distinctive in their marked underexpression of miR-135b,
miR-204, miR-153, and miR-182. One of the SHH tumors reported to have C9ORF3
overexpression was found to have upregulation of the miR-23b cluster.
4.1.3. Group 3 and 4
MiR-135b, a miRNA located in an intron of the LEMD1 gene, was found to be over-
expressed in both Group 3 and Group 4 tumors. LEMD1 gene is also overexpressed in
these tumors. MiR-204 and miR-153, underexpressed in SHH subgroup tumors, were also
found to be underexpressed in Group 3 tumors. MiR-204 is located in an intron of TRPM3,
a gene which has been reported to be downregulated in SHH and Group 3 tumors [15].
While miR-182 was found to be over-expressed in some Group 3 / Group 4 tumors, miR-
204 was seen to be over- expressed in most Group 4 medulloblastomas.
4.1.4. MiRNAs common to multiple subgroups of medulloblastomas
MiR-17/92 cluster miRNAs (miR-17, miR-18a, miR-19a, miR-20a, miR-19b, and miR-
92a) were overexpressed in WNT, SHH and Group 3 medulloblastomas. Normal adult
cerebellar tissues had the least expression of miR-17/92 cluster miRNAs. MiR-106b and
miR-25, which belong to miR-17/92 paralog cluster, were also overexpressed in all

Chapter 4: Results
80
medulloblastomas relative to normal cerebellar tissues. MiR-214 and miR-199a were
found to be overexpressed in all the tumors having overexpression of wound healing
pathway genes (TGFB1, ITGA1, COL3A1, PDGFRB, IGFBP4, etc.). MiR-379/miR-
656 cluster miRNAs, located within an imprinted region on chromosome 14, were found to
be underexpressed in WNT, SHH, and Group 3 tumors as compared to normal cerebellar
tissues and Group 4 tumors. MiR-127/miR-432/miR-433 miRNA cluster on chromosome
14 was also similarly underexpressed in WNT, SHH, and Group 3 tumors. Another
miRNA, considerably down-regulated in WNT, SHH and Group 3 medulloblastomas was
miR-124a.
Besides this, several miRNAs were highly expressed in normal cerebellum relative
to medulloblastomas. Group 4 tumors appeared to have the most overlapping miRNA
expression profile with the normal cerebellar tissues consistent with the expression of
neuronal differentiation related genes in this subgroup.
4. 2. Validation of the differential miRNA expression in the molecular subgroups of
medulloblastomas
4.2.1. Molecular sub-grouping based on the expression profile of protein-coding genes
Differential miRNA expression was validated on a set of 44 fresh frozen (inclusive of 18
profiled tumors) and 59 FFPE tissues. Molecular sub-grouping of 103 medulloblastomas
was done by a real-time RT-PCR based evaluation of expression levels of a set of protein-
coding genes as markers. Twelve genes (WIF1, DKK2, MYC, HHIP, EYA1, MYCN,
IMPG2, NPR3, GRM8, UNC5D EOMES, OTX2) were selected as markers based on the
standardized fold change in the expression of the gene in a particular subgroup from our
profiling data (Appendix II) as well as that in other published reports [16, 58].
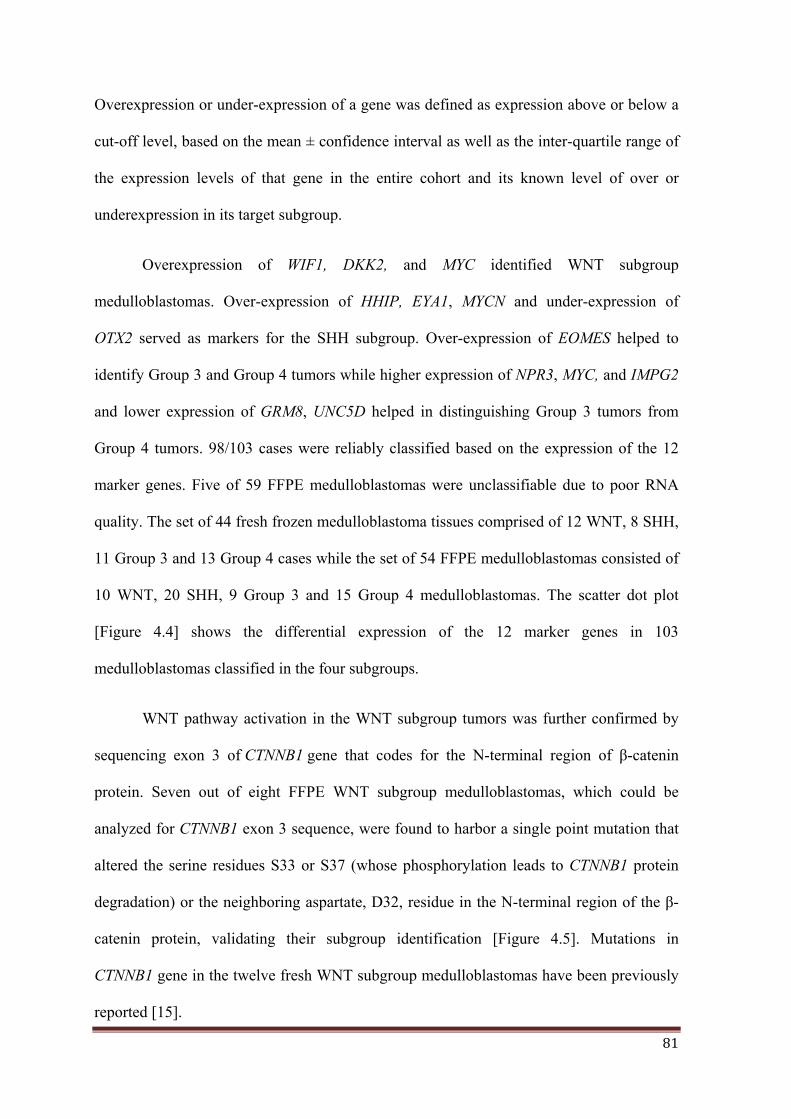
81
Overexpression or under-expression of a gene was defined as expression above or below a
cut-off level, based on the mean ± confidence interval as well as the inter-quartile range of
the expression levels of that gene in the entire cohort and its known level of over or
underexpression in its target subgroup.
Overexpression of WIF1, DKK2, and MYC identified WNT subgroup
medulloblastomas. Over-expression of HHIP, EYA1, MYCN and under-expression of
OTX2 served as markers for the SHH subgroup. Over-expression of EOMES helped to
identify Group 3 and Group 4 tumors while higher expression of NPR3, MYC, and IMPG2
and lower expression of GRM8, UNC5D helped in distinguishing Group 3 tumors from
Group 4 tumors. 98/103 cases were reliably classified based on the expression of the 12
marker genes. Five of 59 FFPE medulloblastomas were unclassifiable due to poor RNA
quality. The set of 44 fresh frozen medulloblastoma tissues comprised of 12 WNT, 8 SHH,
11 Group 3 and 13 Group 4 cases while the set of 54 FFPE medulloblastomas consisted of
10 WNT, 20 SHH, 9 Group 3 and 15 Group 4 medulloblastomas. The scatter dot plot
[Figure 4.4] shows the differential expression of the 12 marker genes in 103
medulloblastomas classified in the four subgroups.
WNT pathway activation in the WNT subgroup tumors was further confirmed by
sequencing exon 3 of CTNNB1 gene that codes for the N-terminal region of β-catenin
protein. Seven out of eight FFPE WNT subgroup medulloblastomas, which could be
analyzed for CTNNB1 exon 3 sequence, were found to harbor a single point mutation that
altered the serine residues S33 or S37 (whose phosphorylation leads to CTNNB1 protein
degradation) or the neighboring aspartate, D32, residue in the N-terminal region of the β-
catenin protein, validating their subgroup identification [Figure 4.5]. Mutations in
CTNNB1 gene in the twelve fresh WNT subgroup medulloblastomas have been previously
reported [15].

Chapter 4: Results
82
Figure 4.4: Molecular- subgrouping of medulloblastomas by real- time RT-PCR using 12
protein- coding genes. The scatter dot plot shows log 2 transformed relative expression levels (Y-
axis) of the indicated protein-coding genes in the 103 medulloblastomas assigned to the four
molecular subgroups (X-axis). The horizontal black line within each cluster denotes the median
level of expression. The p-value given on the top of each scatter indicates the significance of the
differential expression of the marker gene across the four subgroups as determined by ANOVA.
4.2.2. Differential miRNA expression in the molecular subgroups of
medulloblastomas
The expression of a select set of eleven miRNAs (miR-193a-3p, miR-224, miR-148a, miR-
23b, miR-365, miR-182, miR-135b, miR-204, miR-592, miR-10b, and miR-376a) most
significantly differentially expressed was validated by real-time RT-PCR. The selection of
miRNAs differentially expressed in the four subgroups was based on the profiling data
using SAM analysis (Appendix I) as described earlier. MiR-592 was not present on the
TLDA array and was selected for validation based on published reports of its differential
expression in Group 3 and Group 4 tumors [59, 83].

83
Figure 4.5: Mutation analysis of exon 3 of β-catenin (CTNNB1) in the WNT subgroup FFPE
medulloblastomas: Nucleotide Sequence of exon 3 of the CTNNB1 gene in 7 FFPE WNT
subgroup medulloblastomas. Arrow indicates the altered nucleotide and (*) indicates the altered the
amino acid.

Chapter 4: Results
84
Validation was done on a total of 101 medulloblastomas. Total RNA was not
available for 2 fresh frozen tumor tissues for miRNA expression analysis. WNT subgroup
tumors showed significant overexpression (p < 0.0001) of miR-193a-3p, miR-224, miR-
148a, miR-23b, miR-365 and miR-10b as compared to other subgroup medulloblastomas
thereby confirming the distinctive miRNA signature of the WNT subgroup
medulloblastomas. MiR-182 over-expression (p < 0.0001) was confirmed in all WNT
subgroup medulloblastomas. In addition, many (17/21) Group 3 (p < 0.0001) and some
(7/29) Group 4 medulloblastomas (p < 0.0462) also showed significant miR-182 over
expression. MiR-204 was overexpressed (p < 0.0001) in all WNT subgroup
medulloblastomas and in most (25/29) Group 4 medulloblastomas (p < 0.0001).
Underexpression of miR-182 (p < 0.0001), miR-135b (p < 0.0001), and miR-204 (p <
0.0001) was confirmed in SHH subgroup medulloblastomas. Group 3 and Group 4 tumors
showed significant overexpression of miR-135b (p < 0.0001) as compared to WNT and
SHH subgroup. MiR-592, a miRNA located within the GRM8 gene, was significantly
overexpressed (p < 0.0001) in Group 4 medulloblastomas. MiR-10b was expressed at the
highest level in WNT subgroup medulloblastomas (p < 0.0001) while it was significantly
underexpressed (p < 0.0001) in SHH tumors. MiR-376a, which belongs to the miR-
379/miR-656 cluster miRNAs, was found to be significantly higher (p = 0.0082) in Group
4 medulloblastomas as compared to Group 3 medulloblastomas.
Real time RT-PCR, thus confirmed the differential miRNA expression, as seen by
miRNA profiling, of a select set of miRNAs in the four molecular subgroups of an
independent set of medulloblastomas. The scatter dot plot representing the differential
miRNA expression across the four molecular subgroups in the 101 medulloblastoma
samples is shown in Figure 4.6. The five FFPE medulloblastomas that were unclassifiable

85
due to poor RNA quality using protein- coding genes alone as markers were classified
primarily based on their miRNA profile as discussed later.
Figure 4.6: Validation of differential miRNA expression in medulloblastomas by real time
RT-PCR. The scatter dot plot shows log 2 transformed relative expression levels (Y-axis) of the
indicated miRNA in 101 medulloblastomas assigned to the four molecular subgroups (X-axis). The
horizontal black line within each cluster denotes the median level of expression. The p-value given
on the top of each scatter indicates the significance of the differential expression of the marker gene
across the four subgroups as determined by ANOVA.
A difference of ~ 8-cycles was observed between the average Ct values of RNU48 (19 ±
1.7) and GAPDH (27 ± 2.1) wherein amount of cDNA used for GAPDH evaluation was
2.5 times higher than that used for RNU48 evaluation, indicating integrity of small RNAs
(miRNAs) being about 600 fold higher than that of protein-coding gene RNAs. Therefore,

Chapter 4: Results
86
the evaluation of miRNA expression was reliable, reproducible, and sensitive even in 7 to
8 yr old FFPE tumor tissues [Figure 4.7].
Figure 4.7: House-keeping gene (GAPDH) and small RNA control (RNU48) Ct value
correlation with age of the block. The Ct values for GAPDH and RNU48 were obtained by real
time RT-PCR for each of the 59 FFPE medulloblastomas studied.
Delineate the role of specific miRNAs in medulloblastoma pathogenesis.
4.3. Functional Significance of WNT- subgroup specific miRNAs on the growth and
malignant potential of medulloblastoma cells
MiRNA expression profiling indicated that the WNT subgroup tumors had the most robust
miRNA signature. Medulloblastomas with activated WNT signaling pathway have been
reported to have a lower metastatic potential and better prognosis [56]. In order to
understand the functional significance of the miRNAs overexpressed in medulloblastomas
associated with WNT signaling activation, three miRNAs, viz. miR-193a, miR-
224, and miR-23b, were exogenously expressed in Daoy cell line established from a
human sporadic medulloblastoma. The effect of expression of these miRNAs on
proliferation, clonogenic potential, radiation sensitivity, and anchorage- independent
growth of Daoy cells was investigated.
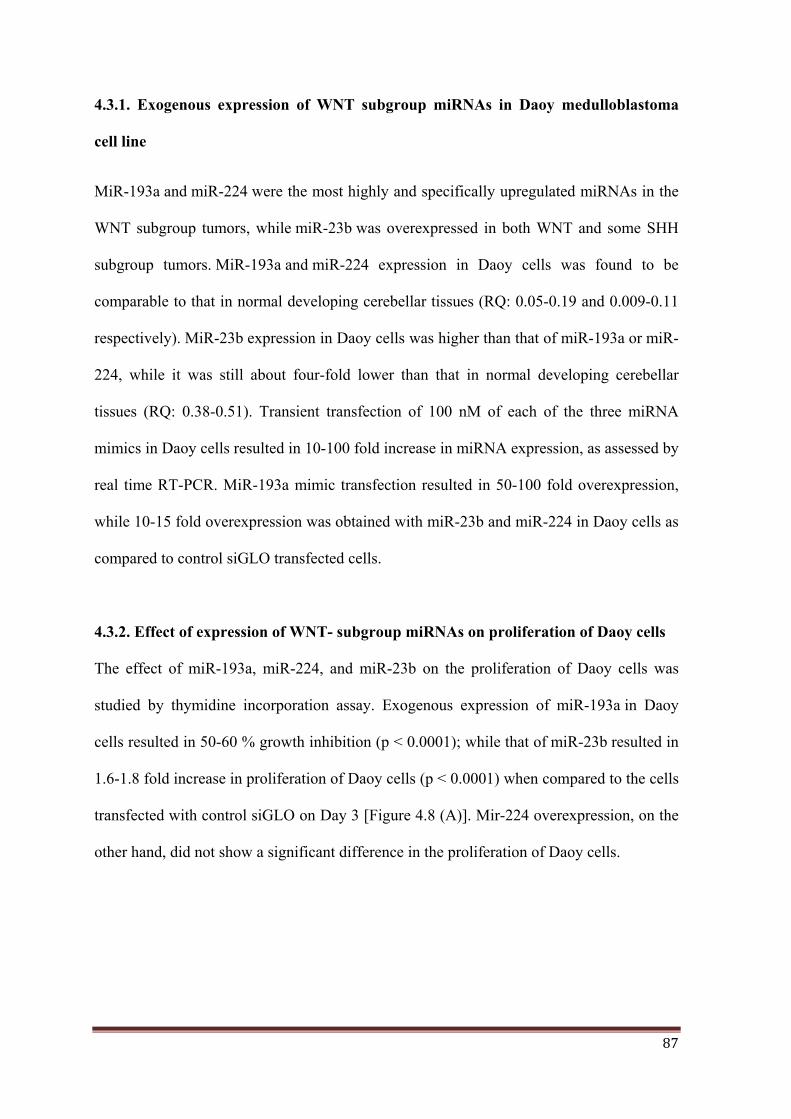
87
4.3.1. Exogenous expression of WNT subgroup miRNAs in Daoy medulloblastoma
cell line
MiR-193a and miR-224 were the most highly and specifically upregulated miRNAs in the
WNT subgroup tumors, while miR-23b was overexpressed in both WNT and some SHH
subgroup tumors. MiR-193a and miR-224 expression in Daoy cells was found to be
comparable to that in normal developing cerebellar tissues (RQ: 0.05-0.19 and 0.009-0.11
respectively). MiR-23b expression in Daoy cells was higher than that of miR-193a or miR-
224, while it was still about four-fold lower than that in normal developing cerebellar
tissues (RQ: 0.38-0.51). Transient transfection of 100 nM of each of the three miRNA
mimics in Daoy cells resulted in 10-100 fold increase in miRNA expression, as assessed by
real time RT-PCR. MiR-193a mimic transfection resulted in 50-100 fold overexpression,
while 10-15 fold overexpression was obtained with miR-23b and miR-224 in Daoy cells as
compared to control siGLO transfected cells.
4.3.2. Effect of expression of WNT- subgroup miRNAs on proliferation of Daoy cells
The effect of miR-193a, miR-224, and miR-23b on the proliferation of Daoy cells was
studied by thymidine incorporation assay. Exogenous expression of miR-193a in Daoy
cells resulted in 50-60 % growth inhibition (p < 0.0001); while that of miR-23b resulted in
1.6-1.8 fold increase in proliferation of Daoy cells (p < 0.0001) when compared to the cells
transfected with control siGLO on Day 3 [Figure 4.8 (A)]. Mir-224 overexpression, on the
other hand, did not show a significant difference in the proliferation of Daoy cells.

Chapter 4: Results
88
Figure 4.8: Functional analysis of WNT – specific miRNAs on the growth and malignant
potential of medulloblastoma cells. (A) Growth kinetics of miRNA mimic transfected Daoy
cells by thymidine incorporation assay. Histogram shows the counts per million of thymidine
incorporated in proliferating miRNA or control siGLO transfected Daoy cells over a period of 5
days obtained using a beta- scintillation counter. (B) Plating efficiency and radiation sensitivity
of miRNA transfected Daoy cells by clonogenic assay. Histogram indicates number of colonies
formed by control/ miRNA transfected Daoy cells with or without irradiation. Colonies were
visualized and counted by staining with 0.5 % crystal violet after about a week of incubation (C)
Anchorage- independent growth of miRNA transfected Daoy cells by soft agar colony
formation assay. Histogram indicates number of colonies formed in soft agar medium by control/
miRNA transfected Daoy cells. Colony count was done using an inverted microscope after about a
month of incubation. All data points are presented as Mean ± S.E. p value indicates significance
with control siGLO using Students t-test.

89
4.3.3. Effect of expression of WNT- subgroup miRNAs on plating efficiency and
radiation sensitivity of Daoy cells
Clonogenic assay was performed to study the effect of expression of miR-193a, miR-224,
and miR-23b on the plating efficiency and radiation sensitivity of Daoy cells. Transient
expression of miR-193a was found to reduce the plating efficiency of Daoy cells by almost
80 % (p < 0.0001). The plating efficiency of miR-224 transfected Daoy cells was found to
be reduced by 50 % (p < 0.0006), while that of miR-23b transfected Daoy cells did not
change significantly from control cells [Figure 4.8 (B)].
To evaluate the radiation sensitivity of these miRNA- transfected Daoy cells, effect
of irradiation at a dose of 6Gy on the clonogenic potential of Daoy cells was studied.
Irradiation at a dose of 6 Gy resulted in about 70 % reduction in the number of colonies
formed by control siGLO transfected Daoy cells. MiR-193a overexpressing Daoy cells on
irradiation at a dose of 6 Gy failed to form any colonies, while irradiation of miR-
224 overexpressing Daoy cells resulted in more than 90 % reduction in colony formation.
No significant change was observed in the radiation sensitivity of miR-23b overexpressing
Daoy cells [Figure 4.8 (B)].
4.3.4. Effect of expression of WNT- subgroup miRNAs on anchorage – independent
growth
The effect of expression of miR-193a, miR-224, and miR-23b on the anchorage
independent growth of Daoy cells was investigated by soft agar assay. Daoy cells
transiently expressing miR-193a showed a 90 % reduction (p < 0.0001) in the number of
soft agar colonies formed as compared to siGLO transfected cells. MiR-
224 overexpression in Daoy cells was found to bring about 60 % reduction (p < 0.0006) in
soft agar colony formation. There was no significant difference in the number of soft agar

Chapter 4: Results
90
colonies formed by miR-23b overexpressing cells as compared to siGLO transfected cells
[Figure 4.15 (C)].
4.4. Development of an assay based on real time RT-PCR for molecular classification
of medulloblastomas
Based on the differential expression of miRNAs in the four molecular subgroups an assay
was developed for molecular classification of medulloblastomas. Due to the lack of
sufficient number of significantly differentially expressed miRNAs in the non-WNT
subgroups, a combination of 12 protein-coding genes and 9 miRNAs were tested as
markers for molecular classification by PAM analysis. MiR-376a and miR-10b were
excluded as markers from the analysis as their expression levels were found to be less
consistent within a subgroup and considerably low as compared to other miRNAs. The set
of 42 fresh frozen medulloblastoma tissues comprised of 10 WNT, 8 SHH, 11 Group 3 and
13 Group 4 cases while the set of 59 FFPE medulloblastomas consisted of 11 WNT, 22
SHH, 10 Group 3 and 16 Group 4 medulloblastomas. Heat map depicting the differential
expression of the 21 markers across 101 medulloblastomas is shown in Figure 4.9.
PAM analysis using the 101 medulloblastomas as a training set showed a cross-
validation accuracy of 99 %. Figure 4.10 shows a centroid plot of all the marker genes and
miRNAs used in the PAM analysis. Using a training set of 42 fresh frozen
medulloblastomas, all FFPE tumors were accurately classified with the exception of two
SHH subgroup tumors [Figure 4.11 and 4 (A) and (D)]. Four out of five tumors, which
were classified primarily based on their miRNA profiles, due to poor RNA quality, were
accurately classified by PAM analysis using both protein-coding genes and miRNAs
[Figure 4.9]. One of these five tumors belonging to the WNT subgroup was found to
possess mutation in CTNNB1 gene further confirming its classification [Figure 4.5].

91
Figure 4.9: Heat map showing differential expression of 12 protein-coding genes and 9 miRNAs in the 101 tumor tissues. * indicates the tumor tissues
classified primarily based on miRNA expression profile. Subgroup assignment based on PAM analysis using 42 fresh frozen tumor tissues as a training set is
indicated above the heat map. The clinical profile of each medulloblastoma case is indicated below the heat map. Age: <3yr- blue, 3-8yr-brown, 9-17yr-green,
≥18yr-yellow; Gender: Male-blue, Female-pink; Histology: Classic-grey, Desmoplastic-yellow, Large cell/anaplastic-orange. The number of fresh and FFPE
tumor tissues within each subgroup is denoted below the clinical profile by the white and black bars respectively.

Chapter 4: Results
92
Figure 4.10: Centroid plot. Shrunken centroids for the 21 markers (12 genes + 9 miRNAs)
employed as the PAM classifier are depicted for each of the 4 molecular subgroups using the
training set of all 101 medulloblastomas.
The assay was validated on a set of well-annotated 34 FFPE medulloblastoma
tumor tissues from DKFZ, Germany. The tumor tissue RNAs from this cohort were
analyzed for expression of the 12 protein-coding genes and 9 miRNAs by the present real
time RT-PCR assay [Figure 4.12]. PAM analysis using the training set of 42 fresh frozen
tumor tissues accurately classified all DKFZ FFPE tissues with the exception of one Group
4 (pMB 47) tumor misclassified as Group 3 tumor [Figure 4.11 (B) and (E)]. The present
real-time RT-PCR assay was thus found to have an overall accuracy of 97 %. The two
SHH subgroup medulloblastomas that were misclassified using our fresh frozen tumor
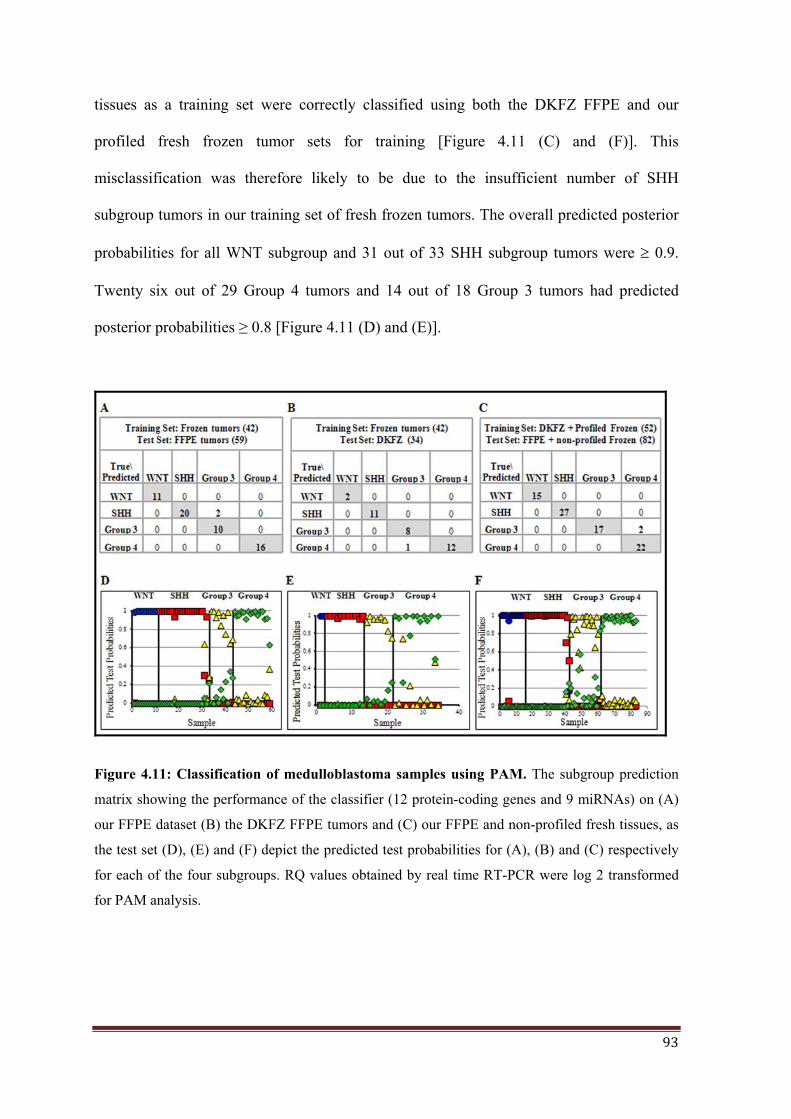
93
tissues as a training set were correctly classified using both the DKFZ FFPE and our
profiled fresh frozen tumor sets for training [Figure 4.11 (C) and (F)]. This
misclassification was therefore likely to be due to the insufficient number of SHH
subgroup tumors in our training set of fresh frozen tumors. The overall predicted posterior
probabilities for all WNT subgroup and 31 out of 33 SHH subgroup tumors were 0.9.
Twenty six out of 29 Group 4 tumors and 14 out of 18 Group 3 tumors had predicted
posterior probabilities ≥ 0.8 [Figure 4.11 (D) and (E)].
Figure 4.11: Classification of medulloblastoma samples using PAM. The subgroup prediction
matrix showing the performance of the classifier (12 protein-coding genes and 9 miRNAs) on (A)
our FFPE dataset (B) the DKFZ FFPE tumors and (C) our FFPE and non-profiled fresh tissues, as
the test set (D), (E) and (F) depict the predicted test probabilities for (A), (B) and (C) respectively
for each of the four subgroups. RQ values obtained by real time RT-PCR were log 2 transformed
for PAM analysis.
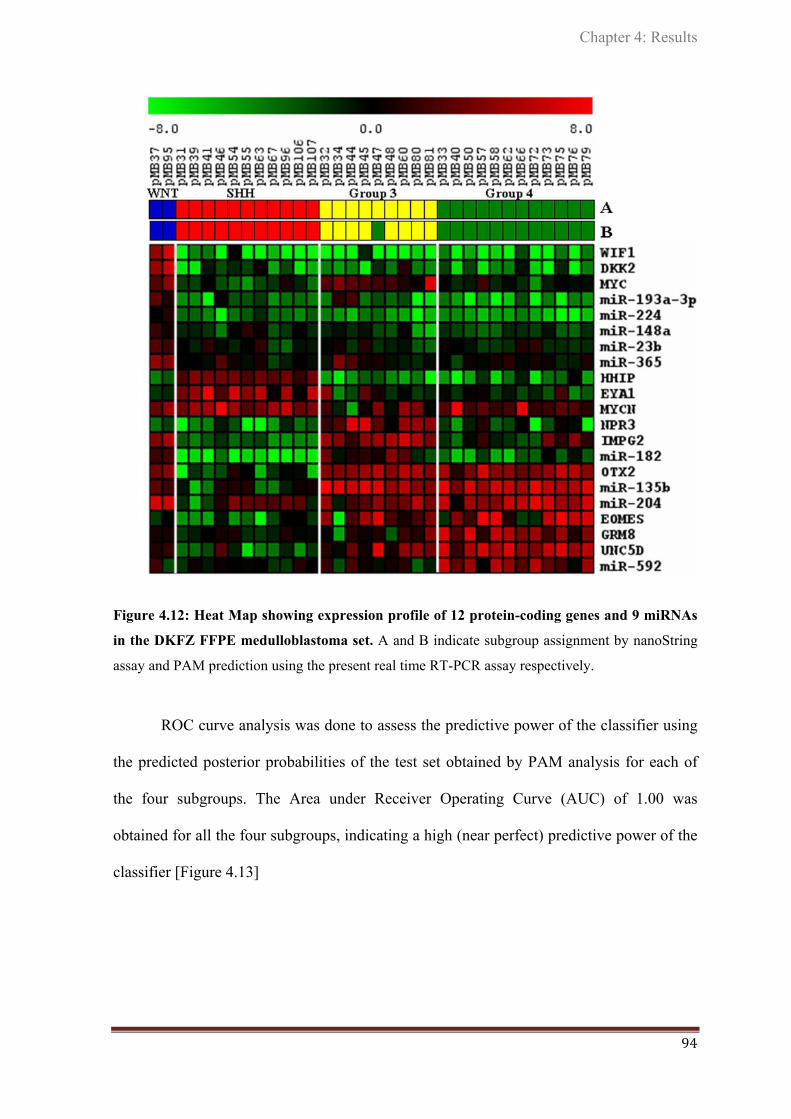
Chapter 4: Results
94
Figure 4.12: Heat Map showing expression profile of 12 protein-coding genes and 9 miRNAs
in the DKFZ FFPE medulloblastoma set. A and B indicate subgroup assignment by nanoString
assay and PAM prediction using the present real time RT-PCR assay respectively.
ROC curve analysis was done to assess the predictive power of the classifier using
the predicted posterior probabilities of the test set obtained by PAM analysis for each of
the four subgroups. The Area under Receiver Operating Curve (AUC) of 1.00 was
obtained for all the four subgroups, indicating a high (near perfect) predictive power of the
classifier [Figure 4.13]

95
Figure 4.13: ROC curve Analysis to determine the strength of the classifier: (A), (B), (C) and
(D) represent the ROC curves for the four subgroups (Test variables) with the Area Under the
Curve (AUC) specified in each plot. Predicted posterior probabilities of the 59 FFPE
medulloblastomas for each subgroup obtained using the 42 fresh tissues as the training set and the
21-marker classifier for PAM analysis, served as the input for the ROC curve analysis.

Chapter 4: Results
96
4.5. Correlation of the molecular subgrouping and miRNA expression with clinical
parameters
Further, the correlation between the clinico-pathologic variables and the molecular
subgrouping of the patients used in the study was investigated. Demographic comparison
revealed notable differences between the subgroups, as described below:
4.5.1. Correlation with age, gender and histology
Of the 103 medulloblastomas studied, 23 belonged to WNT subgroup, 30 to SHH
subgroup, 21 to Group 3 and 29 belonged to Group 4 [Figure 4.14 (A)].
a) Age: The median age at diagnosis for the entire cohort was 9 yr (< 1 yr – 45 yr), but
varied across the four subgroups. Median age at diagnosis was 12 yr ( 7 – 45 yr) for WNT
subgroup, 8 yr (< 1 – 36 yr ) for SHH subgroup, 4.5 yr (1 – 13 yr ) for Group 3 and 8 yr
(4– 16 yr ) for Group 4. Children of age < 3 yr belonged to SHH (67 %) or Group 3 (33
%) whereas; older children (> 8 yr) belonged primarily to Group 4 (40 %) or WNT
subgroup (40 %). Adult patients ( 18 yr) belonged to either SHH (65 %) or WNT (35 %)
subgroup [Figure 4.14 (B)].
b) Gender: The male-to-female ratio in the present cohort was 2.12:1. SHH subgroup
comprised of 63 % males and 37 % females. Notably, while there were almost equal
number of male and female patients in the WNT subgroup, 80 % (40/50) of patients in
Group 3 and Group 4 were only males. Specifically, males were predominant in Group 4
(37 %) as compared to WNT (16 %), SHH (27 %) and Group 3 (20 %), whereas females
were more common in the WNT subgroup (36 %) as compared to SHH (33 %), Group 3
(21 %) and Group 4 (9 %) [Figure 4.14 (C)].

97
c) Histology: Most of the tumors studied were of classical histology (79 %) followed by
tumors having large cell / anaplastic (10.6 %) and desmoplastic (10.6%) histology. Tumors
with classic histology were distributed among the four subgroups with the WNT subgroup
showing predominance. Desmoplastic tumors were restricted to the SHH subgroup. Large
cell / anaplastic variant which is a known indicator of poor prognosis, although present in
SHH, Group 3 and Group 4 tumors, was more predominant in Group 3 tumors (64 %)
[Figure 4.14 (D)].
Figure 4.14: Demographic profile of the four molecular subgroups. (A) Distribution of the 103
medulloblastomas based on subgroups (B) Age at diagnosis distribution for the four subgroups, (C)
Gender based distribution and (D) Distribution of histological variants. The numbers indicate the
number of tumors in each category.
Chapter 4: Results
98
4.5.2. Correlation with overall survival
The overall survival data was available for 72 medulloblastoma cases with a median
follow-up of 16.7 months. The patients who expired within the first month after surgery
were excluded from the analysis as the death in peri-surgery period could be due to surgery
related causes. Kaplan Meier analysis showed survival curves to be significantly different
(p = 0.0046) for the four subgroups [Figure 4.15 (A)] with the best survival for the WNT
subgroup patients (83 %) and the worst survival for Group 3 patients (27 %), while Group
4 and SHH subgroup patients had intermediate survival of close to 70 %.
Among the histological variants patients having large cell / anaplastic histology tumors had
significantly (p=0.0017) worse survival (25 %) as compared to those having classic (68 %)
or desmoplastic histology (88 %) [Figure 4.15 (B)].
Within the SHH subgroup, patients having tumors with MYCN over-expression levels
comparable to MYCN amplification levels were found to have significantly (p = 0.0185)
poorer survival (40 % vs. 70 %) [Figure 4.15 (C)].
In the combined cohort of Group 3 and Group 4 medulloblastomas cases, those with miR-
592 overexpression were found to have significantly (p = 0.0060) better survival (72 % vs.
25 %) while those with miR-182 overexpression were found to have significantly (p =
0.0422) worst survival (45 % vs. 70 %) [Figure 4.15 (E) and (F)].
The difference in the survival rates of non-WNT, non-SHH subgroup medulloblastoma
cases having miR-592 underexpression with those having overexpression ( 25 % vs.72 %)
was comparable to the difference in the survival rates of Group 3 vs. Group 4 patients (27
% vs.72 % ) [Figure 4.15 (D)]. The hazard ratios for the Group 3/4 combined cohort
indicated that tumors with underexpression of miR-592 have a significantly higher risk

99
(6.65) than those with overexpression of miR-182 (3.53), but marginally higher than the
risk of patients belonging to Group 3 (5.32).
Figure 4.15: Kaplan- Meier survival analysis: Overall survival of 72 patients in the present
cohort separated on the basis of (A) subgroup, (B) histological variants, (C) SHH subgroup tumors
with and without MYCN over-expression (D), Group 3 vs. Group 4 tumors (E), non-SHH, non-
WNT tumors with or without miR-592 over-expression and (F) with or without miR-182 over-
expression. p value indicates level of significant difference in the Kaplan Meier survival curves
estimated by Log Rank Test. The table below shows the results of univariate survival analysis
using the variables listed. The hazard ratios for the variables tested are indicated with the
corresponding confidence interval for that group.

DISCUSSION
Chapter 5

100
DISCUSSION
MicroRNAs (miRNAs) are a class of non-coding RNA molecules that act as post-
transcriptional regulators of gene expression [19]. Several studies have demonstrated the
utility of miRNA profiling in identification of signatures associated with diagnosis,
staging, progression, prognosis and response to treatment and all studies have arrived at a
common conclusion that miRNA expression profile represents tumor biology better than
the expression profile of protein-coding genes [21-22]. Therefore, in order to gain a better
understanding of the biology of medulloblastoma, the role played by miRNAs in this tumor
was investigated in the present study.
5.1. Differential miRNA expression in medulloblastoma
MicroRNA profiling of medulloblastomas revealed that miRNAs are differentially
expressed in medulloblastomas relative to normal cerebellar tissues. The four molecular
subgroups of medulloblastomas viz. WNT, SHH, Group 3, and Group 4 are distinct in their
miRNA expression profiles. MiRNA profiles alone could also segregate medulloblastomas
into the four subgroups, although this segregation was not as robust as the one obtained
using expression profile of protein-coding genes (as judged by bootstrap analysis) [15].
The fact that the expression profile of miRNAs and protein-coding genes could
segregate the tumors into almost identical subgroups indicates the miRNA expression to be
under the control of signaling pathways activated / deregulated in a specific subgroup and /
or the role of the miRNAs as a positive / negative feedback to the signaling pathways
contributing to the pathogenesis. Two possible mechanisms are indicated for their
subgroup specific miRNA expression:

101
i) Co-expression of intronic miRNAs with their host genes – In the present study,
miRNAs like miR-224, miR-23b, miR-204, and miR-135b located in the intron of GABRE,
C9ORF3, TRPM3, and LEMD1 genes respectively were co-expressed with the protein-
coding genes. Therefore miRNA expression appears to be under the control of promoter /
enhancers of the host protein-coding genes.
ii) Regulation of miRNA expression by transcription factors: A number of transcription
factors are specifically expressed in each subgroup like LEF1 (WNT), GLI2 (SHH),
EOMES (Group 3 / Group 4) etc. which may in turn regulate the miRNA expression in that
subgroup. For example, upregulation of miR-17-92 cluster miRNAs in WNT, SHH and
Group 3 is likely to be the result of E2F, MYC and /or MYCN over-expression [83, 110-
112]. MiR-182, another miRNA upregulated in the WNT tumors, has been shown as a
direct target of the complex in breast cancer [113].
Subgroup specific miRNA expression also suggests a role of the miRNAs in
pathogenesis. MiRNAs may target components of the subgroup associated signaling
pathway and thus may function to further activate the signaling pathway or miRNAs may
act in a negative feedback of the activated signaling pathway.
5.1.1. Role of WNT subgroup specific miRNAs
A striking feature of the miRNA profile was the distinctive miRNA signature exhibited by
the WNT tumors, with 16 miRNAs overexpressed by 3-70 fold almost exclusively in this
subgroup as compared to all other subgroups. Upregulation of miRNAs in the WNT
tumors is in contrast to the global downregulation of miRNA expression reported in most
cancers [22]. To understand the role of WNT subgroup specific miRNAs in
medulloblastoma pathogenesis, the effect of three WNT subgroup miRNAs, miR-193a-3p,

Chapter 5: Discussion
102
miR-224 and miR-23b, was investigated on the growth characteristics of human
medulloblastoma cell line, Daoy. Daoy cell line has been established from a desmoplastic
medulloblastoma most likely belonging to the SHH subgroup. Since WNT subgroup
medulloblastoma cell line is not available, the three miRNAs were expressed in Daoy cells
at levels comparable to those in the WNT subgroup tumors. Of the three miRNAs,
expression of mir-193a-3p, the most specific and highly upregulated miRNA in the WNT
tumors was found to significantly (p < 0.0001) inhibit proliferation, clonogenic potential
and anchorage-independent growth of medulloblastoma cells.
This tumor-suppressive role of miR-193a is in congruence with its reported role in
other cancers. Mir-193a-3p has been reported to be down-regulated in multiple solid
tumors in a study done on 2532 tumor tissues as compared to 806 normal tissues [114].
Epigenetic silencing of miR-193a-3p has been reported to contribute to leukemogenesis in
acute myeloid leukemia by activating the PTEN / PI3K pathway [115]. Both miR-193a-3p
and miR-224, another miRNA upregulated in the WNT tumors, were found to significantly
(p < 0.0006) increase radiation sensitivity of Daoy cells. MiR-224 has been reported to
promote apoptosis of hepatocarcinoma (HCC) cells by targeting API5 (Apoptosis Inhibitor
5) [116]. MiR-224 however, has also been reported to be upregulated in many cancers and
has been shown to promote proliferation [117-119], while role of miR-193a-3p as a tumor-
suppressor appears to be consistent across many cancer types. MiR-193a-3p has been
shown to target at least three oncogenes so far i.e. KRAS, PLAU and E2F6 [120-121]. In a
parallel study done in our lab, expression of miR-193a-3p was shown to radically (85-
95 %) reduce the tumorigenic potential of both Daoy (Pratibha M. Boga, Ph.D. Thesis) and
U87MG glioblastoma cells (Shailendra Upraity, Ph.D. Thesis). Therefore, miR-193a-3p
appears to have a therapeutic potential in non-WNT medulloblastomas.

103
The robust expression of the WNT subgroup specific miRNAs is similar to the
robust expression of WNT signaling negative regulators like WIF1, DKK family genes,
AXIN2, in the WNT tumors. MiR-449, overexpressed in the WNT tumors has been shown
to directly target WISP2, which is induced by WNT signaling [122]. While both Group 3
and WNT subgroup tumors overexpress MYC oncogene, Group 3 tumors have the worst
survival while WNT subgroup medulloblastomas have excellent overall survival among all
medulloblastomas. MiR-24, up-regulated in WNT subgroup tumors has been shown to
target MYC [123]. It is possible that miRNAs upregulated in WNT tumors target
downstream effectors of WNT signaling pathway, and thereby blunt the WNT signaling
effects on cell behavior. WNT subgroup specific miR-148a has been shown to inhibit
motility, tumor growth and metastasis [124]. Overexpression of mir-183 has been shown to
inhibit migration and invasion in lung and breast cancer cells and Ezrin has been identified
as a bona-fide target of miR-183 [125-126]. Therefore, expression of miRNAs like miR-
193a, miR-224, miR-148a, and miR-183 may contribute to the lower metastatic potential
and better response to radiation therapy and thereby better survival rate of the WNT
subgroup medulloblastomas. On the other hand, WNT subgroup up-regulated miRNAs
may also potentiate WNT signaling pathway. For example, miR-335-5p has been reported
to positively modulate the activity of WNT signaling via directly targeting DKK-1 [127].
MiR-135a, a miRNA over-expressed in the WNT tumors, has been shown to target APC
[128] which is expected to potentiate activation of WNT signaling pathway. APC gene is
underexpressed in the WNT subgroup medulloblastomas.
Therefore, miRNAs up-regulated in WNT subgroup medulloblastomas may help
WNT signaling pathway activation but may also target some downstream oncogenic
effectors making these tumors less invasive, less metastatic and more responsive to
radiation and chemotherapy and thus miRNAs could be major contributors towards

Chapter 5: Discussion
104
excellent survival of WNT medulloblastoma patients. Detailed functional studies and
target identification is required for deciphering precise role of WNT subgroup miRNAs in
the medulloblastomas belonging to the WNT subgroup.
5.1.2. MiRNA with potential oncogenic role in medulloblastomas
WNT, SHH and Group 3 subgroup show upregulation of several proliferation related genes
like ribosomal proteins (RPL10, RPL18) and cell cycle regulators (TP53, CDK4) [15].
MiRNAs common to these three subgroups have been reported to have oncogenic role in
other tumors, including medulloblastoma. A prime example of this is miR-17-92, a
polycistronic miRNA cluster that has been identified as an oncogene in several solid
tumors and B-cell malignancies with PTEN being one of its targets [87, 89-90, 129].
Upregulation of miR-17/92 cluster in SHH medulloblastomas has been reported to
contribute towards aggressive behavior and poor prognosis [83, 112].
SHH and Group 3 tumors have lower expression of miRNAs like mir-204, mir-153
whose predicted targets include components of TGF-beta signaling pathway. Ferretti et al.
reported underexpression of mir-153 in high- risk medulloblastomas, which are either
metastatic or belong to children less than 3 yrs of age [130]. Group 3 medulloblastomas
have been reported to have the highest metastatic potential among the four subgroups.
MiR-183/96/182 cluster miRNAs are overexpressed in most Group 3 tumors and some
Group 4 tumors. Recently, two complementary studies showed that metastatic
medulloblastomas significantly overexpressed miR-182 as compared to non-metastatic
medulloblastomas and individual components of miR-183/96/182 cluster were capable of
driving migration and metastasis in cell-based assays and xenograft model [131-132].
MiR-135b, over-expressed in Group 3 and Group 4 tumors, has been shown to be
upregulated in relapsed prostate cancer patients indicating oncogenic nature of this miRNA

105
[133]. Thus, potential oncogenic miRNAs, miR-135b and miR-182 are overexpressed
while potential tumor-suppressive miRNAs like miR-204 and miR-153 are underexpressed
in Group 3 tumors possibly contributing towards the higher metastatic potential and poor
prognosis of this subgroup.
5.1.3. MiRNAs with potential role in neural differentiation
A number of miRNAs (miR-124a, miR-137, miR-379/656 cluster, miR-127/432/433
cluster, etc.) were found to be downregulated as compared to normal cerebellar tissues in
all other subgroups except Group 4. Mir-124a, a brain specific miRNA, and mir-137 have
been shown to induce differentiation of glioma stem cells [134-135]. MiR-124a expression
was found to potently inhibit the growth of medulloblastoma xenograft tumors in rodents
by targeting CDK6 [136]. MiR-379/656 cluster located on chromosome 14 has been found
to be evolutionarily conserved in all placental mammals but not present in any other
vertebrate genome [137]. The miR-379/miR-656 cluster miRNAs are predominantly
expressed in the brain and therefore may play a role in neural differentiation. Reduced
expression of these miRNAs in WNT, SHH and Group 3 tumors appears to correlate with
the increased proliferation and lower expression of neuronal differentiation related genes in
these subgroups. On the other hand, over-expression of these miRNAs in Group 4 tumors
is consistent with the expression of various differentiation related genes in this subgroup
(GRM8, KCNA1, GABRA5, etc.) which also explains the considerable overlap of the Group
4 miRNA profile with that of normal cerebellar tissues.
To date there are only a handful of groups that have studied miRNA expression in
medulloblastomas. Some of these studies were done prior to the identification of
expression profile based molecular subgroups of medulloblastomas, and as a result
reported differential miRNA expression primarily in SHH subgroup medulloblastomas [83,

Chapter 5: Discussion
106
112, 130, 138]. Concurrent with our study on miRNA profiling of medulloblastomas, two
other groups studied miRNA expression in parallel with the expression profile of protein-
coding genes in medulloblastomas [16, 59]. The miRNA profiling in these two studies was
done using oligonucleotide based Ohio Cancer Centre microarray and Illumina Bead array.
Neither of the two studies reported distinctive miRNA profile of WNT subgroup
medulloblastomas, either due to less number of WNT subgroup tumors in their cohort and /
or low sensitivity / specificity of the arrays used and / or lack of validation. Nonetheless,
there is considerable concordance in the differential miRNA expression between our study
and these two studies. Similar to our study, Northcott et al. reported differential miRNA
expression in the four molecular subgroups (WNT, SHH, Group C and Group D) similar to
the four subgroups (Group A [WNT], Group B [SHH], Group C and Group D) identified
by our group. Cho et al. reported differential miRNA expression in six subgroups of
medulloblastomas wherein non-WNT, non-SHH subgroup tumors belonged to not two but
four subgroups. However, subsequently consensus has been reached among all the
investigators wherein four core molecular subgroups of medulloblastomas were identified
as WNT, SHH, Group 3 (ours and Northcott Group C) and Group 4 (ours and Northcott
Group D) [17].
5.2. Development of miRNA based assay for molecular classification of
medulloblastomas
The differential miRNA expression profile of the four molecular subgroups of
medulloblastomas was validated on a total of 101 tissues including 59 FFPE tumor tissues.
For routine histology based diagnosis and also for use in most clinical trials, tumor tissues
are mostly preserved as FFPE tissues. MiRNAs being small in size are protected from
degradation during the process of formalin- fixation unlike most of the RNA from protein-

107
coding genes [24]. Several studies have also shown an excellent correlation between
miRNA expression in fresh frozen and FFPE tissues, with most of them indicating
miRNAs as better analytes than mRNAs for molecular characterization of clinical samples
[25-26].
A real time RT-PCR assay using 12 protein-coding genes and 9 miRNAs as
markers was developed for molecular classification of fresh as well as FFPE
medulloblastomas. The integrity of miRNAs was found to be considerably higher (600
fold) than that of protein-coding gene RNAs. MiRNA expression levels were particularly
helpful while classifying tumor tissues with GAPDH Ct values closer to 30, wherein the
expression levels of protein-coding genes could not be completely relied upon. FFPE
blocks as old as 8 yr could be classified by the present assay. Further, the 21-marker real
time PCR assay could classify an independent cohort of 34 FFPE medulloblastomas
(DKFZ, Germany), with known subgroup affiliation, with an accuracy of 97 % and an
AUC of 1 for all the four subgroups demonstrating high specificity, sensitivity and
universal applicability.
Northcott et al. initially had used four antibodies against DKK2, SFRP1, NPR3,
and KCNA1 respectively for WNT, SHH, Group 3 and Group 4 respectively for
classification of medulloblastomas by immunohistochemistry [16]. However, the assay
was not found to be reproducible in our lab as well as other labs across the world, and the
single antibody approach for identification of medulloblastoma subgroups was considered
inappropriate [139]. Thereafter, Northcott et al. developed the nanoString assay using 22
subgroup specific protein-coding genes as markers for molecular classification of
medulloblastomas [70]. The nanoString assay showed an accuracy of 98 % for fresh-frozen
tumor tissues. However, out of 58 FFPE medulloblastomas, the nanoString assay could
classify only 32 tumors with an accuracy of 87.5 %. The remaining FFPE tissues were

Chapter 5: Discussion
108
considered not classifiable based on the threshold as defined by PAM analysis separately
for each subgroup due to variation in the prediction accuracy of the assay for each
subgroup. Our assay being based on real time PCR is highly sensitive and hence allows
analysis of the expression levels of protein-coding genes and miRNAs from FFPE tissues
having considerable RNA degradation too. Besides, the tissues with extensive RNA
degradation are easily identified as the Ct value of housekeeping gene GAPDH crosses
value of 30, wherein either expression of the genes is undetectable or has erroneously high
values. The assay is rapid, inexpensive as compared to nanoString assay and uses real-time
PCR technology that is now commonly available in molecular pathology labs across the
world.
5.3. Correlation of molecular subgroups and demographics in an Indian
medulloblastoma cohort
This is the first comprehensive analysis of medulloblastomas from the Indian subcontinent
comparing molecular subgroups with demographics. The age at diagnosis, histology and
gender related incidences and the relative survival rates of the four molecular subgroups in
the present Indian cohort were found to be similar to those reported for the
medulloblastomas from the American and European subcontinent, suggesting uniform
mechanisms of medulloblastoma pathogenesis [14]. WNT subgroup was found to be
prevalent in older children (61 %) and adults (26 %). SHH subgroup cases occurred across
all age groups with predominance in infants (27 %), and adults (37 %). Group 3 cases were
found predominantly in younger children (60 %) and infants (20 %) with none in adults.
Group 4 patients distributed almost equally in younger (52 %) and older (48 %) children
with no cases in infants and adults. Consistent with the reported findings of the meta-
analysis, higher incidence of females was observed in the WNT subgroup. It has been

109
reported that females with medulloblastomas have a better outcome than males [140].
Moreover, WNT subgroup tumors are known to have the best prognosis [14, 56]. The
improved survival in females has been observed in older children and adults [32], in whom
WNT tumors are more prevalent. It is therefore most likely that the improved outcome is
due to the prevalence of WNT subgroup in females. On the other hand, 80 % males from
the cohort belonged to Group 3 and Group 4 alone. Higher incidence of males in these high
risk groups possibly correlates with their significantly poor outcome.
The Indian cohort, however, showed some striking differences from the reported
medulloblastoma incidences. The male to female ratio of Group 4 was 9:1, substantially
higher than the reported ratio of 2:1. None of the 17 adult patients belonged to Group 4 in
the adult patient age group. In the present cohort, WNT and Group 3 tumors accounted for
22.3 % and 20.39 % of tumor tissues respectively, as against the reported incidences of 11
% and 27 % based on the meta-analysis of the medulloblastoma data from the American
and European subcontinent [14]. The higher incidence of the WNT subgroup and relatively
lower incidence of Group 3 tumors can be partly accounted by the higher representation of
older children and adults who together account for 51 % of the tumors in the present
cohort. Nonetheless, frequency of WNT subgroup tumors was much higher than reported
so far even for these age groups, with as many as 40 % older children and 35 % adults in
the present Indian cohort belonging to the WNT subgroup. Further genomic analysis is
required on these medulloblastomas, especially the WNT subgroup tumors for
identification of genetic basis, if any or any infectious / environmental factors, responsible
for the higher incidence in the Indian population.

Chapter 5: Discussion
110
5.4. Role of miRNAs in prognosis and risk stratification of medulloblastoma
As described earlier, risk stratification based solely on clinical parameters like age,
presence of metastasis is insufficient in accurate prognostication of medulloblastomas,
resulting in over-treatment with long term side effects and under-treatment in some
medulloblastomas. Histological and molecular markers have been identified with the
potential to refine the existing risk stratification based on clinical parameters. Large-cell /
anaplastic histology has been regarded as a predictor of high risk while desmoplastic
tumors in infants have been reported to have a better outcome than other histological
variants. Beta-catenin nucleopositivity has been identified as a marker of favorable
outcome, while MYC amplification has been reported as a strong predictor of poor outcome
[141-142]. However, the major revolution in the risk stratification was brought about by
the identification of the four molecular subgroups that have distinct clinical features
including overall survival. The WNT subgroup patients have been found to have excellent
survival, while Group 3 patients have the worst survival with SHH and Group 4 patients
having intermediate survival [17].
In the present cohort as well the WNT subgroup cases had the best overall survival
(83 %) while Group 3 case had the worst survival (27 %). Tumors with large cell /
anaplastic histology (largely comprising of Group 3 tumors) were found to have
significantly poor survival (25 %) in the present study too indicating importance of
histology for risk stratification. MYCN amplification has been shown to associate with
relatively inferior survival in the SHH subgroup medulloblastomas [14]. SHH subgroup
tumors with MYCN over-expression (MYCN levels comparable to the tumors having
MYCN amplification) were found to have significantly poor survival (40 %) in the present
cohort too, indicating their importance in further risk stratification within SHH subgroup.

111
Although due to insufficient number of tumors in Group 3, effect of MYC over-expression
/ amplification on survival could not be analyzed, the inclusion of oncogenes viz. MYCN,
MYC and OTX2 in the present assay, makes the assay useful for not only molecular
classification but also for further risk stratification.
Group 3 and Group 4 tumors have an overlapping gene expression profile, but
strikingly distinct survival rates. Group 3 / Group 4 medulloblastomas overexpressing
miR-182 or under-expressing miR-592 were found to have significantly poor overall
survival rates (45 % and 25 % respectively). MiR-182 expression has previously been
shown as a poor prognostic indicator in Group 3 medulloblastomas [131]. MiR-592 has
been shown to be associated with the transition of normal colon to carcinoma [143] and
has been reported to be down regulated in hepatocellular carcinoma [144]. Sarver et al.
reported miR-592 levels lower in deficient mismatch repair (dMMR) as compared to
proficient mismatch repair (pMMR) colorectal cancers [145]. However, no functional role
of miR-592 has yet been identified. The correlation of miR-592 expression with better
survival of medulloblastoma patients was demonstrated for the first time in the present
study. Notably, lower expression of miR-592 appeared to be a more significant predictor of
poor survival with the hazard ratio being almost double (6.7 vs. 3.5) than that of tumors
overexpressing miR-182 in Group 3/4 tumors. In addition, although the difference in the
survival of Group 3 vs. Group 4 patients was comparable to that of low vs. high miR-592
expression in non-WNT, non-SHH, the risk contributed by miR-592 underexpression in
the latter group was higher, albeit marginally, than that contributed by Group 3 tumors in
the former group. MiR-592 and miR-182 can therefore act as surrogate markers for Group3
/ Group 4 classification and as markers for risk stratification of non-WNT, non-SHH FFPE
medulloblastomas. However, analysis with additional survival data would be necessary for
further confirmation. Functional studies to determine the role of miR-592 in

Chapter 5: Discussion
112
medulloblastoma together with identification of its targets is also required to understand
the full potential of this miRNA.
In summary, miRNAs were found to be differentially expressed in the four
molecular subgroups of medulloblastomas with WNT subgroup medulloblastomas having
the most distinctive miRNA profile. Based on the differential miRNA expression an assay
for molecular classification of medulloblastomas was developed. The 21- marker real time
PCR assay has an accuracy of 97 %, is rapid, inexpensive and particularly useful for
classifying formalin-fixed, paraffin-embedded tumor tissues. The assay is also useful for
risk stratification within the four subgroups as it includes oncogenes like MYC, MYCN as
well as miRNAs like miR-182 associated with worse and miR-592 associated with better
survival. MiR-193a-3p, a WNT subgroup specific miRNA was found to reduce
proliferation, anchorage-independent growth and increase radiation sensitivity indicating
its therapeutic potential in the treatment of non-WNT medulloblastomas. Detailed
functional analysis is necessary to understand the significance of differential miRNA
expression in medulloblastoma pathogenesis and in exploring miRNAs for targeted
treatment of medulloblastomas.

SUMMARY AND CONCLUSIONS
Chapter 6

113
SUMMARY AND CONCLUSIONS
Genome-wide microRNA profiling was carried out on a small subset of medulloblastomas
and normal cerebellar tissues for which the expression profile of protein-coding genes had
been previously done in our lab. The expression of a select set of miRNAs significantly
differentially expressed in the four molecular subgroups was validated on a total of 101
medulloblastomas (42 fresh tissues and 59 FFPE tissues). This is the first study that
identified distinctive miRNA profile of WNT subgroup medulloblastomas and developed a
miRNA based assay (98 % accuracy) for molecular classification of medulloblastomas.
This is also the first study of molecular classification and its correlation with clinical
characteristics on an Indian cohort of medulloblastomas. Further, functional role of three
WNT subgroup specific miRNAs in medulloblastoma cell behavior was also investigated.
The salient findings of the present study are given below.
MiRNA profiling of medulloblastomas revealed that miRNAs are differentially
expressed in the four molecular subgroups of medulloblastomas (WNT, SHH,
Group 3, and Group 4). Interestingly, this study showed that miRNAs alone could
also segregate medulloblastomas into four subgroups similar to those identified by
expression profiling of protein-coding genes.
The highlight of the miRNA profile was the distinctive miRNA signature of the WNT
subgroup tumors, with 16 miRNAs almost exclusively overexpressed (3 – 70 fold) in
this subgroup as compared to the other subgroups.
Real time RT-PCR for molecular subgrouping using subgroup specific genes (WIF1,
DKK2, MYC, EYA1, HHIP, MYCN, OTX2, EOMES, IMPG2, NPR3, UNC5D, GRM8)

114
identified 20 WNT, 28 SHH, 20 Group 3 and 28 Group 4 tumors of the total 101
medulloblastomas studied. Validation of the differential expression of 11 miRNAs
(miR-193a-3p, miR-224, miR-148a, miR-365, miR-23b, miR-10b, miR-182, miR-204,
miR-135b, miR-592 and miR-376a, confirmed their significant (p < 0.0001) differential
expression across the four subgroups in the 101 tumors studied. The distinctive miRNA
profile of WNT subgroup was also confirmed in all the WNT subgroup tumors (n = 21).
Analysis of CTNNB1 mutation in 7 out of 8 FFPE tissues that could be analyzed, further
confirmed their WNT subgroup identification. This is the first report of identification
and validation of the robust miRNA profile of WNT subgroup medulloblastomas
and validation by real time PCR of the differential miRNA expression across the
four subgroups on a large cohort of medulloblastomas.
Exogenous expression of three WNT subgroup miRNAs: miR-193a-3p, miR-224 and
miR-23b in the human medulloblastoma cell line Daoy, demonstrated that, miR-193a
could significantly (p < 0.0001) inhibit proliferation and anchorage independent growth
and increase radiation sensitivity of Daoy cells. MiR-23b significantly (p < 0.0001)
increased proliferation of Daoy cells, but had no effect on radiation sensitivity and
anchorage independent growth; while miR-224 significantly (p < 0.0006) reduced
anchorage-independent growth and increased radiation sensitivity of Daoy cells. The
tumor-suppressive miRNA, miR-193a, may serve as a novel therapeutic strategy in
non- WNT medulloblastomas.
A real time RT-PCR assay based on the expression of 12 protein-coding genes and 9
miRNAs as markers was developed for molecular classification of medulloblastomas.
The assay had an accuracy of 97 % with area under curve for each of the four subgroups

Chapter 6: Summary and Conclusions
115
being 1 indicating near perfect specificity and high sensitivity. Validation on an
independent set of FFPE medulloblastomas from DKFZ, Germany, further confirmed
the accuracy and the universal applicability of this assay. The assay being miRNA
based was particularly useful in the classification of FFPE medulloblastoma since
miRNAs escape degradation during formalin fixation due to their small size.
Besides, as the real time PCR systems are available in relatively inexpensive bench-top
formats (unlike nanoString nCounter System), the assay enables virtually any
laboratory worldwide to perform the subgrouping in a rapid and inexpensive
manner.
Distribution of age, gender and histology among the four subgroups was similar to that
reported in the meta–analysis of seven published studies on medulloblastomas from the
American and European subcontinent, suggesting uniform mechanisms of
medulloblastoma pathogenesis. Few exceptions to this were the high frequency of WNT
subgroup tumors (22 % vs. 11 %), strikingly high male: female ratio in Group 4 (9:1 vs.
2:1) and absence of adult patients in the Group 4 tumors. Further genomic studies are
required on these medulloblastomas, especially the WNT subgroup tumors for
identification of genetic basis if any or any infectious /environmental factors,
responsible for the higher incidence in the Indian population. This is the first
comprehensive study on medulloblastomas from the Indian subcontinent
comparing molecular subgroups with demographics.
The subgroup, histology, MYCN expression and miRNA expression (miR-182 and miR-
592) were correlated with overall survival. As reported in other studies, WNT subgroup
cases had the best survival (83 %), while Group 3 cases had the worst survival (27 %).

116
Patients with high MYCN expression (comparable to MYCN amplification) in SHH
subgroup (40 %) and those with large cell / anaplastic histology (25 %) had a poor
survival, indicating their importance in risk stratification. Group 3/4 cases with
overexpression of miR-182 (45 %) and underexpression of miR-592 (25 %) showed
poor survival. MiR-182 and miR-592 can therefore serve as markers for risk
stratification in addition to the molecular classification.
In conclusion, our study not only indicates a role of miRNAs in medulloblastoma
pathogenesis but also demonstrates the utility of miRNAs as biomarkers for molecular
classification of medulloblastomas, risk stratification and as therapeutic agents in
medulloblastomas.
Future Implications and therapeutic potential of miRNAs
Research in medulloblastoma is on the brink of a huge step towards improved risk-
stratification and thereby tailored treatment. Several studies on medulloblastoma have
shown that, stratification of patients based on molecular classification, is far more
predictive of treatment outcome as compared to that based on clinical variables. Molecular
subgroup assignment is now being considered as a vital part of prospective clinical trials
for medulloblastoma. The present study highlights the role of miRNAs in the pathogenesis,
molecular classification and risk stratification of medulloblastoma. The 21-marker real
time RT-PCR based assay (97 % accuracy) proposed in the present study can reliably
classify FFPE medulloblastoma and has the potential to be used as a simple, rapid and
cost-effective method in both clinical trials and in day-to- day clinical care of
medulloblastoma patients across the globe. Although the assay provides robust markers for
identification of subgroups, additional markers are required to identify subtypes within

Chapter 6: Summary and Conclusions
117
each subgroup, as has been reflected by the existence of a small fraction of ‘intermediate’
tumors in Group 3 and Group 4 subgroups [59], and the need for further improvement in
risk stratification.
From molecularly targeted therapy point of view, the ability of miRNAs to target
multiple oncogenes at once and across different signaling pathways provides a strong
rationale for developing miRNA-based therapeutics i.e. miRNA mimics and miRNA
antagonists. Also, reports about role of miRNA in stem cell renewal and differential
miRNA expression in cancer stem cells strongly indicate the use of miRNAs to target
cancer stem cells [146]. At a time when de-escalation of treatment for WNT subgroup
patients and use of SHH pathway inhibitors for SHH subgroup patients are being
considered in clinical trials, miRNA mimics of tumor-suppressive miRNAs like miR-193a,
can also be considered as a potential therapeutic strategy for non-WNT medulloblastomas.
Although application of miRNAs to clinical therapeutics comes with its challenges, the
fact that few miRNAs have entered into clinical trials is encouraging. MiR-122 antagonist
targeting hepatitis C virus has reached human Phase IIa clinical trial. In context to cancer,
Mirna Therapeutics has initiated Phase I clinical trial of MRX34 (miR-34 mimic), a
potential tumor suppressor in several solid cancers [99]. As is the case for most RNAi-
based therapy, a major caveat in miRNA-based therapeutics has been their effective
delivery in particular to the brain, having to cross the blood brain barrier. Receptor-specific
pegylated immuno-liposomes (PILs) and lipid encapsulation of nucleic acids may be
utilized for delivery of miRNAs to the brain, as these strategies have already been tested
with siRNAs [147]. If proven useful in clinical trials, miRNAs have the added advantage
of being long lived in vivo and very stable in vitro, which is critical in a clinical setting.

REFERENCES

118
REFERENCES
1. Siegel, R., D. Naishadham, and A. Jemal, Cancer statistics, 2012. CA Cancer J Clin, 2012; 62:10-29.
2. Rossi, A., et al., Medulloblastoma: from molecular pathology to therapy. Clin Cancer Res, 2008; 14:971-6.
3. Raffel, C., Medulloblastoma: molecular genetics and animal models. Neoplasia, 2004; 6:310-22.
4. Louis, D.N., et al., The 2007 WHO classification of tumours of the central nervous system. Acta Neuropathol, 2007; 114:97-109.
5. Sarkar, C., P. Deb, and M.C. Sharma, Medulloblastomas: new directions in risk stratification. Neurol India, 2006; 54:16-23.
6. Gajjar, A., et al., Risk-adapted craniospinal radiotherapy followed by high-dose chemotherapy and stem-cell rescue in children with newly diagnosed medulloblastoma (St Jude Medulloblastoma-96): long-term results from a prospective, multicentre trial. Lancet Oncol, 2006; 7:813-20.
7. Packer, R.J., et al., Phase III study of craniospinal radiation therapy followed by adjuvant chemotherapy for newly diagnosed average-risk medulloblastoma. J Clin Oncol, 2006; 24:4202-8.
8. Polkinghorn, W.R. and N.J. Tarbell, Medulloblastoma: tumorigenesis, current clinical paradigm, and efforts to improve risk stratification. Nat Clin Pract Oncol, 2007; 4:295-304.
9. Packer, R.J. and G. Vezina, Management of and prognosis with medulloblastoma: therapy at a crossroads. Arch Neurol, 2008; 65:1419-24.
10. Rutkowski, S., et al., Survival and prognostic factors of early childhood medulloblastoma: an international meta-analysis. J Clin Oncol, 2010; 28:4961-8.
11. de Bont, J.M., et al., Biological background of pediatric medulloblastoma and ependymoma: a review from a translational research perspective. Neuro Oncol, 2008; 10:1040-60.
12. Hamilton, S.R., et al., The molecular basis of Turcot's syndrome. N Engl J Med, 1995; 332:839-47.
13. Cowan, R., et al., The gene for the naevoid basal cell carcinoma syndrome acts as a tumour-suppressor gene in medulloblastoma. Br J Cancer, 1997; 76:141-5.
14. Kool, M., et al., Molecular subgroups of medulloblastoma: an international meta-analysis of transcriptome, genetic aberrations, and clinical data of WNT, SHH, Group 3, and Group 4 medulloblastomas. Acta Neuropathol, 2012; 123:473-84.
15. Gokhale, A., et al., Distinctive microRNA signature of medulloblastomas associated with the WNT signaling pathway. J Cancer Res Ther, 2010; 6:521-9.
16. Northcott, P.A., et al., Medulloblastoma comprises four distinct molecular variants. J Clin Oncol, 2011; 29:1408-14.
17. Taylor, M.D., et al., Molecular subgroups of medulloblastoma: the current consensus. Acta Neuropathol, 2012; 123:465-72.
18. Jones, D.T., et al., Dissecting the genomic complexity underlying medulloblastoma. Nature, 2012; 488:100-5.
19. Bartel, D.P., MicroRNAs: genomics, biogenesis, mechanism, and function. Cell, 2004; 116:281-97.
20. Di Leva, G., M. Garofalo, and C.M. Croce, MicroRNAs in Cancer. Annu Rev Pathol, 2013;

119
21. Calin, G.A. and C.M. Croce, MicroRNA signatures in human cancers. Nat Rev Cancer, 2006; 6:857-66.
22. Lu, J., et al., MicroRNA expression profiles classify human cancers. Nature, 2005; 435:834-8.
23. Sempere, L.F., et al., Expression profiling of mammalian microRNAs uncovers a subset of brain-expressed microRNAs with possible roles in murine and human neuronal differentiation. Genome Biol, 2004; 5:R13.
24. Hall, J.S., et al., Enhanced stability of microRNA expression facilitates classification of FFPE tumour samples exhibiting near total mRNA degradation. Br J Cancer, 2012; 107:684-94.
25. Xi, Y., et al., Systematic analysis of microRNA expression of RNA extracted from fresh frozen and formalin-fixed paraffin-embedded samples. RNA, 2007; 13:1668-74.
26. Liu, A., et al., MicroRNA expression profiling outperforms mRNA expression profiling in formalin-fixed paraffin-embedded tissues. Int J Clin Exp Pathol, 2009; 2:519-27.
27. Bailey, P.C., H., Medulloblastoma Cerebelli: A common type of midcerebellar glioma of childhood. Arch NeurPsych, 1925; 14:192-224.
28. Rutka, J.T. and H.J. Hoffman, Medulloblastoma: a historical perspective and overview. J Neurooncol, 1996; 29:1-7.
29. Gilbertson, R.J. and D.W. Ellison, The origins of medulloblastoma subtypes. Annu Rev Pathol, 2008; 3:341-65.
30. Crawford, J.R., T.J. MacDonald, and R.J. Packer, Medulloblastoma in childhood: new biological advances. Lancet Neurol, 2007; 6:1073-85.
31. Smoll, N.R. and K.J. Drummond, The incidence of medulloblastomas and primitive neurectodermal tumours in adults and children. J Clin Neurosci, 2012; 19:1541-4.
32. Curran, E.K., et al., Gender affects survival for medulloblastoma only in older children and adults: a study from the Surveillance Epidemiology and End Results Registry. Pediatr Blood Cancer, 2009; 52:60-4.
33. Rorke, L.B., The cerebellar medulloblastoma and its relationship to primitive neuroectodermal tumors. J Neuropathol Exp Neurol, 1983; 42:1-15.
34. Pomeroy, S.L., et al., Prediction of central nervous system embryonal tumour outcome based on gene expression. Nature, 2002; 415:436-42.
35. Paterson, E. and R.F. Farr, Cerebellar medulloblastoma: treatment by irradiation of the whole central nervous system. Acta Radiol, 1953; 39:323-36.
36. Merchant, T.E., et al., Multi-institution prospective trial of reduced-dose craniospinal irradiation (23.4 Gy) followed by conformal posterior fossa (36 Gy) and primary site irradiation (55.8 Gy) and dose-intensive chemotherapy for average-risk medulloblastoma. Int J Radiat Oncol Biol Phys, 2008; 70:782-7.
37. Paulino, A.C., Current multimodality management of medulloblastoma. Curr Probl Cancer, 2002; 26:317-56.
38. Rutkowski, S., et al., Treatment of early childhood medulloblastoma by postoperative chemotherapy and deferred radiotherapy. Neuro Oncol, 2009; 11:201-10.
39. Robertson, P.L., et al., Incidence and severity of postoperative cerebellar mutism syndrome in children with medulloblastoma: a prospective study by the Children's Oncology Group. J Neurosurg, 2006; 105:444-51.
40. Palmer, S.L., W.E. Reddick, and A. Gajjar, Understanding the cognitive impact on children who are treated for medulloblastoma. J Pediatr Psychol, 2007; 32:1040-9.

References
120
41. Pfister, S., et al., Outcome prediction in pediatric medulloblastoma based on DNA copy-number aberrations of chromosomes 6q and 17q and the MYC and MYCN loci. J Clin Oncol, 2009; 27:1627-36.
42. Marino, S., Medulloblastoma: developmental mechanisms out of control. Trends Mol Med, 2005; 11:17-22.
43. Nusslein-Volhard, C. and E. Wieschaus, Mutations affecting segment number and polarity in Drosophila. Nature, 1980; 287:795-801.
44. Varjosalo, M. and J. Taipale, Hedgehog: functions and mechanisms. Genes Dev, 2008; 22:2454-72.
45. Wechsler-Reya, R.J. and M.P. Scott, Control of neuronal precursor proliferation in the cerebellum by Sonic Hedgehog. Neuron, 1999; 22:103-14.
46. Archer, T.C., S.D. Weeraratne, and S.L. Pomeroy, Hedgehog-GLI pathway in medulloblastoma. J Clin Oncol, 2012; 30:2154-6.
47. Pasca di Magliano, M. and M. Hebrok, Hedgehog signalling in cancer formation and maintenance. Nat Rev Cancer, 2003; 3:903-11.
48. Goodrich, L.V., et al., Altered neural cell fates and medulloblastoma in mouse patched mutants. Science, 1997; 277:1109-13.
49. Hatton, B.A., et al., The Smo/Smo model: hedgehog-induced medulloblastoma with 90% incidence and leptomeningeal spread. Cancer Res, 2008; 68:1768-76.
50. Low, J.A. and F.J. de Sauvage, Clinical experience with Hedgehog pathway inhibitors. J Clin Oncol, 2010; 28:5321-6.
51. Nusse, R. and H. Varmus, Three decades of Wnts: a personal perspective on how a scientific field developed. EMBO J, 2012; 31:2670-84.
52. Li, F., Z.Z. Chong, and K. Maiese, Vital elements of the Wnt-Frizzled signaling pathway in the nervous system. Curr Neurovasc Res, 2005; 2:331-40.
53. Clevers, H., Wnt/beta-catenin signaling in development and disease. Cell, 2006; 127:469-80.
54. Klaus, A. and W. Birchmeier, Wnt signalling and its impact on development and cancer. Nat Rev Cancer, 2008; 8:387-98.
55. Moon, R.T., et al., WNT and beta-catenin signalling: diseases and therapies. Nat Rev Genet, 2004; 5:691-701.
56. Ellison, D.W., et al., beta-Catenin status predicts a favorable outcome in childhood medulloblastoma: the United Kingdom Children's Cancer Study Group Brain Tumour Committee. J Clin Oncol, 2005; 23:7951-7.
57. Thompson, M.C., et al., Genomics identifies medulloblastoma subgroups that are enriched for specific genetic alterations. J Clin Oncol, 2006; 24:1924-31.
58. Kool, M., et al., Integrated genomics identifies five medulloblastoma subtypes with distinct genetic profiles, pathway signatures and clinicopathological features. PLoS One, 2008; 3:e3088.
59. Cho, Y.J., et al., Integrative genomic analysis of medulloblastoma identifies a molecular subgroup that drives poor clinical outcome. J Clin Oncol, 2011; 29:1424-30.
60. Kool, M., A. Korshunov, and S.M. Pfister, Update on molecular and genetic alterations in adult medulloblastoma. Memo, 2012; 5:228-232.
61. Behesti, H. and S. Marino, Cerebellar granule cells: insights into proliferation, differentiation, and role in medulloblastoma pathogenesis. Int J Biochem Cell Biol, 2009; 41:435-45.
62. Gibson, P., et al., Subtypes of medulloblastoma have distinct developmental origins. Nature, 2010; 468:1095-9.

121
63. Roussel, M.F. and M.E. Hatten, Cerebellum development and medulloblastoma. Curr Top Dev Biol, 2011; 94:235-82.
64. Kawauchi, D., et al., A mouse model of the most aggressive subgroup of human medulloblastoma. Cancer Cell, 2012; 21:168-80.
65. Pei, Y., et al., An animal model of MYC-driven medulloblastoma. Cancer Cell, 2012; 21:155-67.
66. Pugh, T.J., et al., Medulloblastoma exome sequencing uncovers subtype-specific somatic mutations. Nature, 2012; 488:106-10.
67. Northcott, P.A., et al., Subgroup-specific structural variation across 1,000 medulloblastoma genomes. Nature, 2012; 488:49-56.
68. Ellison, D.W., et al., Medulloblastoma: clinicopathological correlates of SHH, WNT, and non-SHH/WNT molecular subgroups. Acta Neuropathol, 2011; 121:381-96.
69. Schwalbe, E.C., et al., Rapid diagnosis of medulloblastoma molecular subgroups. Clin Cancer Res, 2011; 17:1883-94.
70. Northcott, P.A., et al., Rapid, reliable, and reproducible molecular sub-grouping of clinical medulloblastoma samples. Acta Neuropathol, 2012; 123:615-26.
71. Lee, R.C., R.L. Feinbaum, and V. Ambros, The C. elegans heterochronic gene lin-4 encodes small RNAs with antisense complementarity to lin-14. Cell, 1993; 75:843-54.
72. Wightman, B., I. Ha, and G. Ruvkun, Posttranscriptional regulation of the heterochronic gene lin-14 by lin-4 mediates temporal pattern formation in C. elegans. Cell, 1993; 75:855-62.
73. Reinhart, B.J., et al., The 21-nucleotide let-7 RNA regulates developmental timing in Caenorhabditis elegans. Nature, 2000; 403:901-6.
74. Pasquinelli, A.E., et al., Conservation of the sequence and temporal expression of let-7 heterochronic regulatory RNA. Nature, 2000; 408:86-9.
75. Johnson, S.M., et al., RAS is regulated by the let-7 microRNA family. Cell, 2005; 120:635-47.
76. Esquela-Kerscher, A. and F.J. Slack, Oncomirs - microRNAs with a role in cancer. Nat Rev Cancer, 2006; 6:259-69.
77. Kim, V.N., MicroRNA biogenesis: coordinated cropping and dicing. Nat Rev Mol Cell Biol, 2005; 6:376-85.
78. Calin, G.A., et al., Frequent deletions and down-regulation of micro- RNA genes miR15 and miR16 at 13q14 in chronic lymphocytic leukemia. Proc Natl Acad Sci U S A, 2002; 99:15524-9.
79. Calin, G.A., et al., Human microRNA genes are frequently located at fragile sites and genomic regions involved in cancers. Proc Natl Acad Sci U S A, 2004; 101:2999-3004.
80. Cimmino, A., et al., miR-15 and miR-16 induce apoptosis by targeting BCL2. Proc Natl Acad Sci U S A, 2005; 102:13944-9.
81. Garzon, R., G.A. Calin, and C.M. Croce, MicroRNAs in Cancer. Annu Rev Med, 2009; 60:167-79.
82. Concepcion, C.P., C. Bonetti, and A. Ventura, The microRNA-17-92 family of microRNA clusters in development and disease. Cancer J, 2012; 18:262-7.
83. Northcott, P.A., et al., The miR-17/92 polycistron is up-regulated in sonic hedgehog-driven medulloblastomas and induced by N-myc in sonic hedgehog-treated cerebellar neural precursors. Cancer Res, 2009; 69:3249-55.

References
122
84. Costinean, S., et al., Pre-B cell proliferation and lymphoblastic leukemia/high-grade lymphoma in E(mu)-miR155 transgenic mice. Proc Natl Acad Sci U S A, 2006; 103:7024-9.
85. Hatley, M.E., et al., Modulation of K-Ras-dependent lung tumorigenesis by MicroRNA-21. Cancer Cell, 2010; 18:282-93.
86. Medina, P.P., M. Nolde, and F.J. Slack, OncomiR addiction in an in vivo model of microRNA-21-induced pre-B-cell lymphoma. Nature, 2010; 467:86-90.
87. He, L., et al., A microRNA polycistron as a potential human oncogene. Nature, 2005; 435:828-33.
88. Xiao, C., et al., Lymphoproliferative disease and autoimmunity in mice with increased miR-17-92 expression in lymphocytes. Nat Immunol, 2008; 9:405-14.
89. Mu, P., et al., Genetic dissection of the miR-17~92 cluster of microRNAs in Myc-induced B-cell lymphomas. Genes Dev, 2009; 23:2806-11.
90. Olive, V., et al., miR-19 is a key oncogenic component of mir-17-92. Genes Dev, 2009; 23:2839-49.
91. Bockmeyer, C.L., et al., MicroRNA profiles of healthy basal and luminal mammary epithelial cells are distinct and reflected in different breast cancer subtypes. Breast Cancer Res Treat, 2011; 130:735-45.
92. Schetter, A.J., et al., MicroRNA expression profiles associated with prognosis and therapeutic outcome in colon adenocarcinoma. JAMA, 2008; 299:425-36.
93. Rossi, S., et al., microRNA fingerprinting of CLL patients with chromosome 17p deletion identify a miR-21 score that stratifies early survival. Blood, 2010; 116:945-52.
94. Ali, S., et al., Gemcitabine sensitivity can be induced in pancreatic cancer cells through modulation of miR-200 and miR-21 expression by curcumin or its analogue CDF. Cancer Res, 2010; 70:3606-17.
95. Yanaihara, N., et al., Unique microRNA molecular profiles in lung cancer diagnosis and prognosis. Cancer Cell, 2006; 9:189-98.
96. Yang, H., et al., MicroRNA expression profiling in human ovarian cancer: miR-214 induces cell survival and cisplatin resistance by targeting PTEN. Cancer Res, 2008; 68:425-33.
97. Ji, J., et al., MicroRNA expression, survival, and response to interferon in liver cancer. N Engl J Med, 2009; 361:1437-47.
98. Batora, N., et al., Transitioning from genotypes to epigenotypes: Why the time has come for medulloblastoma epigenomics. Neuroscience, 2013;
99. Nana-Sinkam, S.P. and C.M. Croce, Clinical applications for microRNAs in cancer. Clin Pharmacol Ther, 2013; 93:98-104.
100. Iorio, M.V. and C.M. Croce, MicroRNA dysregulation in cancer: diagnostics, monitoring and therapeutics. A comprehensive review. EMBO Mol Med, 2012; 4:143-59.
101. Chomczynski, P. and N. Sacchi, Single-step method of RNA isolation by acid guanidinium thiocyanate-phenol-chloroform extraction. Anal Biochem, 1987; 162:156-9.
102. Korbler, T., et al., A simple method for RNA isolation from formalin-fixed and paraffin-embedded lymphatic tissues. Exp Mol Pathol, 2003; 74:336-40.
103. Chen, C., et al., Real-time quantification of microRNAs by stem-loop RT-PCR. Nucleic Acids Res, 2005; 33:e179.
104. Saeed, A.I., et al., TM4: a free, open-source system for microarray data management and analysis. Biotechniques, 2003; 34:374-8.
123
105. Eisen, M.B., et al., Cluster analysis and display of genome-wide expression patterns. Proc Natl Acad Sci U S A, 1998; 95:14863-8.
106. Kerr, M.K. and G.A. Churchill, Bootstrapping cluster analysis: assessing the reliability of conclusions from microarray experiments. Proc Natl Acad Sci U S A, 2001; 98:8961-5.
107. Tusher, V.G., R. Tibshirani, and G. Chu, Significance analysis of microarrays applied to the ionizing radiation response. Proc Natl Acad Sci U S A, 2001; 98:5116-21.
108. Tibshirani, R., et al., Diagnosis of multiple cancer types by shrunken centroids of gene expression. Proc Natl Acad Sci U S A, 2002; 99:6567-72.
109. Fawcett, T., An introduction to ROC analysis Pattern Recognition Letters, 2006; 27:861-874.
110. Woods, K., J.M. Thomson, and S.M. Hammond, Direct regulation of an oncogenic micro-RNA cluster by E2F transcription factors. J Biol Chem, 2007; 282:2130-4.
111. O'Donnell, K.A., et al., c-Myc-regulated microRNAs modulate E2F1 expression. Nature, 2005; 435:839-43.
112. Uziel, T., et al., The miR-17~92 cluster collaborates with the Sonic Hedgehog pathway in medulloblastoma. Proc Natl Acad Sci U S A, 2009; 106:2812-7.
113. Chiang, C.H., M.F. Hou, and W.C. Hung, Up-regulation of miR-182 by beta-catenin in breast cancer increases tumorigenicity and invasiveness by targeting the matrix metalloproteinase inhibitor RECK. Biochim Biophys Acta, 2013; 1830:3067-76.
114. Volinia, S., et al., Reprogramming of miRNA networks in cancer and leukemia. Genome Res, 2010; 20:589-99.
115. Li, Y., et al., Epigenetic silencing of microRNA-193a contributes to leukemogenesis in t(8;21) acute myeloid leukemia by activating the PTEN/PI3K signal pathway. Blood, 2013; 121:499-509.
116. Wang, Y., et al., Profiling microRNA expression in hepatocellular carcinoma reveals microRNA-224 up-regulation and apoptosis inhibitor-5 as a microRNA-224-specific target. J Biol Chem, 2008; 283:13205-15.
117. Huang, L., et al., MicroRNA-224 targets RKIP to control cell invasion and expression of metastasis genes in human breast cancer cells. Biochem Biophys Res Commun, 2012; 425:127-33.
118. Liao, W.T., et al., microRNA-224 promotes cell proliferation and tumor growth in human colorectal cancer by repressing PHLPP1 and PHLPP2. Clin Cancer Res, 2013; 19:4662-72.
119. Lu, S., et al., Upregulation of microRNA-224 confers a poor prognosis in glioma patients. Clin Transl Oncol, 2013; 15:569-74.
120. Kozaki, K., et al., Exploration of tumor-suppressive microRNAs silenced by DNA hypermethylation in oral cancer. Cancer Res, 2008; 68:2094-105.
121. Iliopoulos, D., A. Rotem, and K. Struhl, Inhibition of miR-193a expression by Max and RXRalpha activates K-Ras and PLAU to mediate distinct aspects of cellular transformation. Cancer Res, 2011; 71:5144-53.
122. Iliopoulos, D., et al., MicroRNA signature of primary pigmented nodular adrenocortical disease: clinical correlations and regulation of Wnt signaling. Cancer Res, 2009; 69:3278-82.
123. Lal, A., et al., miR-24 Inhibits cell proliferation by targeting E2F2, MYC, and other cell-cycle genes via binding to "seedless" 3'UTR microRNA recognition elements. Mol Cell, 2009; 35:610-25.

References
124
124. Lujambio, A., et al., A microRNA DNA methylation signature for human cancer metastasis. Proc Natl Acad Sci U S A, 2008; 105:13556-61.
125. Wang, G., W. Mao, and S. Zheng, MicroRNA-183 regulates Ezrin expression in lung cancer cells. FEBS Lett, 2008; 582:3663-8.
126. Lowery, A.J., et al., Dysregulated miR-183 inhibits migration in breast cancer cells. BMC Cancer, 2010; 10:502.
127. Zhang, J., et al., Effects of miR-335-5p in modulating osteogenic differentiation by specifically downregulating Wnt antagonist DKK1. J Bone Miner Res, 2011; 26:1953-63.
128. Nagel, R., et al., Regulation of the adenomatous polyposis coli gene by the miR-135 family in colorectal cancer. Cancer Res, 2008; 68:5795-802.
129. Volinia, S., et al., A microRNA expression signature of human solid tumors defines cancer gene targets. Proc Natl Acad Sci U S A, 2006; 103:2257-61.
130. Ferretti, E., et al., MicroRNA profiling in human medulloblastoma. Int J Cancer, 2009; 124:568-77.
131. Bai, A.H., et al., MicroRNA-182 promotes leptomeningeal spread of non-sonic hedgehog-medulloblastoma. Acta Neuropathol, 2012; 123:529-38.
132. Weeraratne, S.D., et al., Pleiotropic effects of miR-183~96~182 converge to regulate cell survival, proliferation and migration in medulloblastoma. Acta Neuropathol, 2012; 123:539-52.
133. Tong, A.W., et al., MicroRNA profile analysis of human prostate cancers. Cancer Gene Ther, 2009; 16:206-16.
134. Silber, J., et al., miR-124 and miR-137 inhibit proliferation of glioblastoma multiforme cells and induce differentiation of brain tumor stem cells. BMC Med, 2008; 6:14.
135. Xia, H., et al., Loss of brain-enriched miR-124 microRNA enhances stem-like traits and invasiveness of glioma cells. J Biol Chem, 2012; 287:9962-71.
136. Silber, J., et al., Expression of miR-124 inhibits growth of medulloblastoma cells. Neuro Oncol, 2013; 15:83-90.
137. Glazov, E.A., et al., Origin, evolution, and biological role of miRNA cluster in DLK-DIO3 genomic region in placental mammals. Mol Biol Evol, 2008; 25:939-48.
138. Ferretti, E., et al., Concerted microRNA control of Hedgehog signalling in cerebellar neuronal progenitor and tumour cells. EMBO J, 2008; 27:2616-27.
139. Gilbertson, R.J., Finding the perfect partner for medulloblastoma prognostication. J Clin Oncol, 2011; 29:3841-2.
140. Tabori, U., et al., Distinctive clinical course and pattern of relapse in adolescents with medulloblastoma. Int J Radiat Oncol Biol Phys, 2006; 64:402-7.
141. Ellison, D.W., et al., Definition of disease-risk stratification groups in childhood medulloblastoma using combined clinical, pathologic, and molecular variables. J Clin Oncol, 2011; 29:1400-7.
142. Leary, S.E., et al., Histology predicts a favorable outcome in young children with desmoplastic medulloblastoma: a report from the children's oncology group. Cancer, 2011; 117:3262-7.
143. Oberg, A.L., et al., miRNA expression in colon polyps provides evidence for a multihit model of colon cancer. PLoS One, 2011; 6:e20465.
144. Wang, W., et al., MiR-138 induces cell cycle arrest by targeting cyclin D3 in hepatocellular carcinoma. Carcinogenesis, 2012; 33:1113-20.

125
145. Sarver, A.L., et al., Human colon cancer profiles show differential microRNA expression depending on mismatch repair status and are characteristic of undifferentiated proliferative states. BMC Cancer, 2009; 9:401.
146. Ceppi, P. and M.E. Peter, MicroRNAs regulate both epithelial-to-mesenchymal transition and cancer stem cells. Oncogene, 2013;
147. Ajeawung, N.F., B. Li, and D. Kamnasaran, Translational applications of microRNA genes in medulloblastomas. Clin Invest Med, 2010; 33:E223-33.

APPENDIX

126
APPENDIX
APPENDIX I List of miRNAs most significantly differentially expressed in each medulloblastoma
subgroup (t-test analysis, p < 0.05) using log 10 transformed RQ values. Fold change
indicates ratio of unlogged mean expression levels. MiRNAs overexpressed or
underexpressed in each molecular subtype as compared to all other subtypes as well as
normal cerebellar tissues are indicated in bold font.
WNT subgroup
miRNAs up-regulated in WNT subgroup as compared to medulloblastomas belonging to other subgroups
DetectorSHH, Group
3, 4 mean
SHH, Group 3,4
std.dev.WNT mean
WNT std.dev.
Absolute t value Adj p value Fold Change
hsa-miR-193a-4373107 -0.110 0.664 1.746 0.426 6.994 6.30E-06 71.68hsa-miR-183-4373114 0.253 1.089 2.020 0.259 5.325 1.38E-04 58.40hsa-miR-224-4373187 -0.173 0.444 1.528 0.446 7.525 2.01E-05 50.30hsa-miR-182-4373271 0.168 0.968 1.827 0.174 5.757 9.07E-05 45.60hsa-miR-452-4378077 -0.352 0.581 1.240 0.298 7.462 3.05E-06 39.13hsa-miR-204-4373094 -0.632 0.967 0.518 0.322 3.850 1.41E-03 14.13hsa-miR-452-4373281 -0.084 0.231 1.016 0.265 7.678 3.07E-05 12.60hsa-miR-365-4373194 -0.158 0.469 0.861 0.129 7.006 9.25E-06 10.43hsa-miR-135a-4373140 -0.257 0.457 0.755 0.300 5.740 5.11E-05 10.27hsa-miR-23b-4373073 -0.266 0.419 0.731 0.301 5.779 6.40E-05 9.93hsa-miR-148a-4373130 -0.091 0.296 0.878 0.194 8.504 6.68E-07 9.31hsa-miR-449-4373207 -0.507 0.633 0.411 0.210 4.549 4.55E-04 8.28hsa-miR-27b-4373068 -0.155 0.429 0.711 0.189 6.106 1.52E-05 7.34hsa-miR-24-4373072 -0.063 0.319 0.713 0.174 6.585 1.76E-05 5.97hsa-miR-146b-4373178 -0.179 0.350 0.482 0.190 5.181 1.12E-04 4.58hsa-miR-335-4373045 -0.126 0.320 0.386 0.270 3.616 4.05E-03 3.25hsa-miR-449b-4381011 -0.138 0.578 0.369 0.133 2.753 1.75E-02 3.21hsa-miR-328-4373049 -0.141 0.201 0.349 0.136 6.238 2.17E-05 3.09hsa-miR-98-4373009 -0.156 0.207 0.312 0.107 6.495 7.39E-06 2.94hsa-miR-330-4373047 -0.178 0.275 0.264 0.186 4.112 1.06E-03 2.77hsa-miR-320-4373055 -0.055 0.163 0.376 0.248 3.855 6.25E-03 2.70hsa-miR-497-4373222 -0.245 0.359 0.167 0.116 3.613 2.83E-03 2.58hsa-miR-194-4373106 -0.232 0.227 0.145 0.163 4.113 1.22E-03 2.38hsa-miR-324-3p-4373053 -0.113 0.217 0.250 0.213 3.427 7.55E-03 2.31hsa-miR-195-4373105 -0.203 0.306 0.137 0.103 3.591 2.44E-03 2.19
hsa-let-7f-4373164 -0.131 0.146 0.203 0.141 4.757 7.72E-04 2.16hsa-miR-324-5p-4373052 -0.186 0.256 0.127 0.069 4.084 9.78E-04 2.05

127
WNT subgroup
miRNAs up-regulated in WNT subgroup as compared to normal cerebellar tissues
DetectorGroupN mean
GroupN std.dev.
WNT mean
WNT std.dev.
Absolute t value Adj p value Fold Change
hsa-miR-183-4373114 -0.737 0.663 2.020 0.259 7.929 4.18E-03 571.41hsa-miR-182-4373271 -0.857 0.471 1.827 0.174 10.921 1.64E-03 483.39hsa-miR-224-4373187 -0.690 0.513 1.528 0.446 7.050 8.87E-04 165.38hsa-miR-193a-4373107 -0.410 0.293 1.746 0.426 9.481 3.04E-05 143.12hsa-miR-196b-4373103 -2.035 0.233 -0.170 1.096 3.908 1.13E-02 73.13hsa-miR-452-4378077 -0.398 0.403 1.240 0.298 6.957 9.43E-04 43.53hsa-miR-96-4373010 -1.215 0.149 0.259 0.260 9.864 2.22E-03 29.75hsa-miR-365-4373194 -0.535 0.226 0.861 0.129 11.207 3.61E-04 24.89hsa-miR-135a-4373140 -0.618 0.559 0.755 0.300 4.499 1.08E-02 23.59hsa-miR-452-4373281 -0.345 0.131 1.016 0.265 10.315 4.85E-05 22.99hsa-miR-148a-4373130 -0.388 0.530 0.878 0.194 4.577 1.96E-02 18.47hsa-miR-28-4373067 -0.940 0.220 0.245 0.069 10.424 1.88E-03 15.31hsa-miR-375-4373027 -0.686 0.454 0.435 0.265 4.382 1.19E-02 13.23hsa-miR-325-4373051 -0.870 0.480 0.217 0.155 4.379 2.20E-02 12.23hsa-miR-23b-4373073 -0.317 0.246 0.731 0.301 6.019 5.32E-04 11.16hsa-miR-204-4373094 -0.471 0.198 0.518 0.322 6.016 5.34E-04 9.77hsa-miR-326-4373050 -0.708 0.129 0.100 0.152 9.028 4.18E-05 6.44hsa-miR-32-4373056 -0.597 0.324 0.113 0.167 3.977 1.64E-02 5.13hsa-miR-24-4373072 0.010 0.105 0.713 0.174 7.480 2.95E-04 5.04hsa-miR-146b-4373178 -0.207 0.094 0.482 0.190 7.590 1.27E-04 4.88hsa-miR-335-4373045 -0.298 0.348 0.386 0.270 3.317 2.11E-02 4.83hsa-miR-25-4373071 -0.627 0.288 0.013 0.170 3.997 1.62E-02 4.36hsa-miR-106b-4373155 -0.497 0.342 0.106 0.153 3.313 4.53E-02 4.01hsa-miR-576-4381021 -0.407 0.234 0.126 0.246 3.322 1.60E-02 3.42hsa-miR-27b-4373068 0.183 0.190 0.711 0.189 4.305 5.06E-03 3.37hsa-miR-98-4373009 -0.191 0.066 0.312 0.107 9.208 3.67E-05 3.19hsa-miR-186-4373112 -0.347 0.057 0.152 0.121 8.754 5.11E-05 3.15hsa-miR-451-4373209 -0.506 0.198 -0.054 0.309 2.822 2.57E-02 2.84hsa-miR-425-4373202 -0.287 0.127 0.137 0.168 4.535 2.68E-03 2.65hsa-miR-100-4373160 -0.213 0.180 0.183 0.236 3.012 1.96E-02 2.49hsa-miR-21-4373090 -0.475 0.119 -0.111 0.328 2.483 4.76E-02 2.31hsa-miR-320-4373055 0.013 0.172 0.376 0.248 2.724 2.96E-02 2.30hsa-miR-99a-4373008 -0.240 0.190 0.102 0.149 3.032 2.90E-02 2.20
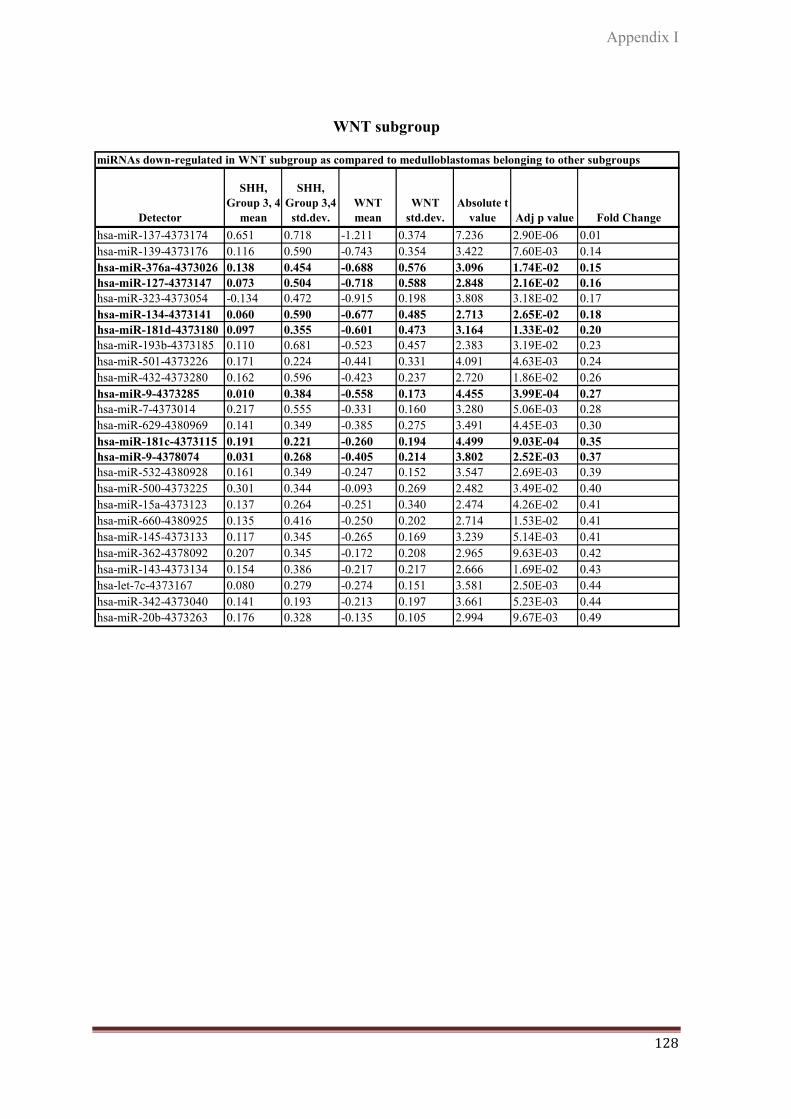
Appendix I
128
WNT subgroup
miRNAs down-regulated in WNT subgroup as compared to medulloblastomas belonging to other subgroups
Detector
SHH, Group 3, 4
mean
SHH, Group 3,4
std.dev.WNT mean
WNT std.dev.
Absolute t value Adj p value Fold Change
hsa-miR-137-4373174 0.651 0.718 -1.211 0.374 7.236 2.90E-06 0.01hsa-miR-139-4373176 0.116 0.590 -0.743 0.354 3.422 7.60E-03 0.14hsa-miR-376a-4373026 0.138 0.454 -0.688 0.576 3.096 1.74E-02 0.15hsa-miR-127-4373147 0.073 0.504 -0.718 0.588 2.848 2.16E-02 0.16hsa-miR-323-4373054 -0.134 0.472 -0.915 0.198 3.808 3.18E-02 0.17hsa-miR-134-4373141 0.060 0.590 -0.677 0.485 2.713 2.65E-02 0.18hsa-miR-181d-4373180 0.097 0.355 -0.601 0.473 3.164 1.33E-02 0.20hsa-miR-193b-4373185 0.110 0.681 -0.523 0.457 2.383 3.19E-02 0.23hsa-miR-501-4373226 0.171 0.224 -0.441 0.331 4.091 4.63E-03 0.24hsa-miR-432-4373280 0.162 0.596 -0.423 0.237 2.720 1.86E-02 0.26hsa-miR-9-4373285 0.010 0.384 -0.558 0.173 4.455 3.99E-04 0.27hsa-miR-7-4373014 0.217 0.555 -0.331 0.160 3.280 5.06E-03 0.28hsa-miR-629-4380969 0.141 0.349 -0.385 0.275 3.491 4.45E-03 0.30hsa-miR-181c-4373115 0.191 0.221 -0.260 0.194 4.499 9.03E-04 0.35hsa-miR-9-4378074 0.031 0.268 -0.405 0.214 3.802 2.52E-03 0.37hsa-miR-532-4380928 0.161 0.349 -0.247 0.152 3.547 2.69E-03 0.39hsa-miR-500-4373225 0.301 0.344 -0.093 0.269 2.482 3.49E-02 0.40hsa-miR-15a-4373123 0.137 0.264 -0.251 0.340 2.474 4.26E-02 0.41hsa-miR-660-4380925 0.135 0.416 -0.250 0.202 2.714 1.53E-02 0.41hsa-miR-145-4373133 0.117 0.345 -0.265 0.169 3.239 5.14E-03 0.41hsa-miR-362-4378092 0.207 0.345 -0.172 0.208 2.965 9.63E-03 0.42hsa-miR-143-4373134 0.154 0.386 -0.217 0.217 2.666 1.69E-02 0.43hsa-let-7c-4373167 0.080 0.279 -0.274 0.151 3.581 2.50E-03 0.44hsa-miR-342-4373040 0.141 0.193 -0.213 0.197 3.661 5.23E-03 0.44hsa-miR-20b-4373263 0.176 0.328 -0.135 0.105 2.994 9.67E-03 0.49

129
WNT subgroup
miRNAs down-regulated in WNT subgroup as compared to normal cerebellar tissues
DetectorGroupN
meanGroupN std.dev.
WNT mean
WNT std.dev.
Absolute t value Adj p value Fold Change
hsa-miR-206-4373092 1.305 0.105 -0.803 1.002 4.674 9.49E-03 0.01hsa-miR-383-4373018 0.602 0.174 -1.164 0.820 4.216 2.44E-02 0.02hsa-miR-410-4378093 1.058 0.258 -0.589 0.561 5.838 2.09E-03 0.02hsa-miR-127-4373147 0.913 0.265 -0.718 0.588 5.947 5.72E-04 0.02hsa-miR-379-4373023 1.202 0.280 -0.428 0.705 5.090 2.24E-03 0.02hsa-miR-134-4373141 0.803 0.229 -0.677 0.485 6.031 1.80E-03 0.03hsa-miR-487b-4378102 0.874 0.222 -0.600 0.600 5.075 3.85E-03 0.03hsa-miR-382-4373019 0.896 0.179 -0.520 0.508 5.260 1.34E-02 0.04hsa-miR-132-4373143 0.863 0.256 -0.542 0.623 4.935 1.68E-03 0.04hsa-miR-376a-4373026 0.649 0.271 -0.688 0.576 4.925 1.70E-03 0.05hsa-miR-432-4373280 0.909 0.030 -0.423 0.237 11.170 1.54E-03 0.05hsa-miR-411-4381013 0.659 0.206 -0.658 0.535 5.055 3.92E-03 0.05hsa-miR-656-4380920 0.775 0.537 -0.530 0.254 4.037 2.73E-02 0.05hsa-miR-433-4373205 1.069 0.245 -0.218 0.520 4.476 1.10E-02 0.05hsa-miR-485-3p-4378095 0.717 0.251 -0.502 0.587 4.187 8.60E-03 0.06hsa-miR-124a-4373150 0.801 0.273 -0.350 0.581 4.201 4.03E-03 0.07hsa-miR-181d-4373180 0.520 0.219 -0.601 0.473 5.049 1.48E-03 0.08hsa-miR-299-5p-4373188 0.819 0.471 -0.204 0.317 3.604 1.55E-02 0.09hsa-miR-95-4373011 0.660 0.039 -0.358 0.335 7.375 7.20E-04 0.10hsa-miR-376a-4378104 0.530 0.195 -0.460 0.360 4.832 8.45E-03 0.10hsa-miR-9-4373285 0.349 0.237 -0.558 0.173 6.577 1.22E-03 0.12hsa-miR-181c-4373115 0.492 0.047 -0.260 0.194 9.090 2.70E-04 0.18hsa-miR-181b-4373116 0.414 0.173 -0.303 0.281 4.696 3.34E-03 0.19hsa-miR-107-4373154 0.761 0.214 0.052 0.278 4.544 2.66E-03 0.20hsa-miR-378-4373024 0.424 0.125 -0.265 0.499 2.971 4.11E-02 0.20hsa-miR-139-4373176 -0.076 0.112 -0.743 0.354 3.588 3.71E-02 0.22hsa-miR-9-4378074 0.246 0.153 -0.405 0.214 5.608 8.09E-04 0.22hsa-let-7g-4373163 0.466 0.367 -0.135 0.242 2.885 4.48E-02 0.25hsa-miR-149-4373128 0.431 0.105 -0.145 0.159 6.909 2.30E-04 0.27hsa-miR-30e-5p-4373058 0.184 0.145 -0.268 0.279 3.347 1.23E-02 0.35hsa-miR-22-4373079 0.211 0.050 -0.238 0.400 2.722 4.17E-02 0.36hsa-miR-488-4373213 0.305 0.109 -0.130 0.248 3.525 1.68E-02 0.37hsa-let-7e-4373165 0.329 0.162 -0.104 0.294 2.991 2.02E-02 0.37
hsa-miR-660-4380925 0.146 0.221 -0.250 0.202 2.872 2.84E-02 0.40hsa-miR-30e-3p-4373057 0.267 0.054 -0.126 0.094 7.868 2.23E-04 0.40hsa-miR-125a-4373149 0.416 0.115 0.070 0.154 4.053 4.85E-03 0.45hsa-miR-342-4373040 0.119 0.091 -0.213 0.197 3.595 8.80E-03 0.47hsa-let-7b-4373168 0.250 0.172 -0.056 0.132 3.017 2.95E-02 0.49

Appendix I
130
SHH subgroup
miRNAs up-regulated in SHH subgroup as compared to medulloblastomas belonging to other subgroups
Detector
WNT, Group 3, 4
mean
WNT, Group 3, 4
std.dev.SHH mean
SHH std.dev.
Absolute t value
Adj p value Fold Change
hsa-miR-95-4373011 -0.361 0.521 0.705 0.255 5.425 2.88E-03 11.64hsa-miR-550-4380954 -0.127 0.227 0.505 0.226 4.450 4.70E-02 4.29hsa-miR-199a-4378068 -0.031 0.527 0.460 0.221 2.679 3.16E-02 3.10hsa-miR-92-4373013 0.002 0.347 0.451 0.129 3.922 4.41E-03 2.81hsa-miR-501-4373226 -0.078 0.392 0.331 0.011 4.162 8.34E-04 2.56hsa-miR-576-4381021 -0.130 0.381 0.251 0.159 2.783 2.38E-02 2.41hsa-miR-216-4373083 -0.263 0.552 0.115 0.081 2.595 1.95E-02 2.39hsa-miR-565-4380942 -0.149 0.352 0.210 0.167 2.749 3.33E-02 2.29hsa-miR-20a-4373286 -0.064 0.357 0.283 0.121 3.061 1.20E-02 2.22hsa-miR-19a-4373099 0.027 0.300 0.346 0.071 3.739 1.98E-03 2.09
miRNAs up-regulated in SHH subgroup as compared to normal cerebellar tissues
DetectorGroupN
meanGroupN std.dev.
SHH mean
SHH std.dev.
Absolute t value
Adj p value Fold Change
hsa-miR-199a-4378068 -0.482 0.405 0.460 0.221 3.940 1.70E-02 8.76hsa-miR-92-4373013 -0.445 0.466 0.451 0.129 3.660 3.53E-02 7.86hsa-miR-25-4373071 -0.627 0.288 0.221 0.090 5.532 1.16E-02 7.05hsa-miR-224-4373187 -0.690 0.513 0.150 0.004 3.275 4.66E-02 6.92hsa-miR-594-4380958 -0.315 0.338 0.474 0.363 2.931 4.28E-02 6.16hsa-miR-21-4373090 -0.475 0.119 0.258 0.226 5.107 3.63E-02 5.41hsa-miR-106b-4373155 -0.497 0.342 0.163 0.160 3.392 2.75E-02 4.57hsa-miR-576-4381021 -0.407 0.234 0.251 0.159 4.423 1.15E-02 4.55hsa-miR-565-4380942 -0.147 0.162 0.210 0.167 2.833 4.72E-02 2.28

131
SHH subgroup
miRNAs down-regulated in SHH subgroup as compared to medulloblastomas belonging to other subgroups
Detector
WNT, Group 3, 4 mean
WNT, Group 3, 4 std.dev.
SHH mean
SHH std.dev.
Absolute t value
Adj p value Fold Change
hsa-miR-135b-4373139 0.184 0.494 -1.921 0.068 16.248 2.29E-11 0.01hsa-miR-182-4373271 0.907 1.043 -0.765 0.406 4.312 2.30E-02 0.02hsa-miR-204-4373094 -0.027 0.834 -1.558 0.639 3.615 3.64E-02 0.03hsa-miR-183-4373114 0.990 1.227 -0.341 0.380 3.263 3.10E-02 0.05hsa-miR-153-4373125 0.114 0.580 -0.910 0.230 5.111 9.18E-04 0.09hsa-miR-187-4373111 0.109 0.647 -0.779 0.036 5.272 1.18E-04 0.13hsa-miR-135a-4373140 0.202 0.586 -0.681 0.138 5.294 9.01E-05 0.13hsa-miR-452-4373281 0.589 0.605 -0.150 0.212 3.043 2.87E-02 0.18hsa-miR-627-4380967 0.135 0.381 -0.294 0.154 3.033 1.62E-02 0.37hsa-miR-30d-4373059 0.039 0.216 -0.317 0.142 3.637 2.20E-02 0.44
miRNAs down-regulated in SHH subgroup as compared to normal cerebellar tissues
DetectorGroupN mean
GroupN std.dev.
SHH mean
SHH std.dev.
Absolute t value
Adj p value Fold Change
hsa-miR-135b-4373139 -0.257 0.218 -1.921 0.068 14.355 7.33E-04 0.02hsa-miR-206-4373092 1.305 0.105 -0.258 0.006 29.708 8.38E-05 0.03hsa-miR-433-4373205 1.069 0.245 -0.271 0.170 8.538 1.03E-03 0.05hsa-miR-656-4380920 0.775 0.537 -0.529 0.177 4.537 2.00E-02 0.05hsa-miR-124a-4373150 0.801 0.273 -0.494 0.453 4.392 2.19E-02 0.05hsa-miR-379-4373023 1.202 0.280 0.001 0.441 4.129 2.58E-02 0.06hsa-miR-382-4373019 0.896 0.179 -0.205 0.319 5.382 3.28E-02 0.08hsa-miR-153-4373125 0.057 0.235 -0.910 0.230 5.448 5.52E-03 0.11hsa-miR-218-4373081 0.530 0.448 -0.375 0.171 3.696 2.09E-02 0.12
hsa-miR-127-4373147 0.913 0.265 0.014 0.333 3.848 3.10E-02 0.13hsa-miR-134-4373141 0.803 0.229 0.086 0.199 4.418 1.15E-02 0.19hsa-miR-330-4373047 0.512 0.305 -0.163 0.166 3.743 2.01E-02 0.21hsa-miR-411-4381013 0.659 0.206 -0.012 0.253 3.763 3.28E-02 0.21hsa-miR-149-4373128 0.431 0.105 -0.174 0.194 4.887 3.94E-02 0.25hsa-miR-181d-4373180 0.520 0.219 -0.049 0.137 4.205 1.36E-02 0.27hsa-miR-181c-4373115 0.492 0.047 -0.047 0.029 18.828 4.69E-05 0.29hsa-miR-488-4373213 0.305 0.109 -0.166 0.053 7.144 5.65E-03 0.34hsa-miR-328-4373049 0.225 0.270 -0.245 0.166 2.841 4.68E-02 0.34hsa-miR-30b-4373290 0.207 0.085 -0.250 0.093 6.669 2.63E-03 0.35hsa-miR-376a-4378104 0.530 0.195 0.101 0.200 2.838 4.70E-02 0.37hsa-miR-99b-4373007 0.224 0.172 -0.194 0.068 4.426 1.15E-02 0.38

Appendix I
132
Group 3
miRNAs up-regulated in Group 3 as compared to medulloblastomas belonging to other subgroups
Detector
WNT,SHH,Group 4
mean
WNT,SHH,Group 4 std.dev.
Group3 mean
Group3 std.dev.
Absolute t value
Adj p value
Fold Change
hsa-miR-18a-4373118 0.021 0.381 0.682 0.091 5.749 6.99E-04 4.58hsa-miR-32-4373056 0.113 0.334 0.552 0.138 3.365 4.36E-02 2.75hsa-miR-30d-4373059 -0.068 0.220 0.358 0.084 5.276 1.33E-02 2.67hsa-miR-17-3p-4373120 -0.160 0.423 0.244 0.136 2.832 4.73E-02 2.54hsa-miR-133b-4373172 -0.034 0.422 0.270 0.071 2.607 2.29E-02 2.02
miRNAs up-regulated in Group 3 as compared to normal cerebellar tissues
DetectorGroupN
meanGroupN std.dev.
Group3 mean
Group3 std.dev.
Absolute t value
Adj p value
Fold Change
hsa-miR-193b-4373185 -0.765 0.374 0.634 0.370 4.352 4.90E-02 25.03hsa-miR-28-4373067 -0.940 0.220 0.331 0.157 8.131 1.48E-02 18.63hsa-miR-32-4373056 -0.597 0.324 0.552 0.138 6.070 8.98E-03 14.10hsa-miR-325-4373051 -0.870 0.480 0.270 0.071 4.649 1.88E-02 13.83hsa-miR-18a-4373118 -0.369 0.442 0.682 0.091 4.568 1.97E-02 11.25hsa-miR-106b-4373155 -0.497 0.342 0.176 0.014 3.929 2.94E-02 4.71hsa-miR-339-4373042 -0.444 0.368 0.211 0.107 3.292 4.60E-02 4.52hsa-miR-16-4373121 -0.268 0.114 0.125 0.044 6.071 8.97E-03 2.47
miRNAs down-regulated in Group 3 as compared to medulloblastomas belonging to other subgroups
Detector
WNT,SHH,Group 4
mean
WNT,SHH,Group 4 std.dev.
Group3 mean
Group3 std.dev.
Absolute t value
Adj p value Fold Change
hsa-miR-204-4373094 -0.103 0.847 -1.930 0.035 8.569 3.66E-07 0.01hsa-miR-153-4373125 0.003 0.562 -1.019 0.225 4.750 1.77E-02 0.09hsa-miR-410-4378093 -0.166 0.606 -0.911 0.039 4.689 3.48E-04 0.18hsa-miR-487b-4378102 -0.169 0.671 -0.867 0.123 3.501 4.96E-03 0.20hsa-miR-433-4373205 0.022 0.507 -0.658 0.026 4.968 2.57E-04 0.21
hsa-miR-127-4373147 -0.175 0.606 -0.739 0.042 3.653 2.36E-03 0.27hsa-miR-29a-4373065 -0.005 0.321 -0.340 0.089 3.287 2.18E-02 0.46
miRNAs down-regulated in Group 3 as compared to normal cerebellar tissues
DetectorGroupN
meanGroupN std.dev.
Group3 mean
Group3 std.dev.
Absolute t value
Adj p value Fold Change
hsa-miR-410-4378093 1.058 0.258 -0.911 0.039 14.919 6.54E-04 0.01hsa-miR-487b-4378102 0.874 0.222 -0.867 0.123 12.344 1.15E-03 0.02hsa-miR-433-4373205 1.069 0.245 -0.658 0.026 13.962 7.96E-04 0.02hsa-miR-127-4373147 0.913 0.265 -0.739 0.042 12.152 1.20E-03 0.02hsa-miR-204-4373094 -0.471 0.198 -1.930 0.035 14.316 7.39E-04 0.03hsa-miR-379-4373023 1.202 0.280 -0.086 0.112 7.997 4.08E-03 0.05hsa-miR-153-4373125 0.057 0.235 -1.019 0.225 5.444 3.21E-02 0.08hsa-miR-330-4373047 0.512 0.305 -0.118 0.006 4.117 2.60E-02 0.23

133
Group 4
miRNAs up-regulated in Group 4 as compared to medulloblastomas belonging to other subgroups
Detector
WNT,SHH,Group3
mean
WNT,SHH, Group3 std.dev.
Group4 mean
Group4 std.dev.
Absolute t value
Adj p value
Fold Change
hsa-miR-137-4373174 -0.439 0.978 1.002 0.654 3.622 2.78E-03 27.63hsa-miR-135b-4373139 -0.609 0.913 0.579 0.283 4.020 1.70E-03 15.40hsa-miR-206-4373092 -0.662 0.797 0.331 0.623 2.504 3.12E-02 9.83hsa-miR-487b-4378102 -0.660 0.489 0.264 0.492 3.740 2.47E-03 8.39hsa-miR-485-3p-4378095 -0.592 0.641 0.245 0.299 3.606 3.20E-03 6.86hsa-miR-382-4373019 -0.540 0.532 0.248 0.459 3.180 7.25E-03 6.14hsa-miR-432-4373280 -0.436 0.293 0.311 0.461 3.616 4.72E-03 5.58hsa-miR-153-4373125 -0.377 0.603 0.359 0.341 3.216 6.22E-03 5.45hsa-miR-127-4373147 -0.522 0.560 0.209 0.330 3.483 3.34E-03 5.38hsa-miR-410-4378093 -0.529 0.558 0.140 0.497 2.599 2.20E-02 4.67hsa-miR-134-4373141 -0.470 0.587 0.189 0.467 2.572 2.21E-02 4.56hsa-miR-187-4373111 -0.299 0.700 0.347 0.532 2.160 4.86E-02 4.43hsa-miR-9-4373285 -0.426 0.361 0.209 0.178 4.954 1.73E-04 4.31hsa-miR-376a-4373026 -0.416 0.632 0.214 0.277 2.898 1.17E-02 4.26hsa-miR-433-4373205 -0.334 0.379 0.285 0.501 2.719 2.16E-02 4.15hsa-miR-124a-4373150 -0.360 0.515 0.183 0.244 3.008 8.83E-03 3.49hsa-miR-660-4380925 -0.174 0.332 0.359 0.270 3.734 2.22E-03 3.42hsa-miR-132-4373143 -0.458 0.576 0.048 0.266 2.522 2.35E-02 3.20
hsa-miR-181c-4373115 -0.139 0.210 0.359 0.128 6.244 1.57E-05 3.14hsa-miR-7-4373014 -0.164 0.554 0.334 0.377 2.264 3.88E-02 3.14hsa-miR-451-4373209 -0.175 0.355 0.282 0.388 2.522 2.68E-02 2.87hsa-miR-9-4378074 -0.302 0.288 0.153 0.081 4.931 3.47E-04 2.85hsa-miR-486-4378096 -0.179 0.349 0.265 0.274 3.005 8.88E-03 2.78hsa-let-7c-4373167 -0.199 0.229 0.230 0.204 4.143 9.94E-04 2.69hsa-miR-627-4380967 -0.085 0.389 0.340 0.242 2.520 2.85E-02 2.67hsa-miR-532-4380928 -0.099 0.340 0.288 0.239 2.833 1.26E-02 2.44hsa-miR-30a-3p-4373062 -0.331 0.332 0.007 0.177 2.810 1.32E-02 2.18hsa-miR-362-4378092 -0.029 0.370 0.296 0.253 2.214 4.27E-02 2.11hsa-miR-149-4373128 -0.105 0.209 0.207 0.284 2.501 3.14E-02 2.05

Appendix I
134
Group 4
miRNAs up-regulated in Group 4 as compared to normal cerebellar tissues
DetectorGroupN
meanGroupN std.dev.
Group4 mean
Group4 std.dev.
Absolute t value
Adj p value
Fold Change
hsa-miR-182-4373271 -0.857 0.471 0.201 0.848 2.663 2.87E-02 11.44hsa-miR-193b-4373185 -0.765 0.374 0.130 0.648 2.902 1.98E-02 7.85hsa-miR-135b-4373139 -0.257 0.218 0.579 0.283 5.476 9.30E-04 6.86hsa-miR-28-4373067 -0.940 0.220 -0.111 0.458 4.036 3.76E-03 6.74hsa-miR-32-4373056 -0.597 0.324 0.207 0.407 3.600 8.74E-03 6.38hsa-miR-451-4373209 -0.506 0.198 0.282 0.388 4.457 2.12E-03 6.14hsa-miR-25-4373071 -0.627 0.288 0.107 0.075 4.994 1.54E-02 5.42hsa-miR-106b-4373155 -0.497 0.342 0.091 0.175 3.209 4.90E-02 3.87hsa-miR-21-4373090 -0.475 0.119 0.095 0.330 4.127 3.31E-03 3.72hsa-miR-326-4373050 -0.708 0.129 -0.186 0.395 3.216 1.47E-02 3.33hsa-miR-204-4373094 -0.471 0.198 -0.011 0.340 2.841 2.18E-02 2.89hsa-miR-15a-4373123 -0.217 0.118 0.214 0.264 3.711 5.95E-03 2.70hsa-miR-365-4373194 -0.535 0.226 -0.143 0.335 2.310 4.97E-02 2.47hsa-let-7c-4373167 -0.136 0.175 0.230 0.204 3.139 1.64E-02 2.32hsa-miR-7-4373014 -0.031 0.086 0.334 0.377 2.449 4.42E-02 2.31hsa-miR-16-4373121 -0.268 0.114 0.086 0.075 5.574 5.08E-03 2.26hsa-miR-99a-4373008 -0.240 0.190 0.108 0.231 2.700 3.07E-02 2.23
miRNAs down-regulated in Group 4 as compared to medulloblastomas belonging to other subgroups
Detector
WNT,SHH,Group3
mean
WNT,SHH, Group3 std.dev.
Group4 mean
Group4 std.dev.
Absolute t value
Adj p value
Fold Change
hsa-miR-193a-4373107 1.208 0.861 -0.389 0.520 4.625 4.75E-04 0.03hsa-miR-224-4373187 0.927 0.852 -0.431 0.384 4.358 7.75E-04 0.04hsa-miR-452-4378077 0.699 0.767 -0.632 0.584 3.912 2.06E-03 0.05hsa-miR-449-4373207 0.276 0.310 -0.712 0.515 4.539 1.41E-03 0.10hsa-miR-189-4378067 0.465 0.516 -0.377 0.258 3.920 2.87E-03 0.14hsa-miR-449b-4381011 0.262 0.244 -0.507 0.355 4.629 1.69E-03 0.17hsa-miR-23b-4373073 0.399 0.606 -0.358 0.307 3.381 4.92E-03 0.17hsa-miR-27b-4373068 0.435 0.499 -0.309 0.245 4.210 7.57E-04 0.18hsa-miR-24-4373072 0.394 0.440 -0.205 0.220 3.691 2.72E-03 0.25hsa-miR-365-4373194 0.449 0.697 -0.143 0.335 2.328 3.67E-02 0.26hsa-miR-146b-4373178 0.247 0.413 -0.313 0.259 3.423 4.12E-03 0.28hsa-miR-148a-4373130 0.436 0.587 -0.110 0.243 2.738 1.60E-02 0.28hsa-miR-17-3p-4373120 0.084 0.305 -0.429 0.395 2.924 1.52E-02 0.31hsa-miR-18a-4373118 0.271 0.368 -0.185 0.346 2.656 1.98E-02 0.35hsa-miR-20a-4373286 0.213 0.204 -0.239 0.190 4.778 3.61E-04 0.35hsa-miR-19a-4373099 0.258 0.199 -0.119 0.191 4.022 1.45E-03 0.42hsa-miR-92-4373013 0.261 0.251 -0.101 0.257 2.939 1.24E-02 0.44hsa-miR-330-4373047 0.078 0.262 -0.265 0.316 2.398 3.53E-02 0.45

135
Group 4
miRNAs down-regulated in Group 4 as compared to normal cerebellar tissues
DetectorGroupN mean
GroupN std.dev.
Group4 mean
Group4 std.dev.
Absolute t value
Adj p value
Fold Change
hsa-miR-129-4373171 0.545 0.567 -0.580 0.434 3.365 2.00E-02 0.07hsa-miR-95-4373011 0.660 0.039 -0.465 0.567 5.226 1.97E-03 0.08hsa-miR-383-4373018 0.602 0.174 -0.455 0.699 3.542 1.65E-02 0.09hsa-miR-206-4373092 1.305 0.105 0.331 0.623 3.436 2.64E-02 0.11hsa-miR-410-4378093 1.058 0.258 0.140 0.497 4.030 3.79E-03 0.12hsa-miR-379-4373023 1.202 0.280 0.342 0.593 3.075 1.79E-02 0.14hsa-miR-107-4373154 0.761 0.214 -0.083 0.354 4.928 1.15E-03 0.14hsa-miR-323-4373054 0.643 0.124 -0.194 0.528 4.006 5.15E-03 0.15hsa-miR-132-4373143 0.863 0.256 0.048 0.266 5.001 2.45E-03 0.15hsa-miR-219-4373080 0.748 0.452 -0.041 0.529 2.612 3.48E-02 0.16hsa-miR-433-4373205 1.069 0.245 0.285 0.501 3.479 8.33E-03 0.16hsa-miR-330-4373047 0.512 0.305 -0.265 0.316 4.006 7.07E-03 0.17hsa-miR-127-4373147 0.913 0.265 0.209 0.330 3.866 6.17E-03 0.20hsa-miR-411-4381013 0.659 0.206 -0.024 0.370 3.938 4.31E-03 0.21hsa-miR-376a-4378104 0.530 0.195 -0.125 0.306 4.325 2.53E-03 0.22hsa-miR-382-4373019 0.896 0.179 0.248 0.459 3.321 1.05E-02 0.22hsa-miR-124a-4373150 0.801 0.273 0.183 0.244 3.751 1.33E-02 0.24
hsa-let-7d-4373166 0.434 0.220 -0.179 0.184 4.709 5.30E-03 0.24hsa-miR-134-4373141 0.803 0.229 0.189 0.467 2.919 1.93E-02 0.24hsa-miR-487b-4378102 0.874 0.222 0.264 0.492 2.820 2.25E-02 0.25hsa-miR-432-4373280 0.909 0.030 0.311 0.461 3.420 1.41E-02 0.25hsa-miR-26b-4373069 0.339 0.221 -0.238 0.130 4.764 8.88E-03 0.27hsa-miR-378-4373024 0.424 0.125 -0.075 0.187 5.295 7.33E-04 0.32hsa-miR-27b-4373068 0.183 0.190 -0.309 0.245 3.707 7.59E-03 0.32hsa-miR-485-3p-4378095 0.717 0.251 0.245 0.299 2.799 2.66E-02 0.34hsa-miR-376a-4373026 0.649 0.271 0.214 0.277 2.543 4.39E-02 0.37hsa-miR-30a-3p-4373062 0.427 0.047 0.007 0.177 5.920 5.88E-04 0.38hsa-miR-125a-4373149 0.416 0.115 0.022 0.093 5.837 2.09E-03 0.40hsa-miR-324-5p-4373052 0.185 0.088 -0.187 0.212 4.063 3.62E-03 0.43hsa-miR-597-4380960 0.196 0.120 -0.174 0.304 2.850 2.15E-02 0.43hsa-miR-103-4373158 0.303 0.172 -0.044 0.144 3.398 1.93E-02 0.45hsa-let-7e-4373165 0.329 0.162 -0.010 0.230 2.734 2.92E-02 0.46

136
APPENDIX II
Standardized fold change in the expression levels of the indicated marker genes / miRNAs
in a specific subgroup as compared to all other subgroups based on the analysis of the
genome wide expression profile data (19 medulloblastomas) and the real-time RT-PCR
data on 101 medulloblastomas.
Subgroup Differentially
expressed Genes
Gene 1.0 ST Array (GEO Acc No. GSE41842)
Real time RT-PCR
Standardized Difference (compared to rest of the groups)
WNT
WIF1 18.34 5.43 DKK2 14.98 2.74 MYC 2.82 0.78 OTX2 4.40 0.20
miR-193a-3p 3.06 3.02 miR-224 2.34 3.25
miR-148a 4.59 3.20 miR-23b 3.12 2.70 miR-365 7.56 2.92 miR-182 9.12 4.11 miR-204 2.52 4.28 miR-10b 1.81 2.94
SHH
HHIP 3.07 2.32 MYCN 3.87 1.17 OTX2 -3.14 -1.56 EYA1 1.93 3.30
miR-135b -22.12 -2.66 miR-204 -1.71 -2.55 miR-182 -4.85 -2.74 miR-10b -1.49 miR-376a 3.15 0.70
Group 3
NPR3 3.69 2.70 MYC 0.84 0.91 OTX2 201.02 1.12
EOMES 3.58 0.48 IMPG2 20.93 1.35
miR-135b 2.93 1.30 miR-204 -11.17 -0.37 miR-182 0.41 1.52 miR-592 -0.63 miR-10b -1.14 0.09 miR-376a -1.29 -0.10
Group 4
GRM8 4.28 2.68 OTX2 2.26 1.40
EOMES 1.73 1.42 UNC5D 4.90 1.42

137
miR-135b 4.71 2.65 miR-204 3.18 1.84 miR-182 -0.61 -0.44 miR-592 - 2.99 miR-10b -1.81 -0.30 miR-376a 1.89 1.12

PUBLICATIONS

138
LIST OF PUBLICATIONS:
Publications from thesis:
1. Real-time PCR assay based on the differential expression of microRNAs and
protein-coding genes for molecular classification of formalin-fixed paraffin
embedded medulloblastomas. Kunder R, Jalali R, Sridhar E, Moiyadi A, Goel
N, Goel A, Gupta T, Krishnatry R, Kannan S, Kurkure P, Deopujari C, Shetty
P, Biyani N, Korshunov A, Pfister SM, Northcott PA, Shirsat NV. Neuro
Oncol., 2013 Dec; 15(12):1644-51.
2. Distinctive microRNA signature of medulloblastomas associated with the
WNT signaling pathway. Gokhale A, Kunder R, Goel A, Sarin R, Moiyadi A,
Shenoy A, Mamidipally C, Noronha S, Kannan S, Shirsat NV. J Cancer Res
Ther., 2010 Oct-Dec; 6(4):521-9.

Real-time PCR assay based on the differentialexpression of microRNAs and protein-codinggenes for molecular classification of formalin-fixed paraffin embedded medulloblastomas
Ratika Kunder, Rakesh Jalali, Epari Sridhar, Aliasgar Moiyadi, Naina Goel, Atul Goel,Tejpal Gupta, Rahul Krishnatry, Sadhana Kannan, Purna Kurkure,Chandrashekhar Deopujari, Prakash Shetty, Naresh Biyani, Andrey Korshunov,Stefan M. Pfister, Paul A. Northcott, and Neelam Vishwanath Shirsat
Advanced Centre for Treatment, Research & Education in Cancer, Tata Memorial Centre,Kharghar, NaviMumbai,
India (R.K., E.S., A.M., T.G., S.K., P.S., N.V.S.); Tata Memorial Hospital, Tata Memorial Centre, Parel, Mumbai,
India (R.J., R.K., P.K.); Department of Pathology (N.G.), Department of Neurosurgery (A.G.) Seth G. S. Medical
College & K. E. M. Hospital, Parel, Mumbai, India; Bombay Hospital, Mumbai, India (C.D., N.B.); Division of
Pediatric Neurooncology, German Cancer Research Center, Heidelberg, Germany (A.K., S.M.P., P.A.N.)
Background. Medulloblastoma has recently been foundto consist of 4 molecularly and clinically distinctsubgroups: WNT, Sonce hedgehog (SHH), Group 3,and Group 4. Deregulated microRNA expression isknown to contribute to pathogenesis and has beenshown to have diagnostic and prognostic potential inthe classification of various cancers.Methods. Molecular subgrouping and microRNA ex-pression analysis of 44 frozen and 59 formalin-fixedparaffin embedded medulloblastomas from an Indiancohort were carried out by real-time RT-PCR assay.Results. The differential expression of 9 microRNAs inthe 4 molecular subgroups was validated in a set of 101medulloblastomas. The tumors in the WNT subgroupshowed significant (P , .0001) overexpression of miR-193a-3p, miR-224, miR-148a, miR-23b, and miR-365.Reliable classificationofmedulloblastomas into the 4mo-lecular subgroups was obtained using a set of 12 protein-coding genes and 9 microRNAs as markers in a real-timeRT-PCR assay with an accuracy of 97% as judged by thePrediction Analysis of Microarrays. Age at diagnosis,histology, gender-related incidence, and the relative sur-vival rates of the 4 molecular subgroups in the presentIndian cohort were found to be similar to those reported
for medulloblastomas from the American and Europeansubcontinent. Non-WNT, non–SHH medulloblastomasunderexpressing miR-592 or overexpressing miR-182were found to have significantly inferior survival rates,indicating utility of these miRNAs as markers for riskstratification.Conclusions. The microRNA based real-time PCR assayis rapid, simple, inexpensive, and useful for molecularclassification and risk stratification of medulloblastomas,in particular formalin-fixed paraffin embedded tissues,wherein the expression profile of protein-coding genes isoften less reliable due to RNA fragmentation.
Keywords: Indian cohort, medulloblastoma, miRNA,molecular classification, risk stratification.
Medulloblastoma is a common malignant braintumor in children, accounting for 20% of allpediatric brain tumors.1 All medulloblastomas
belong to WHO grade IV, the highest histological gradeof malignancy. Standard treatment includes surgical re-section, followed by craniospinal radiation and chemo-therapy. Advances in surgical and radiation techniqueshave improved the 5-year survival rate to about 80%for average-risk patients and 55%–76% for high-riskpatients.2 The risk stratification of medulloblastomas isbased on clinical parameters like age at diagnosis, pres-ence of metastasis, and extent of resection. Recentlyseveral investigators around theworld havedemonstratedthat medulloblastoma is not a single disease but consists
Corresponding Author: Dr Neelam Vishwanath Shirsat, PhD, Advanced
Centre for Treatment, Research & Education in Cancer, Tata Memorial
Centre, Kharghar, Navi Mumbai 410210 India ([email protected]).
Received October 29, 2012; accepted July 10, 2013.
Neuro-Oncology 15(12):1644–1651, 2013.doi:10.1093/neuonc/not123 NEURO-ONCOLOGY
#The Author(s) 2013. Published by Oxford University Press on behalf of the Society for Neuro-Oncology.All rights reserved. For permissions, please e-mail: [email protected].
at AC
TR
EC
on June 5, 2014http://neuro-oncology.oxfordjournals.org/
Dow
nloaded from

of molecularly distinct subgroups.3–5 According to thecurrent consensus, there are 4 core molecular subgroupsof medulloblastomas: WNT, SHH, Group 3, andGroup 4, which not only are distinct in their underlyingbiology but also vary in their clinical characteristics, likeage-related incidence, presence of metastasis, and survivalrates.6 In addition to the clinical parameters, molecularclassification of medulloblastomas is now necessary forbetter risk assessment and management of the disease.7
MicroRNAs (miRNAs) are 18- to 22-nucleotide-longnoncoding RNA molecules that regulate expression of theprotein-coding genes.8 MiRNAs bind to complementarysequences in the 3′ untranslated regions of multiple targetgenes, usually resulting in their silencing.9 Each miRNA isbelieved to target several hundred genes. Altered miRNAexpression has been reported in various cancers.10,11
Accumulating evidence indicates that deregulated miRNAexpression plays an important role in pathogenesis.MiRNAexpressionprofile hasbeen found tohave diagnos-tic and prognostic potential in the classification of variouscancers.12 Besides, miRNAs, being small in size, are pro-tected from fragmentation during the process of formalinfixation and hence can be reliably studied in formalin-fixedparaffin embedded (FFPE) tissues.13 Several studies haveshownanexcellentcorrelationbetweenmiRNAexpressionin fresh frozenandFFPEtissuesandhave foundthemiRNAexpression profile to be superior to that of the protein-coding genes in FFPE tissues.14,15
Weearlier reportedagenome-wideexpressionprofileofprotein-coding genes and miRNAs done in parallel on a setof 19 medulloblastomas and 4 normal cerebellar tissuesusing Gene 1.0 ST arrays (Affymetrix) and Taqman LowDensity miRNA array version 1.0 (Applied Biosystems),respectively.16 The protein-coding genes as well as themiRNA profile could segregate the medulloblastomasinto the 4 molecular subgroups, with the WNT medullo-blastomas having the most distinctive miRNA profile. Inthe present study, molecular subgrouping of 103 medullo-blastomas that included 59 FFPE tissues was carriedout using a set of 12 protein-coding genes as markers.Further, expression of a set of 11 miRNAs was studied inthese medulloblastomas by real-time RT-PCR, validatingthe differential expression of these miRNAs in the 4 molec-ularsubgroups.This studydemonstratesmiRNAsasusefulmarkers for molecular subgrouping of medulloblastomasfrom archived FFPE tissues.
Materials and Methods
Tumor Samples and RNA/DNA Extraction
All tumor tissues were obtained with the approval of the in-stitutional review board. Fresh tumor tissues were collectedfollowingsurgery, snapfrozen in liquidnitrogen,andstoredat 2808C. All the medulloblastoma cases studied weretreated per standard practices, with surgery followed by ra-diation(withtheexceptionofchildren ,3yold)andchemo-therapy. Forty-four fresh frozen medulloblastoma tissues(including a set of 30 tissues reported earlier) and 59 medul-loblastomas available as FFPE blocks were included in this
study. Hematoxylin and eosin staining were done toensure at least 80% tumor content, after which the tissueswere used for RNA and DNA extraction. For FFPEtissues, 10-mm sections were deparaffinized using xylenefollowed by absolute ethanol washes and subsequent diges-tion with proteinase K overnight at 558C in Tris–sodiumdodecyl sulfate–NaCl-EDTA buffer as per the protocol de-scribed by Korbler et al,17 followed by acid phenol–chloro-form or phenol-chloroform extraction and ethanolprecipitation for isolation of RNA and DNA, respective-ly.18 DNA and RNA quantity and quality were evaluat-ed using a spectrophotometer (Nanodrop ND-1000,Thermo Scientific) and agarose gel electrophoresis, re-spectively. Validation of the assay was done on totalRNA from 34 medulloblastoma FFPE tissues obtainedfrom the German Cancer Research Centre (DKFZ).
Reverse Transcription and Real-time PCR
The differential expression of the protein-coding genesand miRNAs was analyzed by real-time RT-PCR. TotalRNA (1–2 mg) was reverse transcribed using randomhexameric primers and M-MLV reverse transcriptase(Invitrogen). The primers for real-time PCR analysiswere designed such that they corresponded to 2 adjacentexons and, wherever possible, were located at exonboundaries to avoid amplification of genomic DNA.Supplementary Table S1 lists the sequences of theprimers used. The amplicon size was maintained below75–80 bp, so as to enable amplification of the fragmentedRNA from FFPE tissues. The expression was analyzed bySYBR Green PCR amplification assay on an AppliedBiosystems 7900HT real-time PCR system using 10 ngcDNA per reaction for frozen tissues and 10–100 ngcDNAperreactionforFFPEtissues.FormiRNAexpressionanalysis, 50 ng RNA from fresh tissues and 50–200 ngRNA from FFPE tissues were reverse transcribed usingmultiplex RT primer pools and the Taqman MicroRNAReverse Transcription Kit (Applied Biosystems) accordingto the manufacturer’s instructions. The expression of eachmiRNA was analyzed by TaqMan real-time miRNAassay (Applied Biosystems) on the ABI 7900HT real-timePCR system using 10 ng cDNA from frozen tissuesand 10–40 ng cDNA from FFPE tissues. The relativequantity (RQ) of each protein-coding gene/miRNAcompared with GAPDH/RNU48 was determined bythe comparative cycle threshold (Ct) method, whereRQ ¼ 22(Ct
Gene2Ct
Ref)×100.
Mutation Analysis
Exon 3 of the CTNNB1 gene was amplified from theWNT subgroup tumor tissues and sequenced to identifymutations, if any, using a 3100 Avant Genetic Analyzer(Applied Biosystems).
Statistical Analysis
Descriptive statistics were used for the subgroup assign-ment of each tumor tissue based on the expression levels
Kunder et al.: MicroRNAs as markers for medulloblastoma classification
NEURO-ONCOLOGY † D E C E M B E R 2 0 1 3 1645
at AC
TR
EC
on June 5, 2014http://neuro-oncology.oxfordjournals.org/
Dow
nloaded from

of the marker genes evaluated by real-time RT-PCR anal-ysis. The nearest shrunken centroid classifier implement-ed in the Prediction Analysis of Microarray (PAM) forExcel package was used for class prediction analysis(pamr_1.54 package at http://cran.r-project.org).19 Theexpression levels of the marker genes obtained as RQsby real-time RT-PCR were log2 transformed for PAManalysis. Robustness of the training set was assessed bycross-validation (random 10% left out at each cycle).The cross-validation was performed by selecting variousthresholds associated with the lowest error rate on thetraining set and then used for class prediction of the testset at the threshold having the least cross-validationerror rate. Analysis of receiver operating characteristic(ROC) curves was performed using SPSS 15.0 software.Descriptive statistics were used to describe the demo-graphic and histological data of the 4 subgroups. Eventfor overall survival was calculated from the date ofsurgery until death or last follow-up date. Survival per-centages were estimated by the Kaplan–Meier method,and statistical significance between the groups was esti-mated by the log-rank test using GraphPad Prism v5.0.
Results
Molecular Subgrouping Based on the ExpressionProfile of Protein-coding Genes
Molecular subgrouping of 103 medulloblastomas wascarried out using real-time RT-PCR based on the evalua-tion of expression of a set of protein-coding genes asmarkers. The 103 medulloblastomas consisted of 44fresh frozen and 59 FFPE tissues. The genes significantlydifferentially expressed in the 4 molecular subgroupswere identified by Significance Analysis of Microarray(MeV, http://www.TM4.com) of our expression profilingdata on 19 medulloblastoma tissues obtained using theAffymetrix Gene 1.0 ST array.16 The selection of themarker genes for classification from these significantlydifferentially expressed genes was based on the standard-ized fold change in the expression of the gene in the partic-ular subgroup from our data (Supplementary Table S2) aswell as that in other published reports.3,4 The heat map(Fig. 1A) and the scatter dot plot (Supplementary Fig.S1) show the differential expression of the marker genesin the 103 medulloblastomas that could be accuratelyclassified. Concomitant overexpression of WIF1,DKK2, and MYC identified WNT medulloblastomas.Overexpression of HHIP, EYA1, and MYCN and under-expression of OTX2 served as markers for the SHH sub-group. The overexpression of EOMES helped to identifyGroup 3 and Group 4 tumors, while higher expression ofNPR3, MYC, and IMPG2 and lower expression ofGRM8 and UNC5D helped to distinguish Group 3from Group 4 tumors. Five of the 103 medulloblastomaswere classified primarily based on their miRNA profiledue to poor RNA quality (to be discussed). Seven out of8 FFPE WNT medulloblastomas, which could be ana-lyzed for CTNNB1 exon 3 sequence, were found toharbor a single point mutation that altered D32, S33, or
S37 amino acid, validating their subgroup identification(Supplementary Fig. S2). Mutations in the CTNNB1gene in the 12 frozen WNT medulloblastomas havebeen previously reported.16 Thus, the presence of theCTNNB1 mutation in 19 out of 20 WNT tumors ana-lyzed confirmed its known prevalence in WNT medullo-blastomas.
Differential MiRNA Expression in the MolecularSubgroups of Medulloblastomas
The expression of a select set of miRNAs differentially ex-pressed in the 4 molecular subgroups was studied in par-allel by real-time RT-PCR analysis. Total RNA was notavailable for 2 fresh frozen tumor tissues for miRNA ex-pression analysis. The selection of miRNAs differentiallyexpressed in the 4 subgroups was based on our dataand other reports on the differential miRNA expressionin medulloblastoma subgroups.5,16,20 WNT tumorsshowed significant (P , .0001) overexpression ofmiR-193a-3p, miR-224, miR-148a, miR-23b, miR-365,and miR-10b compared with other subgroup medullo-blastomas (Fig. 1 and Supplementary Fig. S1). MiR-182was found to be overexpressed in all WNT medulloblasto-mas and in many (16/21) Group 3 and some (7/29) Group4 medulloblastomas, while miR-204 was overexpressed inall WNT medulloblastomas and in most (25/29) Group 4medulloblastomas. MiR-182, miR-135b, and miR-204were found to be underexpressed in SHH medulloblasto-mas. MiR-135b was found to be overexpressed in Group3 and Group 4 tumors. MiR-592, a miRNA locatedwithin the GRM8 gene, was overexpressed in Group 4 me-dulloblastomas. MiR-10b was expressed at the highestlevel inWNT medulloblastomas, followed by Group 3 me-dulloblastomas. MiR-376a belongs to the miR-379/miR-656 cluster of miRNAs located within an imprintedregion on chromosome 14.21 MiR-376a expression wasfound to be significantly higher in Group 4 medulloblasto-mas compared with Group 3 medulloblastomas.
Molecular Subgrouping Using Both Protein-codingGenes and MiRNAs by Prediction Analysis ofMicroarrays
A difference of �8 cycles was observed between theaverage Ct values of RNU48 (19+1.7) and GAPDH(27+2.1), wherein the amount of cDNA used forGAPDH evaluation was 2.5 times higher than that usedfor RNU48 evaluation, indicating integrity of smallRNAs (miRNAs) being about 600-fold higher than thatof protein-coding gene RNAs. Therefore, the evaluationof miRNA expression was reliable, reproducible, and sen-sitive even in 7- to 8-year-old FFPE tumor tissues(Supplementary Fig. S3).
The 12 protein-coding genes and 11 microRNAsdifferentially expressed in the 4 molecular subgroups ofmedulloblastomas were tested as markers for molecularclassification of medulloblastomas by PAM analysis.MiR-376a and miR-10b expression levels were found tobe less consistent within a subgroup and considerably
Kunder et al.: MicroRNAs as markers for medulloblastoma classification
1646 NEURO-ONCOLOGY † D E C E M B E R 2 0 1 3
at AC
TR
EC
on June 5, 2014http://neuro-oncology.oxfordjournals.org/
Dow
nloaded from

Fig. 2. The results of PAM analysis showing the subgroup prediction matrix and the predicted test probabilities of the test set based on the
expression profile of 12 protein-coding genes and 9 miRNAs.
Fig. 1. (A) Heat map showingdifferential expression of 12 protein-codinggenesand 9 miRNAs in the101 tumor tissues (2 tumors lacking miRNA
profile excluded). *indicates the tumor tissues classified primarily based on miRNA expression profile. Subgroup assignment based on PAM
analysis using 42 fresh frozen tumor tissues as a training set is indicated above the heat map. (B) The scatter dot plot shows log2 transformed
RQs of the indicated miRNA in the 101 medulloblastomas assigned to the 4 molecular subgroups. The P values given on the top of each
scatter indicates the significance of the differential expression of the marker gene in the 4 subgroups as determined by ANOVA tests.
Kunder et al.: MicroRNAs as markers for medulloblastoma classification
NEURO-ONCOLOGY † D E C E M B E R 2 0 1 3 1647
at AC
TR
EC
on June 5, 2014http://neuro-oncology.oxfordjournals.org/
Dow
nloaded from

low compared with other miRNAs and hence were notincluded as markers for molecular classification. PAManalysis using the set of 101 medulloblastomas as atraining set showed a cross-validation accuracy of 99%.Supplementary Fig. S4 shows a centroid plot of all themarker genes used in the PAM analysis. The set of 42fresh frozen medulloblastoma tissues consisted of 10WNT, 8 SHH, 11 Group 3, and 13 Group 4 cases, whilethe set of 59 FFPE medulloblastomas consisted of 11WNT, 22 SHH, 10 Group 3, and 16 Group 4 medullo-blastomas. Using a training set of 42 fresh frozen medul-loblastomas, all FFPE tumors were accurately classified,with the exception of 2 SHH tumors (Fig. 2A and Cand Fig. 1A). Four out of 5 tumors classified primarilybased on their miRNA profiles due to poor RNAquality were accurately classified by PAM analysis usingboth protein-coding genes and miRNAs. One of these5 tumors belonging to the WNT subgroup was found topossess a mutation in the CTNNB1 gene, confirming itsclassification.
The assay was validated on a set of 34 well-annotatedFFPE medulloblastoma tumor tissues (subgroup assign-ment based on NanoString assay)22 from DKFZ. TheRNAs of this set of tumor tissues were analyzed for ex-pression of the 12 protein-coding genes and 9 miRNAsby the present real-time PCR assay (SupplementaryFig. S5). PAM analysis using the training set of 42 freshfrozen tumor tissues accurately classified all DKFZFFPE tissues, with the exception of a single Group 4tumor misclassified as a Group 3 tumor (Fig. 2B and D).The 2 SHH medulloblastomas that were misclassifiedusing our fresh frozen tumor tissues as a training set
were correctly classified using the DKFZ tumor set fortraining (data not shown). This misclassification is there-fore likely to be due to the insufficient number of SHHtumors in our training set of fresh frozen tumors. Theoverall predicted posterior probabilities for all WNTand 31 of 33 SHH tumors were ≥0.9. Twenty-six of29 Group 4 tumors and 14 of 18 Group 3 tumors hadpredicted posterior probabilities ≥0.8 (Fig. 2C and D).The present real-time RT-PCR assay thus had an overallaccuracy of 97% with an area under the ROC curve of1.00 for all 4 subgroups.
Demographic Analysis
Of the 103 medulloblastomas studied, 23 belonged to theWNT subgroup, 30 to the SHH subgroup, 21 to Group 3,and 29 to Group 4 (Fig. 3A). The overall median age of thecohort was 9 years (range, ,1–45 y). Tumors in children,3 years of age were SHH (67%) and Group 3 (33%).Those in older children (.8 y) were primarily Group 4(40%) and WNT (40%). Tumors in adult patients (≥18y) were SHH (65%) and WNT (35%; Fig. 3B). Theratio of male to female patients in the WNT subgroupwas lowest, at �1:1, while 40 of 50 cases in Group 3and Group 4 were male patients (Fig. 3C). Most of thetumors studied were of classical histology (79%), fol-lowed by tumors having large cell/anaplastic (10.6%)anddesmoplastic (10.6%)histology.While all thedesmo-plastic tumors belonged to the SHH subgroup, 64% oftumors with large cell/anaplastic histology were Group3 (Fig. 3D).
Fig. 3. (A) The demographic distribution of the 4 molecular subgroups in the present cohort; (B) subgroup distribution with respect to the age at
diagnosis; (C) gender; (D) histological variants. The numbers indicate the number of tumors in each category.
Kunder et al.: MicroRNAs as markers for medulloblastoma classification
1648 NEURO-ONCOLOGY † D E C E M B E R 2 0 1 3
at AC
TR
EC
on June 5, 2014http://neuro-oncology.oxfordjournals.org/
Dow
nloaded from

Correlation of the Molecular Subgroups WithOverall Survival
Overall survival data were available for 72 of 103 medul-loblastomas, which were adequately treated per standardpractice. The patients who expired within the first monthafter surgery were excluded from the analysis. Kaplan–Meier analysis showed the best survival rate for theWNT subgroup patients, followed by Group 4 and SHHpatients, with the worst survival rate for Group 3 patients(Fig. 4A). The log-rank test showed survival curves to besignificantly different (P ¼ .0046) for the 4 subgroups.The survival analysis of the histological variants showedsignificantly (P ¼ .0017) worse survival rates for thetumors with large cell/anaplastic histology comparedwith those with classic or desmoplastic histology(Fig. 4B). The survival curve of patients ,3 years of agewas not found to be significantly different from that ofpatients older than 3 years of age, possibly due to thelack of sufficient number of cases (data not shown).Within the SHH subgroup, tumors with MYCN overex-pression comparable to MYCN amplification levelswere found to have significantly (P ¼ .0185) poorersurvival rates (Fig. 4C). In the combined cohort ofGroup 3 and Group 4 medulloblastomas, tumors withmiR-592 overexpression were found to have significantly
(P ¼ .0060) better survival rates, while those withmiR-182 overexpression were found to have significantly(P ¼ .0422) worse survival rates (Fig. 4E and F). The dif-ference in the survival rates of non-WNT, non-SHHtumors having miR-592 overexpression from thoselacking the overexpression is comparable to the differencein the survival rates of Group 3 versus Group 4 medullo-blastomas (Fig. 4D).
Discussion
In the present study,differential expressionof11miRNAsin the 4 molecular subgroups was validated in a set of 101medulloblastomas that confirmed the distinctive miRNAsignature of WNT medulloblastomas. Reliable classifica-tion of medulloblastomas into the 4 molecular subgroupswas demonstrated using a set of 12 protein-coding genesand 9 miRNAs as markers by a real-time RT-PCR basedassay with an overall accuracy of 97%. Molecular classi-fication based on the 9 miRNAs alone was found to haveaccuraciesof100%,93.3%,85.7%,and100%forWNT,SHH, Group 3, and Group 4, respectively, in cross-validation analysis by PAM using the set of 101 medullo-blastomas (data not shown). MicroRNAs thereforeserved as useful markers for the molecular subgrouping
Fig. 4. Overall survival analysis of (A) 4 molecular subgroups; (B) histological variants; (C) SHH subgroup tumors with and without MYCN
overexpression; (D) Group 3 vs Group 4 tumors; (E) non-SHH, non-WNT tumors with or without miR-592 overexpression; (F) non-SHH,
non-WNT tumors with or without miR-182 overexpression. P value indicates level of significant difference in the Kaplan–Meier survival
curves estimated by the log-rank test.
Kunder et al.: MicroRNAs as markers for medulloblastoma classification
NEURO-ONCOLOGY † D E C E M B E R 2 0 1 3 1649
at AC
TR
EC
on June 5, 2014http://neuro-oncology.oxfordjournals.org/
Dow
nloaded from

of FFPE tumor tissues, wherein RNA is fragmented, re-sulting in less reliable evaluation of the expression ofprotein-coding genes. MiRNA expression levels helpedparticularly in the classification of the tumor tissues forwhich GAPDH Ct values were closer to 30, wherein theexpression levels of protein-coding genes could not becompletely relied upon. In the case of tumor tissues forwhich Ct values were in the range of 32 and higher forGAPDH, miRNA expression levels also became unreli-able (data not shown).
The real-time RT-PCR assay based on the expressionof 12 protein-coding genes and 9 miRNAs is comparableto the reported 98% accuracy of the NanoString assayusing 22 subgroup-specific protein-coding genes asmarkers.22 The PCR technology, being highly sensitive,allows analysis of the expression levels of protein-codinggenes and miRNAs from FFPE tissues having consider-able RNA degradation. The present assay is rapid and in-expensive and is based on real-time PCR technology thatis now commonly available in molecular pathology labsaround the world.
The study was performed on medulloblastomas froman Indian cohort. WNT, SHH, Group 3, and Group 4 ac-counted for 22.3%, 29.13%, 20.39%, and 28.16%, re-spectively, of the tumor tissues as against the reportedincidences of 11%, 28%, 27%, and 34% based on themeta-analysis of the medulloblastoma data from theAmerican and European subcontinents.23 The WNT sub-group was found to be prevalent in older children (61%)and adults (26%). The SHH cases occurred across all agegroups, with predominance in infants (27%), youngerchildren (27%), and adults (37%). Group 3 cases werefound predominantly in younger children (60%) andinfants (20%), with none among adults. Group 4 caseswere distributed almost equally in younger (52%) andolder (48%) children, with no cases in infants andadults. The age-related incidences of the 4 subgroupsare similar to the data reported.23 Male (n ¼ 70) tofemale (n ¼ 33) ratio in the present cohort was 2.12, con-sistent with the known preferential occurrence of medul-loblastoma in males. The WNT subgroup had almostequal male to female ratio, while the ratio was 1.7 : 1and 2 : 1 for SHH and Group 3, respectively, which is con-sistent with the reported gender representation in thesegroups. Male to female ratio of Group 4 was 9 : 1,which is substantially higher than the reported ratio of2 : 1.23 Age at diagnosis, histology, and gender-related in-cidence and the relative survival rates of the 4 molecularsubgroups in the present Indian cohort were found to besimilar to those reported for the medulloblastomas fromthe American and European subcontinents, suggestinguniform mechanisms of medulloblastoma pathogenesis.The higher incidence of the WNT subgroup and relativelylower incidenceofGroup3 tumors are thereforepartlyex-plained by the higher representation of older children andadults, who together accounted for 51% of the tumors inthe present cohort. Nonetheless, frequency of WNTtumors is much higher than reported so far, even forthese age groups, with as many as 40% of older children
and 35% of adults in the present Indian cohort belongingto the WNT subgroup.
Molecular markers in addition to the molecular sub-grouping are required for further improvement in riskstratification, particularly of the 3 non-WNT subgroups.As reported by several other studies, tumors with largecell/anaplastic histology were found to have significantlypoor survival in the present study, indicating theimportance of histology for risk stratification.23 MYCNamplification has been shown to associate with relativelyinferior survival in the SHH medulloblastomas.23
Accordingly, SHH tumors with MYCN overexpression(MYCN levels comparable to the tumors having MYCNamplification; data not shown) were found to have poorsurvival rates in the present cohort as well. Group 3 andGroup 4 tumors have an overlapping gene expressionprofile but strikingly distinct survival rates. MiR-182was found to be overexpressed in the majority of Group3 tumors, while miR-592 was found to be overexpressedin the majority of Group 4 tumors. Group 3/Group 4medulloblastomas overexpressing miR-182 or underex-pressing miR-592 were found to have significantly pooroverall survival rates. MiR-592 and miR-182 couldtherefore act as surrogate markers for Group 3/Group 4classification and as markers for risk stratification ofnon-WNT, non-SHH FFPE medulloblastomas.
In summary, a real-time RT-PCR based expressionanalysis of 12 protein-coding genes and 9 miRNAsaccurately classified medulloblastomas into 4 molecularsubgroups. The miRNA based classification was foundto be particularly useful for FFPE tumor tissues, asmiRNAs are known to be relatively resistant to fragmen-tation during formalin fixation. Further, the inclusion ofoncogenes like MYCN and miRNAs like miR-182 andmiR-592 in the assay not only helps in classification butcan also help in risk stratification. Further study on alarger dataset would be necessary to confirm the role ofmiRNAs in prognostication.
Supplementary Material
Supplementary material is available online at Neuro-Oncology (http://neuro-oncology.oxfordjournals.org/).
Funding
This work was supported by the Indian Council ofMedical Research, New Delhi.
Acknowledgments
We thank Anant Sawant, Umesh Kadam, ShreyasBhat, and Vijay Padul for the technical assistance andDr Rajani Joshi, Indian Institute of Technology,Mumbai, for assistance in the statistical analysis.
Conflict of interest statement. None declared.
Kunder et al.: MicroRNAs as markers for medulloblastoma classification
1650 NEURO-ONCOLOGY † D E C E M B E R 2 0 1 3
at AC
TR
EC
on June 5, 2014http://neuro-oncology.oxfordjournals.org/
Dow
nloaded from
References
1. Bourdeaut F, Miquel C, Alapetite C, Roujeau T, Doz F. Medulloblastomas:
update on a heterogeneous disease. Curr Opin Oncol. 2011;23:
630–637.
2. Rossi A, Caracciolo V, Russo G, Reiss K, Giordano A. Medulloblastoma:
from molecular pathology to therapy. Clin Cancer Res. 2008;14:
971–976.
3. Kool M, Koster J, Bunt J, et al. Integrated genomics identifies five medul-
loblastomasubtypeswithdistinctgeneticprofiles,pathwaysignaturesand
clinicopathological features. PLoS ONE. 2008;3:e3088.
4. Northcott PA, Korshunov A, Witt H, et al. Medulloblastoma comprises
four distinct molecular variants. J Clin Oncol. 2011;29:1408–1414.
5. Cho YJ, Tsherniak A, Tamayo P, et al. Integrative genomic analysis of me-
dulloblastoma identifies a molecular subgroup that drives poor clinical
outcome. J Clin Oncol. 2011;29:1424–1430.
6. Taylor MD, Northcott PA, Korshunov A, et al. Molecular subgroups
of medulloblastoma: the current consensus. Acta Neuropathol.
2012;123:465–472.
7. Northcott PA, Korshunov A, Pfister SM, Taylor MD. The clinical implica-
tions of medulloblastoma subgroups. Nat Rev Neurol. 2012;8:340–351.
8. Ambros V. MicroRNA pathways in flies and worms: growth, death, fat,
stress, and timing. Cell. 2003;113:673–676.
9. Murchison EP, Hannon GJ. miRNAs on the move: miRNA biogenesis and
the RNAi machinery. Curr Opin Cell Biol. 2004;16:223–229.
10. Croce CM, Calin GA. miRNAs, cancer, and stem cell division. Cell.
2005;122:6–7.
11. Iorio MV, Croce CM. microRNA involvement in human cancer.
Carcinogenesis. 2012;33:1126–1133.
12. Calin GA, Croce CM. MicroRNA signatures in human cancers. Nat Rev
Cancer. 2006;6:857–866.
13. Hall JS, Taylor J, Valentine HR, et al. Enhanced stability of microRNA
expression facilitates classification of FFPE tumour samples exhibiting
near total mRNA degradation. Br J Cancer. 2012;107:684–694.
14. Xi Y, Nakajima G, Gavin E, et al. Systematic analysis of microRNA
expression of RNA extracted from fresh frozen and formalin-fixed
paraffin-embedded samples. Rna. 2007;13:1668–1674.
15. LiuA,TetzlaffMT,VanbelleP,et al.MicroRNAexpressionprofilingoutper-
forms mRNA expression profiling in formalin-fixed paraffin-embedded
tissues. Int J Clin Exp Pathol. 2009;2:519–527.
16. Gokhale A, Kunder R, Goel A, et al. Distinctive microRNA signature of
medulloblastomas associated with the WNT signaling pathway.
J Cancer Res Ther. 2010;6:521–529.
17. Korbler T, Grskovic M, Dominis M, Antica M. A simple method for RNA
isolation from formalin-fixed and paraffin-embedded lymphatic tissues.
Exp Mol Pathol. 2003;74:336–340.
18. Chomczynski P, Sacchi N. Single-step method of RNA isolation by acid
guanidinium thiocyanate-phenol-chlorofrom extraction. Anal Biochem.
1987;162:156–159.
19. Tibshirani R, Hastie T, Narasimhan B, Chu G. Diagnosis of multiple cancer
types by shrunken centroids of gene expression. Proc Natl Acad Sci U S A.
2002;99:6567–6572.
20. Northcott PA, Fernandez LA,Hagan JP, et al. The miR-17/92 polycistron is
up-regulated in sonichedgehog-drivenmedulloblastomasand inducedby
N-myc in sonic hedgehog-treated cerebellar neural precursors. Cancer
Res. 2009;69:3249–3255.
21. Glazov EA, McWilliam S, Barris WC, Dalrymple BP. Origin, evolution, and
biological role of miRNA cluster in DLK-DIO3 genomic region in placental
mammals. Mol Biol Evol. 2008;25:939–948.
22. Northcott PA, Shih DJ, Remke M, et al. Rapid, reliable, and reproducible
molecular sub-grouping of clinical medulloblastoma samples. Acta
Neuropathol. 2012;123:615–626.
23. Kool M, Korshunov A, Remke M, et al. Molecular subgroups of
medulloblastoma: an international meta-analysis of transcriptome,
genetic aberrations, and clinical data of WNT, SHH, Group 3, and Group
4 medulloblastomas. Acta Neuropathol. 2012;123:473–484.
Kunder et al.: MicroRNAs as markers for medulloblastoma classification
NEURO-ONCOLOGY † D E C E M B E R 2 0 1 3 1651
at AC
TR
EC
on June 5, 2014http://neuro-oncology.oxfordjournals.org/
Dow
nloaded from

521Journal of Cancer Research and Therapeutics - October-December 2010 - Volume 6 - Issue 4
Amit Gokhale, Ratika Kunder, Atul Goel1, Rajiv Sarin, Aliasgar Moiyadi, Asha Shenoy2, Chandrasekhar Mamidipally3, Santosh Noronha3, Sadhana Kannan, Neelam Vishwanath Shirsat
AdvancedCentreforTreatment,ResearchandEducationinCancer,TataMemorialCentre,Kharghar,NaviMumbai410210,1DepartmentsofNeurosurgeryand2Pathology,SethG.S.MedicalCollegeandK.E.M.Hospital,Parel,Mumbai400012,3DepartmentofChemicalEngineering,SchoolofBioscienceandBioengineering,SystemsandControl,IndianInstituteofTechnology,Mumbai400076,Maharashtra,India
For correspondence:Dr.NeelamVishwanathShirsat,AdvancedCentreforTreatment,ResearchandEducationinCancer,TataMemorialCentre,Kharghar,NaviMumbai410210,Maharashtra,India.E-mail:[email protected]
Distinctive microRNA signature of medulloblastomas associated with the WNT signaling pathway
ABSTRACTAim: Medulloblastoma is a malignant brain tumor that occurs predominantly in children. Current risk stratification based on clinical parameters is inadequate for accurate prognostication. MicroRNA expression is known to be deregulated in various cancers and has been found to be useful in predicting tumor behavior. In order to get a better understanding of medulloblastoma biology, miRNA profiling of medulloblastomas was carried out in parallel with expression profiling of protein-coding genes.
Materials and Methods: miRNA profiling of medulloblastomas was carried out using Taqman Low Density Array v 1.0 having 365 human microRNAs. In parallel, genome-wide expression profiling of protein-coding genes was carried out using Affymetrix gene 1.0 ST arrays.
Results: Both the profiling studies identified four molecular subtypes of medulloblastomas. Expression levels of select protein-coding genes and miRNAs could classify an independent set of medulloblastomas. Twelve of 31 medulloblastomas were found to overexpress genes belonging to the canonical WNT signaling pathway and carry a mutation in CTNNB1 gene. A number of miRNAs like miR-193a, miR-224/miR-452 cluster, miR-182/miR-183/miR-96 cluster, and miR-148a having potential tumor/metastasis suppressive activity were found to be overexpressed in the WNT signaling associated medulloblastomas. Exogenous expression of miR-193a and miR-224, two miRNAs that have the highest WNT pathway specific upregulation, was found to inhibit proliferation, increase radiation sensitivity and reduce anchorage-independent growth of medulloblastoma cells.
Conclusion: Expression level of tumor/metastasis suppressive miRNAs in the WNT signaling associated medulloblastomas is likely to determine their response to treatment, and thus, these miRNAs would be important biomarkers for risk stratification within the WNT signaling associated medulloblastomas.
KEY WORDS: Medulloblastoma, miRNA profile, molecular subtype, WNT signalling
Original Article
INTRODUCTION
Medulloblastoma is a highly malignant brain tumor that occurs predominantly in children. Medulloblastomas are located in the cerebellar region of the brain and have a tendency to spread through the cerebrospinal fluid. Therefore, standard post-operative treatment not only includes local radiotherapy but also craniospinal radiation and chemotherapy.[1,2] One-third of the patients are incurable, while the long term survivors suffer from permanent neurological deficits resulting from the intensive therapies administered to the developing child brain. All medulloblastomas are classified pathologically as grade IV tumors. Molecular markers for risk stratification are required, so that standard risk patients can be spared from excessive treatment and survival of high risk patients can be improved. Understanding of the molecular mechanism/s underlying the pathogenesis of medulloblastomas is crucial for designing novel targeted therapies, which could be more effective
and free of undesirable side effects.
Most microRNA expression analyses of human cancers have arrived at the common conclusions that miRNAs are deregulated in cancer, and miRNA expression profile represents tumor biology better than the expression profile of protein-coding genes.[3,4] In order to get a better understanding of medulloblastoma biology, miRNA profiling of medulloblastomas was carried out using Taqman Low Density array v 1.0 having 365 human microRNAs. In parallel, genome-wide expression profiling of protein-coding genes was carried out using Affymetrix gene 1.0 ST arrays. Both the profiling studies segregate medulloblastoma tumor tissues into almost identical molecular subtypes.
MATERIALS AND METHODS
Tu m o r t i s s u e s p e c i m e n s o f s p o r a d i c medulloblastomas and normal cerebellar tissues were procured with the approval of the Institutional
Access this article onlineWebsite: www.cancerjournal.netDOI: 10.4103/0973-1482.77072 PMID: ***Quick Response Code:
[Downloaded free from http://www.cancerjournal.net on Tuesday, November 05, 2013, IP: 14.139.127.177] || Click here to download free Android application for thisjournal
Avinash K
Rectangle
522 Journal of Cancer Research and Therapeutics - October-December 2010 - Volume 6 - Issue 4
Review Board after getting informed consent from the patients. Immediately following surgery, tumor tissues were snap-frozen in liquid nitrogen and stored at −70°C. Normal cerebellum tissues were obtained from the Brain Tissue Repository, National Institute of Mental Health and Neurosciences, Bangalore, India.
Total RNA was extracted from tumor tissues using mirVANA kit Ambion, Austin, TX, USA, as per the manufacturer’s protocol after ensuring at least 80% tumor cell content. Normal cerebellar tissues labeled NC01 and NC02 were from 6-month and 2-month old infants, while NC03 and NC04 were from 4-year and 35-year old males, respectively. Total RNA (100 ng) was reverse transcribed using stem-loop RT primer pools from Applied Biosystems (Foster City, CA, USA). Polymerase chain reactions (PCRs) were carried out using the Taqman Low Density Arrays v 1.0 on ABI 7900HT Fast real time RT-PCR system. Relative quantities (RQ) of each miRNA in each of the tissue samples as compared to the endogenous control small RNA RNU48 were computed by comparative Ct method.
Total RNA extracted, as described before, was further purified using RNeasy columns (Qiagen,Valencia, CA,USA), as per the manufacturer’s instructions. RNAs having more than 7.0 RIN value and no detectable genomic DNA contamination were used for the analysis (Bioanalyzer, Agilent Technologies, Palo Alto, CA, USA). RNA (100 ng) was reverse transcribed, amplified, and labeled with biotin using the whole transcript sense target labeling kit and hybridized to gene 1.0 ST arrays (Affymetrix, Santa Clara,CA, USA), as per the manufacturer’s instructions.
Data normalization was done using GCRMA algorithm in the Bioconductor package of the R statistical environment (http://www.bioconductor.org). Protein-coding genes and miRNAs significantly differentially expressed in each cluster were identified by Significance Analysis of Microarrays (SAM) analysis and t-test, respectively (http://www.TM4.org). Hierarchical clustering and bootstrap analysis steps were implemented using MeV module of TM4 package (http://www.TM4.org). miRNA target prediction common to at least four different target prediction softwares was done using miRecords database (http://www.mirecords.umn.edu). Pathway identification and functional classification of differentially expressed genes and that of predicted targets of miRNAs was done using DAVID tool (http://david.abcc.ncifcrf.gov).
The differential expression of a select set of protein-coding genes and miRNAs was confirmed by real time RT-PCR analysis. Total RNA (500 ng) was treated with amplification grade RNase-free DNase (Invitrogen, Carlsbad, CA, USA) and reverse transcribed using MMLV-RT (MBI Fermentas, Burlington, Canada). Primers were designed such that they correspond to two adjacent exons, and wherever possible, were located at exon boundaries to avoid amplification of genomic DNA. Expression was analyzed by SYBR Green assay using GAPDH as a housekeeping gene control. Expression of each miRNA was analyzed using specific Taqman assay. Each assay was validated using RNA expressing specific
miRNA as a positive control and RNA (no RT) as a negative control. RNU48 was used as an endogenous control RNA. Relative expression levels were quantified by comparative Ct method. Analysis was also done using RNU44 as an endogenous control for confirmation (data not shown). Supplementary Table 1 lists sequences of the primers used.
Human medulloblastoma cell line Daoy (ATCC, Manassas, VA, USA) was grown in Dulbecco’s Modified Eagle Medium DMEM supplemented with 10% fetal bovine serum (FBS) (Invitrogen, Carlsbad, CA, USA) in a humidified atmosphere of 5% CO
2. Daoy
cells were transfected with 100 nM of miR-193a mimic, miR-224 mimic, or miR-23b mimic using Dharmafect 2 reagent, as per the manufacturer’s protocol (Dharmacon, Lafayette, CO, USA) for a period of 48 h. miRNA levels in transfected cells were estimated by real time RT-PCR analysis using RNU48 as an endogenous control RNA. As a negative control, Daoy cells were transfected with 100 nM of siGLO (a RISC-free control siRNA) or siRNA negative control (Dharmacon, Lafayette, CO, USA). microRNA mimic negative controls from Dharmacon were found to affect proliferation of Daoy cells. The transfected cells were allowed to recover for a period of 24 h before analyzing their growth characteristics. For MTT reduction assay, miRNA transfected Daoy cells were plated at a density of 500 cells/well of a 96-well microtiter plate.[5] Growth of these cells was followed over a period of 8 days with replenishment of the medium every 3rd day. 20 μl of MTT (5 mg/ml) was added to each well at the end of the incubation period and the cells were incubated further for a period of 4 h. 100 μl of 10% sodium dodecyl sulfate (SDS) in 0.01 N HCl was added per well to dissolve the dark blue formazan crystals. Optical density was read on an Enzyme-linked immunosorbent assay (ELISA) reader at a wavelength of 540 nm with a reference wavelength of 690 nm.
For thymidine incorporation assay, 2500 miRNA transfected cells were plated per well of a 96-well microtiter plate. The cells were incubated in the presence of 1 μCi of tritiated thymidine (specific activity 240 Gbq/mmole, Board of Radiation and Isotope Technology, Navi Mumbai, India) per well for a period of 20 h before harvesting by trypsinization. Tritiated thymidine incorporated was estimated by scintillation counting. Radiation sensitivity of the miRNA transfected cells was studied by clonogenic assay. 1000 miRNA transfected cells were plated per 55 mm plate and then irradiated at a dose of 6 Gy (Cobalt-60 gamma irradiator, developed by Bhabha Atomic Research Centre, India). The medium was changed 24 h later and the cells were allowed to grow for 6-8 days until microscopically visible colonies formed. The cells were fixed by incubation in chilled methanol/acetic acid and the colonies were visualized by staining with 0.5% crystal violet.
Anchorage-independent growth of the miRNA transfected cells was studied by their potential to form colonies in soft agar. 10,000 cells were seeded in DMEM/10% FBS medium containing 0.3% agarose. The cells were seeded onto a basal layer containing 1% agarose. The cells were incubated for
Gokhale, et al.: miRNA signature of WNT signaling associated medulloblastomas
[Downloaded free from http://www.cancerjournal.net on Tuesday, November 05, 2013, IP: 14.139.127.177] || Click here to download free Android application for thisjournal

523Journal of Cancer Research and Therapeutics - October-December 2010 - Volume 6 - Issue 4
about 3-4 weeks and the colonies formed were counted. All the experiments were performed in triplicates. Student’s t-test was performed to evaluate statistical significance of the difference in the performance of miRNA-transfected cells as compared to siGLO or siRNA negative control transfected cells.
RESULTS
Gene expression profiling of 19 medulloblastoma tumor tissues was done using Affymetrix gene 1.0 ST array that contains probe sets for 28,869 genes. Unsupervised hierarchical clustering using 1000 most differentially expressed genes segregates tumor tissues into four clusters, viz. ‘A’, ‘B’, ‘C’, and ‘D’ with a bootstrap support of 100% for each cluster [Figure 1A]. Hierarchical clustering of medulloblastomas using the most significantly differentially expressed genes (FDR < 1%) is shown in Supplementary Figure 1.
Of the 365 miRNAs studied, 216 were found to be expressed in medulloblastomas. Hierarchical unsupervised clustering using these 216 miRNAs segregates tumors into clusters/subtypes similar to those identified by expression profiling of protein-coding genes [Figure 1B]. Figure 2 is a heat map depicting the expression of selected miRNAs that are significantly differentially expressed in the four medulloblastoma subtypes and normal cerebellar tissues. The protein-coding genes and the miRNAs significantly differentially expressed in each subtype are listed in Supplementary Tables 2 and 3, respectively. Real-time PCR analysis confirmed the expression of selected set of protein-coding genes and miRNAs in the four molecular subtypes. Molecular subtyping of an independent set of 12 medulloblastomas was done by analyzing the expression of these selected marker genes and miRNAs [Figure 3].
Subtype A (six tumors) is characterized by the overexpression of a number of genes involved in the canonical WNT signaling pathway like WIF1, DKK1, DKK2, DKK4, AXIN2, LEF1, NKD1, and MYC. Based on the overexpression of WIF1 and GABRE, six out of 12 tumors from an independent set of medulloblastomas were found to belong to subtype A [Figure 3]. WNT pathway activation in these tumors was confirmed by sequencing exon 3 of CTNNB1 gene that codes for the N-terminal region of β-catenin protein. A point mutation was found in all 12 subtype A tumors that modified either the serine residues S33 or S37 which get phosphorylated or the neighboring D32 or I35 residue in the N-terminal region of the β-catenin protein [Supplementary Figure 2].[6]
Subtype A has the most robust miRNA signature with 16 miRNAs differentially expressed as compared to the normal cerebellar tissues as well as all other subtypes [Table 1]. A number of miRNAs like miR-193a, miR-224/miR-452 cluster, miR-182/miR-183/miR-96 cluster, miR-365, miR-135a, miR-148a, miR-23b/miR-24/miR-27b cluster, miR-204, miR-146b, miR-449/miR-449b cluster, miR-335, and miR-328 are overexpressed by 3-100 fold almost exclusively in tumors associated with the WNT signaling pathway [Figure 2 and Supplementary Table 3]. Real time RT-PCR analysis confirmed significant overexpression of miR-224, miR-193a, miR-365, miR-148a, miR-182, and miR-23b in the WNT signaling associated medulloblastomas [Figure 3]. miR-224 and miR-452 belong to a single cluster located in the intron of GABRE gene coding for GABA receptor. The gene GABRE and miR-224/miR-452 are specifically expressed in subtype A tumors. miR-224 cluster, therefore, appears to be co-expressed with GABRE gene. GABRE is overexpressed exclusively in all nine tumors having WNT pathway activation of Kool et al., data set as well.[7]
Three tumors show overexpression of SHH signaling components that include HHIP, ATOH1, MYCN, PTCH1, and GLI2. One tumor from the additional set belongs to subtype B as it shows overexpression of MYCN and ATOH1. All four subtype B tumors underexpress TRPM3 gene and miR-204 as well as miR-135b [Figure 3, Table 1]. Two of the B subtype tumors, HMED13
Figure 1: (A) Bootstrap analysis of microarray profiling data of medulloblastomas using 1000 most differentially expressed genes. (B) Bootstrap analysis of miRNA profiling data of 19 medulloblastomas and 4 normal cerebellar tissues done using 216 miRNAs expressed in medulloblastoma tumor tissues. Analysis was done on log 2 transformed microarray data and log 10 transformed miRNA RQ values
Gokhale, et al.: miRNA signature of WNT signaling associated medulloblastomas
[Downloaded free from http://www.cancerjournal.net on Tuesday, November 05, 2013, IP: 14.139.127.177] || Click here to download free Android application for thisjournal

524 Journal of Cancer Research and Therapeutics - October-December 2010 - Volume 6 - Issue 4
and HMED22, show overexpression of MYCNOS. MYCNOS is a MYCN related gene that is expressed from the DNA strand complementary to the MYCN coding strand. MYCNOS and MYCN are known to be co-expressed in MYCN amplified tissues. A 30-60 fold increase in copy number of MYCN gene was confirmed by real-time PCR analysis of genomic DNA from these two tumors (data not shown). miR-23b, miR-27b and miR-24 belong to a single miRNA cluster that is located in an intron of C9orf3 gene. Two subtype B tumors lacking MYCN amplification overexpress C9orf3 and miR-23b, while the two having MYCN amplification underexpress miR-153. C9orf3 and miR-23b cluster miRNAs are overexpressed in all subtype A tumors of our data set as well as Kool et al., data set. C9orf3 is overexpressed in 8 out of 15 subtype B tumors of Kool et al., data set.[7]
Remaining 10 medulloblastomas segregate into cluster C (2 tumors) and cluster D (8 tumors). Non-WNT, non-SHH subtype medulloblastomas in Kool et al., study segregate into three subtypes, viz. C, D and E, with overlapping gene signature.[7] The genes specifically expressed in tumors belonging to C, D and E subtypes of Kool et al., data set as well as those belonging to C and D subtypes of our data set include transcription factors involved in brain development, viz. EOMES and FOXG1B, a testes
Figure 2: Heat map showing miRNAs significantly differentially expressed in molecular subtypes of medulloblastomas. Subtype /group: A = blue, B = green, C = red, D1 = pink, D2 = purple; sex: female = pink; male = white; age: less than 3 years = filled box, 3-8 years = white, 9-17 years = blue, 18 years and above = green; metastasis: no metastasis = white, metastasis at diagnosis = brown, recurrent tumor = red
Gokhale, et al.: miRNA signature of WNT signaling associated medulloblastomas
Table 1: Representative miRNAs significantly differentially expressed in each molecular subtype of medulloblastomas as compared to all the other subtypes as well as the normal cerebellar tissues
Clus
ters A B C D
WNT Signaling SHH Signaling ProliferationDifferentiation
DifferentiationProliferation
Mar
kers
WIF1, GABRECTNNB1 (mutation)
ATOH1, MYCN,TRPM3,
miR-135b,miR-204
LEMD1, KHDRBS2, miR-135b
TRPM3, miR-204
GRM8
miR
NAs
up-re
gula
ted
/ dow
n-re
gula
ted
miR-193amiR-183miR-224miR-182miR-452miR-204miR-365miR-135amiR-23bmiR-148amiR-27bmiR-24miR-146bmiR-335miR-98miR-376amiR-127miR-134miR-181dmiR-9miR-181c
71.6858.4050.3045.6039.1314.1310.4310.27
9.939.317.345.974.583.252.940.150.160.180.200.270.35
miR-199amiR-92miR-565miR-135bmiR-204miR-153
3.102.812.290.010.030.09
miR-135b miR-193b
21.48 4.81
miR-18amiR-32miR-204miR-153miR-410miR-487bmiR-433miR-127
4.582.750.010.090.180.200.210.27
let-7cmiR-7mir-27b
2.322.310.32
The number displayed against each miRNA indicates the ratio of the mean expression level of the miRNA in a specific subtype with its mean expression level in all the other subtypes. The underlined text indicates underexpression or downregulation, while the rest indicates overexpression or upregulation
specific gene LEMD1, and genes involved in neuronal migration like UNC5D and EPHA8. Expression of neuronal differentiation related genes in subtypes C and D and the expression of retinal differentiation related genes in subtypes D and E distinguish the three subtypes C, D and E of Kool et al,. data set. Subtype C tumors from our data set overexpress retina-specific genes like CRX, NRL, TULP1, PDE6H and underexpress most neuronal differentiation genes like GRM1, GRM8, MYRIP, thus resembling subtype E of Kool et al., data set. Equivalence of our subtype C to subtype E of Kool et al., data set is supported further by the expression of subtype E specific genes like GABRA5, SMARCD3 as well as the overexpression of cell cycle genes and a number of ribosomal protein coding genes in subtype C tumors of our data set.
Subtype D tumors of our data set express a number of neuronal differentiation genes including those encoding synaptic proteins like MYRIP, SYN2, SYT6, SYT13, those involved in transmission of nerve impulse like GRM1, GRM8, GABARAPL1, GABBR2, GABRG2, as well as genes involved in axon guidance like EPHA6, EPHB1, EFNB1, RND1, RND2, and SEMA3A. None of the subtype D medulloblastomas from our data set overexpress retinal differentiation genes like CRX, NRL, TULP1, and PDE6H. Therefore, subtype D of our data set is equivalent to subtype C of Kool et al., data set.
[Downloaded free from http://www.cancerjournal.net on Tuesday, November 05, 2013, IP: 14.139.127.177] || Click here to download free Android application for thisjournal

525Journal of Cancer Research and Therapeutics - October-December 2010 - Volume 6 - Issue 4
miR-135b is upregulated in tumors belonging to subtypes C and D. miR-135b is located in an intron of LEMD1 gene that is overexpressed in the C and D subtype medulloblastomas. miR-204 and miR-153 are underexpressed in subtype B and C medulloblastomas. miR-204 is located in an intron of TRPM3 gene that is downregulated in B and C subtype tumors. TRPM3 gene is underexpressed in all subtype B and 9 out of 11 subtype E medulloblastomas of Kool et al.,data set.[7]
HMED16 and HMED18 form a sub-cluster of cluster D on hierarchical cluster analysis of microarray profiling data of the protein-coding genes. These tumors segregate into a distinct cluster (D2) on hierarchical cluster analysis of miRNA data. Sub-cluster D2 (two tumors) differs from sub-cluster D1 (six tumors) based only on the overexpression of genes encoding various extracellular matrix proteins and TGF-β signaling components. Gene expression profile of cluster D2 is a characteristic wound healing signature.[8] This wound healing signature is also evident in all cluster B tumors and some cluster A tumors of our data set as well as those of Kool et al., data set. miR-214 and miR-199a are overexpressed in all these tumors having overexpression of wound healing pathway genes.
Five tumors from the additional set belong to subtype C or D as they overexpress LEMD1, KHDRBS2 and miR-135b. Three out of the five tumors most likely belong to subtype C as they underexpress TRPM3, miR-204 and GRM8 (a neuronal differentiation marker). miR-153 is underexpressed in two
out of these three tumors. Thus, overexpression of LEMD1, KHDRBS2 and miR-135b is specific for subtypes C and D, while underexpression of TRPM3, GRM8 and miR-204 further distinguishes subtype C from subtype D [Figure 3 and Table 1].
miR-17-92, a polycistronic miRNA cluster, has been reported to be overexpressed in a wide variety of human cancers. Overexpression of miR-17-92 cluster miRNAs in A, B and C subtype medulloblastomas is consistent with their reported upregulation by MYC, MYCN and E2F transcription factors.[9, 10] Normal adult cerebellums have the least expression of miR-17-92 cluster miRNAs. miR-106b and miR-25, which belong to miR-17-92 paralog cluster, are also overexpressed in all medulloblastomas as compared to the normal cerebellar tissues.
miR-379/miR-656 cluster miRNAs located within an imprinted region on chromosome 14 are underexpressed in subtype A, B and C tumors as compared to normal cerebellar tissues and subtype D tumors.[11] miR-379/miR-656 cluster miRNAs may play a role in neural differentiation as suggested by their predominant expression in the brain. miR-127/miR-432/miR-433 miRNA cluster on chromosome 14 is also similarly underexpressed in subtype A, B and C tumors. miR-127 has been reported to be underexpressed in various other cancers as a result of promoter hypermethylation.[12] miR-124a is also considerably downregulated in A, B and C subtype medulloblastomas and has been shown to promote neural differentiation by triggering brain-specific pre-mRNA alternate splicing.[13]
Figure 3: Confirmation of differential expression of marker protein-coding genes and miRNAs by real time RT-PCR analysis. Y-axis denotes log 10 transformed RQs using GAPDH and RNU48 as housekeeping controls for protein-coding genes and miRNAs, respectively. Subtype A = blue, subtype B = green, subtype C = red, subtype D = pink. Black horizontal lines indicate median value for each cluster. Level of significance as determined by analysis of variance (ANOVA) for the differential expression of each gene/miRNA across the four molecular subtypes is also indicated
Gokhale, et al.: miRNA signature of WNT signaling associated medulloblastomas
[Downloaded free from http://www.cancerjournal.net on Tuesday, November 05, 2013, IP: 14.139.127.177] || Click here to download free Android application for thisjournal

526 Journal of Cancer Research and Therapeutics - October-December 2010 - Volume 6 - Issue 4
To understand the functional significance of miRNAs overexpressed in medulloblastomas associated with WNT signaling activation, three miRNAs, viz. miR-193a, miR-224 and miR-23b, were exogenously expressed in Daoy cell line established from human sporadic medulloblastoma. miR-193a and miR-224 are the most highly and specifically upregulated miRNAs in cluster A tumors, while miR-23b is overexpressed in both A and B subtype tumors. miR-193a and miR-224 expression in Daoy cells is comparable to normal developing cerebellar tissues. miR-23b expression in Daoy cells is higher than that of miR-193a or miR-224, while it is still about four-fold lower than that in normal developing cerebellar tissues. Transfection of 100 nM of miRNA mimics in Daoy cells resulted in 10-100 fold increase in miRNA expression. A 50-100 fold overexpression of miR-193a in Daoy cells resulted in 50-60% growth inhibition, while 10-15 fold overexpression of miR-23b resulted in 1.6-1.8 fold increased proliferation of Daoy cells as judged by thymidine incorporation assay [Figure 4A]. miR-193a induced growth inhibition and miR-23b mediated proliferation stimulation of Daoy cells was also evident on analysis by MTT assay [Figure 4B]. A 10-15 fold miR-224 overexpression, on the
other hand, showed a marginal difference on proliferation of Daoy cells by the thymidine incorporation assay, while the MTT assay demonstrated growth inhibitory effect. Five hundred cells were plated per well for the MTT assay, while 2500 cells/well were plated for the thymidine incorporation assay. It, therefore, appears that the difference in the behavior of miR-224 transfected Daoy cells is likely to be due to the difference in plating density, indicating increased growth factor requirement of miR-224 transfected Daoy cells. This observation is further supported by the fact that plating efficiency of miR-224 transfected Daoy cells was found to be reduced by 50% in clonogenic assay [Figure 5A]. Thus, miR-224 appears to reduce proliferation of Daoy cells in a density-dependent manner. The plating efficiency of miR-193a transfected Daoy cells was found to be reduced by almost 80%, while the plating efficiency of miR-23b transfected Daoy cells did not change significantly from control cells. Irradiation at a dose of 6 Gy resulted in about 70% reduction in the number of colonies formed by control siGLO or siRNA transfected Daoy cells in clonogenic assay. miR-193a overexpressing Daoy cells on irradiation at a dose of 6 Gy failed to form any colonies, while irradiation of miR-224 overexpressing Daoy cells resulted in more
Figure 5: (A) Plating efficiency and radiation sensitivity of miRNA transfected Daoy cells was studied by clonogenic assay. (B) Anchorage-independent growth of miRNA transfected Daoy cells was studied by soft agar colony formation assay. All data points are presented as mean ± standard error (vertical bars)
Gokhale, et al.: miRNA signature of WNT signaling associated medulloblastomas
Figure 4: Growth kinetics of miRNA mimic transfected Daoy cells (A) by thymidine incorporation assay and (B) by MTT assay. Cell growth was followed over a period of 8 days. All data points are presented as mean ± standard error (vertical bars)
[Downloaded free from http://www.cancerjournal.net on Tuesday, November 05, 2013, IP: 14.139.127.177] || Click here to download free Android application for thisjournal

527Journal of Cancer Research and Therapeutics - October-December 2010 - Volume 6 - Issue 4
than 90% reduction in colony formation. No significant change was observed in radiation sensitivity of miR-23b overexpressing Daoy cells [Figure 5A]. miR-224 and miR-193a overexpression in Daoy cells was found to bring about 60 to 90% reduction in soft agar colony formation [Figure 5B]. There was no significant difference in the number of soft agar colonies formed by miR-23b overexpressing cells as compared to siGLO or control siRNA transfected cells.
DISCUSSION
Genome-wide expression profiling of protein-coding and miRNA coding genes identified almost identical four molecular subtypes of medulloblastomas. 38% (12 out of 31) medulloblastomas in our study were found to carry a mutation in CTNNB1 gene and thereby WNT pathway activation. Median age at diagnosis for WNT signaling associated medulloblastomas is reported to be higher (10.4 years) than that reported for medulloblastomas (6 years).[7] Median age at diagnosis of subtype A tumors in our data set is also high (12 years). Four out of 12 medulloblastoma patients belonging to the WNT subtype in our study are adults. Prevalence of SHH signaling associated medulloblastomas is reported in children less than 3 years of age.[7] Lack of medulloblastomas from children less than 3 years of age can explain lower number of medulloblastomas with SHH signaling activation in our data set. Even if SHH signaling associated tumors are not taken into account, medulloblastomas associated with WNT signaling appear to be more common in the Indian subcontinent (38% incidence vs. reported incidence of 10-15%), which needs to be confirmed on a larger data set.[7, 14] Six out of 12 (50%) subtype A tumors belong to female patients, while 5 out of the rest 19 (20%) patients in our data set are females. In Kool et al., data set as well, 44% (4/9) of subtype A tumors as compared to 32% (12/37) of the rest of the medulloblastomas (excluding subtype B tumors) belong to female patients.[7] Prevalence of medulloblastomas resulting from deregulated WNT pathway activation in females over 3 years of age probably explains better survival of female patients in this age group as reported from the retrospective analysis of 1226 medulloblastoma cases.[15]
Medulloblastomas having WNT pathway activation have been reported to have lower metastatic potential and better survival rates.[7,14] One out of 10 informative subtype A patients of our data set had metastasis at the time of diagnosis as compared to 4 out of 13 subtype C and D patients [Supplementary Table 4]. Higher incidence of metastasis at diagnosis in subtype C and D tumors has also been reported by Kool et al.[7] Expression profile of subtype A tumors seems paradoxical to this observation. Subtype A tumors have higher expression of genes encoding ribosomal proteins, cell cycle regulators and genes encoding components of RAS-MAPK, TGF-β and NOTCH signaling pathways as compared to the subtype D tumors. Robust overexpression of a number of miRNAs in subtype A tumors is similar to the robust expression of negative regulators of WNT signaling like WIF1, DKK family genes, AXIN2, NKD1,
NKD2. Many of these miRNAs are likely to be direct/indirect transcriptional targets of mutant β-catenin protein and may target components of WNT signaling machinery. Predicted targets of subtype A specific miRNAs include the WNT signaling components. miR-135a has been shown to target APC and its levels correlate with APC levels in colorectal cancer.[16] APC gene is downregulated in subtype A medulloblastomas. WNT1-inducible signaling pathway protein 2 (WISP2) has been shown to be a direct target of miR-449, another miRNA overexpressed in subtype A tumors.[17]
Overexpression of miR-193a and miR-224, the two most upregulated miRNAs in subtype A tumors, was found to inhibit proliferation, increase radiation sensitivity and inhibit anchorage-independent growth of medulloblastoma cells. Overexpression of miR-224 has been shown to promote apoptosis of hepatocarcinoma cells and API5 has been shown to be a target of miR-224.[18] miR-193a expression has been found to be downregulated in oral squamous cell carcinoma cell lines as a result of tumor-specific hypermethylation of CpG islands and its ectopic expression has been found to be growth inhibitory to these cell lines.[19] miR-193a has been reported to be downregulated in various types of solid tumors in a study that was done on 2532 tumor tissues.[20] miR-23b cluster miRNAs have been shown to inhibit migration of hepatocellular carcinoma cells and inhibit TGF-β signaling by targeting SMAD proteins.[21,22]
Among other miRNAs overexpressed in subtype A tumors, miR-148a has been shown to be downregulated as a result of promoter hypermethylation in cancer cell lines established from lymph node metastasis and further shown to inhibit motility, tumor growth and metastasis on overexpression.[23] Overexpression of miR-183 in lung cancer cells has recently been shown to inhibit migration and invasion of lung cancer cells and Ezrin has been identified as a bonafide target of miR-183.[24] Thus, while the expression of proliferation stimulating and apoptosis inhibitory genes like MYC, CCND1, BIRC5 drives tumorigenesis resulting from activated WNT signaling, expression of miRNAs like miR-193a, miR-224, miR-148a, miR-183 appears to contribute to lower metastatic potential and better response to radiation therapy and thereby better survival rate of these medulloblastomas.
Subtype C medulloblastomas have been reported to have the highest metastatic potential followed by subtype D tumors.[7] miR-135b overexpressed in subtype C and D medulloblastomas has been shown to be upregulated in relapsed prostate cancer patients, indicating the oncogenic nature of this miRNA.[25] miR-124a and miR-137 are known to induce differentiation of glioma stem cells.[26] Relatively higher expression of these miRNAs in subtype D medulloblastomas is consistent with the expression of various differentiation related genes in these tumors. Subtype B and C tumors have lower expression of miRNAs like miR-204 and miR-153 whose predicted targets include components of TGF-β signaling pathway. Ferreti et
Gokhale, et al.: miRNA signature of WNT signaling associated medulloblastomas
[Downloaded free from http://www.cancerjournal.net on Tuesday, November 05, 2013, IP: 14.139.127.177] || Click here to download free Android application for thisjournal

528 Journal of Cancer Research and Therapeutics - October-December 2010 - Volume 6 - Issue 4
al., have reported underexpression of miR-153 in high risk medulloblastomas which are either metastatic or belong to children less than 3 years of age.[27] These high risk tumors are likely to belong to the subtypes B and C. Thus, potential oncogenic miRNA miR-135b is overexpressed while the potential tumor-suppressive miRNAs like miR-204 and miR-153 are underexpressed in C and D subtype tumors having higher metastatic potential.
In summary, genome-wide expression profiling of both protein-coding genes and miRNAs segregates medulloblastomas into four molecular subtypes. These four molecular subtypes closely match the four molecular variants reported in a recent study of genome wide expression profiling coupled with DNA copy number alterations in medulloblastomas.[28] Relative expression levels of a select set of protein-coding genes and miRNAs could successfully identify these molecular subtypes in an independent set of medulloblastomas and thus they can serve as markers for molecular subtyping. A number of miRNAs having potential tumor/metastasis suppressive role were found to be overexpressed in WNT signaling associated medulloblastomas. Exogenous expression of miR-193a and miR-224, two miRNAs that have the highest WNT pathway specific upregulation, was found to inhibit proliferation, increase radiation sensitivity and reduce anchorage-independent growth of medulloblastoma cells. Detailed functional studies on miRNAs differentially expressed in WNT signalling associated medulloblastomas and correlation of their expression with clinical outcome on a larger sample size would indicate if these miRNAs could serve as important biomarkers for risk stratification.
ACKNOWLEDGEMENTS
We are grateful to Prof. David Bowtell for his valuable suggestions and help in microarray profiling. We thank Dr. S. K. Shankar for providing normal cerebellar tissues and Mr. Anant Sawant for technical assistance.
REFERENCES
1. Paulino AC. Current multimodality management of medulloblastoma. Curr Probl Cancer 2002;26:317-56.
2. Packer RJ, Cogen P, Vezina G, Rorke LB. Medulloblastoma: Clinical and biologic aspects. Neuro Oncol 1999;1:232-50.
3. Wu W, Sun M, Zou GM, Chen J. MicroRNA and cancer: Current status and prospective. Int J Cancer 2007;120:953-60.
4. Zhang B, Pan X, Cobb GP, Anderson TA. microRNAs as oncogenes and tumor suppressors. Dev Biol 2007;302:1-12.
5. Mosmann T. Rapid colorimetric assay for cellular growth and survival:application to proliferation and cytotoxic assays. J Immunol Methods 1983;65:55-63.
6. Legoix P, Bluteau O, Bayer J, Perret C, Balabaud C, Belghiti J, et al. Beta-catenin mutations in hepatocellular carcinoma correlate with a low rate of loss of heterozygosity. Oncogene 1999;18:4044-6.
7. Kool M, Koster J, Bunt J, Hasselt NE, Lakeman A, van Sluis P, et al. Integrated genomics identifies five medulloblastoma subtypes with distinct genetic profiles, pathway signatures and clinicopathological features. PLoS One 2008;3:e3088.
8. Chang HY, Sneddon JB, Alizadeh AA, Sood R, West RB, Montgomery K, et al. Gene expression signature of fibroblast serum response predicts human cancer progression: Similarities between tumors and wounds. PLoS Biol 2004;2:E7.
9. Woods K, Thomson JM, Hammond SM. Direct regulation of an oncogenic micro-RNA cluster by E2F transcription factors. J Biol Chem 2007;282:2130-4.
10. Northcott PA, Fernandez LA, Hagan JP, Ellison DW, Grajkowska W, Gillespie Y, et al. The miR-17/92 polycistron is up-regulated in sonic hedgehog-driven medulloblastomas and induced by N-myc in sonic hedgehog-treated cerebellar neural precursors. Cancer Res 2009;69:3249-55.
11. Glazov EA, McWilliam S, Barris WC, Dalrymple BP. Origin, evolution, and biological role of miRNA cluster in DLK-DIO3 genomic region in placental mammals. Mol Biol Evol 2008;25:939-48.
12. Lujambio A, Esteller M. CpG island hypermethylation of tumor suppressor microRNAs in human cancer. Cell Cycle 2007;6:1455-9.
13. Makeyev EV, Zhang J, Carrasco MA, Maniatis T. The MicroRNA miR-124 promotes neuronal differentiation by triggering brain-specific alternative pre-mRNA splicing. Mol Cell 2007;27:435-48.
14. Ellison DW, Onilude OE, Lindsey JC, Lusher ME, Weston CL, Taylor RE, et al. beta-Catenin status predicts a favorable outcome in childhood medulloblastoma: The United Kingdom Children’s Cancer Study Group Brain Tumour Committee. J Clin Oncol 2005;23:7951-7.
15. Curran EK, Sainani KL, Le GM, Propp JM, Fisher PG. Gender affects survival for medulloblastoma only in older children and adults: A study from the Surveillance Epidemiology and End Results Registry. Pediatr Blood Cancer 2009;52:60-4.
16. Nagel R, le Sage C, Diosdado B, van der Waal M, Oude Vrielink JA, Bolijn A, et al. Regulation of the adenomatous polyposis coli gene by the miR-135 family in colorectal cancer. Cancer Res 2008;68:5795-802.
17. Iliopoulos D, Bimpaki EI, Nesterova M, Stratakis CA. MicroRNA signature of primary pigmented nodular adrenocortical disease: Clinical correlations and regulation of Wnt signaling. Cancer Res 2009;69:3278-82.
18. Wang Y, Lee AT, Ma JZ, Wang J, Ren J, Yang Y, et al. Profiling microRNA expression in hepatocellular carcinoma reveals microRNA-224 up-regulation and apoptosis inhibitor-5 as a microRNA-224-specific target. J Biol Chem 2008;283:13205-15.
19. Kozaki K, Imoto I, Mogi S, Omura K, Inazawa J. Exploration of tumor-suppressive microRNAs silenced by DNA hypermethylation in oral cancer. Cancer Res 2008;68:2094-105.
20. Volinia S, Galasso M, Costinean S, Tagliavini L, Gamberoni G, Drusco A, et al. Reprogramming of miRNA networks in cancer and leukemia. Genome Res 2010;20:589-99.
21. Salvi A, Sabelli C, Moncini S, Venturin M, Arici B, Riva P, et al. MicroRNA-23b mediates urokinase and c-met downmodulation and a decreased migration of human hepatocellular carcinoma cells. FEBS J 2009;276:2966-82.
22. Rogler CE, Levoci L, Ader T, Massimi A, Tchaikovskaya T, Norel R, et al. MicroRNA-23b cluster microRNAs regulate transforming growth factor-beta/bone morphogenetic protein signaling and liver stem cell differentiation by targeting Smads. Hepatology 2009;50:575-84.
23. Lujambio A, Calin GA, Villanueva A, Ropero S, Sanchez-Cespedes M, Blanco D, et al. A microRNA DNA methylation signature for human cancer metastasis. Proc Natl Acad Sci U S A 2008;105:13556-61.
24. Wang G, Mao W, Zheng S. MicroRNA-183 regulates Ezrin expression in lung cancer cells. FEBS Lett 2008;582:3663-8.
25. Tong AW, Fulgham P, Jay C, Chen P, Khalil I, Liu S, et al. MicroRNA profile analysis of human prostate cancers. Cancer Gene Ther 2009;16:206-16.
26. Silber J, Lim DA, Petritsch C, Persson AI, Maunakea AK, Yu M, et al. miR-124 and miR-137 inhibit proliferation of glioblastoma multiforme cells and induce differentiation of brain tumor stem cells. BMC Med 2008;6:14.
27. Ferretti E, De Smaele E, Po A, Di Marcotullio L, Tosi E, Espinola MS,
Gokhale, et al.: miRNA signature of WNT signaling associated medulloblastomas
[Downloaded free from http://www.cancerjournal.net on Tuesday, November 05, 2013, IP: 14.139.127.177] || Click here to download free Android application for thisjournal

529Journal of Cancer Research and Therapeutics - October-December 2010 - Volume 6 - Issue 4
Source of Support: Indian Council of Medical Research, India; The Terry Fox Foundation, Canada; Fellowship from the Council
of Scientific and Industrial Research, India., Conflict of Interest: None declared.
Supplementary data files (Figures & Tables) are available on www.cancerjournal.net
et al. MicroRNA profiling in human medulloblastoma. Int J Cancer 2009;124:568-77.
28. Northcott PA, Korshunov A, Witt H, Hielsher T, Eberhart CG, Mack S, et al. Medulloblastoma comprises four distinct molecular variants. J Clin Oncol 2010 [Epub ahead of print].
Gokhale, et al.: miRNA signature of WNT signaling associated medulloblastomas
[Downloaded free from http://www.cancerjournal.net on Tuesday, November 05, 2013, IP: 14.139.127.177] || Click here to download free Android application for thisjournal


![The Molecular Basis and Therapeutic Potential of Let-7 ...downloads.hindawi.com/journals/cjgh/2018/5769591.pdf · microRNA Cancer microRNA- Lung[] microRNA-Neuroblastoma[ ] ... Recent](https://static.fdocuments.us/doc/165x107/604147fde9c3331b744ecb0e/the-molecular-basis-and-therapeutic-potential-of-let-7-microrna-cancer-microrna-.jpg)