Microglia-specific fluorescent probes for live cell imaging · 1 Microglia-specific fluorescent...
19
1 Microglia-specific fluorescent probes for live cell imaging Cheryl Leong, Sung Chan Lee, Jiyeon Ock, Xin Li, Peter See, Sung Jin Park, Florent Ginhoux, Seong-Wook Yun, Young-Tae Chang Supplementary information Supplementary Files Title Materials & Methods Supplementary Figure 1 Screening format overview and microglia hit structures Supplementary Figure 2 LC-MS spectrum of CDr10b. Supplementary Figure 3 1H, 13C-NMR spectrum of CDr10b. Supplementary Figure 4 CDr10b labeling with organelle trackers Supplementary Figure 5 Co-labeling of microglia with other markers Supplementary Figure 6 Microglia viability assay Supplementary Figure 7 Microglia functional assay Supplementary Figure 8 Microglia specificity of CDr10a Supplementary Figure 9 Time-course analysis of CDr10b and CDr10a destaining Supplementary Figure 10 SDS-PAGE of CDr10a- and CDr10b-stained microglia cell lysates Supplementary Figure 11 pH response of CDr10b and CDr10a Electronic Supplementary Material (ESI) for Chemical Communications This journal is © The Royal Society of Chemistry 2013
Transcript of Microglia-specific fluorescent probes for live cell imaging · 1 Microglia-specific fluorescent...

1
Microglia-specific fluorescent probes for live cell imaging
Cheryl Leong, Sung Chan Lee, Jiyeon Ock, Xin Li, Peter See, Sung Jin Park, Florent Ginhoux,
Seong-Wook Yun, Young-Tae Chang
Supplementary information
Supplementary Files Title
Materials & Methods
Supplementary Figure 1 Screening format overview and microglia hit structures
Supplementary Figure 2 LC-MS spectrum of CDr10b.
Supplementary Figure 3 1H, 13C-NMR spectrum of CDr10b.
Supplementary Figure 4 CDr10b labeling with organelle trackers
Supplementary Figure 5 Co-labeling of microglia with other markers
Supplementary Figure 6 Microglia viability assay
Supplementary Figure 7 Microglia functional assay
Supplementary Figure 8 Microglia specificity of CDr10a
Supplementary Figure 9 Time-course analysis of CDr10b and CDr10a destaining
Supplementary Figure 10 SDS-PAGE of CDr10a- and CDr10b-stained microglia cell lysates
Supplementary Figure 11 pH response of CDr10b and CDr10a
Electronic Supplementary Material (ESI) for Chemical CommunicationsThis journal is © The Royal Society of Chemistry 2013

2
Materials & Methods
Synthesis and characterization of CDr10b: The aminophenyl bodipy (10 mg, 32 µmole) and 3-
ethoxy-4-methoxybenzaldehyde (8.6 mg, 48 µmole) were dissolved with acetonitrile (5 mL) in 20 mL
vial and 3 eq. of pyrrolidine and acetic acid were added to reaction mixture. The reaction vial was heated
to 60 ℃ by heating block reactor for 3 hrs. After reaction completion, NaHCO3 saturated solution (50 µL)
and chloroacetylchloride 20 µL were added to reaction mixture. Crude compound was purified by column
chromatography and obtained product was 15 mg. 1H-NMR (CD3OD + CDCl3) δ 8.36 (s, 1H), 7.71 (m, 3H), 7.55 (d, J = 16.0 Hz, 1H), 7.39 (d, J = 8.5 Hz,
2H), 7.33 (d, J = 16.0 Hz, 1H), 7.17 (m, 2H), 6.88 (d, J = 9.0 Hz, 1H), 6.72 (s, 1H), 6.38 (bs, 2H),4.25 (s,
2H), 4.18 (m, 2H), 3.92 (s, 3H), 1.63 (s, 3H), 1.50 (t, J = 7 Hz, 3H), 13C-NMR (CDCl3) δ 165.35, 158.33,
150.99, 148.28, 145.69, 140.13, 138.52, 136.95, 134.65, 129.95, 129.49, 128.76, 122.30, 119.42, 119.12,
115.96, 111.15, 110.86, 64.30, 55.57, 42.66, 29.31, 15.01, 14.22; ESI-MS m/z (M + H) calc’d: 550.18,
found 550.20, 530.20 (M - F)
Synthesis and characterization of CDr10a: 1H-NMR (CD3OD + CDCl3) δ 8.46 (s, 1H), 7.76 (m, 3H),
7.65 (d, J = 16.0 Hz, 1H), 7.43 (d, J = 8.5 Hz, 2H), 7.32 (d, J = 16.0 Hz, 1H), 7.19 (m, 2H), 6.89 (d, J =
9.0 Hz, 1H), 6.75 (s, 1H), 6.39 (bs, 2H), 2H), 4.20 (m, 2H), 3.95 (s, 3H), 2.04(s, 3H), 1.71 (s, 3H), 1.49 (t,
J = 7 Hz, 3H), 13C-NMR (CDCl3) δ 165.45, 159.33, 151.99, 147.28, 146.69, 140.33, 138.55, 136.98,
134.65, 129.95, 129.49, 128.76, 123.30, 119.52, 119.82, 114.96, 112.15, 110.86, 64.30, 55.58, 42.66,
29.51, 15.01, 14.22; ESI-MS m/z (M + H) calc’d: 516.22, found 516.20.
Synthetic Materials & Method: All reactions were performed in oven-dried glassware under a
positive pressure of nitrogen. Unless otherwise noted, starting materials and solvents were purchased
from Aldrich and Acros organics and used without further purification. Analytical TLC was carried out
on Merck 60 F254 silica gel plate (0.25 mm layer thickness) and visualization was done with UV light.
Column chromatography was performed on Merck 60 silica gel (230–400 mesh). NMR spectra were
recorded on a Bruker Avance 300 MHz NMR spectrometer. Chemical shifts are reported as δ in units of
parts per million (ppm) and coupling constants are reported as a J value in Hertz (Hz). Masses of all the
compounds were determined by LC-MS of Agilent Technologies with an electrospray ionization source.
The Phenomenex C18 (50 mm × 4.6 mm, 5 µm) column was used for purity confirmation with 0.1% TFA
containing acetonitrile/water gradient (5% to 100% in 10 min) elution conditions. Spectroscopic
measurements were performed on a fluorometer and a UV/Vis instrument, Synergy 4 of bioteck company
and Gemini XS fluorescence plate reader. The slit width was 1 nm for both excitation and emission.
Relative quantum efficiencies were obtained by comparing the areas under the corrected emission spectra.
The following equation was used to calculate quantum yield.
Electronic Supplementary Material (ESI) for Chemical CommunicationsThis journal is © The Royal Society of Chemistry 2013

3
Φx = Φst(Ix/Ist)(Ast/Ax)(ηx2/ηst
2)
where Φst is the reported quantum yield of the standard, I is the integrated emission spectrum, A is the
absorbance at the excitation wavelength, and η is the refractive index of the solvents used. The subscript
× denotes unknown and st denotes the standard. Rhodamin B was used as a standard and the sample
concentration was 10 µM in DMSO.
pH response: pH response from pH 2 to 12 was measured using 10 µM of CDr10b, CDr10a or pHrodo
(Life technologies) in 50% DMSO/50% pH buffer at the known excitation and emission wavelengths
using a fluorescence plate reader.
Cell culture: Primary brain cultures were generated from the whole brains of postnatal day 1-3 (P1-3)
FVB/N mice by trypsinization and trituration methods in accordance with the animal handling regulations
of our institution. Briefly, fresh brains were incubated with 0.25% trypsin for 1 hour at 37°C, followed by
neutralization with Fetal Bovine Serum (FBS). A single cell suspension was generated by sequential
trituration using pipette tips of decreasing diameter. Finally, the cell suspension was filtered using a 40-
micron strainer. Cells were grown in DMEM/F12 (Gibco) with 10% FBS and 1% penicillin-streptomycin
(Gibco). BV2 and MEF cells were cultured in DMEM + 5% FBS and DMEM + 20% FBS respectively
with 1% penicillin streptomycin (Gibco).
High throughput screening:
Primary neurons and primary astrocyte enriched cultures were generated using the adherence isolation
protocol by Jana et.al8. Primary microglia enriched cultures were generated by adherence methods and
harvested using the mild trypsinization method as described by Saura et.al9. Each cell type isolated by
these methods was 80-90% pure when determined by immunocytochemistry Neuron, astrocyte and
microglia enriched cultures were plated in duplicate on to 384 well plates and incubated with 500 nM of
fluorescent compound for 1hour before image acquisition using the ImageXpress Micro TM high
throughput. A total of 5,000 compounds from a series of DOFL BODIPY libraries were screened.
Immunocytochemistry: Primary neural cells were fixed in 4% PFA and permeabilized with 0.1% Triton-
X (Sigma). Cells were identified using the following markers at the respective dilutions: microglia – Iba
(Wako) 1:500, astrocytes - GFAP (DakoCytomaton) 1:1,000, neurons - β-III-tubulin (Sigma) 1:1,000 and
oligodendrocytes (Millipore) 1:500. For secondary antibody staining, anti- mouse Alexa Fluor 546 IgG,
anti-rabbit Cy5 IgG and anti-mouse Alexa Fluor 488 IgM (Invitrogen) 1:1000 were used. Images were
scored using intensity analysis software MetaXpress® and confirmed by image-based manual analysis
forthe identification of hit compounds. For isolectin staining, isolectin-B4 FITC conjugate (Sigma), 20
µg/µl. was applied to live cells and co-stained with compound respectively.
Electronic Supplementary Material (ESI) for Chemical CommunicationsThis journal is © The Royal Society of Chemistry 2013

4
Fluorescence imaging and processing: Cells were stained with 500 nM of CDr10b or CDr10a for 1
hour followed by 1 hour of washing in fresh media before image acquisition. All fluorescence microscopy
was carried out using the ECLIPSE Ti microscope (Nikon Instruments Inc) on the NIS Elements 3.10
software. For images of organelle localization (mitochondria, lysosomes, endoplasmic reticulum and
golgi), we used the following fluorescent dyes from Life technologies: Mitotracker Green, Lysotracker
green, ER tracker green and Golgi tracker green. Images were acquired using a LSM 5 DUO (inverted)
Laser Scanning Confocal Microscope using a 100X oil objective. Images were deconvoluted using
Hyugen’s Deconvolution. Co-localization analysis was carried out using the Coloc 2 plugin (Version by
Daniel J White, Tom Kazimiers, Johannes Schindelin) in Fiji. Pearson’s coefficient values were average
from analysis done from 3 sets of images with approximately 5-10 cells per image.
Flow cytometry: Primary brain cell cultures were generated from the brains of P1 CX3CR1-GFP pups as
described above. Cells were stained with 500 nM of compound for 1 hour and washed with PBS before
acquisition on the BD LSR II analyzer. Cells were acquired using the appropriate filters for GFP and
Texas Red wavelengths.
Washing and SDS-PAGE: BV2 microglia were stained with 500 nM of CDr10b or CDr10a for 1 hour
and washed for 1 hour with DMEM + 10% FBS or 100% methanol and imaged at the same exposure time
as unwashed cells. For SDS-PAGE, BV2 microglia were stained with 500 nM of CDr10b or CDr10a for
1 hour followed by cell lysis with Cell Lytic M (Sigma). 20 µg of cell lysate was run on 12 % SDS-PAGE
and analyzed using a typhoon fluorescence scanner. The gel was then stained with comassie blue.
Cytotoxicity assays: Cytoxicity assays were carried out using the MTS reagent kit (Promega) on 24h
compound treated BV2 microglia cells in accordance with the manufacturer's instructions.
Real time RT-PCR: Total RNA was isolated from the cells using the RNeasy Mini Kit (QIAGEN Inc.)
according to the manufacturer’s instructions. Gene expression for the cytokines IL-6, TNFα and GAPDH
was measured using the Power SYBR® Green RNA-to-CT™ 1-Step Kit (Applied Biosystem) on a
StepOne™ Real-Time PCR System (Applied Biosystems). mRNA levels of the above mentioned genes
were normalized to GAPDH expression levels using the Q-gene relative expression software tool.
The following primer sequences (5’ to 3’) were used in this study:
mGAPDH-F1 AAGGGCTCATGACCACAGTC
mGAPDH-R1 GGATGCAGGGATGATGTTCT
mTNFα-F1 TAGCCAGGAGGGAGAACAGA
mTNFα-R1 TTTTCTGGAGGGAGATGTGG
Electronic Supplementary Material (ESI) for Chemical CommunicationsThis journal is © The Royal Society of Chemistry 2013

5
mIL-6-F1 CCGGAGAGGAGACTTCACAG
mIL-6-R1 TCCACGATTTCCCAGAGAAC
Nitric oxide assay: BV2 cells were pretreated for 1 hour with 500 nM of CDr10b before addition of 100
ng/μl of LPS or 20U/ml (20 ng/ml) of IFN-γ in fresh media. After incubation for 24 hours, 50 μl of cell
culture media was mixed with an equal volume of Griess reagent (Sigma) in a 96 well plate. Light
absorbance was measured at 540 nm. Nitric oxide concentration was determined by comparison with a
standard curve generated from a titration of sodium nitrite.
Activation intensity measurements by imaging: BV2 cells were activated with 100 ng/μl of LPS for the
stipulated times. One hour before image acquisition 500 nM of CDr10b was added to the cells. Cells
were imaged using flow cytometry or the ImageXpress high throughput system at 20X magnification and
intensity measurements were calculated by intensity based multi-wavelength scoring.
Live cell tracking: For cell tracking, videos were acquired on the Biostation IM (Nikon) at 10X
magnification for 24 hours. For imaging cellular interactions, U251 glioma cells were treated with 10 uM
of camptothecin. After 24 hours, media was replaced and the U251 cells were stained with 500 nM of
Cell Tracker Green (Invitrogen) for 1 hour. BV2 microglia were stained for 1 hour with 500 nM of
CDr10b. After staining, both cell types were washed briefly in fresh media. Stained BV2 microglia were
trypsinized and seeded with the U251 cells. Images were acquired over 36 hours on the Biostation IM
(Nikon) at 20X magnification at intervals of 20 mins.
Live cell washing: BV2 microglia were stained with 500 nM of compound for 2 hours. Cells were then
briefly rinsed with fresh media and imaged using the Biostation IM(Nikon) at 10X magnification for 20
hours at intervals of 15 mins. For the quantification of signal intensity, the Time Series Analyzer plugin
(Balaji, J. 2007) was used. Values were averaged from a set of three regions of interest, each consisting of
3-10 cells.
Protein extraction for LC separation: The compound stained BV2 cells were lyzed with solution
including 0.1% TFA, 5% acetonitrile (ACN). The cells were suspended in the solution and ultrasonicated
for 4 min using 40% power, 6 sec on/ 3 sec off cycle. The lysate was centrifuged for 5 min at maximum
speed to remove the insoluble debris. The protein concentration of the supernatant was measured by
Bradford method.
Off-line LC separation and SDS-PAGE separation: Dionex Ultimate 3000 2D LC system was employed
to fractionate the cell lysate using Dionex ProSwift RP-2H column. The 40 min HPLC gradient consisted
of 100% buffer A (0.1% TFA, 5% ACN) for 2 min; 0−24% buffer B (0.1% TFA, 95% ACN) for 3 min;
Electronic Supplementary Material (ESI) for Chemical CommunicationsThis journal is © The Royal Society of Chemistry 2013

6
24-62% buffer B for 25 min; 62−100% buffer B for 2 min followed by 100% buffer A for 3 min; 100%
buffer A for 5 min. In total 40 fractions were collected. The chromatography was recorded by UV
detector at 214nm and by fluorescence detector at 610nm. The fractions that carry the fluorescent signal
were selected to concentrate to dryness using vacuum centrifuge. The fractions collected and dried from
the LC separation were separate by 4-15% SDS-PAGE gel or 12% SDS-PAGE gel. The gel was scanned
by Typhoon 9400 variable mode imager (Amersham Biosciences, NJ). The gel band carrying fluorescent
signal was cut out for in-gel digestion.
In-gel digestion: The proteins that trapped in the gel pieces was reduced by dithiothreitol (DTT) and
alkylated by iodoacetamide (IAA). Tryptic digestion was performed by using porcine trypsin (Sequencing
Grade Modified, Promega, Wisconsin) overnight. The tryptic peptides were extracted by 5% formic acid
in 50% ACN and vacuum dried by vacuum centrifuge.
Data analysis: The peak list was submitted to Mascot sever for searching against the uniprot_sprot
database. The Mascot dat file was processed by in-house program to select those peptides with score
above 20 and peptides with score above identity score. The peptide number for each protein was
calculated. Proteins were grouped according to the similarity of the sequence.
Electronic Supplementary Material (ESI) for Chemical CommunicationsThis journal is © The Royal Society of Chemistry 2013

7
Cell isolation by differential adhesion – Immunostaining
NB
N
F F
NH
OCl
O
CDr10b
NB
N
F F
NH
O
S
Cl
NB
N
F F
NH2
HN
Br
MG1 MG2
O
Day 0
Seeding of primary neurons into poly-lysine coated wells
Day 3
Seeding of primary astrocytes & microglia
Day 5
Addition of 500 nM of compound for 1h
Tuji GFAP Iba High throughput image based
screening with ImageXpress
imaging system
Hit selection by: • Primary/Secondary/ • Tertiary screening • Image analysis • Flow cytometry
Microglia hit compounds
a
b
NB
N
F F
NH
OCl
O O
NB
N
F F
NH
O
S
Cl
NB
N
F F
NH2
NH
Br
Electronic Supplementary Material (ESI) for Chemical CommunicationsThis journal is © The Royal Society of Chemistry 2013

8
NB
N
F F
NH
O
N
NB
N
F F
NH
O
O
NB
N
F F
NH
O
HN
Cl
Br
N
NB
N
F F
N O
Cl
HN
OCl
Cl
O
NB
N
F F
N OHN
OCl
O
NB
N
F F
NH
O
HO
B1 B2 B3
B4
NB
N
F F
NH
O
HN
B6
NB
N
F F
HN
Br
NH
O
B5
B7 B8
Non-microglia selective compounds c
NB
N
F F
NH
Br
NH
O
Electronic Supplementary Material (ESI) for Chemical CommunicationsThis journal is © The Royal Society of Chemistry 2013

9
Supplementary Figure 1. Screening format overview and microglia hit structures. (a) Schematic
work flow. Image based primary neural screening which employs the use of primary neural cells isolated
from P1-3 mouse pup brain preparations. Cells isolated by the differential adhesion methods were found
to be 80-90% positive for our cell types of interest. Cells were treated in parallel with compounds from
our DOFL and screened using an image-based high throughput screening system. (b) Structures of
microglia hit compounds – CDr10b, MG1 and MG2. (c) Representative structures of non-microglia hit
compounds from our DOFL libraries based on the BODIPY scaffold (d) Representative screening images
and histogram analysis of 2 representative non-microglia selective compounds, B2 and B6 from primary
neurons, astrocytes and microglia . Scale bar, 20 µm.
d
Electronic Supplementary Material (ESI) for Chemical CommunicationsThis journal is © The Royal Society of Chemistry 2013
10
min0 0.5 1 1.5 2 2.5 3 3.5 4 4.5
mAU
0
100
200
300
400
DAD1 D, Sig=560,16 Ref=off (D:\DATA\LSC2\BDNCA1H5.D)
nm450 500 550 600 650
mAU
0
20
40
60
80
100
120
140
DAD1, 3.925 (171 mAU, - ) of BDNCA1H5.D
m/z600
0
20
40
60
80
100
*MSD1 SPC, time=3.935 of D:\DATA
Max: 223232
429.4 699.6 68.4
529.2
548.2
532.2
550.2
530.2
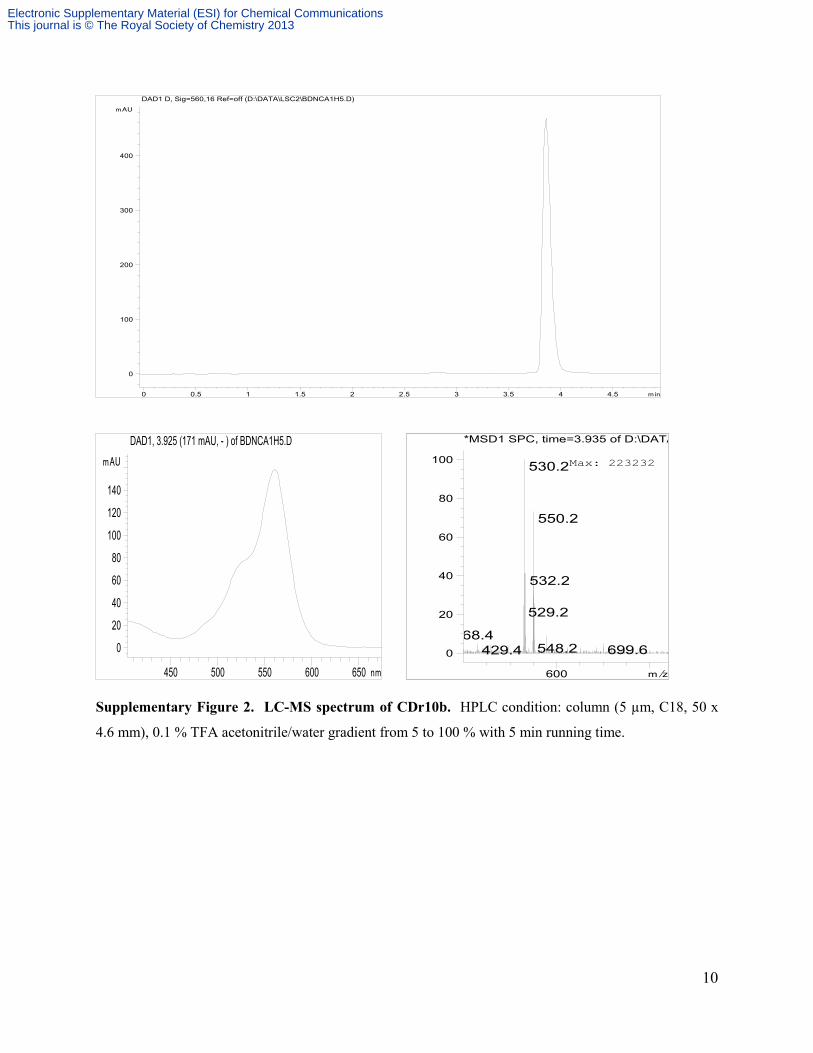
Supplementary Figure 2. LC-MS spectrum of CDr10b. HPLC condition: column (5 µm, C18, 50 x
4.6 mm), 0.1 % TFA acetonitrile/water gradient from 5 to 100 % with 5 min running time.
Electronic Supplementary Material (ESI) for Chemical CommunicationsThis journal is © The Royal Society of Chemistry 2013
11
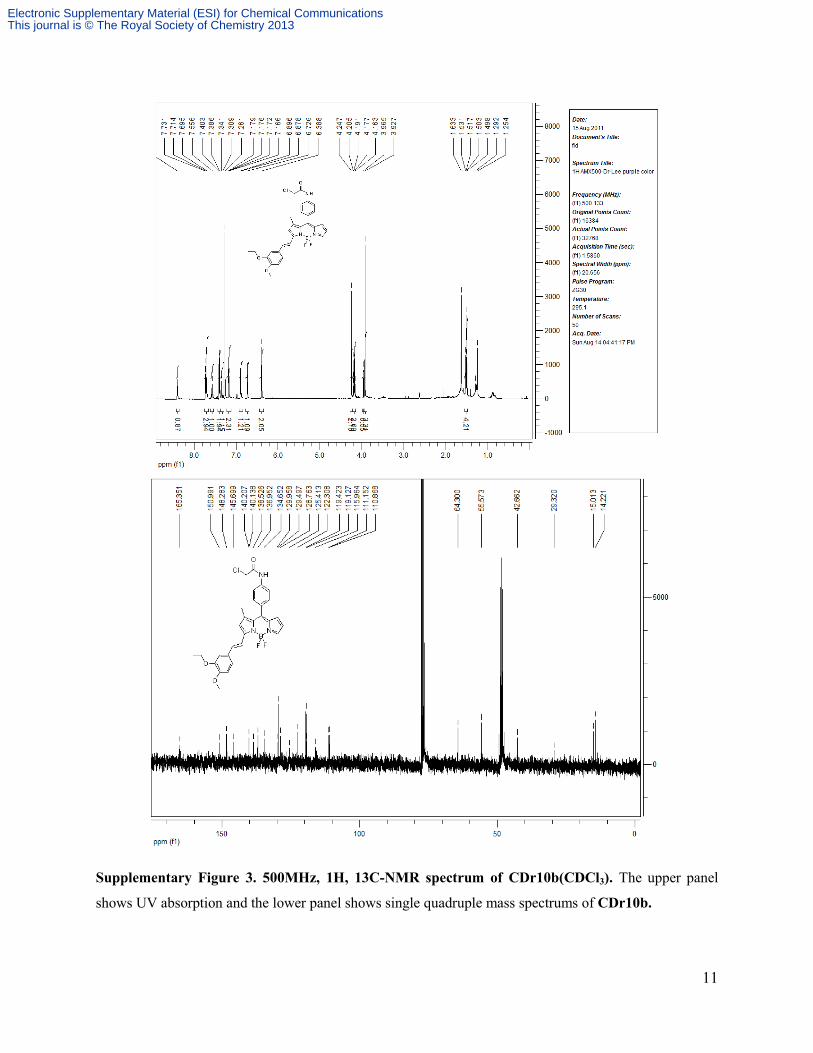
Supplementary Figure 3. 500MHz, 1H, 13C-NMR spectrum of CDr10b(CDCl3). The upper panel
shows UV absorption and the lower panel shows single quadruple mass spectrums of CDr10b.
Electronic Supplementary Material (ESI) for Chemical CommunicationsThis journal is © The Royal Society of Chemistry 2013

12
Supplementary Figure 4. CDr10b labeling with organelle trackers. BV2 microglia were co-stained
with their respective organelle trackers and CDr10b to determine the level of co-localization. Scale bar, 5
µm.
Electronic Supplementary Material (ESI) for Chemical CommunicationsThis journal is © The Royal Society of Chemistry 2013

13
Supplementary Figure 5. Co-labeling of microglia with other markers. (a) Primary microglia
enriched cultures (upper panels) and neuron enriched cultures (lower panels) were stained with 500 nM of
CDr10b and imaged using a Texas red filter. CDr10b shows specificity for primary microglia and does
not stain other primary neural cells. To confirm for cell type, the cells were fixed and immunostained for
the microglia cell surface marker, Iba (green) and the corresponding neuron (β-III-tubulin - yellow),
astrocyte (GFAP - red) and oligodendrocyte (O4 -green) markers. Scale bar, 50 µm. (b) Isolectin B4
(Green) staining of BV2 microglia co-cultured with U251 glioma cells with CDr10b and CD10a (red).
Scale bar, 20 µm.
a
b
Electronic Supplementary Material (ESI) for Chemical CommunicationsThis journal is © The Royal Society of Chemistry 2013

14
Supplementary Figure 6. Microglia viability assay. (a) Cell viability was accessed using an MTS assay
(Promega) on BV2 cells after 24 hours incubation with the respective amounts of CDr10b and CDr10a.
(b) The effect of CDr10b (500 nM) on cell proliferation was analyzed by cell counting of live and dead
cells using SYTOX Green and Hoechst 33342 nuclei staining (Invitrogen) at 0, 24 and 48 hours. The
number of live cells was calculated by subtracting dead cells (SYTOX Green positive cells) from all cells
(Hoechst staining).
CDr10b
b
a CDr10b CDr10a
Electronic Supplementary Material (ESI) for Chemical CommunicationsThis journal is © The Royal Society of Chemistry 2013

15
Supplementary Figure 7. Microglia functional assay. CDr10a and CDr10b was accessed for potential
activating effects on the microglia by measuring cytokine expression and nitric oxide production. (a, b)
BV2 cells were pretreated for 1 hour with 500 nM of compound before addition of 100 ng/ml of LPS in
fresh media. After 6 hours, total RNA was isolated from the cells and mRNA expression levels of IL-6 (a)
and TNF-α (b) were measured by qRT-PCR. All values were normalized to GAPDH expression levels. (c)
For the measurement of nitric oxide concentration, cells were pretreated with 500 nM of compound
before addition of 100 ng/ml LPS. After incubation for 24 hours, nitric oxide production was measured
using the Griess assay and concentrations determined by comparison to a standard curve. (d) BV2 cells
were pretreated for 1 hour with CDr10b (0.5-5 μM), followed by the addition of LPS 24 hours before
nitric oxide measurement. BV2 cells treated with LPS for 24 hours were used as a positive control.
a b
c d
Electronic Supplementary Material (ESI) for Chemical CommunicationsThis journal is © The Royal Society of Chemistry 2013

16
Supplementary Figure 8. Microglia specificity of CDr10a. Primary neural cells from CX3CR1-GFP
mice were stained with 500 nM of CDr10a and imaged by fluorescence microscopy (a) and analyzed by
flow cytometry (b). Scale bar, 10 µm.
a b
Electronic Supplementary Material (ESI) for Chemical CommunicationsThis journal is © The Royal Society of Chemistry 2013

17
Supplementary Figure 9. Time-course analysis of CD10b and CDr10a destaining. A percentage
average intensity plot of CDr10b and CDr10a stained cells over 18 hours in media without
compounds. CDr10a signal is rapidly washed out but CDr10b signal remains relatively constant.
Electronic Supplementary Material (ESI) for Chemical CommunicationsThis journal is © The Royal Society of Chemistry 2013

18
Supplementary Figure 10. SDS-PAGE of CDr10a- and CDr10b-stained microglia cell lysates. (a) 1D
SDS-PAGE - CDr10b-stained BV2 cell lysate shows prominent dye labeled bands. No signal was
detected from control and CDr10a-stained cell lysate. (b) HPLC detection and fractionation- The major
fluorescence peak from HPLC of CDr10b-stained BV2 cell lysate was fractionated and run on 1D SDS-
PAGE. (c) Silver staining confirmed that it corresponded with the major fluorescent band identified from
(a).
a
b
Lane 1: Unstained cells Lane 2: CDr10b stained cells Lane 3: CDr10a stained cells
*
c Fluorescence
UV emission – Protein
Silver staining
*
*
1 2 3
50kDa
37kDa
20kDa 25kDa
15kDa
100kDa
Electronic Supplementary Material (ESI) for Chemical CommunicationsThis journal is © The Royal Society of Chemistry 2013

19
Supplementary Figure 11. pH response of CDr10b and CDr10a. CDr10b (red) and CDr10a (blue) did
not show any pH response compared to pHrodo, a known acid responsive fluorescent dye.
CDr10b CDr10a pHrodo
Electronic Supplementary Material (ESI) for Chemical CommunicationsThis journal is © The Royal Society of Chemistry 2013