Microenterprise Results Reporting: 2003 Annual …Microenterprise Results Reporting: 2003 Annual...
89
Microenterprise Results Reporting: 2003 Annual Report USAID/Bureau for Economic Growth, Agriculture and Trade/Office of Poverty Reduction/Microenterprise Development Division (USAID/EGAT/PR/MD) by Gary Woller, Catherine Neill, and Sharon Williams of Weidemann Associates, Inc., under the direction of Stacey Young, Senior Knowledge Management Advisor, and Katharine McKee, Director, Office of Microenterprise Development (EGAT/PR/MD) Produced under Contract Number: AMAP GEG-I-00-02-00025-00, Task Order #1
Transcript of Microenterprise Results Reporting: 2003 Annual …Microenterprise Results Reporting: 2003 Annual...
Microenterprise Results Reporting:
2003 Annual Report USAID/Bureau for Economic Growth, Agriculture and Trade/Office of Poverty Reduction/Microenterprise Development Division (USAID/EGAT/PR/MD) by Gary Woller, Catherine Neill, and Sharon Williams of Weidemann Associates, Inc., under the direction of Stacey Young, Senior Knowledge Management Advisor, and Katharine McKee, Director, Office of Microenterprise Development (EGAT/PR/MD) Produced under Contract Number: AMAP GEG-I-00-02-00025-00, Task Order #1

Microenterprise Results Reporting: 2003 Annual Report 2
TABLE OF CONTENTS MICROENTERPRISE FUNDING IN FISCAL YEAR 2003 ......................................................3
Funding by Type of Institution ................................................................................................7 Funds for Very Poor Clients ....................................................................................................8 Funds for U.S. Private Voluntary Organizations (PVOs) and Networks.................................10
RESULTS FROM USAID-SUPPORTED MICROENTERPRISE INSTITUTIONS in 2003.....12 MICROFINANCE ....................................................................................................................12 ENTERPRISE DEVELOPMENT ............................................................................................20 POLICY ADVOCACY AND REFORM...................................................................................21
Table 1. Sources of USAID Funds for Microenterprise by Appropriation Account, 1992-2003�5 Table 2. FY 2003 Funding in Regions by Activity������������������..6 Table 3. FY 2003 Funding in Regions by USAID Bureau.������.��������...6 Table 4. Funding for Enabling Environment Activities, 1997-2003�.���...������..7 Table 5. Funding by Type of Recipient, FY 2003������������������..7 Table 6. Percentage of Funds Benefiting the Very Poor����������������.9 Table 7. Annual Funding to PVO Networks, 1997-2003���������������..10 Table 8. Clients of Lending Institutions 2003 and 2002����������������12 Table 9. Outstanding Loans at Lending Institutions, 2003 and 2002�����������13 Table 10. Average Loan Balance and Percentage of Women Clients, 2003��������.14 Table 11. Clients with Poverty Loans�����������������������15 Table 12. Number of Savers and Saving Amounts, 2003���������������..16 Table 13. Leading Savings Institutions or Networks Supported by USAID, FY2003����..17 Table 14. Location of Microfinance Clients��������������������..18 Table 15. Portfolio-at-Risk and Loan Loss, FY 2003�����������������18 Table 16. Sustainability of USAID-Supported Institutions������������.��..19 Table 17. Clients of USAID-Supported Enterprise Development Programs, FY 2003�...�.�20 Table 18. Funding for Type of Activity and Recipient, 2003����...���������24 Table 19. Microenterprise Survey Respondents, 2003���������������.�.27 Table 20. Response Rate for Institutions Receiving Obligations in 2003���������.28 Methodology Annex������ �����������������������.21

Microenterprise Results Reporting: 2003 Annual Report 3
MICROENTERPRISE RESULTS REPORTING 2003 ANNUAL REPORT
In fiscal year (FY) 2003, USAID maintained its distinction as the world�s largest bilateral donor for microenterprise development. Over the years, USAID has played a pivotal role in facilitating the evolution of microenterprise development from a small-scale development intervention to an emerging global industry. USAID support of microenterprise development has been instrumental in helping supported institutions provide high quality, sustainable financial services to and improve business performance of millions of low-income microentrepreneurs. It has also been instrumental in helping institutions advocate for policy, legal and regulatory reforms that hinder microenterprise formation and growth. This report1 summarizes the principal outcomes from USAID�s support of microenterprise development during FY 2003. It also discusses the levels and distribution of funding by regions, bureaus, and types of institution; the outreach of USAID-supported microfinance and enterprise development institutions in terms of clients reached, value of loans and savings, and percentage of women, rural, and poor clients served; and the financial performance of these institutions. MICROENTERPRISE FUNDING IN FISCAL YEAR 2003
USAID has supported a large number of industry leaders over many years � leaders who have done much to move the industry forward, including such well-known institutions and networks as Banco Sol in Bolivia and Bank Rakyat Indonesia (BRI), FINCA, ACCION, and WOCCU. Because USAID works with a broad range of actors in the public, PVO/NGO, private, and multi-lateral sectors, it is able to target its support to those organizations best suited to advance the development of the microenterprise sector. In FY 2003, more than 550 institutions received assistance through active USAID agreements. More institutions received USAID support through subsidiary agreements. Fully 489 institutions reported on their activities, including 340 microfinance institutions, 107 business development services (BDS) institutions, and 42 policy institutions. Survey respondents included primary grantees as well as many institutions that received subgrants or technical assistance through an umbrella program manager.2 The information from the surveyed institutions forms the basis for this report. (See methodology annex.) Not all institutions with active agreements received funds from USAID during 2003, and not all institutions that received funds reported data. Overall, USAID provided nearly $182 million to 346 institutions, including $106 million (58 percent) to 206 microfinance institutions, $52 million (29 percent) to 135 enterprise support and BDS institutions, and $24 million (13 percent)
1 At the conclusion of each fiscal year, all USAID missions that support microenterprise activities, and all microenterprise institutions with active agreements with USAID, are asked to complete a survey on their activities during the past year. The purpose of the survey is to monitor funding and key indicators so as to track USAID support for microenterprise development. The data collected through this process forms the basis of this report. For details, see the methodology annex. 2 Institutions that serve as �umbrellas� or �apexes� channel funds and/or technical support to other institutions.

Microenterprise Results Reporting: 2003 Annual Report 4
to 40 policy institutions. (Some institutions received funds for more than one purpose.) The level of funding in 2003 exceeds by 7 percent the $170 million obligated in 2002 and continues the long-term upward trend begun when USAID was first required to track its funding to microenterprise development in 1988. Over this time, USAID has provided more than $2 billion in funding support for microenterprise development. Table 1 shows the sources of funding for microenterprise development programmed by USAID. The Development Assistance (DA) account is used by USAID to fund long-term development programs in Africa, Asia, the Near East, and Latin America/Caribbean. DA funds typically constitute about half of all USAID funds for microenterprise development (51% in FY 2003). Economic Support Funds (ESF) are authorized through the U.S. Department of State. ESF funds support U.S. strategic and policy objectives and have been used largely in Latin America and the Near East to support microenterprise development. Freedom Support Act (FSA) funds are also authorized through the State Department and are used to support microenterprise development programs in Russia, Ukraine, Moldova, the Caucasus, and the Central Asian Republics. FSA Funds applied to microenterprise development have increased in the last three years; FY 2003 funding represents a 23 percent increase over FY 2002. USAID field offices in Southern and Eastern Europe authorize funds for microenterprise development under the SEED Act, or Special Assistance Initiatives (SAI). While funding through the SAI declined in FY 2002, it was up again in FY 2003 with added support to microenterprise development programs in Bosnia, Bulgaria, Croatia, Macedonia, Romania and Serbia. Local currency support for microenterprise development comes from the monetization of Title II funds under Public Law (PL) 480 and from balance of payments support. In FY 2003, funds to microenterprise from Title II took a slight turn downward, though the usual pattern is one of funds in amounts between $8- $13 million. An exception to this trend was FY 1999, when $17.3 million from food monetization was used for microenterprise.

Microenterprise Results Reporting: 2003 Annual Report 5
Table 1. Sources of USAID Funds for Microenterprise by Appropriation Account, 1992-2003 (US$ Millions) Fiscal Year 1992 1993 1994 1995 1996 1997 1998 1999 2000 2001 2002 2003 DA1 61.3 51.6 89.2 93.3 72.9 83.3 79.9 74.3 88.9 87.4 81.9 91.8 ESF 34.4 20.8 31.6 22.9 16.1 24.5 33.9 32.9 25.2 27.9 48.1 28.4 FSA 5.4 20.6 14.3 12.8 30.3 19.6 33.4 41.0 SEED/SAI2 4.7 24.8 4.6 13.0 9.2 7.6 6.7 14.5 CACEDRF3 3.2 8.0 CSD/HIV4 0.8 0.5 0.5 1.0 Local Currency 30.6 23.6 16.6 17.3 12.2 11.8 12.4 17.3 8.8 13.7 18.5 4.8 Total 126.3 96.0 137.4 133.5 111.4 165.0 145.1 153.5 171.2 156.7 189.1 181.5
1 Development Assistance funds include the Development Fund for Africa. In 2003, DA includes $1.54 million in Funds for Alternative Development programmed in Peru. 2 Funds appropriated under the Support for Eastern European Democracy (SEED) Act; also includes funds
appropriated under Special Assistance Initiatives (SAI). In 2003, funds totaling $3.76 million in Assistance for Eastern Europe and the Baltics is included.
3 Central America and Caribbean Emergency Disaster Recovery Fund. 4 Child Survival and Development/HIV. These funds are from the Child Survival Account.
In FY 2003, about one-third of all USAID funding for microenterprise development went to institutions in Europe and Eurasia; about one quarter went to institutions in Asia and the Near East region; more than one-fifth went to institutions in Africa; about one-eighth went to institutions in Latin America and the Caribbean; the remainder (about one-eighth) was used for capacity building of worldwide microenterprise programs, headquartered in the U.S. or Canada (see Table 2).
Compared to FY 2002, microenterprise funding increased in all regions except Latin America and the Caribbean. Funding was up by 12 percent in Africa, 12 percent in Asia and the Near East, 38 percent in Europe and Eurasia, and 53 percent to programs headquartered in North America. In contrast, funding for microenterprise development fell by nearly one-half in Latin America/Caribbean. In recent years, large sums have been appropriated in response to disasters in Latin America; none of this funding was present in FY 2003. Overall, 62 percent of total USAID funding went to financial services programs for operating expenses, technical assistance, loan capital, and microfinance policy work (see Table 2). The remaining 38 percent went to enterprise support and business development services, and to policy advocacy to improve the enabling environment for microentrepreneurs and microenterprise development programs. In 2002 the relevant percentages were 69 percent and 31 percent, respectively.

Microenterprise Results Reporting: 2003 Annual Report 6
Table 2. FY 2003 Funding in Regions by Activity (US$ Millions)
Region
Financial Services & Microfinance-Related Enabling Environment
Enterprise Development and Related Enabling
Environment Total Amount Percent Amount Percent Amount Percent Africa $18.5 47 $20.8 53 $39.3 22 Asia/Near East $40.1 92 $3.4 8 $43.5 24 Europe/Eurasia $25.7 45 $30.8 55 $56.5 31 Latin America/Caribbean $17.7 80 $4.3 20 $22.0 12 Worldwide1 $11.2 55 $9.0 45 $20.2 11 Total $113.2 62 $68.3 38 $181.5 100
1Refers to funds provided to North American headquarter operations for institutions operating worldwide Table 3 presents the same information as Table 2 from the point of view of the funding entity within USAID rather than the destination of funds. Table 3. FY 2003 Funding in Regions by USAID Bureau (US$ Millions)
Region
Financial Services & Microfinance-Related Enabling Environment
Enterprise Development and Related Enabling
Environment Total Amount Percent Amount Percent Amount Percent Africa Bureau $14.0 41 $20.0 59 $34.0 19 Asia/Near East Bureau $35.9 93 $2.6 7 $38.5 21 Europe/Eurasia Bureau $24.7 44 $30.8 56 $55.5 31
Latin America/Caribbean Bureau $14.7 77 $4.3 23 $19.0
10 Global Bureau $23.9 69 $10.6 31 $34.5 19 Total $113.2 62 $68.3 38 $181.5 100
The policy and regulatory framework for microfinance and microenterprise development are collectively referred to as the enabling environment. It is axiomatic that a growing and dynamic microenterprise sector requires a supportive enabling environment. Efforts to improve the enabling environment through policy analysis and reform can thus yield benefits for the entire microenterprise sector far in excess of the relatively limited USAID funds devoted to this activity. Overall, USAID devoted approximately 13 percent of its support for microenterprise development to efforts to improve the enabling environment, an increase from previous years. Of the $113 million USAID devoted to microfinance in FY 2003, $7.1 million, or 6.7 percent, went to policy advocacy for the purpose of improving the enabling environment for microfinance institutions. An additional $16.4 million of the $68 million USAID devoted to enterprise development went to organizations engaged in policy advocacy to create a strong enabling environment for microenterprises.

Microenterprise Results Reporting: 2003 Annual Report 7
Table 4. Funding for Enabling Environment Activities, 1999-2003 (US$ Thousands) Fiscal Year 1999 2000 2001 2002 2003 Microfinance Enabling Environment $3,390 $13,500 $8,307 $6,956 $7,099 Microenterprise Enabling Environment $3,700 $5,141 $5,715 $5,295 $16,438 Total Funding for MF and ME Enabling Environment $7,090 $18,461 $14,022 $12,251 $23.537 As Percent of Total USAID Funding 4.6% 11.4% 8.9% 7.2% 12.9%
Funding by Type of Institution
As shown in Table 5, 42 percent of USAID microenterprise funding in FY 2003 went directly to non-profit recipients, including U.S. PVO networks (19 percent) and NGOs (14 percent), as well as cooperatives, credit unions, governments and research and educational institutions. Just over 54 percent of total USAID microenterprise funding went directly to for-profit recipients. This was up from 40 percent in FY 2002, and included 33 percent of overall microenterprise funding to consulting firms and 21 percent to commercial banks, non-bank financial institutions, and finance companies. Consulting firms are widely used by missions to manage umbrella programs for financial services and enterprise development, channeling funds or technical assistance to local direct service providers and support organizations. In this way, USAID can achieve such objectives as building local capacity and ensuring service delivery to more remote rural areas. The figures in Table 5, however, understate the percentage of USAID microenterprise funds flowing to non-profit institutions. A portion of the funding received by consulting firms is passed through to non-profits in the form of loan capital, technical assistance, operational support, research and development, and other forms of assistance. In some cases, the funds that pass through agreements with for-profit firms on to non-profit institutions constitute a substantial portion of the total obligation. Beginning in FY 2005, MRR will be able to report comprehensively on the funds that are handled this way and thereby present a more accurate picture of the magnitude of funding to non-profit entities. Table 5. Funding by Type of Recipient, FY 2003
Institution Type
Obligation Amount
(US$ millions) Percent of Total
Obligations2 Bank $9.63 5.31% Business Association $1.99 1.10% Consulting Firm $60.17 33.18% Cooperative $7.19 3.97% Credit Union $4.64 2.56% Finance Company/For Profits $7.75 4.28% Gov. Agency $3.01 1.66% NGO $25.17 13.77%

Microenterprise Results Reporting: 2003 Annual Report 8
Institution Type
Obligation Amount
(US$ millions) Percent of Total
Obligations2 Non Bank Financial Institution $20.75 11.44% PVO $33.66 18.56% Research/Educational $3.33 1.84% USAID3 $4.24 2.34% Total $181.53 100.00% NGO, PVO, COOP, CU $70.66 38.86% Consulting Firms $60.17 33.18% Other For Profits $38.13 21.03% Total All Other Entities $12.57 6.93% Total $181.53 100.00%
1 Funds were provided to institutions for loan capital, institutional strengthening, technical assistance, monitoring and evaluation, and/or research and development.
2 Table shows obligations made to umbrellas and apex organizations, not sub-obligations (i.e. funds that are passed through to other organizations). Institutions that serve as �umbrellas� or �apexes� channel funds or technical support to other institutions.
3 Obligations to USAID include those funds that were used for microenterprise project management and those for which specific implementing institutions had not yet been specified.
Funds for Very Poor Clients3
The 2000 Microenterprise for Self Reliance Act (MSRA) mandates that at least one-half of all USAID funding support for microenterprise development shall benefit the very poor. The 2000 Act established a loan size threshold as a proxy to use in estimating the poverty status of microenterprise development clients. Loan sizes falling under the thresholds are assumed to represent a very poor client. The loan thresholds are:
• $300 in Asia, the Near East, and Africa • $400 in Latin America and the Caribbean • $1,000 in Europe and Eurasia4
For microfinance institutions, the Funds Benefiting the Very Poor (FVP) is equal to the percentage of the total loan portfolio held in �poverty loans� (the percentage below the loan size threshold). For BDS institutions, the FVP is equal to the percentage of clients with outstanding
3 The data referred to in this section and presented in Table 6 are based on reports from institutions with USAID funding provided in FY 2003. USAID is under Congressional mandate to report the percentage of its appropriated funds in a given fiscal year that went to very poor clients. The data in the later section on �Poverty Loans� (see page 15) is drawn from all MFIs with active funding agreements for the same period (FY 2003), which may include MFIs funded in earlier years that remain under USAID supervision. The data set, then, upon which Table 6 is based is a subset of the dataset used for Table 11. 4 Using the Consumer Price Index to calculate the 2003 poverty loan equivalents in 1997 dollars, the poverty loan sizes would be $344, $458 and $1,146 rather than $300, $400 and $1000. However, because many MFIs have set up their management information systems to provide data on the latter amounts (300/400/1000) MRR continued to request in the 2003 survey that institutions report on those loan sizes as requested.

Microenterprise Results Reporting: 2003 Annual Report 9
poverty loans regardless of the source. Table 6 shows the FVP for microfinance and BDS institutions in FY 2003. Because policy institutions do not report client data, they are excluded from Table 6.5 The share of USAID funding benefiting the very poor was 32 percent in FY 2003, compared to over 50 percent of funding in fiscal years 2000, 2001 and 2002. This downward shift is likely caused by a variety of factors. The first causal factor is the increase in microenterprise activity in the Europe and Eurasia region, where USAID is working with a wide range of institutional types, and fewer institutions that work exclusively with those who meet the 2000 Act�s definition of �very poor.� As funding in this region increases, it has a direct bearing on lowering the overall percentage of microenterprise funds that benefit people who do meet that definition. The second factor is that the great majority of enterprise development and BDS institutions do not track whether their clients have poverty loans, particularly if the institutions do not offer loans themselves. Because of the discontinuity between the proxy (loan size) and the activities of these institutions, many enterprise development and BDS institutions either cannot or do not respond to this portion of the survey. Poverty loan percentages, if reported at all by these institutions, are at best very rough estimates. As a result of these factors, it is likely that the percentage of poverty loans reported by enterprise development and BDS institutions significantly understates the actual percentage of funds benefiting the very poor, particularly since the great majority of clients served reside in rural areas, where poverty incidence is consistently higher (see Table 17). It seems highly unlikely, for example, that in Africa 92% of the BDS clients were rural and yet only 17% were very poor. Rather, this reported data likely reflects the limitations of the reporting methodology as established by law. And as the portion of microenterprise funding that goes to BDS activities increases, the effect of this understatement intensifies. A third factor, then, is increased funding in FY03 to enterprise support and BDS in general, and increased funding for several large BDS programs in Africa in particular. USAID contributed large amounts to BDS programs in the following countries: Tanzania ($5 million); Ghana ($3.7 million); Mozambique ($3.2 million); Kenya ($2.4 million); and Senegal ($1.1 million). Across Africa, USAID is focusing its efforts on improving technologies, and building markets and market associations for smallholder rural farmers. Because BDS activities yield artificially low estimates of funds that benefit very poor clients, the high percentage of people in sub-Saharan Africa who meet the 2000 Act�s definition of �very
5 The Microenterprise for Self-Reliance Act was amended in 2003 to define the very poor as either (1) those living in the bottom 50 percent of people below the official national poverty line or (2) those living on the equivalent of less than $1 per day (adjusted for 1993 purchasing power parity). In compliance with the amended 2000 Act, USAID currently funds and supports research to develop, test, and validate tools for assessing the poverty levels of current or prospective microenterprise development clients. Beginning no later than October 1, 20065, USAID will require that institutions applying for microenterprise assistance document their outreach to very poor clients using one of the certified poverty assessment tools. In the meantime, the loan size thresholds specified in the MRSA of 2000 remain the operational proxy used to estimate �very poor� status.

Microenterprise Results Reporting: 2003 Annual Report 10
poor� are likely to be omitted from the FVP calculation. Thus the depressive impact of BDS activities on the FVP calculation is further exaggerated. Many MFIs reported the share of their portfolio value using the nominal poverty loan thresholds included in the law, rather than adjusting the threshold upward from the 1997 levels to the 2003 levels. This also resulted in underreporting of the extent of service to very poor microfinance clients. Table 6. Percentage of Funds Benefiting the Very Poor, FY 2003
Bureau
Total Microenterprise
Funding (US$ millions)
Percent of MFI
Funding For Poverty
Lending
Percent of Non-
Financial/Enterprise Development Funding for
Poverty Loan Clients
Percent of Total Funding Benefiting the
Very Poor Africa Bureau $33.3 71% 19% 30%Asia/Near East Bureau $37.0 71% 53% 67%Europe/Eurasia Bureau $40.0 30% 11% 22%Latin America/Caribbean Bureau $17.8 38% 17% 30%Global Bureau $22.8 47% 43% 46%Total all Bureaus $150.91 44% 19% 32%
1 Funds in the amount of $7.039 million used for, research, training and USAID salaries were excluded from this column. Total funds ($23.537 million) provided to improve the enabling environment for microenterprise development were also excluded. The rationale for excluding them is that the extent to which they benefit very poor clients is impossible to estimate by the poverty loan proxy mandated by law, since they do not directly serve clients and therefore do not yield any client data. Not all microfinance and BDS institutions that reported data for FY 2003 also reported information on poverty loans. The analysis imputes the average poverty loan ratio to non-reporting institutions, since there is no reason to assume that the poverty loan ratio of non-reporters is systematically higher or lower than that of reporters. (Imputing average values to missing observations is a common and accepted approach in statistical analysis.) Funds for U.S. Private Voluntary Organizations (PVOs) and Networks
With USAID assistance, North American PVOs have established extensive multi-country networks of local microenterprise development institutions through which they deliver loan capital, business development services, technical assistance and other forms of support. In this manner, North America PVOs have played a critical role in developing the capacity of local institutions to deliver high-quality, sustainable financial and business development services while achieving significant scale and depth of outreach.

Microenterprise Results Reporting: 2003 Annual Report 11
USAID�s long-standing support for PVOs recognizes their historical importance in the development of the microenterprise sector. Table 7 shows the level of USAID funding support for North American PVOs over the past 7 years. Total funding to the top 15 PVOs represents one-third of total USAID funding to microenterprise development for the period. Table 7. Annual Funding to PVO Networks, 1997-2003
PVO Network Total USAID Awards (US$ Thousands)
Avg. Annual Award (US$ Thousands)
ACCION International $17,197 $2,457
ACDI/VOCA $35,754 $5,108
Aid to Artisans (ATA) $17,344 $2,478
CARE International $18,413 $2,630
Catholic Relief Services $30,828 $4,404
Cooperative Housing Foundation $20,225 $2,889
Enterprise Works Worldwide $21,041 $3,006
FINCA International $52,934 $7,562
Mercy Corps $12,884 $1,841
National Cooperative Business Association $14,096 $2,014
Opportunity International $33,957 $4,851
Save the Children Federation $25,695 $3,671
TechnoServe $39,059 $5,580
WOCCU $32,371 $4,624
World Vision Relief and Development $12,026 $1,718
TOTAL Funding $383,824 $54,833

Microenterprise Results Reporting: 2003 Annual Report 12
RESULTS FROM USAID-SUPPORTED MICROENTERPRISE INSTITUTIONS in FY 2003
MICROFINANCE
USAID support for microfinance takes many forms. Most funding supports technical assistance, training and operational activities. Support also takes the form of portfolio guarantees, training and new product development. Funding also goes to activities that strengthen the broader microenterprise sector. Examples include activities to build country or regional microfinance networks or to increase the availability, accuracy and dissemination of financial information, such as credit bureaus and credit rating agencies. In FY 2003, 376 microfinance institutions were requested to provide data. This number includes many institutions receiving technical support through a direct funding recipient. Overall, 340 institutions responded to the survey, including 278 institutions that received USAID funding or technical assistance in 2003, representing $97.4 million. This number includes 34 apex6 institutions that did not offer retail loans and thus had no lending data to report. (Five other institutions responded to the survey but had no data to report.) These 34 institutions in turn served many more microfinance institutions with loan capital, technical assistance, and other services. Thus, the overall response rate for microfinance institutions was 90 percent (340 institutions responded out of a universe of 376). As in previous years� reports, the figures presented in the section of the report on institutional results do not include Bank Rakyat Indonesia (BRI). With 3 million loan clients and $1.7 billion in loans outstanding in 2003, BRI has more loan and savings clients than all other USAID-supported microfinance institutions combined. Consequently, including BRI in the summary statistics would produce a skewed portrait of outcomes among USAID-supported microfinance institutions. Clients of USAID-Supported Lending Institutions
Traditionally, access to formal financial services has been limited to a relatively small segment of economically well-off people in developing countries. Those excluded from access to formal financial services � who therefore rely on microfinance institutions � have included not only nearly all �very poor�7 households but also millions of poor and vulnerable non-poor households (as defined by national poverty lines). Each of these groups benefits from access to formal financial services. Moreover, many non-poor households are one economic shock away from falling back under the poverty line. Access to financial services provides a critical bulwark that allows households whose members are not poor, as defined by their nation�s poverty line, yet are still economically vulnerable, to maintain or improve their economic status despite economic shocks (e.g., sickness, job loss, natural disaster, or death) that inevitably buffet their lives. USAID has worked to guarantee access to formal financial services to all segments of heretofore excluded populations. As shown in Table 8, USAID-supported microfinance institutions were
6 Apex institutions serve as wholesalers to channel technical assistance or funds to retail lending institutions. 7 �Very poor� is defined in the Microenterprise for Self-Reliance Act of 2000 as people living on less than $1/day purchasing power parity or those who live in the bottom 50% of people living below their nation�s poverty line.
Microenterprise Results Reporting: 2003 Annual Report 13
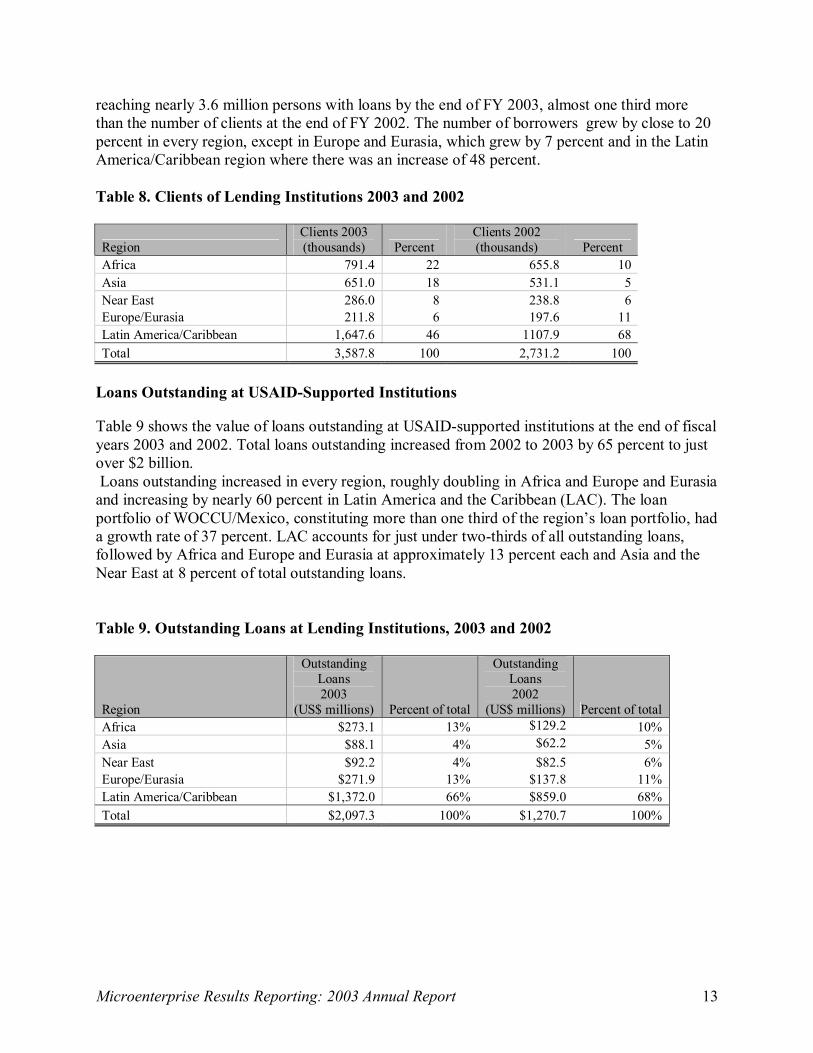
reaching nearly 3.6 million persons with loans by the end of FY 2003, almost one third more than the number of clients at the end of FY 2002. The number of borrowers grew by close to 20 percent in every region, except in Europe and Eurasia, which grew by 7 percent and in the Latin America/Caribbean region where there was an increase of 48 percent. Table 8. Clients of Lending Institutions 2003 and 2002
Region Clients 2003 (thousands) Percent
Clients 2002 (thousands) Percent
Africa 791.4 22 655.8 10 Asia 651.0 18 531.1 5 Near East 286.0 8 238.8 6 Europe/Eurasia 211.8 6 197.6 11 Latin America/Caribbean 1,647.6 46 1107.9 68 Total 3,587.8 100 2,731.2 100
Loans Outstanding at USAID-Supported Institutions
Table 9 shows the value of loans outstanding at USAID-supported institutions at the end of fiscal years 2003 and 2002. Total loans outstanding increased from 2002 to 2003 by 65 percent to just over $2 billion. Loans outstanding increased in every region, roughly doubling in Africa and Europe and Eurasia and increasing by nearly 60 percent in Latin America and the Caribbean (LAC). The loan portfolio of WOCCU/Mexico, constituting more than one third of the region�s loan portfolio, had a growth rate of 37 percent. LAC accounts for just under two-thirds of all outstanding loans, followed by Africa and Europe and Eurasia at approximately 13 percent each and Asia and the Near East at 8 percent of total outstanding loans. Table 9. Outstanding Loans at Lending Institutions, 2003 and 2002
Region
Outstanding Loans 2003
(US$ millions) Percent of total
Outstanding Loans 2002
(US$ millions) Percent of total Africa $273.1 13% $129.2 10% Asia $88.1 4% $62.2 5% Near East $92.2 4% $82.5 6% Europe/Eurasia $271.9 13% $137.8 11% Latin America/Caribbean $1,372.0 66% $859.0 68% Total $2,097.3 100% $1,270.7 100%

Microenterprise Results Reporting: 2003 Annual Report 14
Average Loan Balance
The loan balance at USAID-supported institutions averaged $585 in 2003. The average loan balance was highest in Europe and Eurasia, where it increased by 85 percent over FY 2002. It should be noted that the average loan balance obscures substantial variation within regions. Perhaps the most extreme example of this is in Europe and Eurasia. The average loan balance ranges from $220 in Uzbekistan to $3,980 in Ukraine. The diversity in loan size in the Europe and Eurasia region (and other regions) reflects tremendous economic diversity among countries in the region as well as among the particular institutions in USAID�s portfolio, which in turn reflects the funding priorities of USAID country missions. USAID works with a wide range of institutional types in the region, from commercial banks that are extending their reach to microenterprises to village banking institutions that work with poorer populations. Variation within regions also explains much of the shift, year to year, of average loan balances. Because projects are generally funded for only a few years, and some projects are renewed while others are not, USAID�s partners within a region shift from year to year. Consequently, funding in any given year may represent a different proportion of projects in poorer or less poor countries from those funded in a previous year. Percentage of Women Clients
Empirical evidence demonstrates that cash surpluses controlled by women are more likely to be invested in the well-being of children and the household than are surpluses controlled by men. In addition, women tend to suffer from much higher rates of social and economic exclusion than men. Consequently, USAID actively supports microfinance institutions that target loans to women. As shown in Table 10, USAID-supported institutions successfully target women, with over 60 percent of loans going to women in all regions except in Europe and Eurasia. The 66 percent of loans going to women in 2003 represents a slight drop from 69 percent in 2002 and 73 percent in 2001, however. The drop was particularly sharp in Asia and in Europe and Eurasia, falling from 92 percent to 77 percent in the former and from 60 percent to 46 percent in the latter. The drop in Asia is due largely to a single large institution, Khushalibank in Pakistan, funded for the first time in 2003. With 92,000 clients, equal to 14 percent of all loan clients in Asia, Khushalibank reports only 33 percent women clients, low enough to skew the entire region downward. Omitting Khushalibank from results pushes the share of women clients up to 85 percent. In Europe and Eurasia, one large credit union federation, WOCCU/Romania, reported nearly twice as many clients in 2002, of whomich 45 percent were women. In 2003 both its overall clients and its percentage of women clients were lower. Excluding WOCCU/Romania, the overall percentage of women borrowers in the region increases to 55 percent in 2003. These examples serve to highlight the inherent sensitivity of the MRR data. With relatively few institutions reporting in each region, the data are sensitive to large outliers. The Near East is the only region in which the percentage of loans going to women increased from FY 2002, maintaining a consistent and sharp upward trend from 27 percent in FY 2000 to 62 percent in FY 2003. This change reflects the trend to target women more specifically among a

Microenterprise Results Reporting: 2003 Annual Report 15
group of Near Eastern institutions that have been included in the survey results over the same period of time. Table 10. Average Loan Balance and Percentage of Women Clients, 2003
Region Average Balance
(US$) Percentage of Women Clients
(%) Africa 345 66 Asia 135 77 Near East 322 62 Europe/Eurasia 1,283 46 Latin America/Caribbean 833 65 Total 585 66
Poverty Loans
Average loan size is the Congressionally mandated proxy that USAID uses to measure poverty outreach (or FVP � funds benefiting the very poor), with smaller averages assumed to indicate poorer clients and larger averages assumed to indicate less poor clients. The rationale underlying this proxy is that persons will borrow more or less equal to their ability to repay and in accordance with their risk preferences, which are in turn positively correlated with income level. Following the thresholds set by the 2000 Microenterprise for Self-Reliance Act, poverty loans are set at:
• $300 or less in Asia, the Near East, and Africa • $400 or less in Latin America and the Caribbean • $1,000 or less in Eastern Europe and Eurasia8
As shown in Table 10 above, the average loan size exceeds the poverty loan definition in each region, with the exception of Asia, which is much lower than the $300 threshold. The difference is moderate in Africa and the Near East and more significant in Europe and Eurasia and Latin America and the Caribbean. Nonetheless, the average loan balance across all regions is still only $585, suggesting that USAID-supported institutions have on balance done a good job reaching poor persons without access to other formal loans. Table 11 corroborates this conclusion. Almost two-thirds of loans made by USAID-supported institutions went to the very poor, although this figure is lower than the 69 percent reported in FY 2002 and FY 2001. Thus the number of poverty loans as a percentage of total loans made by USAID-assisted institutions is high. However, the law frames the poverty targeting goals in terms of percent of funds benefiting the very poor rather than the percent of loans serving them. (See the methodology annex.) Thus, the FVP calculation is weighted by the size of the obligation to each institution. With this approach, a few large obligations to institutions that have been working 8 Using the Consumer Price Index to calculate the 2003 poverty loan equivalents in 1997 dollars, the poverty loan sizes would be $344, $458 and $1,146 rather than $300, $400 and $1000. However, because many MFIs have set up their management information systems to provide data on the latter amounts (300/400/1000) MRR continued to request in the 2003 survey that institutions report on those loan sizes as requested.

Microenterprise Results Reporting: 2003 Annual Report 16
with higher-end clients prior to USAID funding can bring down the overall percentage of funds for the very poor. With the exception of Latin America and Caribbean, the percentage of poverty loans exceeds 50 percent in each region. Table 11. Clients with Poverty Loans, 2003
Region
Number of Loans (�000s)
Number of Poverty Loans
(�000s)
Percent Poverty Loans
Africa 791.4 572.3 72% Asia 651.0 580.5 89% Near East 286.0 177.1 62% Europe/Eurasia 211.8 124.8 59% Latin America/Caribbean 1,647.6 716.5 43% Total 3,587.8 2,171.2 61%
Savings Services
Savings are an integral component of poor households� livelihood and coping strategies. Experience demonstrates that even the poorest people are capable of setting aside small sums of money to protect themselves from economic shocks and to meet other anticipated or unanticipated cash needs. For this reason, USAID has long promoted access to safe and reliable savings instruments targeted to the poor. Credit unions and credit union federations are examples of �savings-led� institutions that have pioneered savings programs and promoted specialized savings products to meet the needs of poor clients. As seen in Table 12, more than 4.5 million individuals held savings at USAID-supported microfinance institutions at the end of FY 2003 totaling nearly $1.3 billion in deposits. These figures represent a 43 percent increase in the number of savings accounts and a 63 percent increase in the value of savings amounts from FY 2002. In the Africa region, a 49 percent increase in the number of savers, accompanied by a 95 percent increase in deposits, can be attributed to the addition of two credit union networks to USAID�s portfolio: FECECAM in Benin and Credit Mutuel Senegal with 500,000 and 160,000 savers, respectively. The Latin America region has also seen a tremendous change since FY 2002, with an 86 percent increase in savings clients, and a 63 percent increase in savings deposits. The majority of this increase can be attributed to two savings-led programs, WOCCU/Mexico and WOCCU/Ecuador. Overall the average amount of savings per client increased slightly (14 percent) between FY 2002 ($242) and FY 2003 ($276).

Microenterprise Results Reporting: 2003 Annual Report 17
Table 12. Number of Savers and Savings Amounts, 2003
Region
Savings Members (�000s)
Savings Amounts
(US$ millions)
Average Savings Account (US$)
Africa 1,840.3 $203.1 $110
Asia
774.5 $16.5 $21
Near East
1.2 $0.3 $23
Europe/Eurasia
151.2 $15.7 $104
Latin America/Caribbean
1,829.9 $1,034.1 $565
Total
4,597.1
$1,269.7 $276 The small average account size within and across regions could imply that most savings captured by supported institutions come from low-income clients. While an average savings balance of $276 does not represent a significant store of cash for people living in developed countries, it is a significant amount for poor persons living in developing countries. An extra bit of money set aside as savings may make the difference between successfully coping with an economic shock or being forced to engage in increasingly severe coping strategies (e.g., selling off productive assets, emigration, child labor, borrowing from loan sharks) to meet cash demands. Banking regulations in most countries prohibit NGOs from intermediating savings (taking savings deposits and lending out those funds to loan clients). Thus microfinance NGOs generally only collect savings from loan clients, typically in the form of mandatory savings denominated as a percentage of the loan. Mandatory savings can serve to teach loan clients fiscal discipline, although their main function is to serve as cash collateral for loans. For some countries, microfinance NGOs also can offer voluntary savings, which typically have much more flexible rules than mandatory savings regarding deposits, minimum balances, and withdrawals. USAID also supports a variety of regulated institutions (credit unions, cooperatives, finance companies, and commercial banks) that are legally permitted to mobilize and intermediate savings from the general population (including but not limited to loan clients). Of the 3009 USAID-supported microfinance institutions providing data for FY 2003, 194 reported on their savings services.10 These include 52 MFIs that provide mandatory savings only, 107 MFIs that offer both mandatory and voluntary savings, and 37 institutions that offer only voluntary savings.
9 Excludes BRI in Indonesia, which also reported on its savings activities. 10 Typically more institutions offer savings services than report to MRR on those services. MFIs do not report on this data to USAID because they are not funded by USAID for this activity, even though MRR requests the information. Therefore, readers should not infer from this response that only two-thirds of reporting MFIs offer savings; the actual number is likely higher.

Microenterprise Results Reporting: 2003 Annual Report 18
A disproportionately large share of savers and savings is accounted for by a relatively small number of savings-led institutions or programs. Table 13 shows the 9 institutions or programs with the largest number of savers and deposits. These nine account for 49 percent of clients and 70 percent of savings held at USAID-supported institutions. Table 13. Leading Savings Institutions or Networks Supported by USAID, FY 2003
Institution Name
Type of Institutions
Savings Members
Savings Amounts
(US$ millions)
Average Savings Account (US$)
WOCCU Mexico Credit unions 774,778 $581.4 $750 FECECAM/Benin Credit union 501,698 $51.1 $101
COPEME Peru MFI
Association 168,583 $106.4 $630 Credit Mutuel Senegal Credit union 159,743 $37.6 $235 WOCCU Ecuador Credit unions 141,921 $39.2 $276 Rural Green Bank of Caraga Philippines
Rural bank 129,465 $2.5 $19
Consejo Mundial de Cooperativas de Ahorro y Credito Bolivia
Credit union
124,522 $50.5 $405 WOCCU Romania Credit unions 122,265 $11.4 $93 Nyesigiso Mali Credit union 111,442 $8.3 $74 Total 2,234,417 $888.4 $397
Location of Microfinance Clients
Reaching rural populations is a particular challenge for microfinance institutions. While the heaviest concentrations of poor and vulnerable populations are found in rural areas, geographic isolation, underdeveloped infrastructures, and fragmented markets all make serving rural markets both difficult and costly. For this reason, USAID has a long record of supporting microfinance institutions that target rural areas. Given the inherent challenges, USAID-supported microfinance institutions have done a good job reaching rural areas. In FY 2003, 47 percent of loan clients at these institutions lived in rural areas. Many institutions in Latin America and the Caribbean are primarily urban focused, hence rural clients constitute only one third of total clients. Asian institutions have proven particularly successful at reaching rural clients; an outcome that is not surprising given the high rural population densities in several Asian countries relative to countries in the other regions. Table 14. Location of Microfinance Clients
Region Rural
Percent Urban
Percent Africa 55 45 Asia 84 16 Near East 48 52 Europe/Eurasia 32 68 Latin America/Caribbean 31 78 Total 47 60

Microenterprise Results Reporting: 2003 Annual Report 19
Portfolio Quality
A longstanding barrier to reaching the poor with formal financial services has been the widely held perception that the poor are bad credit risks. Experience now conclusively demonstrates this perception to be wrong. In fact, the poor are good credit risks and repay at rates equal or superior to the non-poor. Nonetheless, maintaining high repayment rates requires well-run institutions committed to managing risk and maintaining high levels of portfolio quality. USAID has long emphasized portfolio quality, and it regularly monitors the loan performance of the microfinance institutions with which it has active agreements. Two indicators of portfolio quality are loan loss and portfolio-at-risk, the latter defined as outstanding balance (unpaid principal) of loans with payments overdue more than 30 days divided by the value of loans outstanding. Loan loss is the percentage of portfolio that has been written off due to delinquent and defaulted loans. As seen in Table 15, USAID-supported institutions have achieved high levels of portfolio quality by both measures. Loan loss is reasonable for all regions. The portfolio-at-risk is consistently low, ranging from 2-4 percent across all five regions. Table 15. Portfolio-at-Risk and Loan Loss FY 2003
Region
Portfolio-At-Risk (%)
Loan Loss (%)
Africa 3.0 1.5 Asia 3.1 0.3 Near East 3.3 0.7 Europe/Eurasia 2.6 7.5 Latin America/Caribbean 4.2 5.8 Total 3.7 5.0
Sustainability
Because financial services play such an important role in poor households� livelihood and coping strategies, it is critical that poor families maintain access to financial services both now and in the future. Accordingly, USAID promotes institutional sustainability as a key goal for the microfinance institutions it supports. USAID tracks two sustainability measures: operational and financial sustainability. Operational sustainability occurs when an institution produces sufficient revenue from operations to cover all of its operating expenses, including loan losses and the costs of capital. Operational sustainability is an important interim achievement for microfinance institutions indicative of a well-run institution that utilizes inputs efficiently to produce operating revenue. Financial sustainability occurs when an institution generates sufficient operating revenues to cover not only all operating costs but also the costs (actual or imputed) of raising funds from commercial sources at market rates, adjusted for the effects of inflation and subsidies. Financial sustainability

Microenterprise Results Reporting: 2003 Annual Report 20
is the NGO equivalent of profitability. It is the most widely accepted indicator of long-term financial viability. Table 16 shows that over one-half of USAID-supported microfinance institutions were financially sustainable and nearly two-thirds were either financially or operationally sustainable by the end of FY 2003. Clients served by financially sustainable institutions account for 77 percent of loan clients and 87 percent of the total loan portfolio. FY 2003 is the first year in which more than one-half of USAID-supported institutions were financially sustainable. By comparison, in FY 2002 and FY 2001, only 49 percent and 38 percent respectively of supported microfinance institutions had achieved full financial sustainability. Table 16. Sustainability of USAID-Supported Institutions, FY 2003
Region
Not Yet Sustainable
(%)
Operational Sustainability
(%)
Financial Sustainability
(%) Africa (n=110) 45 10 45 Asia (n=56) 30 6 64 Near East (n=22) 36 14 50 Europe/Eurasia (n=47) 43 17 40 Latin America/Caribbean (n=65) 25 12 63 Total (n=300) 37 11 52
ENTERPRISE DEVELOPMENT
Lack of access to credit is not the only constraint to microenterprise formation and growth. Many microentrepreneurs also lack access to higher-value markets, basic business skills, knowledge, or access to business networks that could help them stabilize and grow their businesses. Business development services refer to the myriad services offered to microentrepreneurs to help them acquire necessary skills and knowledge and tap into more vibrant supply chains and markets. BDS institutions come in two types: BDS providers and BDS facilitators. BDS providers are local institutions that offer services directly to microentrepreneurs. BDS facilitators are international or local institutions whose purpose is to expand and improve microentrepreneurs� access to the resources they need to compete in globalizing markets. They do this by facilitating inter-firm cooperation and coordination so that the relationships among firms within a value chain lead to a distribution of learning and benefits that enables microenterprises to innovate and compete. Some BDS institutions are both providers and facilitators. MRR requested data from 138 BDS institutions supported under active agreements in FY 2003; 103 institutions reported data on their clients. Of these, 40 provided services directly to microentrepreneurs, and 48 facilitated BDS provision. Another 15 institutions were both providers and facilitators. An additional 4 institutions reported on their capacity building activities worldwide but provided no data.

Microenterprise Results Reporting: 2003 Annual Report 21
USAID obligated funds to 111 BDS institutions in FY 2003. Eighty-six of these obligations reported on their activities accounting for $43.7 million, or 90 percent of total BDS obligations. As seen in Table 17, USAID-supported BDS programs offered services to 349,000 microentrepreneurs during FY 2003. More than half of these microentrepreneurs were reached through the activities of BDS facilitators and the rest by direct BDS providers. By targeting assistance to BDS facilitators, USAID is able to leverage the impact of its development assistance by funding activities more likely to reach larger numbers of microentrepreneurs, particularly in rural areas. The percentage of women BDS clients has dropped from 48 percent in FY 2002 to 34 percent in 2003, related to two factors: a change in the mix of reporting institutions and the small sample size. While more than two-thirds (31) of the African institutions reported in both 2002 and 2003, a single institution in the FY 2002 universe that did not report in FY 2003 accounts for a reduction in the overall number of clients by 200,000. The clients of this Ethiopian institution were more than 50 percent women. Rural microenterprises face even greater constraints to business formation and growth relative to urban microenterprises. Geographic isolation, fragmented markets, underdeveloped physical infrastructure, weak markets, and heavy reliance on agriculture and agro-businesses form the unique challenges faced by rural microenterprises. These constraints notwithstanding, USAID-supported BDS institutions continue to be effective in reaching rural microenterprises. During FY 2003, more than 8 out of 10 BDS clients reached by USAID-supported BDS institutions were in rural areas. Table 17. Clients of USAID-Supported Enterprise Development Programs, FY 2003 (Providers and Facilitators)
Region
Number of Micro Clients
Percent Women
Percent Rural
Africa (n=45) 162,345 37 92 Asia (n=11) 70,021 37 98 Europe/Eurasia (n=42) 59,782 33 41 Latin America/Caribbean (n=5) 57,021 22 67
Total (n=103) 349,169 34
81 POLICY ADVOCACY AND REFORM
In FY 2003, USAID provided funds to 36 institutions for the purpose of promoting policy or regulatory analysis and reforms affecting the microenterprise sector. Thirty of these institutions reported on their activities accounting for $17.5 million, or 97 percent of total policy obligations. An additional 12 institutions with pre-existing obligations reported on their policy-related activities. The majority of these institutions (64 percent) were located in either Europe or Eurasia.

Microenterprise Results Reporting: 2003 Annual Report 22
MICROENTERPRISE RESULTS REPORTING11
METHODOLOGY ANNEX
This annex addresses two aspects of the Microenterprise Results Reporting system, USAID�s official system for collecting and reporting its annual funding to microenterprise development: the kind of data and the process by which MRR collects data; and the method used to calculate the portion of USAID microenterprise development funds that benefit the very poor (FVP). Collecting the Data MRR collects two types of data. Funding data are tracked as obligations (i.e., financial assistance including grants and contracts) made by missions and other USAID operating units for microenterprise development activities; institutional data are requested from institutions that receive microenterprise funding � USAID�s development partners. Throughout the year, USAID field missions and central offices provide estimates and projections of their planned microenterprise funding to MRR through an online database. USAID/Washington uses these estimates and projections for planning and budgeting purposes. Then, shortly after the end of USAID�s fiscal year on September 30, USAID, offices are asked to provide data on actual, completed obligations made to institutions. To collect institutional data on microenterprise activities, MRR undertakes an annual survey of USAID�s development partners. In some cases, the implementing institutions for a planned microenterprise development activity may not yet have been selected. For example, the USAID office may be negotiating terms, or soliciting bids from other institutions to achieve the best fit for its objectives. Hence, the data entered into the MRR system at that time is preliminary and remains so until the implementing institutions are specified. MRR makes every effort to provide the most complete report of the uses of USAID funding, however, delays in contracting may prevent a full and exhaustive report of the destination of funds obligated in the most recent fiscal year. Because the survey of USAID�s partners occurs soon after funding agreements are signed for activities that will be implemented over several years, the data reported for a given year does not reflect the results of the funding obligated in that year. Rather, the data provides a picture of USAID�s active investments in microenterprise development overall.12 The results of this survey are contained in this report and are also available online at www.mrreporting.org .
11 Microenterprise Results Reporting (MRR) is an activity managed by the Office of Microenterprise Development in the Poverty Reduction Office of the Bureau for Economic Growth, Agriculture and Trade at USAID. This report was prepared by Gary Woller, Catherine Neill, and Sharon Williams of Weidemann Associates, Inc. under the supervision of Stacey Young, Senior Knowledge Management Advisor, and Katharine McKee, Director of the Office of Microenterprise Development (EGAT/PR/MD). 12 While this information is useful for a variety of programmatic purposes, it is not intended, and should not be used, to assess the impact of USAID funding. A valid impact assessment would require time-series data on a set of institutions beginning on receipt of USAID funds. It would also require a control group to assess the counterfactual, i.e., what the outcomes would have been in the absence of USAID funding. The MRR data set does not meet these

Microenterprise Results Reporting: 2003 Annual Report 23
Funding Data: Obligations Funding data are tracked in the form of obligations, which are legally binding USAID agreements to provide financial support to microenterprise institutions and activities. Funding to microenterprise development is reported to MRR when it is clearly determined that the ultimate beneficiaries are microenterprises � defined by the Agency as enterprises with 10 or fewer employees that are owned and operated by poor or low-income people. USAID field missions and offices are directed to report to MRR only on the portions of obligations that directly benefit microenterprises; funding is prorated where the activity may serve larger enterprises in addition to microenterprises, or where funding may support other activities in addition to microenterprise. Microenterprise development is a versatile strategy that is used by field missions to address a range of economic and social issues. For example, microenterprise programs have been funded by USAID under strategic objectives for economic growth, democracy and governance, community health, and women�s literacy and empowerment. The activities defined by the larger objective may include a wide range of development programs addressing this objective. The purpose of MRR, however, is to report solely on the funding for the microenterprise development activity.
Funding data provided by USAID field missions is reviewed by USAID/Washington personnel, including regional and central budget staff. Funding data are subject to change and are adjusted as often as necessary in the MRR database. Funding amounts to institutions may change, for example, when an institution has difficulties accomplishing its objectives. Agreements may be canceled or altered if performance targets are not met. Funds set aside by a field mission for microenterprise development activities have also been de-obligated when a suitable awardee was not found. The tally for actual obligations made during the fiscal year is finalized several months after the end of the year. At that time, each mission or operating unit reports to MRR each institution or activity to which funds were obligated. Sub-obligations, or grants made by the main grantee or contractor to retail microfinance institutions or providers/facilitators of business development services, are also added to the database. Table 18 contains details on the types of institutions receiving obligations in 2003. It includes some activities for which implementing institutions had not yet been selected. It does not include those institutions that received either funds or technical assistance through these direct agreements. Another 83 institutions benefited from USAID support through sub agreements. requirements. Many institutions included in the current survey received USAID funding for the first time in 2003. Many other institutions responding to previous years� surveys terminated their agreements with USAID at the end of FY 2002 or earlier and thus did not respond to the FY 2003 survey. Moreover, many institutions responding to the survey have received assistance from other sources, such that isolating the unique impact of USAID assistance is problematic. Finally, the absence of a control group makes it impossible to determine whether observed outcomes can be attributed to USAID support or to other factors.

Microenterprise Results Reporting: 2003 Annual Report 24
Table 18. Funding for Microenterprise Obligation Recipients, 20031
Microfinance Microfinance Enabling
Environment
BDS Microenterprise Enabling
Environment
Total Obligations2
Amount US$
(000's)
Number Amount
US$ (000's)
Number
Amount US$
(000's)
Number
Amount US$
(000's)
Number
Amount US$
(000's)
Number
Banks
9,633
27
0
-
0
-
0
-
9,633
27
Business Associations
0
-
0
-
1,997
5
0
-
1,997
5
Consulting
29,520
20
5,344
12
15,573
21
9,730
15
60,167
48
Cooperatives & Credit Unions
7,358
8
0
-
4,482
9
0
-
11,840
17
For-Profits/Finance Companies
2,206
4
0
-
656
5
4,889
4
7,751
9
Government Agencies
1,531
4
0
-
1,475
4
0
-
3,006
7
NGOs
16,004
31
193
4
8,385
24
395
3
24,977
54
Non-Bank Financial Institution
20,731
13
0
-
20
1
0
-
20,751
14
PVOs
16,706
29 0
-
15,986
38
969
2
33,661
66
Research Institutions
160
1
640
1
2,330
5
200
1
3,330
7
USAID3
2,051
4
922
2
1,010
4
255
2
4,238
9
Total4
105,900
141
7,099
18
51,914
116
16,438
27
181,351
263
1 Funds were provided to institutions for loan capital, institutional strengthening, technical assistance, program expansion, monitoring and evaluation, or research and development.
2 Table shows obligations made to umbrellas and apex organizations, not sub-obligations (i.e., funds that primary recipients pass through to other organizations). Institutions that serve as �umbrellas� or �apexes� channel funds or technical support to other institutions.
3 Obligations to USAID include those funds that were used for microenterprise project management and those for which specific implementing institutions had not yet been specified.
4Total for all obligations does not correspond with column totals because 39 institutions had funding for more than one purpose.

Microenterprise Results Reporting: 2003 Annual Report 25
Funding Data: Institutions Using the obligations data obtained after the end of a fiscal year, MRR initiates its annual survey of microenterprise institutions with active USAID funding agreements. Institutions surveyed include those with prior year agreements as well as those that have received funding in the most recent fiscal year. (As noted above, the data on those funded in the most recent fiscal year may not reflect all the eventual end users of USAID funds due to delays in identifying implementing institutions.) Institutions are asked to complete one or more of three questionnaires (microfinance, business development services, and policy or enabling environment) that pertain to the activities for which they received USAID funding. The results of this survey are presented in the preceding report. Prior year reports are available online at www.mrreporting.org. MRR obtains institutional data either directly from the institution, from an apex organization or umbrella contractor, or from the USAID mission. Because umbrella contractors channel funds and technical assistance to other institutions, they are able to gather descriptive data on these �second tier�13 institutions more readily than MRR. A number of missions also collect descriptive data in the course of managing their agreements and provide these data to MRR. For those institutions that MRR surveys directly, each is asked to respond to an online survey or to send their survey response via fax or email if they do not have internet access. The USAID office overseeing the grant or contract assists in contacting and following up with their respective partners. The survey questionnaire is available in three languages: English, French and Spanish. Institutions can view their data from prior years online, which helps to ensure consistency of reporting from year to year. MRR staff closely review each record as it is provided to check for anomalies, data entry errors, and omissions. In addition, umbrella contractors, PVO headquarters, and mission offices review data for institutions under their purview. Microfinance experts within AID also scan the data for anomalies. Microfinance. All institutions that have active agreements with USAID for the purpose of carrying out or expanding financial services for microenterprises and their households are requested to submit data on their programs. Umbrella or apex organizations are asked to provide a list of all the retail or second tier institutions to which they have channeled assistance. In some cases, the umbrella may provide the descriptive data on its second tier organizations, especially in instances where the retail organizations are very small or have limited technical capacity. Some umbrella institutions regularly submit aggregate data on behalf of retail institutions. MRR seeks to report on each individual institution to avoid the possibility of double-counting, but it is not always possible to obtain data at that level.
13 �Second tier� or retail organizations receive support through �first tier� or wholesale institutions. Second tier organizations, as recipients of sub-contracts or sub-grants, are one step removed from a direct relationship with USAID.

Microenterprise Results Reporting: 2003 Annual Report 26
Microfinance institutions are asked to report on standard performance indicators for MFIs, including outstanding portfolio, number of loans, percentage of women borrowers, amount of savings deposits, number of savings clients, percentage of rural clients, portfolio at risk and degree of operational and financial self-sufficiency. Numbers of clients and percentage of portfolio in very small (�poverty loan�) amounts have also been requested as proxies for the number and amount of loans directed to very poor clients. Enterprise development and business development services. BDS institutions are also surveyed on their activities. MRR has two BDS questionnaires: one for BDS facilitators (institutions that expand and improve microentrepreneurs� access to the resources they need to compete in globalizing markets) and another for BDS providers (institutions that offer services directly to individual microentrepreneurs). Institutions that offer both kinds of services complete both questionnaires. The survey questionnaire includes questions on the types of services provided, the numbers of clients, percentage of women clients, percentage of rural clients, and the percentage of clients with poverty loans. Enabling environment or policy advocacy. Policy advocacy institutions also receive a questionnaire about their activities. Institutions that have worked on financial policy or on a wider range of policies affecting microenterprises are asked to describe the nature of their activities on behalf of microentrepreneurs. Table 19 summarizes all the respondents to USAID�s annual microenterprise survey by institution type, including those institutions that had prior year funding and those with initial funding in fiscal year 2003.

Microenterprise Results Reporting: 2003 Annual Report 27
Table 19. Microenterprise Survey Respondents, 2003
Types
Microfinance
Survey
Business
Development Survey
Policy Survey
Total
Banks1
50
-
-
50
Business Associations
4
3
1
8
Consulting Firms
3
17
22
42
Cooperatives/ Credit Unions
65
4
-
69
For-Profits/Finance Companies
7
5
4
16
Government Agencies
2
4
2
8
NGOs
85
31
7
123
Non-Bank Financial Institutions
35
-
3
38
PVOs
18
34
2
54
Research Institutions
3
4
1
8
Rural Banks2
26
-
-
26
USAID - 1 - 1 Other 3 - - 3 Total
3013
1034
42
4463
1 Includes Bank Rakyat Indonesia (BRI), which is excluded from the institution data summary tables due to its scale. 2 Rural banks are structured more like very local credit and savings institutions than like commercial banks. Almost all of these USAID-assisted rural banks are located in the Philippines.
3 In addition, 39 institutions responded to the survey but had no program data to report. Ths majority of these were apex institutions that primarily provide financing and technical assistance to MFIs. The MFIs they assist receive questionnaires to complete and are included in the survey results.
4 Another 4 institutions reported on their capacity building activities. Table 20 presents the response rates for institutions by region. Response rates are high in all regions, particularly Africa, Asia and the Near East and Europe and Eurasia.

Microenterprise Results Reporting: 2003 Annual Report 28
Table 20. Response Rates in 2003 by Region Response rate
Africa Asia/ Near East
Europe/ Eurasia
Latin America/
Caribbean
Worldwide
All
Number of MFIs with active USAID support in 2003
125 96 58 86 11 376
Percentage of MFIs responding to survey
93% 88% 93% 88% 82% 90%
Number of BDS institutions with active USAID support in 2003
57 13
47 11 10 138
Percentage of BDS institutions responding to survey
79% 85% 89% 45% 40% 78%
Number of policy institutions with active USAID support in 2003
6 7 28 4 1 46
Number of policy institutions responding to survey
5 7 27 3 0 42 (91%)
Table 21 presents response rates for only institutions with FY 2003 obligations. It does not include those institutions that received technical assistance or funds under sub agreements. Response rates are calculated on those obligations for which data was requested. This excludes funds for research, salaries and training. These response rates are also high, which demonstrates that there is good compliance with USAID�s request for data from its partners. Response rates in FY 2003 were as follows: 86 percent of microfinance institutions, or 117 of 135; 77 percent of BDS institutions, or 86 of 111; and 83 percent of policy advocacy institutions, or 30 of 36. The combined response rate was 83 percent.

Microenterprise Results Reporting: 2003 Annual Report 29
Table 21. Response Rates for Institutions Receiving Obligations in 2003 Response rate
Number of Obligations
Percent of Total Number of Obligations
Amount of Obligations
(US$ millions)
Percent of Total
Amount of Obligations
Total microfinance activities with 2003 obligations
135
100%
$102.506
100%
Total activities responding to MFI survey
117
86%
$97.366
95%
Total BDS activities with 2003 obligations
111
100%
$48.468
100%
Total activities responding to BDS survey
86
77%
$43.707
90%
Total policy activities with 2003 obligations
36
100%
$18.041
100%
Total activities responding to policy survey
30
83%
$17.477
97%
Measuring the Benefit to the Very Poor In 2000, the U.S. Congress passed the Microenterprise for Self-Reliance Act, which mandated that half of all USAID microenterprise funds benefit the very poor, defined as those living in the bottom 50 percent below their country�s poverty line. This legislation was amended in 2003 to add a second definition of the very poor, i.e., those living on less than $1 a day at purchasing power parity (PPP)14. The 2003 law also requires USAID to develop and certify at least two tools for assessing the poverty level of its microenterprise beneficiaries.15 The Microenterprise Results and Accountability Act of 2004 extends the timeframe for developing the tools, which will now be used in the collection of FY 2006 data. Until then, the poverty loan proxy established in the 2000 Microenterprise for Self-Reliance Act remains the measure USAID is required to use in estimating the direct benefit of USAID microenterprise funds to very poor people. This proxy
14 �$1 a day at PPP� refers to the local equivalent of one U.S. dollar when converted using the purchasing power parity exchange rate, which equalizes the overall purchasing power of different currencies. PPP exchange rates can differ several-fold from official exchange rates, especially in poor countries. For example, in December 2004 one U.S. dollar could buy 76.3 Kenyan shillings at official exchange rates; for the same month, the PPP equivalent of one dollar was 32.0 shillings, nearly 60 percent less. The World Bank maintains the official PPP exchange rates. Readers can learn more by consulting PovCalNet, which contains a �poverty calculator� that incorporates the PPP rates and allows users to generate poverty estimates based on a poverty line of their own choosing: $1/day, $2/day, etc. Go to http://iresearch.worldbank.org/PovcalNet/jsp/index.jsp Readers can also learn more about the actual methodology of the PPP estimates through the World Bank�s International Comparison Program (ICP). Go to http://web.worldbank.org/WBSITE/EXTERNAL/DATASTATISTICS/ICPEXT/0,,contentMDK:20118237~menuPK:62002075~pagePK:60002244~piPK:62002388~theSitePK:270065,00.html 15 A consortium led by the University of Maryland�s IRIS Center has been leading the effort to develop and implement these new measurement methods.

Microenterprise Results Reporting: 2003 Annual Report 30
measure is the percent of portfolio held in poverty loan sizes by MFIs or the number of clients with poverty loans from any source for BDS institutions. Poverty loan amounts for each region, defined by the Microenterprise for Self-Reliance Act of 2000, are:
• $300 in Asia, the Near East, and Africa • $400 in Latin America and the Caribbean • $1,000 in Europe and Eurasia16
As USAID is mandated by Congress to report on poverty lending appropriations by fiscal year, only those institutions receiving funds within the 2003 fiscal year are included in the calculation to determine the percentage of Funds for the Very Poor (FVP). For a thorough explanation of the challenges associated with the use of the current proxies and the limitations of the data obtained from USAID-assisted institutions, please refer to the Methodology Annex for the FY 2002 Annual Report. [www.mrreporting.org] Methodology for calculating FVP, the share of funds benefiting the very poor To arrive at the overall FVP %,17 MRR takes the following steps: 1. It calculates the amount of FVP from financial services (FS) reporters by multiplying the
amount of the obligation to an institution that reported poverty data by the ratio of its loan portfolio held in poverty loans over the total loan portfolio. The resulting amounts are summed to provide the amount of FVP obligations for all FS reporters. For FY 2003, this amount was $19.0 million.
2. It calculates the amount of FVP from BDS reporters by multiplying the amount of the obligation to the institution that reported poverty data by the percent of clients estimated to hold poverty loans (i.e., the ratio of number of clients with poverty loans over the total number of clients). The resulting amounts are summed to provide the amount of FVP obligations for all BDS reporters. For FY 2003, this amount was $7.1 million.
3. It totals all FS funds for the poor (from 1 above) and BDS funds for the poor (from 2 above). This provides the amount of obligations attributable to FVP from which the final overall FVP % is derived. For FY 2003, this amount was $26.1 million.
16 Using the Consumer Price Index to calculate the 2003 poverty loan equivalents in 1997 dollars, the poverty loan sizes would be $344, $458 and $1,146 rather than $300, $400 and $1000. However, because many MFIs have set up their management information systems to provide data on the latter amounts (300/400/1000) MRR continued to request in the 2003 survey that institutions report on those loan sizes as requested. 17 Readers should bear in mind that the FVP calculation for FY 2003 is performed only on funding amounts and data associated with institutions that received obligations in FY 2003. While MRR collects program data from all institutions with active agreements with USAID in a given fiscal year, it uses data only from those institutions that received obligations in the current fiscal year for the purposes of calculating the Funds that benefit the Very Poor (FVP). This is because USAID is mandated by Congress to report on poverty lending appropriations by fiscal year.

Microenterprise Results Reporting: 2003 Annual Report 31
4. It totals all obligations to institutions reporting poverty data (from 1 and 2 above). This provides the total obligations used in the calculation of the FVP percentage. For FY 2003, this amount was $80.9 million.
5. It divides the FVP (from 3 above) by total obligations to institutions reporting poverty data (from 4 above). This provides the FVP percentage reported in Table 5. For FY 2003, this resulted in the following: $26.1 million divided by $80.9 million = 32%.
6. Funding amounts for policy activities and USAID support and research ($30.6 million for FY 2003) are deducted from total microenterprise obligations ($181.5 million for FY 2003).
7. The FVP percentage (derived in 5 above) is assumed to apply to all programs funded in the fiscal year, excluding those amounts mentioned in 6 above. In other words, the FVP% (32% in FY 2003) is extrapolated from obligations to institutions that reported poverty data to obligations to institutions that did not or could not report poverty data. For obligations to institutions/activities that do not involve clients and client data, no claim is made regarding their benefit to the very poor; these funds ($30.6 million for FY 2003) are left out of the FVP.
Hence, the complete formula used by MRR to calculate the benefit of USAID microenterprise funds to the very poor in 2003 is: overall FVP% =
(FVP for FS) + (FVP for BDS) (obligations to poverty data reporters)
MRR also breaks out FVP by region. Combining the FVP for both MFIs and BDS institutions for a region provides a total amount of FVP obligations for the region. The sum of all FVP obligations for a region is divided by the total obligations to the reporting institutions to provide a �Percentage of Funds Benefiting the Very Poor� for the region. All the FVP obligations � across all regions and USAID operating units � are summed and divided by total obligations to reporting institutions to provide a �Percentage of Total Funding for Poverty Lending� worldwide. Table 6, which appears earlier in this report and is reproduced here for the reader�s convenience, presents data on the percentage of USAID microenterprise funds that benefited the very poor in FY 2003.
Table 6. Percentage of Funds Benefiting the Very Poor, FY 2003
Bureau
Total Microenterprise
Funding (US$ millions)
Percent of MFI Funding For Poverty
Lending
Percent of BDS
Funding for Poverty Loan
Clients
Percent of Total Funding Benefiting the
Very Poor Africa Bureau $33.3 71% 19% 30%Asia/Near East Bureau $37.0 71% 53% 67%Europe/Eurasia Bureau $40.0 30% 11% 22%Latin America/Caribbean Bureau $17.8 38% 17% 30%

Microenterprise Results Reporting: 2003 Annual Report 32
Global Bureau $22.8 47% 43% 46%Total all Bureaus $150.91 44% 19% 32%
1 Funds in the amount of $7.039 million used for USAID salaries, research, and training were excluded from this column. Total funds ($23.537 million) provided to improve the enabling environment for microenterprise development were also excluded. The rationale for excluding them is that the extent to which they benefit very poor clients is impossible to estimate by the poverty loan proxy mandated by law, since they do not directly serve clients. Thus, in assessing what portion of total USAID microenterprise funds ($181.5 million) directly benefited the very poor, MRR can report with certainty that the funds that directly benefited the very poor equaled 32% of the $80.9 million that went to reporters of poverty loan data. MRR believes that the same percentage � 32% -- can reasonably be extrapolated to the activities of FS ($61.425 million) and BDS ($13.701 million) institutions that either could not or did not report as well (including SOAGS). For the remaining $30.6 million of USAID microenterprise funds, which went to activities that cannot yield poverty loan data (policy work, and USAID staffing, research, and support), it is impossible to determine the extent of benefit to the very poor with the measurement method available. The two primary reasons for the decline in the percentage of funds to the very poor � using the Congressionally mandated method for the calculation of this percentage � are:
• A combined increase in funding accompanied by higher response rates in Europe and Eurasia region (93% for MFIs and 89% for BDS institutions) where the percentage of clients meeting the standard for �very poor� as set by MSRA is lower than in other regions.
• The low reported percentages of funds for the very poor for BDS funding across almost all regions.18 Because of the lack of logical connection between the poverty loan proxy and BDS activities, BDS response rates are generally lower.
18 ANE is at 53% but is based on a very small sample.

Microenterprise Results Reporting: 2003 Annual Report 33
ACRONYMS ACCION Americans for Community Cooperation in Other Nations ACDI/VOCA Agricultural Cooperative Development International/Volunteers in
Overseas Cooperation and Assistance AFR Africa (USAID) ANE Asia and the Near East Region (USAID) ATA Aid to Artisans BDS Business Development Services BRI Bank Rakyat Indonesia DA Development Assistance CACEDRF Central American and Caribbean Disaster Relief Fund CSD/HIV Child Survival and Development/Human Immunodeficiency Virus ESF Economic Support Funds EE Enabling Environment E&E Europe and Eurasia Region (USAID) FINCA Foundation for International Community Assistance FS Financial Services FSA Freedom Support Act FVP Funds that Benefit the Very Poor LAC Latin America and the Caribbean Region (USAID) MD USAID/Washington Microenterprise Development office ME Microenterprise MED Microenterprise Development MF Microfinance MFI Microfinance Institution MRR Microenterprise Results Reporting MSRA Microenterprise for Self Reliance Act (2000) NGO Nongovernmental Organization PVC Office of Private and Voluntary Cooperation (USAID) PVO Private Voluntary Organization SAI Special Assistance Initiatives SEED Support for Eastern European Democracy SOAG Strategic Objective Agreement USAID United States Agency for International Development WOCCU World Council of Credit Unions Posted March 13, 2006

Table of Contents
Annex A: Summary of USAID Microenterprise Funding by Mission, 1996-2003 Annex B: Microenterprise Funding by USAID Bureau, 2003 Annex C: Microenterprise Funding by Region, 2003 Annex D: Microenterprise Funding by Fund Account, 2003 Annex E: Institutions with Amounts of 2003 Funding by USAID Bureau Annex F: Microfinance Institutions with Portfolio Data by Location of Institution, 2003 Annex G: Microfinance Savings Data, Location of Clients and Sustainability, 2003 Annex H: Poverty Lending Ratings by Location of Institution, 2003 Annex I: BDS Providers in USAID Survey, 2003 Annex J: BDS Facilitators in USAID Survey, 2003 Annex K: Policy Research by USAID-Supported Institutions, 2003

ANNEX A
BUREAU MISSION 1996 1997 1998 1999 2000 2001 2002 2003AFRICA
Africa Bureau $800Angola $900Benin $1,835 $1,040 $1,397 $1,109 $985 $1,473 $951Eritrea $200 $200 $2,226 $1,925 $1,075 $345Ethiopia $34 $1,049 $1,683 $600 $756 $731 $460Gambia $276Ghana $2,584 $4,515 $4,448 $6,322 $6,000 $5,692 $2,947 $3,891Guinea $500 $401 $73 $1,300 $600 $600 $953 $981Guinea-Bissau $2,575 $2,033Kenya $2,000 $2,904 $1,717 $2,629 $943 $2,357 $1,581 $3,276Madagascar $229 $260 $225 $0 $200Malawi $635 $541 $1,700Mali $148 $417 $809 $3,131 $2,265 $2,710 $796 $2,000Mauritania $425Mozambique $3,373 $2,370 $2,802 $0 $1,932 $1,086 $3,264 $3,264Namibia $712 $241 $95 $200Niger $715 $0Nigeria $200 $3,090 $2,000 $525RCSA $400 Senegal $932 $364 $2,500 $2,778 $12,916 $3,852 $3,874 $4,385South Africa $3,781 $3,308 $4,005 $50 $1,000 $1,000 $1,500 $382Sudan $1,000 $2,000Tanzania $200 $950 $2,000 $2,650 $2,544 $5,006Uganda $3,044 $5,481 $5,162 $4,752 $2,540 $1,300 $582 $1,200Zambia $600 $1,000 $616 $1,500 $1,869 $1,021 $886 $1,053Zimbabwe $350 $35 $200 $2,940 $2,010 $1,000 $875
$22,853 $25,764 $24,421 $26,917 $39,140 $31,669 $26,842 $34,019
ASIA/NEAR EAST Afghanistan $7,090Bangladesh $5,670 $8,639 $7,663 $3,388 $2,000 $4,105 $1,400 $1,337Cambodia $1,281 $750 $1,000Egypt $10,000 $15,000 $21,667 $15,000 $5,777 $15,000 $36,192 $17,016India $428 $250 $1,300 $1,300 $1,300Indonesia $747 $866 $1,000 $4,186 $1,700 $1,700 $1,500Jordan $500 $2,792 $3,539 $5,739 $7,655 $6,000 $3,150 $2,250Lebanon $1,000 $1,000 $2,100 $866 $2,500 $500Mongolia $105 $920 $700Morocco $3,600 $1,450 $990 $2,000 $1,200 $900 $900 $0Nepal $50 $1,170 $1,855 $500 $1,500Pakistan $3,700Philippines $8,411 $3,000 $2,746 $900 $1,000 $2,540 $3,745 $2,010Sri Lanka $769 $200West Bank/Gaza $1,888 $2,499 $3,311 $501 $3,133 $2,515 $650 $1,107
$30,888 $36,925 $43,637 $32,659 $28,067 $37,665 $49,957 $38,510
EUROPE/EURASIAAlbania $225 $1,000 $1,000 $1,500 $950 $550 $0 $0Armenia $553 $2,150Azerbaijan $991 $4,200 $6,961 $3,100 $5,144 $4,413Bosnia $669Bulgaria $771 $132 $524 $1,450 $1,266 $1,118 $2,300 $2,500Central Asian Republics $500Caucasus $6,940 $2,000Croatia $500 $500 $864 $4,645Europe/Eurasia Region $200 $1,000 $200 $292Georgia $923 $2,027 $500 $3,590 $1,172 $2,350Hungary $310Kazakstan $244 $1,377 $1,975 $3,045 $2,715 $3,300 $4,598Kosovo $1,000 $1,600 $692Kyrgystan $487 $2,878 $1,177 $1,826 $999 $2,523 $2,802 $3,736Macedonia $950 $900 $500 $2,000 $1,300 $1,000 $0 $623Moldova $60 $180 $200 $1,200 $4,056Montenegro $1,984 $1,400 $200 $60
Summary of USAID Microenterprise Funding by Mission, 1996-2003 (US$ '000s)
AFRICA Subtotal
ANE Subtotal
A-1

BUREAU MISSION 1996 1997 1998 1999 2000 2001 2002 2003Poland $1,693 $19,088Romania $1,405 $3,200 $2,050 $4,547 $1,758 $1,293 $459 $1,397Russia $2,475 $2,139 $7,340 $7,357 $5,218 $4,470 $7,123 $4,500Serbia $2,000 $2,135 $4,465Tajikistan $101 $1,479 $2,235 $2,214 $1,651Turkmenistan $356 $638 $520 $25Ukraine $2,403 $1,238 $4,948 $2,900 $7,539 $13,003Uzbekistan $40 $583 $442 $3,025 $2,486
$10,473 $45,398 $18,941 $26,554 $35,535 $27,118 $40,017 $55,469
LATIN AMERICA/CARIBBEANBolivia $1,775 $1,800 $3,230 $1,200 $1,700 $2,025 $2,500 $700Dominican Republic $1,300 $780 $500 $0Ecuador $1,094 $796 $945 $758 $2,730 $4,260 $1,870El Salvador $2,478 $3,214 $3,800 $2,990 $2,918 $4,366 $7,180 $1,904Guatemala $708 $1,974 $1,403 $9,576 $2,155 $2,136 $1,751 $1,292Guyana $53 $30 $164 $820 $800 $400Haiti $3,148 $2,868 $3,698 $7,246 $6,789 $1,964 $3,000 $3,443Honduras $587 $914 $4,536 $9,462 $2,519 $1,132 $1,706Jamaica $442 $389 $640 $1,074 $1,926 $1,500 $500Mexico $200 $147 $550 $1,000 $1,000 $900Nicaragua $448 $1,222 $1,440 $2,817 $1,021 $1,741 $1,400 $1,400Peru $3,220 $4,447 $6,564 $5,863 $9,357 $8,011 $13,086 $4,853Regional Programs $1,444 $1,453
$15,200 $20,101 $21,080 $36,303 $36,643 $29,238 $37,609 $18,968
CENTRAL BUREAUSGLOBAL
Business Development $3,150 $10,750Development Credit $61 $573 $375 $784 $3,021 $3,241 $3,052Emerging Markets $2,800Microenterprise $19,494 $28,534 $24,994 $12,288 $22,844 $17,056 $22,288 $22,654Housing (RHUDO) $300Women in Develop. $645Private & Voluntary Cooperation (PVC) $10,926 $9,162 $8,877
$23,239 $28,595 $28,717 $23,413 $23,628 $31,003 $34,691 $34,583
BUREAU FOR HUMANITARIAN RESPONSEPVC $8,705 $8,289 $8,316 $7,650 $8,195
$8,705 $8,289 $8,316 $7,650 $8,195
$31,944 $36,884 $37,033 $31,063 $31,823 $31,003 $34,691 $34,583
GRAND TOTAL $111,358 $165,072 $145,112 $153,496 $171,208 $156,693 $189,116 $181,549
BHR Subtotal
Global Subtotal
SUBTOTAL Central Bureaus
E&E Subtotal
LAC Subtotal
A-2

ANNEX B
BUREAU MISSION FINANCE FINANCIAL POLICY BDS MICROENTERPRISE
POLICY TOTAL
AFRICA Angola $900 $900 Benin $392 $108 $451 $951
Eritrea $345 $345Ethiopia $210 $250 $460Ghana $200 $3,691 $3,891Guinea $981 $981Kenya $646 $2,430 $200 $3,276Madagascar $200 $200Malawi $1,700 $1,700Mali $2,000 $2,000Mauritania $425 $425Mozambique $3,264 $3,264Namibia $200 $200Nigeria $525 $525Senegal $3,241 $1,144 $4,385South Africa $382 $382Sudan $2,000 $2,000Tanzania $5,006 $5,006Uganda $950 $250 $1,200Zambia $1,053 $1,053Zimbabwe $375 $500 $875
$13,946 $108 $19,515 $450 $34,019
ASIA/NEAR EAST Afghanistan $7,090 $7,090 Bangladesh $157 $1,180 $1,337
Egypt $17,016 $17,016India $1,300 $1,300Indonesia $468 $243 $789 $1,500Jordan $2,250 $2,250Lebanon $500 $500Mongolia $700 $700Pakistan $3,700 $3,700Philippines $1,522 $488 $2,010West Bank /Gaza $1,107 $1,107
$35,110 $731 $1,880 $789 $38,510
EUROPE/ EURASIA Albania $0 $0
Azerbaijan $2,627 $1,786 $4,413Bosnia $669 $669Bulgaria $2,500 $2,500Croatia $1,644 $3,001 $4,645EE Region $292 $292
Total AFRICA
Total ANE
Microenterprise Funding by USAID Bureau, 2003 (US$ '000s)
B-1

BUREAU MISSION FINANCE FINANCIAL POLICY BDS MICROENTERPRISE
POLICY TOTAL
Georgia $850 $1,500 $2,350Kazakhstan $1,750 $528 $2,320 $4,598Kyrgyzstan $847 $72 $1,136 $1,682 $3,737Macedonia $300 $323 $623Moldova $575 $55 $3,329 $96 $4,055Montenegro $60 $60Romania $1,397 $1,397Russia $3,100 $1,400 $4,500Serbia $2,850 $1,615 $4,465Tajikistan $573 $175 $903 $1,651Turkmenistan $25 $25Ukraine $10 $6,548 $6,445 $13,003Uzbekistan $1,653 $172 $661 $2,486
$21,345 $3,319 $18,698 $12,107 $55,469
LATIN AMERICA/ CARIBBEAN Bolivia $700 $700
Ecuador $1,870 $1,870El Salvador $1,904 $1,904Guatemala $956 $336 $1,292Guyana $20 $240 $140 $400Haiti $2,593 $850 $3,443Honduras $1,205 $501 $1,706Jamaica $500 $500Mexico $600 $300 $900Nicaragua $1,400 $1,400Peru $2,673 $2,180 $4,853
$14,401 $320 $4,107 $140 $18,968
GLOBAL DC $3,052 $3,052MD $12,713 $2,622 $4,368 $2,951 $22,654PVC $5,530 $3,347 $8,877
$21,295 $2,622 $7,715 $2,951 $34,583
$106,097 $7,100 $51,915 $16,437 $181,549GRAND TOTAL
Total E&E
Total GLOBAL
Total LAC
B-2

REGION COUNTRY FINANCE FINANCIAL POLICY BDS MICROENTERPRISE
POLICY TOTAL
AFRICAAngola $900 $900Benin $892 $108 $451 $1,451DR Congo $0Eritrea $345 $345Ethiopia $350 $650 $1,000Ghana $494 $3,691 $4,185Guinea $981 $981Guinea-Bissau $400 $400Kenya $1,471 $2,430 $200 $4,101Madagascar $200 $200Malawi $1,700 $1,700Mali $3,342 $3,342Mauritania $425 $425Mozambique $200 $3,264 $3,464Namibia $200 $200Nigeria $525 $525Senegal $3,487 $1,144 $4,631South Africa $382 $325 $707Sudan $2,000 $2,000Tanzania $5,006 $5,006Uganda $1,568 $250 $1,818Zambia $1,053 $1,053Zimbabwe $375 $500 $875
$18,111 $433 $20,315 $450 $39,309
ASIA Bangladesh $805 $1,180 $1,985India $2,500 $757 $3,257Indonesia $652 $243 $789 $1,684Mongolia $700 $700Nepal $600 $600Pakistan $3,700 $3,700Philippines $2,022 $488 $2,510
$10,279 $731 $2,637 $789 $14,436
EUROPE/ EURASIA Albania $0 $0
Azerbaijan $2,627 $1,786 $4,413Bosnia $669 $669Bulgaria $2,901 $2,901Croatia $1,644 $3,001 $4,645EE Region $292 $292Georgia $850 $1,500 $2,350Kazakhstan $1,782 $528 $2,321 $4,631Kyrgyzstan $847 $72 $1,136 $1,682 $3,737
Total AFRICA
ANNEX C
Total ASIA
Microenterprise Funding by Region, 2003(US$ '000s)
C-1

REGION COUNTRY FINANCE FINANCIAL POLICY BDS MICROENTERPRISE
POLICY TOTAL
Macedonia $300 $323 $623Moldova $811 $55 $3,329 $96 $4,291Montenegro $60 $60Romania $1,397 $1,397Russia $3,441 $1,400 $4,841Serbia $2,850 $1,615 $4,465Tajikistan $573 $175 $904 $1,652Turkmenistan $25 $25Ukraine $10 $6,548 $6,445 $13,003Uzbekistan $1,653 $172 $661 $2,486
$22,355 $3,319 $18,698 $12,109 $56,481
LATIN AMERICA/ CARIBBEAN Bolivia $700 $700
Colombia $1,000 $1,000Ecuador $2,102 $2,102El Salvador $2,480 $2,480Guatemala $1,000 $336 $1,336Guyana $20 $240 $140 $400Haiti $2,593 $920 $3,513Honduras $1,411 $501 $1,912Jamaica $500 $500Mexico $600 $300 $900Nicaragua $1,400 $1,400Peru $3,481 $2,180 $5,661Trinidad $73 $73
$17,340 $320 $4,177 $140 $21,977
NEAR EAST Afghanistan $7,590 $7,590 Egypt $17,016 $17,016 Jordan $2,250 $2,250
Lebanon $500 $500 Morocco $600 $600 West Bank /Gaza $1,107 $1,107
$29,063 $0 $0 $0 $29,063
WORLDWIDE* Worldwide $8,949 $2,297 $6,088 $2,951 $20,285$8,949 $2,297 $6,088 $2,951 $20,285
GRAND TOTAL $106,097 $7,100 $51,915 $16,439 $181,551
*Worldwide refers to funds used for salaries, training, and research that serve all of USAID'sfield operations. It also includes funding support to PVO headquarters based in North America.
Total WORLDWIDE
Total NEAR EAST
Total E&E
Total LAC
C-2

BUREAU MISSION AEEB CSD/HIV DA ESF FSA INC LC SAI/SEED TOTALAFRICA Angola $200 $700 $900
Benin $651 $300 $951Eritrea $345 $345Ethiopia $460 $460Ghana $891 $3,000 $3,891Guinea $981 $981Kenya $1,921 $1,355 $3,276Madagascar $200 $200Malawi $1,700 $1,700Mali $2,000 $2,000Mauritania $425 $425Mozambique $3,264 $3,264Namibia $200 $200Nigeria $525 $525Senegal $4,385 $4,385South Africa $382 $382Sudan $2,000 $2,000Tanzania $5,006 $5,006Uganda $1,200 $1,200Zambia $1,053 $1,053Zimbabwe $500 $375 $875
$1,025 $27,639 $2,355 $0 $3,000 $0 $34,019
ASIA/ NEAR EAST Afghanistan $7,090 $7,090 Bangladesh $1,180 $157 $1,337
Egypt $17,016 $17,016India $1,300 $1,300Indonesia $1,500 $1,500Jordan $2,250 $2,250Lebanon $500 $500Mongolia $700 $700Pakistan $3,700 $3,700Philippines $2,010 $2,010West Bank /Gaza $1,107 $1,107
$16,780 $21,573 $0 $157 $0 $38,510
EUROPE/ EURASIA Albania $0 $0
Azerbaijan $4,413 $4,413Bosnia $669 $669Bulgaria $2,500 $2,500Croatia $3,001 $1,644 $4,645EE Bureau $199 $93 $292Georgia $2,350 $2,350Kazakhstan $4,598 $4,598Kyrgyzstan $3,736 $3,736Macedonia $623 $623Moldova $4,056 $4,056Montenegro $60 $60Romania $1,397 $1,397Russia $4,500 $4,500Serbia $4,465 $4,465Tajikistan $1,651 $1,651Turkmenistan $25 $25
ANNEX D
Total AFRICA
Total ANE
Microenterprise Funding by Fund Account, 2003(US$ '000s)
D-1

BUREAU MISSION AEEB CSD/HIV DA ESF FSA INC LC SAI/SEED TOTALUkraine $13,003 $13,003Uzbekistan $2,486 $2,486
$3,670 $0 $0 $0 $41,017 $0 $10,782 $55,469
LATIN AMERICA/ CARIBBEAN Bolivia $700 $700
Ecuador $400 $1,470 $1,870El Salvador $1,904 $1,904Guatemala $1,066 $226 $1,292Guyana $400 $400Haiti $2,993 $450 $3,443Honduras $1,706 $1,706Jamaica $500 $500Mexico $900 $900Nicaragua $1,400 $1,400Peru $2,340 $1,540 $973 $4,853
$0 $11,316 $4,463 $0 $1,540 $1,649 $0 $18,968
GLOBAL DC $3,052 $3,052MD $22,654 $22,654PVC $8,877 $8,877
$0 $34,583 $0 $0 $0 $0 $34,583
GRAND TOTAL $3,670 $1,025 $90,318 $28,391 $41,017 $1,540 $4,806 $10,782 $181,549
USAID Fund AccountsAEEB Assistance for Eastern Europe and the Baltics (included with SAI/SEED in summary report)CSD/HIV Child Survival and Development/HIVDA Development AssistanceESF Economic Support FundsFSA Freedom Support ActINC Alternative Development (included with DA in summary report)LC Local Currency, from PL 480 or balance of payments supportSAI/SEED Special Assistance Initiatives/ Support for Eastern European Democracy
Total GLOBAL
Total LAC
Total EE
D-2

BUREAU MISSION OFFICE OBLIGATION AMOUNT
AFRICA Angola Mission/Angola CREDITMission/Angola CREDIT
900$ Benin Goverance CREDIT
Governance EWW/Benin EnterpriseWorks NONCRDGovernance FINPOL
951$ Eritrea Economic Growth/Food NONCRD
345$ Ethiopia Mission CREDIT
Mission NONCRD
460$ Ghana PRIVATE SECTOR CREDIT
PRIVATE SECTOR NONCRDPRIVATE SECTOR NONCRD
PRIVATE SECTOR NONCRDPRIVATE SECTOR NONCRD
PRIVATE SECTOR NONCRD3,891$
Guinea
50$ ACDI/VOCA/Ethiopia 150$ ACDI/VOCA/Ethiopia
Total Eritrea
Mission
Mission
CREDIT
NONCRD
345$ REU Rural Enterprise Unit/Eritrea
INSTITUTION FUNCTION
Total AngolaCARE Benin 392$
NVB NovoBanco S.A.R.L./Angola 200$
451$
NONCRD 300$
2,519$
PRIVATE SECTOR OICI Opportunities Industrialization Centers International/Ghana
NONCRD 652$
NONCRD 329$
Natural Resource Management
Natural Resource Management Enrma Expanded Naturel Ressources Management/Guinea
Enrma Expanded Naturel Ressources Management/Guinea
TNS/G TechnoServe/GhanaTotal Ghana
15$ GEEKCORP/IESC/Ghana 200$
PRIVATE SECTOR Federation Association of Ghanaian Exporters NONCRD 193$
Ghana Co-operative of Susu Collectors
AMEX International, Inc./Ghana 400$ Aid to Artisans/Ghana 64$ ADRA Adventist Relief Agency/Ghana 200$
Virginia Tech Virginia Polytechnic and State University/EthiopiaVirginia Tech Virginia Polytechnic and State University/Ethiopia
Total Ethiopia
160$
100$
Total Benin
ANNEX E
CARE /Benin FINPOL 43$
700$ Development Workshop/Angola
Institutions with Amounts of 2003 Funding by USAID Bureau (US$ '000s)
Governance
SOAG/Benin 65$
E-1

BUREAU MISSION OFFICE OBLIGATION AMOUNT
INSTITUTION FUNCTION
981$ Kenya ABEO NONCRD
ABEO CREDITABEO NONCRD
3,276$ Madagascar Economic Growth NONCRD
200$
1,700$ Mali USAID/Mali/AEG CREDIT
2,000$ Mauritania FFP CREDIT
425$ Mozambique NONCRD
NONCRDNONCRDNONCRD
NONCRDNONCRDNONCRD
3,264$ Namibia Private Sector NONCRD
200$ Nigeria CREDIT
525$ Senegal Private Sector CREDIT
Private Sector NONCRD
Total Guinea
ABEO
200$
Total Kenya
KIPPRA Kenya Institute for Public Policy Research and Analysis/Kenya
CREDIT 196$ ABEO NONCRD 1,000$ USAID Kenya BDS Program/KenyaABEO NONPOL
Total Namibia
CREDIT
Total MadagascarUSAID Malawi CREDIT 1,700$
Total Malawi
Total Mali
Total Mauritania
ASACASE/Senegal 65$ ASACASE/Senegal 235$
300$ CEDPA Centre for Development and Population Activities/Nigeria
Africare Africare/Nigeria225$
Total Nigeria
200$ Sigma One Corporation/Namibia
World Vision/Mozambique 50$ Total Mozambique
Save the Children/Mozambique 50$ TechnoServe, Inc./Mozambique 988$
CLUSA Cooperative League of the United States of America/MozambiqueFHI/Mozambique Food For The Hungry International/Mozambique
Africare/Mozambique 50$ CARE/Mozambique 50$
NONCRD 988$
NONCRD 50$
988$ ADRA/Mozambique 50$ ACDI/VOCA Mozambique/Mozambique
425$ World Vision/Mauritania
2,000$ Chemonics International/Mali
OIBM Opportunity International Bank of Malawi/Malawi
SOAG Madagascar 200$
Malawi
CDA Coast Development Authority/Kenya 905$ Co-operative Bank of Kenya Limited/Kenya
525$ CDA Coast Development Authority/Kenya 450$ ACDI/VOCA/Kenya
E-2

BUREAU MISSION OFFICE OBLIGATION AMOUNT
INSTITUTION FUNCTION
Senegal
Private Sector NONCRD
4,385$
382$ Sudan SFO CREDIT
2,000$ Tanzania Economic Growth NONCRD
Economic Growth NONCRDEconomic Growth NONCRDEconomic Growth NONCRD
5,006$ Uganda
CREDITCREDIT
NONPOL
CREDIT
1,200$ Zambia USAID/Zambia
USAID/Zambia
Total Senegal
Private Sector CREDIT 3,006$
Private Sector NONCRD 751$
40$ EWW EnterpriseWorks Worldwide/Senegal NONCRD 188$
NONCRD
Total South Africa
South Africa
Total Sudan
Total Tanzania
NONCRDNONCRD
CREDIT
Microenterprise Support/TanzaniaEnterprise Works/TanzaniaDAI Development Alternatives, Inc./Tanzania
CREDIT
CREDIT 88$
CREDIT
100$
99$
CREDITUganda Microfinance Union/Uganda 277$ U-TRUST UGANDA FINANCE TRUST LIMITED(formerly UWFT)/Uganda
382$
550$ 450$
75$
206$ 650$
2,400$
CREDIT 123$
NONCRDTotal Uganda
CLUSA RGB Co-operative League of the USA - Rural Group Business program/Zambia
NONCRDCLUSA RGB Copperbelt program Co-operative 50$
Microenterprise Support/Uganda 250$ PRIDE UGANDA
Katakwi Soroti Development Organisation (KASO)
MED-Net Microenterprise Development Network/Uganda
43$
FTCU Feed The Children Uganda 60$ FUL Faulu Uganda Ltd./Uganda 185$
FOCCAS Foundation for Credit and Community Assistance/Uganda
Economic Growth Tuskeege University/Sokoine University/TanzaniaEconomic Growth TechnoServe Tanzania
ACDI/VOCA/Tanzania 750$
Chemonics International Inc./Sudan 2,000$
FINCA Foundation for International Community Assistance/South Africa
Special Objective CasamanceSpecial Objective Casamance
EWW EnterpriseWorks Worldwide/Senegal
South Africa
APRAN/Senegal100$
Chemonics International Inc. - DynaEntreprises Project/Senegal
Chemonics International Inc. - DynaEntreprises Project/Senegal
E-3

BUREAU MISSION OFFICE OBLIGATION AMOUNT
INSTITUTION FUNCTION
USAID/Zambia NONCRD
USAID/Zambia NONCRD
USAID/Zambia NONCRD
USAID/Zambia NONCRD
USAID/Zambia NONCRD
1,053$ Zimbabwe SED
SED
875$ 34,019$
ANE Afghanistan CREDIT7,090$
Bangladesh Office of Economic Growth CREDITOffice of Economic Growth NONCRDOffice of Economic Growth NONCRD
1,337$ Egypt CREDIT
SEB Activity CREDIT17,016$
India USAID/India CREDIT1,300$
Indonesia CREDITEconomic Growth FINPOLEconomic Growth CREDITEconomic Growth NONPOLEconomic Growth Office FINPOL
1,500$ Jordan CREDIT
2,250$
Total Afghanistan
Total BangladeshWorldFish Center/Bangladesh
Total ZambiaCREDIT
NONCRD
ZCSMBA-LADT ZCSMBA-Lyambai Agricultural Development Trust/Zambia
League of the USA, Rural Group Business/Zambia
Total India
CARE-UNBAR SAMBA Silk And
375$
500$
Total IndonesiaAMIR Program Achievement of Market-Friendly
Total Jordan2,250$
162$ The Asia Foundation/Indonesia 789$ GIAT/Nathan MSI Growth through Investment
OI Opportunity International/Indonesia 320$
148$ 81$
BRI Bank Rakyat Indonesia/Indonesia
1,300$
NCBA/Egypt 1,416$ CGC Credit Guarantee Company/Egypt 15,600$
Total EgyptCHF Cooperative Housing Foundation
1,000$
157$ IRIS/JOBS University of Maryland/Bangladesh 180$ CARE/Bangladesh
7,090$ Chemonics/Afghanistan
LEAD Linkages for the Economic Advancement of the Disadvantaged/Zimbabwe
LEAD Linkages for the Economic Advancement of the Disadvantaged/Zimbabwe
Total ZimbabweTOTAL AFRICA
50$
ZATAC Zambia Agribusiness Technical Assistance Center/Zambia
150$
ZCSMBA Zambia Chamber of Small and Medium Business Associations/Zambia
253$
50$
IESC Copperlink International Executive Services Corp Copperlink/Zambia
400$
IDE International Development Enterprises/Zambia
E-4

BUREAU MISSION OFFICE OBLIGATION AMOUNT
INSTITUTION FUNCTION
Lebanon Other CREDIT500$
Mongolia Mission NONCRDUSAID/Mongolia NONCRD
700$ Pakistan CREDIT
CREDIT3,700$
Philippines Office of Economic Development and Gover
CREDIT
Office of Economic Development and Gover
FINPOL
Office of Economic Development and Gover
CREDIT
2,010$ West Bank /Gaza
Private Enterprise Office CREDIT
1,107$ 38,511$
EE Azerbaijan USAID/Baku CREDITUSAID/Baku CREDITUSAID/Baku NONCRDUSAID/Baku CREDITUSAID/Baku NONCRD
4,412$ Bosnia DEMO CREDIT
669$ Bulgaria USAID/Bulgaria CREDIT
USAID/Bulgaria CREDIT2,500$
Croatia Mission NONCRDMission NONCRDMission - USAID Croatia CREDIT
4,645$ EE EE Bureau EE/EG FINPOL
EE/EG FINPOL292$
CHF/AMEEN Access to Microfinance and Total Lebanon
Gobi Initiative; Mercy Corps
PPAF Pakistan Poverty Alleviation Fund/PakistanTotal Pakistan
DAI/TPPA Development Alternatives Inc./Transnational Public Policy WOCCU/CUES World Council of Credit Union, Inc. / Credit Union Empowerment &
Total Philippines
Total West Bank/GazaTOTAL ANE
Foundation for International Community IFDC International Fertilizer Development Mercy Corps International/Azerbaijan/AzerbaijanMercy Corps International/Azerbaijan/Azerbaijan
Total AzerbaijanCHF Communities, Habit, Finance (Cooperative
Total Bosnia
Total Bulgaria
Total EE BureauMicrofinance Center/Poland 25$ CARANA Corporation/USA 267$
438$ MCI Mercy Corps` International/Croatia 1,644$ Deloitte Touche Tohmatsu Deloitte Touche
Total Croatia
DAI Development Alternatives Inc./Croatia 2,563$
1,200$ NACHALA Cooperative/Bulgaria 1,300$ CRS Catholic Relief Services/Bulgaria
669$
425$
1,361$ 560$
1,426$ 640$
ACDI/VOCA/Azerbaijan
SC Save the Children USA/West Bank /Gaza 1,107$
500$
1,022$
488$
Chemonics International, Inc./Philippines
600$ KB Khushhalibank/Pakistan 3,100$
200$ CHF/Mongolia GER Initiative/Mongolia 500$
Total Mongolia
500$
E-5

BUREAU MISSION OFFICE OBLIGATION AMOUNT
INSTITUTION FUNCTION
EE Georgia USAID/Caucasus, Economic Growth
CREDIT
USAID/Georgia, Economic Growth
FINPOL
USAID/Georgia, HRST CREDIT2,350$
Kazakhstan NONCRDNONCRDNONCRDNONCRD
EF NONPOLEF CREDITEF NONCRDEF NONCRDEF NONCRDEF NONPOLUSAID/CAR NONPOLUSAID/CAR CREDITUSAID/CAR NONPOL
4,598$ Kyrgyzstan NONCRD
NONCRDNONCRDNONCRDNONCRDNONCRDNONCRDNONCRDNONCRDFINPOLFINPOLFINPOL
USAID/CAR NONPOLUSAID/CAR NONPOLUSAID/CAR NONPOLUSAID/CAR NONPOLUSAID/CAR NONPOLUSAID/CAR EF CREDIT
Chemonics International Chemonics International/GeorgiaChemonics International Chemonics International/GeorgiaCARE International in the Caucasus Cooperative
Total Georgia
CDC/MBAEC Citizens Democracy Corps,
CAMFA/Central Asian Republics
USAID Legal Infrastructure For a Market Barents Group of KPMG Consulting/KyrgyzstanIRT Investment Round Table Public Barents Group of KPMG Consulting/Kyrgyzstan
USAID Legal Infrastructure For a Market BTFF (Microcredit Agency) Bai Tushum Financial
LARC/Kyrgyzstan
70$ 265$
12$ Pragma Corp/Kyrgyzstan 1,238$
232$ Land Reform/Kyrgyzstan 38$ Barents Group of KPMG Consulting/Kyrgyzstan
44$ 13$
78$ 14$
Mashav/Kyrgyzstan 90$ Pragma Corp/Kyrgyzstan 110$
152$ LARC/Kyrgyzstan 104$ Land Reform/KyrgyzstanJunior Achievement/Kyrgyzstan 5$
CDC/MBAEC/Kyrgyzstan 4$ 566$ IFDC International Fertilizer Development
ACDI/VOCA:CAIP/Kyrgyzstan 27$
1,350$ Pragma Corp/Kazakhstan 1,542$ EBRD/KSBP European Bank for Reconstruction
Total Kazakhstan
Pragma Corp/Kazakhstan 636$ ARD, Inc./Kazakhstan 43$
IFC Leasing/Kazakhstan 20$ Pragma Corp/Kazakhstan 2$
400$ 5$
Pragma Corp/Kazakhstan 300$ Bearing Point/Kazakhstan 100$
CAMFA/Central Asian Republics
23$ Mashav/Kazakhstan 135$
ARD, Inc./Kazakhstan 43$
350$
500$
1,500$
E-6

BUREAU MISSION OFFICE OBLIGATION AMOUNT
INSTITUTION FUNCTION
USAID/CAR EF CREDITUSAID/CAR EF CREDITUSAID/CAR EF NONPOLUSAID/CAR EF NONPOL
3,736$ EE Macedonia NONCRD
CREDITCREDIT
623$ EE Moldova USAID/Chisinau CREDIT
USAID/Chisinau CREDITUSAID/Chisinau FINPOLUSAID/Chisinau NONCRDUSAID/Chisinau NONPOLUSAID/Chisinau NONCRDUSAID/Chisinau CREDITUSAID/Chisinau CREDITUSAID/Chisinau CREDITUSAID/Chisinau NONCRD
4,056$ Montenegro Economic Policy and Finance
OfficeNONCRD
60$ Romania Private Sector Inititative CREDIT
1,397$ Russia Business Development &
InvestmentCREDIT
Business Development & Investment
CREDIT
Business Development & Investment
CREDIT
Business Development & Investment
CREDIT
Business Development & Investment Office
FINPOL
4,500$ EE Serbia Economic Policy and Finance
OfficeNONCRD
CAMFA/Central Asian RepublicsMSFF EBRD Micro and Small Finance Facility
USAID Legal Infrastructure For a Market Total Kyrgyzstan
ATA/Macedonia Aid to Moznosti Humanitarian Association WOCCU World Council of Credit Unions,
Total Macedonia
BIZPRO-Moldova Development Alternatives BIZPRO-Moldova Development Alternatives BIZPRO-Moldova Development Alternatives BIZPRO-Moldova Development Alternatives CNFA Citizens Network of Foreign CORPORAÅ¢IA DE FINANÅ¢ARE
PFAP-E East-West Management Institute/MoldovaTotal Moldova
Total Montenegro
Total RomaniaACDI/VOCA MAC/Rural Credit Coops Development/Russia
FINCA Foundation for International Community Assistance/Russia
Total RussiaBooz Allen Hamilton/Serbia 450$
DAI Development Alternatives, Inc./Russia 1,400$
FINCA/Tomsk/Russia 1,800$
600$
ACDI/VOCA/Russia 350$
350$
CHF International Romania/Romania 1,397$
BAH Booz Allen Hamilton/Montenegro 60$
MOLDINDCONBANK S.A./Moldova 87$ 2,051$
38$ MOBIASBANCA S.A./Moldova 185$
96$ 831$
448$
222$ 55$
Banca Sociala S.A./Moldova 43$
30$ 270$
323$
Pragma Corp/Kyrgyzstan 85$ 8$
140$ 442$
E-7

BUREAU MISSION OFFICE OBLIGATION AMOUNT
INSTITUTION FUNCTION
Economic Policy and Finance Office
CREDIT
General Development Office NONCRDGeneral Development Office NONCRDGeneral Development Office NONCRD
Serbia General Development Office NONCRD4,465$
EE Tajikistan PS NONCRDPS NONCRDPS NONCRDPS NONCRDUSAID/CAR NONPOLUSAID/CAR NONPOLUSAID/CAR EF NONPOLUSAID/CAR EF NONPOLUSAID/CAR EF CREDIT
USAID/CAR EF CREDIT
USAID/CAR EF CREDIT
USAID/CAR EF NONPOL1,651$
EE Turkmenistan NONCRD25$
EE Ukraine ODG NONCRDODG NONCRDODG NONPOLOEG NONCRDOEG NONPOLOEG NONPOLOEG NONCRDOEG NONCRDOEG NONCRDOEG NONPOLOEG NONPOLOHST CREDITOHST NONCRD
ADF America`s Development Foundation/SerbiaCHF Cooperative Housing
Total Serbia
Total Tajikistan
Total TurkmenistanCURE/UREP Center for Ukrainian Reform
Chemonics Urban/Rural Land Titling
LSU AgCenter Louisiana State University NTCA BIC NTCA Business Internet UNDP United Nations Development US-UF CPP US-Ukraine Foundation Community Winrock International/Ukraine 10$ Winrock International/Ukraine 711$
19$ 365$
600$ 222$
2,472$ LOL AMP-Land O`Lakes/Ukraine 3,191$
BIZPRO-DAI/Ukraine 1,517$ BIZPRO-DAI/Ukraine 3,409$
Eurasia Foundation/Ukraine 198$ Eurasia Foundation/Ukraine 180$
109$
Pragma Corporation/Turkmenistan 25$
MDTM Micro-entrepreneur Development Support Center/Tajikistan
100$
Pragma Corp/Tajikistan 188$
CAMFA/Central Asian Republics 250$
EBRD European Bank for Reconstruction and Development/Tajikistan
223$
Abt Associates/Tajikistan 6$ ARD/CHECCHI/Tajikistan 48$
ARD/CHECCHI/Tajikistan 62$ Pragma Corp/Tajikistan 600$
MC Mercy Corps/Tajikistan 16$ Pragma Corp/Tajikistan 114$
8$ CDC/MBAEC/Tajikistan 36$ ARD/CHECCHI/Tajikistan
452$ MCI Mercy Corps International/Serbia204$ 189$
ACDI/VOCA CDRA/Serbia 320$
Opportunity International/Serbia 2,850$
E-8

BUREAU MISSION OFFICE OBLIGATION AMOUNT
INSTITUTION FUNCTION
13,002$ EE Uzbekistan PS NONCRD
PS NONCRDPS NONCRDPS NONCRDPS NONCRDUSAID/CAR NONPOLUSAID/CAR NONPOLUSAID/CAR CREDIT
USAID/CAR NONPOLUSAID/CAR CREDIT
2,486$ 55,467$
GLOBAL DC Office of Development CREDITOffice of Development Credit CREDIT
Office of Development Credit CREDIT
Office of Development Credit CREDIT
Office of Development Credit CREDIT
Office of Development Credit CREDIT
Office of Development Credit CREDIT
Office of Development Credit CREDIT
Office of Development Credit CREDIT
Office of Development Credit CREDIT
Office of Development Credit CREDIT
Office of Development Credit CREDIT
Total Ukraine
WOCCU World Council of Credit Unions, Total UzbekistanTotal EE Region
Financiera Calpia, S.A./El Salvador
Center-Invest Bank/Russia
Banrural
75$ KBL K-Rep Bank Limited/Kenya
131$
Ecobank/Ghana 140$
Dhaka Bank/Bangladesh 130$
228$
CBAO/Senegal 246$
Cal Merchant Bank/Ghana 154$
44$
Bank NISP/Indonesia 184$
BANCO SOLIDARIO S.A./Ecuador 232$
308$ Aval Card/Honduras 206$ Solucion Financiera de Credito del Peru/Peru
Pragma/Uzbekistan 600$ 1,525$
ARD, Inc./Uzbekistan 7$ O`z-MARD Uzbekistan Micro-entrepreneur Population Developme/Uzbekistan
128$
Pragma/Uzbekistan 105$ Abt/Uzbekistan 54$
CHF/Uzbekistan 43$ Mercy Corps/Uzbekistan 9$
7$ CDC/MBAEC/Uzbekistan 9$ ARD, Inc./Uzbekistan
E-9

BUREAU MISSION OFFICE OBLIGATION AMOUNT
INSTITUTION FUNCTION
Office of Development Credit CREDIT
Office of Development Credit CREDIT
Office of Development Credit CREDIT
Office of Development Credit CREDIT
Office of Development Credit CREDIT
Office of Development Credit CREDIT
Office of Development Credit CREDIT
3,052$ GLOBAL MD AMAP NONCRD
AMAP CREDITAMAP CREDITAMAP NONCRDAMAP FINPOLAMAP NONCRDAMAP NONPOLAMAP CREDITAMAP NONCRDAMAP NONPOLAMAP FINPOLAMAP NONCRDAMAP NONPOLBASIS Buy-in CREDITCORE Support FINPOLEMDAP CREDITIGP CREDITIGP NONCRDIGP CREDITIGP CREDITIGP CREDITIGP CREDITIGP CREDIT
Total DC
United Bulgarian Bank/Bulgaria
Prime Bank/Bangladesh
MD Office of Microenterprise MD Office of Microenterprise EMDAP Emerging Markets Development
Grameen Foundation/Uganda 618$
FINAMERICA/Colombia 1,000$ Financiera Calpia, S.A./El Salvador 445$
Caisse Desjardin/Mali 592$ Cashpor/India 1,200$
500$ AT Appropriate Technology/India 757$ Aga Khan/Afghanistan
387$
364$ 857$
Weidemann Assoc./Mali 364$ Weidemann Assoc./Mali 1,500$
The QED Group, LLC/Worldwide 1,447$ Weidemann Assoc./Mali 800$
PricewaterhouseCoopers, LLP/Worldwide 718$ The Louis Berger Group, Inc./Worldwide 774$
103$ 5$
DAI Development Altermatives Inc. 750$ 640$ IRIS Center for Institutional Reform and the
MD Office of Microenterprise MD Office of Microenterprise
Chemonics International, Inc./USA 800$ DAI Development Altermatives Inc. 900$
ACDI/VOCA/Worldwide 750$
Victoriabank/Moldova 70$
401$
Russia Banker`s House/Russia 114$
Royal Bank/Trinidad 73$
118$
Moldova AgrolndBank/Moldova 165$
Lariba Bank/Kazakhstan 32$
E-10

BUREAU MISSION OFFICE OBLIGATION AMOUNT
INSTITUTION FUNCTION
IGP CREDITIGP CREDITIGP CREDITIGP CREDITPRIME NONCRDPRIME CREDITPRIME CREDITPRIME NONCRDPRIME CREDITPRIME CREDITPRIME FINPOLPRIME CREDITPRIME CREDITPRIME - Oversight Dakar, Senegal
NONCRD
SEGIR buy-in to Deloitte CREDIT22,654$
GLOBAL PVC NONCRDCREDITNONCRDCREDITNONCRDNONCRDCREDITCREDITCREDITCREDITNONCRDNONCRDNONCRDNONCRDNONCRDCREDITCREDITCREDITNONCRDCREDITCREDIT
1,125$ 697$
30$ 753$
221$
MEDA Mennonite Economic Development
ACSI Amhara Credit and Saving Institute/Ethiopia
CARE Cooperative for Assistance and Relief
AAC/MIS Americas Assoc of Coops/Mutual Insur.
ADRA Adventist Development and Relief Agency
SEEP Network
IDE International Development
NCBA National Cooperative Business NTCA National Telecommunications Cooperative PADF Pan American Development
WR World Relief/USA 740$
18$
84$ 130$
Plan International/Worldwide
Land O`Lakes/Worldwide
TechnoServe/WorldwideWorld Council of Credit Unions/Worldwide
Pro Women (Pro Mujer)/LAC Region
Enterprise Development/USA 330$ 776$
Freedom from Hunger/USA 352$ FINCA International/USA
548$
275$
CHF Cooperative Housing Foundation 227$ CRS Catholic Relief Services/Worldwide 45$
195$ ATA Aid to Artisans/USA 902$
ACCION International/LAC Region 274$ ACDI/VOCA/Worldwide 165$
200$
250$
Enterprise Works/Guinea-Bissau 400$
MD Office of Microenterprise Total MD
SOAG/Bangladesh 400$ 500$
DAI/Morocco 600$ Nathan Associates, Inc./South Africa 325$
WOCCU/CUES-World Council of Credit Union,
ATA Aid to Artisans/Haiti 70$ 500$
ACDI/VOCA/Kenya 750$ 140$
SC Save the Children Federation Inc./Mali 750$ ACDI/VOCA/Ethiopia 400$
NovoBanco/Mozambique 200$ Save the Children US/Nepal 600$
500$
E-11

BUREAU MISSION OFFICE OBLIGATION AMOUNT
INSTITUTION FUNCTION
CREDIT8,877$
34,582$ LAC Bolivia EOSOT CREDIT
700$ Ecuador EGD CREDIT
EGD CREDIT1,870$
El Salvador EGE CREDITEGE CREDIT
1,904$ Guatemala Income and Natural Resources NONCRD
Mission Guatemala CREDITMission Guatemala CREDITMission Guatemala CREDITMission Guatemala CREDITMission Guatemala CREDIT
1,292$ Guyana Mission FINPOL
Mission NONCRDMission NONPOL
400$ Haiti Economic Growth NONCRD
Economic Growth CREDITEconomic Growth CREDIT
3,443$ Honduras ANRO CREDIT
ANRO NONCRD1,706$
Jamaica Economic Growth CREDIT500$
Mexico CREDITFINPOL
900$ Nicaragua ERD CREDIT
ERD CREDIT
ATA Aid to Artisans/Haiti
Chemonics/Guyana
Total PVC
SALTO/DAI
750$ WOCCU World Council of Credit Unions,
Total Honduras
600$ CII Chemonics International, Inc./Mexico 300$ CII Chemonics International, Inc./Mexico
500$
Total MexicoSmall Producers Project 650$
CARANA CORPORATION/Jamaica
850$
Project Mgmt/HondurasDTT Deloitte Touche Tomatsu/Honduras
FINCA/HaitiDAI/FINNET Financial Services Network
501$ 1,205$
2,143$ 450$
140$
394$
20$ Chemonics/Guyana 240$ Chemonics/Guyana
Total Guatemala
Total Guyana
Total Haiti
STC Save The Children/Guatemala 102$ Genesis Empresarial/Guatemala
200$
1,470$
136$
DCA-BancafeCRS/Guatemala 124$
AGEXPRONT/Guatemala 336$
1,435$ SO AG/El Salvador 469$
400$ WOCCU/Ecuador
FAFIDESS /Guatemala
790$
Total Bolivia
Total EcuadorFOMIR DAI I Fortalecimiento de las
DAI/Bolivia Development Alternatives, Inc. 700$
WV World Vision Relief and
Total El Salvador
Total GLOBAL
Total Jamaica
E-12

BUREAU MISSION OFFICE OBLIGATION AMOUNT
INSTITUTION FUNCTION
1,400$ Peru CREDIT
CREDITCREDITNONCRDCREDITNONCRDCREDIT
4,853$ 18,968$
181,547$
170$ Microfinance Project Support/PeruTotal PeruTotal LAC
1,171$ 300$
COPEME COPEME
Chemonics/Peru 359$ Chemonics/Peru 1,880$
187$ CP Caritas del Peru/Peru 786$
Total NicaraguaA.B.PRISMA
GRAND TOTAL
E-13

Microfinance Institutions with Portfolio Data by Location of Institution, 2003
Region Country Institution Borrowers Portfolio US$ Percent Women
Portfolio at Risk
Loan Loss
AFRICA Angola Development Workshop 757 $71,555 81.00% 12.90% 0.00%NVB NovoBanco 0 $0 0.00% 0.00% 0.00%Total Angola 757 $71,555
Benin 2CM Cercle 1,795 $1,210,414 60.00% 9.90% 10.00%CBDIBA Centre Beninois pour le 3,543 $381,573 69.00% 5.00% 3.00%CONVERGENCE 3,337 $369,523 94.31% 17.00% 7.00%FECECAM 82,526 $44,743,975 40.00% .20% 2.00%GRAPAD/CASFIP 4,606 $417,518 92.00% 1.20% 0.00%PADME BENIN 32,600 $25,500,889 78.00% 1.00% .03%PAPME Agence pour 12,263 $27,517,146 55.00% 1.84% 1.50%Total Benin 140,670 $100,141,038
DR Congo FINCA/DR Congo 9,995 $755,620 99.99% .01% 0.00%Total DR Congo 9,995 $755,620
Eritrea HABEN/Eritrea 27 $2,037 98.00% 0.00% 0.00%National Council of Negro Women, 495 $100,899 100.00% 0.00% 0.00%Vision Eritrea/Eritrea 23 $6,600 94.00% 0.00% 0.00%
Total Eritrea 545 $109,536Ethiopia WISDOM/Ethiopia 12,151 $1,354,264 34.06% 5.32% 6.85%
Total Ethiopia 12,151 $1,354,264Ghana ADRA Adventist Relief Agency/Ghana 1,803 $83,212 80.00% .40% 0.00%
Akoti Rural Bank, 1,683 $141,154 100.00% 5.14% 0.00%APED Association of Productive Entrep 2,117 $173,731 80.00% 1.20% 1.80%Cal Merchant Bank 10 $56,770 36.66% 0.00% 0.00%Ecobank/Ghana 6 $28,465 28.33% 0.00% 0.00%Sikaman Savings and Loan/Ghana 1,776 $1,589,495 67.56% .91% .03%Sinapi Aba Trust 41,803 $3,222,170 92.14% 3.00% 1.05%Total Ghana 49,198 $5,294,997
Guinea Enrma Expanded Naturel Ressources 2,530 $215,889 37.00% 4.00% .60% Total Guinea 2,530 $215,889
Kenya CDA Coast Development Authority/Ken 0 $0 0.00% 0.00% 0.00%Co-operative Bank of Kenya Limited/Ke 3,719 $3,728,013 60.00% 7.00% 0.00%Faulu Kenya Limited/Kenya 15,027 $7,000,000 47.00% 4.80% 0.00%KBL K-Rep Bank Limited/Kenya 21,241 $11,084,741 52.00% 13.00% 0.00%KWFT Kenya Women Finance Trust/Ke 48,948 $10,099,157 100.00% 5.00% 0.00%SAGA SAGA Thrift and Enterprise Pro 408 $95,853 72.50% .43% 0.00%SMEP Small and Micro Enterprise Prog 16,290 $3,466,909 56.00% 5.86% 1.52%
Total Kenya 105,633 $35,474,674
ANNEX F
F-1

Region Country Institution Borrowers Portfolio US$ Percent Women
Portfolio at Risk
Loan Loss
Malawi OIBM Opportunity International Bank o 186 $51,620 79.00% 2.53% 0.00% Total Malawi 186 $51,620
Mali Chemonics 0 $0 0.00% 0.00% 0.00%Nyesigiso 11,708 $11,147,404 44.66% 4.61% .04%SC Save the Children 10,627 $633,781 100.00% .18% 0.00%
Total Mali 22,335 $11,781,185 Mauritania World Vision/Mauritania 7,697 $711,407 88.00% 1.34% .80% Total Mauritania 7,697 $711,407 Mozambique FCC Fundo de Credito Comunitario/Mo 9,831 $652,538 45.00% 9.10% 1.00% Frontier Finance/Mozambique 8,178 $2,934,828 17.51% 2.17% 4.31%
NovoBanco/Mozambiq 8,178 $2,934,828 17.51% 2.17% 4.31%Tchuma/Mozambique 6,151 $1,341,039 77.66% 2.88% 3.06%
Total Mozambique 32,338 $7,863,233 Nigeria LAPO- Lift Above Poverty Organization 23,270 $1,412,106 95.00% 2.30% 3.38%
Orphans Caregivers 935 $59,192 90.00% 0.00% 0.00% Total Nigeria 24,205 $1,471,298
Rwanda URWEGO World 12,619 $388,038 90.00% 5.00% 3.50% Total Rwanda 12,619 $388,038
Senegal ACEP/Senegal Alliance de Credit et d` 17,200 $24,176,021 33.00% 1.88% 1.16%ACRA Association de Coopatives Rura 2,117 $462,021 43.00% 8.00% 1.70%CAPEC JOOBASS Caisse Populaire d 49 $6,812 58.00% .44% 0.00%CAPEC SAMM SA NGOR Caisse Pop 361 $36,621 58.00% 3.20% 2.60%CAPFED Caisse d`Epargne et de Cred 174 $42,323 67.00% .92% 0.00%CBAO/Senegal 13 $61,983 23.08% 0.00% 0.00%CEC MAK Caisse d`Epargne et de Crà 116 $196,802 39.00% .05% 0.00%CMECAT Caisse des Mutuelles des Ar 549 $239,311 0.00% 5.58% 29.25%CMS Credit Mutuel Senegal/Senegal 27,578 $20,572,284 14.00% 1.37% 1.20%COFDEC Collectif des Femmes pour le 705 $216,458 99.00% .78% 0.00%FADECBA Federation des Association 867 $57,830 100.00% 0.00% 0.00%FNGPF Federation Nationale des Grou 7,104 $6,137,800 100.00% 3.89% 4.16%GEC FEMUNI Groupement d`Epargne 88 $42,446 75.00% 12.50% .27%GEC GANDA Groupement d`Epargne 67 $10,901 28.00% 7.58% 0.00%GEC LAWTAN Groupement d`Epargne 174 $15,598 62.00% 13.35% .48%GEC TINAARE Groupement d`Epargne 27 $452 95.00% 0.00% 100.00%IMCEC CCF Institution Mutualiste Com 2,199 $634,553 75.00% 5.47% 0.00%INTER CREC Entre les Caisses Rurale 623 $248,933 36.00% 18.51% 12.79%MCEG NAFA Mutuelle d`Epargne, de C 387 $104,534 48.00% 0.00% 0.00%MEC ADEFAP Mutuelle d`Epargne et d 213 $59,512 91.00% 8.50% 0.00%MEC ADER Mutuelle d`Epargne et de 53 $11,207 13.00% 2.30% 0.00%MEC ANAMBE Mutuelle d`Epargne et 38 $53,307 45.00% 92.67% 0.00%MEC COCOGES Mutuelle d`Epargne e 218 $76,268 87.00% 9.02% 0.00%MEC EGAM Mutuelle d`Epargne et de 13 $9,643 54.00% 88.01% 7.15%MEC FADEC Mutuelle d`Epargne et de 931 $162,982 67.00% .80% 0.00%
F-2

Region Country Institution Borrowers Portfolio US$ Percent Women
Portfolio at Risk
Loan Loss
MEC FEMZOP Mutuelle d`Epargne et 228 $27,758 96.00% .74% 0.00%MEC L & D Mutuelle d`Epargne et de C 380 $147,173 62.00% 1.48% .68%MEC PROPEM Mutuelle d`Epargne et 966 $230,289 47.00% 2.29% .55%MEC PROTES Mutuelle d`Epargne et d 418 $363,775 77.00% 2.35% .85%MECARTH Mutuelle d`Epargne et de C 384 $334,309 37.00% 3.38% .87%MECFAM Mutuelle d`Epargne et de Cr 223 $33,268 95.00% 3.08% .71%MFC/Senegal Mutuelle des Femmes d 187 $14,505 71.00% 7.14% 0.00%MUPROEL Mutuelle des Professionne 4 $999 47.00% 23.38% 0.00%MUPROP Mutuelle des Professionnels 24 $9,407 17.00% 43.75% 0.00%PAMECAS Partenariat pour la Mobilisa 15,674 $13,163,231 80.00% 0.00% 3.90%PLAN International/Senegal 4,638 $269,571 67.12% 2.10% .90%PPMEH Projet de Promotion des Petite 1,312 $791,410 52.00% 5.55% 5.21%
PROFEMU Programme des Femmes e 3,827 $468,586 100.00% 3.15% 3.20%RECEC Reseau des Caisses d`Epargn 6,455 $845,742 79.00% 7.16% 6.15%UFC Union des Femmes Commercante 412 $64,100 83.00% 5.14% 12.12%UGPF Union des Groupements de Pro 510 $19,930 92.00% 0.00% 0.00%UMEC Union des Mutuelles d`Epargne 3,711 $719,990 34.00% 17.22% 4.13%UNACOIS Union Nationale des Comm 6,866 $6,897,360 45.00% 9.78% 4.15%
Total Senegal 108,083 $78,038,005South Africa FINCA 815 $137,000 98.70% 41.00% 45.00%
Teba Bank/South 0 $0 0.00% 0.00% 0.00% Total South Africa 815 $137,000
Sudan SUMI Sudan Microfinance Institution/S 125 $8,700 26.00% 0.00% 0.00%Total Sudan 125 $8,700
Uganda FINCA Uganda Foundation for Internat 36,912 $2,452,000 95.00% 2.00% .01%FOCCAS Foundation for Credit and Co 16,076 $669,602 75.00% 0.00% 4.00%FTCU Feed The Children Uganda/Uga 12,036 $695,005 75.00% 1.15% 0.00%FUL Faulu Uganda Ltd./Uganda 13,439 $2,178,203 65.00% 1.70% 0.00%Grameen Foundation/Uganda 6,753 $404,958 78.28% 1.00% 0.00%Katakwi Soroti Development Organisat 9,311 $410,794 62.00% 12.22% 0.00%MED-Net Microenterprise Developmen 13,163 $1,179,738 54.00% 1.59% 1.00%PRIDE UGANDA Promotion of Rural In 45,917 $6,913,567 54.00% 0.00% 0.00%UMU Uganda Microfinance Union/Uga 28,625 $5,331,020 48.00% 1.28% .06%U-TRUST UGANDA FINANCE TRUST 24,103 $4,260,540 80.00% 6.08% .43%WOCCU/Uganda 5,917 $1,189,648 47.44% 48.94% .38%Total Uganda 212,252 $25,685,075
Zambia FINCA/Zambia 7,388 $348,027 98.52% 2.50% .01% Total Zambia 7,388 $348,027
Zimbabwe Chawada Savings and Credit Coopera 655 $6,797 39.00% 26.00% 0.00%CSFS Collective Self-Finance Scheme 980 $11,424 62.00% 6.00% 5.00%Kingdom Bank/Zimbabwe 8,309 $2,434,357 58.99% 4.68% 0.00%Lupane Savings and Credit Union Coo 2,044 $3,098 10.00% 36.00% 0.00%NASCUZ National Association of Savin 0 $0 0.00% 0.00% 0.00%
F-3

Region Country Institution Borrowers Portfolio US$ Percent Women
Portfolio at Risk
Loan Loss
Pundutso Microfinance Pvt Ltd/Zimbab 4,460 $99,505 55.00% 4.66% 1.00%SHDF (SCORE) Self Help Developmen 4,841 $601,791 85.00% .73% 0.00%TAKURA Takura Nyakasikana SACCO 1,818 $10,230 60.00% 36.00% 0.00%WDSCU Women Development Savings 2,154 $25,537 100.00% 32.54% 3.20%Zambuko Trust/Zimbabwe 16,668 $15,132 72.00% 10.34% 3.78%ZAMFI Zimbabwe Association of Micro 0 $0 0.00% 0.00% 0.00%
Total Zimbabwe 41,929 $3,207,871TOTAL AFRICA 791,451 $273,109,032
ASIA Bangladesh CARE Bangladesh 13,271 $1,053,987 100.00% 5.74% .14%Dhaka Bank/Bangladesh 1 $8,621 0.00% 0.00% 0.00%Prime Bank/Bangladesh 13 $83,174 7.69% 0.00% 0.00%WR/CSS Christian Service Society/Ban 23,887 $1,474,015 84.00% 8.00% 5.00%
Total Bangladesh 37,172 $2,619,797 Cambodia EMT Ennatien Moulethan Tchorebat/C 92,173 $5,640,976 76.00% .07% .13%
TPC. Ltd. Thaneakea Phum (Cambodia 31,668 $2,198,182 96.00% .80% 2.02%Total Cambodia 123,841 $7,839,158
India Cashpor/India 24,609 $1,308,343 100.00% 1.96% 0.00%CHF Cooperative Housing Foundation 0 $0 0.00% 0.00% 0.00%
Total India 24,609 $1,308,343 Indonesia Bank NISP/Indonesia 17 $109,968 12.94% 0.00% 0.00%
BRI Bank Rakyat Indonesia 3,100,358 $1,670,000,000 16.00% 2.52% 6.00%OI Opportunity International 9,122 $340,389 77.00% 4.52% .08%Total Indonesia 3,109,497 $1,670,450,357
Nepal NUBL Nirdhan Utthan 32,784 $2,824,309 100.00% 9.10% 0.00%Save the Children 32,652 $2,622,391 100.00% 0.00% 0.00%
Total Nepal 65,436 $5,446,700 Pakistan KB Khushhalibank/Pakistan 92,776 $12,400,000 33.00% 7.90% .80%
PPAF Pakistan Poverty Alleviation Fun 0 $0 0.00% 0.00% 0.00% Total Pakistan 92,776 $12,400,000
Philippines Bangko Kabayan/Philippines 524 $137,996 89.69% .06% .14%Bangko Mabuhay/Philippines 195 $41,188 86.67% 3.96% 0.00%Bangko Santiago de Libon/Philippines 3,638 $235,555 76.00% 0.00% 0.00%Bank of Florida/Philippines 60 $24,450 68.33% 3.25% 0.00%Bank Victorias/Philippines 335 $65,713 80.30% .45% 0.00%Bukidnon Cooperative Bank/Philippines 2,464 $214,689 86.12% 4.58% 0.00%CARD Center for Agriculture and Rura 17,318 $2,171,709 100.00% 0.00% 0.00%Century Rural Bank/Philippines 324 $31,198 84.57% 5.31% 0.00%CEV Community Economic Ventures, I 8,925 $540,540 90.00% 2.30% .30%Cooperative Bank of Misamis Oriental, 846 $170,803 85.11% 4.72% 1.66%Country Bank/Philippines 96 $14,163 85.42% 0.00% 0.00%CRS/PH Catholic Relief Services - USC 44,454 $2,042,489 99.00% 0.00% 0.00%FICO First Isabela Cooperative Bank/P 669 $229,629 77.13% 1.40% 0.00%First Macro Bank/Philippines 508 $117,990 78.94% 6.00% 0.00%
F-4

Region Country Institution Borrowers Portfolio US$ Percent Women
Portfolio at Risk
Loan Loss
MRB Maranao Rural Bank/Philippines 2,569 $331,991 82.60% 4.58% 0.00%Network Rural Bank/Philippines 640 $170,967 86.41% 7.58% 0.00%Rang-Ay Bank/Philippines 101 $20,188 73.27% 3.15% 0.00%Rural Bank of Bogo/Philippines 158 $17,947 79.11% 4.82% 0.00%Rural Bank of Cantilan/Philippines 4,215 $413,617 82.75% .12% .18%Rural Bank of Cotabato/Philippines 87 $14,993 68.97% 0.00% 0.00%Rural Bank of Datu Paglas/Philippines 183 $25,803 31.15% 2.19% .80%Rural Bank of Digos/Philippines 298 $31,926 85.91% 6.60% 0.00%Rural Bank of Dipolog/Philippines 307 $59,807 82.74% 2.17% 0.00%Rural Bank of Dulag/Philippines 906 $169,302 99.23% 0.00% 0.00%Rural Bank of Isulan/Philippines 406 $52,335 83.99% 1.60% 0.00%Rural Bank of Kapatagan Valley/Philipp 1,262 $210,270 83.68% .02% .90%Rural Bank of Labrador/Philippines 60 $7,063 93.33% 0.00% 0.00%Rural Bank of Lebak/Philippines 583 $78,499 81.65% 1.18% 0.00%Rural Bank of Mabitac/Philippines 822 $128,260 82.36% 1.37% 0.00%Rural Bank of Montevista/Philippines 5,426 $372,404 97.40% 5.86% 0.00%Rural Bank of Oroquieta/Philippines 186 $42,579 72.58% 1.08% .20%Rural Bank of Pagbilao/Philippines 91 $14,566 80.22% .96% 0.00%
Rural Bank of Panabo/Philippines 202 $35,872 92.57% 4.40% 0.00%Rural Bank of Santo Tomas/Philippines 749 $125,608 75.52% 3.66% 7.12%Rural Bank of Siam, Inc./Philippines 838 $132,982 79.00% 2.05% 0.00%Rural Bank of Tacurong/Philippines 1,954 $217,504 87.67% 0.00% 0.00%Rural Bank of Tagum/Philippines 604 $102,128 79.14% 11.00% 0.00%Rural Bank of Talisayan/Philippines 1,477 $154,880 86.05% .86% 1.01%Rural Green Bank of Caraga/Philippine 5,109 $967,164 92.21% 2.58% 2.66%Saranggani Rural Bank/Philippines 0 $0 0.00% 5.00% 0.00%WOCCU/CUES-Phils. World Council o 188,424 $47,031,909 73.87% 2.19% 0.00%
Total Philippines 298,013 $56,968,676 Vietnam WOCCU/Vietnam 0 $976,379 100.00% .32% 0.00%
Total Vietnam 0 $976,379TOTAL ASIA 3,751,344 $1,758,009,410
EE Albania PSHM Partneri Shqiptar ne Mikrokredi/ 2,706 $4,043,694 46.40% 1.23% 2.60% Total Albania 2,706 $4,043,694
Azerbaijan ASM Azeri Star Microfinance/Azerbaija 3,993 $490,477 33.00% 1.40% .02%CredAgro LLC CredAgro Non Banking 962 $3,170,377 3.12% .80% 0.00%Foundation for International Communit 6,840 $1,030,299 58.00% .10% 0.00%
Total Azerbaijan 11,795 $4,691,153 Bosnia CARE/Bosnia 7,426 $17,558,875 37.49% .04% .03%
CHF Communities, Habit, Finance (Co 768 $2,226,656 25.00% 3.56% 0.00%UMCOR UNITED METHODIST COMM 0 $0 17.00% 0.00% 0.00%Total Bulgaria 8,194 $19,785,531
Bulgaria CRS Catholic Relief Services/Bulgaria 3,279 $1,357,816 66.81% .06% 0.00%NACHALA Cooperative/Bulgaria 2,101 $3,639,252 43.63% 1.60% 0.00%
F-5

Region Country Institution Borrowers Portfolio US$ Percent Women
Portfolio at Risk
Loan Loss
United Bulgarian Bank/Bulgaria 16 $106,973 16.67% 0.00% 0.00%WOCCU/Bulgaria World Council of Cre 2,677 $2,446,466 50.00% 5.79% 0.00%Total Bulgaria 8,073 $7,550,507
Croatia DEMOS/Croatia 1,162 $1,356,422 50.00% .47% .00%FI FLAG International, LLC/Croatia 60 $320,000 10.00% 0.00% 1.50%MikroPlus 1,831 $869,657 66.68% 3.47% 1.13%Total Croatia 3,053 $2,546,079
Georgia ACDI/VOCA/Georgia 859 $2,036,073 8.20% 13.01% 0.00%Constanta Foundation/Georgia 18,588 $3,536,047 70.00% 3.30% 1.63%SBDF Small Business Development Fo 1,409 $360,059 56.00% 1.06% 3.06%WV/Georgia 1,509 $729,933 73.00% 2.30% 1.60%
Total Georgia 22,365 $6,662,112 Kazakhstan EBRD/KSBP European Bank for Recon 27,724 $51,507,491 65.00% .32% 0.00%
KLF Kazakhstan Loan Fund/Kazakhsta 7,250 $3,075,611 83.00% 0.00% 17.00%Lariba Bank/Kazakhstan 1 $3,996 0.00% 0.00% 0.00%Total Kazakhstan 34,975 $54,587,098
Kyrgyzstan BTFF (Microcredit Agency) Bai Tushum 1,408 $2,092,219 36.00% 3.00% 3.70%Frontiers, LLC/Kyrgyzstan 0 $0 0.00% 0.00% 0.00%MSFF EBRD Micro and Small Finance 1,706 $2,587,679 61.00% .01% 0.00%Total Kyrgyzstan 3,114 $4,679,898
Macedonia Moznosti Humanitarian Association Mo 3,709 $8,879,053 37.00% 3.53% 0.00%WOCCU World Council of Credit Union 1,324 $1,746,399 25.00% 0.00% 0.00%
Total Macedonia 5,033 $10,625,452Moldova BIZPRO-Moldova Development Alterna 34,375 $6,592,000 52.00% 3.90% .07%
Moldova Agorlnd/Moldova 110 $410,286 38.30% 0.00% 0.00%Victoriabank/Moldova 1 $3,854 0.00% 0.00% 0.00%
Total Moldova 34,486 $7,006,140Romania CHF Cooperative Housing Foundation 831 $3,916,495 36.20% 1.64% .30%
WOCCU 35,176 $21,740,203 0.00% 4.48% 89.59% Total Romania 36,007 $25,656,698
Russia ACDI/VOCA/Russia 817 $1,867,232 68.80% 1.50% 0.00%Center-Invest Bank/Russia 84 $511,560 32.06% 0.00% 0.00%FINCA Foundation for International Co 2,705 $3,391,365 77.00% 2.10% .54%FINCA/Tomsk/Russia 1,115 $896,992 91.00% .30% .01%RCCDF Rural Credit Cooperation Deve 1,655 $5,691,898 10.00% 1.43% 0.00%Russia Banker`s House/Russia 8 $62,043 25.00% 0.00% 0.00%
Total Russia 6,384 $12,421,090Serbia Opportunity International 1,917 $2,400,960 41.00% .80% 0.00%
Total Serbia 1,917 $2,400,960Tajikistan EBRD European Bank for Reconstruct 165 $344,929 54.50% 0.00% 0.00%
FINCA/Tajikistan 19 $4,167 79.00% 0.00% 0.00%MDTM Micro-entrepreneur Developme 1,355 $243,843 0.00% 0.00% 0.00%
Total Tajikistan 1,539 $592,939
F-6

Region Country Institution Borrowers Portfolio US$ Percent Women
Portfolio at Risk
Loan Loss
Ukraine Nadra Bank/Ukraine 18 $133,345 27.70% 0.00% 0.00%PCB/UMLP ProCredit Bank Ukraine/Uk 26,764 $107,237,001 49.00% 4.00% 0.00%Winrock International/Ukraine 235 $164,600 100.00% 0.00% 0.00%
Total Ukraine 27,017 $107,534,946Uzbekistan FINCA /Uzbekistan 484 $78,497 82.00% 0.00% 0.00%
O`z-MARD Uzbekistan Micro-entrepren 1,317 $227,954 61.00% .40% 0.00%WOCCU World Council of Credit Union 3,412 $839,284 51.00% 7.70% 0.00%
Total Uzbekistan 5,213 $1,145,735TOTAL EE 211,871 $271,930,031
LAC Bolivia BancoSol Banco Solidario SA/Bolivia 51,771 $91,175,470 56.00% 5.03% 12.78%Caja Los Andes 53,214 $82,179,376 50.10% 3.08% 2.38%Consejo Mundial de Cooperativas de A 23,244 $46,434,107 48.00% 4.48% 6.11%FIE/Bolivia 33,100 $40,389,898 50.56% 3.30% 2.51%PRODEM 25,249 $62,016,034 38.79% 3.42% 2.32%ProMujer/Bolivia 38,380 $5,586,663 95.00% .50% .20%
Total Boliva 224,958 $327,781,548Brazil Banco ABN AMRO 579 $189,695 41.97% 7.33% 0.00%
Total Brazil 579 $189,695Colombia FINAMERICA/Colombia 23,410 $18,212 49.41% 4.90% 1.09%
Total Colombia 23,410 $18,212 Ecuador Banco Procredit Sociedad Financiera E 11,130 $21,907,660 33.31% .40% .33%
BANCO SOLIDARIO S.A./Ecuador 2,807 $7,223,501 45.20% 0.00% 0.00%Cooperativa de Ahorro y Credito CACP 5,977 $9,579,261 31.36% 1.70% .20%Cooperativa de Ahorro Y Credito Coop 9,112 $20,272,512 100.00% 1.40% 0.00%Cooperativa de Ahorro Y Credito Rioba 6,605 $16,187,312 21.07% 3.10% .03%
CREDIFE Banco Del Pinchincha/Ecuad 24,040 $27,988,143 59.47% 1.10% .23%Mision Alianza de Noruega/Ecuador 9,013 $3,501,857 49.87% .80% .30%WOCCU/Ecuador 33,821 $46,064,121 41.00% 2.20% .70%
Total Ecuador 102,505 $152,724,367 El Salvador ACACSEMERSA DE R.L. Asociacion C 1,661 $1,810,310 68.94% 4.13% .50%
ACACU de R.L. Asociacio cooperativa 1,307 $2,203,091 65.91% 13.71% 1.90%ACCOVI DE R.L. Cooperativa de ahorr 1,811 $4,375,185 67.57% 9.77% 11.90%AMC de R.L. Sociedad cooperativa de 5,918 $3,561,119 62.53% 4.94% .53%ASEI Asociacion Salvadorena de exten 5,959 $525,180 83.70% 8.66% 0.00%BA Banco Agricola S.A./El Salvador 1,609 $1,241,926 71.37% 14.09% .60%BANSAL Banco Salvadoreno/El Salvad 3,087 $3,214,390 80.40% 2.37% .39%CAM Centro de Apoyo a la Microempre 19,229 $4,489,285 81.02% 6.02% 4.72%ENLACE CRS/El Salvador 10,160 $1,798,886 81.00% 6.00% 0.00%Financiera Calpia, S.A./El Salvador 54,298 $67,357,372 56.20% 1.61% .51%FJND Fundacion Jose Napoleon Duart 3,180 $1,319,176 80.69% 7.70% 0.00%INTEGRAL Apoyo Integral, S.A. de C.V 15,382 $11,396,390 73.40% 5.49% .32%
Total El Salvador 123,601 $103,292,310 Guatemala AGUDESA Asociacion Guatemalteca p 3,425 $975,282 66.80% 10.24% 4.42%
F-7
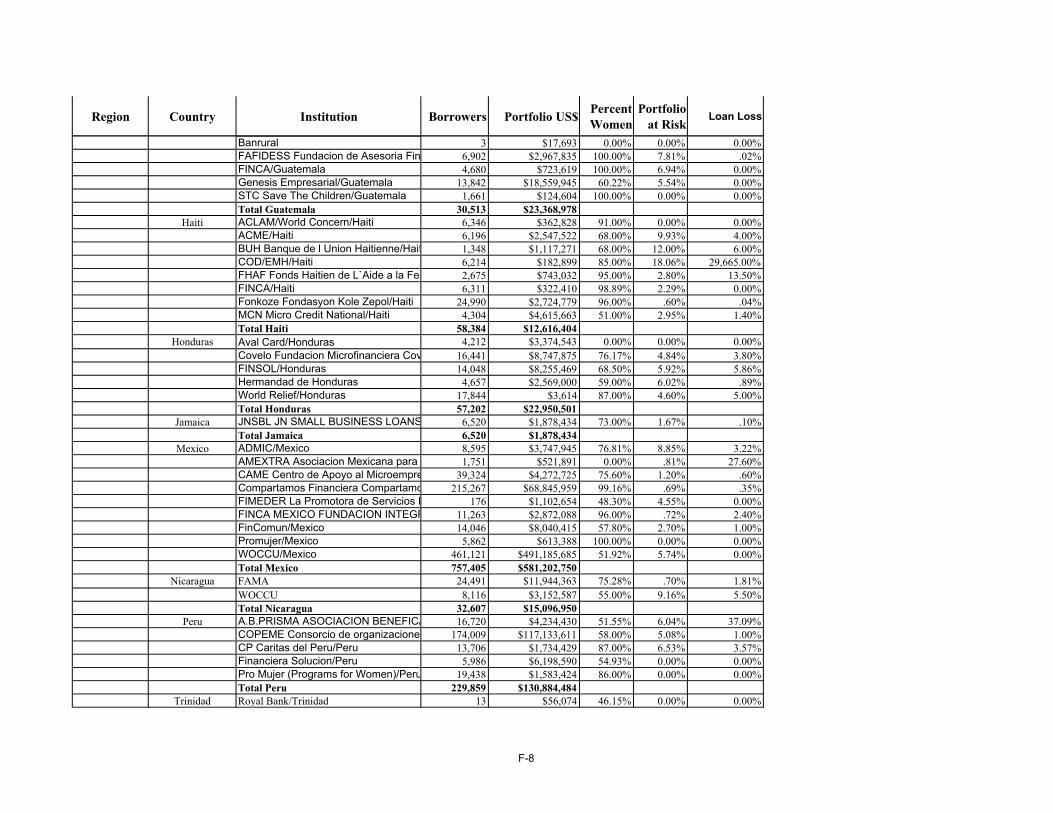
Region Country Institution Borrowers Portfolio US$ Percent Women
Portfolio at Risk
Loan Loss
Banrural 3 $17,693 0.00% 0.00% 0.00%FAFIDESS Fundacion de Asesoria Fin 6,902 $2,967,835 100.00% 7.81% .02%FINCA/Guatemala 4,680 $723,619 100.00% 6.94% 0.00%Genesis Empresarial/Guatemala 13,842 $18,559,945 60.22% 5.54% 0.00%STC Save The Children/Guatemala 1,661 $124,604 100.00% 0.00% 0.00%
Total Guatemala 30,513 $23,368,978 Haiti ACLAM/World Concern/Haiti 6,346 $362,828 91.00% 0.00% 0.00%
ACME/Haiti 6,196 $2,547,522 68.00% 9.93% 4.00%BUH Banque de l Union Haitienne/Hait 1,348 $1,117,271 68.00% 12.00% 6.00%COD/EMH/Haiti 6,214 $182,899 85.00% 18.06% 29,665.00%FHAF Fonds Haitien de L`Aide a la Fem 2,675 $743,032 95.00% 2.80% 13.50%FINCA/Haiti 6,311 $322,410 98.89% 2.29% 0.00%Fonkoze Fondasyon Kole Zepol/Haiti 24,990 $2,724,779 96.00% .60% .04%MCN Micro Credit National/Haiti 4,304 $4,615,663 51.00% 2.95% 1.40%
Total Haiti 58,384 $12,616,404 Honduras Aval Card/Honduras 4,212 $3,374,543 0.00% 0.00% 0.00%
Covelo Fundacion Microfinanciera Cov 16,441 $8,747,875 76.17% 4.84% 3.80%FINSOL/Honduras 14,048 $8,255,469 68.50% 5.92% 5.86%Hermandad de Honduras 4,657 $2,569,000 59.00% 6.02% .89%World Relief/Honduras 17,844 $3,614 87.00% 4.60% 5.00%
Total Honduras 57,202 $22,950,501 Jamaica JNSBL JN SMALL BUSINESS LOANS 6,520 $1,878,434 73.00% 1.67% .10%
Total Jamaica 6,520 $1,878,434 Mexico ADMIC/Mexico 8,595 $3,747,945 76.81% 8.85% 3.22%
AMEXTRA Asociacion Mexicana para 1,751 $521,891 0.00% .81% 27.60%CAME Centro de Apoyo al Microempre 39,324 $4,272,725 75.60% 1.20% .60%Compartamos Financiera Compartamo 215,267 $68,845,959 99.16% .69% .35%FIMEDER La Promotora de Servicios R 176 $1,102,654 48.30% 4.55% 0.00%
FINCA MEXICO FUNDACION INTEGR 11,263 $2,872,088 96.00% .72% 2.40%FinComun/Mexico 14,046 $8,040,415 57.80% 2.70% 1.00%Promujer/Mexico 5,862 $613,388 100.00% 0.00% 0.00%WOCCU/Mexico 461,121 $491,185,685 51.92% 5.74% 0.00%
Total Mexico 757,405 $581,202,750 Nicaragua FAMA 24,491 $11,944,363 75.28% .70% 1.81%
WOCCU 8,116 $3,152,587 55.00% 9.16% 5.50% Total Nicaragua 32,607 $15,096,950
Peru A.B.PRISMA ASOCIACION BENEFICA 16,720 $4,234,430 51.55% 6.04% 37.09%COPEME Consorcio de organizaciones 174,009 $117,133,611 58.00% 5.08% 1.00%CP Caritas del Peru/Peru 13,706 $1,734,429 87.00% 6.53% 3.57%Financiera Solucion/Peru 5,986 $6,198,590 54.93% 0.00% 0.00%Pro Mujer (Programs for Women)/Peru 19,438 $1,583,424 86.00% 0.00% 0.00%
Total Peru 229,859 $130,884,484 Trinidad Royal Bank/Trinidad 13 $56,074 46.15% 0.00% 0.00%
F-8

Region Country Institution Borrowers Portfolio US$ Percent Women
Portfolio at Risk
Loan Loss
Total Trinidad 13 $56,074TOTAL LAC 1,647,543 1,372,004,634
NEAR EAST Afghanistan MISFA Microfinance Investment Suppo 0 $0 0.00% 0.00% 0.00%WOCCU/Afghanistan 0 $0 0.00% 0.00% 0.00%
Total Afghanistan 0 $0 Egypt ABA Alexandria Business Assoc. 43,256 $8,554,266 64.30% 1.00% 0.00%
ASBA Assiut Business Assoc. 40,421 $8,087,742 82.40% 8.90% .70%Aswan Business Association 361 $118,901 13.10% 5.80% 11.70%Banque du Caire 30,663 $8,715,204 21.50% .16% 0.00%DBAC Dakahleya Bus Assoc. for Inves 19,606 $3,826,169 63.90% .50% .20%ESED Egyptian Sm Enter. Dev. Found 33,824 $7,782,607 63.80% 11.90% 0.00%FAYOUM Small Project Dev. Foundatio 2,355 $357,276 27.90% 2.60% .10%SBACD Sharkia Bus Assoc. for Comm 13,226 $2,746,209 59.50% 8.20% 4.00%SEDAP Small Enter. Dev Assoc. Port S 4,169 $981,829 73.60% 9.80% 0.00%SOHAG / SEB 1,243 $562,909 17.90% 2.70% .60%
Total Egypt 189,124 $41,733,112 Jordan AMC Ahli Microfinancing Company/Jor 1,090 $2,822,604 31.65% 9.00% 6.58%
MEMCO Middle East Micro Credit Co./ 2,450 $4,440,694 55.38% 11.82% 5.90%MFW Microfund for Women (formerly J 10,586 $3,095,442 100.00% .23% .11%Tamweelcom Jordan Micro Credit Com 2,333 $2,614,725 35.90% 1.16% .45%
Total Jordan 16,459 $12,973,465 Lebanon CHF/AMEEN Access to Microfinance a 7,114 $5,137,726 26.36% .85% .04%
Total Lebanon 7,114 $5,137,726 Morocco Al Amana/Morocco 48,317 $28,327,279 61.00% .09% .05%
AMSSF Association Marocaine de Soli 6,886 $923,240 84.00% .20% 0.00%FONDEP Fondation pour le Developpm 15,422 $1,467,145 82.00% .87% 0.00%INMAA Institution Marocaine d`Appui a 2,402 $330,787 43.00% 0.00% 0.00%
Total Morocco 73,027 $31,048,451 West Bank /Gaza FATEN Palestine for Credit & Developm 250 $1,261,664 99.00% 2.21% 0.00%
Total West Bank/Gaza 250 $1,261,664TOTAL ANE 285,974 $92,154,417
GRAND TOTAL 6,688,183 3,767,207,524
F-9

Microfinance Savings Data, Location of Clients and Sustainability, 20REGION COUNTRY INSTITUTION SAVINGS US$ SAVERS % RURAL
AFRICA Angola Development Workshop/Angola $19,512 757 100.00%Angola NVB NovoBanco S.A.R.L./Angola $0 0 0.00%Benin 2CM Cercle Communautaire Mieux-Etre/Benin $755,537 4,738 60.00%Benin CBDIBA Centre Beninois pour le $259,213 11,009 81.00%Benin CONVERGENCE 2000 CONVERGENCE $325,174 6,690 29.25%Benin FECECAM Federation des Caisses d`Epargne et $51,063,265 501,698 66.00%Benin GRAPAD/CASFIP Groupe de Recherche et $279,580 4,826 94.00%Benin PADME BENIN Association pour la Promotion et $3,712,596 37,500 47.21%Benin PAPME Agence pour la Promotion et l`Appui aux $6,815,160 8,486 50.00%DR Congo FINCA/DR Congo $0 0 0.00%Eritrea HABEN/Eritrea $400 569 100.00%Eritrea National Council of Negro Women, Inc./Eritrea $10,606 495 100.00%Eritrea Vision Eritrea/Eritrea $1,560 341 100.00%Ethiopia WISDOM/Ethiopia $470,718 12,151 76.00%Ghana ADRA Adventist Relief Agency/Ghana $62,156 1,803 12.00%Ghana Akoti Rural Bank, Limited/Ghana $11,519 1,683 100.00%Ghana APED Association of Productive Entrepreneurs in $79,642 2,119 77.00%
Ghana Cal Merchant Bank/Ghana $0 0 0.00%Ghana Ecobank/Ghana $0 0 0.00%Ghana Sikaman Savings and Loan/Ghana $713,065 5,888 0.00%Ghana Sinapi Aba Trust $0 0 0.00%Guinea Enrma Expanded Naturel Ressources $57,719 6,981 100.00%Kenya CDA Coast Development Authority/Kenya $0 0 0.00%Kenya Co-op Bank Co-operative Bank of Kenya $18,269,737 86,000 85.00%Kenya Faulu Kenya Limited/Kenya $4,800,000 20,804 66.00%Kenya KBL K-Rep Bank Limited/Kenya $7,253,684 37,468 75.00%Kenya KWFT Kenya Women Finance Trust/Kenya $6,151,901 73,064 80.00%Kenya SAGA SAGA Thrift and Enterprise Promotion, $76,843 5,288 98.60%Kenya SMEP Small and Micro Enterprise $1,148,705 18,583 76.00%Malawi OIBM Opportunity International Bank of $485,636 5,162 0.00%Mali Chemonics Chemonics International/Mali $0 0 0.00%Mali Nyesigiso $8,324,284 111,442 0.00%Mali SC Save the Children Federation Inc./Mali $116,475 11,385 75.00%Mauritania World Vision/Mauritania $143,656 6,400 1.40%Mozambique FCC Fundo de Credito Comunitario/Mozambique $359,796 9,831 40.00%Mozambique Frontier Finance/Mozambique $2,164,489 15,277 0.00%Mozambique NovoBanco/Mozambique $2,164,489 15,277 0.00%Mozambique Tchuma/Mozambique $21,161 1,444 7.97%Nigeria LAPO- Lift Above Poverty Organization/Nigeria $456,758 24,545 40.00%Nigeria Orphans Caregivers Association/Nigeria $0 935 100.00%Rwanda URWEGO World Relief/Rwanda $78,943 12,619 73.00%
Senegal ACEP/Senegal Alliance de Credit et d`Epargne $3,763,983 10,810 48.00%Senegal ACRA Association de Coopératives Rurales en $429,599 4,588 7.00%Senegal CAPEC JOOBASS Caisse Populaire d`Epargne et $19,904 481 99.00%Senegal CAPEC SAMM SA NGOR Caisse Populaire $56,113 513 71.00%Senegal CAPFED Caisse d`Epargne et de Credit des $21,684 416 0.00%Senegal CBAO/Senegal $0 0 0.00%Senegal CEC MAK Caisse d`Epargne et de Crédit $56,970 332 50.00%Senegal CMECAT Caisse des Mutuelles des Artisans de $35,380 1,310 22.00%Senegal CMS Créidt Mutuel Sénégalais/Senegal $37,600,369 159,743 30.00%Senegal COFDEC Collectif des Femmes pour le $55,790 1,192 0.00%Senegal FADECBA Federation des Associations de $29,534 913 100.00%Senegal FNGPF Federation Nationale des Groupements de $975,733 23,094 65.00%
G-1

REGION COUNTRY INSTITUTION SAVINGS US$ SAVERS % RURAL
Senegal GEC FEMUNI Groupement d`Epargne et de $26,234 308 0.00%Senegal GEC GANDA Groupement d`Epargne et de $16,512 528 24.00%Senegal GEC LAWTAN Groupement d`Epargne et de $32,805 966 49.00%Senegal GEC TINAARE Groupement d`Epargne et de $1,505 185 100.00%Senegal IMCEC CCF Institution Mutualiste $557,127 2,914 11.00%Senegal INTER CREC Entre les Caisses Rurales d`Epargne $436,857 3,935 75.00%Senegal MCEG NAFA Mutuelle d`Epargne, de Credit et de $137,166 1,588 2.00%Senegal MEC ADEFAP Mutuelle d`Epargne et de Crédit $29,251 632 0.00%Senegal MEC ADER Mutuelle d`Epargne et de Credit des $11,925 272 100.00%Senegal MEC ANAMBE Mutuelle d`Epargne et de Credit $27,443 647 100.00%
Senegal MEC COCOGES Mutuelle d`Epargne et de Credit $123,064 1,397 21.00%Senegal MEC EGAM Mutuelle d`Epargne et de Credit de $29,665 716 98.00%Senegal MEC FADEC Mutuelle d`Epargne et de Credit de $117,980 2,568 98.00%Senegal MEC FEMZOP Mutuelle d`Epargne et de Credit $17,461 599 18.00%Senegal MEC L & D Mutuelle d`Epargne et de Crédit $73,416 1,838 29.00%Senegal MEC PROPEM Mutuelle d`Epargne et de Credit $344,172 2,368 5.00%Senegal MEC PROTES Mutuelle d`Epargne et de Crédit $157,048 1,935 0.00%Senegal MECARTH Mutuelle d`Epargne et de Credit des $237,087 1,537 5.00%Senegal MECFAM Mutuelle d`Epargne et de Credit des $32,966 407 0.00%Senegal MFC/Senegal Mutuelle des Femmes du $14,305 399 0.00%Senegal MUPROEL Mutuelle des Professionnels de $12,633 286 75.00%
Senegal MUPROP Mutuelle des Professionnels de la $4,639 361 94.00%Senegal PAMECAS Partenariat pour la Mobilisation de $13,951,984 76,476 2.00%Senegal PLAN International/Senegal $426,276 4,054 100.00%Senegal PPMEH Projet de Promotion des Petites et $610,684 7,677 97.00%Senegal PROFEMU Programme des Femmes en Milieu $568,999 11,862 0.00%Senegal RECEC Reseau des Caisses d`Epargne et de Credit $908,749 25,604 0.00%Senegal UFC Union des Femmes Commercantes/Senegal $36,223 1,556 0.00%Senegal UGPF Union des Groupements de Promotion $14,304 794 0.00%Senegal UMEC Union des Mutuelles d`Epargne et de $514,560 11,351 85.00%Senegal UNACOIS Union Nationale des Commerçants et $9,045,570 37,934 7.00%South Africa FINCA Foundation for International Community $49,863 792 80.00%South Africa Teba Bank/South Africa $0 0 0.00%Sudan SUMI Sudan Microfinance Institution/Sudan $2,900 210 100.00%Uganda FINCA Uganda Foundation for International $1,564,000 36,912 90.00%
Uganda FOCCAS Foundation for Credit and Community $176,825 16,076 100.00%Uganda FTCU Feed The Children Uganda/Uganda $293,060 12,419 100.00%Uganda FUL Faulu Uganda Ltd./Uganda $926,859 16,490 8.96%Uganda Grameen Foundation/Uganda $209,070 6,189 79.99%Uganda Katakwi Soroti Development Organisation $40,956 13,646 100.00%Uganda MED-Net Microenterprise Development $467,405 11,166 44.00%Uganda PRIDE UGANDA Promotion of Rural Initiatives $3,750,801 58,108 44.00%Uganda UMU Uganda Microfinance Union/Uganda $1,836,431 43,647 76.00%Uganda U-TRUST UGANDA FINANCE TRUST $2,678,130 82,220 81.00%Uganda WOCCU/Uganda $1,905,708 14,219 85.32%Zambia FINCA/Zambia $0 0 35.44%Zimbabwe Chawada Chawada Savings and Credit $11,753 1,092 100.00%Zimbabwe CSFS Collective Self-Finance Scheme/Zimbabwe $0 0 45.00%Zimbabwe Kingdom Bank/Zimbabwe $761,320 14,207 0.00%Zimbabwe LUPANE Lupane Savings and Credit Union $5,660 5,171 100.00%Zimbabwe NASCUZ National Association of Savings and $0 0 0.00%Zimbabwe Pundutso Pundutso Microfinance Pvt $0 0 100.00%Zimbabwe SHDF (SCORE) Self Help Development $223,756 6,432 79.98%
Zimbabwe TAKURA Takura Nyakasikana SACCO $2,975 3,339 100.00%Zimbabwe WDSCU Women Development Savings & Credit $14,606 10,917 30.00%Zimbabwe Zambuko Trust Zambuko Trust/Zimbabwe $13,965 16,668 100.00%Zimbabwe ZAMFI Zimbabwe Association of Micro $0 0 0.00%
$203,153,691 1,840,264Total AFRICA
G-2

REGION COUNTRY INSTITUTION SAVINGS US$ SAVERS % RURAL
ASIA Bangladesh CARE Bangladesh $198,168 18,244 0.00%Bangladesh Dhaka Bank/Bangladesh $0 0 0.00%Bangladesh Prime Bank/Bangladesh $0 0 0.00%Bangladesh WR/CSS Christian Service Society/Bangladesh $383,290 23,887 90.00%Cambodia EMT Ennatien Moulethan Tchorebat/Cambodia $116,618 87 100.00%Cambodia TPC. Ltd. Thaneakea Phum (Cambodia), $291,219 45,685 98.00%India Cashpor/India $0 0 100.00%India CHF Cooperative Housing Foundation $0 0 0.00%Indonesia Bank NISP/Indonesia $0 0 0.00%Indonesia BRI Bank Rakyat Indonesia $3,230,000,000 29,869,197 80.00%Indonesia OI Opportunity International/Indonesia $0 0 0.00%Nepal NUBL Nirdhan Utthan Bank, Ltd./Nepal $841,526 34,817 100.00%Nepal Save the Children US/Nepal $489,279 28,680 100.00%Pakistan KB Khushhalibank/Pakistan $0 0 70.00%Pakistan PPAF Pakistan Poverty Alleviation Fund/Pakistan $0 0 0.00%Philippines Bangko Kabayan/Philippines $624,750 22,569 12.00%Philippines Bangko Mabuhay/Philippines $66,360 2,410 85.00%Philippines Bangko Santiago de Libon/Philippines $235,960 15,744 60.00%
Philippines Bank of Florida/Philippines $361,680 8,341 100.00%Philippines Bank Victorias/Philippines $33,013 851 100.00%Philippines Bukidnon Cooperative Bank/Philippines $285,206 19,009 90.00%Philippines CARD Center for Agriculture and Rural $654,634 18,199 100.00%Philippines Century Rural Bank/Philippines $140,323 9,227 80.00%Philippines CEV Community Economic Ventures, $143,316 9,176 85.00%Philippines Cooperative Bank of Misamis Oriental, $274,222 17,744 70.00%Philippines Country Bank/Philippines $91,499 7,778 70.00%Philippines CRS/PH Catholic Relief Services - USCC, $2,221,533 44,454 100.00%Philippines FICO First Isabela Cooperative Bank/Philippines $167,883 5,939 62.00%Philippines First Macro Bank/Philippines $443,080 18,975 70.00%Philippines MRB Maranao Rural Bank/Philippines $158,720 3,381 90.00%Philippines Network Rural Bank/Philippines $922,988 51,128 100.00%Philippines Rang-Ay Bank/Philippines $185,893 3,830 100.00%Philippines Rural Bank of Bogo/Philippines $69,960 3,877 25.00%Philippines Rural Bank of Cantilan/Philippines $629,208 39,251 86.00%Philippines Rural Bank of Cotabato/Philippines $33,874 1,289 0.00%Philippines Rural Bank of Datu Paglas/Philippines $7,945 339 98.00%Philippines Rural Bank of Digos/Philippines $100,687 4,384 73.00%Philippines Rural Bank of Dipolog/Philippines $203,977 7,154 100.00%Philippines Rural Bank of Dulag/Philippines $170,851 6,898 79.55%Philippines Rural Bank of Isulan/Philippines $141,510 9,068 11.00%Philippines Rural Bank of Kapatagan Valley/Philippines $355,493 19,710 81.85%Philippines Rural Bank of Labrador/Philippines $55,603 1,344 100.00%
Philippines Rural Bank of Lebak/Philippines $108,691 4,732 100.00%Philippines Rural Bank of Mabitac/Philippines $43,229 968 70.00%Philippines Rural Bank of Montevista/Philippines $437,552 29,303 50.00%Philippines Rural Bank of Oroquieta/Philippines $67,674 2,946 59.00%Philippines Rural Bank of Pagbilao/Philippines $97,178 3,179 85.00%Philippines Rural Bank of Panabo/Philippines $404,788 19,994 100.00%Philippines Rural Bank of Santo Tomas/Philippines $207,344 8,944 100.00%Philippines Rural Bank of Siam, Inc./Philippines $249,566 15,771 47.00%Philippines Rural Bank of Tacurong/Philippines $98,720 9,000 80.00%Philippines Rural Bank of Tagum/Philippines $69,654 3,511 80.00%Philippines Rural Bank of Talisayan/Philippines $391,835 19,114 78.00%Philippines Rural Green Bank of Caraga/Philippines $2,466,060 129,465 65.00%Philippines Saranggani Rural Bank/Philippines $0 0 6.00%Philippines WOCCU/CUES-Phils. World Council of Credit $405,532 2,016 80.00%Vietnam WOCCU/Vietnam $399,084 22,081 100.00%
G-3

REGION COUNTRY INSTITUTION SAVINGS US$ SAVERS % RURAL
$3,246,547,175 30,643,690
EE Albania PSHM Partneri Shqiptar ne Mikrokredi/Albania $0 0 34.00%Azerbaijan ASM Azeri Star Microfinance/Azerbaijan $0 0 90.00%Azerbaijan CredAgro LLC CredAgro Non Banking Credit $0 0 95.00%Azerbaijan Foundation for International Community $116,782 6,799 35.00%Bosnia CARE/Bosnia $0 0 13.47%Bosnia CHF Communities, Habit, Finance (Cooperative $0 0 54.00%
Bosnia UMCOR UNITED METHODIST COMMITTEE $0 0 99.00%Bulgaria CRS Catholic Relief Services/Bulgaria $297,550 3,526 10.64%Bulgaria NACHALA Cooperative/Bulgaria $0 0 38.00%Bulgaria United Bulgarian Bank/Bulgaria $0 0 0.00%Bulgaria WOCCU/Bulgaria World Council of Credit $1,760,865 7,525 100.00%Croatia DEMOS/Croatia $0 0 77.00%Croatia FI FLAG International, LLC/Croatia $0 0 100.00%Croatia MikroPlus stedno kreditna zadruga/Croatia $98,052 1,831 90.00%Georgia ACDI/VOCA/Georgia $0 0 100.00%Georgia Constanta Foundation/Georgia $0 0 21.00%Georgia SBDF Small Business Development $0 0 95.00%Georgia WV/Georgia $0 0 30.00%Kazakhstan EBRD/KSBP European Bank for Reconstruction $0 0 .06%Kazakhstan KLF Kazakhstan Loan Fund/Kazakhstan $0 0 28.00%Kazakhstan Lariba Bank/Kazakhstan $0 0 0.00%Kyrgyzstan BTFF (Microcredit Agency) Bai Tushum Financial $0 0 70.00%Kyrgyzstan Frontiers, LLC/Kyrgyzstan $0 0 0.00%Kyrgyzstan MSFF EBRD Micro and Small Finance Facility $0 0 10.64%Macedonia Moznosti Humanitarian Association $83,123 1,457 13.10%
Macedonia WOCCU World Council of Credit Unions, $1,017,094 3,362 45.00%Moldova BIZPRO-Moldova Development Alternatives $209,000 416 97.00%Moldova Moldova AgrolndBank/Moldova $0 0 0.00%Moldova Victoriabank/Moldova $0 0 0.00%Romania CHF International Romania $135,705 651 18.90%Romania WOCCU World Council of Credit Unions $11,375,770 122,265 .10%Russia ACDI/VOCA/Russia $0 0 0.00%Russia Center-Invest Bank/Russia $0 0 0.00%Russia FINCA Foundation for International Community $11,500 175 60.00%Russia FINCA/Tomsk/Russia $0 0 1.00%Russia RCCDF Rural Credit Cooperation Development $0 0 100.00%Russia Russia Banker`s House/Russia $0 0 0.00%Serbia Opportunity International/Serbia $0 0 20.00%Tajikistan EBRD European Bank for Reconstruction and $0 0 0.00%Tajikistan FINCA/Tajikistan $92 19 0.00%Tajikistan MDTM Micro-entrepreneur Development Support $0 0 36.00%Ukraine Nadra Bank/Ukraine $0 0 100.00%Ukraine PCB/UMLP ProCredit Bank Ukraine/Ukraine $0 0 1.00%Ukraine Winrock International/Ukraine $0 0 10.00%Uzbekistan FINCA /Uzbekistan $2,878 474 0.00%
Uzbekistan O`z-MARD Uzbekistan Micro-entrepreneur $0 0 40.00%Uzbekistan WOCCU World Council of Credit Unions, $656,000 2,710 90.00%
$15,764,411 151,210
LAC Bolivia BancoSol Banco Solidario SA/Bolivia $69,963,682 53,600 7.70%Bolivia Caja Los Andes $49,049,210 35,233 15.00%Bolivia Consejo Mundial de Cooperativas de Ahorro y $50,484,708 124,522 66.00%Bolivia FIE/Bolivia $19,842,197 20,267 0.00%Bolivia PRODEM $16,210,940 66,024 50.25%Bolivia ProMujer/Bolivia $3,575,827 49,750 20.00%Brazil Banco ABN AMRO Real S.A./Brazil $0 0 0.00%
Total ASIA
Total EE
G-4

REGION COUNTRY INSTITUTION SAVINGS US$ SAVERS % RURAL
Colombia FINAMERICA/Colombia $0 0 0.00%Ecuador Banco Procredit Sociedad Financiera $0 0 0.00%Ecuador BANCO SOLIDARIO S.A./Ecuador $0 0 0.00%Ecuador CACPECO/Ecuador $6,489,738 31,427 0.00%Ecuador Cooprogreso LTDA/Ecuador $14,029,675 44,262 0.00%Ecuador Riobamba, LTDA/Ecuador $10,592,253 23,285 0.00%Ecuador CREDIFE Banco Del Pinchincha/Ecuador $0 0 0.00%Ecuador Mision Alianza de Noruega/Ecuador $0 0 0.00%Ecuador WOCCU/Ecuador $39,198,857 141,921 79.00%El Salvador ACACSEMERSA DE R.L. Asociacion $181,630 1,305 99.93%
El Salvador ACACU de R.L. Asociacio cooperativa de ahorro $114,476 995 93.74%El Salvador ACCOVI DE R.L. Cooperativa de ahorro y credito $195,425 1,334 99.11%El Salvador AMC de R.L. Sociedad cooperativa de ahorro y $0 0 100.00%El Salvador ASEI Asociacion Salvadorena de extensionistas $0 0 61.48%El Salvador BA Banco Agricola S.A./El Salvador $225,036 1,129 91.47%El Salvador BANSAL Banco Salvadoreno/El Salvador $350,050 2,005 60.41%El Salvador CAM Centro de Apoyo a la Microempresa/El $0 0 67.03%El Salvador ENLACE CRS/El Salvador $435,700 10,160 17.00%El Salvador Financiera Calpia, S.A./El Salvador $35,309,748 35,398 47.50%El Salvador FJND Fundacion Jose Napoleon Duarte/El $0 0 52.64%El Salvador INTEGRAL Apoyo Integral, S.A. de C.V./El $0 0 63.56%Guatemala AGUDESA Asociacion Guatemalteca para el $0 0 90.00%Guatemala Banrural $0 0 0.00%Guatemala FAFIDESS Fundacion de Asesoria Financiera a $0 0 95.00%Guatemala FINCA/Guatemala $257,986 4,680 100.00%Guatemala Genesis Empresarial/Guatemala $0 0 36.46%
Guatemala STC Save The Children/Guatemala $3,602 624 100.00%Haiti ACLAM/World Concern/Haiti $95,628 6,346 81.00%Haiti ACME/Haiti $0 0 0.00%Haiti BUH Banque de l Union Haitienne/Haiti $0 0 10.00%Haiti COD/EMH/Haiti $123,878 9,020 90.00%Haiti FHAF Fonds Haitien de L`Aide a la Femme/Haiti $98,103 2,276 32.50%Haiti FINCA/Haiti $157,658 6,311 80.00%Haiti Fonkoze Fondasyon Kole Zepol/Haiti $3,875,295 53,013 96.00%Haiti MCN Micro Credit National/Haiti $0 0 52.00%Honduras Aval Card/Honduras $0 0 0.00%Honduras Covelo Fundacion Microfinanciera $493,264 6,364 15.00%Honduras FINSOL/Honduras $0 0 5.00%Honduras Hermandad de Honduras $149,945 4,657 60.00%Honduras World Relief/Honduras $1,210 17,130 65.00%Jamaica JNSBL JN SMALL BUSINESS LOANS $0 0 34.33%Mexico ADMIC/Mexico $0 0 0.00%Mexico AMEXTRA Asociacion Mexicana para la $268,546 3,507 32.50%Mexico CAME Centro de Apoyo al Microempresario, $11,896,046 39,324 0.00%Mexico Compartamos Financiera Compartamos/Mexico $0 0 96.31%Mexico FIMEDER La Promotora de Servicios Rurales $0 0 100.00%Mexico FINCA MEXICO FUNDACION INTEGRAL $565,146 11,263 65.00%Mexico FinComun/Mexico $8,894,700 30,033 0.00%Mexico Promujer/Mexico $26,251 6,596 0.00%Mexico WOCCU/Mexico $581,394,622 774,778 .46%Nicaragua FAMA FAMA/Nicaragua $0 0 0.00%
Nicaragua WOCCU World Council of Credit Unions, $2,927,681 25,406 50.00%Peru A.B.PRISMA ASOCIACION BENEFICA $271,787 15,069 72.00%Peru COPEME Consorcio de organizaciones privadas $106,360,573 168,583 30.00%Peru CP Cáritas del Perú/Peru $0 0 5.17%Peru Financiera Solucion/Peru $0 0 0.00%Peru Pro Mujer (Programs for Women)/Peru $17,540 2,267 0.00%Trinidad Royal Bank/Trinidad $0 0 0.00%
G-5

REGION COUNTRY INSTITUTION SAVINGS US$ SAVERS % RURAL
$1,034,128,613 1,829,864
NEAR Afghanistan MISFA Microfinance Investment Support Facility $0 0 0.00%Afghanistan WOCCU/Afghanistan $0 0 0.00%Egypt ABA Alexandria Business Assoc. $0 0 44.40%Egypt ASBA Assiut Business Assoc. $0 0 85.40%Egypt Aswan Business Association $0 0 90.00%Egypt Banque du Caire $0 0 60.00%Egypt DBAC Dakahleya Bus Assoc. for Investors $0 0 67.50%Egypt ESED Egyptian Sm Enter. Dev. Found.. $0 0 17.30%Egypt FAYOUM Small Project Dev. Foundation $0 0 50.00%Egypt SBACD Sharkia Bus Assoc. for Comm. Dev. $0 0 49.80%Egypt SEDAP Small Enter. Dev Assoc. Port Said $0 0 43.10%Egypt SOHAG / SEB $0 0 50.00%Jordan AMC Ahli Microfinancing Company/Jordan $0 0 0.00%Jordan MEMCO Middle East Micro Credit Co./Jordan $0 0 94.00%
Jordan MFW Microfund for Women (formerly $0 0 70.76%Jordan Tamweelcom Jordan Micro Credit $0 0 0.00%Lebanon CHF/AMEEN Access to Microfinance and $0 0 61.00%Morocco Al Amana/Morocco $0 0 1.70%Morocco AMSSF Association Marocaine de Solidarite Sans $0 0 50.00%Morocco FONDEP Fondation pour le Developpment Local $0 0 90.00%Morocco INMAA Institution Marocaine d`Appui a la $0 0 77.00%West Bank FATEN Palestine for Credit & Development/West $28,643 1,235 100.00%
$28,643 1,235
GRAND TOTAL $4,499,622,533 34,466,263
Total LAC
Total NEAR EAST
G-6

003SUSTAINABILITY
LEVELPlannedPlannedPlannedPlannedOperationalPlannedOperationalFinancialFinancialPlannedOperationalPlannedOperationalPlannedPlannedOperationalPlannedFinancialFinancialFinancialFinancialPlannedPlannedFinancialFinancialFinancialFinancialPlannedFinancialPlannedPlannedFinancialPlannedPlannedPlannedPlannedPlannedPlannedFinancialPlannedPlannedFinancialFinancialPlannedFinancialFinancialFinancialFinancialPlannedFinancialFinancialPlannedFinancial
ANNEX G
G-7

SUSTAINABILITY LEVEL
FinancialFinancialFinancialPlannedFinancialFinancialFinancialFinancialPlannedPlannedPlannedFinancialFinancialFinancialFinancialFinancialFinancialFinancialFinancialFinancialFinancialFinancialFinancialOperationalFinancialFinancialFinancialPlannedFinancialPlannedPlannedPlannedPlannedPlannedFinancialPlannedOperationalFinancialPlannedPlannedPlannedFinancialFinancialFinancialPlannedPlannedOperationalOperationalPlannedOperationalPlannedPlannedPlannedPlannedPlannedOperationalPlanned
G-8

SUSTAINABILITY LEVEL
PlannedFinancialFinancialOperationalFinancialFinancialPlannedPlannedFinancialFinancialPlannedPlannedOperationalPlannedPlannedFinancialPlannedPlannedFinancialFinancialFinancialFinancialFinancialOperationalFinancialPlannedFinancialFinancialFinancialPlannedFinancialFinancialFinancialFinancialFinancialPlannedFinancialFinancialFinancialPlannedFinancialPlannedFinancialPlannedFinancialFinancialPlannedFinancialFinancialFinancialFinancialFinancialFinancialFinancialFinancialFinancialPlanned
G-9

SUSTAINABILITY LEVEL
OperationalPlannedOperationalPlannedFinancialOperationalPlannedPlannedOperationalFinancialFinancialPlannedPlannedPlannedPlannedFinancialPlannedPlannedFinancialFinancialFinancialFinancialPlannedPlannedFinancialFinancialFinancialFinancialFinancialPlannedFinancialOperationalFinancialOperationalPlannedOperationalFinancialOperationalPlannedPlannedPlannedPlannedFinancialFinancialPlannedPlannedFinancial
FinancialFinancialFinancialFinancialFinancialOperationalPlanned
G-10

SUSTAINABILITY LEVEL
PlannedFinancialFinancialFinancialFinancialFinancialPlannedFinancialFinancialOperationalFinancialFinancialFinancialPlannedFinancialFinancialFinancialFinancialFinancialPlannedFinancialPlannedFinancialFinancialFinancialOperationalPlannedPlannedFinancialFinancialPlannedOperationalPlannedPlannedOperationalFinancialFinancialFinancialFinancialOperationalPlannedFinancialPlannedOperationalFinancialPlannedFinancialFinancialPlannedFinancialFinancialFinancialPlannedFinancialOperationalFinancialFinancialFinancial
G-11

SUSTAINABILITY LEVEL
PlannedPlannedFinancialFinancialPlannedOperationalFinancialFinancialPlannedOperationalFinancialFinancialPlannedFinancialFinancialFinancialPlannedFinancialFinancialOperationalPlannedPlanned
G-12

Poverty Lending Ratings by Location of Institution, 2003Region Country Institution Portfolio US$ PL Amount US$ PL
RatingAFRICA Angola Development Workshop/Angola 71,555 71,555 100.00%
Angola NVB NovoBanco S.A.R.L./AngolaBenin 2CM Cercle Communautaire Mieux-Etre/Benin 1,210,414 145,455 12.02%Benin CBDIBA Centre Beninois pour le Developpmement 381,573 355,168 93.08%Benin CONVERGENCE 2000 CONVERGENCE 369,523 278,956 75.49%Benin FECECAM Federation des Caisses d`Epargne et de 44,743,975 9,284,374 20.75%Benin GRAPAD/CASFIP Groupe de Recherche et 417,518 410,610 98.35%Benin PADME BENIN Association pour la Promotion et 25,500,889 2,003,675 7.86%Benin PAPME Agence pour la Promotion et l`Appui aux 27,517,146 1,662,781 6.04%DR Congo FINCA/DR Congo 755,620 755,620 100.00%Eritrea HABEN/Eritrea 2,037 2,037 100.00%Eritrea National Council of Negro Women, Inc./Eritrea 100,899 100,899 100.00%Eritrea Vision Eritrea/Eritrea 6,600 1,480 22.42%Ethiopia WISDOM/Ethiopia 1,354,264 1,114,559 82.30%Ghana ADRA Adventist Relief Agency/Ghana 83,212 83,212 100.00%Ghana Akoti Rural Bank, Limited/Ghana 141,154 141,154 100.00%Ghana APED Association of Productive Entrepreneurs in 173,731 139,598 80.35%Ghana Cal Merchant Bank/Ghana 56,770 0 0%Ghana Ecobank/Ghana 28,465 0 0%Ghana Sikaman Savings and Loan/Ghana 1,589,495 67,474 4.24%Ghana Sinapi Aba Trust 3,222,170 2,468,737 76.62%Guinea Enrma Expanded Naturel Ressources 215,889 215,889 100.00%Kenya CDA Coast Development Authority/KenyaKenya Co-op Bank Co-operative Bank of Kenya 3,728,013 372,801 10.00%Kenya Faulu Kenya Limited/Kenya 7,000,000 4,200,000 60.00%Kenya KBL K-Rep Bank Limited/Kenya 11,084,741 4,433,896 40.00%Kenya KWFT Kenya Women Finance Trust/Kenya 10,099,157 3,675,686 36.40%Kenya SAGA SAGA Thrift and Enterprise Promotion, 95,853 26,468 27.61%Kenya SMEP Small and Micro Enterprise 3,466,909 3,466,909 100.00%Malawi OIBM Opportunity International Bank of 51,620 35,866 69.48%Mali Chemonics International/MaliMali Nyesigiso 11,147,404 2,858,664 25.64%Mali SC Save the Children Federation Inc./Mali 633,781 632,767 99.84%Mauritania World Vision/Mauritania 711,407 711,407 100.00%Mozambique FCC Fundo de Credito Comunitario/Mozambique 652,538 521,115 79.86%Mozambique Frontier Finance/Mozambique 2,934,828 713,341 24.31%Mozambique NovoBanco/Mozambique 2,934,828 713,341 24.31%Mozambique Tchuma/Mozambique 1,341,039 480,878 35.86%Nigeria LAPO- Lift Above Poverty Organization/Nigeria 1,412,106 1,412,106 100.00%Nigeria Orphans Caregivers Association/Nigeria 59,192 59,192 100.00%
Rwanda URWEGO/Rwanda 388,038 386,471 99.60%Senegal ACEP/Senegal Alliance de Credit et d`Epargne 24,176,021 4,351,684 18.00%Senegal ACRA Association de Coopératives Rurales en 462,021 219,257 47.46%Senegal CAPEC JOOBASS Caisse Populaire d`Epargne et 6,812 1,589 23.33%Senegal CAPEC SAMM SA NGOR Caisse Populaire 36,621 27,832 76.00%Senegal CAPFED Caisse d`Epargne et de Credit des 42,323 15,955 37.70%Senegal CBAO/Senegal 61,983 0 0%Senegal CMECAT Caisse des Mutuelles des Artisans de 239,311 0 0%Senegal CMS Credit Mutuel Senegal 20,572,284 3,674,087 17.86%Senegal COFDEC Collectif des Femmes pour le 216,458 61,291 28.32%Senegal FADECBA Federation des Associations de 57,830 57,830 100.00%Senegal FNGPF Federation Nationale des Groupements de 6,137,800 1,170,786 19.08%Senegal GEC FEMUNI Groupement d`Epargne et de Credit 42,446 11,418 26.90%Senegal GEC GANDA Groupement d`Epargne et de Credit 10,901 2,958 27.14%
ANNEX H
H-1

Region Country Institution Portfolio US$ PL Amount US$ PL Rating
Senegal GEC LAWTAN Groupement d`Epargne et de 15,598 15,598 100.00%Senegal GEC TINAARE Groupement d`Epargne et de 452 452 100.00%Senegal IMCEC CCF Institution Mutualiste Communautaire 634,553 379,502 59.81%Senegal INTER CREC Entre les Caisses Rurales d`Epargne 248,933 16,486 6.62%Senegal MCEG NAFA Mutuelle d`Epargne, de Credit et de 104,534 21,591 20.65%Senegal MEC ADEFAP 59,512 56,417 94.80%Senegal MEC ADER Mutuelle d`Epargne et de Credit des 11,207 8,405 75.00%Senegal MEC ANAMBE Mutuelle d`Epargne et de Credit 53,307 40,077 75.18%Senegal MEC COCOGES Mutuelle d`Epargne et de Credit 76,268 56,455 74.02%Senegal MEC EGAM Mutuelle d`Epargne et de Credit de 9,643 9,162 95.01%Senegal MEC FADEC Mutuelle d`Epargne et de Credit de 162,982 61,632 37.82%
Senegal MEC FEMZOP Mutuelle d`Epargne et de Credit 27,758 27,758 100.00%Senegal MEC L & D Mutuelle d`Epargne et de Crédit 147,173 19,909 13.53%Senegal MEC PROPEM Mutuelle d`Epargne et de Credit 230,289 54,835 23.81%Senegal MEC PROTES Mutuelle d`Epargne et de Crédit 363,775 35,591 9.78%Senegal MECARTH Mutuelle d`Epargne et de Credit des 334,309 16,364 4.89%Senegal MECFAM Mutuelle d`Epargne et de Credit des 33,268 30,108 90.50%Senegal MFC/Senegal Mutuelle des Femmes du 14,505 7,905 54.50%Senegal MUPROEL Mutuelle des Professionnels de 999 833 83.38%Senegal MUPROP Mutuelle des Professionnels de la 9,407 591 6.28%Senegal PAMECAS Partenariat pour la Mobilisation de 13,163,231 2,737,952 20.80%Senegal PLAN International/Senegal 269,571 140,401 52.08%Senegal PPMEH Projet de Promotion des Petites et 791,410 160,577 20.29%Senegal PROFEMU Programme des Femmes en Milieu 468,586 24,200 5.16%Senegal RECEC Reseau des Caisses d`Epargne et de Credit 845,742 440,889 52.13%Senegal UFC Union des Femmes Commercantes/Senegal 64,100 64,100 100.00%Senegal UGPF Union des Groupements de Promotion 19,930 18,381 92.23%Senegal UMEC Union des Mutuelles d`Epargne et de Credit 719,990 359,995 50.00%Senegal UNACOIS Union Nationale des Commerçants et 6,897,360 1,434,651 20.80%South FINCA Foundation for International Community 137,000 61,000 44.53%South Teba Bank/South AfricaSudan SUMI Sudan Microfinance Institution/Sudan 8,700 8,700 100.00%Uganda FINCA Uganda Foundation for International 2,452,000 2,284,000 93.15%Uganda FOCCAS Foundation for Credit and Community 669,602 654,111 97.69%Uganda FTCU Feed The Children Uganda/Uganda 695,005 79,030 11.37%Uganda FUL Faulu Uganda Ltd./Uganda 2,178,203 738,287 33.89%Uganda Grameen Foundation/Uganda 404,958 354,908 87.64%Uganda Katakwi Soroti Development Organisation 410,794 401,246 97.68%Uganda MED-Net Microenterprise Development 1,179,738 1,179,738 100.00%Uganda PRIDE UGANDA Promotion of Rural Initiatives 6,913,567 4,621,424 66.85%Uganda UMU Uganda Microfinance Union/Uganda 5,331,020 5,039,527 94.53%Uganda U-TRUST UGANDA FINANCE TRUST 4,260,540 1,826,537 42.87%Uganda WOCCU/Uganda 1,189,648 169,364 14.24%
Zambia FINCA/Zambia 348,027 338,101 97.15%Zimbabwe Chawada Chawada Savings and Credit Cooperative 6,797 6,797 100.00%Zimbabwe CSFS Collective Self-Finance Scheme/Zimbabwe 11,424 11,424 100.00%Zimbabwe Kingdom Bank/Zimbabwe 2,434,357 1,262,963 51.88%Zimbabwe LUPANE Lupane Savings and Credit Union 3,098 3,098 100.00%Zimbabwe NASCUZ National Association of Savings and Zimbabwe Pundutso Microfinance Pvt Ltd/Zimbabwe 99,505 99,505 100.00%Zimbabwe SHDF (SCORE) Self Help Development 601,791 119,790 19.91%Zimbabwe TAKURA Takura Nyakasikana SACCO 10,230 10,230 100.00%Zimbabwe WDSCU Women Development Savings & Credit 25,537 25,537 100.00%Zimbabwe Zambuko Trust/Zimbabwe 15,132 14,981 99.00%Zimbabwe ZAMFI Zimbabwe Association of Micro
273,109,032 79,165,326
ASIA Bangladesh CARE /Bangladesh 1,053,987 1,053,987 100.00%
Total AFRICA
H-2

Region Country Institution Portfolio US$ PL Amount US$ PL Rating
Bangladesh Dhaka Bank/Bangladesh 8,621 0 0%Bangladesh Prime Bank/Bangladesh 83,174 0 0%Bangladesh WR/CSS Christian Service Society/Bangladesh 1,474,015 1,472,365 99.89%Cambodia EMT Ennatien Moulethan Tchorebat/Cambodia 5,640,976 5,640,976 100.00%Cambodia TPC. Ltd. Thaneakea Phum (Cambodia), 2,198,182 2,198,182 100.00%India Cashpor/India 1,308,343 1,308,343 100.00%India CHF Cooperative Housing Foundation Indonesia Bank NISP/Indonesia 109,968 0 0%Indonesia BRI Bank Rakyat Indonesia/Indonesia 1,670,000,000 928,019,000 55.57%Indonesia OI Opportunity International/Indonesia 340,389 336,999 99.00%Nepal NUBL Nirdhan Utthan Bank, Ltd./Nepal 2,824,309 2,824,309 100.00%Nepal Save the Children US/Nepal 2,622,391 2,596,167 99.00%Pakistan KB Khushhalibank/Pakistan 12,400,000 11,478,261 92.57%Pakistan PPAF Pakistan Poverty Alleviation Fund/PakistanPhilippines Bangko Kabayan/Philippines 137,996 26,551 19.24%Philippines Bangko Mabuhay/Philippines 41,188 24,941 60.55%Philippines Bangko Santiago de Libon/Philippines 235,555 77,578 32.93%Philippines Bank of Florida/Philippines 24,450 1,142 4.67%Philippines Bank Victorias/Philippines 65,713 17,472 26.59%Philippines Bukidnon Cooperative Bank/Philippines 214,689 126,674 59.00%Philippines CARD Center for Agriculture and Rural Developme 2,171,709 2,171,709 100.00%Philippines Century Rural Bank/Philippines 31,198 17,246 55.28%Philippines CEV Community Economic Ventures, Inc/Philippin 540,540 540,540 100.00%Philippines Cooperative Bank of Misamis Oriental, Inc./Philippi 170,803 40,302 23.60%Philippines Country Bank/Philippines 14,163 5,256 37.11%Philippines CRS/PH Catholic Relief Services - USCC, Philippin 2,042,489 2,042,489 100.00%Philippines FICO First Isabela Cooperative Bank/Philippines 229,629 22,060 9.61%
Philippines First Macro Bank/Philippines 117,990 53,182 45.07%Philippines MRB Maranao Rural Bank/Philippines 331,991 214,689 64.67%Philippines Network Rural Bank/Philippines 170,967 0 0%Philippines Rang-Ay Bank/Philippines 20,188 13,205 65.41%Philippines Rural Bank of Bogo/Philippines 17,947 9,023 50.28%Philippines Rural Bank of Cantilan/Philippines 413,617 225,414 54.50%Philippines Rural Bank of Cotabato/Philippines 14,993 6,057 40.40%Philippines Rural Bank of Datu Paglas/Philippines 25,803 2,897 11.23%Philippines Rural Bank of Digos/Philippines 31,926 12,694 39.76%Philippines Rural Bank of Dipolog/Philippines 59,807 34,776 58.15%Philippines Rural Bank of Dulag/Philippines 169,302 72,800 43.00%Philippines Rural Bank of Isulan/Philippines 52,335 48,617 92.90%Philippines Rural Bank of Kapatagan Valley/Philippines 210,270 84,823 40.34%Philippines Rural Bank of Labrador/Philippines 7,063 4,521 64.01%Philippines Rural Bank of Lebak/Philippines 78,499 50,304 64.08%Philippines Rural Bank of Mabitac/Philippines 128,260 44,528 34.72%Philippines Rural Bank of Montevista/Philippines 372,404 289,491 77.74%Philippines Rural Bank of Oroquieta/Philippines 42,579 9,409 22.10%Philippines Rural Bank of Pagbilao/Philippines 14,566 9,044 62.09%Philippines Rural Bank of Panabo/Philippines 35,872 11,209 31.25%Philippines Rural Bank of Santo Tomas/Philippines 125,608 74,519 59.33%Philippines Rural Bank of Siam, Inc./Philippines 132,982 61,602 46.32%Philippines Rural Bank of Tacurong/Philippines 217,504 157,419 72.38%Philippines Rural Bank of Tagum/Philippines 102,128 22,490 22.02%Philippines Rural Bank of Talisayan/Philippines 154,880 87,105 56.24%Philippines Rural Green Bank of Caraga/Philippines 967,164 298,753 30.89%Philippines Saranggani Rural Bank/PhilippinesPhilippines WOCCU/CUES-Phils. World Council of Credit 47,031,909 11,118,853 23.64%Vietnam WOCCU/Vietnam 976,379 976,379 100.00%
1,758,009,410 976,036,352Total ASIA
H-3

Region Country Institution Portfolio US$ PL Amount US$ PL Rating
EE Albania PSHM Partneri Shqiptar ne Mikrokredi/Albania 4,043,694 381,019 9.42%Azerbaijan ASM Azeri Star Microfinance/Azerbaijan 490,477 490,477 100.00%Azerbaijan CredAgro LLC CredAgro Non Banking Credit 3,170,377 48,541 1.53%Azerbaijan Foundation for International Community 1,030,299 959,728 93.15%Bosnia CARE/Bosnia 17,558,875 677,924 3.86%Bosnia CHF Communities, Habit, Finance (Cooperative 2,226,656 199,246 8.95%Bosnia UMCOR UNITED METHODIST COMMITTEE Bulgaria CRS Catholic Relief Services/Bulgaria 1,357,816 755,820 55.66%Bulgaria NACHALA Cooperative/Bulgaria 3,639,252 213,056 5.85%Bulgaria United Bulgarian Bank/Bulgaria 106,973 0 0%Bulgaria WOCCU/Bulgaria World Council of Credit 2,446,466 2,100,000 85.84%Croatia DEMOS/Croatia 1,356,422 258,000 19.02%Croatia FI FLAG International, LLC/Croatia 320,000 0 0%Croatia MikroPlus MikroPlus stedno kreditna 869,657 336,884 38.74%Georgia ACDI/VOCA/Georgia 2,036,073 105,033 5.16%Georgia Constanta Foundation/Georgia 3,536,047 2,336,058 66.06%
Georgia SBDF Small Business Development 360,059 39,606 11.00%Georgia WV/Georgia 729,933 138,150 18.93%Kazakhstan EBRD/KSBP European Bank for Reconstruction 51,507,491 3,063,346 5.95%Kazakhstan KLF Kazakhstan Loan Fund/Kazakhstan 3,075,611 2,029,374 65.98%Kazakhstan Lariba Bank/Kazakhstan 3,996 0 0%Kyrgyzstan BTFF (Microcredit Agency) Bai Tushum Financial 2,092,219 243,901 11.66%Kyrgyzstan Frontiers, LLC/KyrgyzstanKyrgyzstan MSFF EBRD Micro and Small Finance Facility 2,587,679 355,989 13.76%Macedonia Moznosti Humanitarian Association 8,879,053 144,661 1.63%Macedonia WOCCU World Council of Credit Unions, 1,746,399 0 0%Moldova BIZPRO-Moldova Development Alternatives 6,592,000 5,603,200 85.00%Moldova Moldova AgrolndBank/Moldova 410,286 12,225 2.98%Moldova Victoriabank/Moldova 3,854 0 0%Romania CHF CHF International Romania/Romania 3,916,495 10,000 .26%Romania WOCCU World Council of Credit Unions 21,740,203 11,632,842 53.51%Russia ACDI/VOCA/Russia 1,867,232 117,600 6.30%Russia Center-Invest Bank/Russia 511,560 0 0%Russia FINCA Foundation for International Community 3,391,365 873,438 25.75%Russia FINCA/Tomsk/Russia 896,992 358,797 40.00%Russia RCCDF Rural Credit Cooperation Development 5,691,898 0 0%Russia Russia Banker`s House/Russia 62,043 0 0%Serbia Opportunity International/Serbia 2,400,960 854,000 35.57%Tajikistan EBRD European Bank for Reconstruction and 344,929 42,486 12.32%Tajikistan FINCA/Tajikistan 4,167 4,167 100.00%Tajikistan MDTM Micro-entrepreneur Development Support 243,843 243,843 100.00%Ukraine Nadra Bank/Ukraine 133,345 0 0%Ukraine PCB/UMLP ProCredit Bank Ukraine/Ukraine 107,237,001 3,358,983 3.13%Ukraine Winrock International/Ukraine 164,600 98,000 59.54%Uzbekistan FINCA /Uzbekistan 78,497 78,497 100.00%Uzbekistan O`z-MARD Uzbekistan Micro-entrepreneur 227,954 227,954 100.00%Uzbekistan WOCCU World Council of Credit Unions, 839,284 500,000 59.57%
271,930,031 38,892,845
LAC Bolivia BancoSol Banco Solidario SA/Bolivia 91,175,470 5,587,788 6.13%Bolivia Caja Los Andes 82,179,376 3,049,672 3.71%Bolivia Consejo Mundial de Cooperativas de Ahorro y 46,434,107 1,649,250 3.55%Bolivia FIE/Bolivia 40,389,898 1,793,311 4.44%Bolivia PRODEM 62,016,034 1,642,395 2.65%
Bolivia ProMujer/Bolivia 5,586,663 3,587,564 64.22%Brazil Banco ABN AMRO Real S.A./Brazil 189,695 31,445 16.58%Colombia FINAMERICA/Colombia 18,212 5,970 32.78%Ecuador Banco Procredit Sociedad Financiera 21,907,660 0 0%
Total EE
H-4

Region Country Institution Portfolio US$ PL Amount US$ PL Rating
Ecuador BANCO SOLIDARIO S.A./Ecuador 7,223,501 19,016 .26%Ecuador CACPECO/Ecuador 9,579,261 0 0%Ecuador Cooperativa de Ahorro Y Credito Cooprogreso 20,272,512 0 0%Ecuador Cooperativa de Ahorro Y Credito Riobamba, 16,187,312 0 0%Ecuador CREDIFE Banco Del Pinchincha/Ecuador 27,988,143 0 0%Ecuador Mision Alianza de Noruega/Ecuador 3,501,857 475,807 13.59%Ecuador WOCCU/Ecuador 46,064,121 2,710,950 5.89%El Salvador ACACSEMERSA DE R.L. Asociacion Cooperativa 1,810,310 74,668 4.12%El Salvador ACACU de R.L. Asociacio cooperativa de ahorro y 2,203,091 39,566 1.80%El Salvador ACCOVI DE R.L. Cooperativa de ahorro y credito 4,375,185 44,354 1.01%El Salvador AMC de R.L. Sociedad cooperativa de ahorro y 3,561,119 390,394 10.96%El Salvador ASEI Asociacion Salvadorena de extensionistas 525,180 497,343 94.70%El Salvador BA Banco Agricola S.A./El Salvador 1,241,926 60,921 4.91%El Salvador BANSAL Banco Salvadoreno/El Salvador 3,214,390 314,648 9.79%El Salvador CAM Centro de Apoyo a la Microempresa/El 4,489,285 3,638,623 81.05%El Salvador ENLACE CRS/El Salvador 1,798,886 1,726,789 95.99%El Salvador Financiera Calpia, S.A./El Salvador 67,357,372 5,362,242 7.96%El Salvador FJND Fundacion Jose Napoleon Duarte/El 1,319,176 273,852 20.76%El Salvador INTEGRAL Apoyo Integral, S.A. de C.V./El 11,396,390 847,583 7.44%Guatemala AGUDESA Asociacion Guatemalteca para el 975,282 455,134 46.67%Guatemala Banrural 17,693 0 0%Guatemala FAFIDESS Fundación de Asesoria Financiera a 2,967,835 2,967,835 100.00%Guatemala FINCA/Guatemala 723,619 723,619 100.00%Guatemala Genesis Empresarial/Guatemala 18,559,945 3,009,501 16.22%Guatemala STC Save The Children/Guatemala 124,604 124,604 100.00%Haiti ACLAM/World Concern/Haiti 362,828 290,262 80.00%Haiti ACME/Haiti 2,547,522 901,266 35.38%Haiti BUH Banque de l Union Haitienne/Haiti 1,117,271 112,500 10.07%Haiti COD/EMH/Haiti 182,899 182,899 100.00%Haiti FHAF Fonds Haitien de L`Aide a la Femme/Haiti 743,032 194,502 26.18%Haiti FINCA/Haiti 322,410 290,169 90.00%Haiti Fonkoze Fondasyon Kole Zepol/Haiti 2,724,779 1,938,428 71.14%Haiti MCN Micro Credit National/Haiti 4,615,663 202,021 4.38%Honduras Aval Card/Honduras 3,374,543 3,705 .11%Honduras Covelo Fundacion Microfinanciera 8,747,875 205,149 2.35%Honduras FINSOL/Honduras 8,255,469 825,547 10.00%Honduras Hermandad de Honduras 2,569,000 2,055,200 80.00%Honduras World Relief/Honduras 3,614 2,742 75.87%Jamaica JNSBL JN SMALL BUSINESS LOANS 1,878,434 368,818 19.63%Mexico ADMIC/Mexico 3,747,945 1,079,881 28.81%Mexico AMEXTRA Asociacion Mexicana para la 521,891 211,233 40.47%Mexico CAME Centro de Apoyo al Microempresario, 4,272,725 0 0%Mexico Compartamos Financiera Compartamos/Mexico 68,845,959 68,845,959 100.00%Mexico FIMEDER La Promotora de Servicios Rurales S.A. 1,102,654 7,017 .64%Mexico FINCA MEXICO FUNDACION INTEGRAL 2,872,088 1,819,054 63.34%Mexico FinComun/Mexico 8,040,415 2,983,485 37.11%Mexico Promujer/Mexico 613,388 613,388 100.00%Mexico WOCCU/Mexico 491,185,685 15,377,505 3.13%Nicaragua FAMA/Nicaragua 11,944,363 2,433,875 20.38%Nicaragua WOCCU World Council of Credit Unions, 3,152,587 914,250 29.00%Peru A.B.PRISMA ASOCIACION BENEFICA 4,234,430 3,378,849 79.79%Peru COPEME Consorcio de organizaciones privadas de 117,133,611 16,041,035 13.69%Peru CP Cáritas del Perú/Peru 1,734,429 1,567,489 90.37%Peru Financiera Solucion/Peru 6,198,590 162,084 2.61%Peru Pro Mujer (Programs for Women)/Peru 1,583,424 1,580,124 99.79%Trinidad Royal Bank/Trinidad 56,074 370 .66%
1,372,060,708 165,693,651Total LAC
H-5

Region Country Institution Portfolio US$ PL Amount US$ PL Rating
NEAR Afghanistan MISFA Microfinance Investment Support Facility Afghanistan WOCCU/AfghanistanEgypt ABA Alexandria Business Assoc. 8,554,266 427,983 5.00%Egypt ASBA Assiut Business Assoc. 8,087,742 1,769,498 21.88%Egypt Aswan Business Association 118,901 19,843 16.69%Egypt Banque du Caire 8,715,204 2,441,900 28.02%Egypt DBAC Dakahleya Bus Assoc. for Investors Comm. 3,826,169 1,306,710 34.15%Egypt ESED Egyptian Sm Enter. Dev. Found.. 7,782,607 1,737,781 22.33%Egypt FAYOUM Small Project Dev. Foundation 357,276 200,895 56.23%Egypt SBACD Sharkia Bus Assoc. for Comm. Dev. 2,746,209 899,751 32.76%Egypt SEDAP Small Enter. Dev Assoc. Port Said 981,829 164,610 16.77%Egypt SOHAG / SEB 562,909 47,038 8.36%Jordan AMC Ahli Microfinancing Company/Jordan 2,822,604 0 0%Jordan MEMCO Middle East Micro Credit Co./Jordan 4,440,694 112,065 2.52%Jordan MFW Microfund for Women (formerly 3,095,442 241,604 7.81%Jordan Tamweelcom Jordan Micro Credit Company/Jordan 2,614,725 23,700 .91%Lebanon CHF/AMEEN Access to Microfinance and 5,137,726 3,085 .06%Morocco Al Amana/Morocco 28,327,279 8,776,694 30.98%Morocco AMSSF Association Marocaine de Solidarite Sans 923,240 0 0%Morocco FONDEP Fondation pour le Developpment Local et 1,467,145 1,301,944 88.74%West Bank FATEN Palestine for Credit & Development/West 1,261,664 752,092 59.61%
92,154,417 20,557,980
3,767,263,598 1,280,346,153
Total NEAR EAST
GRAND TOTAL
H-6

BDS Providers in USAID Survey, 2003
Region Country Institution Clients # Women %
Rural %
AFRICA Benin EnterpriseWorks Worldwide/Benin 1,619 10% 98%Eritrea REU Rural Enterprise Unit/Eritrea 515 18% 66%Ethiopia CARE/Ethiopia 1,230 30% 100%Ghana Aid to Artisans/Ghana 541 19% 80%Ghana AMEX International, Inc./Ghana 0 0% 0%Ghana Federation Association of Ghanaian Exporters 100 30% 30%Ghana GEEKCORP/IESC/Ghana 19 1% 0%Ghana OICI Opportunities Industrialization Centers 1,698 100% 100%Ghana TNS/G TechnoServe/Ghana 70 45% 80%Guinea Enrma Expanded Naturel Ressources 3,124 48% 95%Kenya TNS TechnoServe/Kenya 68 12% 87%Mozambique ACDI/VOCA Mozambique 2,575 33% 100%Mozambique ADRA/Mozambique 3,522 24% 100%Mozambique Africare/Mozambique 65 39% 94%Mozambique CARE/Mozambique 33,036 31% 100%Mozambique CLUSA Cooperative League of the United States of 5,000 20% 100%Mozambique FHI/Mozambique Food For The Hungry 416 50% 100%Mozambique Save the Children/Mozambique 1,927 37% 100%Mozambique TechnoServe, Inc./Mozambique 25 5% 100%Mozambique World Vision/Mozambique/Mozambique 250 35% 100%Namibia Sigma One Corporation/Namibia 1,108 47% 11%Senegal EWW EnterpriseWorks Worldwide/Senegal 422 54% 81%South Africa CEBI Community Entrepreneurship and Business 4,211 75% 10%Tanzania Enterprise Works/Tanzania 3,257 4% 90%
Tanzania TechnoServe Tanzania 15,048 0% 100%Uganda ATU AT Uganda Ltd./Uganda 8,500 50% 97%Zambia CLUSA RGB Co-operative League of the USA - 10,320 60% 100%Zambia ZCSMBA-LADT ZCSMBA-Lyambai Agricultural 572 39% 100%
99,238
ASIA Bangladesh IDE International Development 10,000 15% 100%
ANNEX I
Total AFRICA
I-1

Region Country Institution Clients # Women %
Rural %
India AT Appropriate Technology/India 1,963 100% 100%Mongolia CHF/Mongolia GER Initiative/Mongolia 1,015 53% 0%Mongolia Gobi Initiative -Phase II Mercy Corps and PACT 3,478 51% 100%
16,456
EE Azerbaijan ACDI/VOCA/Azerbaijan 2,236 41% 100%Azerbaijan IFDC International Fertilizer Development 83 2% 100%EE Region ACDI/VOCA CAMFA/EE Region 40 30% 35%Kazakhstan Mashav/Kazakhstan 350 60% 80%Kazakhstan Pragma Corp/Kazakhstan 240 13% 0%Kyrgyzstan ACDI/VOCA:CAIP/Kyrgyzstan 35 50% 75%Kyrgyzstan LARC/Kyrgyzstan 7,093 30% 100%Kyrgyzstan Mashav/Kyrgyzstan 150 40% 90%Kyrgyzstan Pragma Corp/Kyrgyzstan 32 32% 11%Kyrgyzstan USAID Legal Infrastructure For a Market Economy 80 60% 25%Macedonia ATA/Macedonia Aid to 580 41% 40%Moldova CNFA Citizens Network of Foreign Affairs/Moldova 798 31% 93%Serbia CHF Cooperative Housing 115 37% 90%Serbia IRD International Relief and Development, 49 30% 81%Tajikistan Pragma Corp/Tajikistan 329 54% 100%Turkmenistan Pragma Corporation/Turkmenistan 1,198 46% 75%Ukraine CURE/UREP Center for Ukrainian Reform 28,523 27% 0%Ukraine LOL AMP-Land O`Lakes/Ukraine 450 17% 80%Ukraine NTCA BIC NTCA Business Internet 4,000 35% 100%Uzbekistan Mercy Corps/Uzbekistan 300 20% 60%Uzbekistan Pragma/Uzbekistan 19 10% 60%
46,700
LAC Haiti ATA Aid to Artisans/Haiti 225 40% 70%Honduras Fintrac CDA Fintrac Inc / Centro de Desarrollo de 3,840 10% 70%
4,065
166,459GRAND TOTAL
Total ASIA
Total EE
Total LAC
I-2

Region Country Institution Clients # Women %
Rural %
AFRICA Benin EWW/Benin EnterpriseWorks 0 0% 0%Ethiopia ACDI/VOCA/Ethiopia 1,100 8% 100%Ethiopia Virginia Tech Virginia Polytechnic and 0 0% 0%Ghana AMEX International, Inc./Ghana 0 0% 0%Ghana CARE Cooperative Assistance and Relief 1,745 26% 90%Ghana Federation Association of Ghanaian 75 30% 60%Ghana Ghana Co-operative of Susu Collectors 0 0% 0%Kenya AFE Action for Enterprise/Kenya 0 0% 0%Kenya CDA Coast Development Authority/Kenya 0 0% 0%Kenya USAID Kenya BDS Program/Kenya 5,805 25% 100%Mali AFE Action for Enterprise/Mali 580 100% 100%Mozambique ADRA/Mozambique 560 25% 100%Mozambique CLUSA Cooperative League of the United 700 25% 100%Senegal Chemonics International Inc. - 18,035 27% 79%Senegal EWW EnterpriseWorks 0 0% 0%South Africa WEI World Education NTINGA/South 3,014 26% 40%Tanzania ACDI/VOCA/Tanzania 3,000 75% 100%Tanzania DAI Development Alternatives, 1,200 30% 100%Tanzania Enterprise Works/Tanzania 2,826 5% 95%Uganda AT Uganda Ltd./Uganda 182 24% 100%Zambia IDE International Development 0 0% 0%Zambia IESC Copperlink International Executive 1,098 40% 0%Zambia ZAMTIE Zambia Trade and Investment 0 0% 0%
Zambia ZCSMBA Zambia Chamber of Small and 1,407 41% 68%Zimbabwe LEAD Linkages for the Economic 21,780 66% 100%
63,107
ASIA Bangladesh IRIS/JOBS University of 890 49% 71%Bangladesh WorldFish Center/Bangladesh 30,787 42% 100%India AT Appropriate Technology/India 1,963 100% 100%India International Development 10,511 15% 100%Indonesia CARE-UNBAR SAMBA Silk And 1,298 16% 100%Nepal IDE International Development 7,097 41% 95%Nepal WE World Education Incorporated/Nepal 0 0% 0%Vietnam IDE International Development 1,019 0% 100%
53,565
EE Azerbaijan CHF Cooperative Housing 1,065 38% 100%Azerbaijan Mercy Corps 2,000 9% 100%Central Asian CDC/MBAEC Citizens Democracy Corps, 0 0% 0%Croatia DAI Development Alternatives 0 0% 0%Croatia Deloitte Touche Tohmatsu Deloitte 0 0% 0%Kazakhstan ARD, Inc./Kazakhstan 0 0% 0%Kazakhstan Pragma Corp/Kazakhstan 0 0% 0%Kyrgyzstan CDC/MBAEC/Kyrgyzstan 0 0% 0%Kyrgyzstan IFDC International Fertilizer Development 150 13% 83%Kyrgyzstan Land Reform/Kyrgyzstan 937 30% 0%Kyrgyzstan USAID Legal Infrastructure For a Market 150 70% 20%
BDS Facilitators in USAID Survey, 2003
Annex J
Total AFRICA
Total ASIA
J-1
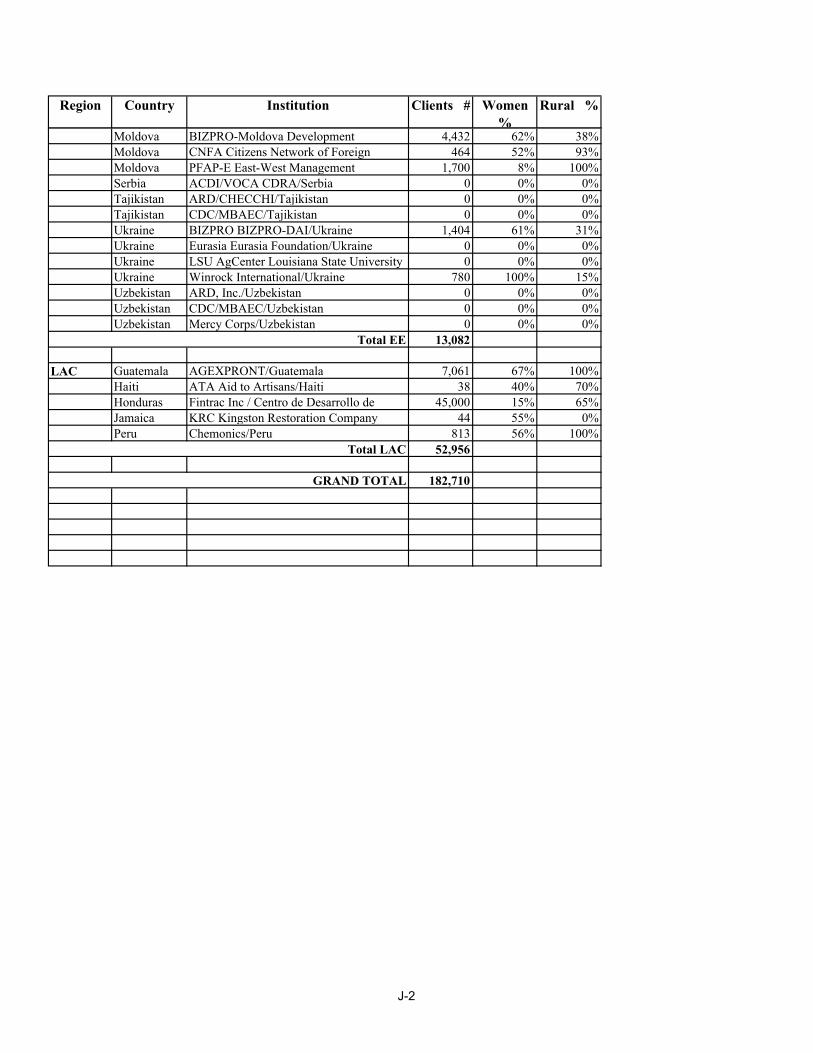
Region Country Institution Clients # Women %
Rural %
Moldova BIZPRO-Moldova Development 4,432 62% 38%Moldova CNFA Citizens Network of Foreign 464 52% 93%Moldova PFAP-E East-West Management 1,700 8% 100%Serbia ACDI/VOCA CDRA/Serbia 0 0% 0%Tajikistan ARD/CHECCHI/Tajikistan 0 0% 0%Tajikistan CDC/MBAEC/Tajikistan 0 0% 0%Ukraine BIZPRO BIZPRO-DAI/Ukraine 1,404 61% 31%Ukraine Eurasia Eurasia Foundation/Ukraine 0 0% 0%Ukraine LSU AgCenter Louisiana State University 0 0% 0%Ukraine Winrock International/Ukraine 780 100% 15%Uzbekistan ARD, Inc./Uzbekistan 0 0% 0%Uzbekistan CDC/MBAEC/Uzbekistan 0 0% 0%Uzbekistan Mercy Corps/Uzbekistan 0 0% 0%
13,082
LAC Guatemala AGEXPRONT/Guatemala 7,061 67% 100%Haiti ATA Aid to Artisans/Haiti 38 40% 70%Honduras Fintrac Inc / Centro de Desarrollo de 45,000 15% 65%Jamaica KRC Kingston Restoration Company 44 55% 0%Peru Chemonics/Peru 813 56% 100%
52,956
182,710GRAND TOTAL
Total EE
Total LAC
J-2

Region Country Institution Institution Type
Policy Issue
AFRICA Benin CARE Cooperative for Assistance and Relief NGO Microfinance institution regulationCollateral for loan guaranteesGovernment intervention in microfinance
Kenya AMFI The Association of Microfinance NGO Microfinance Policy and Regulatory Framework .Kenya KIPPRA Kenya Institute for Public Policy Research/Edu Capacity BuildingSouth Africa Nathan Associates, Inc./South Africa Consulting Credit Law Reform
Housing financeCompetition in banking
Tanzania International Business Intiatives/Chemonics Consulting Tax PoliciesGovernment policy and plans for utilizing minesDiversification of economic activitiesEnvironmental concerns of small scale businesses
ASIA India Sa-Dhan The Association of Community Business Mainstreaming MicrofinanceAccessing Global Green/ Ethical fundsTaxation Framework for microfinanceEnabling Environment for MicrofinanceIncreasing bank interest in expanding Interest rate repression
Indonesia CARE-UNBAR SAMBA Silk And NGO Silk Industry Policy CoordinationIndonesia GIAT/Nathan MSI Growth through Investment Consulting Financial Regulations
Business DevelopmentLocal Regulations and Business Environment for SME Women's EmpowermentWomen and AdvocacyRetailing Policy and SMEsSME Policy AdvocacyRegulatory Review on SME
Indonesia PEG Partnership for Economic Consulting Trade PolicyFinancial Regulation
Indonesia The Asia Foundation/Indonesia PVO Bureaucratic burden of licensing on MSEsDecentralizationReduce intra-regional trade barriersIncrease financial access for MSEs
Philippines Chemonics International, Inc./Philippines Consulting To include microfinance in bank examination Need for microfinance performance standards
Philippines DAI/TPPA Development Alternatives Consulting The need for transparency and effective regulatoryCredit bureaus
EE Georgia Chemonics International Chemonics Consulting MFI Activity Law Amendment Tiered regulation
Financial Leasing LawKazakhstan ARD, Inc./Kazakhstan Consulting Land policy and legislations, regulation
Farmers’ land rights
Policy Research by USAID-Supported Institutions, 2003
Annex K
K-1

Region Country Institution Institution Type
Policy Issue
Kazakhstan Bearing Point/Kazakhstan Consulting AuditBudgetFiscal Analysis – Senate apparatusInter-governmental fiscal relationshipsTaxation
Kazakhstan Pragma Corp/Kazakhstan For Profit Administrative Barriers to Trade
MAS-Q; conformance to WTO regulationsFinancial Sector DevelopmentFinancial RegulationHousingCredit
Kyrgyzstan Barents Group of KPMG Consulting Tax PolicyTax CodeTax Administraition
Kyrgyzstan IFC International Finance Non Bank Microfinance Regulatory Capicity BuildingKyrgyzstan Land Reform/Kyrgyzstan Consulting Establishment of mortgage lending system
Market-Based Land Use PlanningDevelopment of Real Estate ProfessionEstablishment of water rights system
Kyrgyzstan LARC/Kyrgyzstan NGO Rural land rightsLegal documentation developmentTax legislation
Kyrgyzstan Pragma Corp/Kyrgyzstan For Profit Enterprise Development ProjectKyrgyzstan USAID Legal Infrastructure For a Market Consulting To foster the development of commercial law and
Legislative Drafting in a Variety of Areas.Training in Law for Judges, Lawyers and Other
Moldova BIZPRO-Moldova Development Alternatives Consulting Inter-departmental Commission on Coordination National Working Group on Regulatory ReformMinistry of EconomyMinistry of FinanceLocal public authorities, and central public repreBusiness Associations
Russia DAI Development Alternatives, Inc./Russia Consulting Deepening the Regulatory AuthorityDissemination of Information on Legal and
Serbia Booz Allen Hamilton/Serbia Consulting Labor LawIntellectual Property RightsRegulations
Tajikistan Abt Associates/Tajikistan Consulting Financial regulationMicrofinance regulationCollateral
Tajikistan ARD/CHECCHI/Tajikistan Consulting Land policy and legislations, regulationFarmers’ land rights
Tajikistan IFC/Tajikistan Non Bank Legal ReformRegulation/Supervision of MFIs
Tajikistan Pragma Corp/Tajikistan For Profit WTO AccessionRemoval of Investment ConstraintsTajik Standards BoardBusiness Licensing and Tax Law
Trade Policy and Customs Reform
K-2

Region Country Institution Institution Type
Policy Issue
Ukraine BIZPRO-DAI/Ukraine Consulting Entrepreneur HotlinesUkraine Eurasia Foundation/Ukraine PVO Corruption prevention, business associations Ukraine UNDP United Nations Development NGO Taxation
Regulatory policyFinancing
Ukraine US-UF CPP US-Ukraine Foundation PVO Improvement of the local government Ukraine Winrock International/Ukraine NGO Increasing access to entrepreneurial trainingUzbekistan Abt/Uzbekistan Consulting Tax policy
WTO accession/trade liberalizationAgricultural financeAdministrative reform
Uzbekistan ARD, Inc./Uzbekistan Consulting Land policy and legislations, regulationFarmers’ land rights
Uzbekistan IFC PEP IFC Private Enterprise Non Bank Microfinance Legislation DevelopmentUzbekistan Pragma/Uzbekistan For Profit WTO Accession
Trade & Commerce Law
LAC Bolivia SBEF Superintendencia de Bancos y Entidades Gov. Agency Business LicensingMicrofinance Institution RegulationMicrofinance Institution SupervisionClose Microfinance Institution
Bolivia Viceministerio de Asuntos Financieros - VAF Gov. Agency Financial RegulationMicrofinance institution regulation (NGOs)Collateral for loan guaranteesCredit Unions regulation
Mexico CII Chemonics International, Inc./Mexico Consulting Legal and Regulatory Framework. Supervision of
K-3