MICROELECTRONICS TECHNOLOGY, INC - MTI … TECHNOLOGY INC. Contents To Our Shareholders 1 MTI ......
50
2002 ANNUAL REPORT MICROELECTRONICS TECHNOLOGY INC.
Transcript of MICROELECTRONICS TECHNOLOGY, INC - MTI … TECHNOLOGY INC. Contents To Our Shareholders 1 MTI ......

2002 ANNUAL REPORT
MICROELECTRONICS TECHNOLOGY INC.

Contents
To Our Shareholders 1
MTI Products Overview 3
Financial Review 5
Selected Financial Data 5
Consolidated Results of Operations 6
Consolidated Financial Statements 9
Notes to Consolidated Financial Statements 15
Independent Accountant’s Report 47
Corporate Directory 48

Report to the Shareholders
To Our Shareholders: The year 2002 proved a challenging year for the overall telecommunications industry. Deteriorating market conditions, coupled with major shifts in industry structure, brought along heavy impacts on all telecom companies. MTI, as one member of the telecom industry community, was not immune to the major impacts wrought by the downturn. However, we are confident that we can meet the challenges as with the MTI management acts in solidarity. As the telecom was shaken by both shrinking telecom capital spending and the “burst of bubble” of Internet economy, MTI achieved annual revenues of NT$3,666M in 2002, 97% of its revised forecast. This represents a 22% reduction of revenues in comparison with MTI’s 2001 performance. Our gross margin in 2002 was NT$ 649M, and the operating profits at NT$68M; our non-operating loss stood at NT$814M, with NT$113M inventory write-off and NT$643M investment loss. After-tax net loss was NT$611M, 102% of revised financial forecast, and it was translated into loss per share at NT$1.43. We would like to highlight that the NT$643M investment loss included an NT$691M loss incurred due to our investment into Asia Global Crossing (AGC) and a recognized NT$220M allowance for account receivable collection. In March 2003, after the court approved Asia Netcom’s takeover of all AGC’s properties, ANC entered into an agreement with MTI to pay us the NT$220M receivables in installments, with the NT$82M first installment of which has been paid. Facing the unprecedented telecom downturn, MTI still maintains stable financial structure, and we will continue to re-examine and improve our operations, in order to achieve superior performance when the telecom market revives. Our key highlights for the year 2002 are as follows: To cooperate with our partners to combat market slowdown Our long-term partners, such as Hughes Network Systems, DMC STRATEX Networks, Lucent Technologies, are all leading telecom players, even though they have been also heavily impacted by the market slowdown. We are taking active measures to develop closer cooperation with them to fight the current downturn and to create opportunities for future. One notable example is our strategic alliance with STRATEX. In June 2002, MTI and STRATEX reached a strategic agreement for cooperation in product design and manufacturing. STRATEX not only transfer most of its manufacturing activities to MTI, but also jointly develop its next-generation products with MTI. As the alliance proceeded as planned, our revenues with STRATEX grew substantially in the second half of 2002, and a new generation of products will be rolled out in the coming third quarter of this year. Based on this successful alliance model, we are extending this concept to our relations with other customers. To restructure our organization in order to expand our market The protracted telecom market slowdown has forced the world’s leading telecom players to trim down its organization, leading to a wholesale overhaul of the global telecom supply chain. To cope with the new industry landscape by satisfying customer demands and capturing market expansion opportunities, MTI restructured its organization into two strategic business units, Microwave Radio Division and Satcom and Mobile Division. Both business units have respectively integrated product development, production, and marketing and sales teams. We also formed a new Product Innovation Center to develop new products for newly emerged markets. Our nine months of implementing the restructuring proved successful, as our business relations with STRATEX, Lucent, and FTA grew tighter, our newly established relations with ECHOSTAR entered into actual shipment, and new products developed for Wi-Fi market.

To develop new products while further rationalize our cost structure The market softness has intensified competition and driven customers demanding better price performance ratio. In response, MTI continues to improve product design for lower cost structure, at the same time expedite to launch new products. We believe the new products we developed will be the new engines for revenue growth, which include Dish Pro Quad LNB for ECHOSTAR, TRIA line for HNS, Unity ODU for STRATEX, CDMA linear power amplifier for Lucent, and 802.11a-based Wi-Fi products. To reform our supply chain management system As the market slows and new opportunities for revenue expansion become limited, to rationalize our cost structure and overhaul our management systems get into our top priority agenda. We have identified supply chain management as MTI’s priority objective for management reform this year. Via reengineering our supply chain management system, we aim to integrate and overhaul our internal processes from customer demand interface to our internal operation and overall supply chain. After full-scale review lasting for months, we have signed a consulting contract with IBM Consulting to kick off the project. This is part of our efforts to further enhance our core competitiveness in order to create even more strategic benefits for our customers. To strengthen MTI manufacturing base in China For cost considerations, MTI has shifted the production of direct labor-intensive LNB product line to China. Our China production base in Wuxi of Jiangsu Province has been fully set up as a RF product manufacturing base, with necessary engineering capabilities in place in first half of this year. As we move forward, Wuxi will also capture the emerging opportunities out of China’s domestic market, fulfilling our strategic intent of entering China market. Looking forward We are aggressively improving our competitiveness, yet we are also realistic about the market outlooks. The international economic situation in 2003 remains uncertain. Though the market has bottomed, the timing for a market rebound is still not visible, especially for the telecom market. The post-Iraqi war Middle East situation is still murky, and the financial tolls on US economy wrought by the military actions may is yet to be fully absorbed. In addition, the SARS just recently dealt a major blow to once-robust Asia Pacific economy, China in particular. All things combined, we remain very conservative about the year 2003. Hence while we work hard to improve our internal operation for breakthrough performance, we target financial breakeven as the goal for this year. After the year 2002, we sincerely thank the support from all our partners, be you our shareholders, our customers, and our dedicated MTI working team members. And our best wishes for your health and happiness. Patick H.Y.Wang Chi-Chia Hsieh Wesley Huang Chairman of the Board Vice Chairman of the Board President
MTI Product Overview

Very Small Aperture Terminal (VSAT)
VSAT, short for Very Small Aperture Terminal is an earthbound station used in satellite communications of data, voice and video signals, excluding broadcast television. A VSAT consists of two parts, a transceiver that is placed outdoors in direct line of sight to the satellite and a device that is placed indoors to interface the transceiver with the end user's communications device, such as a PC. The transceiver either receives or sends signals directly with another VAST, forming a mesh topology, or to a satellite transponder in the sky. The satellite then sends and receives signals from a ground station computer that acts as a hub for the system. In such setup, each end user is interconnected with the hub station via the satellite, forming a star topology. The hub controls the entire operation of the
network. For one end user to communicate with another, each transmission has to first go to the hub station that then retransmits it via the satellite to the other end user's VSAT.
For banks, hotels, mega chain stores, or other large organizations, often with thousand of dispersed branch sites, routine management operations can be a tremendous burden. VSAT systems are an ideal management tool for simplifying corporate tasks through more streamlined inter-company communications. VSAT is also a popular "Leap-frog" method for rapidly expanding the communications infrastructure in developing countries. And, for countries of islands, laying ground lines is prohibitively expensive. VSAT systems provide cost-effective solutions for bringing basic communications to remote locations.
MTI with core competencies in microwave radio frequency technology is specialized in designing and manufacturing VSAT satellite RF transceivers. Providing complete product lines from C, Ku and to Ka band, MTI enable its customers to rapidly deliver Internet, telephone, and video services virtually anywhere in the world. Through close partnership, MTI also uses various opportunities to team up with its partners to further explore VSAT market and pursues business growth in the future.
Direct Broadcast Satellite (DBS) Receiving Equipment
Direct broadcast satellite (DBS) refers to satellite television (TV) systems in which the subscribers, or end users, receive signals directly from geostationary satellites. Signals are broadcast in digital format at microwave frequencies. DBS is the descendant of direct-to-home (DTH) satellite services. A DBS subscriber installation consists of a dish antenna two to three feet (60 to 90 centimeters) in diameter, a conventional TV set, a signal converter placed next to the TV set, and a length of coaxial cable between the dish and the converter. The dish intercepts microwave signals directly from the satellite. The converter, normally known as Low Noise Block-Down converters (LNB), acts as a device to capture the weak signals from broadcasting satellites to deliver sharp images on the TV screen. With the improvement of DBS programming technology and
quality, the penetration rate of global households subscribes is rapidly growing.
MTI, the world’s leading LNB manufacturer, produces complete LNB products to meet various spec requirements of different countries. As of today, MTI’s LNB products serve more than 78 countries in the world. By working closely with its satellite systems customers, MTI becomes fully aware of their needs for enhancing the functions and performance of LNB systems. To further and continuously improve its competitiveness, MTI has expanded its LNB manufacturing site from Taiwan to Wuxi, China in the middle of 2001 to realize cost advantages and capture, in the long run, the emerging China opportunities.
Digital Microwave Point to Point Radios

In telecommunications network, digital microwave radio systems are used to transmit and receive digital information, be it voice, data, or video, between two points. This technology delivers very low bit error rate links that have high immunity to interference, ideal for public and private networks applications that include Wireless Local Loop (WLL), Wide Area Networking (WAN), and Metropolitan Area Networking (MAN). Such high-performance links suits the needs of frame relay applications and last-mile feeders into optical and satellite networks.
Microwave radio offers several advantages over leased lines or other cable-based transmission alternatives for mid- and short- distance link such as between telecommunications networks, among commercial buildings or in rural and urban areas. Microwave radio is simpler, cheaper, faster to deploy, and more flexible to implement than cable & fiber systems, enabling operators to rollout services quickly and provide opportunities to maximize revenues.
MTI has full range of product line featuring microwave transceivers and outdoor units (ODUs) that range in frequency from 6GHz to 40GHz. Through a close partnership with the leading fixed wireless equipment providers in the industry, MTI engineers high-performance, point-to-point integrated access solutions transporting voice, data and Internet traffic for network operators and end-users throughout the world.
Mobile Base Station Transceivers and Modules
Mobile base stations are an integral element of a mobile telephone network linking mobile telephone users with the public telephone network. A base station must operate at the lowest possible power to avoid interfering with other base stations and mobile telephone users in
the network. The transceiver is one of the key components in the mobile base station, which determines to a large extent the performance and reliability of the mobile base station and require high degree of high power RF design know-how and manufacturing experience.
Having gone through a few generations by now, mobile communication is becoming the primary mode of communication in both developed and developing countries. Typically based on 2.5G technologies (enhanced second-generation mobile technologies), most of these countries now have data services available that will lead to significant changes in the way people exchange information for business and personal use. Driven by the increasing number of worldwide mobile subscribers and higher demands for data capacity, the mobile communication industry is expected continue its growing needs for more mobile stations.
With intensive knowledge in the RF technology, MTI has built up solid capacity in mobile communications-related applications. As a key partner to major system vendor in cellular phone base stations, MTI not only has a variety of related product lines covering various standards on the 800MHz, 900MHz, and 1800MHz bands, but develops base station related components, including power amplifier, low noise amplifier, and tower-mounted integrated receivers. In summary, MTI is building its way to the hallmark “RF inside”.
Financial Review The following sections review the consolidated financial results of Microelectronic Technology, Inc. and its subsidiary for the year 2002, 2001 and 2000.

Selected Financial Data (consolidated)
2002 2001 As restated
in 2002
2000
(Expressed in thousands of New Taiwan dollars, except per share data)
Income Statement Data:
Net operating revenue 3,685,159 4,673,141 4,906,711
Operating cost (3,034,102) (3,821,135) (3,971,731)
Gross profit 651,057 852,006 934,980
Operating expenses (669,653) (712,158) (644,788)
Operating income (loss) (18,596) 139,848 290,192
Non-operating income (expenses) (727,747) 645,917 692,671
Consolidated income (loss) before tax (746,343) 785,765 982,863
Income Tax benefits (expenses) 134,884 (112,038) (132,007)
Net income (loss) (611,459) 673,727 850,856
Earnings Per Share Data:
Net earnings per share (NT$) (1) (1.43) 1.58 2.00
Balance Sheet Data
Total assets 7,908,717 7,213,963 7,953,340
Current liabilities 1,616,596 1,386,530 3,331,491
Long-term liabilities 1,752,172 773,486 146,708
Other liabilities 299,624 401,498 235,918
Stockholders' equity 4,240,325 4,652,449 4,239,223
Other data:
Capital expenditure (2) 162,187 269,754 577,344
Cash flows provided by operating activities 368,295 901,511 436,452
(1) Based on the outstanding number of common shares at the end of each year after retroactively adjusting for
share dividends issued.
(2) Includes expenditures on fixed assets.
CONSOLIDATED RESULTS OF OPERATIONS The following discussion should be read in conjunction with the Company's consolidated financial statements, together with the notes thereto, included elsewhere in this report.

NET OPERATING REVENUE Given the very difficult market environment for communications equipment companies, we ended the year 2002 with a decline in net consolidated revenue from NT$4.67 billion to NT$3.69 billion. The decline of revenue resulted from shrink of market demand in wireless communication industry.
Sales by Sector
61%
Telecommunications
Satellite Communications 39%
2002 Sales by Sector
The company's revenues can be categorized into two major sectors: the satellite communication sector and the telecommunication sector. The satellite communication sector contributed 39% of the company’s total sales, slightly down from 43% in 2001; whereas the telecommunication sector represented 61% of the company’s total sales, up from 57% in 2001.
GROSS PROFIT
0 200 400 600 800
1,000
‘00 ‘01
NT$ million
‘02
Gross Profit Along with the decrease in revenue, the gross consolidated profit was NT$651 million in 2002, which represented 17% of the total consolidated operating revenue and an decrease of 24% from NT$852 million, compared with that reported in 2001. Through the company’s determination for yield improvement and material cost reduction, we look positively to our profit performance in year 2003.
OPERATING INCOME AND LOSS
Operating Expenses vs. R&D Expense as a %of Net Sales
550 600 650 700 750
‘00 ‘01 ‘02
NT$ million
0% 2% 4% 6% 8%
In the face of an uncertain market and the continuing challenges to our top line, our progress is a clear indication of our employees’ resolve and continued dedication to the business and to supporting our customers during this prolonged industry downturn. Managing to improve the production yield and cost control for the past twelve months, MTI had merely below the water

and ended up with a consolidated operating loss of NT$19 million for 2002.
Reviewing the company's overall expenses in 2002, the company’s operating expense has decreased 6% from NT$712 million to NT$670 million, while the R&D expense has increased 13% from NT$228 million to NT$258 million. It is our intention that every penny was and will be saved/prepared for the future opportunities. NON-OPERATING INCOME (LOSS)
-900
-600
-300
-
300
600
900
98 99 00 01 02
Non-Operating Income ( Loss) The long-term investment loss was mainly due to the Chapter 11 of Asia Global Crossing. As for the NT$220 million allowance for account receivable collection, the company has entered into an agreement with Asia Netcom, who had taken over the equity of AGC, to pay back the NT$220 million receivable in installment. The Company writes off NT$ 816 million and NT$ 113 million respectively for telecom industry related long-term investments and inventories. It resulted in a Non-Operating Loss of NT$ 728 million in 2002, a decrease of 213% comparing with that of year 2001.
TAXATION
Benefit from funds used in equipment purchase, R&D, professional personnel training, and creation of internationally recognized brand of products, the company carried a deferred tax asset of NT$52 million as of December 31, 2002. When we reported our financial results for year 2001, the company showed a deferred tax liability balance amounted to NT$83 million. In accordance with article 22 of the R.O.C. Financial Accounting Standards Board regulation (FASB), no actual cash payment for income tax will be expected in year 2002.
NET INCOME AFTER TAX
The company's net income has decreased from NT$674 million in 2001 to a loss of NT$611 million in 2002. The negative result came from the following factors: (1) the decrease in sales due to economic downturn, (2) the increase in R&D expense to capture future opportunities, and (3) the recognition of permanent impairment of long-term investments.
LIQUIDITY AND CAPITAL RESOURCES
Debt to Total Assets vs. Current Ratio
10%
20%
30%
40%
50%
50%
100%
150%
200%
250%
300%
Net consolidated cash provided by operating activities in 2002 was NT$ 368 million, while net consolidated cash provided by operating activities in 2001 and 2000 were NT$902 million and NT$612 million respectively.
Aggregate cash used for investing activities during each of those periods showed an outflow of NT$1,190 million, NT$68 million, and NT$1,087 million respectively in 2002, 2001, and 2000.
Among NT$1,190 investing activities for 2002, NT$832 million was short-term investment for bond fund. Dealing conservatively with future uncertainty, MTI has cut its capital expenditures from NT$230 million to NT$148 million, representing a decrease of 35%. As over capacity has built up over the years out the worldwide telecom upswing and meltdown; MTI has learned it first-hand with our partners and will take every step cautiously down the road.
Total assets were amounted to NT$7,909 million as of December 31, 2002. On the other hand, total liabilities for the same period of time were NT$3,668 million, or 46% of total assets. Comparing with that in 2001, the company’s total liabilities have increased 43% from NT$2,562 million to NT$3,668 million. It was because the company successfully issued 5-year( in the amount of NT$1.2 billion) convertible bond in July 2002. It is proved that the company has maintained a healthy financial structure while encountering the most severe recession we have ever had.
Finally but not the least, a look at Shareholders’ equity shows a 54%, 64%, and 53% of total assets in 2002, 2001, and 2000 respectively. MTI believes that a solid balance sheet will provide good support and flexibility for future business expansion when the wireless communication industry recovers.

MICROELECTRONICS TECHNOLOGY, INC. AND CONSOLIDATED SUBSIDIARY CONSOLIDATED BALANCE SHEETS DECEMBER 31, 2000, 2001 AND 2002
(EXPRESSED IN THOUSANDS OF NEW TAIWAN DOLLARS)
2000 2001 2002 2000 2001 2002 ASSETS LIABILITIES AND SHAREHOLDERS' EQUITY Current Assets Current Liabilities
Cash and cash equivalents (Note 5) $ 924,951 $ 1,599,197 $ 1,926,123 Short-term loans (Note 12) $ 1,084,446 $ 318,402 $ 292,574 Short-term investments (Note 6) - 508 841,183 Accounts payable (Note 4) 1,081,892 556,320 693,211 Notes and accounts receivable - net Accrued expenses and other payables (Note 4) 667,432 360,006 324,377 (Notes 4 and 7) 1,241,072 681,566 723,576 Receipts in advance 387,359 22,476 7,007 Inventories - net (Note 8) 1,663,392 1,236,220 1,008,098 Current portion of long-term liabilities (Notes 10 and 13) 53,292 73,222 233,012 Other receivables and prepayments Other current liabilities 57,070 56,104 66,415 (Notes 4 and 18) 91,292 151,713 280,959 3,331,491 1,386,530 1,616,596 Other current assets (Notes 4 and 18) 249,286 329,295 134,835 Long-term Liabilities 4,169,993 3,998,499 4,914,774 Bonds payable (Note 14) - - 1,215,675 Long-term loans (Notes 10 and 13) 146,708 773,486 536,497 Long-term Investments (Notes 4 and 9) 2,278,857 1,700,745 1,523,734 146,708 773,486 1,752,172 Other Liabilities Fixed Assets - Net (Notes 4 and 10) 1,307,454 1,376,978 1,383,534 Accrued pension expense (Note 20) 135,034 170,511 207,513 Other liabilities (Note 4 and 18) 100,884 230,987 92,111 Other Assets (Notes 11 and 18) 197,036 137,741 86,675 235,918 401,498 299,624 Total liabilities 3,714,117 2,561,514 3,668,392
Shareholders' Equity
Common stock (Notes 15 and 21) 3,128,631 3,830,934 4,261,626 Capital reserve (Note 16) 3,043 13,328 12,024 Retained earnings Legal reserve (Note 17) 70,460 155,545 222,876 Special reserve - - 129,988 Undistributed earnings / (deficit) (Notes 17 and 21) 904,367 782,631 ( 461,182 ) Unrealized loss on long-term investment - ( 393,640 ) ( 172,955 ) Cumulative translation adjustments 132,722 263,651 247,948 Total shareholders' equity 4,239,223 4,652,449 4,240,325 Commitments and Contingent Liabilities (Notes 4 and 22)
TOTAL ASSETS $ 7,953,340 $ 7,213,963 $ 7,908,717 TOTAL LIABILITIES AND SHAREHOLDERS' EQUITY $ 7,953,340 $ 7,213,963 $ 7,908,717
The accompanying notes are an integral part of these financial statements. See report of independent accountants dated February 12, 2003.

MICROELECTRONICS TECHNOLOGY, INC. AND CONSOLIDATED SUBSIDIARY
CONSOLIDATED STATEMENTS OF INCOME
FOR THE YEARS ENDED DECEMBER 31, 2000, 2001 AND 2002
(EXPRESSED IN THOUSANDS OF NEW TAIWAN DOLLARS, EXCEPT EARNINGS PER SHARE WHICH IS EXPRESSED IN NEW TAIWAN DOLLARS)
2000 2001 2002 Operating revenue $ 4,931,309 $ 4,709,392 $ 3,714,966 Sales returns and allowances ( 24,598 ) ( 36,251 ) ( 29,807 ) Net operating revenue (Note 4) 4,906,711 4,673,141 3,685,159 Operating costs (Note 4) ( 3,971,731 ) ( 3,821,135 ) ( 3,034,102 ) Gross profit 934,980 852,006 651,057 Operating expenses (Note 4) Research and development expenses ( 227,427 ) ( 227,554 ) ( 258,412 ) Marketing expenses ( 260,331 ) ( 294,929 ) ( 215,535 ) Administrative expenses ( 157,030 ) ( 189,675 ) ( 195,706 ) ( 644,788 ) ( 712,158 ) ( 669,653 ) Operating income / (loss) 290,192 139,848 ( 18,596 ) Non-operating income (Note 4 and 9) Interest income 75,818 56,799 31,327 Investment income 710,142 - - Gains on disposal of investments - 298,992 306,665 Other income 74,272 546,321 201,377 860,232 902,112 539,369 Non-operating expenses (Note 4 and 9) Interest expense ( 79,269 ) ( 105,833 ) ( 69,167 ) Investment loss - ( 98,294 ) ( 816,186 ) Loss on market value decline and
obsolescence of inventories ( 14,347 ) ( 25,931 ) ( 113,355 ) Other expenses ( 73,945 ) ( 26,137 ) ( 268,408 ) ( 167,561 ) ( 256,195 ) ( 1,267,116 ) Income / (loss) before income tax 982,863 785,765 ( 746,343 ) Income tax (expense) / benefit (Note 18) ( 132,007 ) ( 112,038 ) 134,884 Net income / (loss) $ 850,856 $ 673,727 ( $ 611,459 ) Earnings per share (Note 19) $ 2.00 $ 1.58 ( $ 1.43 )
The accompanying notes are an integral part of these financial statements. See report of independent accountants dated February 12, 2003.

MICROELECTRONICS TECHNOLOGY, INC. CONSOLIDATED STATEMENTS OF CHANGES IN SHAREHOLDERS' EQUITY
FOR THE YEARS ENDED DECEMBER 31, 2000, 2001 AND 2002 (EXPRESSED IN THOUSANDS OF NEW TAIWAN DOLLARS, EXCEPT NUMBER OF COMMON SHARES WHICH IS EXPRESSED IN THOUSANDS OF SHARES)
Capital Reserve Retained Earnings Common Shares Gain on disposal Donated
Long-term
Undistributed Unrealized loss
Cumulative Special Earnings / on long-term translation Number Amount of fixed assets assets investment Legal reserve reserve (Deficit) investments adjustments Total 2000 Balance at January 1, 2000 255,435 $ 2,554,347 $ - $ - $ - $ - $ - $ 704,595 $ - $ 30,842 $ 3,289,784 Appropriation for legal reserve - - - - - 70,460 - ( 70,460) - - - Unappropriated earnings used for capital increase 51,087 510,870 - - - - - ( 510,870) - - - Employees’ bonus capitalized 6,341 63,414 - - - - - ( 63,414) - - - Directors’ and supervisors’ remuneration - - - - - - - ( 6,340) - - ( 6,340) Net income for 2000 - - - - - - - 850,856 - - 850,856 Change in capital reserve due to change in ownership of
long-term investments - - - - 3,043 -
- - - - 3,043
Translation adjustments - - - - - - - - - 101,880 101,880 Balance at December 31, 2000 312,863 3,128,631 - - 3,043 70,460 - 904,367 – 132,722 4,239,223 2001 Appropriation for legal reserve - - - - - 85,085 - ( 85,085 ) - - - Unappropriated earnings used for capital increase 62,572 625,726 - - - - - ( 625,726 ) - - - Employees’ bonus capitalized 7,658 76,577 - - - - - ( 76,577 ) - - - Directors’ and supervisors’ remuneration - - - - - - - ( 7,658 ) - - ( 7,658 ) Net income for 2001 - - - - - - 673,727 - - 673,727 Transfer of gain on disposal of fixed assets to capital
reserve - - 417 - - -
( 417 ) - - -
Change in capital reserve due to change in ownership of long-term investments - - -
- 9,868 -
- - - 9,868
Unrealized loss on long-term investments of investee companies - - -
- - -
- - ( 393,640 ) - ( 393,640 )
Translation adjustments - - - - - - - - - 130,929 130,929 Balance at December 31, 2001 383,093 3,830,934 417 - 12,911 155,545 - 782,631 ( 393,640 ) 263,651 4,652,449 2002 Appropriation for legal reserve - - - - - 67,331 - ( 67,331 ) - - - Appropriation for special reserve - - - - - - 129,988 ( 129,988 ) - - - Unappropriated earnings used for capital increase 38,309 383,093 - - - - - ( 383,093 ) - - - Employees’ bonus capitalized 4,760 47,599 - - - - - ( 47,599 ) - - - Donated assets received - - - 1,360 - - 1,360 Directors’ and supervisors’ remuneration - - - - - - - ( 4,760 ) - - ( 4,760 ) Net loss for 2002 - - - - - - - ( 611,459 ) - - ( 611,459 ) Transfer of gain on disposal of fixed assets to capital
reserve, in 2001, transferred to undistributed earnings - - ( 417 ) - - -
- 417 - - -
Change in capital reserve due to change in ownership of long-term investments - - -
- ( 2,247 ) -
- - - - ( 2,247 )
Unrealized loss on long-term investments of investee companies - - -
- - -
- - 220,685 - 220,685
Translation adjustments - - - - - - - - - ( 15,703 ) ( 15,703 ) Balance at December 31, 2002 426,162 $ 4,261,626 $ - $ 1,360 $ 10,664 $ 222,876 $ 129,988 ( $ 461,182 ) ( $ 172,955 ) $ 247,948 $ 4,240,325
The accompanying notes are an integral part of these financial statements.

See report of independent accountants dated February 12, 2003.
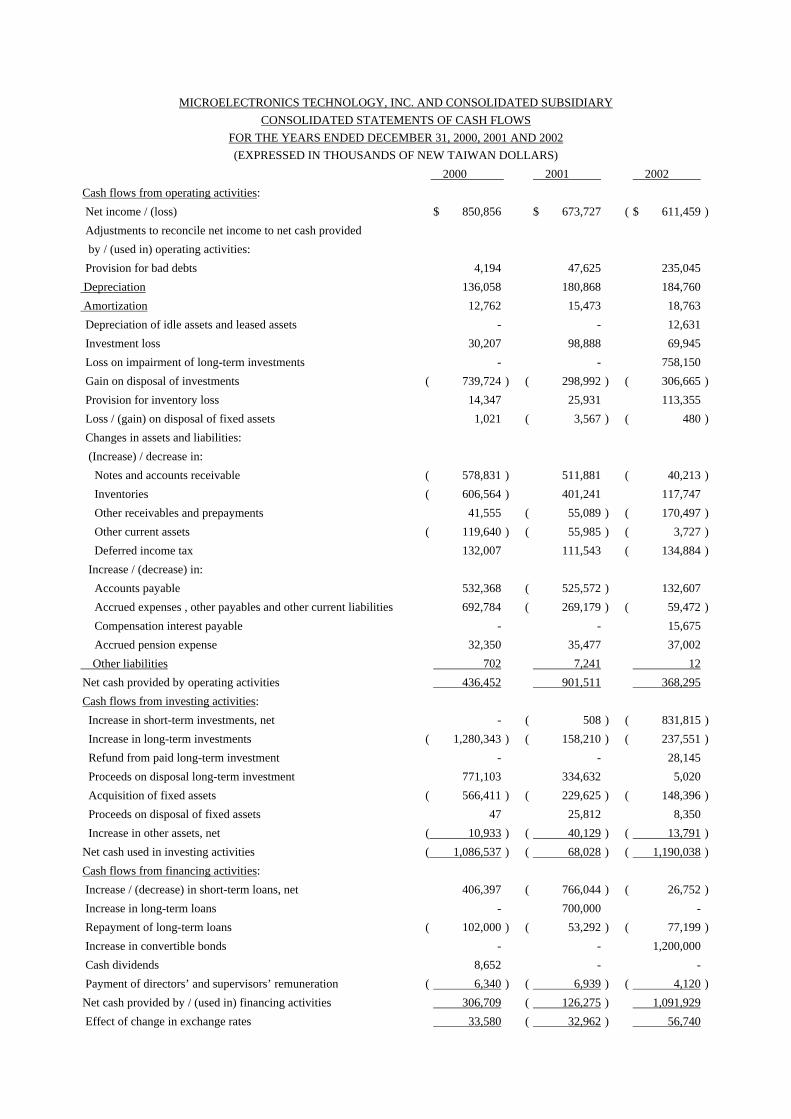
MICROELECTRONICS TECHNOLOGY, INC. AND CONSOLIDATED SUBSIDIARY CONSOLIDATED STATEMENTS OF CASH FLOWS
FOR THE YEARS ENDED DECEMBER 31, 2000, 2001 AND 2002 (EXPRESSED IN THOUSANDS OF NEW TAIWAN DOLLARS)
2000 2001 2002 Cash flows from operating activities: Net income / (loss) $ 850,856 $ 673,727 ( $ 611,459 ) Adjustments to reconcile net income to net cash provided by / (used in) operating activities: Provision for bad debts 4,194 47,625 235,045 Depreciation 136,058 180,868 184,760 Amortization 12,762 15,473 18,763 Depreciation of idle assets and leased assets - - 12,631 Investment loss 30,207 98,888 69,945 Loss on impairment of long-term investments - - 758,150 Gain on disposal of investments ( 739,724 ) ( 298,992 ) ( 306,665 ) Provision for inventory loss 14,347 25,931 113,355 Loss / (gain) on disposal of fixed assets 1,021 ( 3,567 ) ( 480 ) Changes in assets and liabilities: (Increase) / decrease in: Notes and accounts receivable ( 578,831 ) 511,881 ( 40,213 ) Inventories ( 606,564 ) 401,241 117,747 Other receivables and prepayments 41,555 ( 55,089 ) ( 170,497 ) Other current assets ( 119,640 ) ( 55,985 ) ( 3,727 ) Deferred income tax 132,007 111,543 ( 134,884 ) Increase / (decrease) in: Accounts payable 532,368 ( 525,572 ) 132,607 Accrued expenses , other payables and other current liabilities 692,784 ( 269,179 ) ( 59,472 ) Compensation interest payable - - 15,675 Accrued pension expense 32,350 35,477 37,002 Other liabilities 702 7,241 12 Net cash provided by operating activities 436,452 901,511 368,295 Cash flows from investing activities: Increase in short-term investments, net - ( 508 ) ( 831,815 ) Increase in long-term investments ( 1,280,343 ) ( 158,210 ) ( 237,551 ) Refund from paid long-term investment - - 28,145 Proceeds on disposal long-term investment 771,103 334,632 5,020 Acquisition of fixed assets ( 566,411 ) ( 229,625 ) ( 148,396 ) Proceeds on disposal of fixed assets 47 25,812 8,350 Increase in other assets, net ( 10,933 ) ( 40,129 ) ( 13,791 )Net cash used in investing activities ( 1,086,537 ) ( 68,028 ) ( 1,190,038 )Cash flows from financing activities: Increase / (decrease) in short-term loans, net 406,397 ( 766,044 ) ( 26,752 ) Increase in long-term loans - 700,000 - Repayment of long-term loans ( 102,000 ) ( 53,292 ) ( 77,199 ) Increase in convertible bonds - - 1,200,000 Cash dividends 8,652 - - Payment of directors’ and supervisors’ remuneration ( 6,340 ) ( 6,939 ) ( 4,120 )Net cash provided by / (used in) financing activities 306,709 ( 126,275 ) 1,091,929 Effect of change in exchange rates 33,580 ( 32,962 ) 56,740
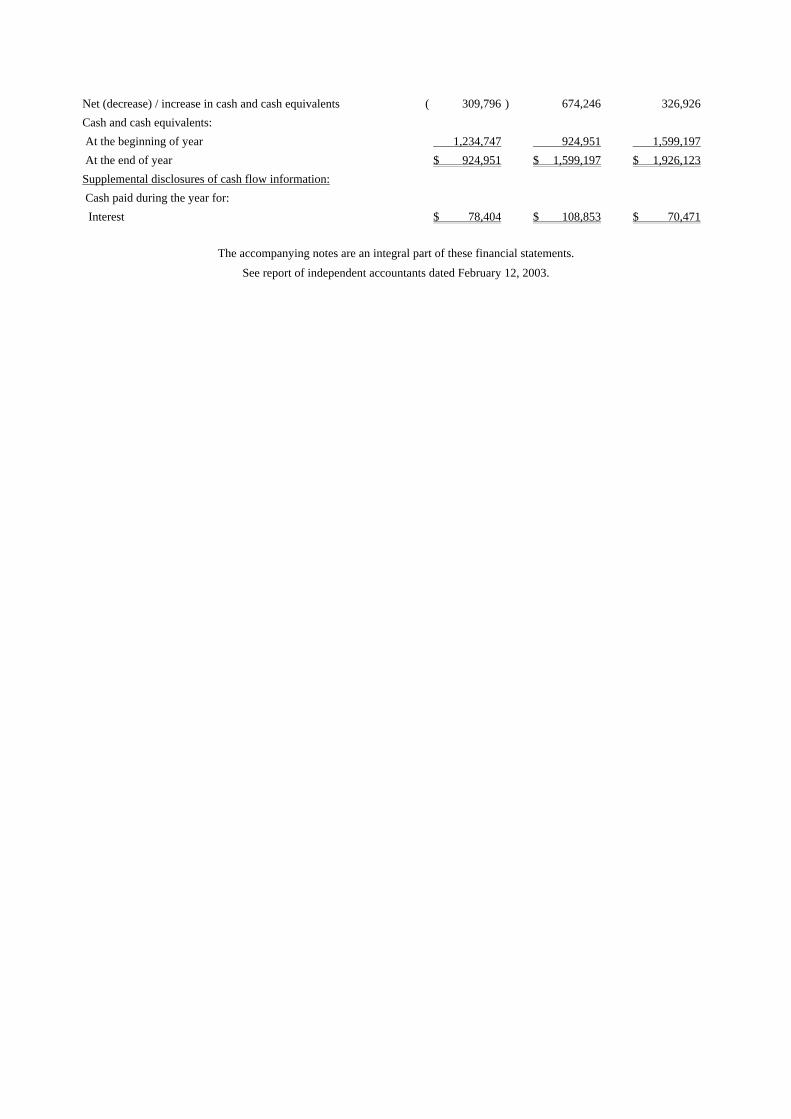
Net (decrease) / increase in cash and cash equivalents ( 309,796 ) 674,246 326,926 Cash and cash equivalents: At the beginning of year 1,234,747 924,951 1,599,197 At the end of year $ 924,951 $ 1,599,197 $ 1,926,123 Supplemental disclosures of cash flow information: Cash paid during the year for: Interest $ 78,404 $ 108,853 $ 70,471
The accompanying notes are an integral part of these financial statements.
See report of independent accountants dated February 12, 2003.

MICROELECTRONICS TECHNOLOGY, INC. AND CONSOLIDATED SUBSIDIARY NOTES TO CONSOLIDATED FINANCIAL STATEMENTS
DECEMBER 31, 2000, 2001 AND 2002 (EXPRESSED IN THOUSANDS OF NEW TAIWAN DOLLARS,
EXCEPT AS OTHERWISE INDICATED) 1. HISTORY AND ORGANIZATION
The Company was approved under the "Statute for the Establishment and Administration of Science-Based Industrial Park" in September, 1982 and was incorporated on March 31, 1983 under the Company Law of the Republic of China (R.O.C.). The Company commenced its operations on April 29, 1983. The main activities of the Company are the design and manufacture of wireless communication products and standard products, including microwave products, digital microwave radio transceivers and systems, VSAT, TVRO/DBS products and microwave components. The Company also manufactures customer designed products suited to the specific requirements of its customers' various microwave systems. The principal foreign shareholder of the Company is Agilent Technologies Inc., which was incorporated in the U.S.A. Sasson International Holdings Inc. (Sasson) is the consolidated subsidiary which was incorporated in the British Virgin Islands in 1993. The Company owns 100% of Sasson. Jupiter Network Corp. and Zeus Communications, Inc. are the consolidated subsidiaries which were incorporated in the British Virgin Islands in 2001. Sasson owns 100% both of Jupiter Network Corp. and Zeus Communication Inc. Jupiter Technology (Wuxi) Inc. is a 100% owned subsidiary of Jupiter Network Corp. and Zeus Communications, Inc., with operating revenue of more than 10 percent of the Company’s non-consolidated operating revenue as of and for the year ended December 31, 2002. Accordingly, Jupiter Technology (Wuxi) Inc. was included in the consolidated entities for year 2002, and thus 2001 and 2000 consolidated financial statements were restated for the change in the consolidated entities.
2. SUMMARY OF SIGNIFICANT ACCOUNTING POLICIES 1) Principles of consolidation
In accordance with the R.O.C. generally accepted accounting principles and R.O.C. Securities and Exchange Commission’s regulations, the Company prepares annual financial statements on a non-consolidated and consolidated basis. All transactions among the Company and the consolidated subsidiary are eliminated in the consolidated financial statements. The consolidated financial statements include all majority owned subsidiaries, except for subsidiaries with total assets and operating revenue of less than 10 percent of the Company’s non-consolidated total assets and operating revenues. Irrespective of the above test, if the combined total assets or operating revenues of all such non-consolidated subsidiaries exceed 30 percent of the Company’s non-consolidated total assets or operating revenue, then each individual subsidiary with total assets or operating revenues greater than 3 percent of the Company’s respective non-consolidated total assets or operating revenue shall be consolidated.
2) Translation of foreign currency transactions The accounts of the Company are maintained in New Taiwan dollars. Transactions

arising in foreign currencies are translated into New Taiwan dollars at the exchange rates prevailing at the dates of the transactions. Receivables and other monetary assets and liabilities denominated in foreign currencies are translated into New Taiwan dollars at the exchange rates prevailing at the balance sheet date. Gains or losses from foreign currency translations are included in the current year's net income. Forward exchange contracts entered into for hedging purposes are recorded using the spot rate on the contract date. Discounts or premiums on forward contracts are amortized over the period of the contract. Gains or losses on the forward contracts are determined by the difference between the spot rate at the balance sheet date and the spot rate at the date of inception of the contract. Exchange gains or losses are included in the current year’s net income. Premiums on foreign currency options contract are translated into New Taiwan dollars using the spot rate at the date of inception of the contract and are amortized over the life of the contract. Unrealized gains and losses for known foreign currency transactions are recognized in the current year’s net income but unrealized gains and losses for foreign currency commitments are deferred until the underlying transaction is recorded, unless deferral would result in a loss at a later period. Translation of financial statements of foreign subsidiaries into New Taiwan dollars Assets and liabilities of foreign subsidiaries are translated into New Taiwan dollars at the exchange rates prevailing at the balance sheet date; equity accounts are translated at historical rates, except for beginning retained earnings which are transferred from prior year's ending retained earnings, and income and expense accounts are translated into New Taiwan dollars at the average rates of exchange prevailing during the period. Translation adjustments are taken directly to a separate component of shareholders' equity, “cumulative translation adjustment.”
3) Income tax a. Income tax expense is provided based on accounting income after adjusting for
permanent differences. The provision for income tax includes deferred income tax resulting from items reported in different periods for tax and financial reporting purposes. Deferred tax consequences of loss carry forwards and investment tax credits are recorded as deferred tax assets. A valuation allowance is provided on deferred income tax assets to the extent that it is more likely than not that the tax benefits will not be realized. Over or under provision of prior years’ income tax liabilities is included in the current year’s income tax expense.
b. According to R.O.C. FAS NO.12, “Accounting for income tax credits”, the Company’s income tax credits generated from the acquisition of automation equipment or technology, expenses for research and development and loss carry forwards are recognized in the period when the tax credits arise.
c. An additional 10% corporate income tax on earnings derived on or after January 1, 1998, which are not distributed in the following year, is included as income tax expense in the year when the stockholders approved the resolution to retain the earnings.
4) Cash equivalents Cash equivalents are highly liquid and short-term investments, with a maturity of three months or less at the time of purchase, that are readily convertible to known amounts of cash and with maturity dates that do not present significant risk of changes in value due to changes in interest rates.
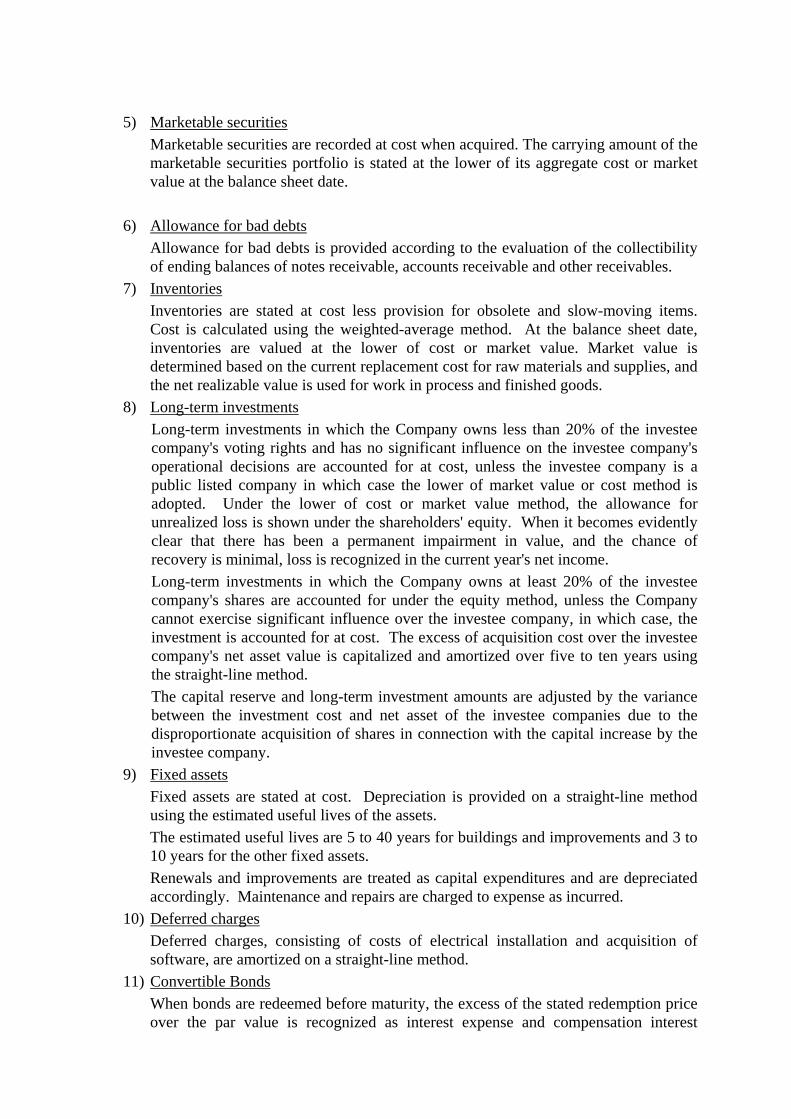
5) Marketable securities Marketable securities are recorded at cost when acquired. The carrying amount of the marketable securities portfolio is stated at the lower of its aggregate cost or market value at the balance sheet date.
6) Allowance for bad debts Allowance for bad debts is provided according to the evaluation of the collectibility of ending balances of notes receivable, accounts receivable and other receivables.
7) Inventories Inventories are stated at cost less provision for obsolete and slow-moving items. Cost is calculated using the weighted-average method. At the balance sheet date, inventories are valued at the lower of cost or market value. Market value is determined based on the current replacement cost for raw materials and supplies, and the net realizable value is used for work in process and finished goods.
8) Long-term investments Long-term investments in which the Company owns less than 20% of the investee company's voting rights and has no significant influence on the investee company's operational decisions are accounted for at cost, unless the investee company is a public listed company in which case the lower of market value or cost method is adopted. Under the lower of cost or market value method, the allowance for unrealized loss is shown under the shareholders' equity. When it becomes evidently clear that there has been a permanent impairment in value, and the chance of recovery is minimal, loss is recognized in the current year's net income. Long-term investments in which the Company owns at least 20% of the investee company's shares are accounted for under the equity method, unless the Company cannot exercise significant influence over the investee company, in which case, the investment is accounted for at cost. The excess of acquisition cost over the investee company's net asset value is capitalized and amortized over five to ten years using the straight-line method. The capital reserve and long-term investment amounts are adjusted by the variance between the investment cost and net asset of the investee companies due to the disproportionate acquisition of shares in connection with the capital increase by the investee company.
9) Fixed assets Fixed assets are stated at cost. Depreciation is provided on a straight-line method using the estimated useful lives of the assets. The estimated useful lives are 5 to 40 years for buildings and improvements and 3 to 10 years for the other fixed assets. Renewals and improvements are treated as capital expenditures and are depreciated accordingly. Maintenance and repairs are charged to expense as incurred.
10) Deferred charges Deferred charges, consisting of costs of electrical installation and acquisition of software, are amortized on a straight-line method.
11) Convertible Bonds When bonds are redeemed before maturity, the excess of the stated redemption price over the par value is recognized as interest expense and compensation interest

payable using the effective interest method during the period from the issue date to the last day of redemption period. The cost method is adopted when bondholders exercise their conversion rights, the book value of bonds is credited to common stock at an amount equal to the par value of the common stock and the excess is credited to capital reserve; no gain or loss is recognized on bond conversion. For convertible bonds with redemption options, the right of redemption becomes invalid if the bondholders fail to exercise their redemption right during the redemption period. The balance of compensation interest payable is amortized over the period from the date following the redemption period to the maturity date using the effective interest method.
12) Reserve for product warranty Under the warranty provisions of its sale contracts, the Company is obligated to correct any deficiencies in its products that occur under normal operation within a certain period after the date of sale. The Company provides a reserve for product warranty based on a certain percentage of the sales value of each product line, using historical experience.
13) Retirement plan The Company has a defined benefit retirement plan covering all its regular employees. This plan is separately funded. Net periodic pension cost which includes components such as service cost, interest cost, expected return on plan assets and amortization of net obligation at transition, is computed based on an actuarial valuation.
14) Revenue and expenses Revenue is recognized when goods are shipped or installed. The related costs and expenses are recognized as incurred.
15) Use of estimates The preparation of financial statements in conformity with generally accepted accounting principles requires management to make estimates and assumptions that affect the amounts reported in the financial statements and accompanying notes. Actual results could differ from those assumptions and estimates.
3. EFFECT OF CHANGE IN ACCOUNTING PRINCIPLES AND ESTIMATES None.
4. RELATED PARTY TRANSACTIONS 1) Names and relationship of related parties
Names Relationship with the Company Agilent Technologies Inc. Major foreign shareholder Hewlett-Packard Company The parent company of Agilent Technologies Inc. Global PCS Inc. 80.19% owned subsidiary Millennium Telecom Inc. 99.99% owned subsidiary Welltop Technology Co., Ltd. Investment accounted for by equity method of the
Company’s subsidiary Optical Microwave Network Inc. Investment accounted for by equity method of the
Company’s subsidiary Wuxi Zeus Technology Inc. Investment accounted for by equity method of the
Company’s subsidiary

2) Transactions with related parties 2000 2001 2002 a) Purchases of fixed assets
﹒Agilent Technologies Inc. $ 396,705 $ 65,552 $ 7,710 ﹒Hewlett- Packard Company 16,428 - - ﹒Optical Microwave Networks Inc. 1,661 - -
$ 414,794 $ 65,552 $ 7,710
The purchases are at market prices and payment terms are similar as to purchases from third parties’ terms.
b) Disposal of fixed assets There was no disposal in 2000
For the year ended December 31, 2001 For the year ended December 31, 2002 Item Amount Gain Amount Gain Global PCS Inc. Machinery $ 14,064 $ - $ - $ - Wuxi Zeus
Technology Inc. Machinery
-
-
3,122
625
$ 14,064 $ - $ 3,122 $ 625
c) Disposal of long-term investments
There were no disposals in 2000 and 2002 For the year ended December 31, 2001 Item Amount Gain / (Loss) .Welltop Technology Co., Ltd. Stock of Optical
Microwave Networks Inc.
$ 25,780 $ -
d) Purchases of materials 2000 2001 2002
﹒Optical Microwave Networks Inc. $ 443,997 $ 56,312 $ 20,746 .Agilent Technologies Inc. 131,932 61,621 1,246 .Hewlett-Packard Company 26,357 - - ﹒Others - 310 -
$ 602,286 $ 118,243 $ 21,992
The purchases are at market prices and payment terms are similar as to purchased from third parties’ terms.
e) Sales 2000 2001 2002
﹒Optical Microwave Networks Inc. $ 39,719 $ 24,814 $ 762 ﹒Global PCS Inc. - 35,552 13,222 ﹒Agilent Technologies Inc. - 11,270 1,599 ﹒Wuxi Zeus Technology Inc. - - 3,716 ﹒Others 8,882 - -
$ 48,601 $ 71,636 $ 19,299
Sales terms to related parties are under regular terms, with collection terms at 1-3 months following the delivery.
2000 2001 2002
f) Service and development expenses
$ 67,488
$ 81,881
$ 51,050
g) Rental and other expenses $ 16,473 $ 39,045 $ 2,774 h) Rental income and other income $ 4,022 $ 6,711 $ 12,377 December 31,
2000 2001 2002 i) Accounts receivable
﹒Agilent Technologies Inc. $ 4,313 $ - $ 344 ﹒Global PCS Inc. - 33,251 9,629 ﹒Wuxi Zeus Technology Inc. - - 354 ﹒Others - 1 -
$ 4,313 $ 33,252 $ 10,327 j) Accounts payable
﹒Global PCS Inc. $ - $ - $ 4,280 ﹒Agilent Technologies Inc. 41,865 105 92 ﹒Optical Microwave Networks Inc. 25,656 139 1,011 ﹒Hewlett-Packard Company 47 24 - ﹒Others - 63 -
$ 67,568 $ 331 $ 5,383 k) Other receivables
﹒Millennium Telecom Inc. $ - $ - $ 194,948 ﹒Global PCS Inc. 577 16,260 3,754 ﹒Wuxi Zeus Technology Inc. - - 231
$ 577 $ 16,260 $ 198,933
l) Accrued expenses $ 19,912 $ 2,547 $ 348 m) Prepaid expenses and
prepayments $ 7,717
$ -
$ 8,314
n) Guarantee deposits received $ 1,678 $ 1,678 $ 1,678 0) As of December 31, 2000, 2001 and 2002, the Company acted as guarantor for the
following subsidiaries: Subsidiary name
Line of credit
Outstanding balance of credit line
December 31, 2000 Optical Microwave Networks Inc. $ 54,582 $ 34,734 December 31, 2001

Optical Microwave Networks Inc. $ 57,668 $ 48,930 December 31, 2002 Optical Microwave Networks Inc. $ 57,338 $ 33,192
p) As of December 31, 2000, 2001 and 2002, Sasson as guarantor of the following subsidiaries provided time-deposit as collateral of the subsidiaries’ lines of credits:
Subsidiary name
Line of credit
Outstanding balance of credit line
December 31, 2000 Millennium Telecom Inc. $ 66,160 $ 13,175 December 31, 2001 Millennium Telecom, Inc. $ 190,372 $ 190,372 There was no such transaction in 2002.
5. CASH AND CASH EQUIVALENTS December 31, 2000 2001 2002 Cash on hand $ 2,531 $ 7,021 $ 4,725 Cash in bank 169,921 711,320 254,256 Time deposits 690,478 399,200 962,047 Cash equivalents-commercial bonds and
STMM 62,021
481,656
705,095
$ 924,951 $ 1,599,197 $ 1,926,123
6. SHORT-TERM INVESTMENTS December 31, 2000 2001 2002 Beneficiary Certificates $ - $ 508 $ 841,183
7. NOTES AND ACCOUNTS RECEIVABLE - NET December 31, 2000 2001 2002 Notes receivable $ 3,132 $ 15,142 $ 10,600 Accounts receivable 1,321,748 768,918 837,935 Accounts receivable – related parties 4,313 33,252 10,327
1,329,193 817,312 858,862 Allowance for bad debts ( 88,121 ) ( 135,746 ) ( 135,286 ) $ 1,241,072 $ 681,566 $ 723,576

8. INVENTORIES December 31, 2000 2001 2002 Finished goods $ 338,084 $ 212,172 $ 175,322 Work in process 360,147 258,473 376,480 Raw materials 1,091,978 951,289 723,283 Inventories in transit 24,639 15,878 18,971 1,814,848 1,437,812 1,294,056 Provision for inventory loss ( 191,499) ( 204,261 ) ( 285,958) 1,623,349 1,233,551 1,008,098 Long-term projects 529,732 529,732 - Advance billings on long-term projects ( 489,689 ) ( 527,063 ) - 40,043 2,669 - $ 1,663,392 $ 1,236,220 $ 1,008,098
9. LONG-TERM INVESTMENTS December 31,
Company name
2002 ownership percentage (%) 2000 2001 2002
Equity method: Global PCS Inc. 80.19 $ 23,509 $ 71,289 $ 64,560 Millennium Telecom Inc. 99.99 184,136 174,493 165,865 AsiaCast Network Systems, Inc. 37.04 38,382 34,244 16,256 Optical Microwave Networks Inc. 100.00 31,792 - - EURO-MTI S.A.R.L. 100.00 1,571 1,660 1,650 Welltop Technology Co.,Ltd. 100.00 - ( 30,280 ) ( 30,212 )Wuxi Zeus Technology Inc. 100.00 - - 56,364
279,390 251,406 274,483 Cost method:
Taiwan Aerospace Corp. 0.48 25,000 25,000 25,000 Easy Data Communication Co., Ltd. 8.85 20,000 23,000 2,867 KG Telecommunications Co., Ltd. 1.12 241,073 247,073 247,073 Enovation Group Inc. 7.61 46,785 46,785 6,362 Kopin Taiwan Corporation 3.00 - 42,300 42,300 Global Crossing Ltd. - 21,423 11,572 - Telecommunication Development Corp. 7.32 3,308 3,495 3,475 InterWAVE Communications International Ltd. 5.15 146,706 155,000 154,112 Netro Corporation 2.00 60,323 63,733 63,369 Mobile Telesystems, Inc. 9.00 19,021 20,096 19,981 Scientific Technology Inc. 11.00 115,780 122,325 121,625 Taicom Capital Ltd. 14.95 330,800 349,500 347,500 Kestrel Solution, Inc. - 33,080 34,950 - @Network Inc. 1.94 33,080 34,950 34,750 NAVII - LP 5.16 49,620 78,638 112,938 NAVII - GP 5.00 496 786 1,164 Digital United Holding Limited 0.34 66,392 70,145 69,743 Intelligent Epitaxy Technology, Inc. 1.86 33,080 34,950 34,750 Blue Wireless, Inc. 4.40 33,080 34,950 34,750 Bayspec, Inc. 1.00 16,540 17,475 17,375 Asia Global Crossing Ltd. 0.50 661,580 698,979 - Vaultus ,Inc. 1.00 - 34,950 34,750

December 31,
Company name
2002 ownership percentage (%) 2000 2001 2002
Greast communication Technology Co., Ltd. 19.29 - - 48,322 1,957,167 2,150,652 1,422,206 Prepaid long-term investment:
Kopin Taiwan Corporation 42,300 - - 2,278,857 2,402,058 1,696,689 Allowance for long-term investments - ( 701,313 ) ( 172,955 ) $ 2,278,857 $ 1,700,745 $ 1,523,734
For the years ended December 31, 2000, 2001 and 2002,the investment loss amounting to $24,891, $24,507 and $26,616, respectively, and the related long-term investment balances of $70,174, $208,737 and $182,121 as of December 31, 2000, 2001 and 2002, respectively, were recognized based on the investee companies’ financial statements audited by other auditors. All shares of Kestrel Solution Inc., @Network Inc., Intelligent Epitaxy Technology Inc., Blue Wireless Inc., Bayspec Inc., and part of the shares of Taicom Capital Ltd. are preferred stocks. In 2002, the Company recognized the losses on impairment of long-term investment amounting to $12,278 and $20,133, respectively, according with the capital reduction of Enovation Group Inc. and Easy Data Communication Co., Ltd. Global PCS Inc., Millennium Telecom Inc., EURO-MTI S.A.R.L , Welltop Technology Co., Ltd., and Wuxi Zeus Technology Inc. are the subsidiaries with totals assets and operating revenue of less than 10 percent of the Company’s non-consolidated total assets and operating revenue, respectively, and, therefore, did not meet the criteria for consolidation.

10 FIXED ASSETS December 31 2000 2001 2002 Buildings $ 594,131 $ 725,780 $ 795,959 Machinery 1,387,500 1,408,129 1,493,222 Transportation equipment 2,573 2,573 1,292 Furniture and fixtures 66,585 77,379 52,705 Leasehold improvements 2,520 2,825 2,825 2,053,309 2,216,686 2,346,003 Accumulated depreciation ( 767,674 ) ( 864,421 ) ( 972,876 ) 1,285,635 1,352,265 1,373,127 Prepayments for equipment and construction in
process 21,819
24,713
10,407
Book value $ 1,307,454 $ 1,376,978 $ 1,383,534 As of December 31, 2000, 2001 and 2002, fixed assets with book values of $411,463, $761,009, and $669,604, respectively, were pledged as security for long-term loans.
11. OTHER ASSETS December 31 2000 2001 2002 Refundable deposits $ 3,015 $ 3,189 $ 3,179 Deferred charges 10,495 35,539 45,354 Leased assets 183,526 99,013 38,142 $ 197,036 $ 137,741 $ 86,675
12. SHORT-TERM LOANS December 31 Type of loan 2000 2001 2002 Material L/C loans $ 764,077 $ 251,505 $ 292,574 Pre-export loans 7,608 14,949 - Bank acceptance and commercial paper (net of $ $7,239 and $52 discount for 2000 and 2001, respectively )
312,761
51,948
-
$ 1,084,446 $ 318,402 $ 292,574 Interest rates per annum 5.11%~7.82% 2.52%∼4.54% 1.825%∼2.46%
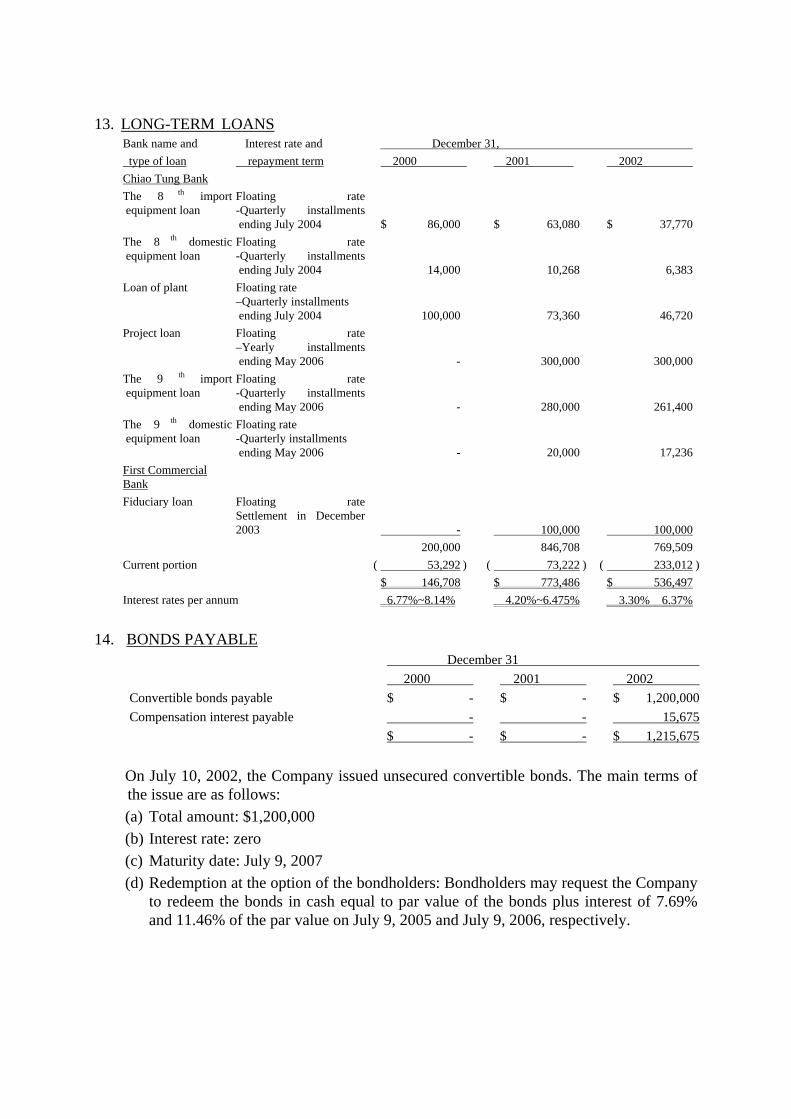
13. LONG-TERM LOANS Bank name and Interest rate and December 31, type of loan repayment term 2000 2001 2002 Chiao Tung Bank The 8 th import equipment loan
Floating rate-Quarterly installments ending July 2004
$ 86,000
$ 63,080
$ 37,770
The 8 th domestic equipment loan
Floating rate-Quarterly installments ending July 2004
14,000
10,268
6,383
Loan of plant Floating rate –Quarterly installments ending July 2004
100,000
73,360
46,720
Project loan Floating rate–Yearly installments ending May 2006
-
300,000
300,000
The 9 th import equipment loan
Floating rate-Quarterly installments ending May 2006
-
280,000
261,400
The 9 th domestic equipment loan
Floating rate -Quarterly installments ending May 2006
-
20,000
17,236
First Commercial Bank
Fiduciary loan Floating rateSettlement in December 2003
-
100,000
100,000
200,000 846,708 769,509 Current portion ( 53,292 ) ( 73,222 ) ( 233,012 ) $ 146,708 $ 773,486 $ 536,497 Interest rates per annum 6.77%~8.14% 4.20%~6.475% 3.30%∼6.37%
14. BONDS PAYABLE December 31
2000 2001 2002 Convertible bonds payable $ - $ - $ 1,200,000 Compensation interest payable - - 15,675 $ - $ - $ 1,215,675
On July 10, 2002, the Company issued unsecured convertible bonds. The main terms of the issue are as follows: (a) Total amount: $1,200,000 (b) Interest rate: zero (c) Maturity date: July 9, 2007 (d) Redemption at the option of the bondholders: Bondholders may request the Company
to redeem the bonds in cash equal to par value of the bonds plus interest of 7.69% and 11.46% of the par value on July 9, 2005 and July 9, 2006, respectively.

15. COMMON STOCK 1) Pursuant to the resolution adopted at the special stockholders' meeting held on
December 11, 1993, and after obtaining approval from the SFC, the Company issued 2,600,000 units of global depository receipts (GDRs) in Europe, Asia and USA, which are represented by 13,000,000 shares of common stock (Deposited Shares). Total amount received by the Company relating to these GDRs on May 24, 1994 was $837,333. The main terms and conditions of the GDRs are as follows: A. Voting
Holders of GDRs have no right to directly exercise voting rights or attend the Company's stockholders' meeting. A holder or holders together holding at least 51% of the GDRs outstanding at the relevant record date of the stockholders' meeting can instruct the Depositary to vote in the same direction in respect of one or more resolutions to be proposed at the meeting.
B. Sale and withdrawal of GDRs Under the current R.O.C. law, the shares represented by the GDRs may not be withdrawn by holders of GDRs commencing three months after the initial issue of GDRs. A holder of GDR may, provided that the Company has delivered to the custodian physical share certificates in respect of the Deposited Shares, request the Depositary to sell or cause to be sold on behalf of such holder the shares represented by such GDRs.
C. Dividends GDR holders are entitled to receive dividends to the same extent as the holders of common stock subject to the terms of the Deposit Agreement and applicable laws of the R.O.C.
2) As of December 31, 2002, the Company's authorized share capital comprised of 700,000,000 common shares at NT$10 (in dollars) par value per share, of which 50,000,000 shares are reserved for the issuance of convertible bonds, stock option certificates and convertible preferred stock, and 426,163,000 shares were issued and outstanding.
3) In accordance with the resolution adopted by the board of directors on April 23, 2002, the Company issued 15,000 units of stock options, representing 15,000,000 shares of common stock. The major terms of the Option Plan are as follows: a. On May 27, 2002 the Company granted 14,011 units of stock options and the
exercise price was NT$23 (in dollar) per share. b. The Company will issue new shares of common stock upon exercise of the
options.
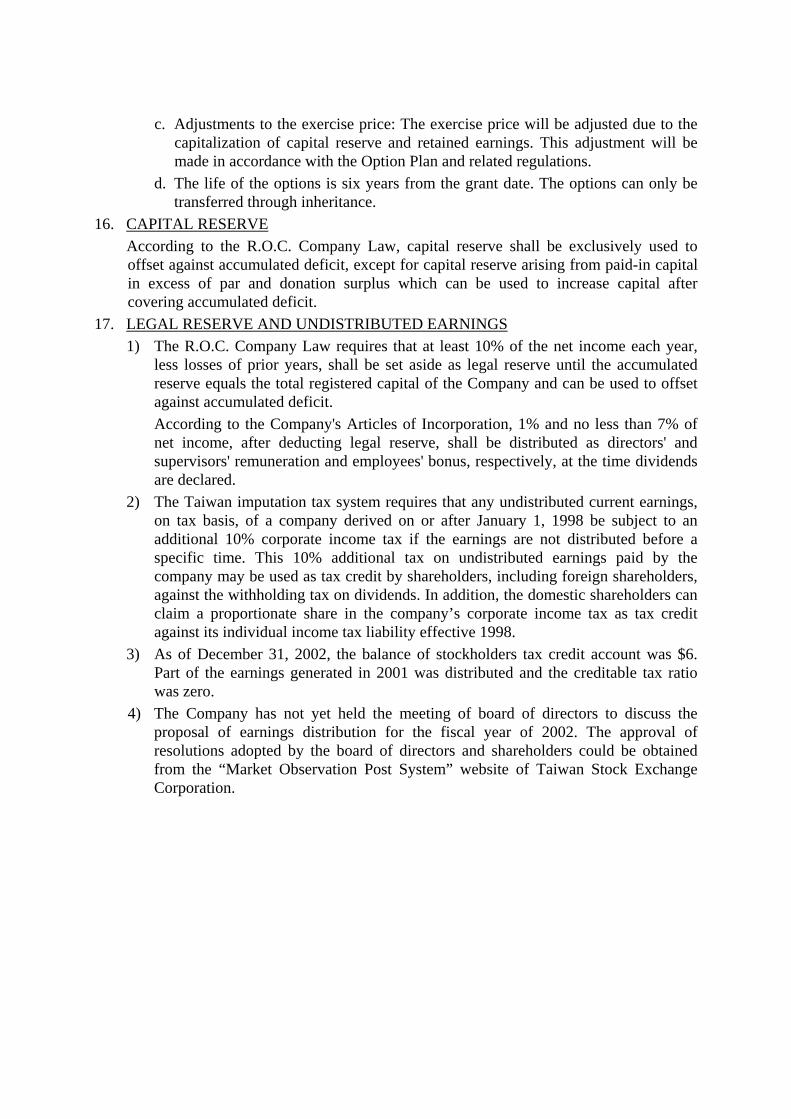
c. Adjustments to the exercise price: The exercise price will be adjusted due to the capitalization of capital reserve and retained earnings. This adjustment will be made in accordance with the Option Plan and related regulations.
d. The life of the options is six years from the grant date. The options can only be transferred through inheritance.
16. CAPITAL RESERVE According to the R.O.C. Company Law, capital reserve shall be exclusively used to offset against accumulated deficit, except for capital reserve arising from paid-in capital in excess of par and donation surplus which can be used to increase capital after covering accumulated deficit.
17. LEGAL RESERVE AND UNDISTRIBUTED EARNINGS 1) The R.O.C. Company Law requires that at least 10% of the net income each year,
less losses of prior years, shall be set aside as legal reserve until the accumulated reserve equals the total registered capital of the Company and can be used to offset against accumulated deficit. According to the Company's Articles of Incorporation, 1% and no less than 7% of net income, after deducting legal reserve, shall be distributed as directors' and supervisors' remuneration and employees' bonus, respectively, at the time dividends are declared.
2) The Taiwan imputation tax system requires that any undistributed current earnings, on tax basis, of a company derived on or after January 1, 1998 be subject to an additional 10% corporate income tax if the earnings are not distributed before a specific time. This 10% additional tax on undistributed earnings paid by the company may be used as tax credit by shareholders, including foreign shareholders, against the withholding tax on dividends. In addition, the domestic shareholders can claim a proportionate share in the company’s corporate income tax as tax credit against its individual income tax liability effective 1998.
3) As of December 31, 2002, the balance of stockholders tax credit account was $6. Part of the earnings generated in 2001 was distributed and the creditable tax ratio was zero.
4) The Company has not yet held the meeting of board of directors to discuss the proposal of earnings distribution for the fiscal year of 2002. The approval of resolutions adopted by the board of directors and shareholders could be obtained from the “Market Observation Post System” website of Taiwan Stock Exchange Corporation.

The information of 2001’s earnings distribution for employees’ bonus and directors’ and supervisors’ remuneration are as follows:
Approved in the Stockholders’ Meeting
(1) Distribution a. Employee stock dividend
(a) Shares(in thousands of shares) (b) Amount (c) Percentage of outstanding shares in 2001
b. Directors’ and supervisors’ remuneration
4,760 $ 47,599 1.24% $ 4,760
(2) Information about earning per share (in dollars) a. Original EPS (Note 1) b. Imputed EPS(note 2)
$ 1.76 $ 1.62
Note 1: The original EPS was not retroactively adjusted in accordance with the issuance of capitalization of earnings and employees’ bonuses.
Note 2: Imputed EPS = (Net income- employees’ bonus - directors’ and supervisors’ remuneration) / weighted average outstanding common shares for 2001.
18. INCOME TAX 1) The balances of deferred income tax assets / (liabilities) are summarized below:
December 31, 2000 2001 2002 Deferred income tax assets - current $ 119,864 $ 136,214 $ 181,706 Less: Valuation allowance - - ( 47,671) 119,864 136,214 134,035 Deferred income tax liabilities– non current ( 90,819) ( 218,714) ( 81,651)Total deferred income tax assets /
(liabilities) $ 29,045 ($ 82,500) $ 52,384

2) The temporary differences and the related deferred income tax assets / (liabilities) comprised the following: December 31, 2000 December 31, 2001 December 31, 2002
Amount Income tax effect Amount
Income tax effect Amount
Income tax effect
Deferred income tax assets - current (shown in other current assets)
Temporary differences: Warranty provision $ 41,949 $ 10,487 $ 47,768 $ 11,942 $ 51,807 $ 12,952 Provision for inventory loss 191,499 47,875 204,261 51,065 285,957 71,488 Allowance for bad debts 78,920 19,730 126,544 31,636 169,461 42,365 Others 9,887 2,472 1,668 417 9,456 2,363 Investment tax credits 34,230 22,488 52,538 Loss carry forward 5,070 18,666 - 119,864 136,214 181,706 Less: Valuation allowance for deferred income tax
assets -
-
( 47,671 )
119,864 136,214 134,035 Deferred income tax assets / (liabilities) – non current (shown in other liabilities)
Temporary differences: Loss on idle assets $ 63,353 15,838 $ 61,619 15,404 $ 71,498 17,875 Net pension cost 135,034 33,759 170,511 42,628 207,513 51,878 Foreign investment income accounted for by the equity
method ( 959,907 ) ( 239,977 ) ( 1,648,022 ) ( 412,006 ) ( 1,099,403 ( 274,851 ) Others 3,431 858 6,511 1,628 12,316 3,079 Investment tax credits 80,037 133,632 120,368 Loss carry forward 18,666 - - ( 90,819 ) ( 218,714 ) ( 81,651 ) $ 29,045 ( $ 82,500 ) $ 52,384

3) Income tax expense / (benefit) and income tax refundable were reconciled as follows: December 31, 2000 2001 2002 Tax on pretax income at statutory tax rate $ 196,572 $ 196,431 $ - Tax effect on permanent differences ( 23,855 ) ( 33,551 ) ( 141,481 ) Adjustment of prior years tax expense - 495 - Investment tax credits ( 40,710 ) ( 51,337 ) ( 41,074 ) Valuation allowance of income tax assets - - 47,671 Income tax expense / (benefit) 132,007 112,038 ( 134,884 ) Net effect of deferred income tax ( 132,007 ) ( 111,543 ) 134,884 Adjustment of prior years' tax expense - ( 495 ) - Prepaid income tax ( 1,653 ) ( 523 ) ( 1,616 ) Income tax refundable (shown in other
receivables and prepayments) ($ 1,653 ) ($ 523 ) ($ 1,616 )
4) The Company is eligible for income tax exemption for a period of four consecutive years due to an expansion of production equipment through increase of capital. The effective date of this exemption is to be decided by the Company within two years from the start of operation of the new machinery and equipment of each expansion. The maximum period of such deferral of the four-year tax holiday shall not exceed four years. The details are as follows: Capital increase method Tax - exempt period Unappropriated earnings, capital reserve and employees' bonus capitalized in 1994
January 1, 2000~December 31, 2003
Unappropriated earnings, capital reserve and employees' bonus capitalized in 1995
January 1, 2002~December 31, 2005.
Unappropriated earnings, capital reserve and employees' bonus capitalized in 1996
Tax-exempt period has not been decided by the Company
Unappropriated earnings, capital reserve and employees' bonus capitalized in 2000
Tax-exempt period has not been decided by the Company
5) As of December 31, 2002, the Company's income tax returns for the years through
1999 have been assessed and approved by the Tax Authority, except for the year 1998 which is still under review by the Tax Authority. However, the investment tax credits of research and development expenditure and employee training expenditure for the year 1995 was not approved by the Tax Authority. Due to the assessment of the 1995 tax return, the 1996 and 1999 tax returns have been reassessed by the Tax Authority. The Company has filed tax appeals for the years of 1995, 1996 and 1999 tax returns.

6) At December 31, 2002, the balance of unused investment tax credits was $172,906, which will expire as follows:
Expiry Investment tax credits 2003 $ 52,538 2004 72,466 2005 6,828 2006 41,074
$ 172,906 19. EARNINGS PER SHARE
For the period ended December 31, 2002 Amount Outstanding Loss per share Loss before Common Loss before income tax Net loss Shares (Note) income tax Net loss Primary earnings
per share:
Net loss ( $ 746,343 ) ( $ 611,459 ) 426,163 ( $ 1.75 ) ( $ 1.43 ) For the period ended December 31, 2001 Amount Outstanding Earnings per share Income before Common Income before income tax Net income Shares (Note) income tax Net income Primary earnings
per share:
Net income $ 785,765 $ 673,727 383,093 $ 2.05 $ 1.76 Net income retroactively
adjusted
426,163 $ 1.84
$ 1.58
For the period ended December 31, 2000 Amount Outstanding Earnings per share Income before Common Income before income tax Net income Shares (Note) income tax Net income Primary earnings
per share:
Net income $ 982,863 $ 850,856 312,863 $ 3.14 $ 2.12 Net income retroactively
adjusted
426,163 $ 2.31
$ 2.00
The convertible bonds and stock options are not dilutable.
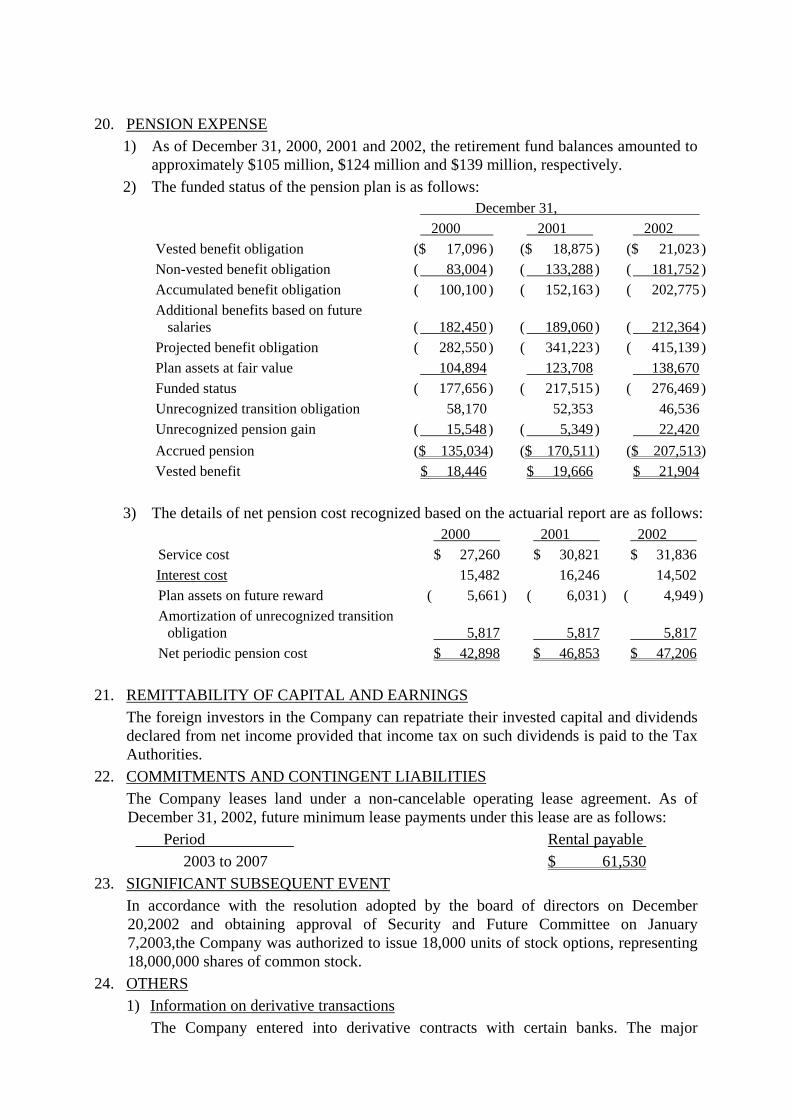
20. PENSION EXPENSE 1) As of December 31, 2000, 2001 and 2002, the retirement fund balances amounted to
approximately $105 million, $124 million and $139 million, respectively. 2) The funded status of the pension plan is as follows:
December 31, 2000 2001 2002 Vested benefit obligation ($ 17,096 ) ($ 18,875 ) ($ 21,023 ) Non-vested benefit obligation ( 83,004 ) ( 133,288 ) ( 181,752 ) Accumulated benefit obligation ( 100,100 ) ( 152,163 ) ( 202,775 ) Additional benefits based on future
salaries ( 182,450 )
( 189,060 )
( 212,364 )
Projected benefit obligation ( 282,550 ) ( 341,223 ) ( 415,139 ) Plan assets at fair value 104,894 123,708 138,670 Funded status ( 177,656 ) ( 217,515 ) ( 276,469 ) Unrecognized transition obligation 58,170 52,353 46,536 Unrecognized pension gain ( 15,548 ) ( 5,349 ) 22,420 Accrued pension ($ 135,034) ($ 170,511) ($ 207,513) Vested benefit $ 18,446 $ 19,666 $ 21,904
3) The details of net pension cost recognized based on the actuarial report are as follows: 2000 2001 2002 Service cost $ 27,260 $ 30,821 $ 31,836Interest cost 15,482 16,246 14,502Plan assets on future reward ( 5,661 ) ( 6,031 ) ( 4,949 )Amortization of unrecognized transition
obligation 5,817 5,817 5,817Net periodic pension cost $ 42,898 $ 46,853 $ 47,206
21. REMITTABILITY OF CAPITAL AND EARNINGS The foreign investors in the Company can repatriate their invested capital and dividends declared from net income provided that income tax on such dividends is paid to the Tax Authorities.
22. COMMITMENTS AND CONTINGENT LIABILITIES The Company leases land under a non-cancelable operating lease agreement. As of December 31, 2002, future minimum lease payments under this lease are as follows: Period Rental payable 2003 to 2007 $ 61,530
23. SIGNIFICANT SUBSEQUENT EVENT In accordance with the resolution adopted by the board of directors on December 20,2002 and obtaining approval of Security and Future Committee on January 7,2003,the Company was authorized to issue 18,000 units of stock options, representing 18,000,000 shares of common stock.
24. OTHERS 1) Information on derivative transactions
The Company entered into derivative contracts with certain banks. The major
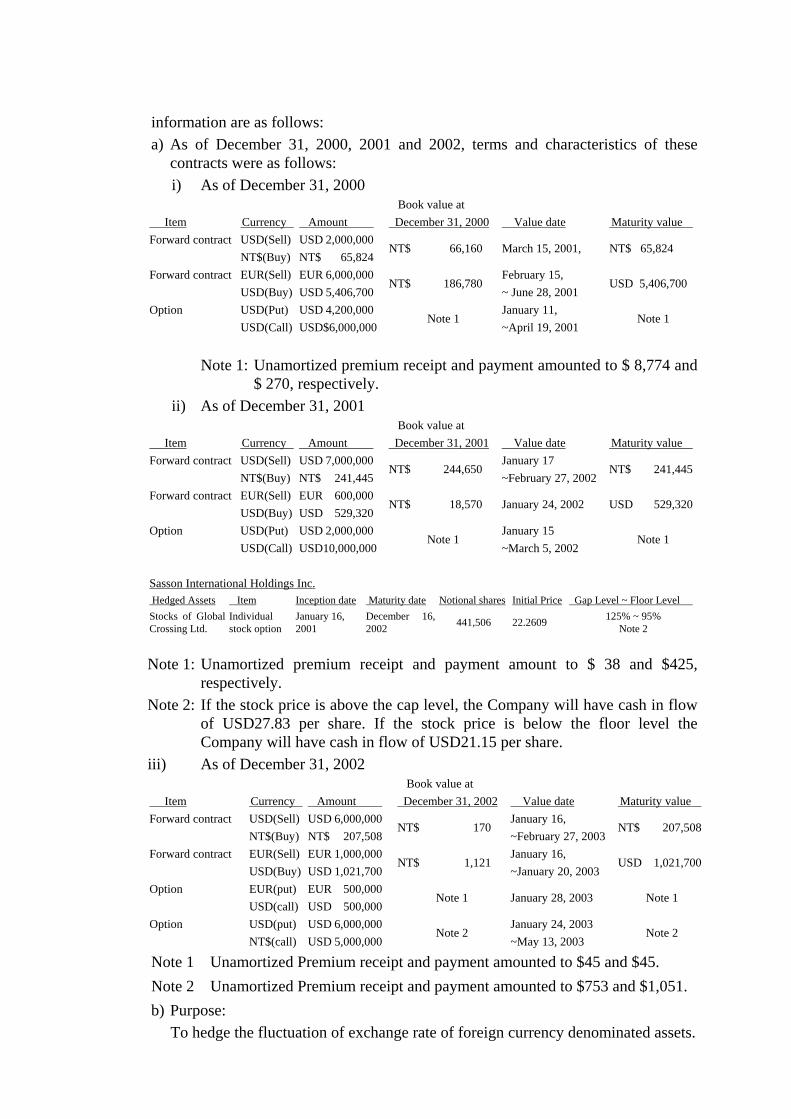
information are as follows: a) As of December 31, 2000, 2001 and 2002, terms and characteristics of these
contracts were as follows: i) As of December 31, 2000
Item
Currency
Amount
Book value at December 31, 2000
Value date
Maturity value
Forward contract USD(Sell) NT$(Buy)
USD 2,000,000 NT$ 65,824
NT$ 66,160 March 15, 2001, NT$ 65,824
Forward contract EUR(Sell) USD(Buy)
EUR 6,000,000 USD 5,406,700
NT$ 186,780 February 15, ~ June 28, 2001
USD 5,406,700
Option USD(Put) USD(Call)
USD 4,200,000 USD$6,000,000
Note 1 January 11, ~April 19, 2001
Note 1
Note 1: Unamortized premium receipt and payment amounted to $ 8,774 and $ 270, respectively.
ii) As of December 31, 2001 Item
Currency
Amount
Book value at December 31, 2001
Value date
Maturity value
Forward contract USD(Sell) NT$(Buy)
USD 7,000,000 NT$ 241,445
NT$ 244,650 January 17 ~February 27, 2002
NT$ 241,445
Forward contract EUR(Sell) USD(Buy)
EUR 600,000 USD 529,320
NT$ 18,570 January 24, 2002 USD 529,320
Option USD(Put) USD(Call)
USD 2,000,000 USD10,000,000
Note 1 January 15 ~March 5, 2002
Note 1
Sasson International Holdings Inc. Hedged Assets Item Inception date Maturity date Notional shares Initial Price Gap Level ~ Floor Level Stocks of Global Crossing Ltd.
Individual stock option
January 16, 2001
December 16, 2002 441,506 22.2609 125% ~ 95%
Note 2
Note 1: Unamortized premium receipt and payment amount to $ 38 and $425, respectively.
Note 2: If the stock price is above the cap level, the Company will have cash in flow of USD27.83 per share. If the stock price is below the floor level the Company will have cash in flow of USD21.15 per share.
iii) As of December 31, 2002 Item
Currency
Amount
Book value at December 31, 2002
Value date
Maturity value
Forward contract USD(Sell) NT$(Buy)
USD 6,000,000 NT$ 207,508
NT$ 170 January 16, ~February 27, 2003
NT$ 207,508
Forward contract EUR(Sell) USD(Buy)
EUR 1,000,000 USD 1,021,700
NT$ 1,121 January 16, ~January 20, 2003
USD 1,021,700
Option EUR(put) USD(call)
EUR 500,000 USD 500,000
Note 1 January 28, 2003 Note 1
Option USD(put) NT$(call)
USD 6,000,000 USD 5,000,000
Note 2 January 24, 2003 ~May 13, 2003
Note 2
Note 1:Unamortized Premium receipt and payment amounted to $45 and $45. Note 2:Unamortized Premium receipt and payment amounted to $753 and $1,051. b) Purpose:
To hedge the fluctuation of exchange rate of foreign currency denominated assets.
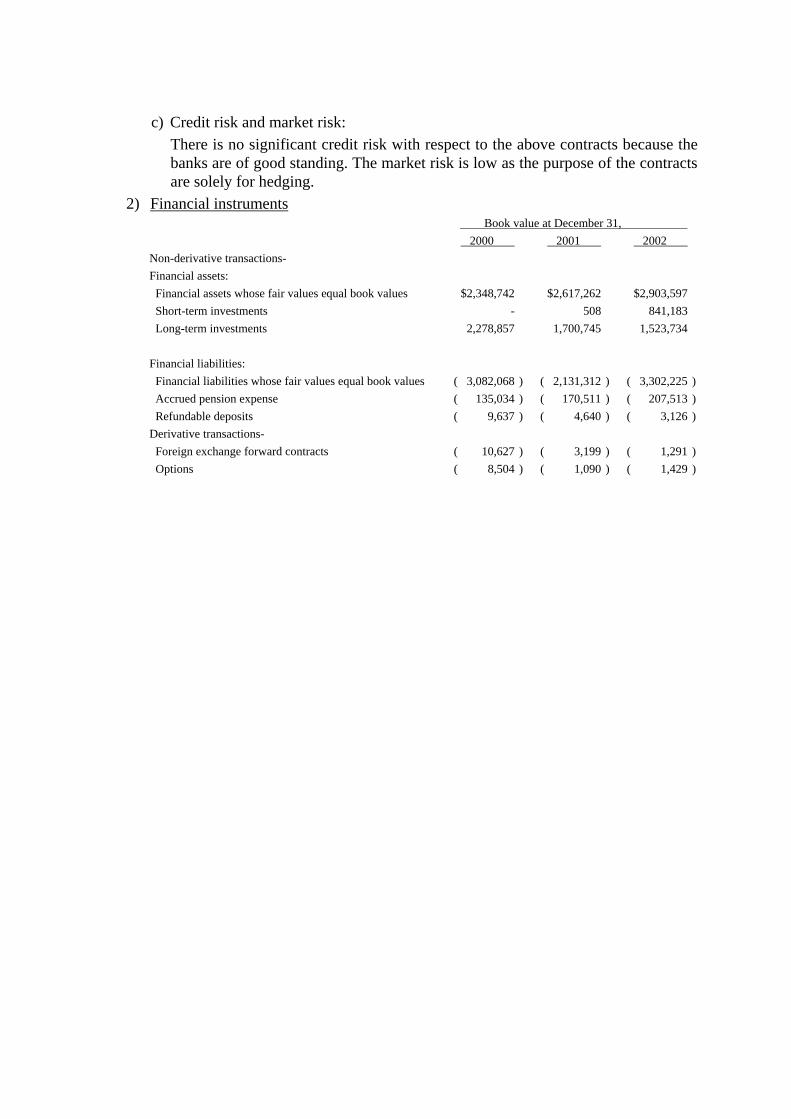
c) Credit risk and market risk: There is no significant credit risk with respect to the above contracts because the banks are of good standing. The market risk is low as the purpose of the contracts are solely for hedging.
2) Financial instruments Book value at December 31, 2000 2001 2002
Non-derivative transactions- Financial assets: Financial assets whose fair values equal book values $2,348,742 $2,617,262 $2,903,597 Short-term investments - 508 841,183 Long-term investments 2,278,857 1,700,745 1,523,734 Financial liabilities: Financial liabilities whose fair values equal book values ( 3,082,068 ) ( 2,131,312 ) ( 3,302,225 ) Accrued pension expense ( 135,034 ) ( 170,511 ) ( 207,513 ) Refundable deposits ( 9,637 ) ( 4,640 ) ( 3,126 )Derivative transactions- Foreign exchange forward contracts ( 10,627 ) ( 3,199 ) ( 1,291 ) Options ( 8,504 ) ( 1,090 ) ( 1,429 )

Fair value at December 31, 2000 2001 2002
Non-derivative transactions- Financial assets: Financial assets whose fair values equal book values $2,348,742 $2,617,262 $2,903,597 Short-term investments - 508 841,744 Long-term investments 2,586,082 1,687,642 1,519,729 Financial liabilities: Financial liabilities whose fair values equal book values ( 3,082,068 ) ( 2,131,312 ) ( 3,302,225 ) Accrued pension expense ( 177,656 ) ( 217,515 ) ( 276,469 ) Refundable deposits ( 8,976 ) ( 4,431 ) ( 3,126 )Derivative transactions- Foreign exchange forward contracts ( 10,627 ) ( 3,199 ) ( 1,291 ) Options ( 8,504 ) ( 1,090 ) ( 1,429 )
The methods and assumptions used to measure the fair values of financial instruments are as follows: a) Financial assets and liabilities whose fair values equal to book values.
The carrying amounts of short-term financial assets and liabilities approximate fair values due to their short maturity.
b) The fair values of long-term investments are based on the market values of the securities, or the underlying equities in the net assets of the investee companies, if market value is not available.
c) The book value of long-term loans are used as fair values as the loans bear floating interest rates.
d) The fair value of accrued pension expense equals the “Projected Benefit Obligation” minus “Plan Assets At Fair Value” based on the actuarial report.
e) The fair value of deposits in is estimated by the present value of expected cash flows.
25. SEGMENT INFORMATION 1) Sales to major customers
2000 2001 2002 Customer Sales % Sales % Sales % Product A $ 1,092,975 22 $ 659,192 12 $ 846,979 20 Telecom. B 813,299 17 - - 526,290 12 Satellite communication C - - 652,945 12 976,723 23 Telecom D - - 931,978 17 - - Satellite communication E 600,059 12 - - - - Telecom $ 2,506,333 51 $ 2,244,115 41 $ 2,349,992 55
2) Export sales by geographical destination 2000 2001 2002 America $ 2,685,919 $ 2,718,827 $ 1,647,276 Europe 1,247,569 1,365,015 868,405 Asia 603,405 298,456 1,096,873 Other areas 24,238 12,109 10,515 Total $ 4,561,131 $ 4,394,407 $ 3,623,069

3) Sales by geographical origin There was no sales by foreign operation in 2000 2001 Asia Taiwan Others Adj&Elim. Consolidated Sales to unaffiliated customers $ - $ 4,673,141 $ - $ - $ 4,673,141 Inter-segment sales 7,656 1,523 - ( 9,179 ) - Total revenue $ 7,656 $ 4,674,664 $ - ( $ 9,179 ) $ 4,673,141 Operating (loss) / profit ( $ 73,762 ) $ 213,610 $ - $ -
$ 139,848 General corporate expenses (including
non-operating items)
751,750
Interest Expense ( 105,833 ) Income before income tax expense $ 785,765 At December 31, 2001 Identifiable assets $ 50,180 $ 3,251,962 $ 1,613 ( $ 10,069 ) $ 3,293,686 Long-term Investments 1,700,745General corporate assets 2,219,532 Total assets $ 7,213,963 2002 Asia Taiwan Others Adj&Elim. Consolidated Sales to unaffiliated customers $ 30,233 $ 3,554,926 $ - $ - $ 3,585,159 Inter-segment sales 450,206 11,060 - ( 461,266 ) - Total revenue $ 480,439 $ 3,565,986 $ - ( $ 461,266 ) $ 3,585,159 Operating (loss) / profit ( $ 86,997 ) $ 68,401 $ - $ - ( $ 18,596 ) General corporate expenses (including
non-operating items)
( 658,580 )
Interest Expense ( 69,167 ) Income before income tax expense ( $ 746,343 ) At December 31, 2002 Identifiable assets $ 196,498 $ 3,055,769 $ 889 ( $ 137,948 )
$ 3,115,208
Long-term Investments 1,523,734General corporate assets 3,269,775 Total assets $ 7,908,717

4) Sales by class of business 2000 Sat.-com. Telecom. Other Total Total revenue $ 1,881,633 $ 3,025,078 $ - $ 4,906,711 Operating profit $ 80,050 $ 406,497 $ - $ 486,547 General corporate income 496,316 Income before income tax expense $ 982,863 Depreciation $ 44,980 $ 36,417 $ 1,061 Capital expenditure $ 254,518 $ 381,183 $ 740 at December 31, 2000: Identifiable assets $ 1,373,516 $ 2,833,575 $ 753,574 $ 4,960,665 General corporate assets 2,992,675 Total assets $ 7,953,340 2001
Sat.-com.
Telecom.
Write-off and Adjustment
Total
Total revenue $ 2,038,562 $ 2,643,758 ( $ 9,179 ) $ 4,673,141 Operating profit ( $ 20,339 ) $ 160,187 $ - $ 139,848 General corporate income 645,917 Income before income tax expense $ 785,765 Depreciation $ 55,676 $ 117,962 Capital expenditure $ 73,287 $ 119,826 at December 31, 2001: Identifiable assets $ 1,132,510 $ 2,169,632 ( $ 10,069 ) $ 3,292,073 General corporate assets 3,921,890 Total assets $ 7,213,963 2002
Sat.-com.
Telecom.
Write-off and Adjustment
Total
Total revenue $ 1,893,132 $ 2,253,293 ( $ 461,266 ) $ 3,685,159 Operating profit ( $ 184,569 ) $ 165,973 $ - ( $ 18,596 ) General corporate income ( 727,747 ) Income before income tax expense ( $ 746,343 ) Depreciation $ 57,399 $ 126,108 Capital expenditure $ 31,084 $ 157,640 at December 31, 2002: Identifiable assets $ 1,134,284 $ 2,117,983 ( $ 137,948 ) $ 3,114,319 General corporate assets 4,794,398 Total assets $ 7,908,717
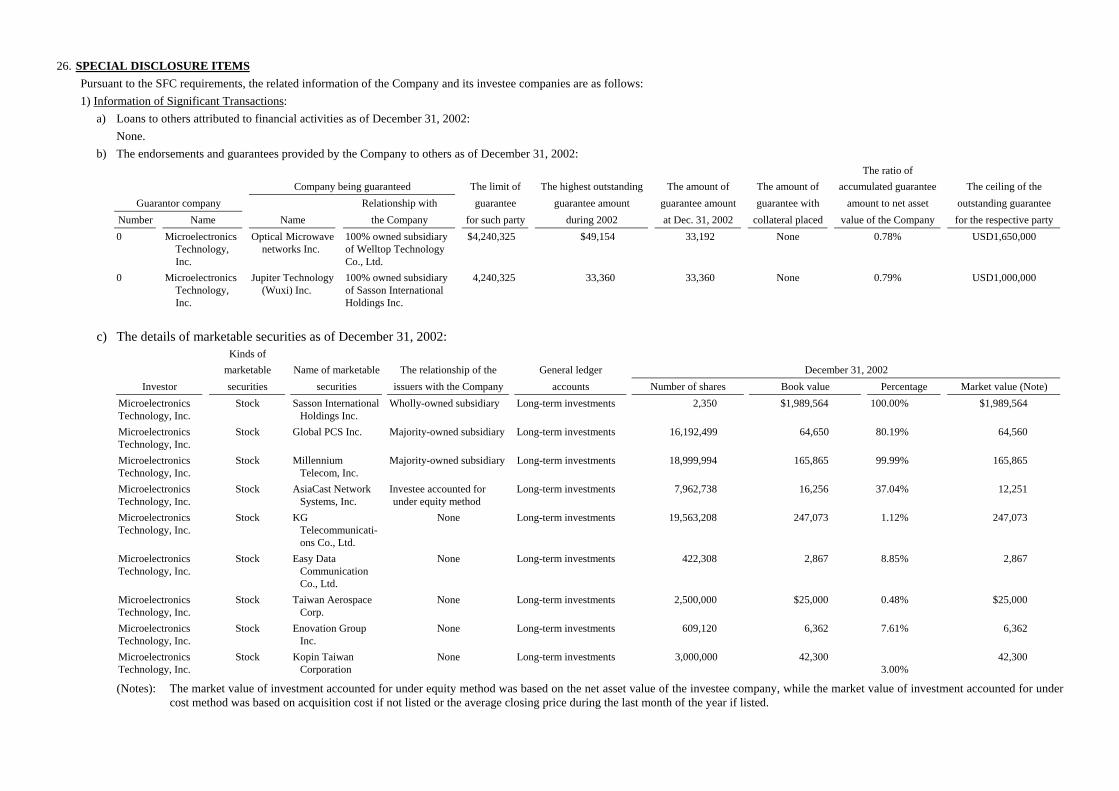
26. SPECIAL DISCLOSURE ITEMS Pursuant to the SFC requirements, the related information of the Company and its investee companies are as follows: 1) Information of Significant Transactions:
a) Loans to others attributed to financial activities as of December 31, 2002: None.
b) The endorsements and guarantees provided by the Company to others as of December 31, 2002: The ratio of Company being guaranteed The limit of The highest outstanding The amount of The amount of accumulated guarantee The ceiling of the Guarantor company Relationship with guarantee guarantee amount guarantee amount guarantee with amount to net asset outstanding guarantee
Number Name Name the Company for such party during 2002 at Dec. 31, 2002 collateral placed value of the Company for the respective party 0 Microelectronics
Technology, Inc.
Optical Microwave networks Inc.
100% owned subsidiary of Welltop Technology Co., Ltd.
$4,240,325 $49,154 33,192 None 0.78% USD1,650,000
0
MicroelectronicsTechnology, Inc.
Jupiter Technology(Wuxi) Inc.
100% owned subsidiary of Sasson International Holdings Inc.
4,240,325 33,360 33,360 None 0.79% USD1,000,000
c) The details of marketable securities as of December 31, 2002: Kinds of marketable Name of marketable The relationship of the General ledger December 31, 2002
Investor securities securities issuers with the Company accounts Number of shares Book value Percentage Market value (Note) Microelectronics Technology, Inc.
Stock Sasson InternationalHoldings Inc.
Wholly-owned subsidiary Long-term investments 2,350 $1,989,564 100.00% $1,989,564
Microelectronics Technology, Inc.
Stock Global PCS Inc. Majority-owned subsidiary Long-term investments 16,192,499 64,650 80.19% 64,560
Microelectronics Technology, Inc.
Stock
MillenniumTelecom, Inc.
Majority-owned subsidiary Long-term investments 18,999,994 165,865 99.99% 165,865
Microelectronics Technology, Inc.
Stock AsiaCast NetworkSystems, Inc.
Investee accounted for under equity method
Long-term investments 7,962,738 16,256 37.04% 12,251
Microelectronics Technology, Inc.
Stock KGTelecommunicati-ons Co., Ltd.
None Long-term investments 19,563,208 247,073 1.12% 247,073
Microelectronics Technology, Inc.
Stock Easy DataCommunication Co., Ltd.
None Long-term investments 422,308 2,867 8.85% 2,867
Microelectronics Technology, Inc.
Stock Taiwan AerospaceCorp.
None Long-term investments 2,500,000 $25,000 0.48% $25,000
Microelectronics Technology, Inc.
Stock Enovation GroupInc.
None Long-term investments 609,120 6,362 7.61% 6,362
Microelectronics Technology, Inc.
Stock Kopin TaiwanCorporation
None Long-term investments 3,000,000 42,300 3.00%
42,300
(Notes): The market value of investment accounted for under equity method was based on the net asset value of the investee company, while the market value of investment accounted for under cost method was based on acquisition cost if not listed or the average closing price during the last month of the year if listed.

d) The cumulative buying, selling of one specific security over $100,000 or 20 percent of the capital stock for the year ended December 31, 2002:
Beginning balance Additions Disposals Ending balance
Investor Name of the securities
General ledger
account
Number of shares Amount Number of
shares Amount Number of shares Amount Book
value Gain/Loss from
disposal Number of
shares Amount
Microelectronic Technology Inc.
Prudential Bond Fund
Short-term investment
- $ - 26,831,982 $390,815 13,415,991 $196,280 $194,280 $ 1,745 13,415,991 $196,280
〃 Prudential Well Pool Fund
〃 -
- 35,060,201 411,210 31,542,192 370,460 369,650 810 3,518,009 41,560
〃 Aig Taiwan Bond Fund
〃 - - 13,494,508 160,350 13,494,508 161,320 160,350 970 - -
〃 Solomon Bond Fund
〃 - - 36,811,108 401,033 18,405,554 201,533 199,500 2,033 18,405,554 201,533
〃 B.B. Bond Fund 〃 - - 41,235,863 437,381 20,617,932 219,381 218,000 1,381 20,617,931 219,381〃 ABN AMRO
Select Bond Fund
〃 - - 14,150,276 150,000 14,150,276 150,228 150,000 228 - -
e) Real estate acquired amounting to over $100,000 or 20 percent of the Company’s capital stock for the year ended December 31, 2002: None.
f) Real estate disposed amounting to over $100,000 or 20 percent of the Company’s capital stock for the year ended December 31, 2002: None.
g) Purchases and sales transactions with related parties over $100,000 or 20 percent of the Company’s capital stock for the year ended December 31, 2002: None.
h) Receivables from related parties over $100,000 or 20 percent of the Company’s capital stock as of December 31, 2002: None.
i) Information on derivative transactions: Please see Note 23.

2) Information of Subsidiaries: a) Related information on subsidiaries as of December 31, 2002:
The net income Original amount Shares held by the Company / (loss) of the The income / The main business December December Number Investee (loss) recorded
Investor Investee company Location scope 31, 2002 31, 2001 of shares Percentage Book value Company by the company Note Microelectronics Technology, Inc.
Sasson International Holdings Inc.
BVI Investment planning and consulting
NT$659,428 NT$659,428 2,350 100.00% NT$1,989,564 (NT$548,620) (NT$548,620) Wholly-ownedsubsidiary
Microelectronics Technology, Inc
Global PCS Inc. Hsinchu, Taiwan
Communication
Microelectronics
43,000,000
91.00%
Wuxi China 91.00% Subsidiary of Jupiter Network
NT$134,847 NT$99,322 16,192,499 80.19% NT$64,560 (NT$51,048) (NT$40,006) Majority-ownedsubsidiary
Microelectronics Technology, Inc
SSPA Microwave Corp.
Ontario, Canada
Communication NT$64,425 NT$64,425 96 44.44% - - - Investee accountedfor under equity method
Microelectronics Technology, Inc
Millennium Telecom Inc.
Taipei, Taiwan
Investment planning and consulting
NT$190,000 NT$190,000 18,999,994 99.99% NT$165,865 (NT$8,628) (NT$8,628) Majority-owned subsidiary
Microelectronics Technology, Inc
AsiaCast Network Systems, Inc.
Taipei, Taiwan
Communication NT$82,327 NT$82,327 7,962,738 37.04% NT$16,256 (NT$41,352) (NT$17,988) Investee accounted for under equity method
Sasson International Holding Inc.
EURO-MIT S.A.R.L
Luxembourg Communication US$15,000 US$15,000 500 100.00% NT$1,650 - - Subsidiary ofSasson International Holdings Inc.
Sasson International Holding Inc.
Welltop Technology Co.,Ltd
BVI Investment planning and consulting
US$828,000 US$828,000 828,000 100.00% (NT$30,312) (NT$104) (NT$104) Subsidiary ofSasson International Holdings Inc.
Sasson International Holding Inc.
Jupiter Network Corp.
BVI Investment planning and consulting
US$4,286,000 US$2,648,000 4,286,000 100.00% NT$120,100 (NT$23,160) (NT$23,160) Subsidiary ofSasson International Holdings Inc.
Sasson International Holding Inc.
Zeus Communications, Inc.
Delaware, USA
Investment planning and consulting
US$430,800 US$264,800 1,200 100.00% NT$11,941 (NT$2,399) (NT$2,399) Subsidiary ofSasson International Holdings Inc.
Welltop TechnologyCo.,Ltd Technology do
Brasil Ltd
Brazil Communication US$80,000 US$80,000 - 99.90% NT$129 - - Subsidiary of Welltop Technology Co.,Ltd
Welltop TechnologyCo.,Ltd
Optical Microwave Networks Inc.
California USA
Communication US$737,600 US$737,600 100.00% (NT$30,386) (NT$35) (NT$35) Subsidiary ofWelltop Technology Co.,Ltd
Jupiter Network Corp.
Jupiter Technology (Wuxi) Inc
Wuxi China Communication US$2,639,000 US$2,639,000 - NT$68,803 (NT$17,925) (NT$16,312) Subsidiary ofJupiter Network Corp.
Wuxi ZeusTechnology Inc.
Communication US$1,638,000 - - NT$51,205 (NT$7,442) (NT$6,772)

Corp. Zeus Communications,
US$261,000
Inc. Taipei, Taiwan
Communication 1,363,000
Inc.
Jupiter Technology (Wuxi) Inc
Wuxi China Communication US$261,000 - 9.00% NT$6,805 (NT$17,925) (NT$1,613) Subsidiary of Zeus Communications, Inc.
Wuxi ZeusTechnology Inc.
Wuxi China Communication US$162,000 - - 9.00% NT$5,159 (NT$7,442) (NT$670) Subsidiary of Zeus Communications,
Millennium Telecom Inc.
Neobits Technology Inc.
NT$30,575 NT$30,575 40.00% NT$11,626 (NT$13,277) (NT$5,311) Investee accounted for under equity method by Millennium Telecom Inc.
Millennium Telecom Inc.
Asia Global Crossing Taiwan
Taipei, Taiwan
Communication NT$320,000 NT$320,000 32,000,000 40.00% NT$320,000 - - Investee accountedfor under equity method by Millennium Telecom Inc.

b) Loans to others attributed to financial activities as of December 31, 2002: Collateral
Number Loan of company Lower General ledger
account
The biggest amount in 2002
December 31, 2002 Rate Type of
loan Amount of selling each
other
Required reason of short-term
financing
Appropriation allowance for
bad debts Name Value
The limited of amount of
loan to differ company
The limited of
total amount of loan
1 Sasson InternationalHolding Inc.
Millennium Telecom, Inc.
Other receivable
$195,284 $194,948 - Note $ - Operations $ - - $ - $1,955,329 $1,955,329
General ledger accounts
$ -
Note: Short-term financing. c) The endorsements and guarantees provided by the subsidiaries to others as of December 31, 2002:
None. d) The details of marketable securities as of December 31, 2002:
Investor Kinds of marketable securities Name of marketable securities The relationship of the
issuers with the Company Number of
shares Book value
Percentage
Market value (Note)
Sasson International Holdings Inc. Stock Euro-MTI S A.R.L Subsidiary of Sasson International Holdings Inc.
Long-term investment 500 $1,650 100.00%
Sasson International Holdings Inc. Stock Welltop Technology Co., Ltd Subsidiary of Sasson International Holdings Inc.
Long-term investment 828,000 (30,212) 100.00%
(30,212)
Sasson International Holdings Inc. Stock Jupiter Network Corp. Subsidiary of Sasson International Holdings Inc.
00%
Stock None Long-term investment 2,230,200
None 743
48,322
Long-term investment 4,286,000 120,100 100.00%
100.
120,100
Sasson International Holdings Inc. Stock Zeus Communications ,Inc. Subsidiary of Sasson International Holdings Inc.
Long-term investment 1,200 11,941 11,941
Sasson International Holdings Inc. Stock Asia Global Crossing Ltd. None Long-term investment 2,857,056 - 0.50% - Sasson International Holdings Inc. Stock Taicom Capital Ltd. None Long-term investment 20,000 347,500 14.95% 347,500Sasson International Holdings Inc. Inter WAVE Communication
Intl. 154,112 5.15% 22,563
Sasson International Holdings Inc. Stock Scientific Technology Inc.
Long-term investment 29,273 121,625 11.00% 121,625 Sasson International Holdings Inc. Fund NAVF II-LP None Long-term investment - 114,102
5.16% 114,102
69,Sasson International Holdings Inc. Stock Digital United Holdings Limited
None Long-term investment 223,000 69,743 0.34%
Sasson International Holdings Inc. Stock Netro Corporation None Long-term investment 234,390 63,369 2.00% 21,963Sasson International Holdings Inc. Stock Greast Communication
Technology Co., Ltd.
None Long-term investment - 19.29% 48,322
Sasson International Holdings Inc. Stock Other None Long-term investment 10,436,944 179,831 - 179,831
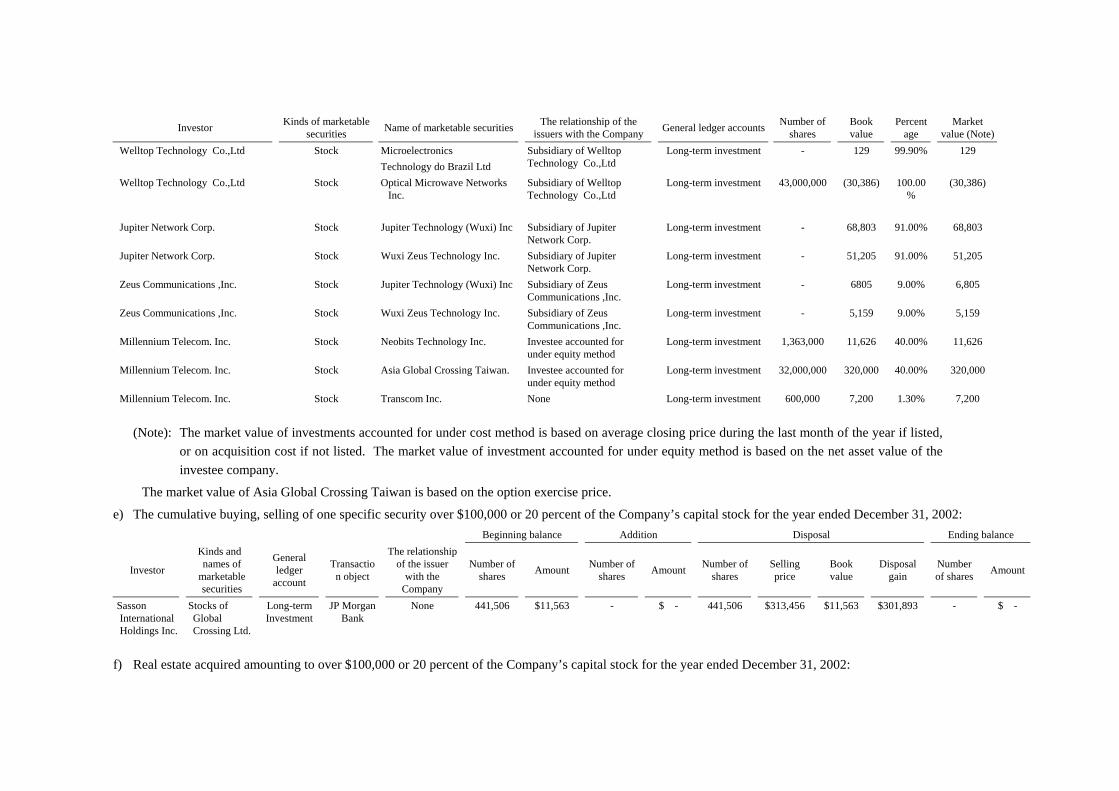
Investor Kinds of marketable securities Name of marketable securities The relationship of the
issuers with the Company General ledger accounts Number of shares
Book value
Percentage
Market value (Note)
Stock 99.90%Welltop Technology Co.,Ltd Microelectronics Technology do Brazil Ltd
Subsidiary of Welltop Technology Co.,Ltd
Long-term investment - 129 129
Welltop Technology Co.,Ltd Stock Optical Microwave Networks Inc.
Subsidiary of Welltop Technology Co.,Ltd
Long-term investment 43,000,000 (30,386) 100.00%
(30,386)
Subsidiary of Zeus Communications ,Inc.
11,626
Asia Global Crossing Taiwan. 40.00%
Kinds and names of
marketable securities
Amount
Jupiter Network Corp. Stock Jupiter Technology (Wuxi) Inc Subsidiary of Jupiter Network Corp.
Long-term investment - 68,803 91.00% 68,803
Jupiter Network Corp. Stock Wuxi Zeus Technology Inc. Subsidiary of Jupiter Network Corp.
Long-term investment - 51,205 91.00% 51,205
Zeus Communications ,Inc. Stock Jupiter Technology (Wuxi) Inc Long-term investment - 6805 9.00% 6,805
Zeus Communications ,Inc. Stock Wuxi Zeus Technology Inc. Subsidiary of Zeus Communications ,Inc.
Long-term investment - 5,159 9.00% 5,159
Millennium Telecom. Inc. Stock Neobits Technology Inc. Investee accounted for under equity method
Long-term investment 1,363,000 40.00% 11,626
Millennium Telecom. Inc. Stock Investee accounted for under equity method
Long-term investment 32,000,000 320,000 320,000
Millennium Telecom. Inc. Stock Transcom Inc. None Long-term investment 600,000 7,200 1.30% 7,200
(Note): The market value of investments accounted for under cost method is based on average closing price during the last month of the year if listed, or on acquisition cost if not listed. The market value of investment accounted for under equity method is based on the net asset value of the investee company.
The market value of Asia Global Crossing Taiwan is based on the option exercise price.
e) The cumulative buying, selling of one specific security over $100,000 or 20 percent of the Company’s capital stock for the year ended December 31, 2002: Beginning balance Addition Disposal Ending balance
Investor General ledger
account Transactio
n object
The relationship of the issuer
with the Company
Number of shares
Number of shares Amount Number of
shares Selling price
Book value
Disposal gain
Number of shares Amount
Sasson International Holdings Inc.
Stocks of Global Crossing Ltd.
441,506 $11,563 $301,893Long-termInvestment
JP Morgan Bank
None $11,563 - $ - 441,506 $313,456 - $ -
f) Real estate acquired amounting to over $100,000 or 20 percent of the Company’s capital stock for the year ended December 31, 2002:
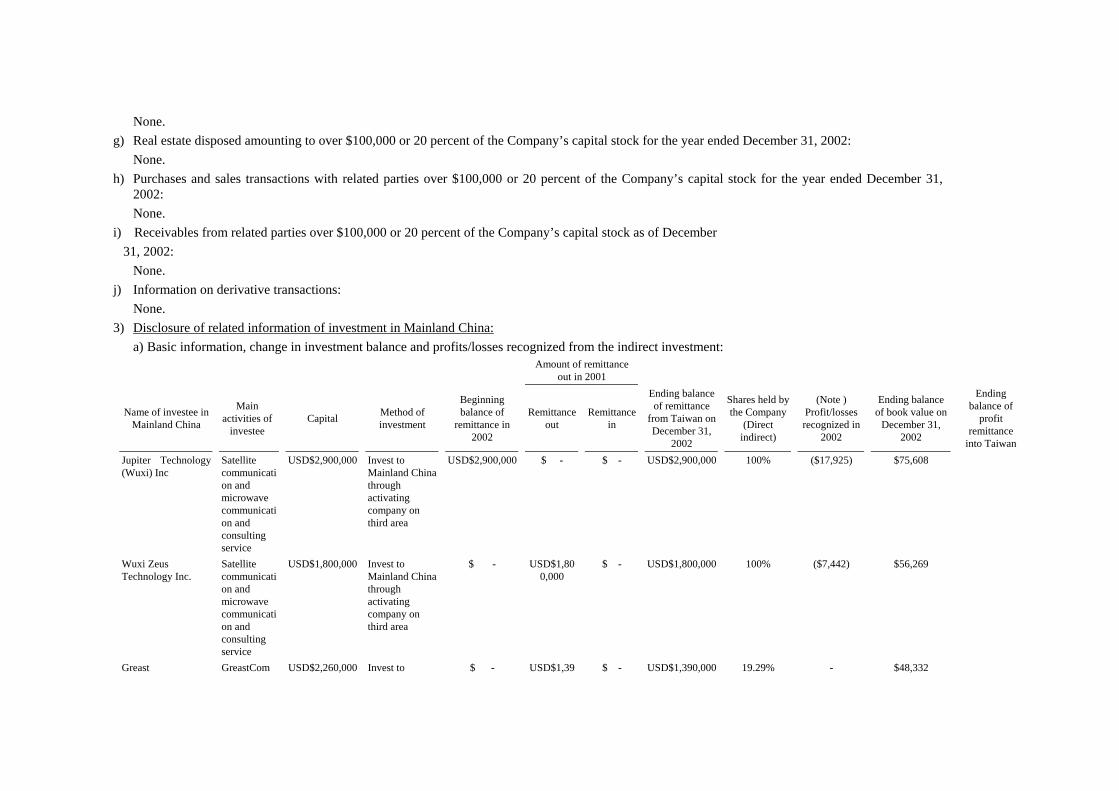
None. g) Real estate disposed amounting to over $100,000 or 20 percent of the Company’s capital stock for the year ended December 31, 2002:
None. h) Purchases and sales transactions with related parties over $100,000 or 20 percent of the Company’s capital stock for the year ended December 31,
2002: None.
i) Receivables from related parties over $100,000 or 20 percent of the Company’s capital stock as of December 31, 2002:
None. j) Information on derivative transactions:
None. 3) Disclosure of related information of investment in Mainland China:
a) Basic information, change in investment balance and profits/losses recognized from the indirect investment:
Capital Method of investment
Beginning balance of
remittance in 2002
Amount of remittance out in 2001
Name of investee in Mainland China
Main activities of
investee
Remittance out
Remittance in
Ending balance of remittance
from Taiwan on December 31,
2002
Shares held by the Company
(Direct indirect)
(Note ) Profit/losses recognized in
2002
Ending balance of book value on
December 31, 2002
Ending balance of
profit remittance
into Taiwan Satellite communication and microwave communication and consulting service
USD$2,900,000 Invest to Mainland China through activating company on third area
USD$2,900,000 $ - USD$2,900,000 100% ($17,925) $75,608
Wuxi Zeus Technology Inc.
Satellite communication and microwave communication and consulting service
USD$1,800,000 Invest to Mainland China through activating company on third area
$ - USD$1,800,000
$ - USD$1,800,000 100% ($7,442) $56,269
Greast GreastCom USD$2,260,000 Invest to $ - USD$1,39 $ - USD$1,390,000 19.29% - $48,332
Jupiter Technology (Wuxi) Inc
$ -

Communication Technology Co., Ltd.
designs,manufactures, and sells the following items for W-CDMA and cdma2000: Base band RF Sub-system;
Repeater;Low Noise Power Amplifier;Linear Power Amplifier;Up/Down Converter;RF Chipset
Mainland China through activating company on third area
0,000
Note: Profit/losses recognized based on the financial statements audited by the Company’s auditors.
The ceiling amount of the Company for investment in Mainland China
Ending balance of investment from Taiwan as of December 31, 2002
Approved investment amount by Ministry of Economic Afairs R.O.C. Net worth × 40%
USD$6,090,000 USD$9,885,542 $1,696,130
b) Major transactions with the investee in Mainland China: i) Purchases (Note 1)
Purchase Accounts payable as of December 31, 2002 Name of investee in Mainland China Amount % of net purchases Amount % of net purchases
Jupiter Technology (Wuxi) Inc $450,206 21% $50,590 8%

ii) Sales (Note 2) Purchase Accounts payable as of December 31, 2002
Name of investee in Mainland China Amount % of net purchases Amount % of net purchases Jupiter Technology (Wuxi) Inc $445,997 12% $139,942 19%Wuxi Zeus Technology Inc. 1,340
iii) Property transaction
- 293 -
Note 1: Purchase transactions were conducted indirectly through Trusin Limited in Hong Kong. Note 2: Sales transactions were conducted indirectly through Trusin Limited in Hong Kong.
Microelectronics Technology , Inc. sold certain machinery and equipment to Jupiter Technology (Wuxi) Inc and Wuxi Zeus Technology Inc. through Trusin Limited.
Name of investee in Mainland China Selling price Gain on disposal Other receivableJupiter Technology (Wuxi) Inc $7,025 $ 184 $ 52 Wuxi Zeus Technology Inc. 784
625 20

To the Board of Directors and Shareholders of Microelectronics Technology, Inc. We have audited the accompanying consolidated balance sheets of Microelectronics Technology, Inc. (the Company) and its subsidiary, Sasson International Holdings Inc. (Sasson) as of December 31, 2000, 2001 and 2002, and the related consolidated statements of income, of changes in shareholders' equity and of cash flows for the years then ended, which are expressed in thousands of New Taiwan dollars. These financial statements are the responsibility of the Company’s management. Our responsibility is to express an opinion on these financial statements based on our audits. As described in Note 9 to the consolidated financial statements, certain long-term investments were accounted for under the equity method based on the investee company’s financial statements which were audited by other auditors. Our opinion in so far as it relates to the investment loss amounting to NT$25 million, NT$25 million and NT$27 million for the years ended December 31, 2000, 2001 and 2002, respectively, and the related long-term investment balances of NT$70 million, NT$209 million and NT$182 million as of December 31, 2000, 2001 and 2002, respectively, which were included in the financial statements, is based solely on the reports of the other auditors. We conducted our audits in accordance with the “Rules Governing the Examination of Financial Statements by Certified Public Accountants” and generally accepted auditing standards in the Republic of China. Those rules and standards require that we plan and perform the audit to obtain reasonable assurance about whether the financial statements are free of material misstatement. An audit includes examining, on a test basis, evidence supporting the amounts and disclosures in the financial statements, assessing the accounting principles used and significant estimates made by management, and evaluating the overall financial statements presentation. We believe that our audits provide a reasonable basis for our opinion. In our opinion, based on our audits and the reports of the other auditors, the consolidated financial statements referred to above present fairly, in all material respects, the financial position of Microelectronics Technology, Inc. and its subsidiary, Sasson International Holdings Inc. as of December 31, 2000, 2001 and 2002, and the results of their operations and their cash flows for the years then ended in conformity with generally accepted accounting principles and the “Rules Governing the Preparation of Financial Statements of Securities Issuers” in the Republic of China. As described in Note 1 to the consolidated financial statements, Jupiter Technology (Wuxi) Inc. is the 100% owned subsidiary of Sasson, with operating revenue of more than 10 percent of the Company’s non-consolidated operating revenue as of and for the year ended December 31, 2002. Accordingly, Jupiter Technology (Wuxi) Inc. was included in the consolidated entities for year 2002, and thus the 2000 and 2001 consolidated financial statements were restated for the change in the consolidated entities. February 12, 2003 ------------------------------------------------------------------------------------------------------------------------------ The accompanying consolidated financial statements are not intended to present the financial position and results of operations and cash flows of the Company and its subsidiary in accordance with accounting principles and practices generally accepted in countries and jurisdictions other than the Republic of China. The standards, procedures and practices in the Republic of China governing the audit of such consolidated financial statements may differ from those generally accepted in countries and jurisdictions other than the Republic of China. Accordingly, the accompanying financial statements and report of the independent accountants are not intended for use by those who are not informed about the accounting principles or auditing standards generally accepted in the Republic of China, and their applications in practice.
∼1∼

Corporate Directory
Patrick Wang Chairman Chi-Chia Hsieh Vice-Chairman Wesley Huang President Amy Ding Director, Executive VP and Chief Financial Officer
Location
Tel:886-3-577-3335 Fax: 886-3-577-7121
Tel: 408-954-0466 Fax: 408-954-0908
Directors and Executive Officers Lory Pike Director, Representative of Agilent Technologies Inc.
Bill Wurst Supervisor Wayne Chan Supervisor, Representative of Agilent Technologies Inc. Allen Yen Senior Vice President, Sales of Satcom and Mobile division Allen Chen Vice President, Sales of Microwave Radio division Jason Chang Vice President, R&D Ken Su Vice President, Manufacturing Victor Your President of Jupiter Technology (Wuxi) Co., Ltd. Paul Chao Vice President
Headquater Microelectronics Technology Inc. No.1, Innovation Road II Hsinchu Science Industrial Park, Taiwan
Manufacturing Sites Jupiter Technology (Wuxi) Co., Ltd. B15, Block 52, Wuxi State High & New Technology Industry Development Zone, Wuxi, Jiangsu Province, China Tel: 510-588-9890 Fax:510-522-9892 Optical Microwave Networks Inc. (OMNI) 130, Rose Orchard Way, San Jose, CA95134, USA
∼2∼