Microeconomics Business Operations. Warm Up What is microeconomics?
Upload
kenneth-merrittCategory
view
215download
1
MICROECONOMICS
Unit 2

Microeconomics: is the area of economics that deals with behavior and decision making by small units, such as individuals and businesses.
Examples include looking at individual businesses, a particular industry or how prices are established.

Which of the following is an example of amicroeconomic decision? A whether to increase or decrease the money supply B whether to increase or decrease taxes C how to reduce the unemployment rate D how many hours an employee should work each week

What is the unit of study in microeconomics? A. imports and exports B. inflation and recession C. individual businesses and households D. national consumption and expenditures

Circular Flow Model: a model that illustrates the flow of economic activity(buying & selling) between households and firms.

Market: is a location or mechanism that allows buyers and sellers to exchange goods and services. Markets can be local, regional, or global in scope.

1.Product Market: a market where firms supply/sell goods and services to consumers. Firms supply goods and services while households demand/buy goods and services.
2.Resource/Factor Market: a market where resources are bought and sold. Households supply/sell their resources to firms while firms demand/buy resources from households.

When households sell resources they receive income in return.
Land– rental incomeLabor– wages or salary
incomeCapital– interest incomeEntrepreneur– profit income
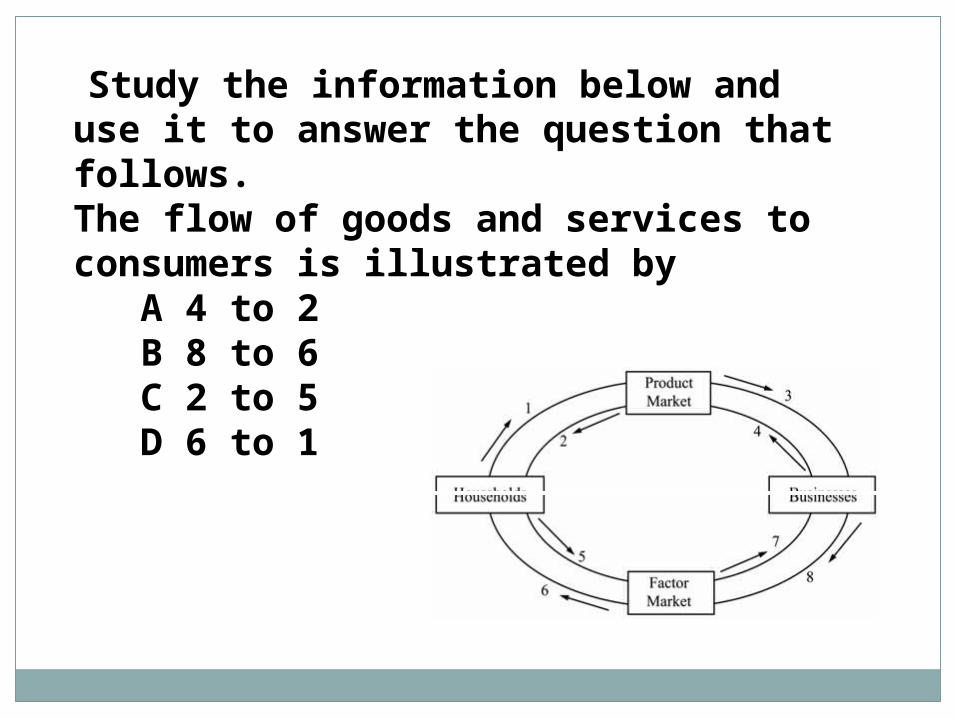
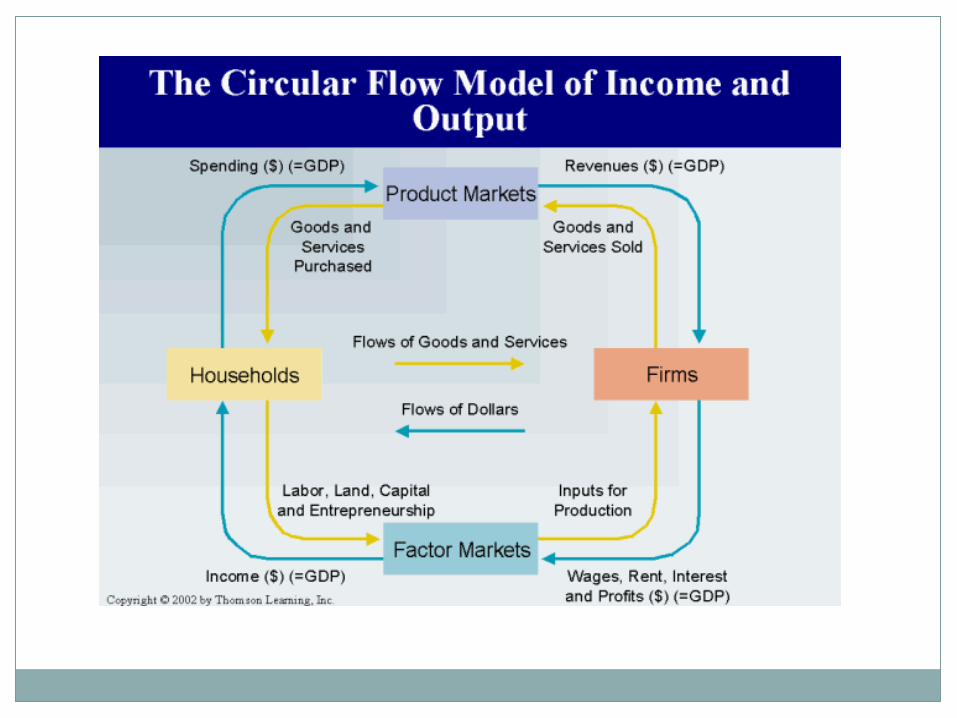
Study the information below and use it to answer the question that follows.The flow of goods and services toconsumers is illustrated by A 4 to 2 B 8 to 6 C 2 to 5 D 6 to 1

The payments for land, labor, capital, and entrepreneurial ability respectively are A. rent, profit, wages, and interest B. profits, wages, interest, and rent C. rent, wages, interest, and profit D. wages, rent, profit, and interest

All the buying and selling that take place in the circular flow model requires money to help facilitate exchange.
Barter: a moneyless economy that relies on trading goods for goods or goods for services. This is not very efficient.


There are 3 main functions of money.
1.Medium of exchange: something accepted by all parties as payment for goods and services. This is the most basic function, it must be accepted.
2.Measure of Value: a common denominator that can be used to express worth in terms that most people can understand.
3.Store of Value: allows purchasing power to be saved until needed in the future.

On the island of Yap, large circular stones are used for money. The main reason why this type of money serves its function as a medium of exchange is because it is A very portable B highly divisible C accepted as payment D prized in foreign transactions

Commodity Money: money that has an alternative use as an economic good, or commodity.

Fiat Money: Money by government decree. The money we carry is fiat money.

Specie: money in the form of coins made from silver or gold.

Characteristics of Money
1.Portable
2.Durable
3.Divisible
4.Limited in Supply

Demand: is the desire and ability of consumers to buy a good or service.
Desire without ability does not constitute demand.

Porshe– I have the desire but not the ability to buy one.
McDonalds Happy Meal– I have the ability but not the desire.

Demand Schedule: is a table or schedule that shows the various quantities demanded by consumers of a good at all prices that might prevail in the market at a given time.

Market Demand Curve
3.00
2.50
2.00
1.50
1.00
.50
0
0 50 100 150 200 250 300 350Slices of pizza per day
Pri
ce p
er s
lic
e (i
n d
oll
ars)
Demand
The Demand Curve A demand curve is a
graphical representation of a demand schedule.
When reading a demand curve, assume all outside factors, such as income, are held constant.

Figure 4.1The Demand for Compact DiscsFigure 4.1The Demand for Compact Discs
Figure 4.1The Demand for Compact DiscsFigure 4.1The Demand for Compact Discs

Figure 4.2Individual and Market Demand CurvesFigure 4.2Individual and Market Demand Curves

When economists refer to “demand,” they mean which of the following? A how much satisfaction buyers receive from a purchase B how much consumers will purchase at different prices C how much sellers will supply at a particular price D how much people want the product if it is free

Demand Curve: is the graphical picture of the demand schedule. It contains the same information, but in a different format.

Law of Demand: states that the quantity demanded of a good or service varies inversely with its price.
Inversely means opposite.
When price goes up, the quantity demanded goes down.
When price goes down, the quantity demanded goes up.

Change in Quantity Demanded: this is a movement along the demand curve and shows a change in the quantity purchased in response to a change in price. This is simply a restatement of the law of demand.

Figure 4.3A Change in Quantity DemandedFigure 4.3A Change in Quantity Demanded

Change in Demand: occurs when people are now willing to buy different amounts of the product at the same prices as before. This is shown as a shift in the curve, not a movement along the curve.

Let’s look at figure 4.4, pg. 98 in the text.
Increase in demand– rightward shift
Decrease in demand– leftward shift

Figure 4.4A Change in DemandFigure 4.4A Change in Demand

There are 6 factors that can shift the demand curve to the right or left. These factors have nothing to do with the price of the product.
They include:

1.Consumer Income: An increase in income allows consumers to buy more of most goods and services, so the curve shifts right. A decrease in income would cause a decrease in demand and therefore a leftward shift of the curve.
2.Tastes & Preferences: this reflects our likes and dislikes. Advertising, news reports, fashion trends, seasonal changes, and other things can affect our tastes.

3. Substitutes: are products that can be used in place of other products. When the price of 1 good goes up, the demand for the substitute will also go up, and vice versa.

4. Complements: are products that are used together. When the price of 1 good goes up, the demand for the complement will go down, and vice versa.

5. Change in Expectations: demand may change because of the expectation of some future event. If I expect prices to rise in a few weeks, I might buy more now. If I think I might lose my job soon, I’ll begin to spend less now.

6. Number of Buyers: more buyers in the market will lead to an increase in demand. Fewer buyers will lead to a decrease in demand.
Some things that might affect number of buyers are:
Population changes Immigration trends Medical advancements Trade Agreements like NAFTA

Which of the following is an attempt by afirm to increase the demand for itsproduct? A the imposition of a price ceiling on the product B an advertising strategy designed to change consumer tastes and preferences C a marketing strategy to make the good scarce and therefore more expensive D a production strategy to flood the market with the good or service

Which of the following is an attempt by afirm to increase the demand for itsproduct?
B. an advertising strategy designed to change consumer tastes and preferences

When there is __________________ the entire demand curve shifts, to
the right to show an increase in
demand or to the left to show a decrease in demand. A. change in quantity demanded
B. change in demand C. change is quantity supplied D. change in supply

When there is __________________ the entire demand curve shifts, to
the right to show an increase in
demand or to the left to show a decrease in demand.
B. change in demand

Demand Elasticity: the extent to which a change in price causes a change in the quantity demanded.
Elasticity = Responsiveness
In essence, we want to know how much the quantity changes in response to a change in price.
There are 3 ranges of elasticity

1. Elastic Demand: when a given change in price causes a relatively larger change in the quantity demanded. See figure 4.5, pg. 103.

Figure 4.5The Total Expenditures Test for Demand ElasticityFigure 4.5The Total Expenditures Test for Demand Elasticity

2. Inelastic Demand: when a given change in price causes a relatively smaller change in the quantity demanded.

3. Unit Elastic Demand: when a given change in price causes a proportional change in the quantity demanded.
Determinants of Demand Elasticity– figure 4.6, pg. 106
These are 3 general questions to ask yourself.

Figure 4.6Estimating the Elasticity of DemandFigure 4.6Estimating the Elasticity of Demand

1. Can the purchase be delayed?
yes-- elastic no-- inelastic
Fresh vegetables orInsulin

2. Are adequate substitutes available? yes– elastic no-- inelastic
Gasoline orButter

3. Does the purchase use a large portion of income? yes– elastic no-- inelastic
New car or Plastic bags

What does it mean when the demand for a product is inelastic? A. a price increase does have a significant impact on buying habits B. people will not buy any of the product when price goes up C. there are very few satisfactory substitutes for the product D. customers are very sensitive to the price of the product

The other side of demand is supply. This represents producers or firms that use resources to make goods and services. Producers attempt to maximize profits by selling what consumers want and by producing as efficiently as possible.
Supply: the amount of a product that firms are willing to offer for sale at all possible prices that might prevail in the market.

Supply Schedule: a table or schedule that shows the various quantities supplied of a product at all prices that might prevail in the market at a given time.

Supply Curve: the graphical representation of the supply schedule. It contains the same information as the schedule but in a different format.

Law of Supply: states that the price and the quantity supplied are directly related to each other. Direct means both variables move together. As price increases, so does quantity supplied. As price decreases, so does quantity supplied.

The resulting supply curve is upward sloping. The reason is that we assume costs increase as output increases.
Ex. Low hanging fruit

Change in Quantity Supplied: is a movement along the supply curve showing a change in the quantity of product supplied in response to a change in price. This is simply a restatement of the law of supply.

Change in Supply: when firms are now willing to offer different amounts of the product for sale at the same prices as before. This is shown as a shift in the curve, not a movement along the curve.

Let’s look at figure 5.3, pg. 117.
Increase in supply– rightward shift
Decrease in supply– leftward shift

Figure 5.3Figure 5.3

There are 7 factors that can shift the supply curve to the right or left. These factors have nothing to do with the price of the product.
They include:
1.Cost of Inputs/Resources: When a firm pays less for its land, labor, or raw materials, it is willing to supply more now. The reason is that the firm is making more profits as their costs fall. If the cost of resources increases, the firm will supply less.

2. Productivity: When workers are more efficient they can produce more. The result is that costs fall, so firms are willing to supply more than before. When workers are not as productive, costs rise and the firm is not as willing to supply.

3. Technology: the introduction of a new machine or process will lower the firm’s costs and will result in an increase in supply. Think about flat screen tv’s and computers. What has happened to their costs over the last several years?

4. Taxes: firms view taxes as an increase in their costs and therefore supply will fall. Taxes will always shift the supply curve to the left.

5. Subsidies: are the opposite of a tax. In this case the government gives money to firms to encourage or protect a certain type of economic activity. Subsidies lower costs and increase supply.

6. Government Regulations: when the government regulates a firm’s product, costs rise and supply falls. Ask yourself how much more expensive it is to comply with federal standards on exhaust emissions on cars. More regulation means less supply. Less regulation means more supply.
7. Number of Sellers: more firm’s leads to more supply, fewer firms leads to less supply.

The factor that would cause the supply curve to shift to the
left is A. higher taxes B. a decrease in the cost of inputs C. an increase in
government subsidies D. all of the above

The factor that would cause the supply curve to shift to the
left is
A. higher taxes

The factor that would cause the supply curve to shift to the right is A. higher taxes B. an increase in the cost of inputs C. a decrease in government subsidies D. none of the above

The factor that would cause the supply curve to shift to the right is
D. none of the above

Supply Elasticity is the same concept as demand elasticity. See figure 5.4, pg. 119.
1.Elastic Supply: when a given change in price causes a relatively larger change in quantity supplied.
2.Inelastic Supply: when a given change in price causes a relatively smaller change in quantity supplied.
3.Unit Elastic Supply: when a given change in price causes a proportional change in quantity supplied.

Figure 5.4aFigure 5.4a

Figure 5.4bFigure 5.4b

Figure 5.4cFigure 5.4c

Figure 5.4dFigure 5.4d

Price: is the monetary value of a product or service and is established by supply and demand.

Prices act as signals that help us make our economic decisions. Prices communicate information and provide incentives to buyers and sellers.

For example:
High Price– firms want to produce more consumer want to buy less
Low Price– firms want to produce less consumers want to buy more

Prices act as signals in the market because A prices indicate to sellers the types of goods and services to offer for sale B prices can determine dividends for businesses C high prices for goods and services signal a healthy economy D entrepreneurs become motivated as prices rise

Prices act as signals in the market because
A. prices indicate to sellers the types of goods and services to offer for sale

How would society allocate goods /services and resources without a system of prices? One possible method could be rationing.
Rationing: is a system under which an agency such as government decides everyone’s fair share.

3 problems of rationing include:
FairnessAdministrative costsDiminished incentives

Rebate: a partial refund of the original price of the product.

We now want to bring supply and demand together to determine how prices are established in a market economy.
It is a process of trial and error.

Market Equilibrium: is a situation in which prices are relatively stable and the quantity supplied is equal to the quantity demanded. See figure 6.1, pg. 143 and figure 6.2, pg. 145.

Figure 6.1aFigure 6.1a
Figure 6.1bFigure 6.1b

Price Quantity Supplied Quantity Demanded $1.50 200 800 $2.00 300 700 $2.50 400 600 $3.00 500 500 $3.50 600 400 $4.00 700 300
The demand schedule above shows quantity supplied and quantity demanded data for a given product. In a market economy what price will this product most likely sell for? A. $1.50 B. $2.50 C. $3.00 D. $4.00
Using the above schedule what is the quantity demanded at $1.50? A. 800 B. 600 C. 400 D. 200

Surplus: when the quantity supplied is greater that the quantity demanded at a given price. The result of the surplus is that price will fall. ( Qs > Qd )

At a given price, a surplus occurs when A. the quantity supplied is greater than the quantity demanded. B. the quantity demanded is more than the quantity supplied. C. the quantity demanded is the same as the quantity supplied. D. Thompson says it occurs.

Shortage: when the quantity demanded is greater that the quantity supplied at a given price. The result of the shortage is that price will rise. ( Qd > Qs )

Equilibrium Price: the price that clears the market by leaving neither a surplus nor a shortage. ( Qs = Qd )

Equilibrium price will do what? A. clear the market B. result in a surplus C. result in a shortage D. will always be found for every product produced

Sometimes society may have to sacrifice some efficiency and freedom in order to achieve greater equity and security. Think back to the economic and social goals in unit 1.

One common way to achieve more equity or security for certain groups of people is for the government to set prices at the socially desirable level. When this happens, prices are not allowed to adjust to reach equilibrium.
2 examples include:
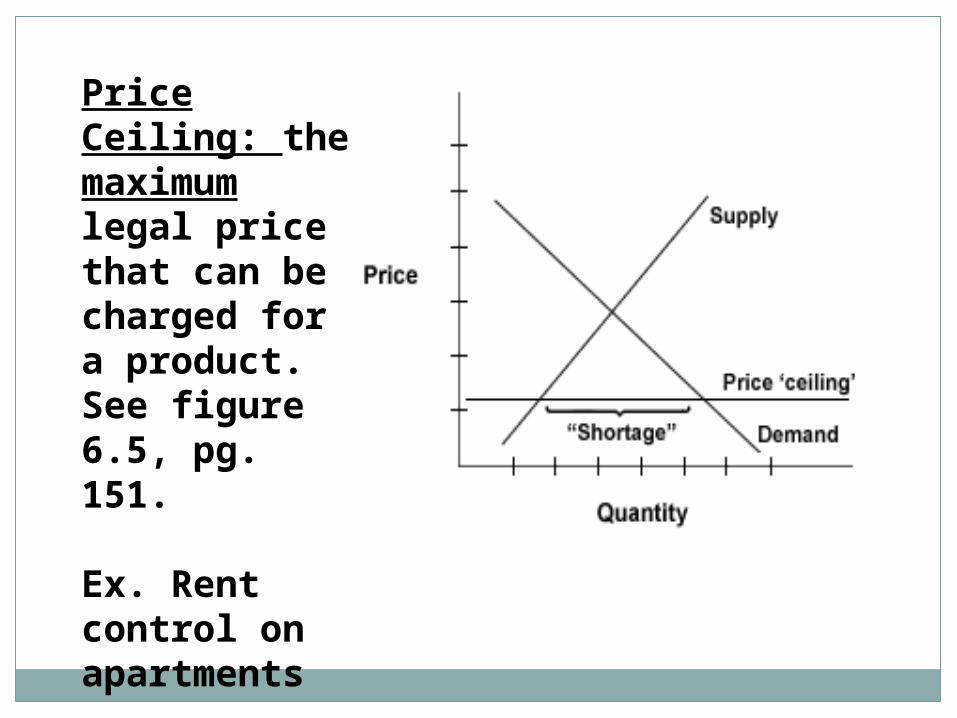
Price Ceiling: the maximum legal price that can be charged for a product. See figure 6.5, pg. 151.
Ex. Rent control on apartments

Price Floor: the lowest legal price that can be charged for a product. See figure 6.5, pg. 151.Ex. Minimum wage Farm products

The minimum wage is a type of A. price floor B. comparable worth C. price ceiling D. marginal price

What happens when wages are set above the equilibrium level by law? A. firms employ more workers than they would at the equilibrium wage B. firms employ fewer workers than they would at the equilibrium wage C. firms tend to try to break the law and hire people at the equilibrium level D. firms hire more workers but for fewer hours than they would at the equilibrium wage

What does the horizontal dashed line on the chart above best represent?
A) supply B) demand C) price floor D) price ceiling

Legal Forms of Business - shows the 3 main ways businesses are set up.
To compare advantages and disadvantages of each form of business, look at Chapter 8 pg. 184


1. Sole Proprietorship: A business owned and operated by 1 person. It is the most common form of business numerically.

2. Partnership: a business jointly owned by 2 or more people. 2 types include:
General– all partners are responsible for the management and financial obligations of the business.
Limited– at least 1 partner is not active in the daily operation of the business although they may have contributed funds to finance the operation.

3. Corporation: is recognized by law as a separate legal entity having all the rights of an individual.

Important aspects of corporations include:
Charter: a government document giving permission to create a corporation.
• Corporation’s name• Its purpose• Number of shares to be issued• Names of parties who started it

Figure 3.3Ownership, Control, and Organization of a Typical CorporationFigure 3.3Ownership, Control, and Organization of a Typical Corporation
Stock: ownership certificates in a corporation. Investors buy shares of stock in hopes of making a profit by selling the stock for more than they paid for them.

Figure 3.2Stock OwnershipFigure 3.2Stock Ownership

Stockholders/Shareholders: investors who buy shares of stock.
Dividends: a check representing a portion of the corporations profits paid back to the stockholders each quarter. This is another way investors make money in the stock market.
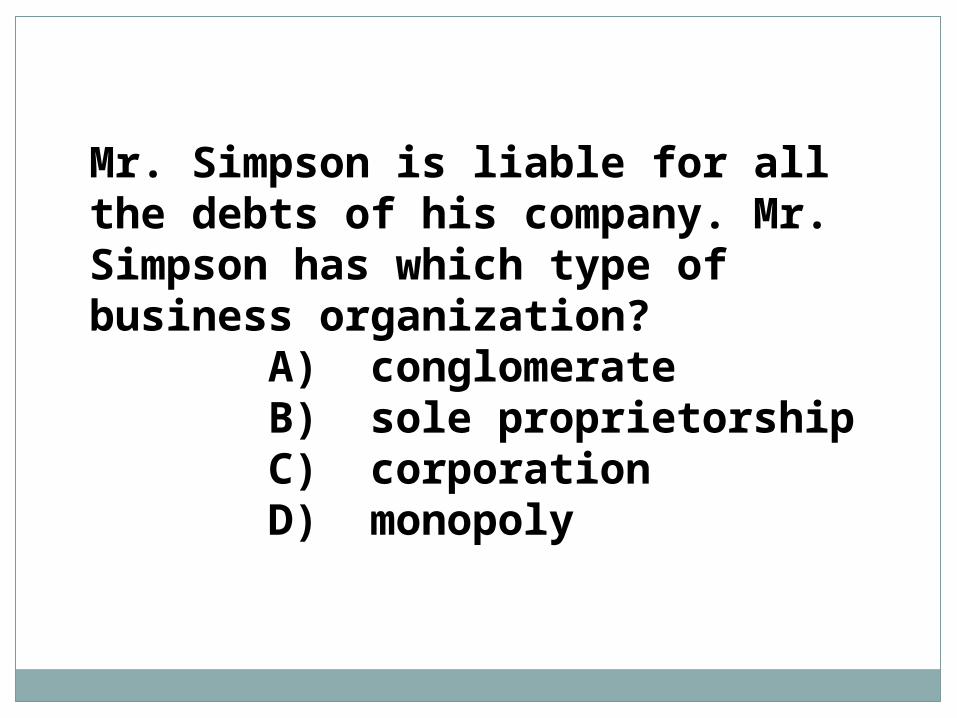
Mr. Simpson is liable for all the debts of his company. Mr. Simpson has which type of business organization? A) conglomerate
B) sole proprietorship C) corporation D) monopoly

Greg has financed Betty’s future sewing business. Which of the following best describes this type of business they have established? A) proprietorship B) general partnership C) limited partnership D) corporation

Profit Motive: this is the driving force that encourages people and organizations to improve their material well-being. Entrepreneurs start businesses to make the greatest amount of profit possible.
Total revenue >Total cost – profits
Total revenue < Total cost– losses
Total revenue = Total costs-- breakeven
Market Structure: represents the nature and degree of competition among firms operating in the same industry.
An industry represents all firms in the same market like airlines or cars.

We will examine 4 types of market structures by looking at their characteristics. Figure 7.2, pg 169.


1.Perfect Competition
o Large numbers of buyers and sellers, 100’s to 1000’s.
o Have no control over price.o Buyers and sellers deal in an
identical product.o Buyers and sellers are free to enter
or leave the market when they choose.
o Do not need to advertise.
The best examples include certain types of farming.


2. Monopolistic Competition
• Large number of buyers and sellers, 20 to 70.
• Have a little bit of control over price.• Buyers and sellers deal in a differentiated
product.• Buyers and sellers are free to enter or
leave the market.• There is a lot of advertising by firms.
Examples include gas stations and drycleaners.

Product Differentiation: the real or imagined differences between competing products in the same industry. Examples include:
• Store location• Store design• Manner of payment• Delivery options• Packaging• Service• Store merchandising

Non-price competition: the use of advertising, promotions or giveaways to convince buyers that their product is better than another brand.

3. Oligopoly
• Few firms, 3 to 12.• Some control over price with collusion.
• The product can be identical or differentiated.
• It is very difficult for firms to enter this market.
• There is a lot of advertising by firms.
Examples include airlines, automobiles and steel.

Interdependent behavior: whenever one firm acts, it must consider how the other firms will respond.Ex. Raise price– ignore Lower price– lower
Collusion: a formal agreement to set prices or behave in a cooperative manner to increase profits. A good example is OPEC. This behavior is illegal in the U.S.
Price-fixing: agreeing to charge the same or similar price for a product.

4. Monopoly
• A single firm, 1.• Almost complete control over price.• The product is unique with no close substitutes.
• It is almost impossible to enter this market.
• No advertising is needed unless it is for public relations reasons.
Best example would be the local power company or water company.

Types of monopolies
Natural Monopoly: when the costs of production are minimized by having a single firm produce the good. This is called economies of scale.
Geographic Monopoly: a single firm by virtue of its location such as a country store.

Technological Monopoly: a monopoly based on the ownership or control of a manufacturing method, process, or other scientific advance such as a patent or copyright.
Government Monopoly: a monopoly that the government owns and runs like the postal service, the city water company, or the TVA.

What is monopolistic competition? A. a very few companies selling identical products B. many companies selling similar but not identical products C. one company selling the identical product under different names D. one company selling several different products under different names

What is monopolistic competition?
B. many companies selling similar but not identical products

In which market structure are businesses most interdependent? A. oligopoly B. monopoly C. pure competition D. monopolistic competition

In which market structure are businesses most interdependent?
A. oligopoly

Public utility companies,(electric company) are examples of A. natural monopolies B. cartels C.technological monopolies D. subsidized monopolies

A. natural monopolies
Public utility companies,(electric company) are examples of

A new firm will find it impossible to enter a market dominated by A. a monopoly B. pure competition C. monopolistic competition D. an oligopoly

A new firm will find it impossible to enter a market dominated by
A. a monopoly

Sometimes markets fail because of inadequate competition, inadequate information, resource immobility, externalities and public goods.
We will focus on 2 types of market failures.

1.Externalities: a cost or benefit that accrues to a 3rd party not involved in the transaction.
Look at the photo on pg. 175.

Negative– noise, air or water pollution.

Positive– education or immunizations

2. Public Goods: goods or services that are collectively consumed by everyone, and whose use by 1 person does not diminish the satisfaction or value available to others. Public goods are not excludable and non rival.
Excludability- refers to the idea that a person can be prevented from using a product they don’t pay for.
Rivalry- refers to the idea where one person’s use of a product will diminish other people’s use of the same product.
Free rider- refers to a person who receives the benefit of a good without paying for it.

Private goodsIce-cream conesClothing cars
Public goodsTornado sirensNational defenseFlood control programs
The left column is rival and excludable, and the right column is non-rival and non-excludable.


In the U.S., how are public goods paid for? A. Private firms collect fees from their employees. B. Non-profit organizations collect charitable donations from people. C. The government collects tax revenues from individuals and firms. D. Corporations make profits from selling goods and services.

In the U.S., how are public goods paid for?
C. The government collects tax revenues from individuals and firms.