Microeconomic factors influencing housing tenure choice Differences between European countries...
25
Microeconomic factors influencing housing tenure choice Differences between European countries Analysis based on CHER database (Consortium of Household Panels for European Socio- Economic Research) Monika Bazyl Warsaw School of Economics
-
Upload
scot-stafford -
Category
Documents
-
view
230 -
download
2
Transcript of Microeconomic factors influencing housing tenure choice Differences between European countries...
Microeconomic factors influencing housing tenure choice
Differences between European countries
Analysis based on CHER database(Consortium of Household Panels for European Socio-Economic Research)
Monika Bazyl Warsaw School of Economics

2
Different proportions of owners and tenants
Source: CHER 2000, HBS 2006
Poland 200
6
81%
3
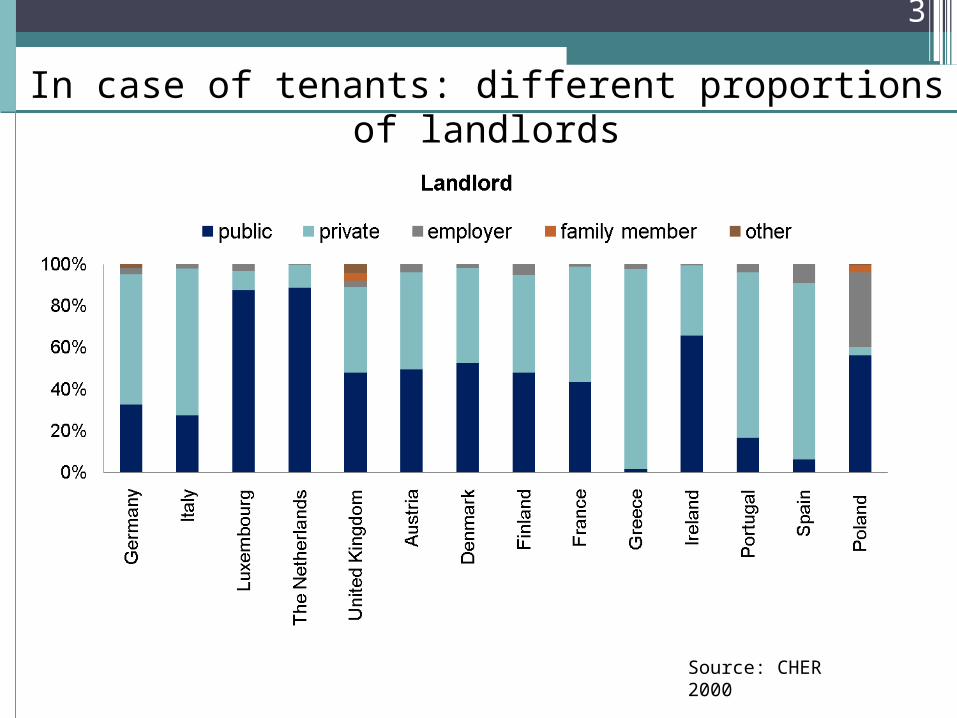
In case of tenants: different proportions of landlords
Source: CHER 2000

4
Data used for analysis
CHER micro database
• Consortium of Household Panels for European Socio-Economic Research
• Established in 2000
• 7 National Panels + ECHP dataset (18 countries)
• Designed for comparative research
• Project funded by European Commission
HBS 2006 (Household Budget Survey)
• Carried out by Central Statistical Office

5
Literature
Wide literature on impact of different factors on housing tenure choice;
may be classified according to a subset of factors studied:
• Households’ status (socio-economic, race, marital etc)• Previous dwelling (characteristics)• Housing market circumstances (price, mortgage interest etc.)
(W. A. V. Clark, M. C. Deurloo and F. M. Dieleman, Entry to Home-ownership in Germany: Some Comparisons with the United States, Urban Studies, Vol. 34, No. 1, 7± 19, 1997)
• Psychological factors(Danny Ben-Shahar, Tenure Choice in the Housing Market: Psychological
Versus Economic Factors, Environment and Behavior 2007; 39; 841)
• Location (Iwarere, L.J, Williams, J.E., A Micro-Market Analysis of Tenure Choice
Using The Logit Model, The Journal of Real Estate Research, 1991)
6
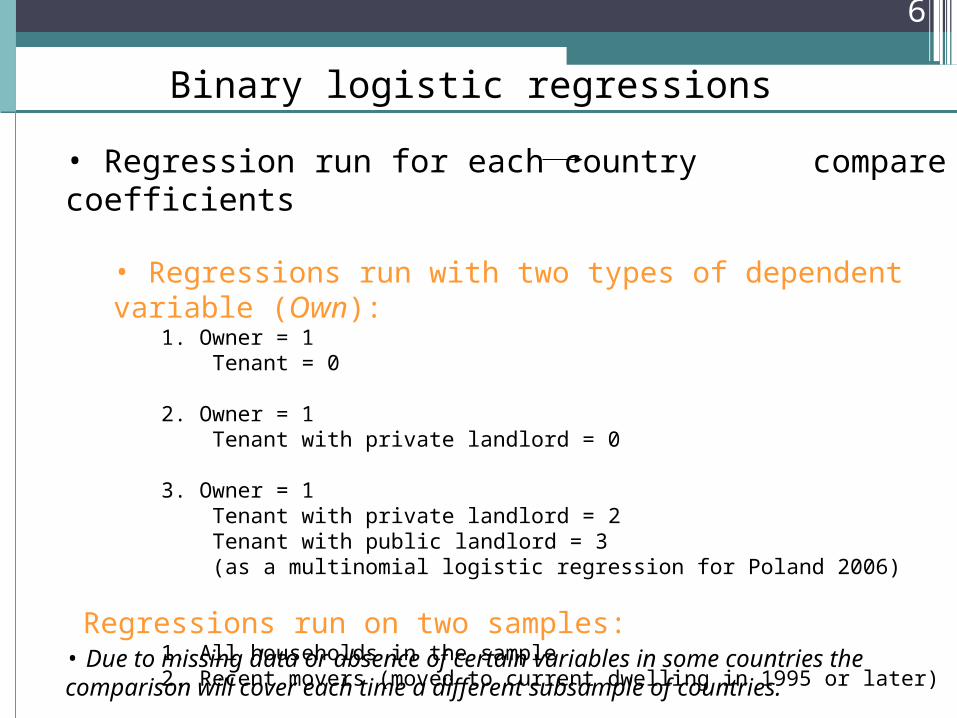
Binary logistic regressions
• Regression run for each country compare coefficients
• Regressions run with two types of dependent variable (Own):1. Owner = 1 Tenant = 0
2. Owner = 1 Tenant with private landlord = 0
3. Owner = 1 Tenant with private landlord = 2 Tenant with public landlord = 3 (as a multinomial logistic regression for Poland 2006)
Regressions run on two samples:1. All households in the sample2. Recent movers (moved to current dwelling in 1995 or later)
• Due to missing data or absence of certain variables in some countries the comparison will cover each time a different subsample of countries.

7
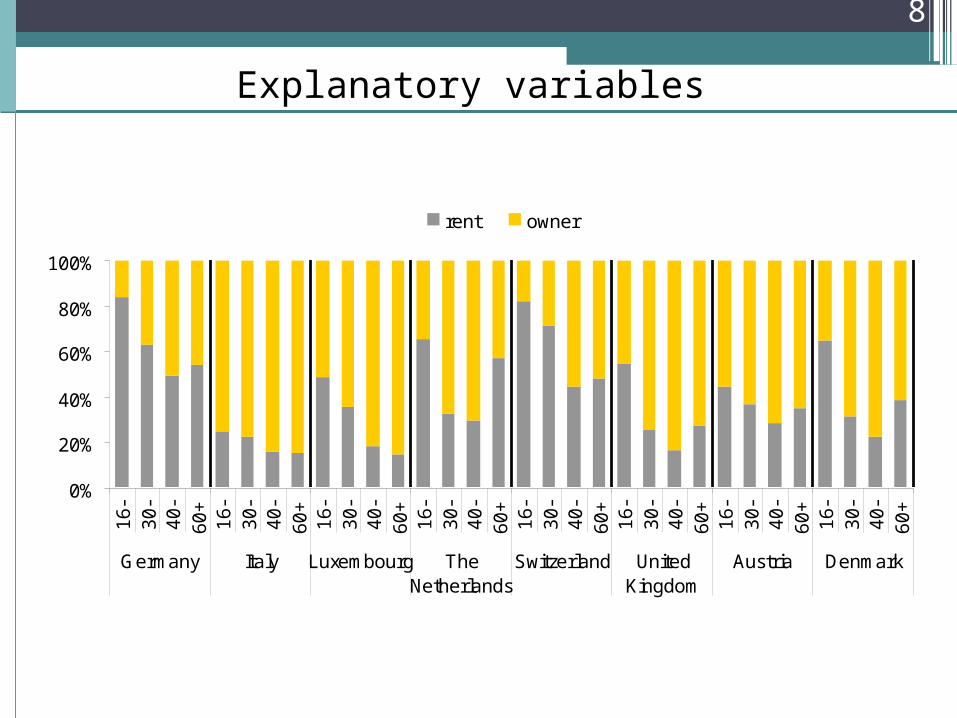
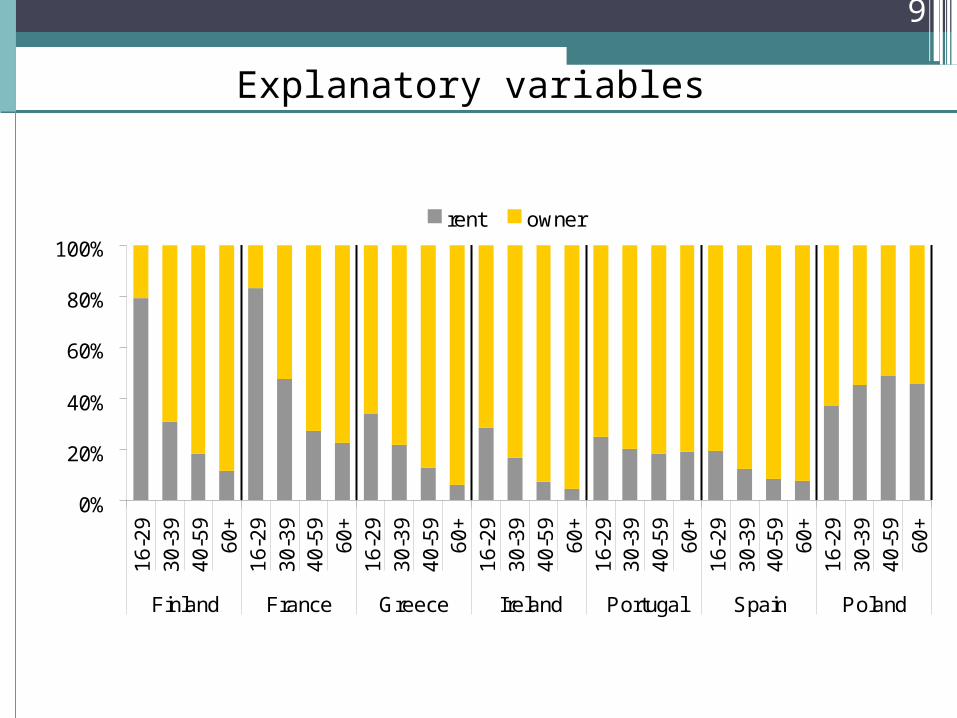
Explanatory variables
Log = β0 + β1X1 + … + βkXk Prob(Own)
1-Prob(Own)
• Demographic:
• Age of the household’s breadwinner (in four subgroups 16-29, 30-39, 40-59 and 60 plus)
+ Ownership rate should increase with age
Variables Expected influence
Cross – sectional analysis:
8
Explanatory variables
0%
20%
40%
60%
80%
100%
16
-3
0-
40
-6
0+
16
-3
0-
40
-6
0+
16
-3
0-
40
-6
0+
16
-3
0-
40
-6
0+
16
-3
0-
40
-6
0+
16
-3
0-
40
-6
0+
16
-3
0-
40
-6
0+
16
-3
0-
40
-6
0+
Germany Italy Luxembourg TheNetherlands
Switzerland UnitedKingdom
Austria Denmark
rent owner
9
Explanatory variables
0%
20%
40%
60%
80%
100%
16
-29
30
-39
40
-59
60
+1
6-2
93
0-3
94
0-5
96
0+
16
-29
30
-39
40
-59
60
+1
6-2
93
0-3
94
0-5
96
0+
16
-29
30
-39
40
-59
60
+1
6-2
93
0-3
94
0-5
96
0+
16
-29
30
-39
40
-59
60
+
Finland France Greece Ireland Portugal Spain Poland
rent owner
10
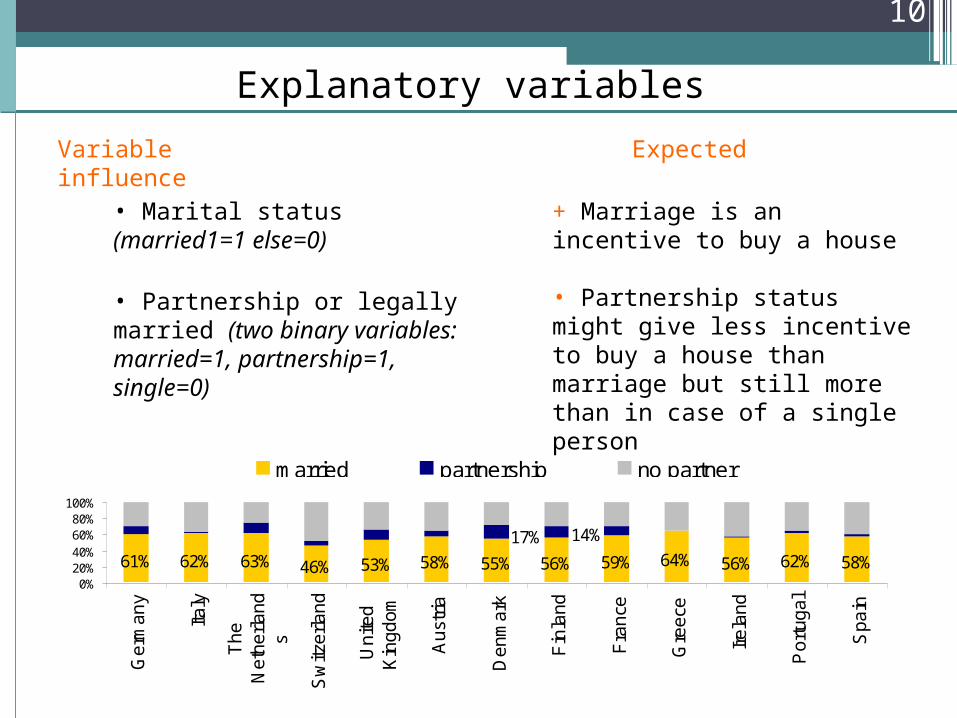
Explanatory variables
• Marital status (married1=1 else=0)
• Partnership or legally married (two binary variables: married=1, partnership=1, single=0)
+ Marriage is an incentive to buy a house
• Partnership status might give less incentive to buy a house than marriage but still more than in case of a single person
Variable Expected influence
61% 62% 63% 46% 53% 58% 55% 56% 59% 64% 56% 62% 58%
17% 14%
0%20%40%60%80%
100%
Ge
rma
ny
Italy
Th
eN
eth
erl
an
ds
Sw
itze
rla
nd
Un
ited
Kin
gd
om
Au
stri
a
De
nm
ark
Fin
lan
d
Fra
nce
Gre
ece
Ire
lan
d
Po
rtu
ga
l
Sp
ain
married partnership no partner
11
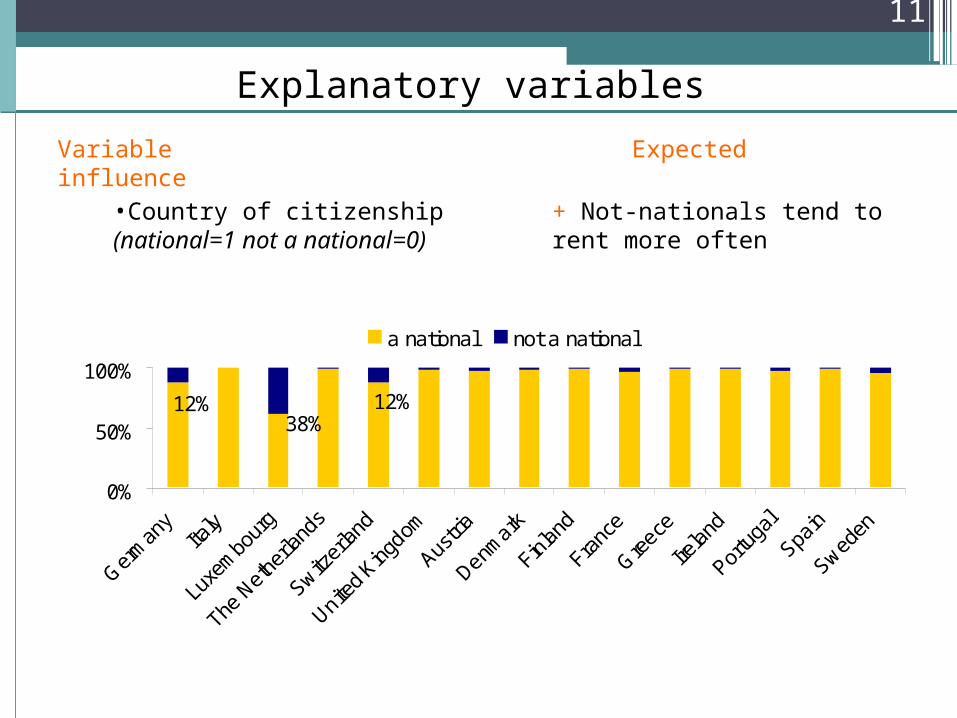
Explanatory variables
Variable Expected influence
•Country of citizenship (national=1 not a national=0)
+ Not-nationals tend to rent more often
12%38%
12%
0%
50%
100%
Ger
man
yIta
ly
Luxe
mbo
urg
The N
ether
land
s
Switzer
land
United
Kingdom
Austri
a
Denmark
Finlan
d
Franc
e
Gre
ece
Irela
nd
Portu
gal
Spain
Sweden
a national not a national
12
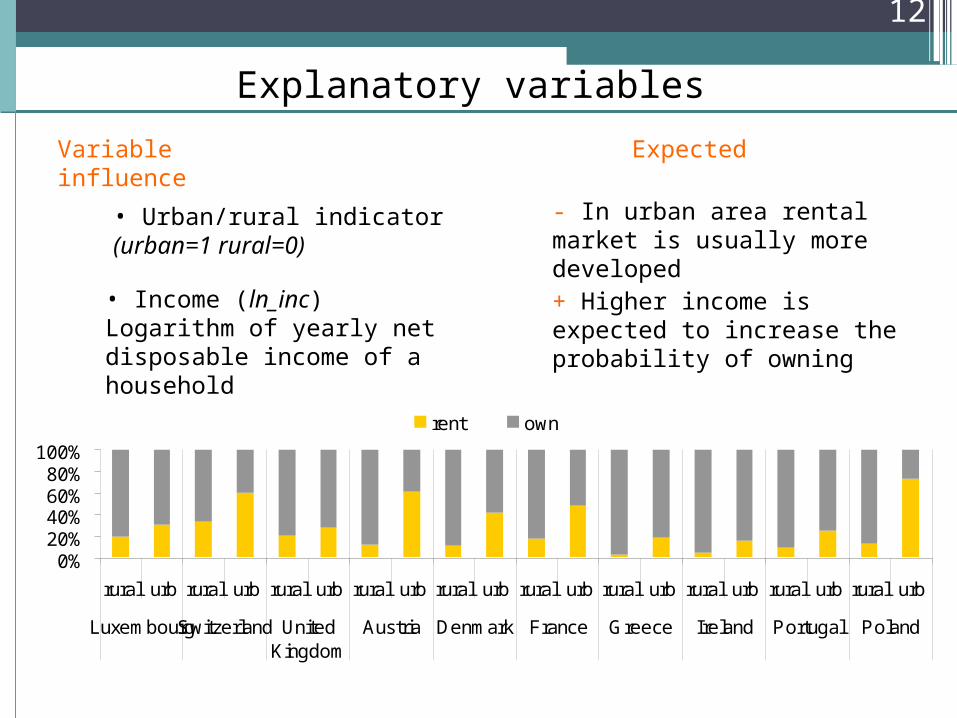
Explanatory variables
Variable Expected influence
• Urban/rural indicator (urban=1 rural=0)
- In urban area rental market is usually more developed
• Income (ln_inc)Logarithm of yearly net disposable income of a household
+ Higher income is expected to increase the probability of owning
0%20%40%60%80%
100%
rural urb rural urb rural urb rural urb rural urb rural urb rural urb rural urb rural urb rural urb
LuxembourgSwitzerland UnitedKingdom
Austria Denmark France Greece Ireland Portugal Poland
rent own

13
Explanatory variables
• Housing quality
• Number of rooms per person in previous dwelling
• Difference between income burden in current and previous dwelling (rent to income or mortgage payment to income ratio)
Variable Expected influence
- Worse conditions in previous dwelling (room stress) should encourage to change from rental accomodation to own a house
• Households should seek to lower burden on their income, on the other hand they might be ready to decide to increase the burden if only it will give them a possibility to own a dwelling
14
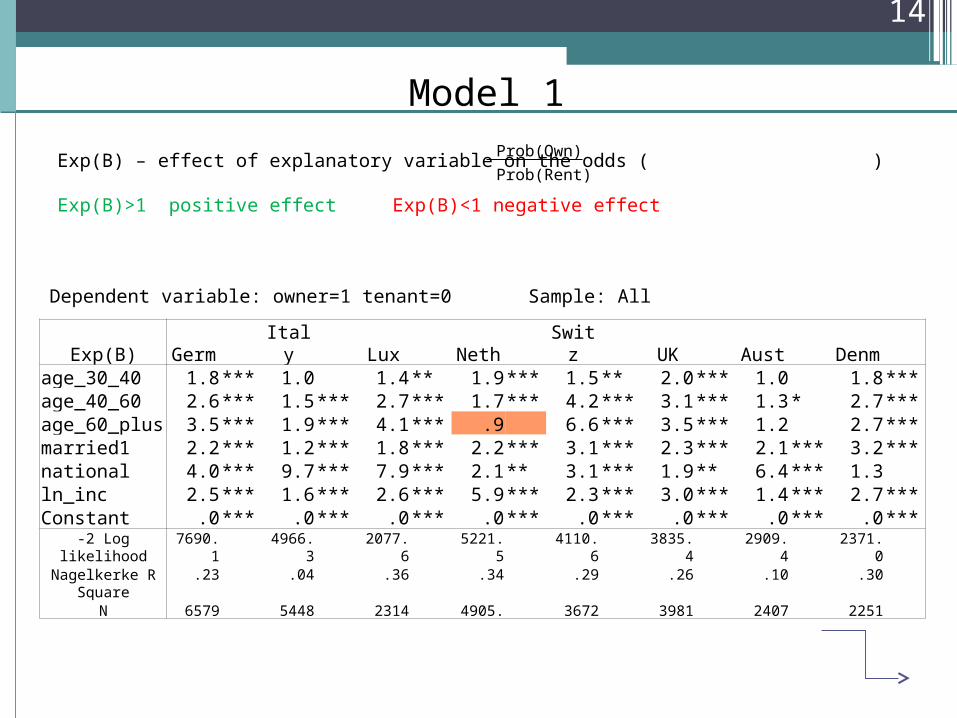
Exp(B) – effect of explanatory variable on the odds ( )
Exp(B)>1 positive effect Exp(B)<1 negative effect
Prob(Own)
Prob(Rent)
Dependent variable: owner=1 tenant=0 Sample: All
Exp(B) Germ Italy Lux Neth Switz UK Aust Denm age_30_40 1.8*** 1.0 1.4** 1.9*** 1.5** 2.0*** 1.0 1.8***age_40_60 2.6*** 1.5*** 2.7*** 1.7*** 4.2*** 3.1*** 1.3* 2.7***age_60_plus 3.5*** 1.9*** 4.1*** .9 6.6*** 3.5*** 1.2 2.7***married1 2.2*** 1.2*** 1.8*** 2.2*** 3.1*** 2.3*** 2.1*** 3.2***national 4.0*** 9.7*** 7.9*** 2.1** 3.1*** 1.9** 6.4*** 1.3 ln_inc 2.5*** 1.6*** 2.6*** 5.9*** 2.3*** 3.0*** 1.4*** 2.7***Constant .0*** .0*** .0*** .0*** .0*** .0*** .0*** .0***
-2 Log likelihood 7690.1 4966.3 2077.6 5221.5 4110.6 3835.4 2909.4 2371.0
Nagelkerke R Square
.23 .04 .36 .34 .29 .26 .10 .30
N 6579 5448 2314 4905. 3672 3981 2407 2251
Model 1
15
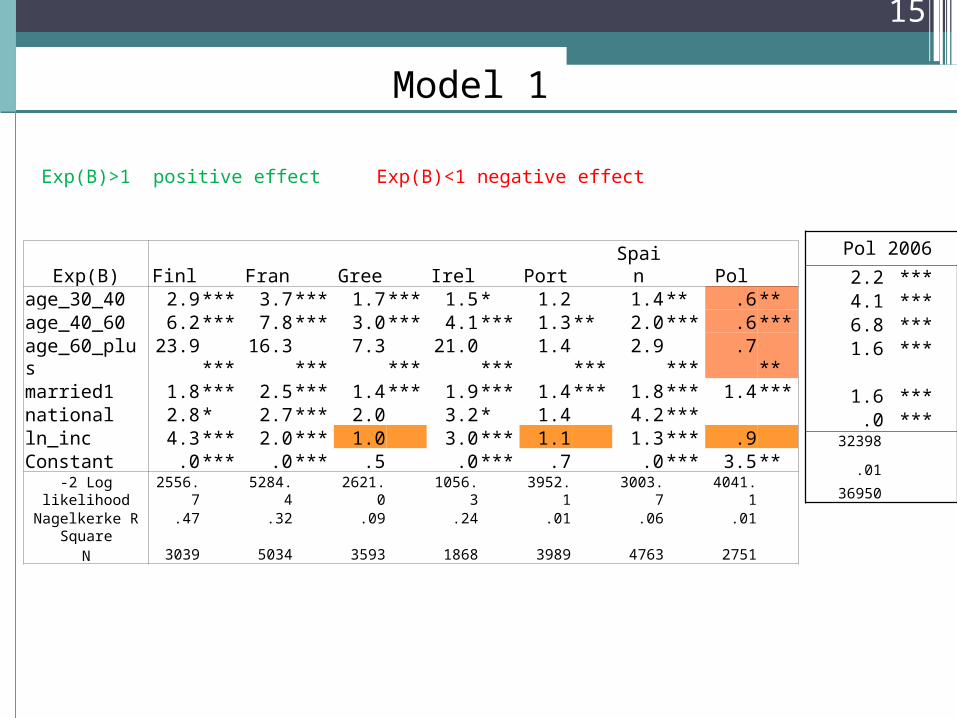
Model 1
Exp(B) Finl Fran Gree Irel Port Spain Pol age_30_40 2.9*** 3.7*** 1.7*** 1.5* 1.2 1.4** .6**age_40_60 6.2*** 7.8*** 3.0*** 4.1*** 1.3** 2.0*** .6***age_60_plus 23.9*** 16.3*** 7.3*** 21.0*** 1.4*** 2.9*** .7**married1 1.8*** 2.5*** 1.4*** 1.9*** 1.4*** 1.8*** 1.4***national 2.8* 2.7*** 2.0 3.2* 1.4 4.2***ln_inc 4.3*** 2.0*** 1.0 3.0*** 1.1 1.3*** .9 Constant .0*** .0*** .5 .0*** .7 .0*** 3.5**-2 Log likelihood 2556.7 5284.4 2621.0 1056.3 3952.1 3003.7 4041.1
Nagelkerke R Square
.47 .32 .09 .24 .01 .06 .01
N 3039 5034 3593 1868 3989 4763 2751
Pol 2006
2.2 ***4.1 ***6.8 ***1.6 ***
1.6 *** .0 ***
32398
.01
36950
Exp(B)>1 positive effect Exp(B)<1 negative effect
16
Model 1
Comments:
•The odds of homeownership is increasing with age almost in all countries. The exception is Netherlands where the odds of homeownership at the age 60+ are not significantly different from the odds of homeownership at the age 16-29. Netherlands have quite big rental market (41%) out of which 89% is public, so it is probable that older households sell their houses and move to public rental market.
Another exception is Poland in 2000 where results show that all groups of households aged 30-60+ have lower odds of homeownership than households aged 16-29. This might be explained by the fact that Polish housing market was still going through a transition period. In 2006 results were similar to other western European countries.
17
Model 1
Comments:
• As expected marriage in each country is a significant incentive to buy a house. The odds of homeownership for married couples are 1.2 – 3.2 higher compared to single and partnerships.
• Nationality plays in many countries even more important role in explaining tenure choice than marriage. In Germany, Italy Luxembourg, Austria or Spain people with national citizenship have 4 – 7.9 higher odds of being a homeowner.
• Income as expected has a positive influence on the odds of owning a home. The exceptions are Greece and Portugal where income seems insignificant, but this is a result of not controlling whether a household lives in urban or rural area. Incomes in rural area are much lower but homeownership rates are much higher there.

18
Model 2
Exp(B) Swit UK Aus
t Denm
Fran Gre Irel Port Pol
age_30_40 1.5** 2.0*** 1.3 1.8*** 4.0*** 1.7*** 1.5* 1.4** .9 age_40_60 4.4*** 3.2*** 1.8*** 3.1*** 8.9*** 3.0*** 4.0*** 1.4** .9 age_60_plus 7.5*** 3.6*** 2.2*** 2.8*** 18.6*** 6.8*** 18.2*** 1.4** 1.1 married 2.5*** 2.4*** 1.6*** 3.8*** 1.8*** 1.3* 1.8*** 1.3*** partnership .4*** 1.0 .6** 1.6*** .7*** 1.2 .7 .5*** national 2.8*** 1.8* 7.2*** 1.4 1.9*** 2.0 3.6** 1.2 ln_inc 2.7*** 2.9*** 1.6*** 2.2*** 2.6*** 1.1* 3.1*** 1.3*** 1.1 urban .3*** .9 .1*** .2*** .2*** .2*** .3*** .3*** .1***Constant .0*** .0*** .0*** .0*** .0*** .5 .0*** .2** 2.5
-2 Log likelihood3937.183a
3338.310b
2274.840c
2215.039d
4704.796e
2420.269f
997.967g
3440.738h
2896.978i
Nagelkerke R Square
.33 .27 .39 .36 .40 .17 .29 .09 .44
N 3667 3457 2398 2236 4894 3585 1865 3754 798
Dependent variable: owner=1 tenant=0 Sample: All
Accounting for urban/rural area and partnership/married versus single status
Exp(B)>1 positive effect Exp(B)<1 negative effect
Pol 2006
1.9 *** 3.6 *** 6.1 ***
1.2 *** 0.6 ***
1.9 ***
.2 ***
.0 *** 30327
.19
36950
19
Model 2
Comments:
• When controlling for urban/rural indicator income in Greece and Portugal becomes significant in explaining tenure choice. In case of Poland, impact of income on the odds of homeownership rose from 1.6 to 1.9.
• In all presented countries (except for UK) the odds of ownership is much lower in urban area.
• In most of the countries cohabitating couples are more likely to rent a dwelling than a single person. Only in Denmark cohabitating status has significantly higher odds of homeownership compared to single people (however still twice lower compared to marriage). To some extent this might be explained by the popularity of cohabitating status in a given country. In Denmark there is one of the highest percentage of partnerships.
20
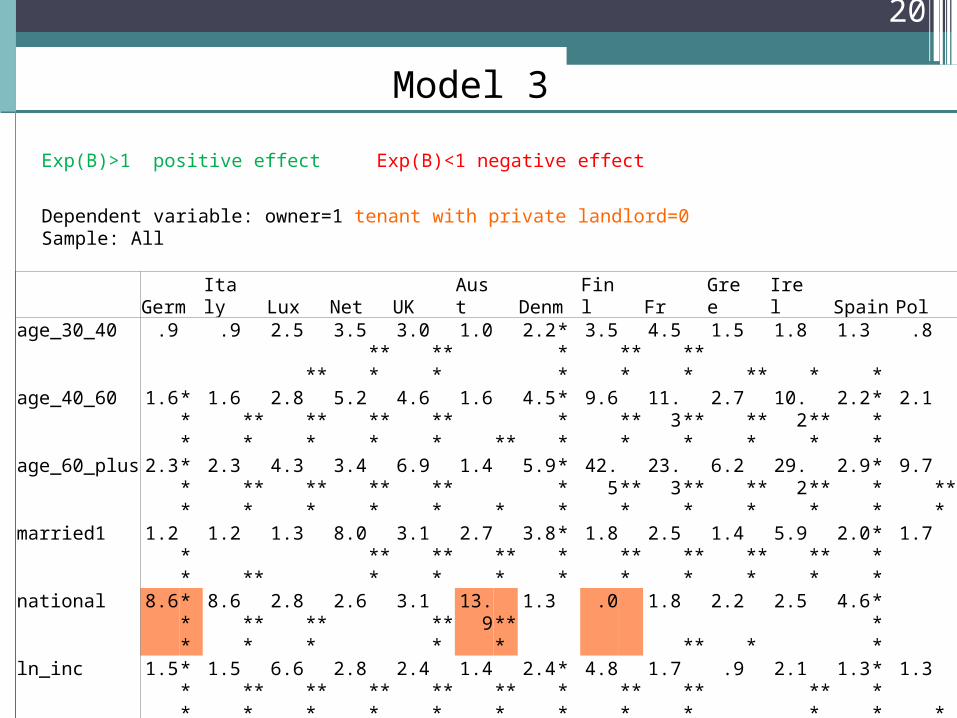
Model 3
Dependent variable: owner=1 tenant with private landlord=0 Sample: All
Germ Italy Lux Net UK Aust Denm Finl Fr Gree Irel Spain Pol age_30_40 .9 .9 2.5** 3.5*** 3.0*** 1.0 2.2*** 3.5*** 4.5*** 1.5** 1.8* 1.3* .8 age_40_60 1.6*** 1.6*** 2.8*** 5.2*** 4.6*** 1.6** 4.5*** 9.6*** 11.3*** 2.7*** 10.2*** 2.2*** 2.1 age_60_plus 2.3*** 2.3*** 4.3*** 3.4*** 6.9*** 1.4* 5.9*** 42.5*** 23.3*** 6.2*** 29.2*** 2.9*** 9.7***married1 1.2** 1.2** 1.3 8.0*** 3.1*** 2.7*** 3.8*** 1.8*** 2.5*** 1.4*** 5.9*** 2.0*** 1.7 national 8.6*** 8.6*** 2.8*** 2.6 3.1*** 13.9*** 1.3 .0 1.8** 2.2* 2.5 4.6*** ln_inc 1.5*** 1.5*** 6.6*** 2.8*** 2.4*** 1.4*** 2.4*** 4.8*** 1.7*** .9 2.1*** 1.3*** 1.3*Constant .0*** .0*** .0*** .0*** .0*** .0*** .0*** 2.1 .0*** 2.8 .0*** .0*** 1.0
-2 Log likelihood5933.199a
3786.419a
417.508a
1115.468a
2129.842a
1738.047a
1405.874a
1408.772a
3553.755a
2519.233a
420.413a
2619.716a
386.617a
Nagelkerke R Square
.249
.049
.187
.357
.266
.145
.322
.513
.346
.087
.291
.069
.066
N 5056 5134 1722 3086 3363 1966 1818 2530 4209 3564 1729 4683 1491
Exp(B)>1 positive effect Exp(B)<1 negative effect

21
Model 3a
Dependent variable: owner=1 tenant with private landlord=2 tenant with public landlord=3
Sample: All
Owner vs tenant with private landlord
Tenant with public landlord versus tenant with public landlord
age_30_40 2,5 *** 1,6 ***age_40_60 8,3 *** 3,3 ***age_60_plus 13,8 *** 3,3 ***married 1,2 *** 1,0aaaapartnership 0,5 *** 0,8 ***urban 0,5 *** 2,9 **aln_inc 1,9 *** 1,0 ***
-2 Log likelihood 34578 McFadden R Square 0,12
N 36829
Exp(B)>1 positive effect Exp(B)<1 negative effect
Multinomial logistic regression for Poland 2006

22
Model 3
Comments:
• When excluding from the sample public rental market it occurs that nationality in some countries plays even more significant role in defining tenure choice (in Germany and Austria the impact of nationality on the odds of homeownership rose twice, in Netherlands the coefficient gained significance). This indicates that not nationals live mainly in private rental market.
• On the other hand in Finland the impact of nationality has lost significance which indicates that many not-national households are entitled to live in public rental accommodation.

23
Model 4
Dependent variable: owner=1 tenant=0Sample: Recent movers (moved to current dwelling in 1995 or later)
Exp(B) Germ Neth UK Denm Finl Fran Spain dIncBurd 15.3*** 34.4*** 1.0 1.3 1.5 6.4*** 9.7***Household size 1.1* 1.1 1.0 1.0 1.0 .9* 1.1 ln_inc 7.3*** 9.0*** 6.3*** 10.4*** 7.0*** 4.2*** 1.7***previous_rooms_per_pers
1.2* 1.1 1.5*** 1.2 1.3* .9 .7*
age_30_40 1.4 1.5 1.9*** 1.3 1.9*** 3.4*** 1.5 age_40_60 1.5 1.2 1.6*** 1.0 1.3 3.8*** .9 age_60_plus .5** .1*** .3*** .6 1.8 1.4 .5 married1 3.2*** 3.1*** 3.3*** 1.8** 1.7** 2.1*** 1.8*national 3.4*** 3.6 1.7 1.9 1.7 .9 5.5**Constant .0*** .0*** .0*** .0*** .0*** .0*** .0***
-2 Log likelihood 1267.7 720.6 1547.2 677.3 694.2 1167.8 340.6 Nagelkerke R
Square
.391 .530 .467 .413 .371 .317 .216
N 1541 841 1902 668 693 1083 319
Exp(B)>1 positive effect Exp(B)<1 negative effect

24
Model 4
Comments:
• Positive sign by IncBurd variable means that all households are ready to increase burden on their income in order to become a homeowner.
• The impact of income on the odds of homeownership in case of recent movers is much higher compared to models built on the whole sample of households.
• The so called ‘room stress’ effect is only valid in case of Spain. The lower size of the housing (lower number of rooms per person) in previous dwelling the higher probability of turning to or remaining in ownership.
• In Germany, Netherlands and UK households aged 60 and more have significantly higher odds of being a tenant compared to young households.

25
Conclusion
• Differences in homeownership rates among European countries arise mainly from different approaches of states toward housing (more or less developed public housing) and from different numbers of not-national households living in particular countries.
• Also the extent to which cohabitating status is accepted in each country influences the size of the rental market.
• In certain countries there is a substantial movement of 60+ households from ownership into rental market