Microcredit to women and its contribution to production ...
235
Microcredit to women and its contribution to production and household food security Namayengo Mayanja Muyonga Faith
Transcript of Microcredit to women and its contribution to production ...

Microcredit to women and its contribution to
production and household food security
Namayengo Mayanja Muyonga Faith

Thesis committee
Promotor
Prof. Dr G. Antonides
Professor of Economics of Consumers and Households
Wageningen University & Research
Co-promotor
Dr J.A.C. van Ophem
Associate professor, Economics of Consumers and Households Group
Wageningen University & Research
Other members
Prof. Dr A. Niehof, Wageningen University & Research
Prof. Dr E.H. Bulte, Wageningen University & Research
Prof. Dr W.J.M. Heijman, Wageningen University & Research
Prof. Dr C. de Graaf, Wageningen University & Research
This research was conducted under the auspices of the Wageningen School of Social Sciences
(WASS)
Microcredit to women and its contribution to
production and household food security
Namayengo Mayanja Muyonga Faith
Thesis
submitted in fulfilment of the requirements for the degree of doctor
at Wageningen University
by the authority of the Rector Magnificus,
Prof. Dr A.P.J. Mol,
in the presence of the
Thesis Committee appointed by the Academic Board
to be defended in public
on Monday 8 May 2017
at 11 a.m. in the Aula.
Namayengo Mayanja Muyonga Faith
Microcredit to women and its contribution to production and household food security
235 pages.
PhD thesis, Wageningen University, Wageningen, the Netherlands (2017)
With references, with summary in English
ISBN: 978-94-6343-110-1
DOI: 10.18174/407189
Table of Contents
Chapter 1. General introduction .................................................................................................................... 9
1.1 Introduction ....................................................................................................................................... 10
1.2 Prevalence, causes and manifestations of food insecurity ................................................................ 13
1.3 Poverty, food insecurity and agricultural production ........................................................................ 15
1.4 Evolution of microcredit ................................................................................................................... 17
1.5 Factors affecting outcomes of microcredit ........................................................................................ 22
1.6 Microcredit impact assessment ......................................................................................................... 24
1.7 Research objective and research questions ....................................................................................... 30
1.8 Research design ................................................................................................................................ 31
1.9 Overview of the thesis ...................................................................................................................... 32
Chapter 2. Women and microcredit in rural agrarian households of Uganda: Match or mismatch between
lender and borrower? .................................................................................................................................. 34
2.1 Introduction ....................................................................................................................................... 35
2.2 Uganda country profile ..................................................................................................................... 38
2.3 Evolution of microfinance in Uganda ............................................................................................... 39
2.4 Characteristics of MFI programs and their recipients ....................................................................... 41
2.5 Study area.......................................................................................................................................... 43
2.6 Method .............................................................................................................................................. 43
2.6.1 Study design and instruments .............................................................................................. 43
2.6.2 Organisation of the study .................................................................................................... 45
2.6.3 Sampling and data collection procedures ........................................................................... 46
2.6.4 Data operationalisation, processing and analysis .............................................................. 48
2.7 Results ............................................................................................................................................... 49
2.7.1 Borrowing information and characteristics of the BRAC microfinance program .............. 49
2.7.2 Socio-demographic and personality characteristics of current (OB) and in-coming (NB)
BRAC borrowers ................................................................................................................................. 53
2.7.3 Microenterprise information ............................................................................................... 54
2.7.4 Reasons to borrow and loan repayment of borrowers ........................................................ 55
2.8 Conclusion and discussion ................................................................................................................ 57
Chapter 3. Does microcredit improve performance of women-run non-farm microenterprises? ............... 63
3.1 Introduction ....................................................................................................................................... 64
3.2 Theoretical framework for relation between microcredit and microenterprise development ........... 69
3.3 Methods............................................................................................................................................. 72
3.3.1 Study design ........................................................................................................................ 72
3.3.2 Sample ................................................................................................................................. 73
3.3.3 Measures ............................................................................................................................. 74
3.3.4 Residual heterogeneity in the data in cross-sectional sample and in the panel study ........ 76
3.4 Results ............................................................................................................................................... 78
3.4.1 Cross-sectional OB/NB comparison results........................................................................ 79
3.4.2 FGD results about borrowing and non-farm ME performance .......................................... 84
3.4.3 Panel results ........................................................................................................................ 87
3.5 Conclusion and discussion ................................................................................................................ 92
Chapter 4. Microcredit and agricultural production among resource-poor rural women (Quasi-
experimental comparison of current and in-coming borrowers in Uganda) ............................................... 98
4.1 Introduction ....................................................................................................................................... 99
4.2 Theory ............................................................................................................................................. 102
4.2.1 Women and peasant agricultural production ................................................................... 102
4.2.2 Microcredit and agricultural production .......................................................................... 106
4.3 Methods........................................................................................................................................... 108
4.3.1 Study design ...................................................................................................................... 108
4.3.2 Data collection and analysis ............................................................................................. 109
4.4 Results ............................................................................................................................................. 111
4.4.1 Sample composition .......................................................................................................... 111

4.4.2 Characteristics of respondents with agriculture-related MEs .......................................... 111
4.4.3 Crop production information for current and in-coming borrowers ................................ 112
4.4.4 Effects of microcredit on expenditure and output for crop production ............................. 113
4.4.5 Effects of microcredit on animal production .................................................................... 116
4.4.6 Sensitivity analysis ............................................................................................................ 117
4.5. Conclusion and discussion ............................................................................................................. 117
4.5.1 Crop production ................................................................................................................ 118
4.5.2 Animal production............................................................................................................. 120
Chapter 5. Microcredit and food security: Evidence from peasant communities in Uganda .................... 124
5.1 Introduction ..................................................................................................................................... 125
5.2 Theoretical framework .................................................................................................................... 130
5.2.1 Concepts and definitions of food security ......................................................................... 130
5.2.2 The income effect of borrowing ........................................................................................ 133
5.2.3 Borrowing and consumption smoothing ........................................................................... 135
5.2.4 Potential negative effects of microcredit........................................................................... 136
5.2.5 Non-income factors which affect food consumption ......................................................... 139
5.2.6 Available evidence on microcredit and food security ....................................................... 140
5.2.7 Research questions and hypotheses .................................................................................. 141
5.3 Methodology ................................................................................................................................... 142
5.3.1 Study design ...................................................................................................................... 142
5.3.2 Setting ............................................................................................................................... 144
5.3.3 Sample and procedures ..................................................................................................... 146
5.3.4 Measures ........................................................................................................................... 148
5.3.5 Empirical strategy ............................................................................................................. 151
5.4 Results ............................................................................................................................................. 154
5.4.1 Cross-sectional study results ............................................................................................ 154
5.4.2 Panel study results ............................................................................................................ 159
5.5 Conclusions and discussion ............................................................................................................ 161
Appendix 5.1 ......................................................................................................................................... 168
Chapter 6. General discussion .................................................................................................................. 171
6.1 Introduction ..................................................................................................................................... 172
6.2 Summary of research findings ........................................................................................................ 174
6.2.1 The context of borrowing .................................................................................................. 174
6.2.2 Microcredit and performance of non-farm MEs ............................................................... 175
6.2.3 Microcredit and agricultural production .......................................................................... 176
6.2.4 Microcredit and food security ........................................................................................... 177
6.3 General synthesis and conclusion ................................................................................................... 178
6.4 Policy implications of the study ...................................................................................................... 182
6.5 Limitations of the study and suggestions for future research ......................................................... 184
6.6 Areas for further research ............................................................................................................... 186
6.7 Overall study conclusion ................................................................................................................. 186
References ................................................................................................................................................. 188
Study Instruments ..................................................................................................................................... 203
Summary ................................................................................................................................................... 224
Acknowledgements ................................................................................................................................... 229
About the author ....................................................................................................................................... 232
Completed Training and Supervision Plan .............................................................................................. 233

Chapter 1
General introduction

10
1.1 Introduction
Food security has many definitions. The 1996 World Food Summit defined food security as a
situation that exists when all people, at all times, have physical, social and economic access to
sufficient safe and nutritious food that meets their dietary needs and food preferences for an
active and healthy life (FAO, 1996).
The definition of food security reflects its three pillars, which are food availability, access to
and utilisation of food. Attaining food security implies availability of nutritionally adequate and
safe food, individual households accessing socially acceptable food to meet their needs, and
ability of the body to utilise essential dietary nutrients (Barrett, 2010; Maxwell & Frankenberger,
1995; Smith, El Obeid, & Jensen, 2000). Food availability is usually in reference to national food
supplies from agricultural production, import or food aid, while access refers to individual
households having physical and or economic access to food. Utilisation on the other hand
reflects concerns about the quality of household food choices, hygienic and sanitary conditions
of food preparation, and finally a state of health that is needed for the body to metabolise
essential dietary nutrients (Mahadevan & Hoang, 2016; Smith et al., 2000).
Food security attainment is a prerequisite for economic development (World Bank, 2007) and
many development practitioners and national governments continue to place food security
attainment at the centre of their development goals and objectives. Yet the Food and Agricultural
Organisation, estimated that more than 800 million people worldwide were undernourished in
terms of dietary energy intake, while micronutrient malnutrition affected 2 million people (FAO,
IFAD, & WFP, 2015). The UNDP Human Development Report (1994) placed food insecurity on
the list of threats to human security, and mentioned food as one of the basic determinants of
well-being. It also identified improvement in income of people as a prerequisite for food security

11
attainment (UNDP, 1994). The 1996 World Food Summit set a goal of halving the number of the
hungry or undernourished by 2015 (FAO, 1996). This goal was not met in some of the
agriculture-based countries of sub-Saharan Africa and promoting agriculture remains a pre-
requisite for reduction of hunger and poverty (FAO et al., 2015). The recent world food price
surges put food insecurity in the limelight, with more efforts being sought to address the food
insecurity question (Mittal, 2009). This thesis deals with the problem of food insecurity,
especially about the way it might be alleviated by improving agricultural production and trade
through access to microfinance.
Food insecurity arising from inadequate access to quality food manifests itself differently in
different households depending on the entitlements available to them. Nobel Prize winner
Amartya Sen introduced the concept of entitlement, the endowment of a household that can be
transformed into food, via production, trade or commodity exchange (Maxwell & Frankenberger,
1995). For rural agrarian communities relying on subsistence agriculture, food security is mainly
attained via the production entitlement. The trade entitlement, though not as common, is
enhanced when peasants pursue rural non-farm activities as a method of enhancing their
livelihoods.
This thesis studies how the provision of microfinance may influence production and trade
entitlements, in order to improve household food security in rural areas in Uganda. For long
microfinance was believed to be a panacea in poverty alleviation and welfare improvement
(Bornstein, 1997; Morduch, 1999; Morduch; 2000). The tide changed when accounts of
numerous negative effects of borrowing including high interest rates, over-indebtedness and
repayment stress (Brett, 2006; Copestake, Bhalotra, & Johnson, 2001; Field, Pande, Papp, &
Park, 2012; Ganle, Afriyie, & Segbefia, 2015; Rahman, 1999a), lack of control over loans (Goetz
12
& Gupta, 1996), increased group-related violence and domestic violence (Rahman, 1999a) came
to light. In the recent past six randomised evaluations of the effect of microfinance were
commissioned in six countries drawn from four continents (Bosnia, Ethiopia, India, Mexico,
Morocco and Mongolia). These studies utilised different experimental designs and econometric
methods to assess the effectiveness of microfinance as a development tool. Results of these
studies were summarised by Banerjee, Karlan, and Zinman (2015). The six studies concluded
that the effects of microfinance are not as large as once thought. In addition they did not find
conclusive evidence of negative effects of borrowing. This left the microfinance debate open and
revealed the need for further research on the outcomes of microfinance to poor borrowers
(Banerjee, 2013). In this study we sought to contribute to this debate, by assessing the effect of
borrowing on agricultural production of female farmers, which is one of the major activities rural
women do. In the food security debate, increased production would have a positive implication
for food security even if monetised income did not increase. We thus measured both the
monetised and the non-monetised (hidden) income of women, from both crop and animal
production.
However, since the need for women to participate in non-farm activities for income needed
for food security improvement cannot be over-emphasised, we also looked at the effect of
microcredit on non-farm microenterprise (ME) performance. In addition to ME profits, we
assessed the effect of borrowing on the monetary worth of the MEs, and on recurrent business
expenditures. Finally, we assessed the effect of microcredit on household food security, using
various measures of food insecurity, as well as its effect on non-food consumption.
This introduction chapter will first consider the food security situation and its relation with
poverty and agricultural production. We continue with the development of microcredit and how
13
it may contribute to food security. We then consider the problems associated with measuring the
impact of microcredit. We present our research objective, and research questions, and briefly
present the research design. We finish with an overview of the next chapters of the thesis.
1.2 Prevalence, causes and manifestations of food insecurity
Rahman, Matsui, and Ikemoto (2013) defined food insecurity as lack of access to sufficient
quality food. Food insecurity may be short term and transitory, experienced for example when an
agrarian community misses a rainy season. It may become chronic due to persistent drought,
political conflict, and persistent lack of access to productive land and to food markets (Ashley,
2016; Maxwell & Frankenberger, 1995; Rahman et al., 2013).
Measurements of food security includes those related with foods and nutrients consumed,
measures of nutritional status as well as measures of access to food. One common measure of
food security is measurement of per capita caloric and nutrient intake. These can be used to
identify undernourishment, an indicator of people failing to attain intake of calories or of one or
more essential nutrients required for good health (FAO et al., 2015; Mahadevan & Hoang, 2016).
Dietary diversity scores (DDS) (Hoddinott & Yohannes, 2002; Arimond & Ruel, 2004) and the
qualitative Household Food Insecurity Access Scale (HFIAS) (Coates, Swindale, & Bilinsky,
2007; Swindale & Bilinsky, 2006b) are common measures of food security (access).
While many parts of the world made good progress in the reduction of hunger and
malnourishment in the last decades, many countries in sub-Saharan Africa made dismal progress,
with 1 in 5 people still being hungry (FAO et al., 2015; Stevens et al., 2012). The slow progress
is attributed to, among others, failure to attain levels of agricultural production and productivity
increase commensurate with the rate of population growth. In addition, unstable incomes, poor
14
markets and marketing infrastructure, and high postharvest losses put subsistence farmers who
rely on agriculture as a source of income at a disadvantage, and yet they also are net buyers of
food (FAO et al., 2015). Food insecurity is also caused by poverty, natural or human induced
disasters and political instability (FAO, 2016; FAO et al., 2015). Environmental degradation,
climate change and unpredictable weather patterns are also major causes of food insecurity in
poor communities (Ashley, 2016; FAO, 2016).
The prevalence of undernourishment in Uganda is estimated at 25.5% (FAO et al., 2015). By
2014 about 4–5 million of the population in Uganda remained at risk of becoming food insecure
(MoFPED, 2014).
The country has recorded improvement in some anthropometric indicators for young children.
For example, stunting defined as low height for age (a measure of chronic malnutrition), dropped
from 45% in 1995 to 33% in 2011. The level of underweight reduced from 25% in 1995 to 14%
in 2011 (World Bank, 2016b).
Food insecurity in Uganda is mainly caused by lack of access to diversified diet and low
nutrient content of commonly eaten foods. Instability in food supplies due to seasonality in food
production, high food prices, and unreliable earning patterns all aggravate the food insecurity
problem (GOU, 2011). Progress in reduction of under-nourishment has been hampered by slow
progress in growth of agriculture (FAO et al., 2015). Although causes of food insecurity in the
world are many and diverse, including conflict and climate change, low agricultural productivity
and poverty have been implicated most in the causation of food insecurity in developing
countries (Misselhorn, 2005; Smith et al., 2000).
15
1.3 Poverty, food insecurity and agricultural production
Poverty is a major cause of food insecurity (Ashley, 2016; FAO, 1996; Rahman et al., 2013;
Smith et al., 2000). Poor people may have difficulty obtaining adequate food, spend a greater
proportion of their income on food, buy poorer quality food, and may eat less frequently than the
non-poor (Ashley, 2016; Mellor, 1983; Rahman et al., 2013; Von Braun, De Haen, & Blanken,
1991). By 2012 close to 900 million people in the world lived below the extreme poverty level of
less than USD 1.9 per day. The global figure of poverty prevalence is 12.7% (World Bank,
2016a).
Poverty is prevalent in sub-Saharan Africa where the majority of people rely on subsistence
farming as the main source of food and income (Ashley, 2016). According to the World Bank
(2016a), Uganda has made significant progress in poverty reduction in the past two decades. The
poverty rates, based on the national poverty line (USD 0.88–1.04) depending on the region of the
country), have reduced from 33.8% in 2000 to 19.7% in 2016 (World Bank, 2016b). The
proportion of households living below the international poverty rate in Uganda fell by 2.7
percentage points per year since 2003, the second highest in sub-Saharan Africa for the time
period. The annual reduction rate, based on the national poverty, was 1.6 percentage points.
The country also recorded reduction in levels of non-monetary poverty. For example, infant
mortality rate (probability of dying between birth and exactly 1 year of age per 1,000 live births)
dropped from 88 in 2001 to 54 in 2011, while the under-five mortality (probability of dying
between birth and exactly 5 years of age per 1,000 live births), stood at 90 in 2011, having
dropped from 152 in 2001 (UBOS & ICF, 2012; World Bank, 2016a).
However despite all improvements the country is still among the poorest in the world. In
2013, more than a third of the citizens lived below the international poverty line. Even with

16
improvement in non-monetary poverty, the country still faces widespread deprivation. Human
development indicators like child and maternal malnutrition, and mortality are still among the
worst in the world.
Since agricultural production is one of the pillars of food security (Quisumbing, Brown,
Feldstein, Haddad, & Peña, 1995), low levels of agricultural productivity are also implicated in
the food insecurity problem. Underlying causes of food insecurity include limited off-farm work
opportunities, limited capital to set up businesses, poor access to land, limited information and
inputs for farm production, inefficient farm support services, and low adoption of tools for
efficient production (GOU, 2011; UNICEF, 1990).
As the discourse for reduction of food insecurity continues, interventions are needed to
address the problem. These include among others rural economic development interventions
geared towards agricultural production, and rural income diversification (Barrett, Reardon, &
Webb, 2001; Ellis, 1993; World Bank, 2007).
Rural income diversification involves promotion of non-farm earnings which have been
estimated to contribute about 42% of income for rural communities in developing countries
(Haggblade, Hazell, & Reardon, 2002). These promotions are important to address poverty
which is prevalent in agrarian societies.
Improvement in agricultural production of small-holder farmers, including women, has the
potential to contribute to improvement in food security since many poor people rely on
agriculture as a form of livelihood and a source of food (FAO et al., 2015; Ruel & Alderman,
2013; Sibhatu, Krishna, & Qaim, 2015). Growth may be attained by promotion and adoption of
modern inputs such as fertilisers and seeds (Abate, Rashid, Borzaga, & Getnet, 2016).
Agricultural growth should be nutrition sensitive, with focus on improved dietary diversity,
17
nutritional education and nutrition awareness, and women’s empowerment, among others (FAO
et al., 2015; Ruel & Alderman, 2013). In addition to production improvements, gender-sensitive
interventions are needed to reduce women’s time constraints, and strengthen their control over
income (FAO, 2011). Indeed according to the National Planning Authority (NPA) and the
Ministry of Finance Planning and Economic Development (MoFPED), the government of
Uganda recognises the need for sustained agricultural production and has placed agricultural
improvement at the core of its development plans (MoFPED, 2014; NPA, 2010).
1.4 Evolution of microcredit
According to Karlan and Goldberg (2011) microfinance refers to very small loans given to low-
income clients with the aim of self-employment. Microfinance has been associated with
dispersion of small collateral-free loans (microcredit) to jointly liable groups (usually consisting
of poor women) in order to foster income generation and poverty reduction through enhancing
self-employment. Microfinance for loans is referred to as microcredit. The origin of the
microcredit or microfinance movement can be traced to Muhammad Yunus, an economics
professor and founder of the Grameen Bank in Bangladesh. Yunus in 1976 observed that lack of
capital was an obstacle to productive self-employment among the poor (Bornstein, 1997). The
poor lacked collateral to access funds from formal banking institutions. He observed that the
poor could utilise small loans to recapitalise their business, and also make regular small
repayments. This worked well when loan repayments were frequent and small, and when the
borrowing and repayment process was conducted openly in the village. It also worked well when
the borrowing arrangement was in groups, where individuals guaranteed each other’s repayment.
The peer groups offered support and exerted pressure for loan payment, as future access to credit

18
for all members would depend on all members fully paying up their loans (Bornstein, 1997).
This loan procedure was the birth of the ‘Grameen-style’ solidarity group lending model. In this
model, borrowers use information available on others in their social circle to screen those to
work with (Armendáriz & Morduch, 2010; Morduch, 1999). Group lending has been found to
support loan repayment from poor borrowers who usually lack collateral needed by formal
financial institutions (Ghatak, 1999; Ghatak & Guinnane, 1999). With the assumption that poor
people need credit (Ledgerwood, 1999), Yunus and others believe that providing loans to the
poor ultimately leads to improvement in their welfare, and in the long run may contribute to the
economic development of their communities (Bornstein, 1997; Todd, Schultz, & John, 2007).
Based on the above highlighted development potential, the microfinance industry has become
a global movement for combating rural poverty. It is considered a tool that can enable the poor,
who are otherwise excluded from formal financial facilities, to unlock their productive potential
by growing small businesses through access to microfinance (Armendáriz & Morduch, 2010).
Substantial amount of development aid has been allocated to microfinance institutions (MFIs) to
improve poor people’s access to microcredit (Armendáriz & Morduch, 2010). By 1995, about $7
million in outstanding loans had been given to more than 13 million individuals and groups
(Ledgerwood, 1999). According to Microcredit Summit Campaign (2015) by the end of 2013,
the microfinance community had reached 211million clients, 114 million of which were women.
Microcredit as a form of financial development strategy brings access to financial resources
closer to resource-constrained communities. However, lack of collateral, information asymmetry,
and high transaction costs make formal lending institutions shy away from the poor (Morduch,
2000). Unable to access formal financial markets, the poor instead rely on informal support,
which may be expensive and yet not always assured (Ghatak & Guinnane, 1999; Morduch,

19
2000). With microcredit, would-be entrepreneurs pursue potentially profitable business
opportunities they would otherwise not be able to pursue (Guiso, Sapienza, & Zingales, 2004;
Sen, 1999).
Because of different reasons, including focus on the poor, financial sustainability of
participating institutions, the many success stories, and the innovative financial products, the
microfinance movement grew and thrived in many countries (Ledgerwood, 1999). The
government of Uganda embraced it as a key strategy for poverty reduction and livelihood
improvement (NPA, 2010). BRAC (Bangladesh Rural Advancement Committee) is one of the
largest MFIs in Uganda that target women with microcredit to recapitalise microenterprises.
BRAC uses Village Organisations (VOs), under the ‘Grameen-style’ group lending model which
relies on joint liability of members for loan repayments at weekly group meetings (Armendáriz
& Labie, 2011; Armendáriz & Morduch, 2010; Eijkel, Hermes, & Lensink, 2011; Morduch,
1999). Small individual loan amounts (microcredit) are advanced to women who must belong to
VOs consisting of 15–20 person (Berger, 1989; BRAC, 2008; Morduch, 1999).
Women are targeted because they lack access to credit (De Mel, McKenzie, & Woodruff,
2009) and yet when they access credit have good record for loan repayment (Kabeer, 2005;
Karlan and Goldberg, 2011). In addition, they play a key role in household welfare maintenance,
by allocating to households a large proportion of their resources (Agarwal, 1997; Barnes, Morris,
& Gaile, 1999; Cheston & Kuhn, 2002; Kabeer, 2005). For example, Pitt & Khandker (1998) and
Pitt et al (2003) found that credit to women led to greater improvement in the nutrition status of
children, than that given to men. Women are household food producers (Fletschner & Kenney,
2014; Quisumbing et al., 1995), managers of nutrition provision to families (Ashley, 2016), and
general care givers (Niehof, 2015). Microcredit to women is thus expected to lead to household
20
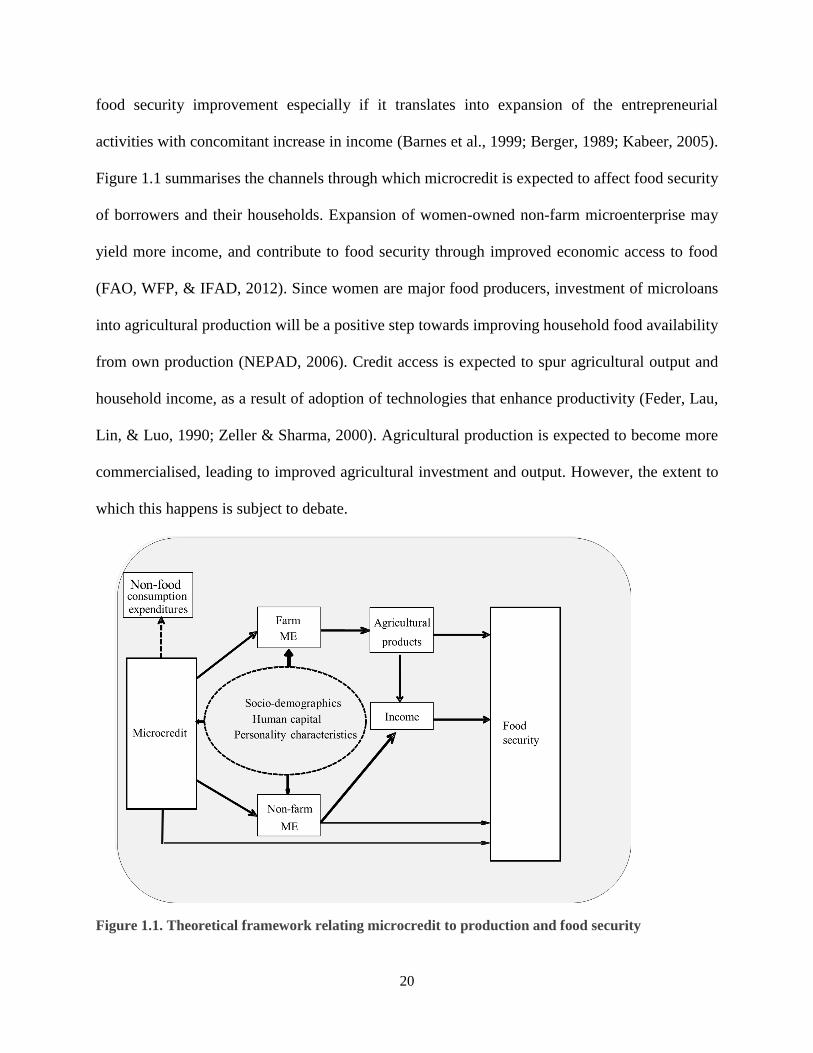
food security improvement especially if it translates into expansion of the entrepreneurial
activities with concomitant increase in income (Barnes et al., 1999; Berger, 1989; Kabeer, 2005).
Figure 1.1 summarises the channels through which microcredit is expected to affect food security
of borrowers and their households. Expansion of women-owned non-farm microenterprise may
yield more income, and contribute to food security through improved economic access to food
(FAO, WFP, & IFAD, 2012). Since women are major food producers, investment of microloans
into agricultural production will be a positive step towards improving household food availability
from own production (NEPAD, 2006). Credit access is expected to spur agricultural output and
household income, as a result of adoption of technologies that enhance productivity (Feder, Lau,
Lin, & Luo, 1990; Zeller & Sharma, 2000). Agricultural production is expected to become more
commercialised, leading to improved agricultural investment and output. However, the extent to
which this happens is subject to debate.
Figure 1.1. Theoretical framework relating microcredit to production and food security

21
Introduction of MFI activities enables communities that were previously excluded from
financial markets to get immediate access to credit (Kaboski & Townsend, 2012). Credit access
will then lead to changes in production and consumption decisions (Crépon, Devoto, Duflo, &
Pariente, 2015).
Loans provide financial capital for production activities, either on-farm or non-farm micro-
enterprises (MEs) (Matin, Hulme, & Rutherford, 2002). Recipients may invest in a new business,
expand an existing business or increase their labour supply (Banerjee, Duflo, Glennerster, &
Kinnan, 2015; Crépon et al., 2015). After borrowing, household members may devote more time
to activities of the microenterprise (Banerjee, 2013; Crépon et al., 2015; McKernan, 2002). In the
long run businesses owned by recipients of microcredit are expected to record higher profits than
their non-credit counterparts (McKernan, 2002). Farm households may adopt labour-saving
technologies that they were otherwise unable to afford (Matin et al., 2002). The extra investment
is expected to lead to, among others, improved productivity (Matin et al., 2002), ME expansion,
increased business outputs, profits and income, and asset accumulation (Gobezie, 2004; Karlan
& Goldberg, 2011; McKernan, 2002; Sebstad, Neill, Barnes, & Chen, 1995). In addition, the
human capital improvement from non-credit MFI services, including training, business sharing
and group support, may improve business and self-employment skills (McKernan, 2002), and
increase output further.
Microcredit may also impact households through change in consumption decisions.
Households accessing microcredit may sacrifice short-term consumption of non-asset goods and
leisure in order to acquire durable goods (Banerjee et al., 2015; Crépon et al., 2015). Such
households will manage their assets and liabilities more efficiently. For example, they may
reduce levels of assets for precautionary savings and increase assets for production purposes

22
(Matin et al., 2002). Participation in microcredit programs may lead to consumption smoothing
(Banerjee et al., 2015; Crépon et al., 2015; Kaboski & Townsend, 2012; Kempson, Crame, &
Finney, 2007). This is achieved through use of microcredit to procure food for consumption or
diversion of food stock from business to consumption. Such diversion is more likely in
communities with production problems, for example, due to seasonality (Develtere &
Huybrechts, 2002). In addition, the possibility of future credit access may alter the need for
savings as protection against future shocks, and clients may then rely on credit to cover current
consumption (Kaboski & Townsend, 2011; Matin et al., 2002).
1.5 Factors affecting outcomes of microcredit
Outcomes of borrowing depend on many factors including the context and characteristics of the
lending program, the socio-demographic and personality characteristics of the borrower, and the
type of activities engaged in (Kabeer, 2005; Snodgrass & Sebstad, 2002).
Characteristics of the microcredit program, such as loan cycle (Copestake et al., 2001), loan
amount (Panjaitan-Drioadisuryo & Cloud, 1999), interest rate, repayment requirements
(Snodgrass & Sebstad, 2002; Kabeer, 2005) and length of borrowing time (Hulme, 2000a), may
all influence outcomes. Loan allocation and loan use may also influence attained outcomes.
Investment of funds into targeted MEs should lead to business expansion, increase in profits and
employment (Panjaitan-Drioadisuryo & Cloud, 1999; van Rooyen, Stewart, & de Wet, 2012).
Business expansion will lead to improvement in household income (Karlan & Goldberg, 2011)
and household assets (Gobezie, 2004). On the other hand diversion of funds to household
consumption deprives MEs of much-needed capital, and no change in profitability may be

23
attained (Gifford, 2004; Rutherford, 2011; van Rooyen et al., 2010), although short-time
consumption smoothing may be achieved.
The type of microenterprise may also determine the probability of successful outcomes.
Different types of microenterprises have varying levels of profitability with some failing to yield
any profits (van Rooyen et al., 2012). Also, poor micro-entrepreneurs may remain food insecure
if the microcredit-supported activities are not productive enough (Balatibat, 2004). In addition,
investment in agricultural-related microenterprises augments the traditional roles of women in
food production (MacGuire & Popkin, 1990), which is the first pillar of food security
(Quisumbing et al., 1995).
Livelihood assets and resources of the recipients and their households may moderate levels of
outcome. Individual characteristics, skills and abilities may influence outcomes of microcredit
participation (Cheston & Kuhn, 2002; Gifford, 2004). For example, the owner’s level of formal
education is a key predictor of survival for small businesses (Bates, 1990). Human-capital
characteristics such as level of schooling (Bates, 1990; Berger, 1989; Crook, Todd, Combs,
Woehr, & Ketchen, 2011; Rakodi, 1999), age and marital status (van Rooyen et al., 2012) may
influence the success of women-owned microenterprises. Time preference, risk preference, and
the desire for achievement may further explain success or failure of microenterprises (Rauch &
Frese, 2000). In addition, group commitment to microcredit repayment may be related to time
preference of the recipients (Bauer et al., 2012).
Household structure and composition may define levels of burden on recipients, decision
making on time and resource allocation, and the support structure and mechanisms for recipients
(Berger, 1989; Feroze, Chauhan, & Chakravarty, 2011; Gifford, 2004; Hulme, 2000a; Nelson et
al., 2004; Rakodi, 1999). Social networks of the family may also influence microenterprise

24
survival and productivity (Gifford, 2004; Rakodi, 1999). Other borrowing contextual issues such
as location of the program, rural versus urban, markets and infrastructure may all affect
borrowing programs.
Food security improvement from microcredit participation is mediated by improvement in
income and savings, self-esteem, and empowerment to participate in household decision making
on household resource use and allocation (Gobezie, 2004; Kabeer, 2005). Female control over
income from microenterprise expansion is needed to realise increments in expenditures on food
(Grown & Sebstad, 1989; Jiggins, 1989) and dietary diversity (Carletto, Zezza, & Banerjee,
2013; Hoddinott & Yohannes, 2002).
Potentially negative outcomes of microfinance program participation, e.g. child labour,
increase in recipient work load and sale of household assets for loan repayments, have been
reported (Karlan & Goldberg, 2011). Exogenous factors such as spouse’s and other people’s
contributions to meeting household food needs and non-loan related food production may affect
household food security changes among microcredit recipients (MacGuire & Popkin, 1990).
1.6 Microcredit impact assessment
The need to ensure that microcredit leads to the intended developmental outcomes necessitates
the careful consideration of methodologies in impact assessments. Studies must strive for rigour,
while keeping in mind the objectives, context, and financial and human resource availability
(Hulme, 2000a).
Sebstad (1998) defined impact assessments (IAs) as ’inquiries that estimate the value, degree
or pattern of change that can be plausibly associated with an intervention’ (p. 3). In consideration
of the opportunity cost of investment in some activities and not others (Armendáriz & Morduch,

25
2010), evidence is needed from IAs to justify the huge expenditures on development programs
such as microfinance (Hulme, 2000a).
Microfinance impact assessments compare individuals who have accessed credit (treatments)
to otherwise similar individuals who have not yet got credit (controls). Changes may be assessed
based on differences in outcomes between the treated and controls. Impact assessment studies
may be done at either enterprise or household level (Hulme, 2000b). Examples of household
level indicators in microfinance impact assessments include changes in household income,
expenditure, assets and consumption. Social indicators include food security and women
empowerment such as measures of decision making (Hulme, 2000a). Sebstad et al. (1995)
provided examples of outcome variables in microfinance impact assessment. Assessment of the
ME resource base may include assessment of levels and sources of the enterprise capital. After
receiving microcredit borrowers are expected to transition away from use of personal savings
and family resources to using credit.
Development interventions work on the assumption of a change in human behaviour and
practice after the intervention, leading to desired intervention outcomes. In IAs, comparisons are
made of key program outcomes on ‘agents’ who have experienced an intervention, to what
would have existed without the program. Hulme (2000a) provides two alternative schools of
thought in choosing the path of analysis. The beneficiary school of thought focuses analysis on
who benefits and how, while the intermediary school of thought focuses on effectiveness and
efficiency of MFI operations and procedures. In this study we focus on the beneficiary school of
thought, since it emphasises the social benefits of microfinance.
Another consideration in any analysis concerns the level of analysis which may be done at the
individual, household or enterprise level. Analysis at different levels balances out potential limits

26
and benefits of assessments at any of the levels (Hulme, 2000a). In the current study analysis was
done at the household, individual and microenterprise levels for different variables.
The primary challenge of impact evaluations is estimation of the counterfactual, the level of
outcome among participants without the program. However, since people cannot be both
participants and non-participants in an intervention at the same time, estimation gives rise to
methodological problems of attribution of observed effects to the intervention (Armendáriz &
Morduch, 2010; Glennerster & Takavarasha, 2013; Hulme, 2000a; Khandker, Koolwal, &
Samad, 2010). Different methods have been developed for estimation of this counterfactual.
While randomised control trials are promoted as the best alternative in impact assessments,
because treatment and control groups are randomly allocated (Glennerster & Takavarasha, 2013;
Karlan & Goldberg, 2011), they are expensive and time consuming (Hulme, 2000a), and not
always feasible if interventions have already started (Karlan & Goldberg, 2011). Some methods
estimate the counterfactual by comparing treated and untreated groups when both are eligible to
be treated (with and without treatment comparisons). Commonly, middle-range IAs are being
promoted with tools developed by USAID-funded Assessing the Impact of Microenterprises
Services (AIMS) project, using with/without credit group comparisons (Sebstad, 1998). To
overcome selection bias, comparison groups may be obtained by use of prospective borrowers
who have self-selected to participate in a program before they access loans (Barnes & Sebstad,
2000; Gaile & Foster, 1996; Karlan & Goldberg, 2011; Nelson et al., 2004). In this quasi-
experimental methodology, impact is obtained as the difference between outcome variables for
in-coming borrowers and actual borrowers (Karlan & Goldberg, 2011; Tedeschi, 2008). One
shortfall that has been suggested for this method by Karlan (2001), is the potential bias from
drop-outs, as well as unobservable reasons why incoming clients may differ from those who

27
joined earlier. This may be overcome by tracing and inclusion of the drop-outs who can be
traced, and also by use of propensity score matching (Khandker et al., 2010).
Another challenge of IAs is that external and internal factors, other than the intervention, may
lead to changes in outcome variables of interest (Armendáriz & Morduch, 2010; Glennerster &
Takavarasha, 2013).
Finally, selection of participants into a program may influence levels of observed outcomes.
Individuals with unique characteristics may self-select into a program. In addition, program
implementers may non-randomly select individuals and locations for the implementation of the
program (Armendáriz & Morduch, 2010; Glennerster & Takavarasha, 2013). If self-selection and
non-random program placement are not taken care of, selection bias may occur, which may lead
to over- or under-estimation of program impact (Armendáriz & Morduch, 2010). Selection bias
may also lead to erroneous attribution of observed differences to a program, when in fact
changes may be due to pre-existing differences (Armendáriz & Morduch, 2010; Coleman, 1999;
Glennerster & Takavarasha, 2013; Tedeschi, 2008).
Another available method is the Difference-in-Difference (DID) method that involves
comparisons of treated and untreated groups before and after the intervention. In this method,
unobserved characteristics which are assumed to be time-invariant, and are differenced out in
assessing differences between treated and controls (Armendáriz & Morduch, 2010; Glennerster
& Takavarasha, 2013; Hulme, 2000a). Alternatively, quasi-experimental methodologies such as
propensity score matching may be used to construct comparable groups through statistical design
(Khandker et al., 2010). The propensity score matching (PSM) methodology has been described
by many authors (Chemin, 2008; Khandker et al., 2010; Luellen, Shadish, & Clark, 2005;
Rosenbaum & Rubin, 1983). It is a quasi-experimental statistical analysis tool used to create

28
treatment and control groups which are similar on a set of observable covariates. It is applied in
the assessment of impact of interventions in which random allocation of participants into
treatment or control groups is impractical or unethical, and in programs where it is impossible
because an intervention has already taken place and participants naturally selected themselves
into different groups. To ensure comparability, selected covariates (factors which may influence
the probability of belonging to either category and which may also influence the outcome of an
intervention) are used in a probit or logit regression procedure which assigns a propensity score
to each individual. The score represents the probability of the respondent being in either group.
In the matching step, treatments and controls with similar scores are paired for inclusion in the
impact effect analysis. Individuals with no matches are eliminated from further analysis. The key
result of PSM is a reduction of selection bias due to the observed covariates. After matching, the
effect of the intervention is determined as the average difference in outcome between the groups.
Different types of matching methods are available. In nearest-neighbour (NN) matching, each
treatment unit is matched to the one in the control group with the nearest propensity score.
Calliper or radius matching involves utilisation of a threshold on the acceptable propensity score
for the matching process. Another alternative is weighted Kernel matching which is based on
giving more weight to more similar cases in the two groups, and less weight to more dissimilar
cases. One limitation of PSM is the assumption that only the measured covariates influence
selection into treatment and control groups. In the event that there are unmeasured covariates,
there may be some residual bias. One of the ways for checking the influence of unobservables to
the comparisons is by use of sensitivity analysis (DiPrete & Gangl, 2004; Rosenbaum, 2010).
Another way of measuring impact is by use of the instrumental variable method. This
involves using an instrument that influences participation in microcredit programs but does not
29
influence the outcome of participation. However, finding a suitable instrument is sometimes not
feasible (DiPrete & Gangl, 2004).
Qualitative approaches using open-ended interview questions in focus group discussions may
also be used in impact assessments. They are useful in the pooling of information, knowledge
and experiences of participants of the program. They have the advantage of providing rich
information and details on the mechanism through which the program works (Duflo, Glennerster,
Kremer, Schultz, & John, 2007). Various authors recommend the use of a combination of
qualitative and quantitative methods in IAs to aid in the interpretation of findings and identifying
impacts that have high plausibility (Barnes & Sebstad, 2000; Hulme, 2000a; Khandker et al.,
2010). The current study uses a combination of a quantitative survey and qualitative focus group
discussions to assess the effect of participation in a program on ME performance.
Given the influence of context on the outcomes of microcredit (Chliova, Brinckmann, &
Rosenbusch, 2015; Coleman, 1999; Kabeer, 2005), there is a need to evaluate microcredit
programs in different communities. To the best of our knowledge, no rigorous assessment of the
food security outcomes of microcredit has been undertaken in Uganda.
Microcredit has greatly expanded in Uganda in the past decades and is lauded as a livelihood
improvement strategy for promoting food production, income and food security improvement in
the country through farm and non-farm activities. However, it is not clear if food security
improvement influences decisions by microcredit beneficiaries to take credit and to what extent
microfinance support leads to food security improvement of borrowers’ households. There is
limited evidence to show if microloans are invested into agricultural and non-farm MEs, and if
this leads to improved agricultural output and improved profits from the MEs, respectively. It is
not clear to what extent and how microcredit to women affects income, food production and food

30
security of resource-constrained agrarian households in Uganda, and which factors enhance or
limit observed outcomes. Many factors (see Section 1.5 above) influence borrowing outcomes,
hence the need for impact assessments in different contexts.
There is need to establish if proceeds from microcredit investment into non-farm MEs
adequately compensate for any foregone opportunities to engage in food production, especially
in communities which traditionally rely on own food production for food. There is also need to
establish if female borrowers are able to transform subsistence food and non-farm MEs into
commercial ones, which is one of the key goals of lending programs.
1.7 Research objective and research questions
This study aims to assess the contribution of microcredit to women in Uganda to household
production activities and food security status and to evaluate factors that enhance or limit food
security outcomes. This objective is accomplished by assessing the effect of borrowing on the
performance of non-farm microenterprises, on input expenditures and output from agricultural-
related activities and by assessing the effect of borrowing on food and non-food consumption.
The main research question is whether microfinance access by women influences production
activities and the food security situation of their households and the underlying factors. This
research question comprises several specific research questions listed below.
1. To what extent do the objectives and design of the BRAC microfinance program match
the expectations, context and characteristics of female borrowers in a rural agrarian
setting in Uganda?
2. How does borrowing influence investments in non-farm MEs, the operation of MEs, their
monetary worth and profits and, what factors affect the observed changes?

31
3. To what extent does borrowing affect investment and input expenditures, and output from
agriculture?
4. How does microcredit participation affect food consumption of households?
1.8 Research design
The overall study was a panel design in which we collected data on three categories of
respondents. The first category was the old borrower (OB) group who had a running loan with
BRAC. The second category consisted of in-coming new borrowers (NB) into BRAC, before
they received their first loan. The third group of respondents (the control group, CG) consisted of
a group of women from the same villages as NBs, with a non-farm ME, but who never borrowed
from BRAC or any other MFI.
During the baseline study we collected data on the three study groups. We used a quasi-
experimental cross-sectional design to compare farm and non-farm ME performance parameters
for OB and NB borrowers based on the USAID/AIMS comparative cross-sectional analysis
design that was described by Nelson et al. (2004). We compared parameters of a treatment group
of existing borrowers (OB) and a group of incoming borrowers (NB), before they received their
first loan. The basis of this methodology in the assessment of the effect of microcredit is that,
since both groups have already self-selected to participate in microcredit, and one has just not
received the loan, the difference between outcome measures for the two may be taken as the
effect of borrowing. In this approach, baseline data from the OB was compared with NB data.
Differences between OB and NB parameters were obtained using propensity score matching
(PSM), which ensures comparability of groups based on observable characteristics, which may
determine participation into the borrowing program.
32
Furthermore, we carried out two waves of data collection for the NB and the CG groups,
respectively (Gaile & Foster, 1996). We used the collected data to obtain an alternative measure
of the effect of microcredit using difference-in-difference (DID) analysis. With the consent of the
participants and after assurance of confidentiality, structured questionnaires were used to collect
quantitative data for the study. The questionnaire elicited information on socio-demographic
characteristics of respondents and their households, household agricultural production
information, information about non-farm enterprises and household food and non-food
consumption as well as several personality variables.
Qualitative data were collected using the focus group method, following a focus group
discussion (FGD) guide. FGDs were used to explore respondents’ reasons for borrowing, loan
allocation and use, and perceived benefits of borrowing to MEs and households, among others.
1.9 Overview of the thesis
In Chapter 2 we investigate the extent to which the objectives and design of the BRAC
microfinance program match the expectations, context and characteristics of female borrowers.
Chapter 3 provides results of our investigation of the effects of microcredit on the
performance of non-farm microenterprises (MEs) run by small-holder female farmers. This was
conducted on a sub-category of respondents with non-farm MEs. We compared parameters for
new borrowers (NB), before and after they received their first loan, and a control group (CG) of
women who never received credit. Difference-in-difference (DID) analysis of the data revealed
marginally significant improvement of ME monetary value. In an alternative approach, baseline
data from current borrowers (OB) was compared with NB data using propensity score matching
(PSM).
33
In Chapter 4 we assess the microcredit-attributable changes in agricultural production input
expenditure and outputs among women with farm MEs. We used a quasi-experimental cross-
sectional design with both quantitative and qualitative survey methods to obtain socio-
demographic, personality and microenterprise (ME) characteristics of existing borrowers (OB)
and incoming borrowers (NB) before they received their first loan. To assess the effect of
microcredit, we measured production input expenditures for crop and animal production, crop
harvests in the season before the study, and the animal wealth for the respondents. We used
propensity score matching to assess differences between OB and NB groups.
In Chapter 5 we investigate the effects of participation of women in a microcredit program on
household food security parameters of female borrowers’ households. We explore the modes of
food acquisition, dietary diversity, calorie and protein intake, and qualitative food insecurity
measures for different categories of respondents.
In Chapter 6 we discuss the implications of the major study findings. Overall, we find that
taking microcredit did not lead to improved farm and non-farm ME income or food security
among the rural women borrowers studied. This may be because of extreme poverty among
borrowers and the loan conditions which are not conducive for investment in agriculture.

34
Chapter 2
Women and microcredit in rural agrarian households of Uganda: Match or
mismatch between lender and borrower?
Abstract
The alignment of microfinance programs with the context and expectations of recipients is
critical to ensuring clients’ satisfaction and desired program outcomes. This study sought to
investigate the extent to which the objectives and design of the BRAC microfinance program
match the expectations, context and characteristics of female borrowers in a rural agrarian setting
in Uganda. Quantitative and qualitative survey methods were used to obtain socio-demographic,
personality and microenterprise (ME) characteristics of existing and incoming borrowers and to
obtain information about the microcredit program. We found that BRAC uses a modified
Grameen-like group lending model to provide small, high interest rate production loans and
follows a rigorous loan processing and recovery procedure. BRAC clients are mainly
impoverished subsistence farmers who derive income from diverse farming and non-farm
activities. The major reason to borrow is to meet lump-sum monetary needs usually school fees
and for investment in informal small non-farm business activities. Many borrowers use diverse
sources of funds to meet repayment obligations. Defaulting on loans is quite low. The stress
caused by weekly loan repayment and resolution of lump sum cash needs were identified as
reasons for women to stop borrowing. The limited loan amounts, the diversions of loans to non-
production activities, the stages of the businesses and the weekly recovery program without
grace period may limit the contribution of these loans to ME expansion and increase in income.
Key words: Uganda, BRAC, rural microcredit, women.
Publication status: Published as Namayengo, F.M.M., van Ophem, J.A.C., and Antonides, G.
2016. Women and microcredit in rural agrarian households of Uganda: Match or mismatch
between lender and borrower? Applied Studies in Agribusiness and Commerce—APSTRACT 10
(2–3), 77–88.

35
2.1 Introduction
Microfinance has been promoted by many national and international developmental agencies as a
tool for poverty alleviation and development of poor communities (Armendáriz & Labie, 2011;
Armendáriz & Morduch, 2010; Matin et al., 2002). The core objective of microfinance
institution (MFIs) programs is to bring financial services to such resource-constrained
communities. Formal institutions usually shy away from the poor because they lack collateral
and because of information asymmetry and high transaction costs (Armendáriz & Labie, 2011;
Armendáriz & Morduch, 2010; Hulme & Mosley, 1996; Matin et al., 2002; Morduch, 2000).
Women constitute a large percentage of the poor in many communities (Fletschner, 2009;
UNDP, 1996). This is because financial, social and economic inequalities limit their participation
in formal markets (Meyer, 2013). Yet women make significant contributions to the welfare of
their families and households. They play significant roles in economic production, social
reproduction, care and community activities (Buvinić, 1997; Momsen, 2004; Niehof, 2004a,
2015b; Østergaard, 1992). They enhance their agency to seek for opportunities for personal and
family welfare improvement. To diversify their livelihoods, they set up microenterprises with
limited financial outlay and often low returns (Jiggins, 1989; Schreiner & Woller, 2003). Women
in Uganda are no exception. They reportedly suffer from the burden of poverty and financial and
social deprivation (Lakwo, 2006; Wakoko, 2004). Poverty, hunger and food deprivation are
common in rural areas which rely on agricultural production as a source of livelihood (MoFPED,
2014).
Poverty alleviation is a core objective of many MFIs. Under their microcredit component,
MFIs target poor micro-entrepreneurs for financing. The financing is in the form of microloans
for productive purposes, to be repaid with interest. The premise is that the loans are invested in
36
poorly-financed microenterprises and enable borrowers to make strategic decisions for business
growth and survival (Guiso et al., 2004; Matin et al., 2002; Sen, 1999). These loans are expected
to increase the income from self-employment and in the long-run should lead to poverty
reduction (Matin et al., 2002).
The performance of MFIs and benefits to the recipient depend on the characteristics of the
lending program, the recipients and the general context (Cohen & Snodgrass, 1997). Program
characteristics like collateral requirements and lending model (Armendáriz & Morduch, 2010;
Attanasio et al., 2015; Morduch, 1999), borrower characteristics like gender and education
(Barrett et al., 2001; Nanayakkara & Stewart, 2015), and purpose of borrowing may influence
the outcomes from borrowing.
MFIs have different ways of selecting program recipients, but many target poor women, for
different reasons. Firstly, women have generally been underserved by MFIs because of different
socio-cultural barriers (Meyer, 2013). Secondly, women play a key role in maintenance of
household welfare and allocate a large proportion of their resources to this (Barnes et al., 1999;
Cheston & Kuhn, 2002; Kabeer, 2005). Loans to women are expected to benefit entire
households. Studies have reported significant effects of borrowing on household consumption
and child nutrition for female but not male clients (Pitt, Khandker, Chowdhury, & Millimet,
2003).
MFI activity in Uganda commenced and greatly expanded in the 1990s. By the end of 2009,
the country had over 350,000 active MFI clients (UBOS & MoFPED, 2014). The Association of
Microfinance Institutions of Uganda (AMFIU) reported 84 MFI members in 2011 (AMFIU,
2011). BRAC Uganda Microfinance Limited, commonly referred to as BRAC, is one of the
largest micro-lenders in rural areas in Uganda (UBOS, 2010a). Its operations in Uganda started

37
in 2006. In 2011, it was reported to have a loan portfolio of UGX 31 billion (about € 11 million)
and 107,000 active borrowers, predominantly (98.4%) women. BRAC thus works with women in
rural Uganda, who play a key role in agriculture, a major sector of employment in Uganda
(UBOS, 2016). Like other MFIs that work with underserved rural agrarian recipients, BRAC has
enormous potential to contribute to agricultural production, reduction of food insecurity and rural
poverty, and improvement of the lives of poor women (Meyer, 2013).
A lot has been written about the operations and contributions to poverty reduction of BRAC
and other MFIs in Bangladesh (Chemin, 2008; Chemin, 2012; Develtere & Huybrechts, 2002;
Montgomery, Bhattacharya, & Hulme, 1996; Pitt & Khandker, 1998). However, not much work
has been done on MFIs in Uganda. We conducted a study to assess the contribution of
microcredit to production and household food security as overall objective. We aim to add to the
body of literature the potential of microcredit to contribute to food security improvements in
resource-constrained agrarian communities. In this paper we present findings on the context and
characteristics of the BRAC microfinance program in Uganda. We evaluate the characteristics of
the borrowers, their reasons for borrowing, the process of loan application, loan allocation, use
and repayment. The question we address is whether the BRAC program is well aligned with the
characteristics and needs of the borrowers.
The remainder of the paper is organised as follows: Sections 2.2–2.5 provide background
information, including a description of the BRAC microfinance program. Section 2.6 provides
the study design and data collection methods. Section 2.7 presents our findings including the
characteristics of the BRAC microfinance program as well as comparisons of the socio-
demographic and personality and microenterprise characteristics of current and in-coming
borrowers. We also present focus group discussion (FGD) results on the reasons for borrowing,

38
loan allocation and use as well as the dynamics of loan repayments. In Section 2.8 we present the
discussion and conclusion.
2.2 Uganda country profile
Uganda is a tropical country in East Africa with an estimated population of about 35 million
people according to the recently concluded Uganda population and housing census (UBOS,
2016). The country is divided administratively into 121 districts. In 1962 Uganda obtained its
independence from Great Britain. The post-independence economic growth was short-lived
when between 1970 and the early 1980s, the country plunged into years of political and financial
stagnation under despotic leadership (UBOS & ICF, 2012). In 1986, the National Resistance
Movement took over leadership of the country and embarked on what was envisaged to be a
period of growth for the country. In the late 1980s, the new government implemented the
structural adjustments programmes (SAPs) promoted by the IMF and World Bank. This included
restructuring of the public sector, reduction of public spending, and privatisation of poorly
performing government parastatals. Many government workers were retrenched and the role of
the private sector in the development of the country gained prominence. Unfortunately one of the
undesirable outcomes of the SAP was the government giving up provision of services that
previously supported poor women. At the same time there was a widening gap between men and
women for the control of productive resources (Makokha, 2001). The need for women to join the
informal sector by setting up microenterprises also increased.
The government committed itself to macroeconomic stability with a resultant period of
economic growth. The 1990s saw Uganda ranked among the fastest growing economies in sub-
Saharan Africa, in terms of GDP. The high inflation rate of the 1980s was brought down to less
39
than 10% in the 1990s. By the year 2000 the country lost a substantial part of its reproductive
labour force to HIV and AIDS (Karuhanga, 2008), but progress has been made in the fight
against HIV, with recent data putting prevalence at 7.4% (Republic of Uganda, 2014b).
Between 1995 and today, the country has continued to make economic progress, albeit at a
slow rate. There has been some progress in the reduction of poverty to the current level of
19.7%. Poverty levels remain higher in rural areas, where agriculture is the mainstay of rural
livelihoods (MoFPED, 2014). The country still ranks as one of the poorest in the world, with a
GDP per capita of 423 in 2014 and GDP growth rate of 4.9% in 2014. Agriculture remains the
major form of employment with 57% of women and 55% of men engaged in agriculture, forestry
and fisheries (UBOS, 2016). The country has poor human development indices, with total
fertility rate at 6.5 per woman, maternal mortality rate at 438, infant mortality rate at 54 and
under-five mortality rate at 90, per 1000 live births (UBOS & ICF, 2012)
2.3 Evolution of microfinance in Uganda
After the SAPs of the late 1980s, the government of Uganda shifted focus to the private sector,
particularly the financial sector, as an engine of development of the country. The financial sector
was poorly performing due to poor regulation and lack of control. The government launched the
financial sector reform strategy to improve efficiency in the sector. This included among others
licensing of private financial institutions and liberalisation of borrowing rates and the foreign
exchange market (Bategeka & Okummu, 2010).
During 1997–1999 poorly performing banks were closed. Some of these had a wide national
coverage, including rural areas. The result was a sector vacuum in many parts of the country.
The remaining banks struggled with defaults and remained reluctant to lend to the rural poor
40
(Bategeka & Okummu, 2010; Carlton et al., 2001). The government then implemented the
financial institutions act to strengthen supervision of the financial sector, including MFIs. With
the sector being more stable and streamlined, the first MFIs in Uganda began operations in 1990
and thrived. Rapid expansion of the sector took place in the mid-1990s. From 1997 onwards, the
collaborative effort of Bank of Uganda, donors, NGOs and capacity building partners resulted in
strengthening the MFI sector. The Association of Microenterprise Finance Institutions of Uganda
(AMFIU), launched in 1997, aims at providing a platform for sharing experiences, technologies
and also to work as a lobby group for MFIs. In 2000, the different stakeholders came together to
synchronise operations and develop a framework of regulation and control for the sector.
Coupled with the closure of two major banks, this created opportunities for MFIs to expand
(Bategeka & Okummu, 2010; Carlton et al., 2001). In 2003, the government passed the
microfinance deposit-taking act which allowed pioneer MFIs in Uganda to take deposits under
regulation of the Bank of Uganda. This act enhanced collaboration among MFIs and between
traditional MFIs (e.g. FAULU, PRIDE and the Uganda Microfinance Union) and formal banks
that also offered microfinance services. Providers who originally offered group loans shifted to
individual loans as clients complained about the rigours of weekly loan repayment meetings.
Those who maintained group borrowing reduced the required minimum group size to as low as
three borrowers. Individual loan requirements were also changed to more realistic forms of
collateral, such as salaries, vehicle log-books, guarantors, unregistered land ownership
documents, post-dated cheques, and other valuable assets (Mutesasira & Kaffu, 2003; Wright &
Rippey, 2003). New products were designed to target the poorer segments of the population.
Despite the aforementioned adjustments, several challenges remained. Wright et al. (1998)
reported high drop-out rates among MFI borrowers in Uganda. They observed that because of

41
the concentration of MFIs in urban areas many did not reach poor clients, but instead reached
rich and not-so-poor clients. The not-so-poor dropped out after the 3rd
and 4th
cycles when larger
loan sizes translated into unmanageable repayment instalments. The poor clients in rural areas
dropped out or rested because of seasonal variations in incomes and expenditures or family
emergencies that depleted the borrowed funds and led to repayment failure. The rich dropped out
because of frustration with the obligatory weekly meetings or because they found the loans too
small for their needs (Wright et al., 1998). Another problem was multiple-borrowing prompted
by the need for patch-up loans for the small amounts offered by some MFIs and the need for
emergency loans to fund health and education expenditures (Wright & Rippey, 2003).
2.4 Characteristics of MFI programs and their recipients
To enable them reach their target groups efficiently and achieve good loan repayment levels,
MFIs need to specify the target group characteristics (usually age and sex) and have to decide on
matters like group lending versus individual lending, loan amounts, interest rates and fixed
periods of loan repayments. Some MFIs lend to individuals, others only to members of
borrowing groups. The group lending model is widely associated with the Grameen Bank in
Bangladesh. Groups of 5–20 women decide to form a borrowing group but are given individual
loans. The group is responsible for repayment of the loans. When a member fails to repay, all
members may then be denied subsequent loans (Armendáriz & Morduch, 2010; Morduch, 1999).
Group loan programs have been found to reach more women than individual loan programs.
Advantages to the MFI include peer screening and monitoring, which diminishes problems of
moral hazard and information asymmetry (Morduch, 1999; Niels & Lensink, 2007). This
supports high repayment levels even in the absence of collateral (Ghatak, 1999; Ghatak &

42
Guinnane, 1999). Group meetings may also function as venues for social marketing on health,
nutrition, agriculture or family planning. In addition social networks are built and utilised in
group sessions (McKernan, 2002; Pitt, Khandker, McKernan, & Latif, 1999). However, the
obligatory weekly meetings and the social pressure may be a burden to the borrowers (Wright et
al., 1998). Hence, some MFIs have now moved away from group lending to individual lending
(Meyer, 2013).
Most MFIs provide production credit, some consumption credit. Mahajan and Ramola (1996)
observed that the poor usually have relatively high demand for consumption credit. However,
since this is rarely offered, production loans are used for consumption purposes. MFIs target
borrowers of different characteristics regarding age, sex, and education, which may influence the
outcomes of the programs. Whereas Pitt and Khandker (1998) reported positive outcomes for
female borrowers, Kaboski and Townsend (2012) found no positive outcomes. The level of
education influences outcomes positively (Attanasio et al., 2015). MFIs also have different
policies regarding maximum and minimum loan size (AMFIU, 2011). Loan size may influence
the willingness of clients to join a program and also the outcomes of the programs. Some loans
may be too small to make contributions to poverty reduction. The success of microfinance also
depends on the context in which a program is implemented (Chliova, Brinckmann, &
Rosenbusch, 2015; Coleman, 1999; Kabeer, 2005). Some programs target the urban poor, others
the rural poor, and some have no specific categories as long as borrowers can pay (AMFIU,
2011).

43
2.5 Study area
Our study was conducted in the districts of Mukono and Buikwe, both located in the central
region of Uganda, within the Lake Victoria basin. The districts were selected based on two
criteria. The first one was the presence of BRAC microfinance activities among rural agrarian
clients. The second was the MFI having expansion plans which was necessary for the
identification of new borrowers for the study (see Table 2.1). Mukono district shares borders
with Buikwe in the East. The relief, climate and fertile soils make the area suitable for
agricultural production (Mukono District Local Government, 2010).
With a population of about 599,817 people Mukono ranks seventh out of the 121 districts of
Uganda, whereas Buikwe has a population of about 436,406. Most people in Mukono (73%) and
Buikwe (67%) live in rural areas (UBOS, 2016). Over 80% of the population in rural parts of
both districts rely on agricultural production. Subsistence agriculture is characterised by low
acreage due to increasing family sizes and land fragmentation, and by low productivity per unit
area because of deteriorating soil fertility. Because of the proximity to the lake and the presence
of rivers and many fish landing sites, fishing is an important economic activity in the two
districts. Most fish is taken by big fish processing companies for the export market (Mukono
District Local Government, 2010). Buikwe district is located 62 kilometres by road east of
Kampala. It became a separate district in 2009 (UBOS, 2016).
2.6 Method
2.6.1 Study design and instruments
Employing a methodology sometimes referred to as the USAID/AIMS comparative cross-
sectional analysis design (Gaile & Foster, 1996; Nelson et al., 2004), we compared the
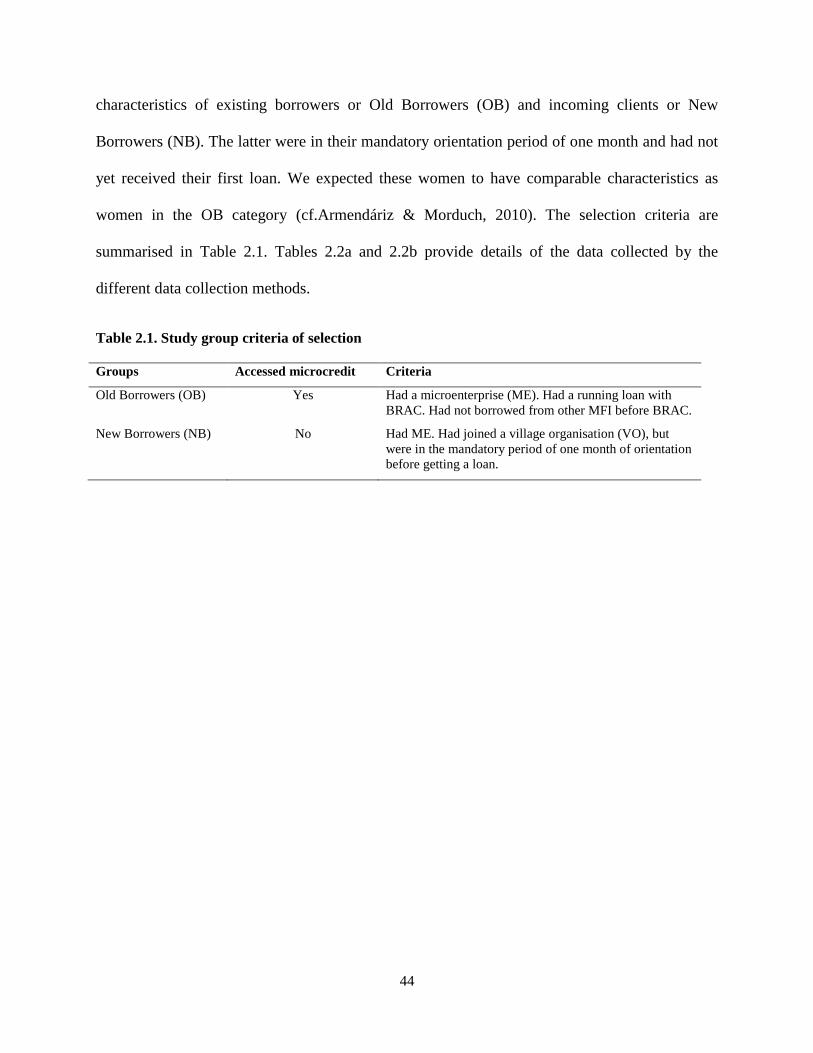
44
characteristics of existing borrowers or Old Borrowers (OB) and incoming clients or New
Borrowers (NB). The latter were in their mandatory orientation period of one month and had not
yet received their first loan. We expected these women to have comparable characteristics as
women in the OB category (cf.Armendáriz & Morduch, 2010). The selection criteria are
summarised in Table 2.1. Tables 2.2a and 2.2b provide details of the data collected by the
different data collection methods.
Table 2.1. Study group criteria of selection
Groups Accessed microcredit Criteria
Old Borrowers (OB) Yes Had a microenterprise (ME). Had a running loan with
BRAC. Had not borrowed from other MFI before BRAC.
New Borrowers (NB) No Had ME. Had joined a village organisation (VO), but
were in the mandatory period of one month of orientation
before getting a loan.

45
Table 2.2a. Summary of data collected in the quantitative survey
Data category Variables of interest
Respondent socio-
demographic characteristics
Respondent age, marital status, education and religion and savings.
Household information Numbers, age, and sex composition of household members
Microcredit-related
information
Loan amount, loan cycles, loan allocation and expenditure and loan-repayment
Non-farm ME data Type and monetary value of MEs
Crop ME data Types of crops.
Animal ME data Types of animals
Time preference items1
(Adapted from Petrocelli,
2003)
(1) I only focus on the short term; (2) I live more for the present than for the
future; (3) The future will take care of itself.
Achievement motivation
items1 (Adapted from
Keinan and Kivetz, 2011,
and Ray, 1980)
(1) I get restless and annoyed when I feel I am wasting time; (2) I have always
worked hard to be among the best; (3) I am an ambitious person; (4) Improving
my life is important to me
Risk Preference items1
(Adapted from Blais and
Weber, 2006)
(1) I enjoy taking part in decisions with un-known outcomes; (2) I avoid
activities whose outcomes are uncertain (reverse scored); (3) to gain high profits
in business one should take decisions even when uncertain of the outcomes; (4) I
would invest all my monthly profit in a new business venture.
1 Personality characteristics scale (1=agree strongly; 2=agree to some extent; 3=disagree to some extent; 4=disagree
strongly)
Table 2.2b. Summary of data collected by qualitative methods
Data category Discussion themes
Focus group
discussion data
Reasons for borrowing, loan repayment, group dynamics in loan repayment, benefits of
borrowing, types of loan-funded MEs.
Key informant
interview
Characteristics of the BRAC microcredit program
2.6.2 Organisation of the study
The original questionnaire was designed in English. To reduce inter-interviewer variation in
administering the questions and for easy communication with the respondents, it was translated
into Luganda (local language) by the Institute of Languages of Makerere University. Seven
Luganda-speaking enumerators with experience in conducting surveys were selected,

46
interviewed and trained. During the training, enumerators also translated and back-translated the
questionnaire and the result complemented the translation by the professional translators.
Initial enumerator training lasted one week. During this time, the interviewers were oriented
about the study questions, objectives and data collection methods. Role-plays were used to
practice how to approach and address respondents and how to introduce the study and ensure
compliance. Points of emphasis during the training included respondent categorisation, themes
and objectives of different sections of the questionnaire, self-introduction and introduction of the
study to respondents, proceeding through the questionnaire, and the importance of getting
complete data. After the training a pilot study was conducted by collecting data from 25
respondents. The data collected was then analysed to ensure its usefulness for meaningful results
and analysis, especially for the open parts of the questionnaire. A few modifications were made
to the questionnaire after this activity. Given that it was not easy to obtain alternative
respondents especially in the NB category, these respondents were re-interviewed to obtain data
that was originally missed.
2.6.3 Sampling and data collection procedures
All BRAC branches in Mukono and Buikwe districts were eligible for inclusion into the study.
We purposively included BRAC branches that had expansion plans, a pre-requisite for
recruitment of new borrowers (NB). In order to balance out the effect of loan period and loan
cycles, we also sampled and included Village Organisations (VOs) that had existed for more than
two years. BRAC branch managers and loan officers used loan sheets to aid in the selection of
VOs, with typically agrarian borrowers. VOs for NBs were newly-formed VOs or had new
borrowers. All women in a selected VO were eligible as respondents, except those who

47
previously borrowed from other MFIs. NBs were enrolled in the study during the mandatory
one-month orientation period into BRAC. OBs were women with a running loan with BRAC and
were selected from VOs in the same or neighbouring village as selected NBs. Drop-outs from
OB groups were traced and interviewed to reduce drop-out bias. Karlan (2001) proposed
inclusion of drop-outs in borrowing group analyses if possible, in case they would possess
unique characteristics that could lead to biased outcomes. Information about the BRAC
microcredit program was obtained from FGDs with the borrowers and from key-informant
interviews with BRAC loan officers, branch managers and the area manager. We got some
information from BRAC loan-borrower documents, that we were able to access and also attended
some VO meetings to understand more about the program operations.
With the consent of the participants and after assurance of confidentiality baseline data
collection was undertaken between September 2013 and March 2014. Six FGD sessions were
held for OB groups and two for NBs. Each focus group comprised 8–15 participants who had not
been respondents in the survey and from groups not included in the survey. Detailed notes and
audio recordings were used to record the interviews. A FGD guide was used to elicit information
from participants about their opinions and experiences with borrowing.
The following problems were encountered:
Interviews were sometimes interrupted when conducted at the women’s work place
because they had to attend to their business clients.
Sometimes we had to deal with husbands who had to be convinced to give room for
the interview to take place and sometimes curious people who tried to listen in on the
interviews.
48
Respondents became uncomfortable when asked questions about their wealth and
expenditures.
Interviews lasted about two hours, which tried the patience of the respondents.
However, these problems did not affect the realisation of the study objectives. Each time we
carefully explained to the respondents the objectives of some of the intrusive questions to ensure
compliance and ease in response and requested non-respondents to excuse us as we conducted
the study. Working together with the chairperson of the village council also helped to get support
for the study.
2.6.4 Data operationalisation, processing and analysis
Data processing was an intensive activity of cleaning, coding, data entry and analysis. Data from
the open-ended parts of the questionnaire were processed into variables that could be used in
further analysis. All data were entered into IBM SPSS Statistics 22. Analysis was done using
Stata 10. In order to assess the characteristics of women BRAC reaches, we analysed base-line
data of 533 respondents. Of these 312 were current borrowers (OB) and 221 were in-coming
borrowers (NBs). They were from 138 VOs, from seven BRAC branches in Buikwe and Mukono
districts.
We compared OB and NB groups on socio-demographic and personality variables, including
religion, marital status, age, and years of education, time preference, risk preference, and
achievement motivation. Focus group discussion data were analysed using ATLAS.ti software,
to obtain the most commonly occurring issues during discussions. Principal components analysis
was used to check the dimensionality of the personality characteristics. We also constructed an
asset index and a housing facilities index, as a proxy for wealth using principal component

49
analysis of data on household wealth and asset ownership. We obtained two components from
our analysis. The household assets index included seven variables: numbers of tables, chairs,
beds, mattresses, cell phones, hoes and radios. The housing facilities index comprised the
variables of house ownership, TV ownership, presence of electricity, type of walls and the
material for the floor of the houses.
2.7 Results
2.7.1 Borrowing information and characteristics of the BRAC microfinance program
In this section we present our findings on the objectives and design of the BRAC microfinance
program, as obtained from our direct observations and interactions with borrowers, from focus
group discussions and in-depth interviews with different BRAC personnel.
The BRAC microfinance program targets poor women (aged 20–50 years) with stable
businesses to enhance the performance of their self-employment activities (agricultural or non-
farm microenterprises). BRAC uses the group lending model, to provide individual loans to
women who must belong to a village organisation (VO). The VOs in the study had on average 20
women. We were informed that groups above this are split. Indeed, we found groups with similar
names in the same village and sometimes holding meetings at the same place, which were
previously part of a bigger group.
BRAC’s policy is to mainly employ women in its programs. Although we observed males at
higher staffing ranks, all area managers, branch managers and credit officers were found to be
female. When starting in a new area, a survey is done to determine the potential for new
borrowers. The BRAC branch and area managers as well as credit officers (COs) are in charge of

50
expansion of BRAC activities in new areas by fostering VO formation and registration and
admission of women into the program. When a new area is deemed viable, a new branch is
established. Then COs move door-to-door to inform women about the microfinance program and
encourage them to form groups. New groups select their leaders (a chairperson, secretary and
cashier), chose a name for the group and decide where they will hold the weekly group meetings.
At the weekly meetings the CO assigned to the group explains BRAC policies and processes.
After a VO is established, old members bring in new ones. For all new members there is a
mandatory one-month period of orientation before receiving the first loan. A new member is
introduced by a seconder into the VO and has to present herself and her motivation to join the
group. Members will accept the new member based on how they judge the risk of default. On
acceptance into the VO, the new member will receive three independent inspections of her home
and business by the VO credit officer, the branch manager and the area manager. The inspections
are meant to confirm the physical existence and location of the woman’s residence and business
and to assess stability and viability of the business and the woman’s ability to pay the weekly
instalments. When the team is satisfied the group members may sign a group resolution of
admission into the group and the CO will sign the BRAC admission form. Upon admission, the
new member has to produce an introduction letter from the chairperson of her village, provide
three passport photographs and physically present to the group a guarantor (usually the husband)
who will repay the loan in case loan recovery fails. The final step of admission occurs at the
branch office, where the woman and her guarantor present themselves at a session chaired by the
area manager and the new VO members pay their annual registration fee.
Loan applications are guaranteed by every member of the group. Loan amounts must also be
agreed upon unanimously. Authorized microloans are disbursed in cash to individual women, at

51
the branch. At the time of the study the borrowers in the OB group had received credit on
average three times. The mean amount of the first loan was UGX 358,414 ($138), while the
average amount of running loans was UGX 725,000 ($278). The average number of weeks since
receiving the last loan for the respondents was 20 and since receiving the first loan 97 weeks.
Loans were repayable in either 20 or 40 equal weekly instalments, at flat interest rates of 12%
and 25%, respectively. The instalments are paid at weekly meetings with repayments
commencing one week following the receipt of the loan. Repayments are received from
individual members by the VO chairperson who passes the money over to the CO for checking
and bagging. At the end of the day’s rounds the CO hands over all payments received to the
branch cashier for banking. Women who are unable to make the week’s repayment before the
meeting day may request support from VO members. In case of a member’s payment failure the
group chairperson and credit officer urge members to cover the payment together by pooling
funds. A VO meeting may not disperse until all funds have been collected, counted and verified
in front of all women. When members fail or refuse to raise the funds for a defaulting member,
the loan guarantor will be contacted. If this fails as well, usually after a period of haggling and
arguing, the CO may reluctantly allow the meeting to disperse and visit the defaulting member’s
home or continue to seek the guarantor. If all fails, the branch cashier can deduct the deficit from
the CO’s salary. When all points to a woman’s inability to continue making her weekly
repayments, her loan guarantor is heavily leaned on to repay the loan in one instalment or weekly
payments until the full amount is paid up. In extreme cases, property of the woman (usually
some business asset) or of the guarantor may be confiscated.
We observed that credit officers were very vigilant in attending the VO meetings and hardly
ever failed to turn up, even in adverse weather conditions. Borrowers also regularly attended VO
52
meetings but resented the duration of the meetings. On days with special events, for example on
market days they would get impatient. COs and branch managers reported very good repayment
performance for initial loans and repayment difficulties with larger loans for successive loans
cycles when weekly repayment amounts commensurately increase. They identified two
categories of BRAC participants: the borrower category, consisting of women with a running
loan with BRAC, and the member category. The latter includes the borrower category plus
women who are new and did not yet borrow, and those who are ‘resting’. A woman was said to
be to be resting if she once belonged to a VO and had a BRAC loan, but decided not to apply for
another loan (yet). Resting borrowers were eligible to borrow again. Drop-outs are women who
stopped borrowing and even withdrew the security deposit (10% of the loan) that was retained
for all loans as insurance against defaults. Outstanding loans of defaulters could be recovered
from this deposit. BRAC has the lowest portfolio at risk (PAR) of MFIs in Uganda (Mohammad
Dulham Hussain Chowdhury, 2016, personal communication). At the time of the study the drop-
out rate was estimated at 15–20%. BRAC records we saw indicated presence of resting and drop-
out members in different groups, especially the older VOs. We could not establish actual drop-
out rates for it was hard for us to access borrowing sheets for most of the VOs we visited.
BRAC has no mandatory members’ savings program. However the women indicated
belonging to self-help Rotating Saving and Credit Associations (ROSCAs) in which they
mobilised savings for loan repayment and other lump-sum payments.

53
2.7.2 Socio-demographic and personality characteristics of current (OB) and in-coming
(NB) BRAC borrowers
This section presents survey data on the socio-demographic and personality characteristics of the
two groups of borrowers, OB and NB.
Table 2.3. Socio-demographic and personality characteristics of current and in-coming borrowers
Respondent Characteristic Sample Means
OB NB t
Dependency ratio 1.58 1.46 0.92
Age at first loan 35.23 33.03 2.31*
Education (Years) 7.35 7.22 0.39
Time preference score 3.48 3.36 1.46
Achievement motivation score 1.23 1.20 1.01
Risk preference 2.25 2.16 1.34
Anglican (%) 0.32 0.27 1.11
Pentecostal (%) 0.14 0.16 -0.81
Muslim (%) 0.21 0.19 0.64
Marital status (%) 0.70 0.71 -0.35
Household asset index 2.23 2.11 1.55
Housing facilities index 0.47 0.45 0.73
* p <0.05
The only characteristic the current and in-coming borrowers differed on was age (see Table
2.3). The average age for the OB group was significantly higher than that for the NB group.
Overall the majority of respondents had completed seven years of primary education. The
average time preference, achievement motivation and risk preference scores indicate that both
groups had a high future bias, a high need for achievement and are mostly risk neutral. The
majority were married and came from households with low household asset and housing
facilities indexes.
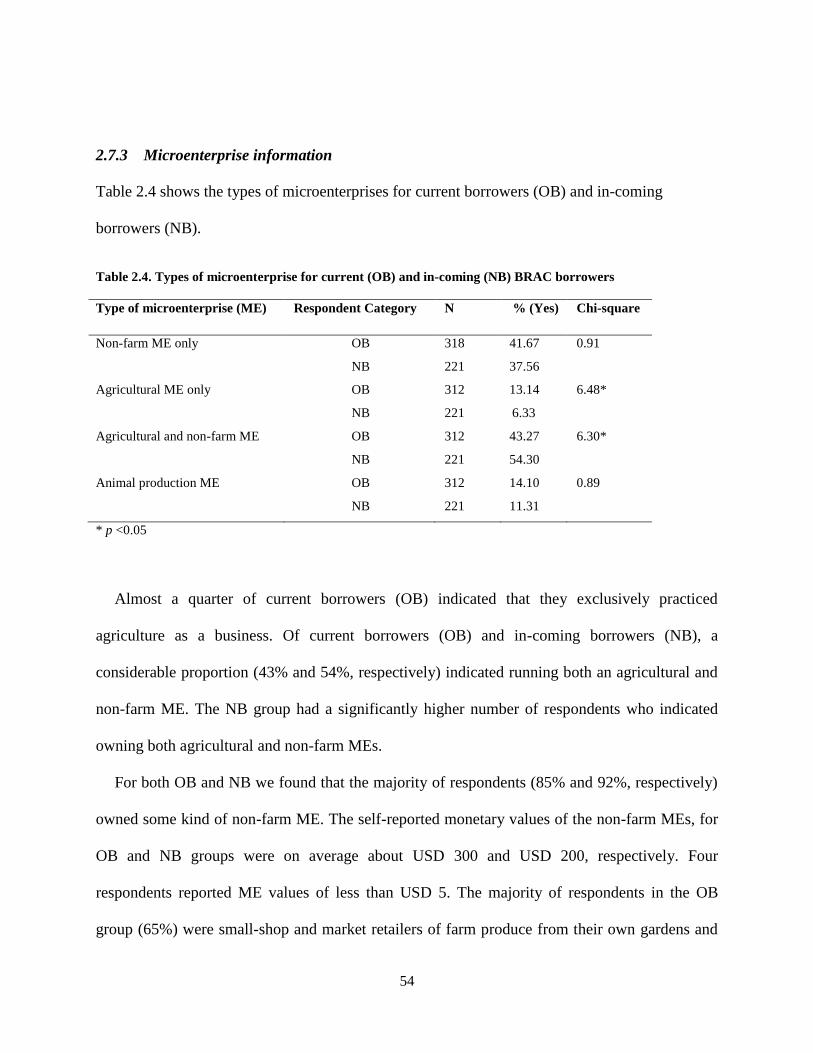
54
2.7.3 Microenterprise information
Table 2.4 shows the types of microenterprises for current borrowers (OB) and in-coming
borrowers (NB).
Table 2.4. Types of microenterprise for current (OB) and in-coming (NB) BRAC borrowers
Type of microenterprise (ME) Respondent Category N % (Yes) Chi-square
Non-farm ME only OB 318 41.67 0.91
NB 221 37.56
Agricultural ME only OB 312 13.14 6.48*
NB 221 6.33
Agricultural and non-farm ME OB 312 43.27 6.30*
NB 221 54.30
Animal production ME OB 312 14.10 0.89
NB 221 11.31
* p <0.05
Almost a quarter of current borrowers (OB) indicated that they exclusively practiced
agriculture as a business. Of current borrowers (OB) and in-coming borrowers (NB), a
considerable proportion (43% and 54%, respectively) indicated running both an agricultural and
non-farm ME. The NB group had a significantly higher number of respondents who indicated
owning both agricultural and non-farm MEs.
For both OB and NB we found that the majority of respondents (85% and 92%, respectively)
owned some kind of non-farm ME. The self-reported monetary values of the non-farm MEs, for
OB and NB groups were on average about USD 300 and USD 200, respectively. Four
respondents reported ME values of less than USD 5. The majority of respondents in the OB
group (65%) were small-shop and market retailers of farm produce from their own gardens and

55
from other farmers. Some also sold common household consumer goods. Few women (about
11%) offered semi-professional services of hair dressing and small-restaurant catering. Fifteen
percent of the combined sub-sample of NB and OB were involved in production-related
activities, such as crafts and liquid soap and bread making. Ten percent was involved in natural
resource extraction, like brick-making, stone-quarrying, and charcoal-burning. The majority of
the respondents was self-employed and did not employ others.
For both OB and NB about two-thirds of respondents with agricultural microenterprises were
food crop farmers. Maize and beans were the main crops produced for sale. The numbers of
women involved in traditional cash crop production were negligible. Few respondents (14% and
11%, respectively) reported practicing animal husbandry as a microenterprise. Respondents who
kept animals on the homestead considered these as a form of storage of wealth. Goats, chicken,
and pigs were the most commonly kept animals.
2.7.4 Reasons to borrow and loan repayment of borrowers
In the focus group discussions (FGD) women expressed their appreciation for BRAC enabling
them to access credit, because they lacked alternative sources of credit and could not meet their
lump-sum needs from their meager incomes. However, contrary to the expectation that loans
would be invested in productive activities, qualitative results revealed that many borrowers
invested only a fraction of the loan in their ME and used the rest for non-business purposes such
as school fees and building expenses. In the FGDs the following reasons for borrowing, in order
of frequency of occurrence, were mentioned: (1) pay children’s school fees; (2) recapitalise non-
farm microenterprises; (3) personal development; (4) household welfare and improvement; (6)
crop farming; (7) animal husbandry; (8) start a new business. This shows that non-business

56
expenses were among the motives for acquiring credit. We asked the women whether improving
food security improvement was a reason for borrowing, but they indicated it was not. They
claimed to have adequate food from their gardens most of the time, except during the planting
season. But they denied spending loan money on food purchases even then, which is reflected in
the following comments:
‘I cannot spend BRAC money on food purchase. But on the day I get the funds, I
may buy a kilogram of meat for my children, to encourage them to support my
efforts at loan repayment’.
‘Whenever I get a loan, I purchase a personal item for myself; could be a bag or a
dress. Sometimes after a while, it is all you have to show for the money you
borrowed’.
Education came out as an important reason for borrowing, which shows in the following
comment: ‘Our children can now go to school without being sent back home for fees’.
The borrowers indicated that they worked harder than before borrowing and harder than
women who did not borrow in order to be able to repay their loans. They found the BRAC policy
of loan repayment starting in the week after borrowing too tight. To comply with repayment
requirements, some borrowers kept a portion of the received loans to make repayments in the
weeks just after borrowing. The majority indicated to have more than one source of income, to
ensure funds for loan repayment. From the FGDs it transpired that indeed most women practiced
some kind of trade. We got comments like:
‘Everyone has something to sell. Some of us sell agricultural produce from our
gardens, others prepare and sell ready-to-eat snacks or have small retail shops or
market stalls’.

57
‘You cannot have only one source of income and manage loan repayment. If you
have borrowed, your brain does not rest like the women who did not borrow. If all
else fails, you put aside funds from what the husband has given you to take care of
the home and use if for loan repayment’.
For stopping to borrow the following reasons were given: (1) achieved the objective of
borrowing, usually business stabilisation; (2) the business collapsed; (3) ordered to abandon
borrowing by the husband; (4) sickness or death in the family leading to failure to repay loans;
(5) to get relief from the pressure of loan repayments; (6) high interest rates. Women indicated
that they found the interest rates rather high and also consider the security deposit an extra cost.
Some said they would have preferred larger amounts, but usually, this is not possible especially
with the first loan. Women could accept the loan application requirements and procedures the
first time but expressed discomfort with the same procedures for subsequent loans.
2.8 Conclusion and discussion
In this chapter, we sought to describe the characteristics of the BRAC microfinance program and
to assess the degree of matching between lender and borrower conditions and aspirations. We
determined the borrower characteristics, type of their business, and the reasons for borrowing
and dropping out. These were compared to BRAC procedures, goals, and objectives.
The BRAC modified Grameen lending model seems to fit the Uganda women quite well.
Women in Uganda are generally not faced with restrictions on their mobility and can venture out
of their homes, unlike in rural areas in South Asia where there is a tradition of purdah (Papanek,
1973). This makes it possible for the women to attend the weekly VO meetings. Additionally, the
fact that most credit officers are female reduces distrust among husbands.

58
In our case, we found evidence of the advantages of group lending with joint liability to loan
recovery, as has been reported in literature (Armendáriz & Morduch, 2010; Postelnicu, Hermes,
& Szafarz, 2014). Because women only admit women they know well into their group, they are
able to use their social ties to screen new members, monitor the process, and ensure loan
repayment by group members. Social capital is utilised to coordinate repayment decisions,
cooperate for mutual benefit and reduce loan defaults. The additional requirement of presenting a
loan guarantor also helps to ensure loan recovery.
The age and educational profile of the borrowers (both current and new) matched BRAC
program requirements. For women with only seven years of education it is difficult to participate
in the formal sector. With just basic literacy and numeracy skills such women face personal and
institutional barriers to formal credit access, leaving them poor and deprived. The BRAC
microfinance program with its reach into rural areas offers these women financial services they
otherwise would have no access to, different from some MFIs that shy away from rural areas and
from funding agricultural activities (UBOS, 2010a; Word Bank, 2007). Many BRAC borrowers
were engaged in subsistence food crop production with some relying exclusively on agriculture.
Women’s limited involvement in animal and cash crop production is probably due to societal
perceptions of women as household food providers (Gladwin et al., 2001; Schroeder, 1996) and
cash crop production as a male activity (Gladwin et al., 2001). Unfortunately, this limits women
borrowers’ earning capacity since food production has a time lag between investment and
returns. Agricultural incomes are also unreliable because of erratic climatic conditions and
depleted soils (Morvant-Roux, 2011).
Possibly to cope with the risks associated with agriculture, we found many respondents
owning both agricultural and non-farm microenterprises. Income diversification is a common

59
strategy in resource-constrained communities (Banerjee & Duflo, 2007; Barrett et al., 2001;
Ellis, 1998; Niehof, 2004b) and a prerequisite for the development of rural communities (Word
Bank, 2007). Livelihood diversification has been observed to increase with borrowing (Khandker
& Koolwal, 2016) and is practiced as an insurance against income shocks (Buckley, 1997).
Women engage in agricultural production using resources that are available to them (notably
own labour) and complement this with non-farm self-employment activities (Banerjee & Duflo,
2007). As observed by Smith, Gordon, Meadows, and Zwick (2001) and Buckley (1997) about
non-farm activities in Uganda, women get the start-up capital for such activities from the sale of
farm produce and sometimes husbands and children. Unfortunately, women usually start low-
return activities that have little potential to lift them out of poverty (Gladwin et al., 2001). In our
case, the non-farm microenterprises the women engaged in were small with low monetary value.
They had few business assets and were not employing others. The businesses seemed geared
towards survival rather than expansion and self-reliance, and reflect little innovativeness and
ambition. This may have to do with the context in which these women operate. Rural and
agrarian Uganda has no history of family business or artisanship to build on.
BRAC borrowers indicated that they work harder than before they received their loans.
However, rather than their hard work resulting in innovativeness and business expansion it
amounts to scurrying around between different activities in an effort to diversify income sources
to raise money for loan repayment. BRAC and other MFIs have a vision of financing the
entrepreneurial poor to facilitate improvement in their socio-economic status. It is questionable
whether this description applies to the borrowers in our study. Some of them seem to fit better in
the category of the ultra-poor of the BRAC Bangladesh Targeting the Ultra Poor (TUP) program
described by Hulme, Moore, and Seraj (2011). And perhaps they would benefit more from such a

60
program. As Viswanathan (2002) observed on the informal sector in West Africa, apart from
lack of credit women’s informal businesses are constrained by lack of entrepreneurial skills and
poor product differentiation. Women deal in almost the same type of products and services,
leading to undue competition. Similarly, Adams and Von Pischke (1992) noted that credit may
not be the biggest problem for agricultural small holders, who face price and other production
risks as well as transportation and other infrastructural challenges.
Some of the characteristics of the BRAC borrowers and their business do not seem to match
with BRAC program specifications. First, the requirement of repayment commencing in the
week following loan access is a notable problem for loans invested in farming, which require
time between investment and outputs. To avoid defaulting, women employ drastic measures like
selling off any kind of saleable agricultural produce, using part of the received loans to make
loan repayments, or shifting the burden to relatives, children and husbands. Secondly, BRAC
loans are rather small and some women indicated they would have preferred larger loan amounts
for more meaningful investments. However, in-depth interviews with BRAC credit officers
revealed increasing repayment problems when women graduate to larger loans that come with
larger weekly instalments. This shows that, contrary to the desire for larger loans expressed by
borrowers, the small loans provided in early loan cycles may be the most sustainable. Interest
rates are rather high and the loan processing procedure is rigorous. Montgomery et al. (1996)
observed that women in Bangladesh had problems with the BRAC security deposit requirement
because of the strict rules surrounding the deposit without borrowers having a say on its size and
when they may access it.
We pitted the reasons for borrowing against the objectives of the lender and found a potential
mismatch. Whereas potential BRAC borrowers must stipulate a productive use for loans, our

61
findings indicate that women borrow to obtain lump-sum amounts for use on school fees and
other expenditures. Montgomery et al. (1996), reported respondents to be reticent about such
loan diversions, but in our study respondents openly shared information about their use of loans
for non-productive purposes, revealing payment of school fees as a major motive for borrowing.
The strong aspirations for the education of their children that Dowla (2011) reported about
women in Bangladesh were also found among the women in our sample. Indeed, because
education removes barriers to engagement in better-paying non-farm employment (Barrett et al.,
2001; Word Bank, 2007). Although Uganda has a policy of universal primary and secondary
education, many state-sponsored schools face challenges of absentee teachers and poor quality
instruction (Deininger, 2003). This results in parents trying to find money to send their children
to private schools. But even though this might be a desirable investment, use of production loans
to finance education brings no immediate returns for loan repayment. As Dowla (2011) argued,
unlike land and other movable assets, expected future income from education cannot be used as
collateral against loans. Such an investment may lead to repayment burden. In line with our
results, UBOS (2010b) reported that in Uganda the three most frequent motives for borrowing
are: to get working capital for small businesses (25.9%), to buy consumption goods (15.9%) and,
third, to pay school fees (14.8%). Matin et al. (2002) conclude that loans enable the poor to make
lump-sum expenditures against small future savings and income which they use to make
repayment instalments. BRAC and/or the Uganda government could consider making loans
available to support children’s education. BRAC currently does have a scholarship scheme,
which could be modified to cater for the current need of women for their children’s education.
BRAC runs a strict procedure of assessment and review of loan applications, aimed at
assessing the borrower’s ability to make weekly loan repayments. But after loan disbursement

62
there is no supportive follow-up on the performance of the loan-funded enterprises. BRAC
already has programs that could support the women, but these probably have limited coverage
since the borrowers in the study were unaware of these programs. We found a few cases of
women borrowers who gave the loan to husbands and children to invest and provide funds to
enable the women to pay the instalments. Follow-up support might discourage the use of loans
for consumption which leaves women with the burden of repayment without a meaningful
investment. Follow-up with supportive services could contribute to realising both borrower and
lender objectives. Alternatively, as proposed by Mosley and Hulme (1998), BRAC could come
up with an alternative lending model with focus on consumption, with flexible repayment
periods and with a saving facility.
We can conclude that the BRAC microfinance program indeed reaches poor women who
otherwise would be unable to access funds to meet lump-sum needs. However, when these
women decide to get a loan, they do so against their future meagre earnings and pay back at a
frequency and cost which they eventually realise is rather high. They stop borrowing, as soon as
the immediate need for borrowing is met. To a certain extent, there is a match between the lender
and the borrower; women are able to meet their needs for borrowing and the lender is able to
attain good repayment levels. For long-term benefit of the borrowing program, however, there is
a need for the lender to reassess loan-term related issues, such as the interest rate,
commencement of loan repayment, and the loan processing requirements and procedures.

63
Chapter 3
Does microcredit improve performance of women-run non-farm
microenterprises?
Abstract
We investigated the effects of microcredit on the performance of non-farm microenterprises run
by small-holder female farmers in Uganda. We compared baseline data from a group of current
borrowers with new borrower data. Propensity score matching revealed positive effects of
microcredit on funds used to restock businesses, and on the monetary value of the
microenterprises.
In an alternative approach, we compared parameters for new borrowers, before and after
they received their first loan, and a control group of women who never received credit.
Difference-in-difference analysis of the baseline data and follow up after one year revealed
marginally significant improvement of microenterprise monetary value.
Concluding, borrowers invested reasonable fractions of received loans. However, the
borrowing context, loan repayment terms, type and size of microenterprises did not seem to
favour higher profits.
Publication status: Namayengo, M.M.F., van Ophem, J.A.C., and Antonides, G. 2016.
Does microcredit improve performance of women-run non-farm microenterprises? Under review at
International Small Business Journal.
64
3.1 Introduction
Self-employment by means of running a microenterprise (ME) is a widespread livelihood coping
strategy among poor people in developing economies (Banerjee & Duflo, 2007; Barrett et al.,
2001; Ellis, 1998; Margolis, 2014; Niehof, 2004b). Pursuit of non-farm income sources enables
households to mitigate risks associated with agricultural production. For example, erratic
weather patterns and depleted soils make agricultural-related income unreliable (Morvant-Roux,
2011). Enterprise diversification by adoption of non-farm MEs helps resource constrained
farmers to improve their livelihood sources and survive the failures in agriculture. In case of
failure in agricultural production, non-farm income sources then become key pre-requisites to
realisation of income and food security (FAO, 2016). Fortunately, if well managed, these sources
have potential to contribute to the well-being and development of communities (Word Bank,
2007). Operating in the informal sector, both in rural and urban areas, MEs in developing
economies contribute significantly to the owners’ livelihoods (Asian Development Bank, 1997;
Schreiner & Woller, 2003).
In the case of Uganda, self-employment and income diversification strategies in rural areas
gained prominence after the structural adjustment program (SAP) of the 1990s. One of the key
outcomes of the SAPs was growth of the informal ME sector, as retrenched government workers
joined the informal sector. At the same time, urban-to-rural financial remittances diminished, at a
time the government also reduced provision of services, like free medical care, that previously
benefitted the rural poor. Many rural dwellers, especially women, sought opportunities to pursue
non-farm employment usually in the form of MEs (Makokha, 2001). Government statistics show
that a larger proportion of the rural (61%) than the urban workforce (54%) was active in the
informal sector (UBOS, 2010b).

65
To support initiatives aimed at creating self-employment government implemented different
socio-economic interventions. These include, among others, support for youth and non-youth
with vocational and financial training, provision of start-up capital for ME establishment, and
sometimes direct income support (MoFPED, 2014). Government-supported savings and credit
associations (SACCOs) were also established to spur growth of household MEs.
As has been reported for other developing countries (Asian Development Bank, 1997;
Margolis, 2014; Schreiner & Woller, 2003) microenterprises in Uganda usually conduct low-
investment, low-income, low-productivity activities, including traditional crop farming, and
small scale retailing (Smith et al., 2001; World Bank, 2016b). ME activities are usually mixed
with the household economy and use little or no fixed assets. Many MEs in Uganda lack start-up
and working capital (UBOS, 2010b).
Microfinance is a popular global strategy for the supply of microcredit and other financial
services to poor people to promote ME development (Hulme, 2000a). Microfinance is a major
form of financing for the poor since they are usually excluded from financial markets
(Armendáriz & Morduch, 2010; Bornstein, 1997; Fletschner, 2009). It offers opportunities for
financial investments in MEs leading to business expansion and increased profitability of MEs
(Hulme, 2000a). Access to credit is expected to foster improvement or creation of livelihoods,
when credit is used to finance self-employment activities (Hulme, 1990). Many microfinance
institutions (MFIs) target poor women (Angelucci, Karlan, & Zinman, 2013; Banerjee et al.,
2015; Morris & Barnes, 2005). Women generally lack capital and access to credit is necessary to
expand or improve their productivity and income from MEs (Fletschner, 2009). Women have
been reported to perform better as MFI clients than men and microcredit granted to them has

66
been observed to lead to better household outcomes than that to men (Pitt & Khandker, 1998;
Pitt, Khandker, Chowdhury, & Millimet, 2003).
Microenterprise finance through provision of microcredit is enthusiastically regarded by
donors and non-governmental organisations as a tool for poverty alleviation in low-income
communities (Armendáriz & Labie, 2011; Armendáriz & Morduch, 2010; Hulme, 2000b).
However, these claims are still the subject of debate and much scrutiny (Crépon et al., 2015;
Mosley & Hulme, 1998). There is need to obtain more evidence on credit-attributable changes in
various contexts (Armendáriz & Morduch, 2010; Banerjee, 2013; Chliova et al., 2015).
Available studies on the impact of microcredit on households and MEs show mixed results.
Some studies found positive effects of microfinance participation on business income and profits
(Copestake et al., 2001; Crépon et al., 2015; Fofana, Antonides, Niehof, & van Ophem, 2015;
McKernan, 2002; Pitt & Khandker, 1998; Tedeschi, 2008) and on the general well-being of
families (Barnes, Keogh, & Nemarundwe, 2001; Panjaitan-Drioadisuryo & Cloud, 1999). Other
studies found no improvement in business income (Angelucci et al., 2013; Barnes et al., 2001)
and general wealth (Angelucci et al., 2013; Banerjee et al., 2015). Banerjee et al. (2015) and
Crépon et al. (2015) observed extra investments in businesses by microcredit recipients but
found no impact of microcredit on business profits or general development outcomes such as
education and health. Coleman (1999) observed insignificant effects of microcredit on savings,
production, sales, productive expenses, and expenditures on health and education.
We also reviewed studies of the impact of borrowing in Uganda and found one study by
Morris and Barnes (2005), who used a repeated cross-sectional design of borrowers and non-
borrowers of three MFIs in Uganda and obtained generally positive descriptive accounts of
effects of borrowing on recipients, their MEs and their households. Many impact assessment
67
studies have been conducted in Bangladesh where the microfinance movement started. Some
studies have alluded to some borrowers becoming worse off after borrowing (Barman, Mathur,
& Kalra, 2009; Copestake et al., 2001; Field et al., 2012; Goetz & Gupta, 1996; Rahman, 1999a),
on account of high interest rates, over-indebtedness and repayment stress, lack of control over
loans and increased domestic and group-related violence. Recent randomised evaluations of the
effects of microfinance in countries in four continents, as described by Banerjee, Karlan, and
Zinman (2015) did not provide conclusive evidence on the effect of borrowing on
entrepreneurship, business size and women empowerment, and concluded that borrowing is not
as effective as once envisaged. However, they failed to confirm the negative effects of borrowing
on households.
Since the success of microfinance depends considerably on the context within which a
program is implemented (Coleman, 1999; Kabeer, 2005) as well as the socio-economic
conditions and personality characteristics of recipients (Snodgrass & Sebstad, 2002), we
analysed the impact of microcredit on different business outcomes (ME worth, recurrent business
expenditures, and profits), for resource-constrained rural agrarian clients in Uganda. Over the
past few decades, the microfinance industry in Uganda has experienced rapid growth in the
number of active borrowers, mainly consisting of women, estimated at 350,000 by the end of
2009 (UBOS, 2010a). While the government of Uganda supports MFIs as important partners in
national development NPA (2010), there is limited information regarding their impact on
targeted communities. Poverty continues to be a big problem (World Bank, 2016b) and women
resort to set up poorly financed microenterprises (Ishengoma & Kappel, 2008; Rooks, Szirmai, &
Sserwanga, 2009) as a source of income and livelihood. Many MFIs provide financial support to
women with the objective of improving the outcomes and profitability of the MEs. However it is

68
not clear whether the women actually invest their received credit in the MEs, and whether the
MEs improve in performance.
Provision of microcredit is expected to spur ME growth and expansion since lack of financing
is considered a limiting factor to ME expansion. We thus make the assumption in this study that
provision of microcredit to women will lead to improvement in the performance of the MEs of
poor women, for various reasons. First, microloans may be invested in factors, inputs and
practices that promote higher ME outcomes and profits, leading to higher business turnover and
profits. In addition, borrowers may take up more risky but more profitable investments. On the
other hand, ME performance may deteriorate or remain unchanged after borrowing for various
reasons. First, loan fractionation between MEs and other household needs may leave only a
fraction of the received loan for ME investment. MEs may thus not become more profitable. In
addition, loan repayment may continuously drain the MEs, affecting profitability and growth.
Lastly, ME improvement may not be a core objective of borrowing.
In this paper, we aim at assessing differences between ME performance parameters of
borrowers and non-borrowers using different performance indicators. We seek to assess whether
borrowing induces changes in investments in non-farm MEs, the operation of MEs, and their
monetary worth and profits. We also explore factors that may explain these effects for a sub-
sample of respondents who run non-farm MEs.
Our main research question is whether access to microcredit leads to improvement in the
performance of non-farm microenterprises. To answer the research question, we employ two
study approaches. The first is a quasi-experimental approach that uses cross-sectional data from a
treatment group of old borrowers (OB), in the BRAC Uganda microcredit program (see Section
3.2), and a control group of new borrowers (NB), who self-selected to participate in the BRAC

69
microcredit program, before they received their first loan. We use propensity score matching to
further ensure comparability of the groups and to assess differences between treatment and
control groups.
In the second approach, we use one-year panel data from the NB category and control group
(CG), who never got a loan from BRAC or other MFI. We employ a difference-in-difference
(DID) estimation with Kernel matching to assess differences between ME performance
parameters and profits for borrowers and control households. Next, we describe our theoretical
framework, study methods, and results. We conclude with a discussion of our results.
3.2 Theoretical framework for relation between microcredit and microenterprise
development
This section is a summary of the theory of change in households and enterprises, resulting from
microcredit. It provides the theoretical basis of the key variables of the study.
Women constitute a large percentage of the world’s poor (Fletschner, 2009). By 1995, about
70 per cent of the 1.3 billion people living on less than $ 1 per day, were women (UNDP, 1996).
Hampered by low levels of education and skills, female participation in formal employment is
limited. They thus resort to self-employment by setting up small survival and maintenance
microenterprises. These poorly-financed microenterprises have low financial and human capital
provisions, and low returns, and yet they constitute a major source of livelihood for women and
their households (Jiggins, 1989; Schreiner & Woller, 2003).
Proponents of microfinance argue that women lack access to credit and that credit access will
lead to increase in the income of households by increasing investment in income-generating
activities, diversification of income sources (Khandker & Koolwal, 2016), and smoothing of

70
consumption (Armendáriz & Labie, 2011; Armendáriz & Morduch, 2010; Khandker & Koolwal,
2016), hence contributing to food security. Generally, access to credit is expected to improve the
social and economic status of women in society (Fletschner, 2009; Hermes & Lensink, 2011).
There are many paths through which borrowing may affect individuals and households.
Introduction of MFI activities in an area improves access to financial service, including
microcredit (Guiso et al., 2004; Kaboski & Townsend, 2012). Borrowers after credit access may
then change their production and consumption decisions (Crépon et al., 2015). They may invest
in a new business, expand an existing one or increase their labour supply (Banerjee et al., 2015;
Crépon et al., 2015). The extra investment is expected to lead to, among others, improved
productivity (Matin et al., 2002), ME expansion, increased business outputs, profits and income,
and asset accumulation (Gobezie, 2004; Karlan & Goldberg, 2011; McKernan, 2002; Sebstad et
al., 1995). The human capital of borrowers may improve also from non-credit MFI services, like
training, business sharing and group support, which may improve business and self-employment
skills (McKernan, 2002), and ME output. However, diversion of microloans to non-ME
expenditures may deprive MEs of capital and negatively affect ME profitability or expansion
(Gifford, 2004; Rutherford, 2011).
Microenterprises in rural communities are intertwined with other household economic
activities. Decisions about these activities are made in due consideration of the trade-offs and
options within the overall household economy (Sebstad et al., 1995). Income from self-
employment microenterprise activities is complemented with farm income from the sale of crops
and animals (Ellis, 1998). Microenterprises depend to varying degrees on the household for
capital, labour and inputs. The reverse is also true, since households depend on the MEs as
sources of cash (Sebstad et al., 1995) and income in kind. The income and cash flow within

71
households is fungible with allocation and reallocation of funds between different livelihood
activities. Because MEs are firmly embedded in the household among poor families, searching
for the impact of microcredit may take care of fungibility issues, due to loan diversion, by
looking for impact on household consumption, in addition to production (MkNelly & Lippold,
1998).
Generally, microcredit is expected to lead to development and poverty reduction by
stimulating creation or expansion of microcredit, resulting in improvement in household income,
asset accumulation, and economic security (Sebstad et al., 1995). The nature and state of the
business (Crépon et al., 2015; De Mel et al., 2009; van Rooyen et al., 2012), socio-demographic
attributes, such as level of schooling (Bates, 1990; Berger, 1989; Crook et al., 2011; De Mel,
McKenzie, & Woodruff, 2009; Fletschner, 2009; Rakodi, 1999), gender (De Mel et al., 2009),
age and marital status (Copestake et al., 2001; Feroze et al., 2011; van Rooyen et al., 2012), may
affect the impact of microcredit on enterprise performance. Furthermore, time preference, risk
preference, and the need for achievement may explain the decision to borrow (Bauer, Chytilová,
& Morduch, 2012), and the success or failure of the microenterprise (Begley & Boyd, 1987;
Rauch & Frese, 2000). Time preference negatively influences the willingness to invest
(Frederick, Loewenstein, & O'donoghue, 2002), whereas risk preference and need for
achievement positively influence entrepreneurial decisions (Wärneryd, 1988). Household
structure and household composition may influence support available to recipients, and decision
making on time and resource allocation (Berger, 1989; Cheston & Kuhn, 2002; Fletschner, 2009;
Gifford, 2004; Hulme, 2000a; Nelson et al., 2004; Rakodi, 1999). Finally, social networks may
influence microenterprise survival and productivity (Attanasio et al., 2015; Gifford, 2004;

72
McKernan, 2002; Rakodi, 1999). It appears that microcredit may lead to business improvement,
depending on a number of personal and social factors influencing the way of spending the loan.
In this study, we tested the following hypothesis: Participation in the microcredit program
leads to improvement in performance of women run-MEs. The ME performance indicators
assessed were restocking amounts, primary ME value, number of employees, and ME profits. In
addition, we explored the effect of different socio-demographic and personality characteristics on
level of profits for non-farm MEs.
3.3 Methods
3.3.1 Study design
The design of the current study is presented in Table 3.1. The overall study was a panel design in
which we collected data on three categories of respondents. The first category was the old
borrowers (OB) group who had running loans with BRAC. The second category consisted of in-
coming new borrowers into BRAC (NB), before they received their first loan. The third group of
respondents consisted of a group of women from the same villages as NBs, with a non-farm ME,
but who never borrowed from BRAC or other MFI (CG).
Table 3.1. Study design
Groups Microcredit
intervention
before t1
Measure ( t1) Microcredit
intervention
after t1
Measure (t2)
Old Borrowers (OB) Yes Outcome
variables (O1)
_ _
New Borrowers (NB) No Outcome
variables (O2)
Yes Outcome
variables (O4)
Comparison group (CG) No Outcome
variables (O3)
No Outcome
variables (O5)

73
During the baseline study we collected data on the three study groups. We used a quasi-
experimental cross-sectional design in which we compared non-farm ME performance
parameters for OB and NB borrowers based on the methodology sometimes referred to as the
USAID/AIMS comparative cross-sectional analysis design as described by Nelson et al. (2004).
We compared non-farm ME performance parameters of a treatment group of existing borrowers
(OB) and a group of incoming borrowers (NB), before they received their first loan. The basis of
this methodology in the assessment of the effect of microcredit is that, since both groups had
already self-selected to participate in microcredit, and one had just not received the loan, the
difference between outcome measures for the two may be taken as the effect the intervention.
Furthermore, we carried out two waves of data collection for the NB and the CG groups,
respectively, and these were used to obtain an alternative measure of the effect of microcredit on
non-farm ME performance using the difference-in-difference (DID) method.
3.3.2 Sample
We use clients of BRAC, which is one of the largest micro-lenders in the world and in Uganda.
Details of the BRAC microfinance program as well as Buikwe and Mukono districts where we
conducted the study are given in Chapter 2 of this thesis. The results in this chapter are based on
a comparison of OBs and NBs, with non-farm MEs. It also contains results for comparison of
new borrowers (NB) with non-farm MEs, to a control group (CG), with non-farm MEs. Details
of data collection are provided in Chapter 2 of this thesis.
74
3.3.3 Measures
Data collection was undertaken between September 2013 and March 2014. It entailed both a
questionnaire-based survey and qualitative focus group discussions (FGDs). FGDs were used to
explore respondents’ reasons for borrowing, loan allocation and use, and perceived benefits of
borrowing to MEs and households, among others. Six FGD sessions were held for OB groups
and two sessions for NBs. The focus groups each comprised 8–10 participants, and included
groups which had not been included in the quantitative study. Information about the BRAC
microcredit program was obtained from loan officers.
The questionnaire elicited information on sociodemographic characteristics of respondents
and their households, household expenditure, enterprise-related expenditure and income, as well
as several personality variables. Details of the variables we obtained from the questionnaire and
those which we derived are given in Tables 3.2 and 3.3.
Socio-demographic and personality measures were assumed to reflect stable personality
characteristics that might explain residual heterogeneity in the samples of new and old
borrowers.

75
Table 3.2. List of questionnaire-based variables
Data category Variables of interest
Socio-demographic
characteristics
Respondent age, marital status, education and religion
Household information Numbers and ages of household members
Time preference items1
(Adapted from Petrocelli,
2003)
(1) I only focus on the short term; (2) I live more for the present than for the
future; (3) The future will take care of itself.
Achievement motivation
items1 (Adapted from
Keinan and Kivetz, 2011,
and Ray, 1980)
(1) I get restless and annoyed when I feel I am wasting time; (2) I have always
worked hard to be among the best; (3) I am an ambitious person; (4) Improving
my life is important to me
Risk Preference items1
(Adapted from Blais and
Weber, 2006)
(1) I enjoy taking part in decisions with un-known outcomes; (2) I avoid
activities whose outcomes are uncertain (reverse scored); (3) to gain high profits
in business one should take decisions even when uncertain of the outcomes; (4) I
would invest all my monthly profit in a new business venture
Microcredit-related
information
Loan amount, loan cycles, loan allocation and expenditure and loan-repayment
Non-farm ME data Type and monetary value of ME
Recurrent ME Summation of expenditures for paid labour, rent transport, electricity, tax and
licences, loan repayment, telephone costs and repairs
1 Personality characteristics scale (1=agree strongly; 2=agree to some extent; 3=disagree to some extent; 4=disagree
strongly)

76
Table 3.3. Glossary of calculated /derived study variables
Variable Derivation method
ME profit calculation
We used a profit proxy described by Daniels (2001); It involved summation of
the total value of products consumed by the household, money from the ME used
by the household and any money left over after restocking the ME
Loan-taking initiative score
based on question (Qn. 207)
A loan-taking initiative score was a measure of borrower initiative to take a loan.
It was based on responses to the question inquiring whose initiative it was to take
the loan (0=Spouse and others, 1=Self and spouse, 2=Self)
Repayment dependency
ratio (Qn. 208a)
Repayment dependency score was a measure of borrower autonomy in loan
repayment. It was based on responses to the question about who was/would be
responsible for the repayment of the loan (0=Others/Spouse, 1=Self and spouse,
2=Self)
ME loan–repayment score
(Qn. 210 and 210a)
The ME loan-repayment score was a measure of ME importance in loan
repayment. It was based on responses to the question identifying source of funds
for the last loan repayment (0=Spouse and others, e.g. VO members and family,
1=Sale of agriculture produce, 2=Proceeds from loan funded MEs)
Assets index (Qn. 412) The first component of principle components analysis (PCA) of respondent
household asset ownership included seven count variables (number of tables,
chairs, beds, mattresses, cell phones, hoes, and radios) used to calculate the assets
index
Housing facilities index
(Based on Qn. 412)
The second component of PCA included variables related to housing and housing
facilities (house ownership, TV ownership, electricity presence, type of walls of
the house, and the material for the floor) used to calculate the housing facilities
index 1 Personality characteristics scale (1=agree strongly; 2=agree to some extent; 3=disagree to some extent; 4=disagree
strongly). Question numbers refer to the questionnaire in the Appendix.
3.3.4 Residual heterogeneity in the data in cross-sectional sample and in the panel study
To ensure comparability of the OB and NB groups further we used Probability Score Matching
(PSM). Factors which could influence self-selection into microcredit and those which could
influence microcredit outcomes were used as control variables in the PSM procedures, including
nearest neighbour, weighted Kernel and radius matching (Luellen et al., 2005). These factors
comprised respondent background characteristics including age, religion, years of education,
dependency ratio, time preference, risk preference, and achievement motivation. In order to
compare with the NBs, all age-related variables of OBs were converted to the age basis at the
time of their first loan, indicated as ‘corrected age’, ‘corrected family size’, and ‘corrected
77
dependency ratio’ hereafter. The control variables were used to construct propensity scores
estimating the probability of being in the control or treatment group.
The PSM procedure was also used to estimate the effect of receiving microcredit. The
rationale of PSM is to match the participants in the treatment group to those in the control group
based on propensity scores. Therefore any remaining differences observed can be attributed to
the treatment. The average treatment effect on the treated (τATT) was defined as:
τATT = E(τ |D = 1) = E[Y (1)|D = 1] − E[Y (0)|D = 1] (1)
where D = 1 if a participant received microcredit and D = 0 otherwise. Y(D) is the outcome
variable of each participant while [Y (0)|D = 1] is counterfactual and unobservable. According to
Rosenbaum and Rubin (1983) τATT can be expressed as:
τATT = EP(X)|D=1 [E[Y (1)|D = 1, P (X)] − E[Y (0)|D = 0, P (X)]] (2)
where P(X) is the propensity score, that is, the probability of an individual to participate in the
microcredit program given the observed characteristics X.
DID–PSM analysis of panel data.
Panel data analysis involved comparison of data for NBs and CG respondents using the DID
approach in combination with PSM. DID measures the impact of microcredit on borrowers by
comparing treatment and control groups on changes in outcomes of interest over time relative to
the outcomes observed in the baseline survey (Armendáriz & Labie, 2011). The method
recognises that unobserved heterogeneity in participation is present, but assumes that such
factors are time invariant (Khandker et al., 2010). We obtained the difference between outcome
variables between the two time periods (T1−T2) and netted out roles of measured and
unmeasured individual attributes that do not change over time. Since this difference may be a

78
reflection of differences in the broader social and economic environment, we use the control
group baseline and follow-up control measures to obtain C1 and C2 differences.
That is, given the two-period setting, where t=0 before borrowing and t=1 after borrowing,
letting 𝑌𝑡𝑇
and 𝑌𝑡𝐶 be respective outcomes of treatment and control units in time t, the DID
method was used to estimate the average microcredit impact as follows:
DID = E ((YtT − Y0
T|T1 = 1) − E(Y1C − Y0
C|Ti = 0)) (3)
𝑇1 = 1 denotes respondents accessing credit at t = 1, whereas 𝑇1 = 0 denotes the control group
that never received or applied for microcredit. The DID estimator has the advantage of allowing
for unobserved heterogeneity (the unobserved difference in mean counterfactual outcomes
between treated and untreated units) that could lead to selection bias.
We improved the DID methodology by combining it with Kernel matching (Khandker et al.,
2010). We used propensity scores based on factors (socio-demographic and personality
characteristics of NB and CG) which could influence participation in the microcredit program to
match controls and borrowers on pre-program characteristics, in the baseline year. We then
obtained differences between NB and CG groups within the common support region, on different
food security parameters.
3.4 Results
In this section, we present empirical results of our assessment of cross-sectional and panel
analysis of differences in non-farm ME performance for borrowers and those without credit. In
the cross-sectional analysis, we compare baseline ME parameters for OB and NB groups. We
then present longitudinal 2-year panel data comparison for CGs and NBs. Finally, we discuss the
study findings and conclude.

79
3.4.1 Cross-sectional OB/NB comparison results
In this section, we present quasi-experimental analysis results for 467 respondents who had non-
farm MEs. These were used in the cross-sectional comparison of old borrowers (OB, n=264) and
new borrowers (NB, n=203). As mentioned before, PSM was used to ensure comparability of the
two groups. It was also used to determine the average treatment effect on the treated (ATT), a
measure of differences between treatment and controls, after controlling for variables that could
influence taking credit.
Probability score matching
Descriptive characteristics of the respondents in the cross-sectional study before and after
matching on factors that would influence microcredit participation are shown in Table 3.4.
Table 3.4. T-tests for equality of means for different variables before and after matching (NB/OB)
Characteristic Unmatched sample means Matched sample means % Bias % Bias
reduction OB NB t OB NB t
Dependency ratio 1.56 1.44 1.03 1.56 1.59 0.26 -2.60 74.50
Age at first loan
(years)
34.76 32.82 2.00* 34.76 34.56 0.21 2.10 89.70
Education (years) 7.24 7.42 0.57 7.24 7.27 0.10 -0.10 83.70
Time preference 3.45 3.42 0.38 3.45 3.44 0.14 1.30 65.00
Achievement
motivation
1.07 1.05 0.93 1.07 1.06 0.45 4.50 51.60
Risk preference 2.27 2.26 0.14 2.27 2.25 0.28 2.70 -96.00
Anglican (%) 0.31 0.25 1.39 0.31 0.29 0.51 5.00 64.00
Pentecostal (%) 0.12 0.16 1.23 0.12 0.13 0.34 -3.20 74.10
Muslim (%) 0.26 0.19 1.55 0.19 0.26 0.05 0.50 97.00
Marital status (%) 0.69 0.71 0.44 0.69 0.71 0.50 -4.80 -10.20
Household asset
index
2.13 2.07 0.81 2.13 2.15 0.15 -1.40 82.30
Housing facilities
index
0.44 0.45 0.39 0.44 0.45 0.49 -4.60 -20.60
*p < 0.05

80
The probit regression analysis of treatment and control group membership, before matching,
indicated no differences in education level, dependency ratio (defined as the ratio of dependents,
aged 0–14 years, and those over 65 years, to the household productive members, 15–64 years),
time preference, achievement motivation, and religion, between the treatment and control
groups. Older women were more likely to be part of the OB group. Respondents in both groups
had limited formal education, regardless of the group to which they belonged (OB or NB). The
average length of schooling was 7.2 years for both groups. The dependency ratio was similar for
both groups (1.44 for NB and 1.56 for OB). The majority of women in both groups were
married. Both groups had respondents with a moderate future time preference (average score =
3.4) on the 4-point time preference scale. After matching, the two groups became about equal for
all control variables in the study (Table 3.4).
Borrowing information for respondents in the cross-section comparison
Table 3.5 shows borrowing information including loan taking initiative, loan amount and the
loan investment ratio defined as the proportion of loan invested in productive activities for OB
and NB respondents
Table 3.5. Borrowing information for OB and NB respondents
NB OB
Variables Max Min Mean SD Max Min Mean SD
Loan-taking initiative indexa 2 0 1.02 0.92 2 0 1.24 0.91
Repayment dependency scoreb 2 0 1.46 0.89 2 0 1.54 0.83
Fraction of loan to be and/or
actually invested into MEc
1 0 0.87 0.30 1 0 0.73 0.32
ME-repayment scored 2 0 1.90 0.38 2 0 1.82 0.55
Financial burden scoref 1 0 0.60 0.49 1 0 0.60 0.49
Notes: a level of initiative to take last loan;
b autonomy of borrower during loan repayment;
c anticipated or actual
percentage of loan invested in ME; d
score of ME as source of funds to repay the loan; e level of burden on woman
for household financial expenditures.
81
The average scores of loan-taking initiative for the NB and OB respondents were 1.02 and
1.24, respectively. This means that the decisions to take loans were mainly taken by women
together with others, who may have included other women, loan officers or husbands.
About loan repayment, one-third of the respondents hoped others would be in charge of
paying back the received loans. The calculated loan repayment dependency score (our measure
of how much women were in charge of loan repayment) was between 1 and 2 (1.46 and 1.54 for
NB and OB, respectively). This implied that a few borrowers expected others rather than
themselves to be in charge of loan repayment.
In a similar way, we asked OBs to indicate the source of funds for last loan repayment. For
the NBs we asked them what would be the source of funds for the first loan repayment. Results
were used to calculate the ME repayment score, a measure of degree of reliance on the ME as
source of ME repayment funds. For both NBs and OBs, we obtained ME-loan repayment scores
close to 2, the maximum possible score for the ME as a source of funds for loan repayment (see
Table 3.5). This implied that MEs were considered the major source of funds for loan repayment
for both OBs and NBs.
Contrary to the expectation that microloans would be invested entirely in productive
activities, both qualitative and quantitative results revealed that loan recipients invested fractions
of the microloans between non-farm MEs, and lump-sum non-business expenditures (usually
school fees and building expenses). Quantitative results revealed that even before accessing
loans, NBs anticipated allocating most of the received funds (87%) into MEs, with the remaining
percentage being allocated to other household expenditures. The OB category reported investing
73% of the loans into MEs. On average NBs anticipated investing 10% of received loans into the
education of children. The OBs reported a similar percentage. From the FGD results we found
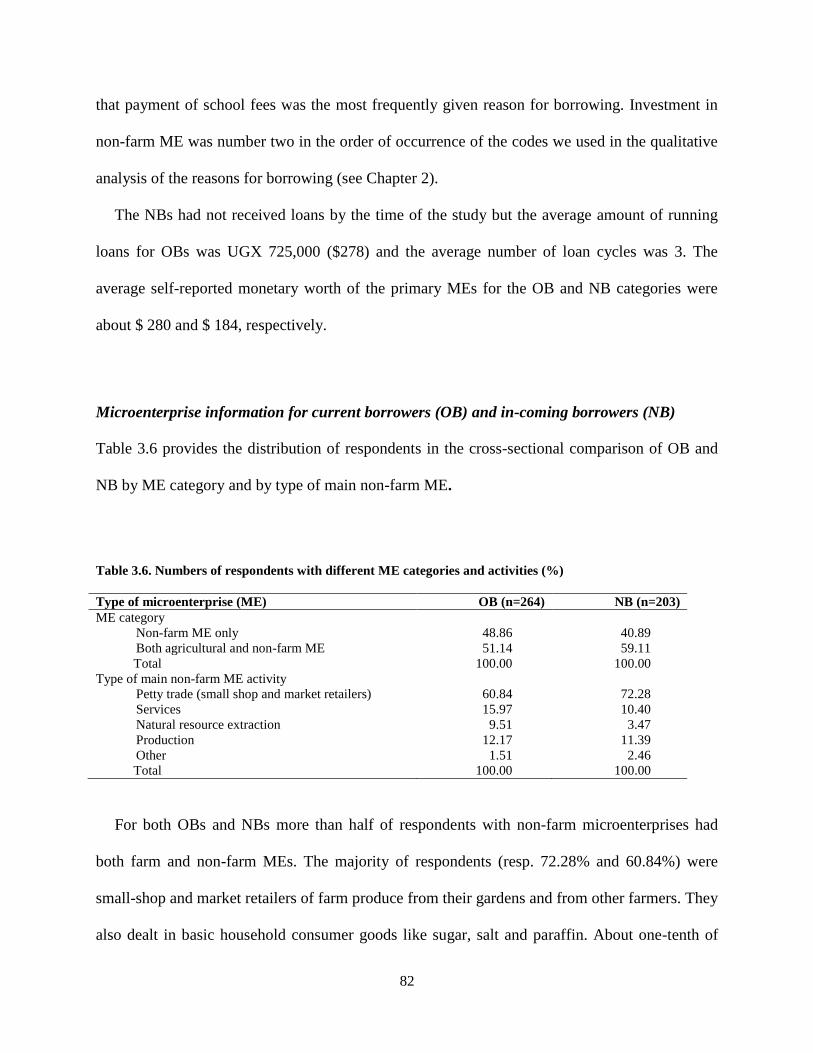
82
that payment of school fees was the most frequently given reason for borrowing. Investment in
non-farm ME was number two in the order of occurrence of the codes we used in the qualitative
analysis of the reasons for borrowing (see Chapter 2).
The NBs had not received loans by the time of the study but the average amount of running
loans for OBs was UGX 725,000 ($278) and the average number of loan cycles was 3. The
average self-reported monetary worth of the primary MEs for the OB and NB categories were
about $ 280 and $ 184, respectively.
Microenterprise information for current borrowers (OB) and in-coming borrowers (NB)
Table 3.6 provides the distribution of respondents in the cross-sectional comparison of OB and
NB by ME category and by type of main non-farm ME.
Table 3.6. Numbers of respondents with different ME categories and activities (%)
Type of microenterprise (ME) OB (n=264) NB (n=203)
ME category
Non-farm ME only 48.86 40.89
Both agricultural and non-farm ME 51.14 59.11
Total 100.00 100.00
Type of main non-farm ME activity
Petty trade (small shop and market retailers) 60.84 72.28
Services 15.97 10.40
Natural resource extraction 9.51 3.47
Production 12.17 11.39
Other 1.51 2.46
Total 100.00 100.00
For both OBs and NBs more than half of respondents with non-farm microenterprises had
both farm and non-farm MEs. The majority of respondents (resp. 72.28% and 60.84%) were
small-shop and market retailers of farm produce from their gardens and from other farmers. They
also dealt in basic household consumer goods like sugar, salt and paraffin. About one-tenth of

83
both NBs and OBs were involved in production-related activities, including making crafts, liquid
soap and bread. Common natural resource extraction activities included brick making, charcoal
burning as well as hand-splitting of stones in stone quarries. Average monetary worth of MEs
was UGX 730,000 ($ 300), with 50% of the current borrowers (OB) having MEs worth about
UGX 450,000 ($ 173), and a quarter with MEs worth about UGX 200,000 ($ 77).
Effect of microcredit on performance of women-run non-farm MEs
The respondents used in the assessment of effect size were not significantly different across
control and treatment groups on all weighted control variables of the study after matching. Also,
the balancing condition was met, indicating similar distributions of the control variables
independent of treatment status. Since the PSM procedure indicated that potential bias between
the treatment and control groups was removed, differences in outcomes could then be attributed
to the effect of microcredit.
Table 3.7. Effects of microcredit on non-farm ME performance (PSM with Kernel matching) for all
respondents in the study
Outcome variable N ATT
(OB)
N ATT
(NB)
Difference t
Ln (profit) 217 11.95 185 11.79 0.16 1.31
Ln (monthly expenses for trade) 217 11.37 185 11.04 0.33 2.68*
Ln (total ME value) 217 12.96 191 12.49 0.47 4.24*
Ln (restocking amount) 213 11.78 193 11.54 0.24 2.32*
Number of employees 148 0.15 193 0.14 0.00 0.11
* p<0.05
Results of the PSM analysis (Table 3.7) of baseline OB and NB data for all respondents with
non-farm MEs revealed positive effects of microcredit on recurrent business input expenditures

84
(expenditures other than restocking), the self-reported monetary worth of the MEs, and the funds
used for restocking the businesses, transformed into logarithms. The OBs spent on average 33%
more than NBs on recurrent business expenditures (other than business stock). We also found a
24% difference in investments in stock acquisition on ME restocking days between OBs and
NBs. In the same line, self-reported monetary worth of non-farm MEs for OBs was 47% larger
than for NBs. However, we found no difference between OBs and NBs on profits from the MEs,
although we note a positive trend.
Table 3.8. Effect of microcredit on non-farm ME performance (PSM with Kernel matching result)
(Comparison of NBs to OBs with 2 loan cycles only)
Outcome variable N ATT
(OB)
N ATT
(NB)
Difference t
Ln (profit) 114 11.89 178 11.80 0.09 0.65
Ln (monthly trade expenses) 124 11.27 185 11.04 0.23 1.44
Ln ( ME value) 122 12.80 128 12.43 0.4 3.03*
Ln (restocking amount) 122 11.74 129 11.55 0.18 1.50
Number of employees 122 0.13 193 0.14 -0.01 -0.17
* p < 0.05
A comparison of NB respondents to OBs with two loan cycles only (Table 3.8) was done to
imitate the loan cycles of the NBs in the CG/NB comparison of the panel data (see Section 4.2).
Typically, the one-year period in the panel data included two loan cycles. We still found the
monetary value of OB to be higher than NB in this comparison.
3.4.2 FGD results about borrowing and non-farm ME performance
In the FGDs we asked the respondents about the status of their MES after borrowing and if they
got loan repayment funds from their loan funded MEs. FGDs participants indicated investing
85
some loan funds in their non-farm MEs. Expansion of non-farm MEs was an important reason
for borrowing as seen from the comment below:
‘We borrowed money because we didn’t have enough money to do what we wanted to do.
For example me I had a business but with little capital so I came to BRAC to borrow
money so that I could add some more capital into my business’.
As discussed in Chapter 2, women indicated working harder than before borrowing, on their
farm and non-farm MEs with the aim of getting funds for loan repayment and for other needs.
About the status of ME performance after borrowing, a number of borrowers observed that
their MEs had expanded after borrowing, and were doing much better. The non-farm MEs were
important sources of funds for loan repayment. In addition, proceeds from non-farm MEs were
used to ensure household welfare. The women were happy to have funds for meeting basic needs
they did not have before, as indicated in the following comments.
‘Funds from non-farm MEs are used for school fees payment, and to buy basics for the
home because most husbands stop helping us when they see that we have borrowed
money’.
On the contrary, some felt that the MEs had not grown as indicated in the following
comments.
‘Businesses grow but not to a level where one can always get money out of it’.
And from another respondent:
‘Sometimes the business stagnates due to seasonal changes in demand, in that case women
use past savings to repay loans. Sometimes women do casual jobs to get loan repayment
money’.

86
Regression results for the predictors of ME profits
In order to check the robustness of our results, and to determine the predictors of profits from the
MEs, we conducted an Ordinary Least Squares (OLS) regression analysis including the same
control variables as in the PSM. The treatment effects from OLS (Table 3.9) were of the same
order of magnitude as the PSM results (Table 3.7). OLS was done for the baseline data for OBs
and NBs with all OBs in the study, regardless of the number of loan cycles.
Results of the regression analysis of control variables on the profits from the non-farm MEs
revealed that age, risk preference and marital status were negative predictors of levels of profits
from MEs. Older, risk averse and married respondents were found to register lower profits from
their MEs. However the study wealth index positively predicted profit levels from the MEs.
Table 3.9. Socio-economic and socio-demographic predictors of ME profits
Parameters Coefficients
Treatment 0.15 (0.12)
Dependency ratio 0.04 (0.05)
Respondent age -0.01 (0.01)**
Respondent education 0.03 (0.02)
Time preference -0.06 (0.08)
Achievement motivation score -0.45 (0.33)
Risk preference -0.10 (0.06)*
Assets index 0.09 (0.08)
Housing index 0.31(0.17)*
Anglican 0.01 (0.15)
Pentecostal 0.04 (0.18)
Moslem 0.08 (0.16)
Marital status -0.22 (0.13)*
R2 0.07
** p <0.05, * p < 0.10; figures in brackets are standard errors
Sensitivity analysis
We conducted a sensitivity analysis of our matching procedure to obtain information about
possible hidden bias or bias from unobserved respondent characteristics with potential to

87
influence self-selection into microcredit program. Such unobserved variables could bias our
conclusions about the effects of microcredit and we tested this by conducting a sensitivity
analysis (DiPrete & Gangl, 2004; Rosenbaum, 2010). We obtained p-values for the Wilcoxon
signed rank tests for different levels of gamma (Γ), the odds ratio of differential treatment
assignment due to unobservable attributes. Each Γ was evaluated at the critical p-value (0.05),
the limit of significance level of the treatment effect due to endogenous selection into treatment.
We obtained results for up to Γ=3, for monetary value of MEs, and funds used on restocking
days. Results indicate that unobservable covariates would need to change the odds of treatment
assignment by factors beyond 3 (we obtained results to as high as 56 and the significance did not
change) to conclude that the observed treatment effects from propensity score matching were due
to non-random assignment.
3.4.3 Panel results
The panel data analysis was conducted on a total of 327 respondents, who had non-farm MEs.
The treatment group in the panel study were 211 new borrowers (NB) who at baseline were just
about to get their first loan. The control group (CG) were 116 women from the same villages as
NB but who never got a loan from BRAC or other MFI.
Probability score matching
Table 3.10 shows that there were differences in risk preferences between the treatment and the
control groups. Respondents in the control group were more poor in housing facilities and more
risk averse than the NB category. We used propensity score matching (PSM) with Kernel
matching of CG and NB groups, during the DID analysis, to reduce the self-selection bias and
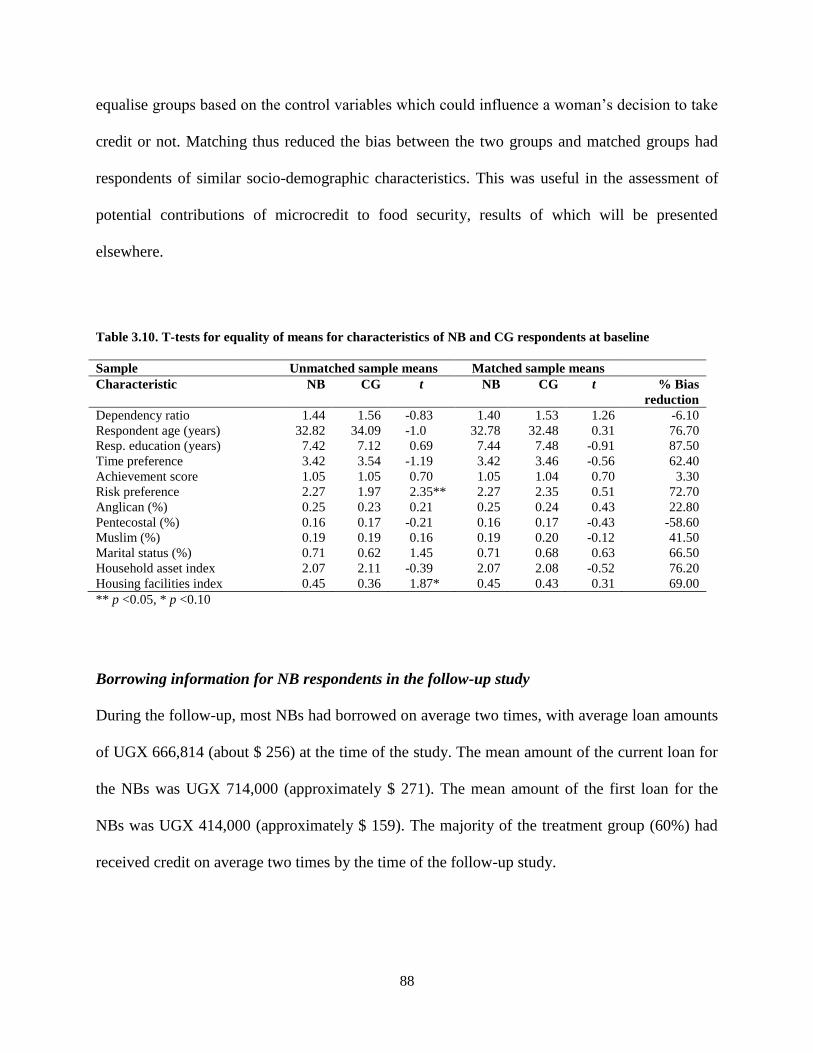
88
equalise groups based on the control variables which could influence a woman’s decision to take
credit or not. Matching thus reduced the bias between the two groups and matched groups had
respondents of similar socio-demographic characteristics. This was useful in the assessment of
potential contributions of microcredit to food security, results of which will be presented
elsewhere.
Table 3.10. T-tests for equality of means for characteristics of NB and CG respondents at baseline
Sample Unmatched sample means Matched sample means
Characteristic NB CG t NB CG t % Bias
reduction
Dependency ratio 1.44 1.56 -0.83 1.40 1.53 1.26 -6.10
Respondent age (years) 32.82 34.09 -1.0 32.78 32.48 0.31 76.70
Resp. education (years) 7.42 7.12 0.69 7.44 7.48 -0.91 87.50
Time preference 3.42 3.54 -1.19 3.42 3.46 -0.56 62.40
Achievement score 1.05 1.05 0.70 1.05 1.04 0.70 3.30
Risk preference 2.27 1.97 2.35** 2.27 2.35 0.51 72.70
Anglican (%) 0.25 0.23 0.21 0.25 0.24 0.43 22.80
Pentecostal (%) 0.16 0.17 -0.21 0.16 0.17 -0.43 -58.60
Muslim (%) 0.19 0.19 0.16 0.19 0.20 -0.12 41.50
Marital status (%) 0.71 0.62 1.45 0.71 0.68 0.63 66.50
Household asset index 2.07 2.11 -0.39 2.07 2.08 -0.52 76.20
Housing facilities index 0.45 0.36 1.87* 0.45 0.43 0.31 69.00
** p <0.05, * p <0.10
Borrowing information for NB respondents in the follow-up study
During the follow-up, most NBs had borrowed on average two times, with average loan amounts
of UGX 666,814 (about $ 256) at the time of the study. The mean amount of the current loan for
the NBs was UGX 714,000 (approximately $ 271). The mean amount of the first loan for the
NBs was UGX 414,000 (approximately $ 159). The majority of the treatment group (60%) had
received credit on average two times by the time of the follow-up study.
89
Microenterprise information for controls (CG) and in-coming borrowers (NB)
Table 3.11 provides summary information for categories and types of microenterprises for in-
coming borrowers (NB) and controls (CG). During baseline a larger proportion of CG (56.90%),
had non-farm MEs only compared to NB (39.80%). On the other hand more NB (56.87%) than
CG (30.17%) had both farm and non-farm MEs, respectively.
At the baseline, a total of 101 CG respondents had some form of non-farm ME, the majority
(61.39%) being small-shop and market retailers. The number for the NB category was 203
respondents, the majority (72.41%) being small-shop and market retailers. Fifty percent of
respondents for both NB and CG sub-categories had MEs worth about UGX 200,000 ($ 77),
while a quarter had MEs worth about UGX 100,000 ($ 38).
At follow-up a larger proportion of CG (55.68%) had non-farm MEs only compared to NB
(39.86%). On the other hand more NBs (55.41%) than CGs (38.64%) had both farm and non-
farm MEs, respectively.
At the follow-up 84 CG respondents had some form of non-farm ME, with the majority
(55.95%) being small-shop and market retailers. The corresponding number for the NB category
was 136 respondents, with the majority (72.71%) being small-shop and market retailers.
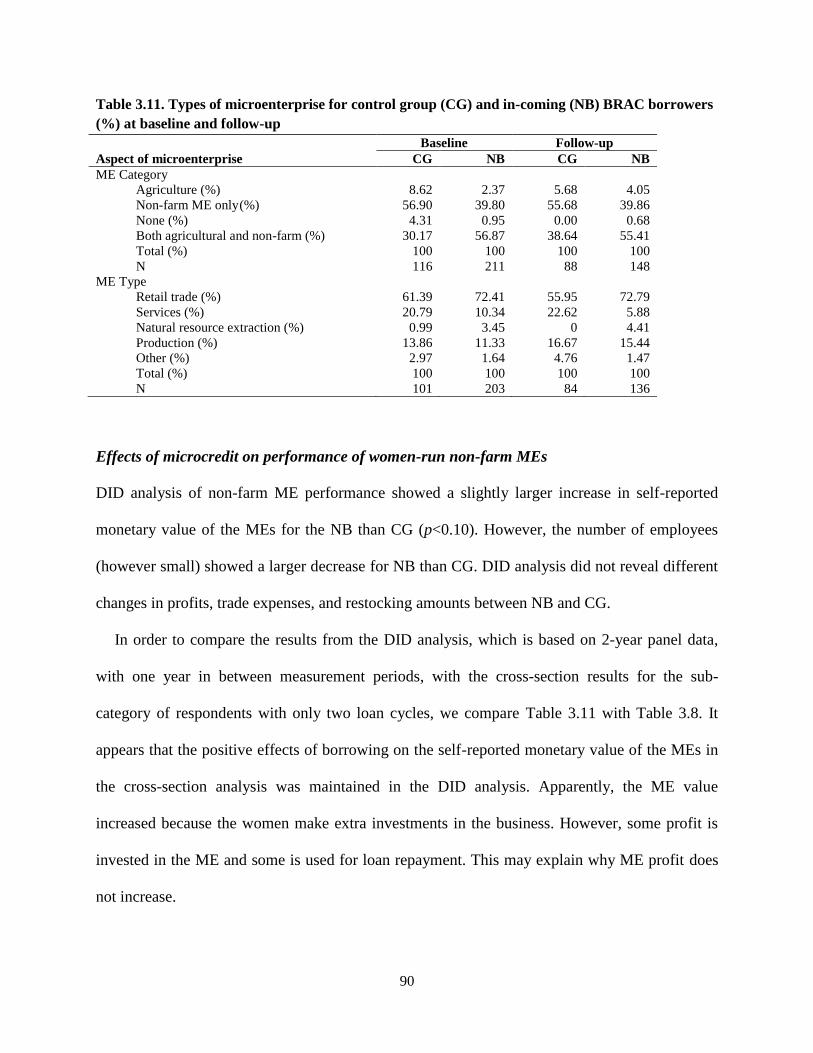
90
Table 3.11. Types of microenterprise for control group (CG) and in-coming (NB) BRAC borrowers
(%) at baseline and follow-up
Baseline Follow-up
Aspect of microenterprise CG NB CG NB
ME Category
Agriculture (%) 8.62 2.37 5.68 4.05
Non-farm ME only (%) 56.90 39.80 55.68 39.86
None (%) 4.31 0.95 0.00 0.68
Both agricultural and non-farm (%) 30.17 56.87 38.64 55.41
Total (%) 100 100 100 100
N 116 211 88 148
ME Type
Retail trade (%) 61.39 72.41 55.95 72.79
Services (%) 20.79 10.34 22.62 5.88
Natural resource extraction (%) 0.99 3.45 0 4.41
Production (%) 13.86 11.33 16.67 15.44
Other (%) 2.97 1.64 4.76 1.47
Total (%) 100 100 100 100
N 101 203 84 136
Effects of microcredit on performance of women-run non-farm MEs
DID analysis of non-farm ME performance showed a slightly larger increase in self-reported
monetary value of the MEs for the NB than CG (p<0.10). However, the number of employees
(however small) showed a larger decrease for NB than CG. DID analysis did not reveal different
changes in profits, trade expenses, and restocking amounts between NB and CG.
In order to compare the results from the DID analysis, which is based on 2-year panel data,
with one year in between measurement periods, with the cross-section results for the sub-
category of respondents with only two loan cycles, we compare Table 3.11 with Table 3.8. It
appears that the positive effects of borrowing on the self-reported monetary value of the MEs in
the cross-section analysis was maintained in the DID analysis. Apparently, the ME value
increased because the women make extra investments in the business. However, some profit is
invested in the ME and some is used for loan repayment. This may explain why ME profit does
not increase.

91
Table 3.12. DID with Kernel matching result for different performance parameters for trade MEs of NB and
CG group
Variable
Cat N T1
Means
T1
Diff.
N
T2
Means
T2
Diff.
Diff-in-
Diff
T
Ln (restocking
amount)
CG 77 10.99 0.61
(0.13)**
54 11.20 0.45
(0.16)**
-0.16
(0.21)
-0.79
NB
193 11.60 114 11.64
Ln (monthly
trade expenses)
CG 74 10.61 0.43
(0.15)**
48 11.01
0.37
(0.19)**
-0.06
(0.24)
-0.27
NB
48 11.04 117 11.38
Number
employees
CG 97 0.01 0.10
(0.03)**
95 0.05 0.01
(0.03)
-0.08
(0.04)
-
2.07*
NB
199 0.13 196 0.05
Ln (ME profits) CG 73 11.67 0.14
(0.15)
49 11.80 -0.06
(0.191)
-0.20
(0.24)
-0.87
NB 177 11.81 108 11.73
Ln (primary
ME value)
CG 81 11.91 0.68
(0.15)**
56 11.96 1.01
(0.18)**
0.39
(0.24)
1.65*
NB
190 12.54 120 12.97
** p <0.05, * p < 0.10
Hypothesis 1 of Section 3.2.2 is partly confirmed and partly rejected for both PSM and DID,
because the profit variable is not significant in either method. In addition the number of
employees is not significant from the PSM analysis, but is significantly negative in DID
calculation, contrary to expectation. This means that microcredit does not lead to increase in
number of employees for non-farm MEs. The monthly recurrent business expenditures as well as
funds for restocking MEs are significant in PSM but not DID analysis. Microcredit has a positive
effect on primary ME value for both PSM and DID albeit at different levels of significance. The
implications of the results of the hypothesis testing will be presented in the next section.
92
3.5 Conclusion and discussion
We conducted this study to assess the effect of borrowing on the performance of women-run
non-farm microenterprises and to also explore the factors associated with improvement in profits
from the MEs. Hypothesis 1 of Section 3.2.2 was partly confirmed and partially rejected for
different ME performance indicators, as outcomes differed between PSM and DID analysis.
Borrowing was associated with higher ME monetary worth in both PSM and DID analysis.
For other variables the results were mixed. However, for both comparisons, we did not find
evidence of improvement in the level of profit from the MEs among borrowers, within the time
frame of the study. Given the increase in ME monetary worth, it is possible that the profits of
MEs in which loans were invested would increase over time. It is therefore not prudent to
conclude that microcredit does not have potential to improve ME profitability, even though a
positive effect on profit was not recorded in the current study. The factor that was found to be
positively associated with ME profit was household wealth, while those negatively associated
included higher respondents’ age, being married, and being risk averse. Next we provide
explanations and implications of our findings.
One of the major advantages of borrowing is the provision of physical capital to MEs (Feder
et al., 1990). We did find evidence of borrowing providing capital for MEs, as evidenced by
increment in the monetary worth and restocking amount of the borrower MEs. The positive
contribution of borrowing on ME monetary worth seems a direct result of investment of
borrowed funds in MEs. We found an average loan–investment ratio of about 73% for borrowers
in the study. This observed loan investment ratio seemed adequate to bring up the monetary
worth of the MEs. ME worth improvement is a positive indicator of future ME performance and
food security improvement. The ME stock may serve as a store of wealth, which can be used for

93
food and non-food consumption smoothing. ME stock may be consumed by the household or
cash from sale of stock may be used for future consumption. The use of part of the loan for other
household needs, usually education and building also has positive implications for non-food
consumption smoothing. In addition investment in education is a human capital investment.
Loan diversion and loan fragmentation between different household consumption
expenditures was reported by Attanasio et al. (2015) who observed loan usage levels similar to
ours from a study on borrowers in Mongolia. Fractionation and diversion of the already small
loans reduces funds available for ME expansion, and may impair profitability. However
fractionation may not be avoidable as the poor usually have relatively high demand for
consumption credit. Since consumption credit is rarely offered, the poor go for production loans
and use them for consumption (Mahajan & Ramola, 1996). Because money is fungible within
poor households, recipients inevitably allocate part of the loans to other household needs and
funds from other household sources to the business. This reduces the amount available for
investment. The diversion of loan funds by poor borrowers from business to competing
household needs has been discussed by Matin et al. (2002), and Rutherford (2011). UBOS
(2010b) reported the three most important motives for people to borrow in Uganda were to get
working capital for small businesses (25.9%), to buy consumption goods (15.9%), and to pay
school fees (14.8%).
Another factor that may reduce funds for ME and productive activities that impedes ME
profits are the high borrowing costs. At the time of the study BRAC charged flat interest rates of
12% and 25%, for 20 weeks and 40 weeks, respectively. This translates into annual interest rates
of 32.5% and 32.0%, respectively. Women in our study decried these interest rates as being
rather high. They engaged in a variety of activities to meet the demands of loan repayment, to the

94
extent that defaulting was very low. Many lenders justify the high rates with arguments that it is
expensive to lend to the poor because they live in hard-to-reach areas and demand only small
loan amounts (Hudon, 2011). High interest rates enable lenders to attain financial sustainability,
though it may compromise the much-acclaimed social objectives of lending. Recipients may be
unable to benefit from the loans or have very little money left after loan repayment (Copestake,
2007; Roxin & Fiege, 2010). We found that the MEs were an important source of loan
repayment funds for the borrowers in the study. Other borrowing program factors, including loan
size and maturity, may also be important. The requirement for loan repayment to commence
right away may discourage risk-taking and innovation (Banerjee, 2013).
The lack of improvement in profits from MEs has been reported elsewhere. Banerjee et al.
(2015) observed no improvement in profits in an experimental study of small MEs of microcredit
recipients in India. Copestake et al. (2001), using a combination of PSM and qualitative FGDs,
found improvement in profits and household income for borrowers on the second loan cycle.
Time is thus needed to translate funds that are injected into MEs after borrowing into profits.
Borrowers on the first loan cycle seemed to become worse off due to rigid loan repayment
protocols that neglected the risks and uncertainties in business (Mosley & Hulme, 1998).
Borrowing is supposed to lead to improvement in input and output management of borrowers
leading to improved performance (Sebstad et al., 1995). This may be a far outcry for rural
agrarian borrowers given their small survival and maintenance MEs. Matin et al. (2002) also
observed that poor borrowers did not hire more labour or utilize improved technology, after
borrowing. Coleman (1999) in a quasi-experimental design study, with pipeline borrowers as
comparison group, observed negligible impact of microcredit on productive expenses. Studies in

95
Ghana by Fafchamps et al. (2011) found women-run MEs to yield lower returns even when they
got the same financial support as men.
The size and type of the MEs the borrowers invest the loans in could also explain the lack of
profit increase. Small survival and maintenance MEs are typical of MEs in developing countries
(Asian Development Bank, 1997; De Mel et al., 2009; Gladwin et al., 2001; Schreiner & Woller,
2003). These studies report that MEs in developing countries usually have limited potential for
growth and may yield no returns. Sometimes such businesses are hindered by lack of
diversification that leads to undue competition (Fafchamps et al., 2011; Viswanathan, 2002). The
MEs in the study fit the description of different authors about MEs in Uganda (Bigsten &
Kayizzi-Mugerwa, 1995; Rooks et al., 2009; Smith et al., 2001; World Bank, 2016b). These
studies reported that MEs in Uganda were conducting low monetary-worth activities, mainly
small-scale retailing, and with only one person, being the owner. The MEs also operate in low-
income markets hindering growth. Poor people’s MEs, in such economically fragile
environments, may have no reason to expand, probably because they have already attained
optimal levels for their business (Banerjee, 2013).
As we try to answer the question as to why ME income does not grow and yet borrowing is
supposed to open up the women’s entrepreneur potential (Bornstein, 1997), we have to
contemplate whether women borrowers are always entrepreneurial. Although we found both NB
and CG respondents with high achievement motivation scores, there was no difference between
groups. Stewart et al. (2010) argue that the assumption that all poor women are entrepreneurial,
and utilising resources available to them to create new economic activities, products and
markets, may be flawed. Being on the margin of survival, may make the poor risk averse
(Banerjee, 2013; FAO, 1998), not the other way round. We found respondents with a high need

96
for achievement but as argued by Banerjee (2013) consumption rather than entrepreneurial
tendencies may compel them to borrow, and self-employment may not be a reflection of
entrepreneurial tendency, but rather a lack of choice and alternatives. Women sometimes borrow
to meet un-met consumption needs (Banerjee, 2013; Mahajan & Ramola, 1996) and invest only a
little.
Various human capital attributes of borrowers are supposed to influence the performance of
women-run MEs. For example, Banerjee (2013) and Ehlers and Main (1998) argue that the poor
lack human capital and networks required for success in business. Participation in the group
lending program should have improved the social capital of women and positively influenced
ME performance. We did not observe this in the current study, pointing to a missed opportunity
of borrowing. In addition, contrary to the general belief that education improves performance in
life (Bates, 1990), we obtain findings similar to Bigsten and Kayizzi-Mugerwa (1995), in that
education did not predict business success, while age and risk aversion negatively predicted
profits. Bigsten and Kayizzi-Mugerwa (1995) state that young people have higher stamina
needed for the success in business, thus explaining the effect of age on ME profits. Although the
direction and degree of risk taking influencing business success is subject to debate, a certain
degree of riskiness is needed to obtain small business success (Begley & Boyd, 1987; Rauch &
Frese, 2000). Unfortunately, being on the margin of survival makes the poor risk averse,
inhibiting investments even when they could be profitable (Banerjee, 2013).
Household wealth (invested in housing) also positively predicted profits, probably because
more wealthy families could raise higher start-up capital, needed for more meaningful
investments (Bigsten & Kayizzi-Mugerwa, 1995).

97
On the whole we partially confirmed the expected positive effect of borrowing on ME
performance. In line with the objective of borrowing to improve livelihoods through investment
in MEs, borrowers invested reasonable fractions of received loans in MEs, leading to higher
monetary worth of the MEs. However, the context, type and size of the MEs may not favour ME
expansion or higher profits. Under the burden of loan repayment, especially older borrowers may
cease borrowing quickly. For younger borrowers or those with more stable MEs, borrowing may
maintain or stabilize MEs, and lead to more secure livelihoods after longer periods of borrowing.
Since improvement in food security requires improvement in income, borrowers whose MEs do
not expand may experience further food insecurity challenges, especially if they record changes
in agricultural production as result of participation in the borrowing programme.
From a policy perspective, it looks like loans should not be given to applicants with the
assumption that self-employment is tantamount to being entrepreneurial. There may be need to
screen loan applications on the basis of in-depth analysis of the potential of applicant MEs. After
loan disbursement, in addition to follow-up on loan repayment, group meetings may be used to
offer support for ME expansion. It is also important to access viability of enterprises proposed by
borrowers to establish their viability, in line with the loan amount and repayment schedule.
Further research is needed to establish types of MEs which are likely to undergo expansion, with
microcredit.

98
Chapter 4
Microcredit and agricultural production among resource-poor rural women
(Quasi-experimental comparison of current and in-coming borrowers in Uganda)
Abstract
In this study, we investigated changes in expenditure and outputs for agricultural production
when women access microcredit in a rural agrarian setting in Uganda. A quasi-experimental
design was used to compare socio-demographic, personality and farming microenterprise (ME)
activities of existing borrowers and incoming borrowers before they received their first loan. To
determine the effect of microcredit, production input expenditures for crop and animal
production, crop harvests in the season before the study and the animal wealth for the
respondents were measured. We used propensity score matching to assess differences between
study groups. Results revealed that current borrowers had less recurrent crop-input expenditures,
spent more time on garden work, and recorded lower crop-harvest value than incoming
borrowers. Likewise, borrowing did not lead to improvement in animal-production input
expenditure. Instead, we observed lower monetary worth of some types of animals among
borrowers. The subsistence nature of agriculture practiced by the women, coupled with the high
risk associated with agricultural production could be discouraging investment of microloans in
agricultural production. In addition the need for weekly loan repayment may favour engagement
into non-farm activities, at the expense of farm production, and the sale of household animals.
Key words: Uganda, BRAC, rural microcredit, women, agricultural production.
Publication status: Manuscript under preparation
99
4.1 Introduction
According to the World Bank (2007), three out of every four people in developing countries live
in rural areas and mostly depend on agriculture for their livelihood, contributing significantly to
the national gross domestic product (GDP). Agriculture continues to be a fundamental
instrument for sustainable development and poverty reduction. Despite the special position of
agriculture, agrarian communities in the least-developed countries still suffer from temporary
food shortages because of fluctuations in production and food prices (Morvant-Roux, 2011). The
Food and Agricultural Organisation (FAO) reported that unfavourable climate conditions
aggravate agricultural production problems in different parts of the world leading to persisting
food insecurity challenges (FAO, 2016).
Given the importance of agriculture in poverty reduction and development, national and
international organisations have established programs geared towards agricultural production
improvement with focus on transformation from subsistence to fully commercial agriculture as
prerequisites for economic development (Moti, Berhanu, & Hoekstra, 2009; Von Braun et al.,
1991; World Bank, 2007).
In the case of Uganda, the Uganda Bureau of Statistics (UBOS) reported that in 2014/15
about 70% of the working population in Uganda was engaged in agriculture, forestry and fishing,
with a higher proportion of women (72%) than males (67%) (UBOS, 2016). The agricultural
sector contributed 22.6% to the GDP and 53% to the country’s exports (UBOS, 2016). In 2014,
42% of the households mainly earned their income from subsistence agriculture (UBOS, 2014).
The strategic direction of the Ministry of Agriculture, Animal Industry and Fisheries
(MAAIF), for the Government of Uganda, includes transformation of subsistence farmers into
enterprise farmers. These programs entail, among others, activities aimed at improvement of

100
agricultural production and productivity, increasing access to farm inputs, and improving
agricultural markets. Rural infrastructure development, provision of extension services,
dissemination of weather information and promotion of improved production practices and crop
varieties are some of the activities undertaken by the government (UBOS, 2016).
It has long been argued that food security may be improved through increasing access to
financial services (FAO, 1998; Meyer, 2013), because lack of financing and poorly functioning
financial markets limit farmers’ capacity to invest in new practices and improved technologies
(FAO, 2011). Investment of microcredit in agriculture is expected to improve input expenditures
and subsequent agricultural output (Morvant-Roux, 2011). However, MFIs offering loans for
agriculture are few in number because of the riskiness of agricultural production, and the lag
phase between investment and agricultural output that often does not favour MFI schedules of
loan repayment. However, since reduction in food insecurity and rural poverty are key mandates
of many microfinance institutions (MFIs), targeting rural agrarian populations with microcredit
for agricultural production investments is a desirable MFI direction (Morvant-Roux, 2011).
There is, however, a dearth of literature about the extent to which female microcredit
recipients invest microloans in agricultural production, and whether such investments in
agriculture translate into production output increase. Currently the debate rages on about the
effect of borrowing on households (Banerjee, 2013; Banerjee et al., 2015). For rural agrarian
communities the focus on agriculrural production cannot be over-emphasized. Given the
difficulty in establishing monetary income of such households, in the current study we focus on
non-monetised income from agricultural production.
One would expect access to microcredit to increase production, since investment in improved
technology is important in optimising the production process. On the other hand, agricultural
101
output may not change for various reasons. First, loan repayment needs and schedules may not
favour investment in agriculture. Second, agricultural production improvement may not be a core
objective of borrowing. The current study seeks to explore these issues.
We conducted a quantitative and qualitative cross-sectional comparison of current borrowers
and incoming borrowers, before they received their first loan. We used Propensity Score
Matching (PSM) to make these groups comparable on a number of characteristics, then assessed
differences between investment and output from both crop and animal production. Qualitative
focus group discussions (FGDs) were used to obtain in-depth understanding of the relationship
between microcredit and agricultural production. FGDs were used to find out whether food
production increase was a core reason for borrowing, whether women invested their loans in
agriculture, and to assess women’s perceptions of investing their loans in agricultural production.
Our main result was that access to credit did not lead to extra investment in crop and animal
production. We also found borrowers having lower monetary value of harvested crops than in-
coming borrowers.
The rest of the chapter is organised as follows. Section 4.2 provides the theoretical framework
and review of literature on microcredit and agricultural production, and the study questions. In
Section 4.3, we describe the study methods. Section 4.4 deals with the results of the study.
Section 4.5 provides the discussion and conclusions.

102
4.2 Theory
4.2.1 Women and peasant agricultural production
Peasant agricultural production has been explained in Ellis (1993). Agricultural production in
peasant communities operates on a subsistence-like model, where family plots are tilled to obtain
food and to generate income to meet non-food family needs. Women play a key role in
agricultural production, and make significant contributions to agricultural production, both as
farmers and as workers (Fletschner & Kenney, 2014; Quisumbing et al., 1995). They provide
about 43% of the agricultural labour force in developing countries and about 50% in parts of
Africa (FAO, 2011), with social norms dictating the kind of roles they play. In some
communities women have the gendered role of provision of food to households (Niehof, 2016),
and thus play a key role in food security attainment. In such communities women are in charge
of short-cropping-season food crop production, while men take charge of the more lucrative
traditional cash crops which take longer to mature. In other communities, crop production
activities are shared out between men and women. Women may be in charge of sowing,
weeding, and simple food processing operations, while men’s roles include land clearing, harvest
and sale of crop and animal produce. In Africa males and females have been reported to cultivate
different plots with different crops (Udry et al., 1995). In some instances different crops may be
planted on the same plot, to ensure against external shocks to production and have stable harvests
(Fafchamps, 2003). Plots managed by females are usually intensively cultivated, use less manure
and have lower output than those managed by men. Men rarely allocate labour time to women-
cultivated plots, and sometimes even child labour may be allocated more to male-cultivated than
to female-cultivated plots (Udry et al., 1995). Female-cultivated plots are usually allocated to
103
food and vegetable crops for which they have more expertise. As far as animal production is
concerned, female control of livestock varies from culture to culture. Usually men have control
over purchase and sale of larger animals like cattle, while women have control over smaller
animals like goats, chicken and pigs (Esenu et al., 2005). According to FAO (2011), the demand
for animal products is likely to grow, thus improving the potential of animal production
contributing to poverty reduction in poor communities. Livestock are an important source of
supplementary income for the poor, a source of animal protein and fertilisers, and a store of
wealth.
Agriculture in peasant communities is dogged with many challenges, some of which have
been summarised in Figure 4.1. Lack of land is rampant sometimes because of traditional land
inheritance customs that promote land decimation and slicing. These factors hinder large-scale
agricultural production and mechanisation. The resultant small pieces of land are tilled
repeatedly, leading to soil exhaustion and depletion. Reliance on depleted soils and unreliable
weather patterns also prevent production improvements (FAO et al., 2015; Jiggins, 1989). In
these communities where purchase and use of agricultural production inputs is limited, the
situation poses a challenge to improvement in production (Ellis, 1993).
Recently, agriculture has come under pressure as climate change affects food production, food
prices and income from agriculture. Dry spells, late onset of rains, and high temperature, work
together against productivity, harvest value and food access (FAO, 2016). Uncertainty about
food production leads to reduced investment in agricultural production and prevents farmers to
profit from ensuing high food prices (FAO, 2016). Indeed greater risk has been observed to lead
to reliance on low-risk, low-return crops, less use of purchased inputs such as fertilisers and new
technologies, and a generally low level of investment in agriculture (Fafchamps, 2003).
104
These challenges are magnified more for women than men. Women face gender-specific
constraints that reduce their productivity and limit their contribution to agricultural production.
These challenges have been discussed by many authors (Ali et al., 2015.; FAO, 2011; Jiggins,
1989). Women generally lack access to land and the land they control may be of poorer quality
and of insecure tenure. Lack of land ownership rights makes women dependent on husbands and
other male relatives to access land for production. As a result they often access small pieces of
low-productivity land which they over-cultivate, lowering productivity even more. Women have
fewer working animals and sometimes have no control over the income from sale of small
animals they keep. They have limited access and are less likely to use improved agricultural
technology and inputs. They have limited access to agricultural knowledge and information,
perpetuated by their low levels of education, limited access and exposure to extension agents and
extension information, and their inability to move away from household responsibilities. Because
of all these factors, women register lower yields than males, not because they are less capable. If
larger inputs would be used by women and if the gender gap could be reduced, then the quantity
of food available to people in the world would be much higher (FAO, 2011).
Such engendered limitations are common in Uganda (Lakwo, 2006; Wakoko, 2004), one of
the countries of the world where gender biases are still growing (FANTA-2, 2010). These biases
have been found to hinder levels of agricultural productivity (Ali et al., 2015.). And yet women
persist with their engagement in subsistence crop and animal production for income and
household food provision.
Support for women-run agriculture is thus important for household food production, a key
pillar of food security (Quisumbing et al., 1995). Such support includes enabling women to
access credit. Limited access to credit has been cited as a main challenge women face in

105
accomplishing their role in production. Women have been reported to use less credit than men
and sometimes may not control the credit they get (Goetz & Gupta, 1996). Factors that hinder
women’s access to credit have been discussed by many authors (Armendáriz & Labie, 2011;
Berger, 1989; FAO, 2011; Fletschner, 2009; Meyer, 2013). Legal barriers and cultural norms
prevent them from holding bank accounts or entering into financial contracts. Many times they
lack collateral needed by banks to advance loans to them. Women are sometimes not favoured by
some MFIs, who prefer men who are able to get larger loans, and when they are given the
opportunity to borrow, may be given smaller loans than men (Agier & Szafarz, 2013; Fletschner,
2009). And yet studies have shown that granting credit to women has more positive implications
for the nutrition of households than credit given to men (Pitt & Khandker, 1998).
Figure 4.1. Microcredit and agricultural production in rural agrarian communities
106
4.2.2 Microcredit and agricultural production
Agricultural productivity of the poor is hampered by limited use of inputs, low human capital use
of rudimentary technology and general lack of productive resources (See Figure 4.1). Poor
market access and post-harvest losses due to limited storage facilities further reduce the value
poor farmers generate from their agricultural activities, and contribute to sustain the vicious
cycle of poverty and food insecurity. By providing the poor with resources for investment in
agricultural production, MFIs could help to break this cycle and enable the poor to expand their
production, thus contributing to commercialisation of subsistence agriculture.
Commercialisation, manifested by an increase in use of external production inputs may lead to
increase in both cash and in-kind transactions for otherwise peasant agriculture. In addition, the
proportion of farm output for sale will increase (Von Braun et al., 1991).
Microcredit is one of the avenues to increase commercialisation. Since agricultural production
is risky and unreliable, leading to unreliable income which is needed for loan repayments, many
MFIs do not offer microloans for agricultural production. One of the exceptions is BRAC, one of
the largest microcredit providers in Uganda, which offers such loans to women who show
potential to make the weekly loan repayments (Wright & Rippey, 2003). Also MFIs like Amanah
Ikhtiar Malaysia (AIM) offer credit that may be invested in agricultural production (Chan &
Ghani, 2011). Provision of loans in Uganda has improved with the fraction of adults applying for
a loan increasing from 17% in 2009/10, to 22% in 2012/13. Most borrowers apply for loans to
get working capital for their microenterprises (UBOS, 2014).
Credit access may lead to changes in production decisions by farmers (Crépon et al., 2015),
favouring more profitable investments of longer duration (Foltz, 2004; Matin et al., 2002). They
may adopt labour-saving technologies and other technologies that enhance agricultural output,
107
including use of improved crop varieties and fertilisers (Khandker & Koolwal, 2016; Matin et
al., 2002; Zeller & Sharma, 2000). They may also use credit to increase animal stocking levels,
and use improved animal rearing methods (Chan & Ghani, 2011). Any extra investment in
agricultural production will lead to improved agricultural productivity (Matin et al., 2002; Feder
et al., 1990). One of the commonly cited positive outcomes of borrowing is women
empowerment (Armendáriz & Morduch, 2010; Swain & Wallentin, 2009) and economic
decision making (Pitt, Khandker, & Cartwright, 2006), which may also have positive effects on
agricultural production.
Since agriculture is a major source of food acquisition for peasant communities, improvement
in production after credit access is expected to lead to increased household food availability as
well as cash and non-cash income, both enabling better access to food.
On the other hand, borrowing may not lead to production improvement when demand for
women’s time increases after borrowing due to competing activities associated with agricultural
production, non-farm MEs and domestic work (Basargekar, 2008; Kabeer, 2001). For example,
Haile, Bock, and Folmer (2012) reported increment in work load of women after borrowing.
Considering the mixed results available from studies on the effects of microcredit, we
attempted to answer the following research question. To what extent does borrowing affect
expenditure and output from agricultural production?
The central null-hypothesis we tested for this study was: Borrowing has no effect on
expenditure and output from agricultural production. We tested this against the two hypothesis
below.
Hypothesis 1. Participation in the microcredit program leads to increment in crop and
animal production input expenditure.

108
Hypothesis 2. Participation in the microcredit program leads to increment in crop and
animal output.
4.3 Methods
Section 4.3 provides the study design, describes the sample and measures, and deals with the
data analysis techniques we employed.
4.3.1 Study design
The study employed a cross-sectional design involving 173 old borrowers (OB), and 71
incoming borrowers (NB) of BRAC microfinance, from Mukono and Buikwe districts, the latter
group before they received their first loan. Study respondents were women who indicated in a
preliminary question that they practiced agriculture as a business, i.e. invested in crop and animal
production, with the aim of selling off the bigger percentage of their produce for income. Both
districts have a large number of people who are involved in subsistence food production.
Mukono is among the largest districts in Uganda and Buikwe is one of the districts that
sometimes have food insecure households.
A quasi-experimental cross-sectional design with both quantitative and qualitative survey
methods was used to obtain socio-demographic (age, dependency ratio, years of education, and
marital status) and personality characteristics (risk preference, time preference, and achievement
motivation) of borrowers.

109
4.3.2 Data collection and analysis
We also calculated two wealth indices based on household asset ownership and housing
facilities, respectively. Details of the study design, the criteria of selection of participants, study
measure and different procedures of data collection, and information about the BRAC
microcredit program are given in Chapter 2 of this thesis.
Data collection was done between September and December 2013 with the harvest season of
April 2013 as the reference season for crop production data. The reference period for animal
production was the period January–December, 2013.
FAO (2011) postulates that access to credit will lead to adoption of new technologies and
practices as part of the agricultural commercialisation process. To assess the level of
commercialisation of agricultural production, we constructed business-like scores for crop and
animal production, respectively. These scores were based on their outlay of inputs of production
in order to assess whether the crop and animal activities of the respondents qualified as
‘business-like’. We based these on responses to questions eliciting use of cash in different crop
and animal activities as follows. For crop production, a crop business-like score was computed as
summation of positive responses to four questions eliciting information on (1) Having employees
in crop production; (2) Payments for farm labourers in crop production; (3) Seed purchase; (4)
Purchase of fertilisers and or pesticides. The maximum crop business-like score was thus 4. The
animal business-like score on the other hand was the summation of positive responses to the
following questions: (1) Payment for veterinary support; (2) Animal feeds purchase; (3)
Payments for hired farm labour. The maximum animal business-like score was thus 3. This
information was used to assess the degree of commercialisation of production activities.
110
For crop producers, data on a self-reported measure of area under crop production, change in
area under cultivation after accessing credit, and time allocation to garden work, both on days
when the respondent conducted non-farm micro-enterprise (ME) activities and on days with no
non-farm ME activity, were obtained.
To capture the effects of microcredit on output for crop-related agriculture, output of crop
production was obtained and used to calculate monetary value of crop harvest, as the product of
the quantity of different crops produced and the unit market price of respective crop items at the
time of the study. For animal-related MEs an animal wealth variable was calculated as the
product of the numbers of different types of animals and unit market price of the animal type at
the time of the study. For crop and animal production, total crop production input expenditures
and cost of animal production were computed, respectively. The propensity score matching
methodology (PSM) was used to control for residual heterogeneity in selection into the
borrowing program and to assess the effect of microcredit as the difference between parameters
for NB and OB respondents. As explained in Chapter 1 of the thesis, control variables in the
PSM matching procedure were factors that would influence the taking of credit including marital
status, level of education, personality characteristics (time preference, risk preference and need
for achievement motivation scores), age, marital status, religion and dependency ratio (defined as
the ratio of dependents, aged 0–14 years, and those over 65 years, to the household productive
members, 15–64 years).
From focus group discussions (FGDs) in the qualitative part of the study we obtained
information on the reasons for borrowing, whether investment in agriculture and improvement in
food security were among reasons for borrowing, the respondent’s opinion on use of microloans
in agricultural production, and loan repayment dynamics.

111
4.4 Results
4.4.1 Sample composition
The total number of respondents with agriculture-related MEs for the baseline year was 244
(OB=173, NB=71). The majority of NBs (66%) and OBs (53%) were involved in both crop and
animal production.
4.4.2 Characteristics of respondents with agriculture-related MEs
We found the socio-demographic and personality characteristics of the respondents with
agricultural-related MEs in the study for both the NB and OB categories to be similar on the
control variables, before and after propensity score matching. The similarity of the groups before
matching seems to be an outcome of both NB and OB groups having self-selected to participate
in the BRAC microcredit program. Respondents were on average 35 years of age, with 7 years of
primary education. The dependency ratio was 1.4, which is slightly higher than the national
average of 1.2. The majority (75%) were married. Risk preference was 2.2 on average, indicating
that most respondents were risk neutral and most had a high time preference score (3.3 on
average), implying they possessed the ability to delay gratification to the future. The respondents
had a high achievement motivation score (1.0 on average), implying they scored high on
questions eliciting respondent aspirations to better themselves. The details for measurement of
personality characteristics are provided in Chapter 2, Table 2a.
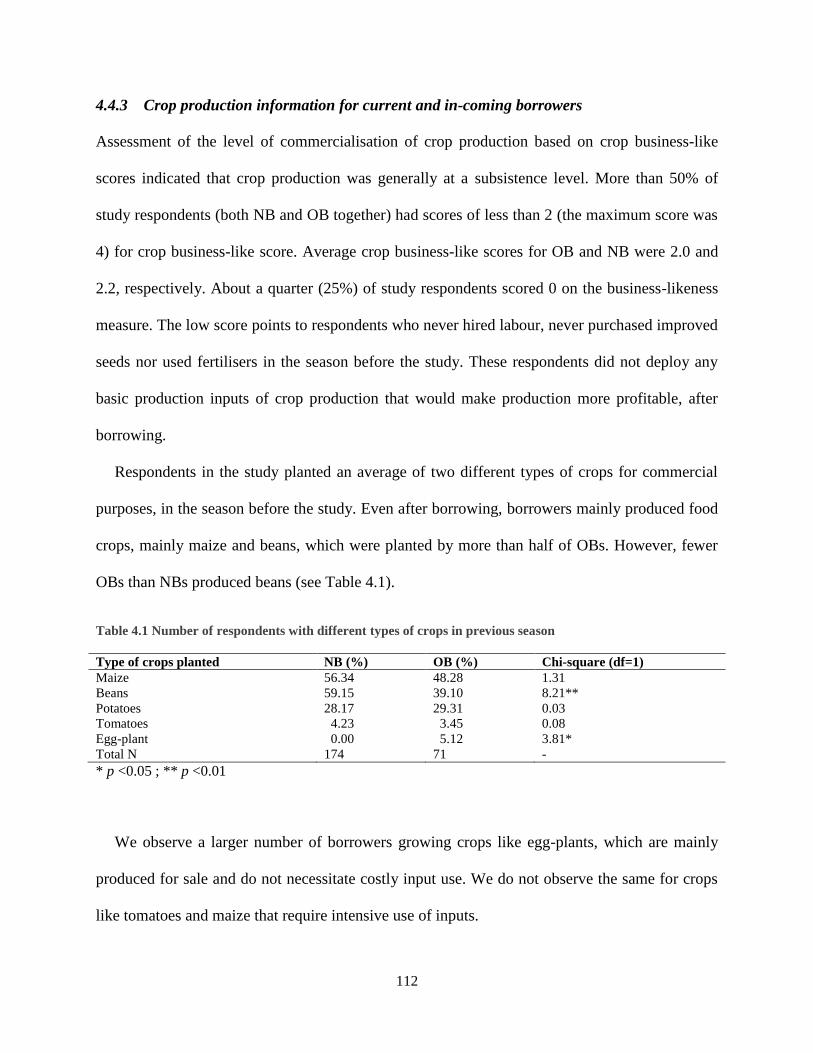
112
4.4.3 Crop production information for current and in-coming borrowers
Assessment of the level of commercialisation of crop production based on crop business-like
scores indicated that crop production was generally at a subsistence level. More than 50% of
study respondents (both NB and OB together) had scores of less than 2 (the maximum score was
4) for crop business-like score. Average crop business-like scores for OB and NB were 2.0 and
2.2, respectively. About a quarter (25%) of study respondents scored 0 on the business-likeness
measure. The low score points to respondents who never hired labour, never purchased improved
seeds nor used fertilisers in the season before the study. These respondents did not deploy any
basic production inputs of crop production that would make production more profitable, after
borrowing.
Respondents in the study planted an average of two different types of crops for commercial
purposes, in the season before the study. Even after borrowing, borrowers mainly produced food
crops, mainly maize and beans, which were planted by more than half of OBs. However, fewer
OBs than NBs produced beans (see Table 4.1).
Table 4.1 Number of respondents with different types of crops in previous season
Type of crops planted NB (%) OB (%) Chi-square (df=1)
Maize 56.34 48.28 1.31
Beans 59.15 39.10 8.21**
Potatoes 28.17 29.31 0.03
Tomatoes 4.23 3.45 0.08
Egg-plant 0.00 5.12 3.81*
Total N 174 71 -
* p <0.05 ; ** p <0.01
We observe a larger number of borrowers growing crops like egg-plants, which are mainly
produced for sale and do not necessitate costly input use. We do not observe the same for crops
like tomatoes and maize that require intensive use of inputs.

113
4.4.4 Effects of microcredit on expenditure and output for crop production
Table 4.2 shows differences between NBs and OBs regarding basic crop and animal production
parameters and practices, investments in crop production, and expected outcomes of borrowing
on crop production. These differences can be considered as average treatment effects on the
treated (ATT) based on probability score matching with Kernel matching.
Table 4.2 Differences between OB and NB agricultural production parameters
Parameter OB NB Diff. t
Ln expenditure on crop production 1 8.08 9.40 -1.32 -1.68*
Ln expenditure on crop production 2 7.72 8.87 -1.15 -1.41
Ln monetary value of harvest 7.81 9.91 -2.19 -2.28**
Ln total crop sales 12.88 12.98 -0.10 -0.32
Number who sold some crops (%) 0.56 0.61 -0.11 -1.54
Types of crops planted 2.02 2.46 -0.45 -1.62
Crop business-like score 1.95 2.26 -0.31 -1.27
Garden hours (day with non-farm ME activities) 3.47 2.72 0.74 2.01**
Garden hours (days with no non-farm ME activities) 3.99 3.2 0.72 1.28
Garden hours per week 20.58 16.58 3.99 1.86*
* p<.10, ** p <0.05 1 Including value of all planted seeds (purchased and from own production) for previous season
2 Including value of purchased planted seeds in previous season only
Monetary values transformed into logarithms
We obtained no evidence of improvement in commercialisation of crop production after
borrowing. This was revealed by the lack of differences between OBs and NBs on the number of
planted crops, the business-like scores for crop production, number who sold some crop in the
previous season, and on the monetary value of crop sales (see Table 4.2).

114
We found that OBs spent less than NBs on crop input expenditures, (e.g., on planted seeds),
with both groups spending less than $100 equivalent on crop production inputs in the cropping
season before the study. It was therefore not surprising that we found the monetary value of the
whole crop harvest (the product quantity of respective crop harvest times the unit market price at
the time of the study) for OBs to be less than for NBs. Although not significant, we observed a
negative trend in number of borrowers who sold some crops from the previous season, the
number of different types of crops planted, and the crop business-like score for the OBs
compared to NBs. Comparison of the amount of time OBs and NBs spent on gardening, on days
when they also conducted non-farm ME activities, revealed that OBs spent 74% more time than
the NBs (see Table 4.2). However, responses to the inquiry about change in amount of time spent
on garden-related activities after borrowing indicated that 43.8% of OBs spent the same amount
of time, 33.3% spent less time, while 22.9% increased the amount of time.
The results of the quantitative survey were confirmed by the qualitative FGDs. Borrowing to
purchase crop production inputs was ranked 6 out of 8 reasons to borrow (See Chapter 2 of this
thesis). The FGDs provided insights into the reasons for limited investment in crop production.
Some respondents, for example, argued that they had access to small pieces of land for crop
growing, limiting the worth of investment in crop production. Respondents also argued that high
risk associated with crop production made it unattractive for investment of loan funds. FGD
participants also observed that investment in agriculture did not suit the BRAC weekly loan
repayment requirements. One participant commented: ‘You have to make weekly loan
repayments from the very week you receive the loan. If you invest in agriculture and have no
trade business, you will have difficulties’.
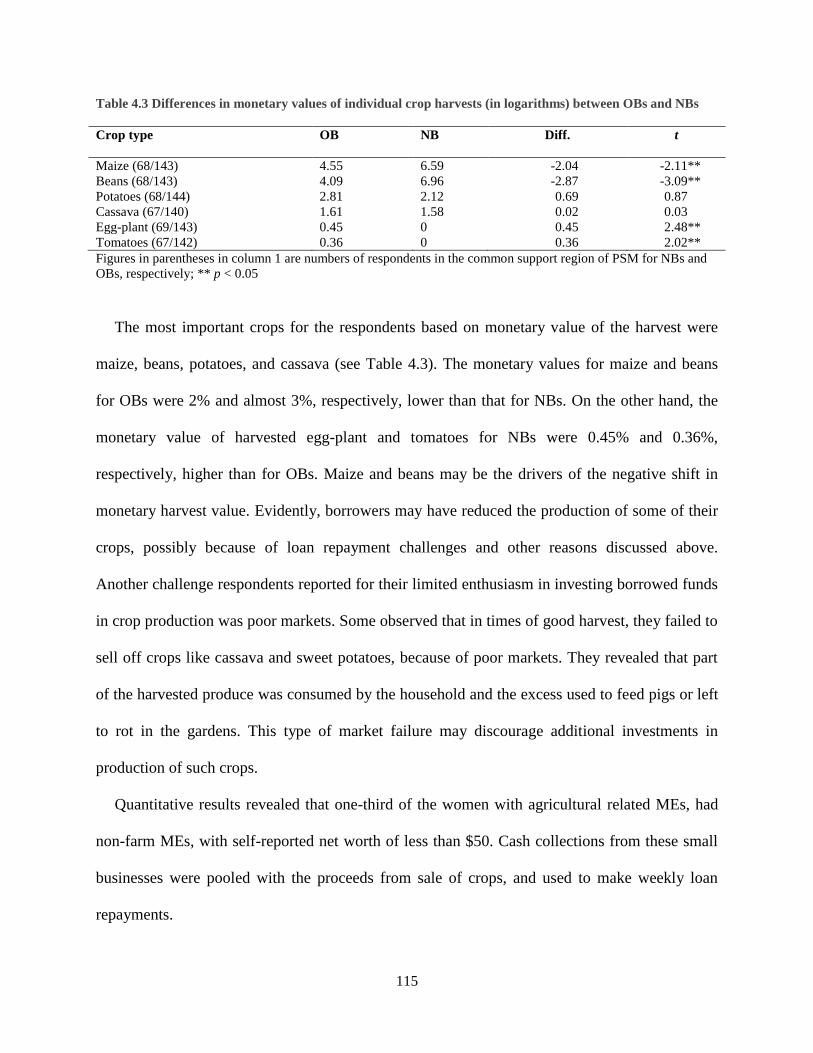
115
Table 4.3 Differences in monetary values of individual crop harvests (in logarithms) between OBs and NBs
Crop type OB NB Diff. t
Maize (68/143) 4.55 6.59 -2.04 -2.11**
Beans (68/143) 4.09 6.96 -2.87 -3.09**
Potatoes (68/144) 2.81 2.12 0.69 0.87
Cassava (67/140) 1.61 1.58 0.02 0.03
Egg-plant (69/143) 0.45 0 0.45 2.48**
Tomatoes (67/142) 0.36 0 0.36 2.02**
Figures in parentheses in column 1 are numbers of respondents in the common support region of PSM for NBs and
OBs, respectively; ** p < 0.05
The most important crops for the respondents based on monetary value of the harvest were
maize, beans, potatoes, and cassava (see Table 4.3). The monetary values for maize and beans
for OBs were 2% and almost 3%, respectively, lower than that for NBs. On the other hand, the
monetary value of harvested egg-plant and tomatoes for NBs were 0.45% and 0.36%,
respectively, higher than for OBs. Maize and beans may be the drivers of the negative shift in
monetary harvest value. Evidently, borrowers may have reduced the production of some of their
crops, possibly because of loan repayment challenges and other reasons discussed above.
Another challenge respondents reported for their limited enthusiasm in investing borrowed funds
in crop production was poor markets. Some observed that in times of good harvest, they failed to
sell off crops like cassava and sweet potatoes, because of poor markets. They revealed that part
of the harvested produce was consumed by the household and the excess used to feed pigs or left
to rot in the gardens. This type of market failure may discourage additional investments in
production of such crops.
Quantitative results revealed that one-third of the women with agricultural related MEs, had
non-farm MEs, with self-reported net worth of less than $50. Cash collections from these small
businesses were pooled with the proceeds from sale of crops, and used to make weekly loan
repayments.

116
4.4.5 Effects of microcredit on animal production
In this section findings on effects of borrowing on animal production are given.
Table 4.4 Number of respondents with different types of animals
Parameter NB (%)
N=71
OB (%)
N=174
Chi-square
(df=1)
Number who owned an animal 84.51 77.59 1.49
Number with pigs 42.25 48.85 0.88
Number with local chicken 38.03 27.01 2.90*
Number with goats 38.03 24.14 4.81**
Number with zero grazing cattle 23.94 18.39 0.97
Number with local cattle 28.17 14.37 6.41**
Number with exotic chicken 5.63 12.07 -2.28**
* p < 0.10, ** p < 0.05
Results indicate that pigs were the most commonly kept animal type. Fewer OBs than NBs
owned goats, local cattle and local chicken (Table 4.4). Although we did not find quantitative
evidence of the effect of borrowing on pig production, FGD participants indicated using loan
funds to purchase pigs. They indicated that the preference for keeping pigs was due to their short
lifecycle and the possibility of selling them readily to meet urgent household needs, and to
provide capital for ailing MEs.
Table 4.5 Differences between OBs and NBs on monetary values of different animals (in logarithms)
Parameter OB NB Diff t
Number of animals 1.57 1.91 -0.34 -1.69*
Animal business-like score 1.04 1.17 -0.13 -1.12
Ln total animal wealth 10.84 11.97 -1.13 -1.57
Ln animal input expenditures 8.85 8.92 -0.07 -0.09
Ln value goats 3.38 5.45 -2.07 -1.96**
Ln value zero grazing 2.07 2.89 -0.82 -0.94
Ln value local cattle 1.49 3.52 -2.03 -2.28**
Ln value exotic chicken 1.07 0.19 0.88 2.50**
Ln value pigs 5.96 4.90 1.06 1.08
Ln value local chicken 3.40 4.71 4.71 -1.49
* p < 0.10, ** p < 0.05
117
We found that the majority of respondents kept at least one type of animal, with no difference
between OBs and NBs. Borrowing seems to have a negative effect on animal production
according to the probability score matching method, with Kernel matching (Table 4.5). Old
borrowers did not spend more than new borrowers on animal production inputs. Instead we find
them to keep marginally fewer types of animals, and the monetary value of some types (goats
and local cattle) was lower. However the total animal wealth for OBs did not differ from NBs.
4.4.6 Sensitivity analysis
We conducted a sensitivity analysis as described by Rosenbaum (2010). We did this for the main
finding of the study, monetary value of the harvest, and found that unobservable covariates
would need to change the odds of treatment assignment by factors beyond 3 to conclude that the
observed treatment effects from propensity score matching were due to non-random assignment.
We concluded that our PSM results were unlikely to be influenced by unobservable attributes of
the respondents.
4.5. Conclusion and discussion
Contrary to the common assertion that credit is the major limiting factor to improvement in
agricultural production, and that borrowing will lead to improvement in investment in
agricultural production and output (Armendáriz & Labie, 2011; FAO, 2016), we tested and
rejected the hypothesis of improvement in agricultural input expenditures and in crop and animal
output after borrowing. Unlike findings by Kaboski and Townsend (2012) of improvement in
agricultural investment after borrowing, and Crépon et al. (2015), of expansion in the scale of
non-livestock agriculture and livestock activities, our findings are more in line with Matin et al.

118
(2002) who found that borrowers did not hire more labour nor did they increase their utilisation
of improved technology after borrowing. This agrees with UBOS’ observation UBOS (2010b)
that only 6.8% and 3.2% of the people in Uganda borrow to buy farm inputs, that is seeds and
livestock, respectively. Our findings are also in agreement with Grimpe (2002) who observed
that FINCA Uganda recipients used loans to cater for short-term livelihood needs rather than
development in agriculture.
4.5.1 Crop production
The major study finding for crop production is that borrowers did not increase their recurrent
expenditures in crop production and animal production. We also found a reduction in non-cash
income from crop production. This raises the question of why female borrowers did not increase
recurrent expenditures in agricultural production or take up improved technologies.
The reasons why borrowers do not invest microloans in activities they purported to borrow to
recapitalise may be found in the nature of their agricultural activities, the local market conditions
for agricultural produce and the needs and requirements of the MFI for loan repayment.
First, we look at the characteristics of the women and the agricultural activities they were
involved in. The respondents in this study seem to fit well the definition of peasants by Ellis
(1993): ‘Peasants are households that derive their livelihoods mainly from agriculture, utilize
mainly farm ily labour in farm production, and are characterised by partial engagement in input
and output markets which are often imperfect or incomplete’ (p. 13). This definition
appropriately characterises women-run agriculture in Uganda and sheds light on why women
borrowers did not invest more in agricultural production.

119
From the FGD results we presented in Chapter 2, borrowers indicated they were cautious
while allocating loans to agricultural production. It is risky to invest in agriculture because of
unpredictable weather patterns and thus unpredictable harvests. Crop failure may lead to loan
repayment problems (See Chapter 2, this thesis). Agricultural production is risky and this,
coupled with the lag phase between investment and harvest, may not favour investment of loans
that have to be paid back with interest (Morvant-Roux, 2011).
Although we found women in our study to be risk neutral, women are generally regarded as
being risk averse and unlikely to invest their loans when they perceive the possibility of failure in
an activity (Fletschner, Anderson, & Cullen, 2010).
Poor markets are a reality in many poor economies (Adams & Von Pischke, 1992). For
perishable agricultural products this factor may pose a risk to income and discourage agricultural
investment. Adams and Von Pischke (1992) asserted that credit may not be as large a problem
for agricultural smallholders as price and other production risks, and may be ineffective for
helping most of the poor to enhance their economic condition.
The result of a smaller numbers of OBs planting beans and of OBs having smaller harvest
values for maize and beans is surprising. Beans are widely grown by subsistence farmers in
Uganda, with little deployment of production inputs. They play a special role in nutrition security
as they are good sources of protein for peasant families. Maize too is widely grown by small
scale farmers as a source of food and income security (GOU, 2016). There seems to be a missed
opportunity for microcredit to contribute to food security improvement. Something seems to be
limiting the women in this regard. One likely limitation is the scale of agricultural production,
which is too small to warrant extra investment. This is evidenced by the observed average crop
business-like scores for OBs and NBs with some respondents scoring zero. In addition, about

120
40% of OB and NB respondents did not sell any crop produce, meaning all harvest was used for
own consumption.
Finally, another impediment to agricultural growth even after borrowing, is societal gender
division of roles and social rigidities that define the roles women play (Schroeder, 1996). Uganda
society still has widespread discriminatory behaviour towards women, which hinders agricultural
production. Women have been found to record lower rates of agricultural production because of
high child care needs, as well as difficulty in accessing markets and inputs. Differential uptake of
cash crops and use of improved seeds and pesticides by women are also manifestation of these
difficulties (Ali et al., 2015.). These factors may explain why women, even after borrowing, are
mainly engaged in food provision for their households, and not in more lucrative cash crop
production. It may also explain why they do not invest microloans in improved agricultural
technologies.
4.5.2 Animal production
Our findings about microcredit and animal production echo the findings for crop production. We
tested and rejected the hypothesis of improvement in investment in animal production inputs and
of improvement in animal wealth after borrowing.
Borrowing does not translate into commercialisation of animal production among borrowers.
This is evidenced by the similarity in the business-like score (animal production) between NBs
and OBs. Apart from the increase in exotic chicken production among borrowers, borrowing
seems to have a negative effect on animal wealth as per the result on reduction in monetary
worth of some types of animals for borrowers and numbers of different types of animals owned
121
by OBs. This could be attributable to a number of factors. OBs did take up, one of the input-
intensive and yet commercially viable animal ventures in Uganda.
First it could be a result of sale of animals to get funds for weekly loan repayments. Animals
being easily convertible into cash may be sold off to obtain funds for loan repayment. As
observed in Chapter 2 of this thesis, women sell off whatever is saleable to get funds for loan
repayment. On the other hand it may indicate a shift away from animal production when women
borrow.
In addition the characteristics and requirements of the lending programme may explain some
of these results (see Chapter 2). BRAC protocol requires weekly loan repayment that commences
the week after loan disbursement. Such loans necessitate or require a regular flow of income and
disfavour investment in agriculture. Borrowers may instead opt for non-farm activities, which
have shorter gestation periods, at the expense of agricultural production.
Also investment in agricultural activities, especially crop production, is risky because of
unpredictable weather patterns and reliance on depleted soils (Morvant-Roux, 2011). Being risk
averse, poor households are unlikely to take up risky ventures (FAO, 1998), as would be the case
if they had invested microloans in agriculture. This is one of the explanations offered by
Banerjee (2013), as to why poor borrowers do not invest microloans in agricultural production.
The socio-economic condition of the women, including limited access to land, uncertain land
tenure, high level of cash poverty, poor market conditions, as well as the persistently risky nature
of agricultural production, may also not favour investment of borrowed funds in farming. This
may therefore impede women to benefit from microcredit in their agricultural activities, thus
failing to grasp any food security benefits of borrowing.
122
Our results reiterate observations by Diagne and Zeller (2001) that resource-poor households
lack the necessary infrastructure and socio-economic environment necessary for agricultural
production to benefit from borrowing. They make the assertion that risks associated with drought
and lack of irrigation, inadequate infrastructure and markets, low levels of education,
malnutrition and disease, purge the potential benefits of borrowing. These factors need to be
addressed if women are to benefit from borrowing.
Further research is needed on ways in which women may commercialise agricultural
production and move away from subsistence agriculture, for food security improvement.
Concluding, borrowing did not lead to increment in recurrent agricultural production
expenditures. Neither did it lead to increase in agricultural output, as usually expected. This was
attributable to the subsistence mode of female agricultural production that has limited potential
for commercialisation even after borrowing. The local context the women operate under, the
MFI protocol for loan repayment and the risky nature of agricultural production also seem to
discourage women from investing microloans in agricultural production. For a country that relies
on agricultural production as a source of food and livelihoods, the food security improvement
potential of microcredit may thus not be realised.
The main conclusion from this chapter was that borrowing did not lead to extra recurrent crop
and animal production expenditures, Instead crop production expenditures, numbers of different
types of animals kept by borrowers and monetary worth of some commonly kept animals went
down. In addition non-cash income from crop production went down. From the results of FGD
on loan repayment, it seems plausible that the downward trend in animal production was due to
sale of animals for loan repayment, as discussed in Chapter 2 of this thesis. Food production, a

123
main pillar of food security, was thus unlikely to improve on the account of these subsistence
farmers accessing microcredit.

124
Chapter 5
Microcredit and food security: Evidence from peasant communities in
Uganda
Abstract
In this study we investigate the effect of participation in a microcredit program on food security
of female borrowers’ households in a rural agrarian setting in Uganda. ‘Modes of food
acquisition, dietary diversity, caloric and protein intake, and qualitative food insecurity measures
for different categories of respondents were investigated. A cross-sectional analysis was used for
comparison of women that self-selected into borrowing. First time borrowers and non-borrowers
were then compared using panel analysis to provide insights into changes of food security
parameters. We use Kernel matching to control for potential bias in observables for the cross-
sectional comparison, and also perform a sensitivity analysis with respect to un-observables
using Rosenbaum bounds. For panel analysis we use difference-in-difference with Kernel
matching as well as an individual fixed effects panel analysis. Results show a decline in food
security following the uptake of microcredit. In particular the analysis reveals robustly lower
dietary diversity among long-time borrowers than new borrowers, and larger reductions in
dietary diversity scores among new borrowers, after one year, compared to controls. The
reduction in dietary diversity was traced to a reduction in animal-source food, fruit and sugar
intake. We find indicative evidence that this may be partly explained by an apparent shift from
own production to reliance on food purchase by households. Other household members
relegating the burden of food provision to women after borrowing may also help explain the
observed result.
Key words: Food security, microcredit, subsistence farming, microenterprises, women.
Publication status: Namayengo, F.M.M., Cecchi, F., & Antonides, G. Microcredit and food
security: Evidence from peasant communities in Uganda. Under review at Journal of African
Economies.
125
5.1 Introduction
Poverty is recognised as a major cause of food insecurity in many developing areas in the world
(FAO, 1996), especially in rural areas where agriculture is key in the production of food and
income (Ruel & Alderman, 2013). In sub-Saharan Africa agricultural production is mainly
undertaken by smallholders who provide over 80% of the food consumed, and women provide
more than half of the agricultural labour force (Quisumbing et al., 1995). Smallholders contribute
significantly to regional food security (IFAD & UNEP, 2013), though their efforts remain
insufficient, as the latest FAO report on the world status of food insecurity indicated that
progress in reducing undernourishment in sub-Saharan Africa lags behind the rest of the world
(FAO et al., 2015). Food insecurity manifested by problems of low dietary energy is rampant in
virtually all developing countries. In Uganda, about 48% of the population is food-energy
deficient, more than 40% of the rural population have low dietary diversity, and almost a third of
the children are stunted (UBOS & WFP, 2013; World Bank, 2016b). Food insecurity is prevalent
in rural areas and has been associated with monetary poverty and reliance on bulky staple foods
as a source of energy (UBOS & WFP, 2013).
Given the association between poverty and food insecurity, interventions aimed at poverty
reduction are expected to address the food insecurity question (FAO, 2000b). Diversification of
livelihoods, especially in agricultural communities, is imperative for improved income and food
security (Barrett et al., 2001; FAO, 2000a). Many such interventions target women in recognition
of the special role they play in food security attainment. Women are involved in agricultural and
non-agricultural activities, including subsistence crop production, and in informal trade and
services, all of which contribute to household food access and availability (Buvinić, 1997;
Momsen, 2004; Østergaard, 1992). Despite their key role, women constitute a large part of the

126
world’s poor (Fletschner, 2009). They lag behind men in labour market participation, and have
lower human development indices (HDI) than men (UNDP, 2014). A combination of factors
work together to limit female productivity and to entrap them in perpetual poverty. Financial,
economic and social deprivation limits their market participation to low-return activities
(Cheston & Kuhn, 2002; Grown & Sebstad, 1989; Jiggins, 1989; Lakwo, 2006; MacGuire &
Popkin, 1990). Other factors limiting their participation in formal employment include low levels
of education and skills, limited land ownership rights, and lack of credit, among others (UNDP,
2003). They are also limited by unequal access to land, and other production inputs including
improved seeds and fertilizers (Quisumbing et al., 1995).
The UNDP 2014 Human Development Report named Uganda as one of the countries in the
world where gender disparity is increasing (UNDP, 2014). Although women make up 50% of the
Ugandan population, the majority are unpaid workers (UBOS, 2016). They contribute and have
potential to contribute even more to the socio-economic development of the country and yet they
are deprived and impoverished (Republic of Uganda, 2014b). According to the 2005/2006
Uganda National Household Survey (UNHS) women constitute 53% of the work force in
Uganda (UBOS, 2006). This pans out in a patriarchal system, with gender disparity in access to
resources (Republic of Uganda, 2014b), with male dominance over productive resources and
household decision making. There is wide-spread marginalisation of women in education,
employment and property ownership (Karuhanga, 2008; Lakwo, 2006; Republic of Uganda,
2014a), and yet women are key players in the agricultural sector and household food provision
(Republic of Uganda, 2014b). They continuously seek ways of enhancing their household
management roles, by seeking opportunities for personal and family welfare improvement. An
important way of doing this amounts to self-employment by setting up survival and maintenance

127
microenterprises (MEs). These poorly financed low-return MEs, make significant contributions
to the livelihood of the women and their households (Jiggins, 1989; Schreiner & Woller, 2003;
Smith et al., 2001) but are in need of financing. However, women usually lack access to credit,
because of different factors including lack of information on available credit facilities, credit
rationing which makes formal banking institutions prefer male clients who take larger loans, lack
of collateral for loans, low levels of education, cultural constraints, and high transaction costs
(Østergaard, 1992; Parpart & Connelly, 2000).
Microcredit is one of the popular approaches to poverty eradication and subsequent food
security improvement. With an underlying connection between finance, entrepreneurship,
business growth and improvement in income, microfinance institutions target women with
microcredit. They provide women with microloans for investment into their microenterprises
which are expected to attain high return on investment (Kaboski & Townsend, 2012). Women
have been reported to have good loan repayment records (Kabeer, 2005; Karlan & Goldberg,
2011), and are important in the maintenance of household welfare by allocating large proportions
of their resources to household needs (Barnes et al., 1999; Cheston & Kuhn, 2002; Kabeer,
2005). They devote a higher share of their income than men to everyday subsistence and
nutrition (Blumberg, 1989; Carloni & Goddard, 1987). Providers of microcredit thus believe that
provision of microcredit to women will lead to improvement in food security of poor households.
Food consumption is expected to increase for different reasons. First, borrowing is expected to
have a positive income effect, hence is expected to lead to improved economic access to food
through purchase. Second, investment of received credit in agricultural production is expected to
lead to increased food availability at the household level. The third reason why food security is
expected to improve is through the consumption smoothing effect of borrowing. Women may
128
overcome income and non-income shocks by using acquired loans for household food
consumption expenditures.
However, food security may remain unchanged or even deteriorate after borrowing, for
various reasons. The first is loan repayment burden due to investment of loans in poorly
performing MEs, and diversion of production loans to consumption, among other issues. In this
case, borrowers may allocate meagre available resources away from essential needs like food
provision to loan repayment and other household expenditure priorities. The second reason for
food security deterioration may be the result of a shift from the established norm of reliance on
own-food production to reliance on food purchase, with no commensurate improvement in
income. Thirdly, women’s burden of food provision may increase when they join the
household’s cash economy. Men usually meet cash needs of peasant families because of their
higher involvement in cash crop production and in informal employment activities. When
women borrow they join the cash economy and subsequently men may reduce their cash
contributions with the supposition that women are now more financially empowered. Finally,
food security may not improve after borrowing because of low prioritisation of food security
improvement. Food security may not be an objective of borrowing; women may be comfortable
with the current food security status and make no change in food consumption patterns after
borrowing.
These and other food security dynamics are rarely explored in microfinance studies. Most
studies focus on the influence of microcredit on usually minimalistic food security parameters,
but rarely explore the underlying dynamics. In this study we utilised different food security
indicators and two alternative study approaches to ensure consistency of our findings. In the first
study approach, we utilised a quasi-experimental cross-sectional design and obtained the effect

129
of borrowing on food security by comparing food security parameters for old borrowers (OB), in
the BRAC Uganda microfinance program, and in-coming new borrowers (NB) into the same
program, before they received their first loan. This design ensures that both groups are self-
selected into borrowing. We utilised the propensity score matching (PSM) methodology to
ensure comparability of the groups and to assess differences in food security outcomes of OB
and NB groups. PSM results revealed significantly lower dietary diversity scores, and proportion
of energy from own production, for OB than NB. OB also had smaller sugar-intake and fruit-
intake scores and proportion of energy consumption from fat than NB.
In the complementary approach, we used 2-year panel data for the NB category and a control
group (CG), who never got a loan from BRAC or any other MFI. We employed a difference-in-
difference (DID) estimation with Kernel matching to assess changes in food security parameters
of the NB and CG, within the study period. We again found a decline in the food security
parameters of the households after borrowing. To the best of our knowledge previous studies has
used neither the diversity of food security indicators that we employ, nor used two comparative
approaches.
The remainder of the chapter is organised as follows. Section 5.2 presents the conceptual and
theoretical framework of the study including the above-mentioned factors associated with food
security improvement or lack of improvement. It also presents an overview of findings of
previous studies on microcredit and food security. Section 5.3 describes the study area, the
BRAC microcredit program and the study design and data collection methods. Section 5.4 shows
the results of the cross-sectional and panel studies. Section 5 concludes.
130
5.2 Theoretical framework
This section has three main objectives. In Section 5.2.1 we introduce and discuss the key food
security concepts and indicators that we use in the study. In Section 5.2.2 we present a review of
the theoretical background for potential effects of microcredit and food security, a brief review
of available studies on microcredit and food security, and the hypotheses that were tested in the
empirical part of the study.
5.2.1 Concepts and definitions of food security
There are various concepts at the core of our analysis. These include the definition of food
security and its components, as well as indicators of food security used in the study. Food
security has been defined in more than 200 different ways (Maxwell, 1996). We use the widely
accepted World Food Summit definition, indicating that food security exists when all people at
all times have physical and economic access to sufficient, safe and nutritious food, that meets
their dietary needs and food preferences for an active and healthy life (FAO, 1996). Three broad
concepts are encompassed in the definition of food security: food availability, food access and
food utilisation. Sen (1981) postulates that food insecurity is not all about food availability, but
rather that food access, especially economic access, is an important component of food security.
Food access encompasses the ability of households to actually access available food, usually
through having the economic means to do so (Ashley, 2016). Food availability denotes the
physical availability of food of adequate quantity and quality in an area, while food utilisation
refers to the body’s ability to utilise ingested food usually affected by the state of health of the
individual (FAO, 1996). Next, we discuss the indicators of food security that we use in the study
including household dietary diversity (HDDS), qualitative measures of food insecurity based on
131
the household food insecurity access scale (HFIAS), and measures of undernourishment based
on caloric intake. Caloric intake of households can be used to classify households as food secure
or food insecure (Ashley, 2016).
While modern food economies are characterised by availability of sufficient quantity and
quality foods for consumers throughout the year, the majority of people in developing economies
depend on own-produced monotonous diets. These are based on starchy staples, with minimal
animal-source foods, and seasonal fruits and vegetables. Starchy staple foods constitute a large
percentage of the food expenditures and caloric intake for poor households (Bouis & Novenario-
Reese, 1997). However, reliance on these starchy staples translates into difficulties with meeting
energy and nutrient needs especially because of these foods are high in dietary bulk (Ljungqvist,
Mellander, & Svanberg, 1981). This makes it difficult to consume enough quantities to meet
nutritional needs. Meeting nutritional and energy needs requires use of diets consisting of a
variety of foods. Dietary diversity is a key element of high quality diets (Torheim et al., 2004),
and many nutritional guidelines recommend consumption of a variety of foods (Arimond &
Ruel, 2004). Dietary diversity is a widely used measure of food security, for interventions that
focus on food security improvement. The Household Dietary Diversity Score (HDDS) is a
simple count of the number of different food groups eaten by a household in a specified time
period. A high HDDS is indicative of adequacy in caloric and nutrient supply from diets,
especially in developing countries (Arimond & Ruel, 2004; Hoddinott & Yohannes, 2002).
When incomes of poor communities improve, they shift away from monotonous diets to richer
diets, with improved quantity, quality and diversity (Swindale & Bilinsky, 2006b). Hoddinott
and Yohannes (2002), found positive and strong relationship between HDDS and household per
capita consumption expenditures and household per capita daily caloric availability from staples

132
and non-staples. High HDDS is associated with caloric and protein adequacy (Chua et al., 2012;
Swindale & Bilinsky, 2006b), and higher household income (Swindale & Bilinsky, 2006b).
Interventions that empower women economically have been found to lead to improvement in the
intake of animal source foods (Colecraft et al., 2006) and dietary diversity (Sraboni et al., 2014).
DDS is easily affected by income and non-income shocks to which households usually respond
by eating less or eating less preferred, poorer quality and less diverse foods (Ashley, 2016).
Another common measure of food access is the qualitative Household Food Insecurity Access
Scale (HFIAS). HFIAS has been described and operationalised by Swindale and Bilinsky
(2006a) and Coates, Swindale, and Bilinsky (2007). Based on work by the United States
National Household Food Security Survey Measure (HFSSM), HFIAS comprises a series of
questions that represent domains of household food insecurity (access) experiences that may be
used to assign households on a continuum of severity from food secure to severely food insecure.
HFIAS captures the respondents’ feelings of uncertainty and/or anxiety over food, perceptions
that food is of insufficient quality (for adults and children), and reported reductions in food
intake (for adults and children). Many researchers have validated the use of HFIAS across
different cultures and reported correlations between HFIAS and poverty, malnutrition and food
insecurity (Coates, Webb, & Houser, 2003; Frongillo, Nanama, & Wolfe, 2004; Webb, Coates,
& Houser, 2002). Melgar-Quinonez et al. (2006) found a correlation between HFIAS and
household expenditures on food. In addition, Coates et al. (2006) conducted a study to identify
the commonalities in the experience and expression of food insecurity (access), across different
cultures. They found that insufficient food quantity, inadequate food quality, uncertainty and
worry about food, were a significant part of the food insecurity experience across different
cultures.
133
Interventions that empower women have been associated with improvement in caloric
availability and DDS (Sraboni et al., 2014). Caloric intake of households can thus be used to
classify households as food secure or food insecure (Ashley, 2016). Focus is placed on caloric
needs because if these are not met, other dietary needs may not be met.
Income is another food security indicator, especially so when women are in charge of the
income (Kennedy & Peters, 1992). Adverse poverty prevents over a billion people in the world
from accessing adequate food for productive living (FAO, 1996). People are said to suffer from
severe or moderate forms of poverty if they live on less than $ 1, resp. less than $ 2 per day
(Banerjee & Duflo, 2007; Weisfeld-Adams & Andrzejewski, 2008). Since measurements of
income are usually difficult, household consumption expenditures are commonly used as an
income proxy. Finally, expenditures on food may be another food security indicator because a
large percentage of income of the poor goes to food (Mellor, 1983; Von Braun et al., 1991).
Banerjee and Duflo (2007) found that food represented 56–78% of the consumption expenditures
of poor people in 13 countries.
5.2.2 The income effect of borrowing
Increased income is one of the major expected outcomes of borrowing, with direct bearing on
food security of households. Any intervention that improves household income is expected to
improve purchasing power and economic access to food. For rural agrarian communities
depending on small-scale farming for income and food, improvement in agricultural productivity
will lead to both improvements in cash income as well as income in kind, mainly in the form of
food. Microcredit thus addresses food insecurity via two major pathways: increase in

134
productivity from agricultural and non-farm MEs, and resultant improvement in income and use
of credit for consumption smoothing.
It has long been argued that poor people are credit constrained and access to credit will enable
them to transform their poorly performing investments with untapped potential into productive
investments. Borrowers are expected to use the social and physical capital associated with
borrowing to improve enterprise output (Feder et al., 1990) and thus generate more income
(Zeller & Sharma, 2000). Generally, investment of credit in existing business or new production
activities is expected to lead to microenterprise expansion, increased business outputs, household
and business assets, profits and income improvement (Banerjee et al., 2015; Crépon et al., 2015;
Gobezie, 2004; Imai, Arun, & Annim, 2010; Karlan & Zinman, 2011; McKernan, 2002; Sebstad
et al., 1995).
In the case of agricultural producers, access to credit is expected to lead to improved
agricultural output (Feder et al., 1990). This may happen via different pathways. Firstly, credit
enables farmers to access labour-saving technologies and have better access to agricultural inputs
like fertilisers and improved seeds (Khandker & Koolwal, 2016; Zeller & Sharma, 2000).
Recipients may also increase their labour supply (Banerjee et al., 2015; Crépon et al., 2015),
leading to improved productivity and income (Matin et al., 2002). Some poor borrowers may
utilise loans to rent land for agricultural production.
Secondly, households accessing credit may manage their assets and liabilities more
efficiently; they may reduce levels of assets for precautionary savings and instead acquire
production assets (Foltz, 2004; Matin et al., 2002). They may sacrifice short-term consumption
of non-asset goods and leisure in order to acquire durable goods (Banerjee et al., 2015; Crépon et

135
al., 2015). All these actions will improve their production potential. Indeed some studies have
observed improvement in profits of MEs among borrowers (Copestake et al., 2001)
Since agriculture is a major source of food for peasant communities, improvement in
production resulting from access to credit should lead to improved household food availability
and improvement in cash income, which will lead to economic access to food, especially when
credit is given to women. Investment in animal production is expected to lead to improvement in
production of easy-to-sell animal products including milk and eggs.
5.2.3 Borrowing and consumption smoothing
Enhancement of consumption and consumption smoothing is another pathway through which
microcredit can contribute to food security. The poor do not only face challenges of low income,
their incomes are prone to shocks from risks like business failure, illness and death. Such shocks
greatly influence household consumption and production decisions. Availability of credit helps
the poor overcome such shocks without compromising consumption and production decisions
(Morduch, 1995). Participation in microcredit programs has been observed to lead to
consumption smoothing (Angelucci et al., 2013), especially for communities with production
problems due to seasonality (Develtere & Huybrechts, 2002; Morduch, 1995; Zeller & Sharma,
2000). Farmers may use credit to invest in longer-duration and more profitable investments
(Foltz, 2004; Matin et al., 2002), without worrying about current consumption. Availability of
credit to address emerging shocks will enable the poor to survive without compromising food
consumption. In addition, the possibility of future credit access may alter the need for savings as
protection against future shocks, and clients may use acquired credit to cover current
consumption (Kaboski & Townsend, 2011; Matin et al., 2002).

136
Furthermore, the poor have needs for lump-sum consumption expenditures including life-
cycle expenditures of weddings and funerals, human capital investments in health, education,
and food which may be covered by borrowing (Matin et al., 2002; Rutherford, 2000). Liquidity
constrained borrowers may then use production loans to cover consumption expenditures they
would otherwise be unable to make (Feder et al., 1990). Use of credit to cover consumption
expenditures which are not related to production may be considered as loan diversion. Usually,
borrowers conceal from lenders the fact that a loan will be used for consumption purposes, other
than food (Attanasio et al., 2015), and improper expenditure of loans may lead to a reduction in
food consumption (Angelucci et al., 2013).
5.2.4 Potential negative effects of microcredit
Recently, the discourse on microcredit and its effects on households has shifted to the potentially
negative effects of borrowing. Some have argued that microcredit, especially for MFIs with both
social and profit motivations in their operations, may not be a silver bullet to improve income
and welfare of the poor, especially women (Buckley, 1997; Matin et al., 2002; Morduch, 2000).
These MFIs focus on increasing their loan portfolio, profits and loan recovery, and may
sometimes disregard social benefits of microcredit participation (Ghosh, 2013). Some levy high
interest rates even when they have a range of prices to work within and still expand their
operations (Angelucci et al., 2013). Borrowers, especially women, end up facing limitations in
making good use of accessed loans and may not benefit from borrowing. For example, a study by
FAO on MFIs in Uganda (FAO, 2000a) noted that many engendered practices are sometimes
perpetrated even when women borrow; they are limited to crop and non-cash crop production,
and for the case of non-farm MEs, they invest in less lucrative activities than men.

137
Studies have been commissioned to assess potential negative effects of microcredit.
Angelucci et al. (2013), studied potential negative effects of microcredit on welfare and business
parameters, for borrowers of Compartamos Bancos (one of the largest micro-lenders in Bolivia)
and concluded that negative effects were minimal. Goetz and Gupta (1996) pointed to potentially
negative effects of microcredit and observed that one of the most widely acclaimed outcomes of
microcredit (women empowerment) is not a universal outcome, as some women lack control
over loans they secure. Other negative effects of borrowing reported among women have
included over-indebtedness (Ganle et al., 2015; Rahman, 1999a) and domestic violence, loan
repayment pressure and stress (Rahman, 1999a, 1999b), ME-running related stress (Ahmed,
Chowdhury, & Bhuiya, 2001), and solidarity group loan payment pressure (Mayoux, 2001;
Rahman, 1999a, 1999b).
As such, access to credit may not lead to improvement in food security because of different
factors, including: (1) no improvement in productivity of MEs leading to no improvement in
cash and non-cash income and a resultant repayment burden; (2) food security may not be a
priority for households; (3) there may be a reduction of contribution of others towards food
purchase when women join the cash economy of households.
As Morduch (2000) and Buckley (1997) argue, there may be undue optimism among
proponents of microcredit that the poor demand credit at whatever cost to transform their
businesses. Some MFIs charge high interest rates to poor borrowers based on the fact that the
borrowers are able to pay off loans and even come back for repeat loans. This positive picture of
microcredit and automatic improvement in production ignores the many structural and societal
constraints poor women face that limit their productive capacity as they try to make good of their
small investments (Brett, 2006; Ehlers & Main, 1998). Production improvement requires more

138
than capital. It requires skills, information, connections, and transportation which many poor
people lack (Buckley, 1997; Morduch, 2000). Women usually lack human, financial and social
capital needed to transform their small businesses into profitable ventures (Ehlers & Main,
1998). The type of MEs the women engage in also matters. Most women usually engage in low-
productivity, low-return activities, with limited potential to yield funds for loan repayment
(Gladwin et al., 2001). It is no wonder that some researchers observed no improvement in ME
profits among borrowers (Banerjee et al., 2015). Borrowers involved in agricultural-related MEs
face production risks due to reliance on unpredictable weather patterns, which make incomes
seasonal and unreliable. These risks come on top of the inevitable lag phase between investment
and income (Morvant-Roux, 2011). And yet some MFIs require loan repayment to be effected
within a year and for repayment to commence already in the week after loan receipt. This may
not be feasible for many borrowers, for few businesses of the poor can attain the rates of return
investment needed to meet such requirements (Rutherford, 2000).
Activities which the women engage in are usually those they can run within the confines of
the households (Goetz & Gupta, 1996). The embeddedness of such activities within the
household economic portfolio may impair separation of funds from MEs for loan repayment
(MkNelly & Lippold, 1998).
The inevitable outcome of these factors is over-indebtedness and problems with loan
repayment that may compromise the food security of households. Copestake et al. (2001)
observed an increase in indebtedness of borrowers on the first loan cycle and envisaged it may
have been due to rigorous loan repayment protocols that put no consideration on the risks and
uncertainties of the businesses. Stuck with the burden of the repayment to save the social ties and
relationships of women in group contracts, women do whatever it takes to ensure loan

139
repayment, including compromising household consumption. They sell whatever is saleable,
including household food items, sacrificing household expenditures to save funds for loan
repayment. These may have a negative effect on household food security (Goetz & Gupta, 1996).
Women may never benefit from loans if issues like market access are not part of the
interventions (Adams & Von Pischke, 1992).
Some authors have explored negative effects of borrowing and found mixed results
(Angelucci et al., 2013). Among the poor and less experienced borrowers some negative effects
were observed.
5.2.5 Non-income factors which affect food consumption
Different factors have been observed that may influence food consumption even when people
have physical and economic access to food. These include cultural and religious factors (den
Hartog, van Staveren, & Brouwer, 2006) as well as education (Burchi & De Muro, 2016). Lack
of nutrition knowledge may negatively impact on the food security outcomes of borrowing. Lack
of nutrition knowledge is a common problem among the low-education women of poor
communities and it has been associated with poor maternal and child nutrition. The UNICEF
conceptual framework of the causes of malnutrition in deprived communities (UNICEF, 1990)
identifies lack of nutrition knowledge as an underlying cause of child malnutrition.
One of the widely acclaimed effects of microcredit participation is the empowering effects of
microcredit on women. Women who have accessed credit have been reported to have higher
levels of decision making within their households (Rahman, 1986; Fofana et al., 2015), and
improvement in societal and perceived self-worth (Angelucci et al., 2013; Hashemi, Schuler, &
Riley, 1996; Kabeer, 2001). These factors may all lead to food security improvement. Any

140
intervention that enhances women’s financial status and decision making will lead to higher
social benefits including extra expenditure on food for households (Buvinić, 1997).
5.2.6 Available evidence on microcredit and food security
Studies on the relationship between microcredit and food security show mixed results. For
example, whereas Attanasio et al. (2015) reported an increase in seven-day expenditure on food
among borrowers in Mongolia, Augsburg et al. (2015) observed a reduction in weekly food
expenditures among poor borrowers, who just started a new business, in order to supplement the
loan. For borrowers who already had a business, their consumption remained unchanged. Barnes
et al. (2001a) report a positive and significant relationship between microcredit participation and
consumption of animal source food, and others report positive relationships between borrowing
and the nutrition of children (Marquis et al., 2015; Moseson, Hamad, & Fernald, 2014), women’s
nutritional status (Hamad & Fernald, 2015), and food consumption for entire households (Doocy
et al., 2005; Hamad & Fernald, 2015; Imai & Azam, 2012; Moseson et al., 2014). Other studies,
however, have reported a negative relationship between borrowing and feeding among women.
For example, borrowers under the Promujer lending program in Bolivia were reported to
compromise their food intake as a result of the burden of loan repayment (Brett, 2006). Women
reported reducing the quantity and quality of household meals and use of all available household
resources to effect the payment. Crépon et al. (2015) reported a reduction in overall consumption
and non-durable consumption for households with a pre-existing business, as they invested more
in their businesses. However, they observe that borrowers who did not have pre-existing
businesses increased their food consumption expenditures after borrowing.

141
Microcredit participation has been associated with smoothening of consumption among
women borrowers. Some studies have reported higher levels of household consumption among
female borrowers (Khandker, 2005). Pitt and Khandker (1998) compared household
consumption among female and male borrowers and found female borrower households with
higher consumption expenditures than their male counterparts. Households that borrow are
reported to smoothen their consumption expenditure in anticipation of borrowing or after
borrowing. However, a number of studies found no changes in general consumption (Attanasio
et al., 2015; Banerjee et al., 2015; Crépon et al., 2015) after borrowing. Coleman (1999) found
no effect of borrowing on expenditure on health and education of children. Finally, over-
borrowing and bad investments may translate into consumption decreases to cover losses on
these expenditures (Angelucci et al., 2013), including loan repayment.
5.2.7 Research questions and hypotheses
Against our theoretical review, and with focus on the food security aspects, we stated the
following hypothesis to answer the question of whether borrowing leads to modification in food
consumption among rural agrarian borrowers and the factors which may explain any observed
differences. The central null-hypothesis we tested is: Borrowing has no effect on the food
consumption of households. The following hypotheses were tested:
Hypothesis 1. Participation in the microcredit program leads to changes in mode of food
acquisition and household expenditure.
Hypothesis 2. Participation in the microcredit program leads to increases in household
food security parameters.

142
Hypothesis 3. The contribution of others to household food needs decreases when women
access loans.
5.3 Methodology
This section deals with the empirical survey among microcredit recipients and non-recipients in
Uganda. Section 5.3.1 considers the study area and the BRAC microcredit organization. Section
5.3.2 explains the study design. Section 5.3.3 describes the measures. Section 5.3.4 deals with
the analysis techniques.
5.3.1 Study design
Measurements of changes among program recipients brought about by a program involves
estimating the counterfactual, i.e., what would have happened to program recipients, without the
program. There are methodological challenges involved, since it is not possible to both be and
not be in the program at the same time. In the case of microfinance programs, there is the
challenge of selecting comparison groups, i.e., non-borrowers to compare with borrowers. This is
not usually easy because program placement may be endogenous. The decision to join a credit
program may also be endogenous, as those who decide to join the program, may be different
from those who do not join the program (Armendáriz & Morduch, 2010; Morduch, 2000) leading
to self-selection bias. Different methods can be used to overcome these challenges including
instrumental variable methods, double-difference methods, propensity score matching,
randomised impact evaluation methods, and pipe-line methods (Coleman, 1999; Pitt &
Khandker, 1998). In this study, we employ some of these commonly used methods to assess the
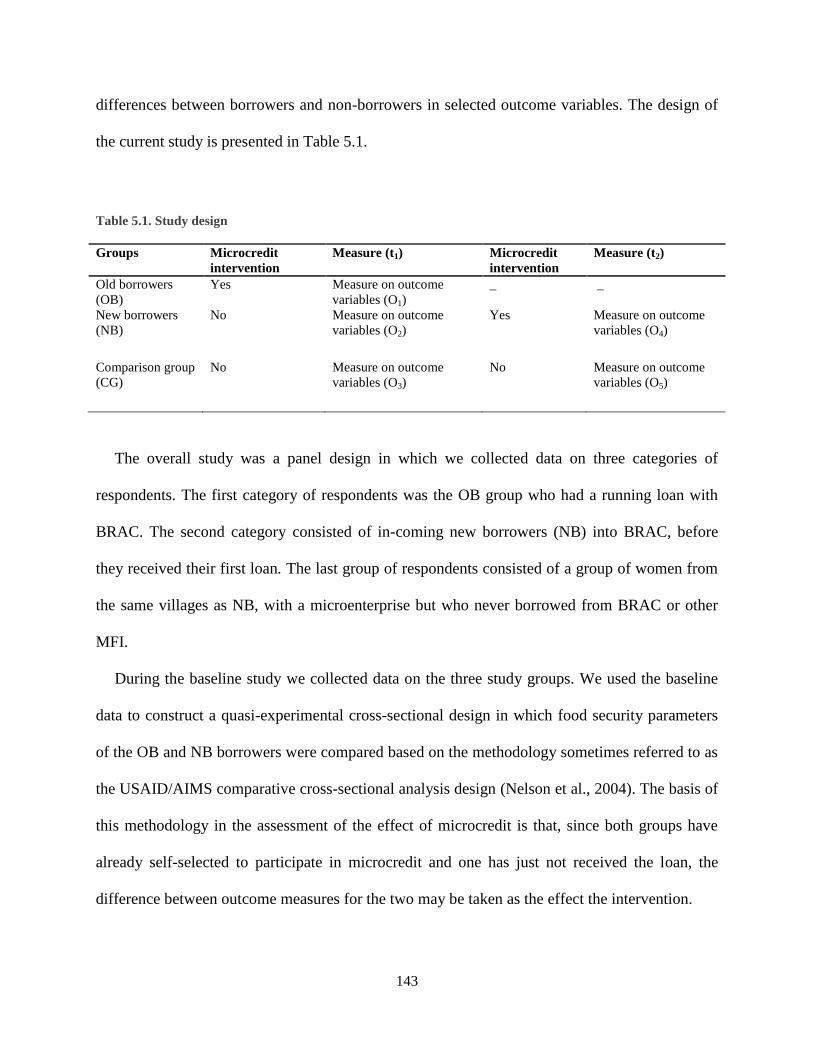
143
differences between borrowers and non-borrowers in selected outcome variables. The design of
the current study is presented in Table 5.1.
Table 5.1. Study design
Groups Microcredit
intervention
Measure (t1) Microcredit
intervention
Measure (t2)
Old borrowers
(OB)
Yes Measure on outcome
variables (O1)
_ _
New borrowers
(NB)
No Measure on outcome
variables (O2)
Yes Measure on outcome
variables (O4)
Comparison group
(CG)
No Measure on outcome
variables (O3)
No Measure on outcome
variables (O5)
The overall study was a panel design in which we collected data on three categories of
respondents. The first category of respondents was the OB group who had a running loan with
BRAC. The second category consisted of in-coming new borrowers (NB) into BRAC, before
they received their first loan. The last group of respondents consisted of a group of women from
the same villages as NB, with a microenterprise but who never borrowed from BRAC or other
MFI.
During the baseline study we collected data on the three study groups. We used the baseline
data to construct a quasi-experimental cross-sectional design in which food security parameters
of the OB and NB borrowers were compared based on the methodology sometimes referred to as
the USAID/AIMS comparative cross-sectional analysis design (Nelson et al., 2004). The basis of
this methodology in the assessment of the effect of microcredit is that, since both groups have
already self-selected to participate in microcredit and one has just not received the loan, the
difference between outcome measures for the two may be taken as the effect the intervention.
144
We also collected baseline data on women who never received a loan (Control group=CG).
We carried out two waves of data collection for both the NB and the CG groups (Gaile & Foster,
1996). After one year we conducted a follow-up study in which we collected data from the NB
and CG groups only. This data were used to obtain an alternative measure of the effect of
microcredit using the difference-in-difference method (DID).
5.3.2 Setting
We use clients of BRAC, which is considered to be the world’s largest developmental
organisation in terms of reach and staff scale (Economist, 2010). BRAC is one of the largest
micro-lenders in Uganda with 110,000 active borrowers by the end of 2013. It operates in many
rural agrarian districts of Uganda, and has an ongoing expansion plan (BRAC, 2008, 2013). The
BRAC microfinance program targets poor women (20–50 years) with stable businesses to
enhance the performance of their self-employment activities (agricultural or non-farm
microenterprises). The BRAC microcredit program uses the Grameen-like group lending model
(Armendáriz & Morduch, 2010), relying on joint liability of members for loan repayments at
weekly group meetings. Microloans (USD 50–700) are given in cash to individual women who
are serviced in 15–20 person Village Organisations (VOs). Loans are repayable in either 20 or 40
equal weekly instalments, commencing in the week after loan access. A VO is served by a credit
officer, who is in charge of explaining BRAC loan terms and processes, including 18 promises
members recite in each meeting to promote desirable behavioural adaptations. The group
members have to agree to joint liability for repayment of each other’s loans. Joint liability helps
overcome problems of information asymmetry before lending, and moral hazard after lending. In
addition borrowers are required to present a loan guarantor who will pay the loan when all other

145
forms of loan recovery have failed. Loan repayment is done weekly, starting in the week
following loan access. If a member fails to make her payment, the group chairperson and credit
officer urge members to cover the payment in the spirit of solidarity by pooling funds together.
Loan guarantors are called in when a woman neither turns up for a VO meeting nor makes prior
arrangement for a payment. Women who cannot attend a VO meeting send their repayment
through fellow VO members. (More details and characteristics of BRAC are presented in
Chapter 2 of this thesis. At the time of the study BRAC charged flat interest rates of 12% and
25% for the 20 and 40-week repayment periods, respectively. Loan amounts were jointly agreed
upon by members of the VOs and the BRAC credit officer, branch manager and area manager.
The minimum loan size and usual amount of the first loan was at the time of the study UGX
250,000 (about $ 100).
The study was conducted in the districts of Mukono and Buikwe, both located in the central
region of Uganda, within the Lake Victoria basin. The districts were selected based on two
criteria. The first one is presence of BRAC microfinance activities among rural agrarian clients.
The second was the MFI having expansion plans which was necessary for the identification of
new borrowers for the study (see Table 5.1 for study design). Mukono district shares borders
with Buikwe in the East. The relief, climate and fertile soils makes the area suitable for crop
production (Mukono District Local Government, 2010).
With a population of about 599,817 people Mukono ranks seventh out of the 121 districts of
Uganda, whereas Buikwe has a population of about 436,406. Most people in Mukono (73%) and
Buikwe (67%) live in rural areas (UBOS, 2016). Over 80% of the population in both districts
rely on agricultural production. Subsistence agriculture is characterised by low acreage due to
increasing family sizes and land fragmentation, and by low productivity per unit area because of

146
deteriorating soil fertility. Because of the proximity to the lake and the presence of many fish
landing sites and rivers, fishing is an important economic activity in the two districts. Most fish
is taken by big fish processing companies for export (Mukono District Local Government, 2010).
Buikwe district is located 62 kilometres by road east of Kampala. It became a separate district in
2009 (UBOS, 2016).
5.3.3 Sample and procedures
With the consent of the participants and after assurance of confidentiality baseline data collection
was undertaken between September 2013 and March 2014. The follow-up study took place
between September and April 2014, one year after the baseline survey. We collected data from
312 existing borrowers (Old Borrowers=OB) and 221 in-coming clients (New Borrowers= NB)
who had self-selected to join the microcredit program before they received their first loan.
Because they had self-selected to participate in the microcredit program, the NB category was
expected to have comparable characteristics to the OB category as described by Armendáriz and
Morduch (2010). We also obtained data from 227 non-borrowers (control group=CG) following
a method described by Karlan and Goldberg (2011). The LC1 (Local Council 1) chairman of the
villages in which the NB groups resided helped to identify households engaged in the informal
sector (a non-farm microenterprise or agriculture as a source of income). The follow-up study
had a total of 373 respondents (NB=131 and CG=203, drop outs from the NB=30, and Controls
that borrowed =9). The overall recovery rate was thus 74% for the panel study.
The OB and NB categories were selected from 100 VOs, from 6 BRAC branches from
Buikwe and Mukono districts (Buikwe, Nkokonjeru, Lugazi, Kasawo, and two from Mukono).
At the start of the study, we purposively selected BRAC branches had expansion plans, a pre-

147
requisite for recruitment of NBs into the study. By the time of the study BRAC had about 323
women organisations in the two districts that are served under 6 branches. All BRAC branches
were eligible for inclusion into the study. We zeroed down on inclusion of VOs that had agrarian
clients we defined as ‘clients who practiced agricultural production for food or as ME’. In order
to balance out the effect of loan periods and loan cycles, we sampled and included VOs that had
existed for more than two years. BRAC branch managers and loan officers used loan sheets to
aid in the selection of VOs, with typically agrarian borrowers. VOs for NBs were newly-formed
or had new borrowers. All women in a selected VO were eligible as respondents, except NBs and
OBs who previously borrowed from other MFIs. NBs were enrolled in the study during the
mandatory one-month orientation period, before they accessed their first loan. OBs were selected
from VOs in the same or neighbouring village as selected NBs. Drop-outs from OB groups were
traced and interviewed to reduce drop-out bias as described by Karlan (2001).
Information about the BRAC microcredit program was obtained from focus group discussions
(FDG) with the borrowers and from key-informant interviews with BRAC loan officers, branch
managers and the area manager. We obtained some information from loan sheets that we were
able to access and also attended some VO meetings to understand more about the program
operations. Six FGD sessions were held for OB groups and two for NBs. Each focus group
comprised 8–15 participants, and included persons who had not been included in the survey and
from groups not included in the questionnaire survey. Detailed notes and audio recordings were
used to record the interviews. A FGD guide was used to elicit information from participants
about their opinions and experiences with borrowing (see Appendix 5.1).

148
5.3.4 Measures
Food intake and dietary diversity were measured by asking the women to provide the number of
days, amount, cost and source of food that was eaten by the households in the seven days before
the study. Measurement of food availability was obtained from data on the types, quantities, cost
and sources of food (purchase versus own-production), acquired or purchased by the household
in the seven days before the study. Household measures with known weight equivalents were
used to estimate the quantities of food eaten by the household. Information was obtained on
household members who missed different meals in the reference time period, to account for
missed meals. The energy, protein, caloric and fat intake of the households was calculated by
using the respective values from 100g of food as given by Ngulube (1989).
We calculated a household per capita caloric intake by dividing the total calories in the
different foods acquired and or consumed by the household and dividing it with the total number
of adult male equivalent (AME) units for the household. AMEs were obtained from information
on the household size and age composition. All adults were assigned one AME and children 0.6
AME. The total AME units of the household were the sum total of the AME units of the
household. In a separate procedure, the quantities of different types of food were converted into
total calories using food composition data bases and the food composition by Ngulube (1989).
To obtain per capita caloric intake for a household, the total caloric supply from the food was
divided by the total household adult equivalence units (den Hartog et al., 2006; Smith &
Subandoro, 2007).
We calculated a household diet diversity score (HDDS) as the number of food groups
consumed during the previous 24 hours of the study. In this study HDDS was based on 12
different food groups: cereals, white roots and tubers, legumes/pulses, vegetables, fish, fruits,

149
meat, eggs, oil, sugar, and milk. This a slightly modified list from that used by Swindale and
Bilinsky (2006b)
The household food insecurity access scale (HFIAS) was adapted from Swindale and Bilinsky
(2006a), and Coates et al. (2007), to assess whether households experienced problems in access
to food in the preceding 30 days. The HFIAS scale was used to obtain the following information:
(1) feelings of uncertainty or anxiety over the food situation; (2) perception that food is
insufficient of quantity for adults and children; (3) perceptions that food is insufficient in quality;
(4) reported reductions in food intake for adults and children; (5) reported consequences of
reduced food intake; (6) reported feelings of shame for resorting to socially unacceptable means
to obtain food. Different questions related to the above were asked for a recall period of 4 weeks
or 30 days. The respondent was first asked an occurrence question, as to whether the condition in
the question happened at all in the past 4 weeks (Yes or No). If the respondent answered ‘yes’ to
an occurrence question, a frequency of occurrence question was asked to determine whether the
condition happened rarely (once or twice), sometimes (three to ten times) or often (more than ten
times) in the past 4 weeks. We calculated a household food insecurity access score (HFIAS), for
individual households, following the methods by Coates et al. (2007). The maximum score for a
household was 27 and the minimum was zero. The higher the HFIAS score the more food
insecurity the household experienced.
The quantitative survey questionnaire was also used to elicit information on socio-
demographic characteristics of respondents and their households, household expenditure, as well
as several personality variables. It also elicited data on the monthly household expenditure on
non-durable goods/ non-food goods, frequently purchased services, and 7-day expenditure on
150
food. We also used it to determine the level of monetary expenditure of other family members on
food.
We used a 4-point Likert scale (1=agree strongly; 2=agree to some extent; 3=disagree to some
extent; 4=disagree strongly) with different personality statements. Three time preference items
were adapted from Petrocelli (2003): (1) I only focus on the short term; (2) I live more for the
present than for the future; (3) The future will take care of itself. Four items for need for
achievement were adapted from Keinan and Kivetz (2011), and Ray (1980), including: (1) I get
restless and annoyed when I feel am wasting time; (2) I have always worked hard to be among
the best; (3) I am an ambitious person; (4) Improving my life is important to me. Another four
items for risk preference were adapted from Blais and Weber (2006): (1) I enjoy taking part in
decisions with un-known outcomes; (2) I avoid activities whose outcomes are uncertain (reverse
scored).; (3) to gain high profits in business one should take decisions even when uncertain of
the outcomes; (4) I would invest all my monthly profit in a new business venture. Socio-
demographic and personality measures were assumed to reflect stable personality characteristics
that might explain residual heterogeneity in the samples of new and old borrowers.
We also constructed an asset index and a housing facilities index, as a proxy for wealth using
principal component analysis of data on household wealth and asset ownership. We obtained two
components from our analysis. Component 1 which we named the household assets index
included seven count variables (number of tables, chairs, beds, mattresses, cell phones, hoes, and
radios). Component 2 was composed of variables related to housing and housing facilities (house
ownership, TV ownership, electricity presence, type of walls of the house, and the material for
the floor of the houses). We used these variables to construct a household housing index.

151
Qualitative data collection using focus group discussions was done for groups of up to 15
women, to obtain in-depth information on different aspects of the study: Reasons for borrowing;
Female participation and responsibilities in the management of loans and loan-supported MEs;
Decision making on loan acquisition; Control of loan funds and the running of the MEs; Changes
in household welfare after borrowing (we probed for changes in lives of the respondents and
their household after borrowing); Changes in community participation and respondent position in
community after borrowing (we probed about loan repayment, sources of funds, difficulties, role
of husbands etc.).
All study instruments were translated into Luganda, the commonly spoken language in the
study area. They were pilot tested and improved before use in the study.
5.3.5 Empirical strategy
We analysed cross-sectional data for 533 respondents (312 OBs and 221 NBs) from about 138
Village Organisations (VOs), from 7 BRAC branches in the Buikwe and Mukono districts. We
cross-checked and ensured comparability of the OB and NB groups by use of the Probability
Score Matching (PSM) methodology. Factors which could influence self-selection into
microcredit and those which could influence microcredit outcomes were used as control
variables in the PSM procedure, with weighted Kernel matching (Luellen et al., 2005). These
factors included respondent background characteristics, that is religion, marital status, age, years
of education, time preference, risk preference, and achievement motivation. In order to compare
with the NBs, all age-related variables of OBs were converted to the age basis at the time of their
first loan, indicated as ‘corrected age’, ‘corrected family size’, and ‘corrected dependency ratio’
hereafter. Principal components analysis was used to check the dimensionality of the personality

152
characteristics. In this analysis, only the time preference items were found to have a single factor
in common, hence the average item scores were used as a measure of time preference, or
impatience. The need for achievement and risk preference items were not explained from
common factors, so we used the individual item scores in the PSM procedure.
The control variables were used to construct propensity scores estimating the probability of
being in the control or treatment group. The PSM procedure was also used to estimate the effect
of receiving microcredit. The rationale of PSM is to match the participants in the treatment group
to those in the control group based on propensity scores. Therefore any remaining differences
observed can be attributed to the treatment. The average treatment effect on the treated (τATT)
was defined as:
τATT = E(τ |D = 1) = E[Y(1)|D = 1] − E[Y(0)|D = 1] (1)
where D = 1 if respondent had a running loan with BRAC and D = 0 when they belonged to the
NB category. Y(D) is the outcome variable of each participant (for example dietary diversity
score) while [Y(0)|D = 1] is counterfactual and unobservable. According to Rosenbaum and
Rubin (1983) τATT can be expressed as:
τATT = EP(X)|D=1 [E[Y(1)|D = 1, P(X)] − E[Y(0)|D = 0, P(X)]] (2)
where P(X) is the propensity score, that is, the probability of an individual to participate in the
microcredit program given the observed characteristics X.
Panel data analysis involved comparison of data for 222 NBs and 225 CGs respondents using:
(1) the Difference-in-difference (DID) approach in combination with propensity score matching,
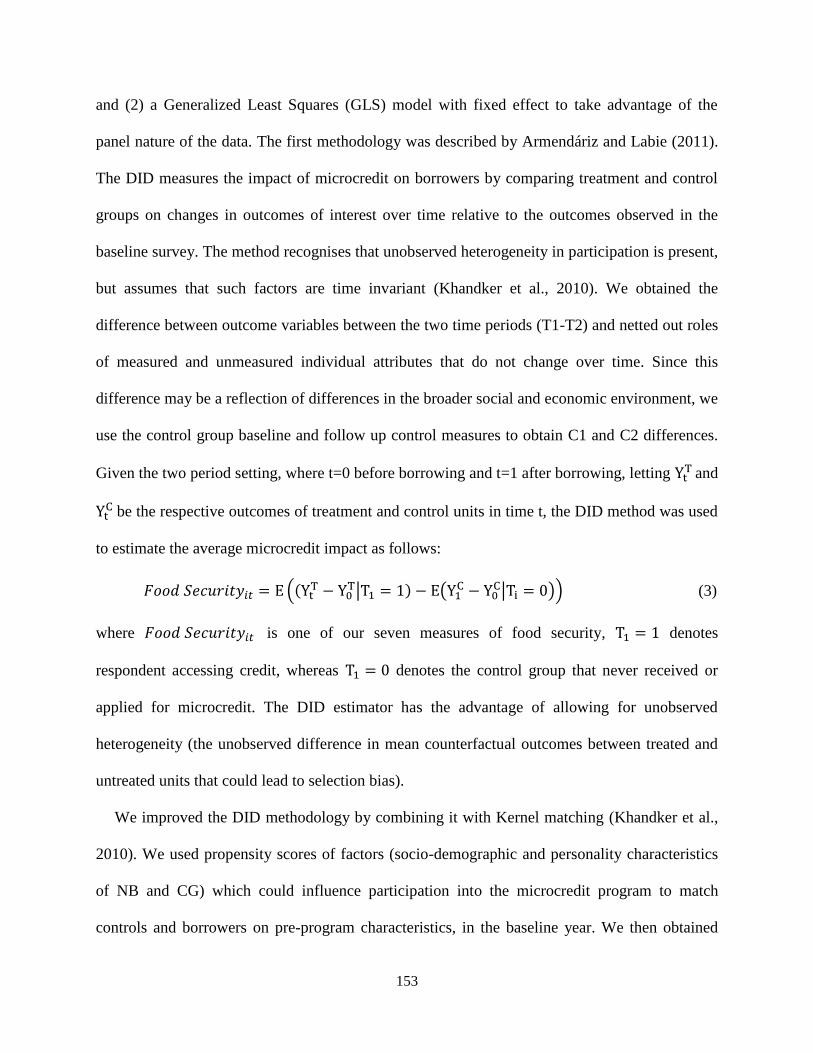
153
and (2) a Generalized Least Squares (GLS) model with fixed effect to take advantage of the
panel nature of the data. The first methodology was described by Armendáriz and Labie (2011).
The DID measures the impact of microcredit on borrowers by comparing treatment and control
groups on changes in outcomes of interest over time relative to the outcomes observed in the
baseline survey. The method recognises that unobserved heterogeneity in participation is present,
but assumes that such factors are time invariant (Khandker et al., 2010). We obtained the
difference between outcome variables between the two time periods (T1-T2) and netted out roles
of measured and unmeasured individual attributes that do not change over time. Since this
difference may be a reflection of differences in the broader social and economic environment, we
use the control group baseline and follow up control measures to obtain C1 and C2 differences.
Given the two period setting, where t=0 before borrowing and t=1 after borrowing, letting YtT
and
YtC be the respective outcomes of treatment and control units in time t, the DID method was used
to estimate the average microcredit impact as follows:
𝐹𝑜𝑜𝑑 𝑆𝑒𝑐𝑢𝑟𝑖𝑡𝑦𝑖𝑡 = E ((YtT − Y0
T|T1 = 1) − E(Y1C − Y0
C|Ti = 0)) (3)
where 𝐹𝑜𝑜𝑑 𝑆𝑒𝑐𝑢𝑟𝑖𝑡𝑦𝑖𝑡 is one of our seven measures of food security, T1 = 1 denotes
respondent accessing credit, whereas T1 = 0 denotes the control group that never received or
applied for microcredit. The DID estimator has the advantage of allowing for unobserved
heterogeneity (the unobserved difference in mean counterfactual outcomes between treated and
untreated units that could lead to selection bias).
We improved the DID methodology by combining it with Kernel matching (Khandker et al.,
2010). We used propensity scores of factors (socio-demographic and personality characteristics
of NB and CG) which could influence participation into the microcredit program to match
controls and borrowers on pre-program characteristics, in the baseline year. We then obtained
154
differences between NB and CG groups within the common support, on different food security
parameters.
In addition to the DID with Kernel matching we use the data in the common support region to
run a standard GLS model with fixed effects. In this case each woman in the sample is traced
both in the baseline and follow up to form a panel of data. This way:
𝐹𝑜𝑜𝑑 𝑆𝑒𝑐𝑢𝑟𝑖𝑡𝑦𝑖𝑡 = α𝑖 + 𝑇𝑖𝑡 + 𝛿𝑡 + 휀𝑖𝑡 (4)
where 𝐹𝑜𝑜𝑑 𝑆𝑒𝑐𝑢𝑟𝑖𝑡𝑦𝑖𝑡 is again one of our seven measures of food security, α𝑖 is the individual
level fixed effect term, 𝑇𝑖𝑡 is once more the microcredit treatment, 𝛿𝑡 represents a time dummy
and 휀𝑖𝑡 the error term.
5.4 Results
In this section we present empirical results of our assessment of cross-sectional and panel
analysis of differences in food security parameters of households of borrowers and those without
credit. In the cross-sectional analysis, we compare baseline food security parameters for OB and
NB groups. We then present longitudinal panel data comparison for CGs and NBs. Finally, we
discuss and conclude based on the study findings.
5.4.1 Cross-sectional study results
In this section we present results for 533 respondents we used in the cross-sectional comparison
of OB (n=311) and NB (n=221). As mentioned before, propensity score matching was used to
ensure comparability of the two groups. It was also used to determine the average treatment
155
effect on the treated (ATT), a measure of differences between treatment and controls, after
controlling for variables that could influence taking credit.
Descriptive characteristics of the respondents in the cross-sectional study before and after
matching on factors that would influence microcredit participation are shown in Table 5.2. The
dependency ratio defined as the ratio of dependents (aged 0–14 years and those over 65 years) to
the household productive members (15–64 years), was about 1.48 for entire sample. This is
lower than the national average. Respondents in the whole sample scored high on the time
preference scale, indicating a moderately high future bias, and they scored around neutral on the
risk measurement scale. The majority of the respondents (70%) were married. The respondents
in both groups typically had limited formal education, the majority having completed seven years
of primary education. Older respondents were more likely to be in the OB group.

156
Table 5.2. Socio-demographic characteristics of OB and NB in unmatched cross-sectional samples
Variables Pooled
Mean
Min Max
OB
Mean
NB
Mean
t
(OB-NB)
Age at borrowing 34.27
(10.12)
19 72.05 35.39
(10.6)
32.86
(9.3)
-2.77**
Education 7.31
(3.30)
0 14 7.27
(3.34)
7.31
(3.39)
0.13
Dependency ratio 1.45
(1.28)
0 9 1.47
(1.3)
1.43
(1.2)
-0.38
Time preference scores 3.41
(0.80)
1 4 3.44
(0.80)
3.40
(0.80)
-0.57
Achievement motivation score 1.06
(0.19)
0.33 2 1.05
(0.19)
1.05
(0.19)
-0.10
Risk preference 2.30
(1.00)
1 4.33 2.32
(1.05)
2.27
(0.96)
-0.56
Anglican (%) 0.3
(0.45)
0 1 0.32
(0.47)
0.26
(0.44)
(2.39)1
Pentecostal (%) 0.14
(0.35)
0 1 0.12
(0.33)
0.16
(0.37)
(1.78)1
Muslim (%) 0.23
(0.41)
0 1 0.25
(0.43)
0.19
(0.4)
(2.07)1
Marital status (%) 0.70
(0.46)
0 1 0.70
(0.46)
0.71
(0.46)
(0.01)1
Household asset index 2.16
(0.83)
0.22 6.22 2.23
(0.82)
2.07
(0.83)
-2.06**
Housing facilities index 0.46
(0.35)
0 1.25 0.47
(0.36)
0.46
(0.34)
-0.44
1Pearsons Chi-square values. ** p <0.05.
The PSM method is useful to reduce differences in observable characteristics between
borrowers and non-borrowers. Matching is expected to balance the distribution of explanatory
variables across OB and NB groups. Table 5.3 contains covariate after-matching balancing test
results for the two-sample t-test of mean differences between OB and NB women. The major
observation from Table 5.3 is that all covariates are balanced since differences between the OB
and NB samples are not significant after matching. Hence the matched groups can be considered
similar with respect to matching variables.

157
Table 5.3. T-tests for equality of means for matched samples (common support)
Variables OB NB t % Bias
Dependency ratio 1.59 1.64 -0.19 -4.2
Age at borrowing 35.07 34.72 0.83 3.5
Education 7.36 7.23 0.44 4.0
Time preference score 3.46 3.43 0.39 3.4
Achievement motivation score 1.06 1.06 0.42 3.8
Risk preference 2.30 2.27 0.09 1.7
Anglican (%) 0.32 0.31 0.20 1.9
Pentecostal (%) 0.14 0.13 -0.12 -1.1
Muslim (%) 0.22 0.23 -0.38 -0.3
Marital status (%) 0.70 0.72 -0.53 -4.8
Household asset index 2.21 2.23 0.14 1.3
Housing facilities index 0.47 0.46 0.73 -1.2
Results of the PSM analysis (Table 5.4) found borrowers with running loans (OB), with
significantly smaller dietary diversity scores and proportion of energy from own production, than
in-coming borrowers (NB). OB dietary diversity scores were 0.64 points smaller than NB. They
also took 2% smaller proportion of energy from fat and 8% smaller proportion of energy
consumption from own production than NB. We disaggregated the household dietary diversity
components further and found OB to have smaller fruit-intake and sugar-intake scores than NB.
As a robustness check for our result we conducted the PSM procedure using Radius matching
and nearest neighbour matching (see Table A5.1 in Appendix 5.1). Results are generally similar
to those we obtain using Kernel matching.
Table 5.4 shows that food expenditures of OB households were significantly higher than for
NB households. Also, the expenditures of others on food were significantly lower. For the other
expenditure categories, no significant difference was found. We therefore do not reject
hypothesis 1 and hypothesis 3 (Section 5.2.7). The results were quite consistent across other
PSM matching methods (Table A5.1 in Appendix 5.1).

158
Table 5.4. Differences between OB and NB food security parameters, Kernel matching
OB NB Difference
N Mean N Mean ATT t
Caloric intake1 250 2351.31 206 2393.40 -42.07
(104.56)
-0.40
Dietary diversity score 250 6.16 205 6.81 -0.64
(0.21)
-3.02**
HFIAS score2 257 4.72 212 4.00 0.72
(0.44)
1.62*
Proportion of energy from fat 246 0.14 210 0.16 0.02
(0.01)
-2.51**
Proportion of own-food production3
228 0.47 195 0.55 -0.08
(0.03)
-3.05**
Log of seven-day per-capita expense on
food
252 8.45 210 8.29 0.16
(0.08)
2.09**
Log of monthly food expenditure by others 250 6.90 209 8.14 -1.2
(0.5)
-2.49**
Figures in parentheses in the Difference column are standard errors. ** p <0.05, * p < 0.10. 1Adult Male Equivalent;
2 30-Day Household Food Insecurity Access Scale score;
3 Energy from own-food production proportion.
Sensitivity analysis using R-Bounds
We conducted a sensitivity analysis of our matching procedure to obtain information about
possible hidden bias or bias from unobserved respondent characteristics with potential to
influence self-selection into microcredit program. Such unobservable variables might bias our
conclusions about the effects of microcredit and we tested this by conducting a Rosenbaum
sensitivity analysis as described by Rosenbaum (2010) and DiPrete and Gangl (2004). Table
A5.2 in Appendix 5.1 provides p-values for Wilcoxon signed rank tests for different levels of
gamma (Γ), the odds ratio of differential treatment assignment due to unobservable attributes. At
each Γ a critical p-value is shown, indicating the limit of significance level of the treatment effect
due to endogenous selection into treatment. We present results for up to Γ=3, for weekly
household food cost and for dietary diversity scores, some of the major outcomes of our study.
Results indicate that unobservable covariates would need to change the odds of treatment
assignment by factors beyond 3 (we obtained results to as high as 56 and the significance did not
change) to conclude that the observed treatment effects from propensity score matching were due
159
non-random assignment. Given the results of the sensitivity analysis for PSM, and the lack of
suitable instruments explaining group membership, we refrained from conducting an
instrumental variables regression on our data. To check if our result holds even across different
analytical techniques, we conduct DID analysis on 2-year panel data, as described below.
5.4.2 Panel study results
The panel data analysis was conducted on a total of 448 respondents. The treatment group in the
panel study were 222 new borrowers (NB) who at baseline were just about to get their first loan.
The control group (CG), were 226 women from the same village as NB but who never got a loan
from BRAC or other MFI.
Table 5.6 shows that the unmatched samples differed on age, family size, education level,
achievement motivation score and risk preference. Respondents in the control group were older,
less educated and more risk averse than the NB category. That the two groups were different is
not surprising, since the NB category had self-selected to participate in the microcredit program
and the CG had not. We incorporated Kernel matching, in our DID analysis, to ensure
comparability of the two groups, based on observable variables including two wealth indices
(housing index and asset index) and demographic and personality characteristics that would
influence the decision to take credit. Once Kernel matching is performed, and data outside the
common support region is excluded, the panel shows strongly balanced treatment and control
groups with respect to the selected variables, none of them being significantly different across
the two groups.

160
Despite use of PSM matching, we may not rule out influence from unobserved characteristics,
on our results. We thus make use of a panel setting and a GLS fixed effects to ensure that all
time-invariant un-observables are taken care of by the individual constant term.
Table 5.6. T-tests for equality of means for unmatched and matched panel samples
Variables Unmatched sample Matched sample % Bias
NB CG t NB CG t
Dependency ratio 1.43 1.49 -0.53 1.43 1.51 -0.71 -6.80
Age at borrowing 32.94 35.70 -
2.72** 32.94 33.31 -0.39 -3.50
Education 7.35 6.47
2.56** 7.35 7.36 -0.04 -0.40
Time preference score 3.38 3.30 0.99 3.38 3.40 -0.23 -2.10
Achievement motivation score 1.06 1.13 -
2.51** 1.06 1.06 0.02 0.20
Risk preference 2.28 2.05
2.52** 2.28 2.32 -0.42 -4.30
Anglican (%) 0.27 0.26 0.08 0.27 0.28 -0.44 -4.30
Pentecostal (%) 0.15 0.15 -0.24 0.16 0.17 -0.55 -5.40
Muslim (%) 0.20 0.17 0.84 0.20 0.19 0.28 2.80
Marital status (%) 0.70 0.71 -0.21 0.70 0.70 0.14 1.30
Household asset index 2.09 2.09 -0.10 2.09 2.10 -0.13 -1.20
Housing facilities index 0.46 0.35
3.39** 0.46 0.44 0.57 5.60
** p <0.05. Matched sample on common support region only.
Table 5.7 shows the mean at time 0 and time 1 for the seven different food security
parameters. The last two columns show respectively the outcomes of the difference-in-difference
with Kernel matching and Generalised least squares with individual fixed effects models. In both
cases there is strong evidence that microcredit uptake resulted in a robustly significant reduction
in dietary diversity at the household level. Table A5.3 in Appendix 5.1 shows that this can be
traced down to a reduction in the diversity of consumption of animal and sugar intake, and to a
lesser extent of fruits, starchy staples and vegetables. While the result from the cross-sectional
analysis regarding lower proportion of own food production over the total food consumed seems
instead not to be confirmed by the panel analysis, we find that caloric intake is significantly
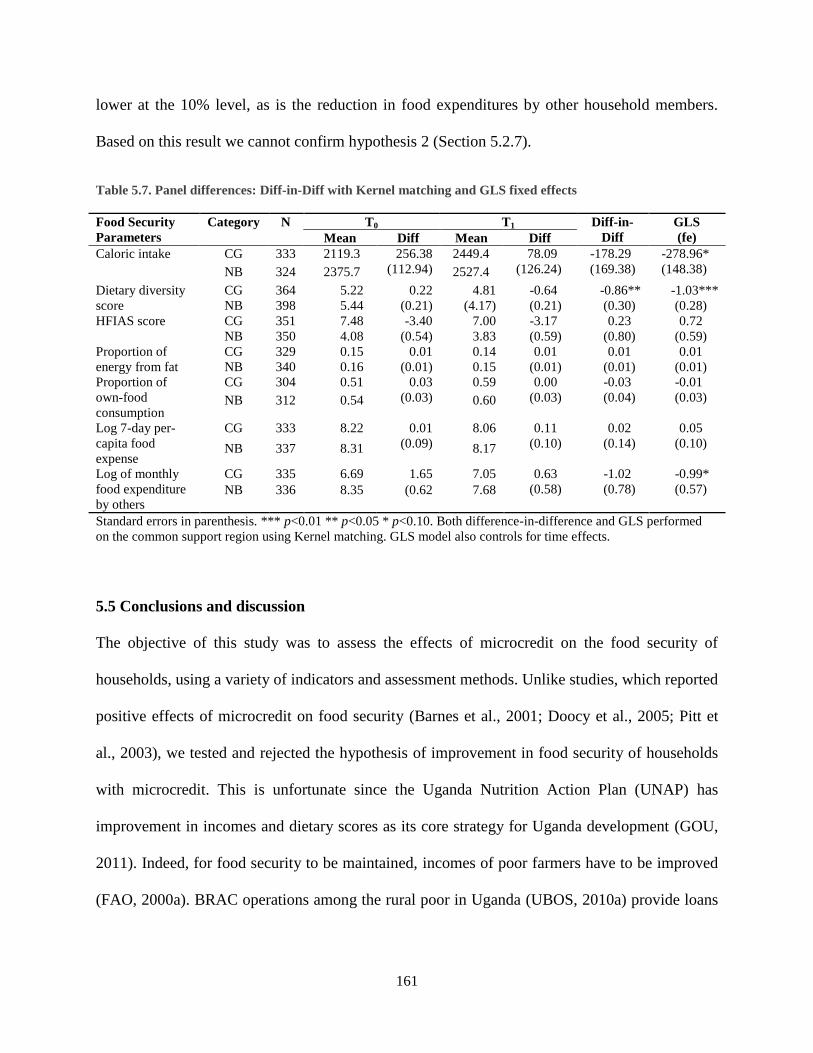
161
lower at the 10% level, as is the reduction in food expenditures by other household members.
Based on this result we cannot confirm hypothesis 2 (Section 5.2.7).
Table 5.7. Panel differences: Diff-in-Diff with Kernel matching and GLS fixed effects
Food Security
Parameters
Category N T0 T1 Diff-in-
Diff
GLS
(fe) Mean Diff Mean Diff
Caloric intake CG 333 2119.3 256.38
(112.94)
2449.4 78.09
(126.24)
-178.29
(169.38)
-278.96*
(148.38) NB 324 2375.7 2527.4
Dietary diversity
score
CG 364 5.22 0.22
(0.21)
4.81 -0.64
(0.21)
-0.86**
(0.30)
-1.03***
(0.28) NB 398 5.44 (4.17)
HFIAS score CG 351 7.48 -3.40
(0.54)
7.00 -3.17
(0.59)
0.23
(0.80)
0.72
NB 350 4.08 3.83 (0.59)
Proportion of
energy from fat
CG 329 0.15 0.01
(0.01)
0.14 0.01
(0.01)
0.01
(0.01)
0.01
(0.01) NB 340 0.16 0.15
Proportion of
own-food
consumption
CG 304 0.51 0.03
(0.03)
0.59 0.00
(0.03)
-0.03
(0.04)
-0.01
(0.03) NB 312 0.54 0.60
Log 7-day per-
capita food
expense
CG 333 8.22 0.01
(0.09)
8.06 0.11
(0.10)
0.02
(0.14)
0.05
(0.10) NB 337 8.31 8.17
Log of monthly
food expenditure
by others
CG 335 6.69 1.65 7.05 0.63
(0.58)
-1.02
(0.78)
-0.99*
(0.57) NB 336 8.35 (0.62 7.68
Standard errors in parenthesis. *** p<0.01 ** p<0.05 * p<0.10. Both difference-in-difference and GLS performed
on the common support region using Kernel matching. GLS model also controls for time effects.
5.5 Conclusions and discussion
The objective of this study was to assess the effects of microcredit on the food security of
households, using a variety of indicators and assessment methods. Unlike studies, which reported
positive effects of microcredit on food security (Barnes et al., 2001; Doocy et al., 2005; Pitt et
al., 2003), we tested and rejected the hypothesis of improvement in food security of households
with microcredit. This is unfortunate since the Uganda Nutrition Action Plan (UNAP) has
improvement in incomes and dietary scores as its core strategy for Uganda development (GOU,
2011). Indeed, for food security to be maintained, incomes of poor farmers have to be improved
(FAO, 2000a). BRAC operations among the rural poor in Uganda (UBOS, 2010a) provide loans
162
to women in the agricultural sector and thus have enormous potential to contribute to household
food security (Meyer, 2013), which do not seem to be realised though.
The negative effect of microcredit on food security may be attributed to a number of factors.
First, female borrowers seem to shift their mode of food acquisition from own food production to
food purchase as evidenced by a lower proportion of energy from own production and
commensurate increment in the weekly expenditures of households on food. However, their food
purchases are not diversified enough, at the detriment of good maternal and child health, and
nutrition (Muhoozi et al., 2016).
Unlike the study by Augsburg et al. (2015), which reported reduction in weekly food
expenditures among borrowers we observe an increment. The increment in expenditure is,
however, not reflected in the purchases of commonly purchased food items in Uganda (sugar,
animal food, oil and seasonal fruits), since the intake frequencies of these items goes down after
taking microcredit (see Table A5.3 in Appendix 5.1). In addition, variety in consumed starchy
food also goes down, pointing to increased expenditure to maintain basic monotonous diets
based on maize, supplemented with beans. The commonest types of crops, reported by women as
income generating crops, were maize and beans (see Chapter 4), both of which are important
staple foods in Uganda (FAO, 2000a). Women often sell off their produce to retailers, shortly
after harvest to meet pressing cash demands. Maize and beans store better than other food crops
and selling them all off leaves households food insecure. They, however, may have to buy the
same type of food to meet household food needs during the lean season. When cash is limited,
women are not able to provide variety in the diet. This may explain the reduction in HDDS. In
the Bolivia study women borrowers also allude to reduction in quantity and quality of foods
given to families, in order to meet the rigors of loan repayment (Augsburg et al., 2015). Some
163
women in our focus groups indicated they would rather not eat, in order to have funds for loan
repayment.
A shift from own production to food purchase for agrarian settings like in our study, requires
a commensurate increase in incomes if household food security is to be maintained. This is
because income is a major determinant of household food security (Kennedy & Peters, 1992).
However, unlike studies showing improvements in ME performance with microcredit
(Copestake et al., 2001; Crépon et al., 2015; Kaboski & Townsend, 2012; McKernan, 2002), we
found no effect of microcredit on monthly business profits (see Chapter 3).
Other factors that may explain the observed negative effect on household food security among
borrowers are loan payment burden, poverty, and low levels of education and food knowledge
among the borrowers, to be considered next.
Burden of loan repayment. The rigors and burden of loan repayment may well be the single
most important cause of the declining food security level among the borrowers’ households. The
rationale behind lending to poor people is that access to credit will lead to improvement in the
performance of poorly performing MEs. Investment of microloans into MEs is expected to yield
funds for loan repayment and for general welfare improvement of households. This is supposed
to be mediated by improvement in profitability of MEs, self-employment income and ultimately
household welfare (Morduch, 1999). For poor borrowers with urgent financial needs it is
sometimes not possible to consider the possibility of failure in profits improvements, at the time
of borrowing. The lack of anticipation for possibility of failure in improvement in the profits
from MEs, has also been observed in several other studies (Banerjee et al., 2015; Crépon et al.,
2015). Lack of improvement in profits of MEs, impedes the mediating roles of improved income
for loan repayment and welfare improvement. The ensuing loan repayment burden may then

164
negatively affect the much anticipated improvement in family welfare, manifested by reduction
in the quality of the diets among borrowers’ households.
The burden of loan repayment faced by women has been discussed by different authors (Brett,
2006; Namayengo et al., 2016). In these studies, women decry strict requirements of loan
repayment that for the benefit of the lender leave no room for repayment default. Pressure from
group members and from credit officers makes borrowers do whatever it takes to obtain funds
for loan repayment. Common sources of funds for loan repayment, mentioned in our focus group
discussions, included (1) Cash from the loan-funded microenterprises, trade and agricultural
related microenterprises; (2) savings or use of funds from husbands, meant for household
supplies; (3) begging from husbands, children and other relatives; (4) sale of any saleable
agricultural produce, even from non-loan funded MEs (Brett, 2006; Namayengo et al., 2016).
Poverty. Poverty has been reported to affect economic decision making and behaviour. Shah
et al. (2012) observed that financial scarcity tends to shift attention allocation from future to
current needs. This has been exemplified with the tendency of the poor to borrow, even at high
interest rates, with minimal regard to loan repayment burden that may ensue.
Farmers in rural areas usually have scanty savings and limited sources of income, leading to
very few food reserves, thus causing food insecurity (FAO, 2000a). Under such circumstances,
current consumption decisions are compromised because the strict and mandatory regime of
BRAC and other MFIs loan repayments leave no room for loan repayment failure (Namayengo
et al, 2016).
Loan use on non-production expenditures. A surprising observation from our study is the
panel-study DID result of reduction in per-capita expenditure on education. This is contrary to
the focus group result of borrowers indicating using part of loan funds for children education

165
expenditures. We also found that about 10% of borrowed funds are used for education
expenditures (Namayengo et al., 2016). Other potential negative effects of borrowing on
education of children have been reported (Augsburg et al., 2015; Wydick, 1999).
Nutrition and food security knowledge. Partly due to lack of food and nutrition knowledge,
women do not seem to prioritise food intake improvement when they borrow. Banerjee and
Duflo (2007) also observed that, even if the poor could spend more on food, they usually do not.
In general, FGD participants commended BRAC as a steady and reliable source of short-term
loans, to meet family needs, which they would otherwise not be able to access (Namayengo et
al., 2016). Studies have observed improvement in household consumption with credit (Morris &
Barnes, 2005; Pitt & Khandker, 1998). The loans provide an instrument for smoothing income
and expenditure flows over time (Carlton et al., 2001). Because money is fungible, within these
households, recipients seem to allocate part of the loans to other household needs and funds from
other household sources into the business. This reduces the amount available for investment. The
diversion of loan funds by poor borrowers from business to competing household needs has been
discussed by Matin et al. (2002), and Rutherford (2011).
On the other hand, women’s increased engagement in income-generating activities may give
rise to nutritional problems if there is no alternative help and when there are no affordable foods
on the market. Indeed, as Adams and Von Pischke (1992) indicated, women need more than
credit to improve their welfare. Eradication of food insecurity will require improvement in
agricultural production, improvement in quality of education and health as well as infrastructure
improvement (FAO, 2000a).
Our results show that households of female agrarian borrowers seem to become more food
insecure after borrowing. The trend is partly explained by an apparent shift to reliance on food
166
purchase by households, which is not accompanied by an increase in income when women
borrow. It is also explained by the burden of loan repayment, poverty, and lack of nutrition
knowledge. This outcome of the microcredit intervention, which has so much potential, suggests
that lenders may do more to ensure attainment of their social goals, especially with respect to
food security.
Our finding is similar to Islam et al. (2016) who postulate that food security of households
may become worse in the period after borrowing. Our result is also in line with Brett (2006),
who observed that clients of microfinance ate less to meet the demands of loan repayment.
However, our result contrasts those of others who showed improvement in food security after
borrowing (Hazarika & Guha-Khasnobis, 2008), including improvement in dietary diversity
(Sraboni et al., 2014), and consumption of foods of animal origin (Colecraft et al., 2006). Still
others have reported no change in food security (Angelucci et al., 2013). Many factors explain
our observation some of which we theorised at the beginning of our study (See Figure 1.1 in
Chapter 1). The reduction in the amount of consumed food from own production partly explains
our result. Respondents depend more on food purchase, which may not provide adequate diets if
there is no commensurate improvement in income from farm and non-farm MEs. In Chapter 4
we provide findings of reduction in agricultural production of households, indicated by a
reduction in the monetary value of the harvest. We also observe a reduction in number of
respondents keeping local chicken, goats and local cattle, as well as the monetary value of these
animals. This may partly explain the reduction in animal-source food-intake scores of the
households. In addition, we find that the contribution of others to household food provision
reduces, after women start to borrow.

167
As a conclusion, microcredit seems to negatively impact on food security of households.
Microcredit interventions may need to address this by adjusting loan conditions to foster food
production. They may also need to incorporate food security and nutrition education of
borrowers, to protect the nutrition of vulnerable groups in households of borrowers.

168
Appendix 5.1
Table A5.1. Differences between OB and NB food security parameters using Radius matching (RM)
and Nearest Neighbour (NN) matching
OB
Mean
NB
Mean
Difference
(ATT)
SE t
Caloric intake RM 2334.39 2367.05 -32.66 69.96 -0.47
NN 2334.00 2280.46 53.91 132.29 -0.41
HDDS1 RM 4.89 5.40 -0.51 0.13 -3.79**
NN 4.89 5.36 -0.47 0.20 -2.25**
HFIAS2 score RM 4.72 4.02 0.70 0.33 2.11**
NN 4.71 4.55 0.45 0.55 0.30
Proportion of energy from fat RM 0.18 0.16 0.02 0.00 -2.82**
NN 0.18 0.15 0.02 0.01 -2.25**
Proportion of own-food
production
RM 0.47 0.53 -0.05 0.02 -2.90**
NN 0.47 0.58 -0.11 0.03 -3.27**
Seven-day fruit intake score RM 0.59 0.70 -0.11 0.03 -3.33**
NN 0.59 0.72 -0.12 0.06 -2.24**
Seven-day sugar intake score RM 0.79 0.87 -0.07 0.03 -2.71**
NN 0.79 0.86 -0.07 0.04 -1.64*
Seven-day oil intake score RM 0.67 0.75 -0.08 0.03 -2.67**
NN 0.67 0.72 -0.06 0.05 -1.09
Seven-day starchy food intake
score
RM 1.37 1.47 -0.10 0.04 -2.29
NN 1.38 1.48 -0.12 0.06 -1.47
Seven-day per-capita expense
on food
RM 8.45 8.34 0.10 0.05 1.97**
NN 8.45 8.33 0.11 0.10 1.11
Monthly expenditure of others
on food
RM 6.90 8.21 -1.31 0.37 -3.52**
NN 6.90 8.23 -1.33 0.26 -2.21**
Figures in parentheses in column 1 are numbers of respondents in the common support region for NB and OB
respectively. ** p <0.05 1Household dietary diversity score;
2 30-Day Household Food Insecurity Access Scale score
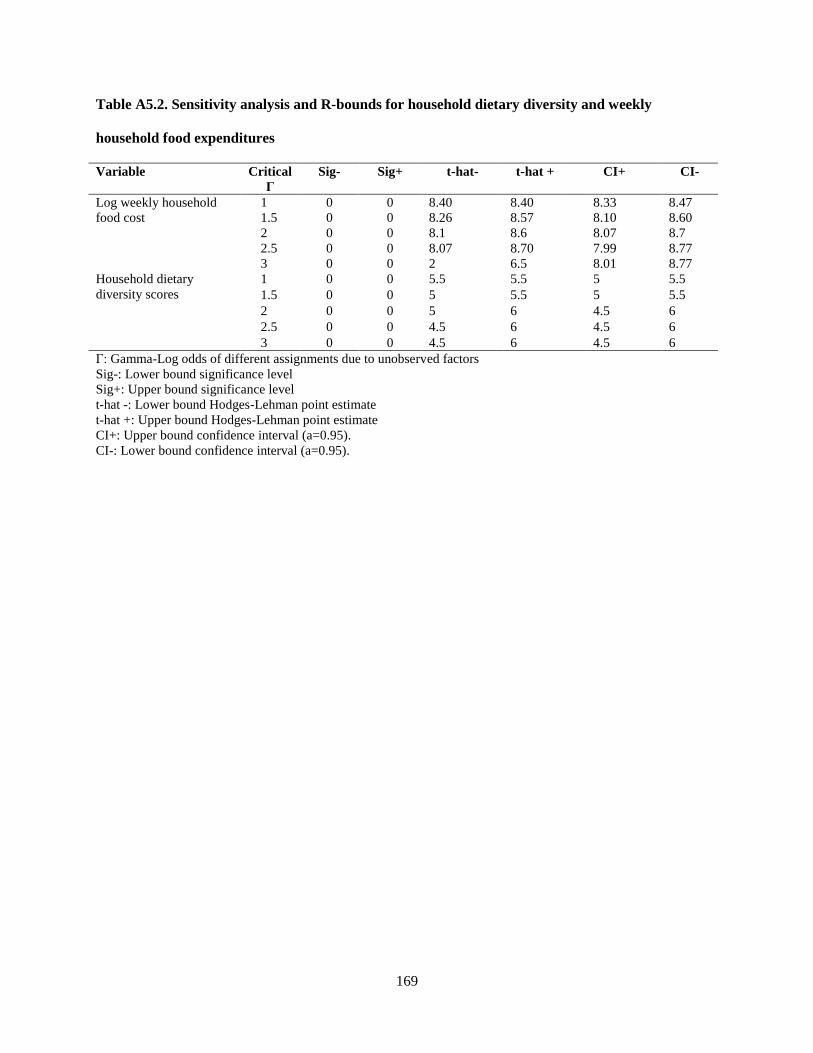
169
Table A5.2. Sensitivity analysis and R-bounds for household dietary diversity and weekly
household food expenditures
Variable Critical
Γ
Sig- Sig+ t-hat-
t-hat +
CI+ CI-
Log weekly household
food cost
1 0 0 8.40 8.40 8.33 8.47
1.5 0 0 8.26 8.57 8.10 8.60
2 0 0 8.1 8.6 8.07 8.7
2.5 0 0 8.07 8.70 7.99 8.77
3 0 0 2 6.5 8.01 8.77
Household dietary
diversity scores
1 0 0 5.5 5.5 5 5.5
1.5 0 0 5 5.5 5 5.5
2 0 0 5 6 4.5 6
2.5 0 0 4.5 6 4.5 6
3 0 0 4.5 6 4.5 6
Γ: Gamma-Log odds of different assignments due to unobserved factors
Sig-: Lower bound significance level
Sig+: Upper bound significance level
t-hat -: Lower bound Hodges-Lehman point estimate
t-hat +: Upper bound Hodges-Lehman point estimate
CI+: Upper bound confidence interval (a=0.95).
CI-: Lower bound confidence interval (a=0.95).

170
Table A5.3. DID for result for disaggregated dietary diversity components for NB and CG groups
N T0 T1 Diff-in- Diff GLS (fe)
Animal-food intake CG 382 0.94 0.82 -0.33**
(0.12)
-0.34***
(0.12) NB 404 1.12 0.67
Fruit intake
CG 380 0.70 0.593 -0.129*
(0.068)
-0.13**
(0.06) NB 402 0.716 0.478
Sugar-intake
CG 380 0.830 0.747 -0.131**
(0.059)
-0.20***
(0.05) NB 402 0.856 0.642
Vegetable-intake
CG 380 0.793 0.693 -0.103
(0.064)
-0.13**
(0.05) NB 402 0.791 0.693
Starchy intake
CG 380 1.438 1.254 -0.134
(0.097)
-.24**
(0.09) NB 402 1.473 1.154
Oil intake score CG 380 0.731 0.641 -0.069
(0.066)
(-0.05)
(0.06) NB 402 0.751 0.592
Standard errors in parenthesis. *** p<0.10 ** p<0.05 * p<0.10. Both difference-in-difference and GLS performed
on the common support region using Kernel matching. GLS model also controls for time effects.

171
Chapter 6
General discussion

172
6.1 Introduction
The contents of this dissertation are based on a quantitative and qualitative survey that was
conducted to assess the contribution of microcredit access of women to production and
household food security status, and the factors associated with enterprise performance and food
security outcomes. In order to do so four main issues were addressed: (a) assessment of the
borrowing context and the match or mismatch between lender and borrower goals and
objectives; (b) the extent to which taking microcredit affected business input expenditures and
performance of non-farm MEs; (c) the extent to which taking microcredit affected production
input expenditures and outputs from farming activities; (d) the changes in household food
security associated with microcredit.
The study utilised two alternative methods to evaluate differences in the dependent variables
for borrowers and non-borrowers. The overall study design was a panel approach, involving two
waves of data collection. In one analytical approach, baseline data for a group of existing
borrowers of the BRAC microfinance program (Old borrowers=OB) and incoming borrowers
(New borrowers=NB) before they received their first loan were used in a quasi-experimental
cross-sectional design to determine the effect of borrowing as the difference between the two
groups using propensity score matching (PSM).
In an alternative approach, two waves of data for the NB and a control group (CG) of women
who never borrowed from BRAC or other MFI, were subjected to difference-in-difference
analysis (DID), with Kernel matching, to assess differences between borrowers and non-
borrowers.
Based on the premise that credit access avails producers with capital to finance inputs, labour
and equipment for productive activities (Zeller & Sharma, 2000), enables them to take up riskier

173
but more profitable ventures (Guiso et al., 2004; Sen, 1999), helps them reach markets more
effectively, leads to adoption of more efficient technologies (Feder et al., 1990; Zeller & Sharma,
2000), and stabilises food consumption of households, MFIs target the rural poor especially
women with microcredit.
The relevance of this study lies in the continuing debate about the impact of microcredit on
poor households, with six recent randomised evaluations of microfinance programs (Banerjee et
al., 2015) indicating that effects of borrowing may not be as large as once acclaimed, and that the
previously reported negative effects of microcredit were not conclusive. Given the influence
borrowers’ context can impart on microfinance programs outcomes (Chliova et al., 2015;
Coleman, 1999; Kabeer, 2005), we contribute to the current debate by conducting our evaluation
in a rural agrarian setting of Uganda. Being a subsistence rural community, we assessed the
effect of borrowing on the largely non-monetised income of women, from crop and animal
production. The women’s produce rarely reaches markets and yet contributes to food security
attainment. Because of the importance of non-farm ME activity in rural communities, we also
assessed ME profits. We also measured the effect of borrowing on monetary worth of MEs and
recurrent business expenditures, which are intermediary business performance indicators that
have not been subjects of much study. In addition we utilised a rich set of food security
indicators and as mentioned before utilised two alternative analytical methods to assess if the
results are robust across methods.

174
6.2 Summary of research findings
6.2.1 The context of borrowing
The benefits of microfinance programs highly depend on their alignment to needs of the target
population. In Chapter 2, we systematically assessed the objectives and design of the BRAC
microfinance program with a view of assessing to what extent they matched the expectations,
context and characteristics of the female borrowers. We observed that BRAC female borrowers
were poor, sometimes ultra-poor in the context described by Hulme et al. (2011).
The main reason for joining the borrowing program was to obtain funds to meet lump-sum
monetary needs they would otherwise not be able to meet. The other reason for borrowing was to
invest in non-farm microenterprises. Women on average obtained loans of $ 278, at the time of
the study. We found that borrowers invested loan funds in subsistence level farming and in small
low monetary worth non-farm MEs, with rather low levels of commercialisation and low returns.
They also invested loans into consumption expenditures including education and house
construction. Borrowers found borrowing costs high; these include the interest rates as well as
the security deposit, which is retained by the lender at the time of loan disbursement and yet used
in the calculation of repayment amounts. The borrowers reported experiencing high loan
repayment pressure, because of weekly repayments, which started the week after borrowing and
even when they invested funds into activities with no immediate returns. Many respondents
diversified their livelihood sources by running both farm and non-farm MEs, in order to secure
funds for loan repayment. Borrowers did whatever they could to obtain funds for loan repayment
including keeping some loan funds for loan repayment, selling whatever is saleable including
crop produce and small animals, as well as diverting household basic upkeep funds for loan
175
repayment. As a result these efforts together with the VO joint liability for loan repayment
requirement by BRAC, defaulting on loan repayment was quite low. Borrowers found the loan
application procedure rigorous, especially for repeat borrowers. This was given as a reason for
stopping to borrow after overcoming the need for which they took the loan. This made the drop-
out rate from the borrowing program quite high.
6.2.2 Microcredit and performance of non-farm MEs
Food access, a main pillar of food security, may be attained via income improvement of
households. The latter is one of the expected outcomes of microcredit participation. Borrowing is
expected to lead to higher involvement of women in non-farm ME activities and extra
investment in non-farm MEs, as well as higher recurrent business expenditures, leading to
improved performance of MEs. In Chapter 3 we assessed the contribution of microcredit access
to performance of non-farm enterprises. Using a panel design, first-time borrowers (NB) were
compared to the control group (CG) based on 2-year data. In an alternative approach the effect of
borrowing was determined in a quasi-experimental comparison of OB and NB groups using
PSM.
Panel data results revealed weakly significant effects of borrowing on the monetary worth of
MEs. On the other hand the quasi-experimental approach revealed that borrowers’ MEs had
higher monetary worth, recurrent business input expenditures, and ME restocking expenditures
than controls. However, we found no effect of borrowing on ME profits. We also found no effect
of selected measures of women empowerment variables, i.e. decision making on loan allocation,
and loan-taking initiative, on the profits from MEs. The general conclusion from this finding is
that borrowing leads to extra investment into non-farm MEs, as evidenced by the increase in ME

176
monetary value and in the recurrent business expenditures. This has a positive connotation to
food security, as improved ME worth is a store of wealth that can be used for food and non-food
consumption smoothing.
6.2.3 Microcredit and agricultural production
It has long been argued that lack of credit is one of the impediments to agricultural development
in rural communities (FAO et al., 2015) and that access to credit will lead to extra investment in
agriculture. In Chapter 4 we evaluated whether borrowing contributed to food production of
households, by assessing changes in expenditure and output from farm MEs (both crop and
animal), using PSM analysis of OB and NB cross-sectional data. In comparison to NBs, OBs
spent more time on garden work, recorded lower recurrent crop production expenditures and
monetary worth of harvested crops. Production of crops which are easily saleable but require
purchased inputs (beans and maize) was also lower for OBs. In the case of animal production,
ownership and monetary worth of some commonly kept animals was lower for OB than NB so
were the numbers of different types of animals kept.
The main conclusion from Chapter 4 was that borrowing did not lead to extra recurrent crop
and animal production expenditures. The prevailing subsistence nature of crop and animal
production seems not to favour investment of borrowed funds into agriculture. Contrary to
expectations, animal production expenditures, numbers of different types of animals kept by
borrowers and monetary worth of some commonly kept animals, and non-cash income from crop
production went down among borrowers. From the results of FGD on loan repayment, it seems
plausible to attribute the lower animal production indicators among OBs to sale of animals for
loan repayment, as discussed in Chapter 2 of this thesis. Food production, a main pillar of food
177
security, was thus unlikely to improve on the account of these subsistence farmers accessing
microcredit.
6.2.4 Microcredit and food security
Lack of access to credit may hamper rural livelihood diversification, exposing poor households
to shocks and seasonality that lead to food deprivation and hunger. Access to microcredit
provides households with capital for productive investment that could lead to improved
household food security. In Chapter 5 we investigated the effects of microcredit on food security,
using different measures of food security, including caloric availability, dietary diversity, and
household food insecurity access scores, among others. We used both panel and quasi-
experimental methods to assess changes in modes of food acquisition, caloric and protein intake,
and qualitative food insecurity measures after borrowing. We found no difference in caloric and
protein intake of households. However, we observed a decline in dietary quality as indicated by
robustly lower household dietary diversity scores (HDDS) among OBs than NBs. The reduction
was traced to reduction in animal-source food, fruits and sugar intake. These being foods which
are commonly purchased, pointed to decreased ability of households to purchase foods generally
considered non-essential and reliance on monotonous low nutrient density starchy-root and tuber
diets. It was also partly explained by a shift from reliance on own food production to food
purchase when women access credit. Another explanation was a reduction in the contribution of
other household members towards food expenditures of the household, when women borrowed.
Generally, our result showed that, contrary to expectations, microcredit may be resulting in
higher food insecurity among borrowers’ households.

178
6.3 General synthesis and conclusion
As a general objective we set out to identify the contribution of microcredit access by women to
production and household food security, and the underlying mechanisms. In affirmation of
Banerjee et al. (2015), our study results also indicate that the effect of borrowing on different
anticipated outcome variables is not as high as expected. We also find that, in the population we
studied, microcredit has some negative effects, as already noted.
We set out to answer different research questions as to whether borrowing led to a positive
contribution to production and household food security, by exploring if there was an
improvement in investment in trade, crop and animal production, and if this translated into
improvement in performance for the respective activities. We also measured different food
security parameters for borrowers and non-borrowers.
While borrowing led to extra investment in non-farm MEs, as evidenced by a high ME loan–
investment ratio, increase in monetary worth of non-farm MEs and increase in recurrent business
expenditures, this was not the case for farm MEs. Borrowing did not lead to increase in recurrent
farm expenditures or to increase in deployment of new technology in farm production. The
increment in monetary worth of non-farm MEs signalled a potentially positive implication of
borrowing on food security of households. Business stock may be a store of wealth, which can be
used in food and non-food consumption smoothing. In addition, increased stocking levels may
eventually lead to higher self-employment income. Sometimes stock may even be consumed
directly.
In addition, borrowing seemed to fulfil other household needs including allocation of received
loans in children’s education. This constitutes a human capital investment, whose returns accrue
later. Other contributions of microcredit included use of loans for investments like building.
179
On the question as to whether borrowing led to increase in farm and non-farm ME income,
the results for farm MEs differed from those for non-farm MEs. Although we found no change in
non-farm ME profits, we found a decline in non-cash income from crop and animal production.
These results did not offer support to the argument of microcredit leading to food security
improvement within the timespan covered by this study.
Finally, we assessed changes in food security indicators after borrowing. Our earlier
observations on investment and output from farm and non-farm MEs seemed to get augmented
by results of higher food insecurity among microcredit recipients. The lack of improvement in
cash income from non-farm MEs and a decline in non-cash income from agricultural production
signalled a negative trend in food security of the borrowers’ households. Although improvement
in the monetary value of non-farm MEs had potential for household consumption smoothing, this
was not observed in the current study. Instead we observed reduction in access to food from
purchase, as indicated by reliance on low dietary diversity diet. Borrowers’ households reduced
the quantity of food consumed from own production, and relied more on food purchase, but
limited the range of foods as reflected in the low household dietary diversity scores (HDDS)
driven by low intake of foods of animal source, fruits and sugar. Low HDDS, an indicator of
food insecurity due to poor access, increases the risk of vulnerable household members including
children and pregnant women suffering from chronic malnutrition (Muhoozi et al., 2016).
Chronic malnutrition affects long-term development of children and nations (World Bank, 2006).
In another study in Uganda (Kikafunda, Agaba, & Bambona, 2014), low dietary diversity scores
were linked to poverty in households. We may not be able to conclude from our study that
poverty among borrower households increased but our results show a decline in dietary diversity,
a food insecurity indicator dependent on food access. Interventions aimed at improvement in

180
incomes of women are associated with improved intake of animal source food (Colecraft et al.,
2006) dietary diversity (Sraboni et al., 2014; Swindale & Bilinsky, 2006b) and DDS has been
shown to reduce rapidly when incomes of households are affected (Ashley, 2016). We may thus
argue that the households of borrowers become more cash constrained after borrowing since the
poor tend to spend most of their income on food.
Next we try to offer explanations for other factors that may have influenced study outcomes.
Studies have shown that the local context the borrowers operated under (Chliova et al., 2015;
Coleman, 1999; Kabeer, 2005), borrower needs (Mahajan & Ramola, 1996) and characteristics,
as well as the characteristics of their MEs (Asian Development Bank, 1997; Gladwin et al., 2001;
Schreiner & Woller, 2003), the loan terms and processes (Armendáriz & Morduch, 2010; Meyer,
2013; Wright et al., 1998) influence the effect of borrowing on the food security of households.
We found that borrowers worked well within their VOs to ensure loan repayment. Similar
results have been reported elsewhere (Ghatak, 1999; Ghatak & Guinnane, 1999). However, the
anticipated benefits of the gained social capital and networking from the village organisations
(McKernan, 2002; Pitt et al., 1999), including adoption of agricultural technologies (van Rijn,
Bulte, & Adekunle, 2012), better ME financial outcomes and social marketing for improved
nutrition, were not evident in this study. Women would possibly reap more benefits from the
groups formed to satisfy the group lending model by collectively engaging in business activities
such communal farming and agro-processing or even joint trading. These may lead to better
business outcomes than the individual poorly resourced microenterprises.
Our findings augment outcomes of some studies (Goetz & Gupta, 1996; Mayoux, 2001;
Rahman, 1999b) throwing doubt on the beneficial effects of group lending to women
empowerment. These studies reported over-indebtedness and borrower stress related to ME

181
running and loan repayment. We also observed similar trends in the current study. In addition,
unlike what others have reported about positive effects of borrowing on women empowerment
(Armendáriz & Morduch, 2010; Fofana et al., 2015), we observed low scores of women on the
empowerment variables, i.e. loan taking initiative and decision making power.
The characteristics of the borrowers and the activities they engaged in also seemed to
influence the food security outcomes of borrowing. The majority of the women were low-
educated poor peasants as defined by Ellis (1993). This is evidenced by the type of activities they
engaged in and based on their scores on the wealth and asset index. They set up self-employment
activities, probably not because they are entrepreneurial but rather due to lack of alternatives.
The enterprises set up by such a population tend to be poorly resourced, with poor human capital
and operate in fragile business environments. These factors limit the productivity of the
enterprises and hence their contribution to food security. The potential contribution of
microcredit towards enhancing productivity of borrowers MEs seem to be limited by the loan
conditions and the tendency of borrowers to divert part of the loans to consumption needs.
According to FAO (1998) and Banerjee (2013), risk aversion because of their impoverished
state may explain the observed reliance of borrowers on low-risk, low-investment, low-return
activities, rather than on riskier but potentially more productive activities. The risky nature of
agricultural production (Morvant-Roux, 2011) may also have impeded extra investment in
agriculture by borrowers with farm MEs. The respondents with farming MEs also remained more
inclined towards less lucrative food crop production, probably as dictated by their culture (Ali et
al., 2015.), and because these are rarely productive, they shift focus to non-farm MEs. Much as
the non-farm MEs showed potential for improvement in household consumption smoothing, the
182
reduction in non-cash income from farm MEs may have led to reduction of household food
availability and access among borrowers.
The local conditions of borrowing may also explain some of our observations. The lack of the
necessary infrastructure and socio-economic environment for their activities hindered borrowers
to benefit from borrowing (Diagne & Zeller, 2001). Local prices of commodities, as well as
competition with other retailers because of homogeneous products as observed by Copestake et
al. (2001) in Zambia, may offer little opportunity for ME expansion. This is typical of Uganda,
which has been characterised as one of the poorest countries in the world by the World Bank
(2016). Poor financial and commodity markets, low purchasing power and poor infrastructure
have been named as some of the growth limitations of micro and small enterprises in Uganda
(Ishengoma & Kappel, 2008). Poor markets may also have impeded extra investment and output
from borrower-run MEs. As argued by Morvant-Roux (2011), there is need for all key players in
the agriculture and informal business industry, buyers, processors, suppliers, local governments
and other key players, who all face the risks described above, to come together to address risks
associated with rural farm and non-farm productivity.
6.4 Policy implications of study
Microfinance has much potential for improving food security of households of borrowers. For
this objective to be achieved the lenders need to balance both the financial and social goals of
lending.
From a policy perspective, our results generally bring out the need to revisit elements of the
loan program if significant livelihood improvement among beneficiaries is to be attained. Firstly,
since farming is a major source of livelihood and food, there seems to be a missed opportunity
183
for microcredit to contribute to income, food production and food security. The time between
loan disbursement, and loan repayment commencement, as well the borrowing costs need to be
revisited, if microcredit is to contribute to income and food security via improved agricultural
production. In addition, alternative interventions for agricultural production improvement,
including direct provision of agricultural inputs, may be explored. Since women seem to borrow
against meagre future earnings, the borrowing program should strengthen the savings
components, both before and after borrowing, to enable women to benefit more from the
borrowing programs. In addition, MFIs need to design products that minimise loan repayment
pressure and drop-outs from the borrowing program. High drop-outs are a disadvantage to both
borrowers and the MFIs.
Secondly, lending should be accompanied by interventions to increase financial and non-
financial literacy of women for better decision making on income and expenditures, in line with
household capital and consumption needs. Also, liaison is needed between government and MFIs
to promote borrower education and protection. Much as MFIs operate in a liberalised financial
economy the government needs to have systems of monitoring MFI operations and procedures to
protect poor borrowers
Thirdly, since credit alone is insufficient to improve the income and non-income activities of
women, the government needs to create an enabling environment for MEs to flourish. This will
include rural infrastructure development to link rural farmers to produce and input markets.
Programs for seed distribution and ease in access to agriculture inputs, as well as information
dissemination on advantages of shifting from peasant to semi-commercial farming should be
promoted.

184
Finally the government and civil society both may need to work with MFIs for optimal
lending rates and protocol not only for protection of the poor borrowers but to also enhance the
social outcomes of borrowing, food security being one of them.
6.5 Limitations of the study and suggestions for future research
The findings presented in this dissertation contribute in many ways to the current debate on the
effect of microcredit on household food security, through exploration of the effect of borrowing
on household farm and non-farm productive activities. We did this by use of a quasi-
experimental methodology that we combined with a panel study design. We used both
quantitative and qualitative methods of data collection to obtain answers to our study questions.
However, like many studies that attempt to measure the effect of interventions there may be
many potential methodological limitations that could have influenced our results. We tried to
overcome many of these by the use of different methods described below.
First and foremost, quasi-experimental designs and other non-experimental impact assessment
methods face the possibility of selection bias into programs that may lead to differences between
those who borrow and those who do not borrow, to the extent that comparison groups are
different even at the beginning of the interventions (Armendáriz & Morduch, 2010; Khandker et
al., 2010). We addressed such bias designing the quasi-experimental comparison of old
borrowers (OB) to in-coming new borrowers (NB) who had already self-selected to take credit.
This comparison may have less self-selection issues as argued by Nelson et al. (2004). In
addition, recognising that drop-outs in the cross-sectional study could have influenced results as
argued by Karlan, (2001), we followed drop-outs from VOs of the OB group and included them
in our analysis. This procedure and the use of a comparison group that had already self-selected
185
to borrow are expected to have significantly reduced selection bias. Before matching, the two
groups were similar on all control variables, except for age. The PSM methodology was then
useful to make the groups even more comparable before assessment of effect size. One limitation
of the PSM methodology is matching only based on characteristics that we measured. In the
event that there are attributes we did not measure that would influence self-selection, this would
bias our results. To check the effect of unobserved variables on our result, we conducted
sensitivity analysis using Rosenbaum bounds as described by Rosenbaum (2010) and found that
the effect of unobservables would have to be of very high magnitude to influence our result.
However, there could still be limitations related to the methodology, for example, differences
could arise because of differences among the VOs in the study.
Secondly, for the panel analysis we ensured high level of rigour by incorporating Kernel
matching with DID analysis, as recommended by Khandker et al. (2010). Otherwise the DID
analysis already took care of time invariant unobservables, which were differenced out in the
DID analysis.
However, our result could have been limited by the relatively short time between the baseline
and follow-up study. We only allowed one year between baseline and follow-up studies. This
was to ensure traceability of study respondents, as some were not permanent residents in the area
and could move away from the baseline locations, and also drop outs from the BRAC borrowing
program. One year may not have been enough time to detect effects that take time, including
changes in ME income, and education attainments, among others. We still had a number of drop-
outs especially from the NB group; some did not eventually take up the loans and some dropped
out after one round of borrowing. We tried to overcome this by matching the NB and CG groups

186
based on baseline characteristics. Further research may need to be done, with a longer time
between baseline and follow-up study, to gain further insights into the issues.
Another limitation of the study could be measurement errors in non-farm ME profits based on
self-reported amounts because of lack of records. The method we used was straightforward but
could still have left some errors in the result. Further research could be conducted, with daily
visits to respondents to keep track of business expenses and income.
Another limitation was in the estimations of amounts of food consumed that relied on recall
and estimates by respondents. Finally many factors other than food production and income may
influence food availability and access of households.
6.6 Areas for further research
In light of our observations, further research is needed to determine optimal lending rates,
payment terms and even loan amounts that will reduce loan repayment burden and drop-out
rates, and also enable MFIs to operate sustainably and yet attain desired social benefits for their
recipients. Further research is needed to assess if loans for non-farm MEs indeed have better
food security effects than for farm MEs. In addition, longer studies need to be conducted on the
effect of borrowing on farm and non-farm MEs, as well as food security. It may also be good to
follow up borrowers for longer periods to determine at which point effects of borrowing may be
realised.
6.7 Overall study conclusion
Borrowing hardly improved the food security situation of the borrowers´ households. Borrowers
tended to shift attention from farm to non-farm activities and yet proceeds from non-farm
187
activities were not adequate to ensure improved food access. This led to reliance on poorer and
maybe cheaper diets, making households more food insecure. However, microcredit may have
served to fulfil many other household needs like consumption smoothing as MEs with higher
monetary worth could be used by households to meet consumption needs. In addition significant
proportions of loans were invested in human capital improvement, usually children education.
The most important determinants of the effect of microcredit as we envisaged at the beginning of
the study were the context of borrowing, the loan terms and processes as well as the personality
and socio-demographic characteristics of the women. Many contextual factors need to change
before microcredit will have the desired effect.

188
References
Abate, G.T., Rashid, S., Borzaga, C., & Getnet, K. (2016). Rural finance and agricultural
technology adoption in Ethiopia: Does the institutional design of lending organizations
matter? World Development, 84, 235-253.
Adams, D.W., & Von Pischke, J. (1992). Microenterprise credit programs: Deja vu. World
Development, 20(10), 1463-1470.
Agarwal, B. (1997). ''Bargaining'' and gender relations: Within and beyond the household.
Feminist economics, 3(1), 1-51.
Agier, I., & Szafarz, A. (2013). Microfinance and gender: is there a glass ceiling on loan size?
World Development, 42, 165-181.
Ahmed, S.M., Chowdhury, M., & Bhuiya, A. (2001). Micro-credit and emotional well-being:
experience of poor rural women from Matlab, Bangladesh. World Development, 29(11),
1957-1966.
Ali, D.A., Bowen, F.H., Deininger, K.W., & Duponchel, M.F. (2015). Investigating the gender
gap in agricultural productivity: evidence from Uganda. World Bank Group. Retrieved 2-
12-2016, from http://documents.worldbank.org/curated/en/
AMFIU. (2011). The Uganda microfinance directory 2011/12 (5th Edition). Retrieved 18-03-
2016, from http://www.amfiu.org.ug/
Angelucci, M., Karlan, D., & Zinman, J. (2013). Win some lose some? Evidence from a
randomized microcredit program placement experiment by Compartamos Banco. IZA
Discussion Paper, No. 7439.
Arimond, M., & Ruel, M.T. (2004). Dietary diversity is associated with child nutritional status:
evidence from 11 demographic and health surveys. The Journal of Nutrition, 134(10),
2579-2585.
Armendáriz, B., & Labie, M. (2011). Handbook of microfinance. New Jersey: World Scientific.
Armendáriz, B., & Morduch, J. (2010). The economics of microfinance. Cambridge, MA: MIT
Press.
Ashley, J.M. (2016). Food security in the developing world. Amsterdam: Academic Press.
Asian Development Bank. (1997). Microenterprise development. Not by credit alone. Retrieved
25-6-2014, from http://bdresearch.org.bd/
Attanasio, O., Augsburg, B., De Haas, R., Fitzsimons, E., & Harmgart, H. (2015). The impacts of
microfinance: Evidence from joint-liability lending in Mongolia. American Economic
Journal: Applied Economics, 7(1), 90-122.
Augsburg, B., De Haas, R., Harmgart, H., & Meghir, C. (2015). The Impacts of microcredit:
Evidence from Bosnia and Herzegovina. American Economic Journal: Applied
Economics, 7(1), 183-203.
Balatibat, E.M. (2004). The linkages between food and nutrition security in lowland and coastal
villages in the Philippines. Retrieved 9-3-2016, from http://edepot.wur.nl/
Banerjee, A., Duflo, E., Glennerster, R., & Kinnan, C. (2015). The miracle of microfinance?
Evidence from a Randomized Evaluation. American Economic Journal: Applied
Economics, 7(1), 22-53.
Banerjee, A., Karlan, D., & Zinman, J. (2015). Six randomized evaluations of microcredit:
Introduction and Further Steps. American Economic Journal: Applied Economics, 7(1),
1-21.
Banerjee, A.V. (2013). Microcredit under the microscope: what have we learned in the past two
decades, and what do we need to know? Annual Review of Economics, 5(1), 487-519.
189
Banerjee, A.V., & Duflo, E. (2007). The economic lives of the poor. The Journal of Economic
Perspectives, 21(1), 141.
Barman, D., Mathur, H.P., & Kalra, V. (2009). Role of microfinance interventions in financial
inclusion: A comparative study of microfinance models. Vision: The Journal of Business
Perspective, 13(3), 51-59.
Barnes, C., Keogh, E., & Nemarundwe, N. (2001). Microfinance program clients and impact: An
assessment of Zambuko Trust, Zimbabwe. Washington, DC: USAID.
Barnes, C., Morris, G., & Gaile, G. (1999). An assessment of client of microfinance programs in
Uganda. International Journal of Economic Development, 1(1), 80-121.
Barnes, C., & Sebstad, J. (2000). Guidelines for microfinance impact assessments. Washington,
DC: Assessing the Impact of Microenterprise Services, Management Systems
International. Retrieved 3-6-2015, from http://scholar.google.nl.ezproxy.library.wur.nl/
Barrett, C.B. (2010). Measuring food insecurity. Science, 327(5967), 825-828.
Barrett, C.B., Reardon, T., & Webb, P. (2001). Nonfarm income diversification and household
livelihood strategies in rural Africa: concepts, dynamics, and policy implications. Food
Policy, 26(4), 315-331.
Basargekar, P. (2008). Economic empowerment through microfinance: An assessment of CSR
activity run by Forbes Marshall Ltd. International Journal of Business Insights &
Transformation, 2(1).
Bategeka, L., & Okummu, L.J. (2010). Banking sector liberalisation in Uganda. Process, results
and policy options. Amsterdam: SOMO.
Bates, T. (1990). Entrepreneur human capital inputs and small business longevity. The Review of
Economics and Statistics, 72(4), 551-559.
Bauer, M., Chytilová, J., & Morduch, J. (2012). Behavioral foundations of microcredit:
Experimental and survey evidence from rural India. The American Economic Review,
102(2), 1118-1139.
Begley, T.M., & Boyd, D.T. (1987). Psychological characteristics associated with performance
in entrepreneurial firms and small business. Journal of Business Venturing, 2(1), 79.
Berger, M. (1989). Giving women credit: The strengths and limitations of credit as a tool for
alleviating poverty. World Development, 17(7), 1017-1032.
Bigsten, A., & Kayizzi-Mugerwa, S. (1995). Rural sector responses to economic crisis in
Uganda. Journal of international Development, 7(2), 181-209.
Blais, A.R., & Weber, E.U. (2006). A domain-specific risk-taking (DOSPERT) scale for adult
populations. Judgment and Decision Making, 1(1), 33-47.
Blumberg, R.L. (1989). Making the case for the gender variable: Women and the wealth and
well-being of nations (M.H.Clark Ed. Vol. 1). Washington: U.S. Agency for International
Development.
Bornstein, D. (1997). The price of a dream: The story of the Grameen Bank. Chicago: University
of Chicago Press.
Bouis, H.E., & Novenario-Reese, M.J.G. (1997). The determinants of demand for
micronutrients. Washington: International Food Policy Research Institute (IFPRI).
BRAC. (2008). Annual report. Empowering women and girls in Uganda. Kampala.
BRAC. (2013). Annual report 2013. Kampala.
Brett, J.A. (2006). “We sacrifice and eat less”: the structural complexities of microfinance
participation. Human Organization, 65(1), 8-19.

190
Buckley, G. (1997). Microfinance in Africa: Is it either the problem or the solution? World
Development, 25(7), 1081-1093.
Burchi, F., & De Muro, P. (2016). From food availability to nutritional capabilities: Advancing
food security analysis. Food Policy, 60, 10-19.
Buvinić, M. (1997). Women in poverty: A new global underclass. Foreign Policy(108), 38-53.
Carletto, C., Zezza, A., & Banerjee, R. (2013). Towards better measurement of household food
security: Harmonizing indicators and the role of household surveys. Global Food
Security, 2(1), 30-40.
Carloni, A.S., & Goddard, P.O. (1987). Women in development: A.I.D.'s experience, 1973 -
1985. Washington: A.I.D.
Carlton, A., Mandorf, H., Obara, A., Reichter, W., & Ryne, E. (2001). Microfinance in Uganda.
Vienna: Austrian Ministry of Foreign Affairs.
Chan, S.H., & Ghani, M. A. (2011). The impact of microloans in vulnerable remote areas:
evidence from Malaysia. Asia Pacific Business Review, 17(1), 45-66.
Chemin, M. (2008). The benefits and costs of microfinance: Evidence from Bangladesh. The
Journal of Development Studies, 44(4), 463-484.
Chemin, M. (2012). Response to 'high noon for microfinance impact evaluations'. Journal of
Development Studies, 48(12), 1881-1885.
Cheston, S., & Kuhn, L. (2002). Empowering women through microfinance. Retrieved 4/7/2013,
from http://storage.globalcitizen.net/
Chliova, M., Brinckmann, J., & Rosenbusch, N. (2015). Is microcredit a blessing for the poor? A
meta-analysis examining development outcomes and contextual considerations. Journal
of Business Venturing, 30(3), 467-487.
Chua, E.Y., Zalilah, M. S., Chin, Y.S., & Norhasmah, S. (2012). Dietary diversity is associated
with nutritional status of Orang Asli children in Krau Wildlife Reserve, Pahang.
Malaysian Journal of Nutrition, 18(1), 1-13.
Coates, J., Frongillo, E.A., Rogers, B.L., Webb, P., Wilde, P.E., & Houser, R. (2006).
Commonalities in the experience of household food insecurity across cultures: what are
measures missing? The Journal of Nutrition, 136(5), 1438S-1448S.
Coates, J., Swindale, A., & Bilinsky, P. (2007). Household food insecurity access scale (HFIAS)
for measurement of food access: indicator guide. Washington, DC: Food and Nutrition
Technical Assistance Project, Academy for Educational Development.
Coates, J., Webb, P., & Houser, R. (2003). Measuring food insecurity: going beyond indicators
of income and anthropometry: Food and Nutrition Technical Assistance Project,
Academy for Educational Development.
Cohen, M., & Snodgrass, D. (1997). Assessing the effects of program characteristics and
program context on the impact of microenterprise services: A guide for practitioners.
Washington.
Colecraft, E., Marquis, G.S., Aryeetey, R., Sakyi-Dawson, O., Lartey, A., Ahunu, B., &
Canacoo, E. (2006). Constraints on the use of animal source foods for young children in
Ghana: A participatory rapid appraisal approach. Ecology of Food and Nutrition, 45(5),
351-377.
Coleman, B.E. (1999). The Impact of group lending in Northeast Thailand. Journal of
Development Economics, 60, 105-141.
Copestake, J. (2007). Mainstreaming microfinance: social performance management or mission
drift? World Development, 35(10), 1721-1738.

191
Copestake, J., Bhalotra, S., & Johnson, S. (2001). Assessing the impact of microcredit: A
Zambian case study. Journal of Development Studies, 37(4), 81-100.
Crépon, B., Devoto, F., Duflo, E., & Pariente, W. (2015). Estimating the impact of microcredit
on those who take it up: Evidence from a randomized experiment in Morocco. American
Economic Journal: Applied Economics, 7(1), 123-150.
Crook, T.R., Todd, S.Y., Combs, J. G., Woehr, D. J., & Ketchen, D. (2011). Does human capital
matter? A meta-analysis of the relationship between human capital and firm performance.
Journal of Applied Psychology, 96(3), 443-456.
Daniels, L. (2001). Testing alternative measures of microenterprise profits and net worth.
Journal of International Development, 13(5), 599-614.
De Mel, S., McKenzie, D., & Woodruff, C. (2009). Are women more credit constrained?
Experimental evidence on gender and microenterprise returns. American Economic
Journal: Applied Economics, 1-32.
De Mel, S., McKenzie, D., & Woodruff, C. (2009). Measuring microenterprise profits: Must we
ask how the sausage is made? Journal of Development Economics, 88(1), 19-31.
Deininger, K. (2003). Does cost of schooling affect enrollment by the poor? Universal primary
education in Uganda. Economics of Education Review, 22(3), 291-305.
den Hartog, A.P., van Staveren, W.A., & Brouwer, I.D. (2006). Food habits and consumption in
developing countries. Manual for field studies. Wageningen: Wageningen Publishers.
Develtere, P., & Huybrechts, A. (2002). Evidence on the social and economic impact of
Grameen Bank and BRAC on the poor in Bangladesh. Retrieved 7-01-2017, from
http://www.microfinancegateway.org/
Diagne, A., & Zeller, M. (2001). Access to credit and its impact on welfare in Malawi (Vol.
116). Washington: IFPRI.
DiPrete, T.A., & Gangl, M. (2004). Assessing bias in the estimation of causal effects:
Rosenbaum bounds on matching estimators and instrumental variables estimation with
imperfect instruments. Sociological methodology, 34(1), 271-310.
Doocy, S., Teferra, S., Norell, D., & Burnham, G. (2005). Credit program outcomes: coping
capacity and nutritional status in the food insecure context of Ethiopia. Social Science &
Medicine, 60(10), 2371-2382.
Dowla, A.U. (2011). Higher education through microfinance: The case of Grameen Bank. In B.
Armendariz & M. Labie (Eds.), The handbook of microfinance (pp. 643-659). World
Scientific.
Duflo, E., Glennerster, R., Kremer, M., Schultz, T.P., & John, A.S. (2007). Using randomization
in development economics research: A toolkit. In: Schultz, T. and Strauss, J. (Eds.),
Handbook of Development Economics (Vol. 4, pp. 3895-3962). Amsterdam: Elsevier.
Economist (2010). Face value: BRAC in Business. Retrieved 14-05-2016, from
http://www.economist.com.
Ehlers, T.B., & Main, K. (1998). Women and the false promise of microenterprise. Gender &
Society, 12(4), 424-440.
Eijkel, R.V., Hermes, N., & Lensink, B.W. (2011). Group lending and the role of the group
leader. Small Business Economics, 36(3), 299-321.
Ellis, F. (1993). Peasant economics: Farm households and agrarian development. Cambridge:
Cambridge University Press.
Ellis, F. (1998). Household strategies and rural livelihood diversification. The Journal of
Development Studies, 35(1), 1-38.

192
Esenu, B., Ossiya, S., Serunkuma, D., Oluka, J., Alin, D., Owesigire, B., Olokojo, B. (2005).
Positioning agro-pastoral women in livestock production: the link between socio-
economic factors and improved household food security. Tropicultura, 23(I), 28.
Fafchamps, M. (2003). Rural poverty, risk and development. Cheltenham: Edward Elgar
Publishing.
Fafchamps, M., McKenzie, D., Quinn, S. R., & Woodruff, C. (2011). When is capital enough to
get female microenterprises growing? Evidence from a randomized experiment in Ghana.
Working paper 17207. Retrieved 25-10-2016, from http://www.nber.org/.
FANTA-2 (2010). The analysis of the nutrition situation in Uganda. Retrieved 17-12-2016, from
http://www.fantaproject.org/.
FAO (1996). Rome declaration on world security and world food plan of action. World Food
Summit 13-17th Nov. 1996. Retrieved from http://www.fao.org/docrep/003/.
FAO (1998). The state of food and agriculture: Rural non-farm income in developing countries.
Retrieved from http://www.fao.org/.
FAO (2000a). The elimination of food insecurity in the Horn of Africa - FINAL REPORT. Rome:
FAO. Retrieved from http://www.fao.org/.
FAO (2000b). The state of food insecurity in the world 2001. Retrieved from
http://www.fao.org/.
FAO (2011). The state of agriculture and food (2010-2011). Closing the gender gap for
development. Retrieved 20-10-2016, from http://www.fao.org/.
FAO (2016). The state of food and agriculture. Climate change, agriculture and food security.
Rome: FAO. Retrieved from http://reliefweb.
FAO, IFAD, & WFP (2015). The state of food insecurity in the world 2015. Meeting the 2015
international hunger targets: taking stock of uneven progress. Rome: FAO. Retrieved
from http://www.fao.org/.
FAO, WFP, & IFAD (2012). The state of food insecurity in the world 2012. Economic growth is
necessary but not sufficient to accelerate reduction of hunger and malnutrition. Rome:
FAO. Retrieved from http://www.fao.org/. Accessed 5-3-2015.
Feder, G., Lau, L.J., Lin, J.Y., & Luo, X. (1990). The relationship between credit and
productivity in Chinese agriculture: A microeconomic model of disequilibrium. American
Journal of Agricultural Economics, 72(5), 1151-1157.
Feroze, S., Chauhan, A., & Chakravarty, A. (2011). Microfinance and income from dairy in
Haryana: An impact analysis. Indian Journal of Animal Sciences, 81(9), 971-976.
Field, E., Pande, R., Papp, J., & Park, Y. J. (2012). Repayment flexibility can reduce financial
stress: a randomized control trial with microfinance clients in India. Plos One, 7(9),
e45679.
Fletschner, D. (2009). Rural women’s access to credit: Market imperfections and intrahousehold
dynamics. World Development, 37(3), 618-631.
Fletschner, D., Anderson, C.L., & Cullen, A. (2010). Are women as likely to take risks and
compete? Behavioural findings from Central Vietnam. The Journal of Development
Studies, 46(8), 1459-1479.
Fletschner, D., & Kenney, L. (2014). Rural women’s access to financial services: Credit savings
and insurance. In: A. R. Quisumbing, R. Meinzen-Dick, T. L. Raney, A. Croppenstedt, J.
A. Behrman, & A. Peterman (Eds.), Gender in Agriculture (pp. 187-208): Springer
Netherlands. Retrieved from http://dx.doi.org/10.1007/978-94-017-8616-4_8.
193
Fofana, N.B., Antonides, G., Niehof, A., & van Ophem, J.A.C. (2015). How microfinance
empowers women in Côte d’Ivoire. Review of Economics of the Household, 1-19.
Foltz, J.D. (2004). Credit market access and profitability in Tunisian agriculture. Agricultural
Economics, 30(3), 229-240.
Frederick, S., Loewenstein, G., & O'donoghue, T. (2002). Time discounting and time preference:
A critical review. Journal of Economic Literature, 351-401.
Frongillo, E., Nanama, S., & Wolfe, W. (2004). Technical guide to developing a direct,
experience-based measurement tool for household food insecurity. Food and Nutrition
Technical Assistance Project, Academy for Educational Development. Washington, DC.
Retrieved 19-2-2016, from https://www.google.com/
Gaile, G.L., & Foster, J. (1996). Review of methodological approaches to the study of the impact
of the microenterprise credit programs. AIMS Publication. Retrieved 29-4-2015, from
http://erepository.uonbi.ac.ke
Ganle, J.K., Afriyie, K., & Segbefia, A.Y. (2015). Microcredit: Empowerment and
disempowerment of rural women in Ghana. World Development, 66, 335-345.
Ghatak, M. (1999). Group lending, local information and peer selection. Journal of Development
Economics, 60(1), 27-50.
Ghatak, M., & Guinnane, T.W. (1999). The economics of lending with joint liability: theory and
practice. Journal of Development Economics, 60(1), 195-228.
Ghosh, J. (2013). Microfinance and the challenge of financial inclusion for development.
Cambridge Journal of Economics, 37(6), 1203-1219.
Gifford, J. (Ed.). (2004). Utilizing, accumulating, and protecting livelihood assets: The role of
urban informal financial services in Kampala, Uganda. Delft: Eburon Academic
Publishers.
Gladwin, C.H., Thomson, A.M., Peterson, J.S., & Anderson, A.S. (2001). Addressing food
security in Africa via multiple livelihood strategies of women farmers. Food Policy,
26(2), 177-207.
Glennerster, R., & Takavarasha, K. (2013). Running randomized evaluations: A practical guide.
Princeton: Princeton University Press.
Gobezie, G. (2004). Microfinance and development: Can impact on poverty and food in-security
be improved upon? International Conference on Microfinance Development in Ethiopia.
Retrieved 28-11-2016, from http://www.microfinancegateway.org/
Goetz, A.M., & Gupta, R.S. (1996). Who takes the credit? Gender, power, and control over loan
use in rural credit programs in Bangladesh. World Development, 24(1), 45-63.
GOU (2011). Uganda nutrition action plan of 2011-2016. Scaling up multisectoral efforts to
establish a strong nutrition foundation in Uganda development. Kampala: GOU.
Retrieved from http://www.fantaproject.org/
GOU (2016). Agriculture sector strategic direction 2015/16-2019/20. Kampala: MAAIF.
Grimpe, B. (2002). Rural microfinance clients in Uganda: FINCA client analysis. FSD series
No.6. Financial System Development Project 2002. Retrieved 31-3-2015, from
http://www.microfinancegateway.org/
Grown, C.A., & Sebstad, J. (1989). Introduction: Toward a wider perspective on women's
employment. World Development, 17(7), 937-952.
Guiso, L., Sapienza, P., & Zingales, L. (2004). Does local financial development matter? The
Quarterly Journal of Economics, 119(3), 929-969.

194
Haggblade, S., Hazell, P.B., & Reardon, T.A. (2002). Strategies for stimulating poverty-
alleviating growth in the rural nonfarm economy in developing countries. Retrieved 13-
11-2016, from http://xxpt.ynjgy.com/.
Haile, H.B., Bock, B., & Folmer, H. (2012). Microfinance and female empowerment: Do
institutions matter? Womens Studies International Forum, 35(4), 256-265.
Hamad, R., & Fernald, L.C.H. (2015). Microcredit participation and women's health: Results
from a cross-sectional study in Peru. International Journal for Equity in Health, 14.
Hashemi, S.M., Schuler, S.R., & Riley, A.P. (1996). Rural credit programs and women's
empowerment in Bangladesh. World Development, 24(4), 635-653.
Hazarika, G., & Guha-Khasnobis, B. (2008). Household access to microcredit and children's
food security in rural Malawi: A gender perspective. Retrieved 18-4-2016, from
http://repec.iza.org/.
Hermes, N., & Lensink, R. (2011). Microfinance: Its impact, outreach, and sustainability. World
Development, 39(6), 875-881.
Hoddinott, J., & Yohannes, Y. (2002). Dietary diversity as a food security indicator. Retrieved
22-4-2016, from http://scholar.google.nl.ezproxy.library.wur.nl/.
Hudon, M. (2011). Ethics in microfinance. In: B. Armendáriz de Aghion & M. Labie (Eds.), The
handbook of microfinance (pp. 123-138). London-Singapore: Scientific Work.
Hulme, D. (1990). Can the Grameen Bank be replicated? Recent experiments in Malaysia,
Malawi and Sri Lanka. Development Policy Review, 8(3), 287-300.
Hulme, D. (2000a). Impact assessment methodologies for microfinance: Theory, experience and
better practice. World Development, 28(1), 79-98.
Hulme, D. (2000b). Is microdebt good for poor people? A note on the dark side of microfinance.
Small Enterprise Development, 11(1), 26-28.
Hulme, D., Moore, K., & Seraj, K.F.B. (2011). Reaching the people whom microfinance cannot
reach: Learning from BRAC’s “Targeting the ultra poor” programme. In: B. Armendáriz
& M. Labie (Eds.), The handbook of microfinance (pp. 563-586): World Scientific.
Hulme, D., & Mosley, P. (1996). Finance against poverty. Volume 1. London and New York:
Routledge.
IFAD, & UNEP (2013). Small holders, food security and the environment. Retrieved 16-5-2016,
from http://www.unep.org/.
Imai, K.S., Arun, T., & Annim, S.K. (2010). Microfinance and household poverty reduction:
New evidence from India. World Development, 38(12), 1760-1774.
Imai, K.S., & Azam, M.D.S. (2012). Does microfinance reduce poverty in Bangladesh? New
evidence from household panel data. The Journal of Development Studies, 48(5), 633-
653.
Ishengoma, E.K., & Kappel, R. (2008) : Business constraints and growth potential of micro and
small manufacturing enterprises in Uganda, GIGA working papers, No. 78). Business
constraints and growth potential of micro and small manufacturing enterprises in Uganda.
GIGA working papers, Number 78. Retrieved 10-12-2016, from http://hdl.handle.net/.
Islam, A., Maitra, C., Pakrashi, D., & Smyth, R. (2016). Microcredit programme participation
and household food security in rural Bangladesh. Journal of Agricultural Economics,
67(2), 448-470.
Jiggins, J. (1989). How poor women earn income in sub-Saharan Africa and what works against
them. World Development, 17(7), 953-963.

195
Kabeer, N. (2001). Conflicts over credit: Re-evaluating the empowerment potential of loans to
women in rural Bangladesh. World Development, 29(1), 63-84.
Kabeer, N. (2005). Is microfinance a 'magic bullet' for women's empowerment? Analysis of
findings from South Asia. Economic and Political Weekly, 4709-4718.
Kaboski, J.P., & Townsend, R.M. (2011). A structural evaluation of a large‐scale quasi‐experimental microfinance initiative. Econometrica, 79(5), 1357-1406.
Kaboski, J.P., & Townsend, R.M. (2012). The impact of credit on village economies. American
Economic Journal: Applied Economics, 4(2), 98-133.
Karlan, D. (2001). Microfinance impact asessments: The perils of using new members as a
control group. Journal of Microfinance, 3(2), 75-85.
Karlan, D., & Goldberg, N. (2011). Microfinance evaluation strategies. In: B. Armendáriz & J.
Morduch (Eds.), The handbook of microfinance (pp. 17-58). Singapore: World Scientific
Publishing.
Karlan, D., & Zinman, J. (2011). Microcredit in theory and practice: Using randomized credit
scoring for impact evaluation. Science, 332(6035), 1278-1284.
Karuhanga, B. M. K. (2008). Living with AIDS in Uganda : impacts on banana-farming
households in two districts. (PhD Thesis), Wageningen Academic Publishers,
Wageningen University. Retrieved from http://edepot.wur.nl/ (29-2-2016).
Keinan, A., & Kivetz, R. (2011). Productivity orientation and the consumption of collectable
experiences. Journal of Consumer Research, 37(6), 935-950.
Kempson, E., Crame, M., & Finney, A. (2007). Financial services provision and prevention of
financial exclusion. Eurobarometer Report, University of Bristol. Retrieved 19-12-2016,
from http://www.bristol.ac.uk/.
Kennedy, E., & Peters, P. (1992). Household food security and child nutrition. The interaction of
income and gender of household head. World Development, 20(8), 1077-1085.
Khandker, S.R. (2005). Microfinance and poverty: Evidence using panel data from Bangladesh.
The World Bank Economic Review, 19(2), 263-286.
Khandker, S.R., & Koolwal, G.B. (2016). How has microcredit supported agriculture? Evidence
using panel data from Bangladesh. Agricultural Economics, 47(2), 157-168.
Khandker, S.R., Koolwal, G.B., & Samad, H.A. (2010). Handbook on impact evaluation:
quantitative methods and practices. Washington, DC: World Bank.
Kikafunda, J., Agaba, E., & Bambona, A. (2014). Malnutrition amidst plenty: an assessment of
factors responsible for persistent high levels of childhood stunting in food secure western
Uganda. African Journal of Food, Agriculture, Nutrition and Development, 14(5), 2088-
2113.
Lakwo, A. (2006). Microfinance, rural livelihoods, and women’s empowerment in Uganda.
(Ph.D Thesis), Radboud Universiteit, Nijmegen. (African Studies Centre Research report
no 85.)
Ledgerwood, J. (1999). Microfinance handbook: An institutional and financial perspective.
Washington: World Bank.
Ljungqvist, B. G., Mellander, O., & Svanberg, U. S.-O. (1981). Dietary bulk as a limiting factor
for nutrient intake in pre-school children. A problem description. Journal of Tropical
Pediatrics.
Luellen, J.K., Shadish, W.R., & Clark, M. (2005). Propensity scores. An introduction and
experimental test. Evaluation Review, 29(6), 530-558.

196
MacGuire, J.S., & Popkin, B.M. (1990). Helping women improve nutrition in the developing
world: beating the zero sum game. World Bank technical paper, no. 114. Retrieved 7-1-
2017, from http://edepot.wur.nl/73935
Mahadevan, R., & Hoang, V. (2016). Is there a link between poverty and food security? Social
Indicators Research, 128(1), 179-199.
Mahajan, V., & Ramola, B.G. (1996). Financial services for the rural poor and women in India:
Access and sustainability. Journal of International Development, 8(2), 211-224.
Makokha, K.A. (2001). Structural adjustment participatory review initiative (SAPRI). Uganda
country report: A synthesis of the Four SAPRI Studies. Retrieved 4-5-2016, from
http://www.saprin.org/
Margolis, D.N. (2014). By choice and by necessity: Entrepreneurship and self-employment in the
developing world. European Journal of Development Research, 26(4), 419-436.
Marquis, G.S., Colecraft, E.K., Sakyi-Dawson, O., Lartey, A., Ahunu, B., Birks, K.A., Huff-
Lonergan, E. (2015). An integrated microcredit, entrepreneurial training, and nutrition
education intervention is associated with better growth among preschool-aged children in
rural Ghana. Journal of Nutrition, 145(2), 335-343.
Matin, I., Hulme, D., & Rutherford, S. (2002). Finance for the poor: From microcredit to
microfinancial services. Journal of international Development, 14(2), 273-294.
Maxwell, S. (1996). Food security: A post-modern perspective. Food Policy, 21(2), 155-170.
Maxwell, S., & Frankenberger, T. R. (1995). Household food security: Concepts, indicators,
measurements: A technical review. New York: UNICEF.
Mayoux, L. (2001). Tackling the down side: Social capital, women's empowerment and micro-
finance in Cameroon. Development and Change, 32(3), 435-464.
McKernan, S.M. (2002). The impact of microcredit programs on self-employment profits: Do
noncredit program aspects matter? Review of Economics and Statistics, 84(1), 93-115.
Melgar-Quinonez, H.R., Zubieta, A.C., MkNelly, B., Nteziyaremye, A., Gerardo, M.F.D., &
Dunford, C. (2006). Household food insecurity and food expenditure in Bolivia, Burkina
Faso, and the Philippines. The Journal of nutrition, 136(5), 1431S-1437S.
Mellor, J.W. (1983). Food prospects for the developing countries. The American Economic
Review, 73(2), 239-243.
Meyer, R.L. (2013). Microcredit and agriculture: Challenges, successes and prospects. In:
Gueyie, Jean-Pierre, R. Manos, & J. Yaron (Eds.), Microfinance in developing countries:
issues, policies and performance evaluation. Houndmills, Basingstoke, Hampshire:
Palgrave Macmillan.
Microcredit Summit Campaign. (2015). The status of the campaign report 2015. Retrieved 8-1-
2017, from https://stateofthecampaign.org/.
Misselhorn, A.A. (2005). What drives food insecurity in southern Africa? A meta-analysis of
household economy studies. Global Environmental Change, 15(1), 33-43.
Mittal, A. (2009). The 2008 food price crisis: Rethinking food security policies. Retrieved from
http://www19.iadb.org/.
MkNelly, B., & Lippold, K. (1998). Practitioner-led impact assessment: A test in Mali. from
http://www.microfinancegateway.org/.
MoFPED. (2014). Proverty status report 2014. Structural change and poverty reduction in
Uganda. Retrieved 1-12-2016, from https://www.google.nl/.
Momsen, J.H. (2004). Gender and development. London: Routledge.

197
Montgomery, R., Bhattacharya, D., & Hulme, D. (1996). Credit for the poor in Bangladesh. The
BRAC rural development programme and the government Thana resource development
and employment programme. In: D. Hulme & P. Mosley (Eds.), Finance against poverty:
Volume 2. (pp. 94-176).
Morduch, J. (1995). Income smoothing and consumption smoothing. The Journal of Economic
Perspectives, 9(3), 103-114.
Morduch, J. (1999). The microfinance promise. Journal of Economic Literature, 37(4), 1569-
1614.
Morduch, J. (2000). The microfinance schism. World Development, 28(4), 617-629.
Morris, G., & Barnes, C. (2005). An assessment of the impact of microfinance: a case study from
Uganda. Journal of Microfinance/ESR Review, 7(1), 39-54.
Morvant-Roux, S. (2011). Is microfinance the adequate tool to finance agriculture? In: The
handbook of microfinance. In B. Armendáriz & M. Labie (Eds.), The handbook of
microfinance (pp. 421-435). London: World Scientific.
Moseson, H., Hamad, R., & Fernald, L. (2014). Microcredit participation and child health:
results from a cross-sectional study in Peru. Journal of Epidemiology and Community
Health, 68(12), 1175-1181.
Mosley, P., & Hulme, D. (1998). Microenterprise finance: Is there a conflict between growth and
poverty alleviation? World Development, 26(5), 783-790.
Moti, J., Berhanu, G., & Hoekstra, D. (2009). Smallholder commercialization: Processes,
determinants and impact. Improving Productivity and Market Success (IPMS) of
Ethiopian Farmers Project. Discussion Paper No. 18. Retrieved from
https://cgspace.cgiar.org/.
Muhoozi, G. K., Atukunda, P., Mwadime, R., Iversen, P. O., & Westerberg, A. C. (2016).
Nutritional and developmental status among 6-to 8-month-old children in southwestern
Uganda: A cross-sectional study. Food Nutrition Research, 60.
Mukono District Local Government. (2010). Mukono 5- year district development plan (2010-
2015). from http://npa.ug/wp-content/themes/npatheme/documents/.
Mutesasira, L., & Kaffu, E. (2003). Competition working for customer: The evolution of the
Ugandan microfinance sector: A longitudinal study from December 2001 to March 2003.
Kampala: MicroSave-Market-led solutions for financial services, Nairobi, Kenya.
Namayengo, F.M.M., Antonides, G., & van Ophem, J.A.C. (2016). Women and microcredit in
rural agrarian households of Uganda: Match or mismatch between lender and borrower?
Applied Studies in Agribusiness and Commerce-APSTRACT, 10(2-3), 77-88.
Nanayakkara, G., & Stewart, J. (2015). Gender and other repayment determinants of
microfinancing in Indonesia and Sri Lanka. International Journal of Social Economics,
42(4), 322-339.
Nelson, C., Mknelly, B., Garber, C., Edcomb, E., Horn, N., Gaile, G., & Lippold, K. (2004).
Learning from clients: assessment tools for microfinance practitioners. AIMS Publication.
from http://pdf.usaid.gov/.
NEPAD. (2006). Championing agricutural success for Africa's future in support of CAADP:
Synthesis report of a parliamentary dialogue. Somerset West, CapeTown.
Ngulube, T.J. (1989). The composition of foods commonly eaten in East Africa. Edited by C. E.
West, F. Pepping and C.R. Temalilwa. Wageningen: Wageningen University.
Niehof, A. (2004a). A micro-ecological approach to home care for AIDS patients. Medische
Antropologie, 16(2), 245-265.
198
Niehof, A. (2004b). The significance of diversification for rural livelihood systems. Food Policy,
29(4), 321-338.
Niehof, A. (2015). Contours of matriarchy in care for people living with AIDS. In: M. Barnes, T.
Brannelly, L. Ward, & N. Ward (Eds.), Ethics of care: critical advances in international
perspective (pp. 139-164). Bristol: Policy Press.
Niehof, A. (2016). Food and nutrition security as a gendered social practice. Applied Studies in
Agribusiness and Commerce—APSTRACT, 10(2-3), 59-66.
Niels, H., & Lensink, R. (2007). The empirics of microfinance: What do we know? The
Economic Journal, 117(517), F1-F10.
NPA (2010). National development plan 2010/11-2014/15. GOU. Retrieved from
http://npa.ug/development-plans/ndp-201011-201415/.
Østergaard, L. (1992). Gender and development: A practical guide: Routledge.
Panjaitan-Drioadisuryo, R.D., & Cloud, K. (1999). Gender, self-employment and microcredit
programs an Indonesian case study. The Quarterly Review of Economics and Finance,
39(5), 769-779.
Papanek, H.C.F. (1973). Purdah: Separate worlds and symbolic shelter. Comparative Studies in
Society and History, 15(3), 289-325.
Parpart, J.L., & Connelly, M.P. (2000). Theoretical perspectives on gender and development.
Ottawa: International Development Research Centre.
Petrocelli, J.V. (2003). Factor validation of the consideration of future consequences scale:
Evidence for a short version. Journal of Social Psychology, 143(4), 405-413.
Pitt, M.M., & Khandker, S.R. (1998). The impact of group-based credit programs on poor
households in Bangladesh: does the gender of participants matter? Journal of Political
Economy, 106(5), 958-996.
Pitt, M.M., Khandker, S.R, & Cartwright, J. (2006). Empowering women with micro finance:
Evidence from Bangladesh. Economic Development and Cultural Change, 54(4), 791-
831.
Pitt, M.M., Khandker, S. R., Chowdhury, O.H., & Millimet, D.L. (2003). Credit programs for the
poor and the health status of children in rural Bangladesh. International Economic
Review, 44(1), 87-118.
Pitt, M.M., Khandker, S.R., Chowdhury, O.H., & Millimet, D.L. (2003). Credit programs for the
poor and the health status of children in rural Bangladesh. International Economic
Review, 44(1), 87-118.
Pitt, M.M., Khandker, S.R., McKernan, S.M., & Latif, M.A. (1999). Credit programs for the
poor and reproductive behavior in low-income countries: Are the reported causal
relationships the result of heterogeneity bias? Demography, 36(1), 1-21.
Postelnicu, L., Hermes, N., & Szafarz, A. (2014). Defining social collateral in microfinance
group lending. In: R. Mersland & R. Ø. Strøm (Eds.), Microfinance institutions:
Financial and social performance (pp. 187-207). London: Palgrave Macmillan.
Quisumbing, A.R., Brown, L.R., Feldstein, H.S., Haddad, L., & Peña, C. (1995). Women: The
key to food security. Retrieved from https://core.ac.uk/.
Rahman, A. (1999a). Micro-credit initiatives for equitable and sustainable development: Who
pays? World Development, 27(1), 67-82.
Rahman, A. (1999b). Women and microcredit in rural Bangladesh: Anthropological study of the
rhetoric and realities of Grameen Bank Lending. Boulder: Westview Press.

199
Rahman, P.M.M., Matsui, N., & Ikemoto, Y. (2013). Poverty and food security. In P. M. M.
Rahman, N. Matsui, & Y. Ikemoto (Eds.), Dynamics of poverty in rural Bangladesh.
Tokyo: Springer Japan.
Rakodi, C. (1999). A capital assets framework for analysing household livelihood strategies:
implications for policy. Development Policy Review, 17(3), 315-342.
Rauch, A., & Frese, M. (2000). Psychological approaches to entrepreneurial success: A general
model and an overview of findings. International Review of Industrial and
Organizational Psychology, 15, 101-142.
Ray, J.J. (1980). The comparative validity of Likert, projective, and forced-choice indices of
achievement motivation. The Journal of Social Psychology, 111(1), 63-72.
Republic of Uganda. (2014a). The HIV and AIDS Uganda country progress report 2014.
Kampala: UNAIDS. Retrieved 6-3-2016., from http://www.unaids.org/.
Republic of Uganda. (2014b). The state of the Uganda population report 2014. Harnessing
Ugandas demographic dividend for socio-economic transformation. Kampala: UNFPA.
Rooks, G., Szirmai, A., & Sserwanga, A. (2009). The interplay of human and social capital in
entrepreneurship in developing countries. The case of Uganda. Research Paper: UNU-
WIDER, No. 2009.09.
Rosenbaum, P.R. (2010). Design of observational studies (2nd ed.). New York: Springer.
Rosenbaum, P.R., & Rubin, D.B. (1983). The central role of the propensity score in
observational studies for causal effects. Biometrika, 70(1), 41-55.
Roxin, H., & Fiege, K. (2010). Economic empowerment of women through microcredit: The case
of the "Microfinance investment and technical assistance facility" (MITAF) SLE
publication series; S240. Retrieved from http://edoc.hu-berlin.de/.
Ruel, M.T., & Alderman, H. (2013). Nutrition-sensitive interventions and programmes: How can
they help to accelerate progress in improving maternal and child nutrition? The Lancet,
382(9891), 536-551.
Rutherford, S. (2000). The poor and their money. Oxford: Oxford University Press.
Rutherford, S. (2011). Boosting the poor's capacity to save. In: B. Armendariz & M. Labie
(Eds.), The handbook of microfinance (pp. 520). New Jersey: World Scientific.
Schreiner, M., & Woller, G. (2003). Microenterprise development programs in the United States
and in the developing world. World Development, 31(9), 1567-1580.
Schroeder, R.A. (1996). "Gone to their second husbands": Marital metaphors and conjugal
contracts in the Gambia's female garden sector. Canadian Journal of African Studies /
Revue Canadienne des Études Africaines, 30(1), 69-87.
Sebstad, J. (1998). Toward guidelines for lower-cost impact assessment methodologies for
microenterprise programs. AIMS, Washington. Retrieved 3-6-2015, from
http://pdf.usaid.gov/.
Sebstad, J., Neill, C., Barnes, C., & Chen, G. (1995). Assessing the impacts of microenterprise
intervention: A framework for analysis. USAID Managing for Results. Working Paper 7.
Retrieved 15-3-2016, from http://pdf.usaid.gov/.
Sen, A. (1981). Poverty and famines: An essay on entitlement and deprivation. Oxford:
Clarendon.
Sen, A. (1999). Development as freedom. New York: Knopf Publishers.
Sibhatu, K.T., Krishna, V.V., & Qaim, M. (2015). Production diversity and dietary diversity in
smallholder farm households. Proceedings of the National Academy of Sciences, 112(34),
10657-10662.

200
Smith, D.R., Gordon, A., Meadows, K., & Zwick, K. (2001). Livelihood diversification in
Uganda: patterns and determinants of change across two rural districts. Food Policy,
26(4), 421-435.
Smith, L. C., El Obeid, A.E., & Jensen, H.H. (2000). The geography and causes of food
insecurity in developing countries. Agricultural Economics, 22(2), 199-215.
Smith, L.C., & Subandoro, A. (2007). Measuring food security using household expenditure
surveys. Food security in practice technical guide. Retrieved from http://www.ifpri.org/.
Snodgrass, D., & Sebstad, J. (2002). Clients in context: The impacts of microfinance in three
countries: Synthesis report. From https://www.researchgate.net/.
Sraboni, E., Malapit, H.J., Quisumbing, A. R., & Ahmed, A.U. (2014). Women’s empowerment
in agriculture: What role for food security in Bangladesh? World Development, 61, 11-
52.
Stevens, G.A., Finucane, M.M., Paciorek, C.J., Flaxman, S.R., White, R.A., Donner, A.J. (2012).
Trends in mild, moderate, and severe stunting and underweight, and progress towards
MDG 1 in 141 developing countries: A systematic analysis of population representative
data. Lancet, 380(9844), 824-834.
Stewart, R., van Rooyen, C., Dickson, K., Majoro, M., & de Wet, T. (2010). What is the impact
of microfinance on poor people? A systematic review of evidence from sub-Saharan
Africa. Technical report. Retrieved Accessed 22-11-2016, from http://eprints.ioe.ac.uk/.
Swain, R.B., & Wallentin, F.Y. (2009). Does microfinance empower women? Evidence from
self‐help groups in India. International Review of Applied Economics, 23(5), 541-556.
Swindale, A., & Bilinsky, P. (2006a). Development of a universally applicable household food
insecurity measurement tool: Process, current status, and outstanding issues. The Journal
of Nutrition, 136(5), 1449S-1452S.
Swindale, A., & Bilinsky, P. (2006b). Household dietary diversity score (HDDS) for
measurement of household food access: Indicator guide. Retrieved from
http://www.fantaproject.org/.
Tedeschi, G.A. (2008). Overcoming selection bias in microcredit impact assessments: A case
study in Peru. The Journal of Development Studies, 44(4), 504-518.
Todd, P.E., Schultz, T.P., & John, A.S. (2007). Evaluating social programs with endogenous
program placement and selection of the treated. Handbook of Development Economics
(Vol. 4, pp. 3847-3894). Amsterdam: Elsevier.
Torheim, L.E., Ouattara, F., Diarra, M. M., Thiam, F. D., Barikmo, I., Hatloy, A., & Oshaug, A.
(2004). Nutrient adequacy and dietary diversity in rural Mali: Association and
determinants. European Journal of Clinical Nutrition, 58(4), 594-604.
UBOS (2006). Uganda national household survey 2005/2006. Report on the Socio-economic
module. Kampala: UBOS Retrieved from http://www.ubos.org/.
UBOS (2010a). Report on the Census of Microfinance Institutions in Uganda. Kampala:
Government of Uganda.
UBOS (2010b). Uganda National Household Survey 2009/2010. Socio-economic Module.
Abridged Report. Kampala: UBOS. Retrieved from http://www.ubos.org/.
UBOS (2014). Uganda National Household Survey 2012/2013. Kampala Uganda Retrieved from
http://www.ubos.org/.
UBOS (2016). National Population and Housing Census 2014. Main report. Kampala Uganda.
Retrieved from http://www.ubos.org/.

201
UBOS, & ICF (2012). Uganda Demographic and Health Survey 2011. Kampala, Uganda::
UBOS and Calverton, Maryland: ICF International Inc. Retrieved from
http://www.ubos.org/.
UBOS, & MoFPED (2014). Report on census of microfinance institutions in Uganda. Kampala:
UBOS Retrieved from https://searchworks.stanford.edu/.
UBOS, & WFP (2013). Comprehensive food security and vulnerability analysis (CVSVA) 2013.
Kampala. Retrieved from http://documents.wfp.org/.
Udry, C., Hoddinott, J., Alderman, H., & Haddad, L. (1995). Gender differentials in farm
productivity: implications for household efficiency and agricultural policy. Food Policy,
20(5), 407-423.
UNDP (1994). Human development report 1994: Oxford University Press.
UNDP (1996). 1995 Human Development Report (Vol. 4). New York.
UNDP (2003). Human Development Report 2003 Millenium Development Goals: A Compact
among Nations to end Human Poverty. New York: Oxford University Press.
UNDP (2014). Human development report 2014 Sustaining human progress: Reducing
vulnerabilities and building resilience. New York: Oxford University Press.
UNICEF (1990). Strategy for improved nutrition of women and children in developing countries.
A UNICEF policy review. New York: UNICEF.
van Rijn, F., Bulte, E., & Adekunle, A. (2012). Social capital and agricultural innovation in Sub-
Saharan Africa. Agricultural Systems, 108, 112-122.
van Rooyen, C., Stewart, R., & de Wet, T. (2012). The Impact of microfinance in Sub-Saharan
Africa: A systematic review of the evidence. World Development, 40(11), 2249-2262.
Viswanathan, K. (2002). The informal sector and microfinance institutions in West Africa.
Indian Journal of Agricultural Economics, 57(1), 126.
Von Braun, J., De Haen, H., & Blanken, J. (1991). Commercialization of agriculture under
population pressure: Effects on production, consumption, and nutrition in Rwanda (Vol.
85). Washington: IFPRI.
Wakoko, F. (2004). Microfinance and women’s empowerment in Uganda: A socioeconomic
approach. (PhD Thesis), Ohio State University.
Wärneryd, K. (1988). The psychology of innovative enterpreneurship. In: W. F. van Raaij, G. M.
van Veldhoven, & K. Warneryd (Eds.), Handbook of Economic Psychology. (ed., pp.
404-447). London: Kluwer Academic Publishers.
Webb, P., Coates, J., & Houser, R. (2002). Allocative responses to scarcity: Self-reported
assessments of hunger compared with conventional measures of poverty and malnutrition
in Bangladesh. Food Policy and Applied Nutrition Program, Discussion paper. Retrieved
13, from http://citeseerx.ist.psu.edu/.
Weisfeld-Adams, E., & Andrzejewski, A. (2008). Hunger and poverty: Definitions and
distinctions. The Hunger Project.
Word Bank (2007). World development report 2008: Agriculture for development. Washington,
DC: World Bank.
World Bank (2006). Repositioning nutrition as central to development: A strategy for large-scale
action. from http://www.unhcr.org/45f6c4432.pdf:
World Bank (2007). Agriculture for development. World development report 2008. Retrieved
from http://edepot.wur.nl/.
World Bank (2016a). Global monitoring report 2015/2016. Development goals in an era of
demographic change. Retrieved from http://pubdocs.worldbank.org/.
202
World Bank (2016b). The Uganda poverty assessment report 2016. Farms, cities and good
fortune: Assessing poverty reduction in Uganda from 2006 to 2013. Retrieved from
http://pubdocs.worldbank.org/.
Wright, G.A., Mutesasira, L., Sempangi, H., Hulme, D., & Rutherford, S. (1998). Drop-outs
Amongst Ugandan Microfinance Institutions. Retrieved 20-03-2016, from
http://www.microsave.net/files/.
Wright, G.A., & Rippey, P. (2003). The competitive environment in Uganda: Implications for
microfinance institutions and their clients. Retrieved 8-5-2016., from
http://www.microfinancegateway.org/.
Wydick, B. (1999). The effect of microenterprise lending on child schooling in Guatemala.
Economic Development and Cultural Change, 47(4), 853-869.
Zeller, M., & Sharma, M. (2000). Many borrow, more save, and all insure: implications for food
and micro-finance policy. Food Policy, 25(2), 143-167.

203
Study Instruments
Survey questionnaire
Dear respondent,
The current study on “Microcredit to women and its contribution to production and household
food security” is an academic research project. The aim is to provide information on
microfinance support of women, production and household food security.
We would like to ask you some questions on the loan that you have with BRAC, your production
activities, and the food intake of your household. All information obtained will be treated with
confidentiality. Do you object to using the questionnaire and other information from BRAC
about the loan, for purposes of this study? Can we proceed? Thank you.
Name of interviewer...................................Cleaning status....................................... Supervisor
signature...................

204
Section 0
Interview Identification: Area Office: Mukono
001.Q.Number 002. Interview 003. District 004. Sub-County
Date: D/M/YR 1. Mukono
2. Buikwe
005. Branch 006. Village 007. Name of Group
1. Mukono 1 2. Mukono 2
3. Lugazi 4. Nkokonjeru
5. Buikwe
RESPONDENT CATEGORISATION:
Interviewer: Ask the respondent if she ever received a loan from BRAC or any other financial institution. Use table
008 to categorise the respondent.
Question: Did you ever take any loan with BRAC or other Organisation?
Categorise respondent into the following.
008. RESPONDENT CATEGORY
1. Old Borrower 2. Drop out 3. New Borrower Control
Ever taken BRAC loan
(still borrowing)
Ever took BRAC Loan
(no longer borrowing)
Applied for BRAC loan
(Not yet received loan)
Has microenterprise but has
never taken loan
Section 1A
101a Name
101b BRAC ID. NUMBER
101c Phone Number
102 Age
103 Marital status
104 Religion
105 Schooling Status Highest level of education
Primary (P.1-
P.7)
Secondary
(S.1-S.6)
Tertiary education None
Codes for 103: 1=Married, 2= Never married/single, 3=Co-habiting, 4= Widow, 5=Separated
Code for 104: 1=Roman Catholic, 2=Anglican, 3=Pentecostal, 4=SDA, 5=Orthodox, 6=Moslem, 7=Other
(specify)

205
Section 1B: Socio demographic/household information
(List all members of this household, starting with the household head)
A household is a group of people who routinely eat from the same pot and live on the same compound (or physical
location); it is possible that they may live in different structures.
ID 110 111 112 113 114
Name
Relationship to the
respondent
1.Husband
2. Son/ daughter
3. Sister/brother
4. Other adults
5. Other children
Sex
1.Male
2.Female
Age (completed
years)
Schooling
1.In school
2. Not in school
1
...
10
Section 1C: Schooling status of household members
ID 115 116 117 118 119
If still in school,
which grade is
he/she currently
attending?
If not in
school, why
not school?
Highest grade
completed
(if no longer
in school)
What is the status of the last
school?
1.Government 2.Private
3.NGO/ religious
4.Other
What type of
scholar is child
(last)?
1. Day school
2. Boarding school
1
...
10
Code for reason (qn.116)
1. Distance to school too far 2.Household could not afford 3. Institution did not admit 4. Had to work
5. Did not want to study 6. Health condition (illness /
disability)
7. Social /religious pressure 8. Other(specify)

206
Section 2: Microcredit information (Loan allocation)–New borrowers proceed to 202a. (Skip section for all
controls)
I will now ask you questions about the microcredit from BRAC
200 201 202 203 204 205 206 207
How many
times did
you take the
loan
since/when
you joined
the credit
group?
(put
number)
When
(How
many
months
ago) did
you
receive
your first
loan?
Amount
of first
loan
(UGX.)
When (How
many
months ago)
did you
receive the
current/ last
loan?
Amount of
current/
last loan
(UGX.)
What
was the
main
reason
for
borrowin
g your
current
/last
loan?
What is the
Loan
period?
1.
40 weeks
2.
20 weeks
Whose initiative
was it to take your
current/last loan?
1. Self
2. Spouse
3.Self and spouse
4. BRAC staff
5. Group members
6. Self and
other(specify)
7. Other(specify)
FILL FOR NEW BORROWERS.
200a 201a 202a 203a 204a 205a 206a 207a
Amount
of loan
(UGX.)
What is
the main
reason
for
borrowing?
What is the
loan
period?
1.
40 weeks
2.
20 weeks
Whose initiative
was it to take the
loan?
1. Self
2. Spouse
3.Self and spouse
4. BRAC staff
5. Group members
6. Self and
other(specify)
7. Other(specify)
..............
Code for reason (205 and 205a)
1.To buy land
2. To buy livestock
3. Recapitalize farming-related
microenterprise
4.Recapitalize trade related microenterprise
5. ...........................................
6.Buying building materials
7.Pay for education expenses
8.Pay for health expenses
9.Pay for ceremonial expenses
10. Pay for other consumption goods /
services
11. Other (specify).............
12. Begin new business
Microcredit information (loan repayment)
(For old borrowers) NEW BORROWERS GO TO 208a
208 209 210
Who is responsible to repay the
loan in your household?
1. Self
2. Spouse
3. Self and spouse
4. Spouse and other(specify)
Did you ever face difficulties
with the weekly repayments
of your loan?
1. Yes
2. No
What was the source of cash for the last
weekly repayment of your loan?
1. Loan funded enterprises
2. Group members
3. Loan from other MFI
4. From spouse
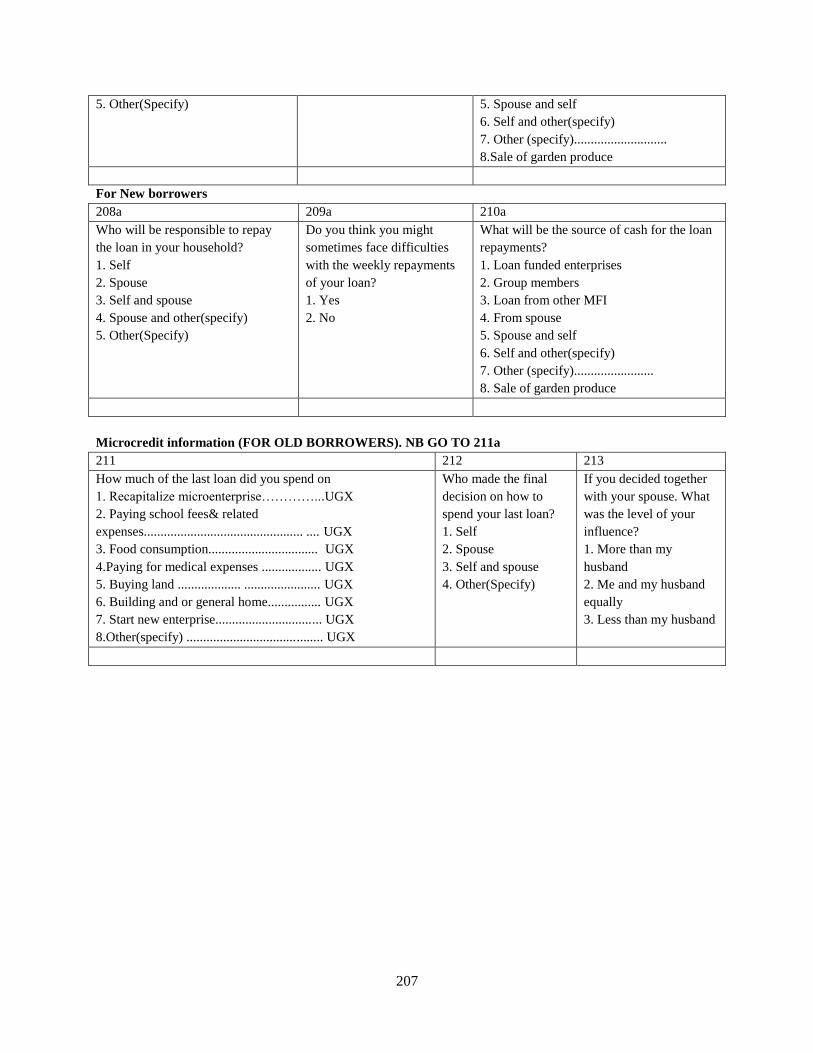
207
5. Other(Specify) 5. Spouse and self
6. Self and other(specify)
7. Other (specify)............................
8.Sale of garden produce
For New borrowers
208a 209a 210a
Who will be responsible to repay
the loan in your household?
1. Self
2. Spouse
3. Self and spouse
4. Spouse and other(specify)
5. Other(Specify)
Do you think you might
sometimes face difficulties
with the weekly repayments
of your loan?
1. Yes
2. No
What will be the source of cash for the loan
repayments?
1. Loan funded enterprises
2. Group members
3. Loan from other MFI
4. From spouse
5. Spouse and self
6. Self and other(specify)
7. Other (specify)........................
8. Sale of garden produce
Microcredit information (FOR OLD BORROWERS). NB GO TO 211a
211 212 213
How much of the last loan did you spend on
1. Recapitalize microenterprise…………...UGX
2. Paying school fees& related
expenses................................................ .... UGX
3. Food consumption................................. UGX
4.Paying for medical expenses .................. UGX
5. Buying land ................... ....................... UGX
6. Building and or general home................ UGX
7. Start new enterprise................................ UGX
8.Other(specify) ......................................... UGX
Who made the final
decision on how to
spend your last loan?
1. Self
2. Spouse
3. Self and spouse
4. Other(Specify)
If you decided together
with your spouse. What
was the level of your
influence?
1. More than my
husband
2. Me and my husband
equally
3. Less than my husband
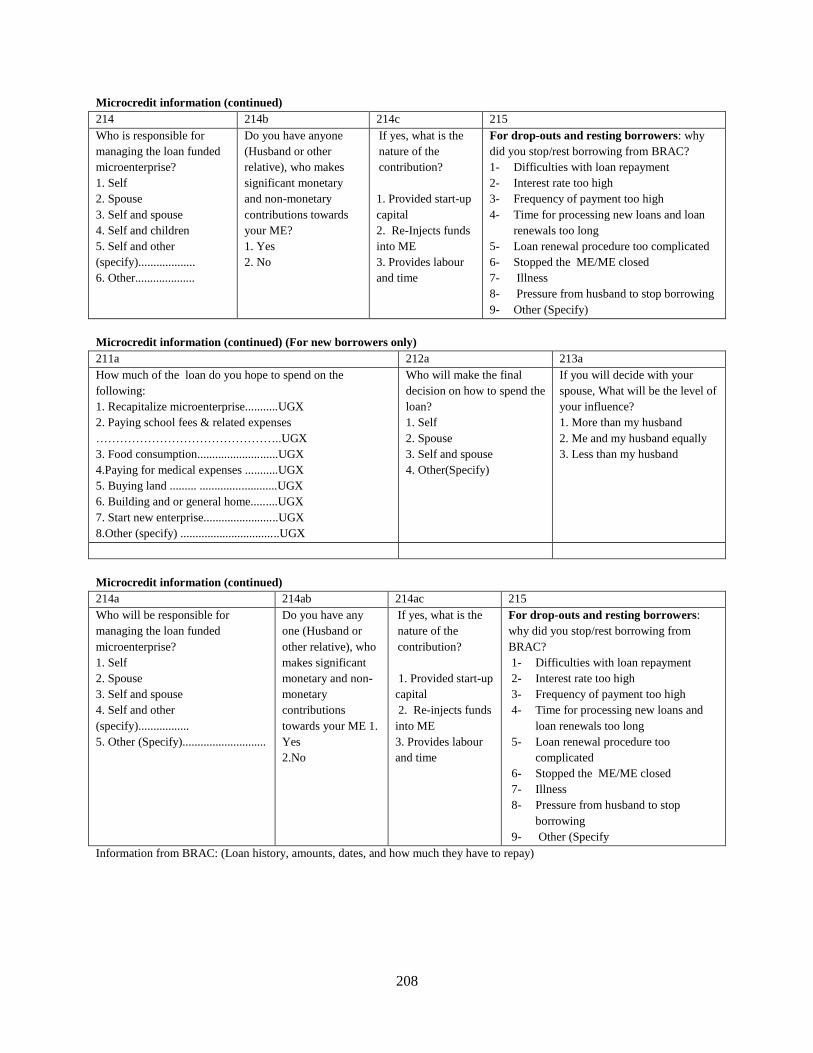
208
Microcredit information (continued)
214 214b 214c 215
Who is responsible for
managing the loan funded
microenterprise?
1. Self
2. Spouse
3. Self and spouse
4. Self and children
5. Self and other
(specify)...................
6. Other....................
Do you have anyone
(Husband or other
relative), who makes
significant monetary
and non-monetary
contributions towards
your ME?
1. Yes
2. No
If yes, what is the
nature of the
contribution?
1. Provided start-up
capital
2. Re-Injects funds
into ME
3. Provides labour
and time
For drop-outs and resting borrowers: why
did you stop/rest borrowing from BRAC?
1- Difficulties with loan repayment
2- Interest rate too high
3- Frequency of payment too high
4- Time for processing new loans and loan
renewals too long
5- Loan renewal procedure too complicated
6- Stopped the ME/ME closed
7- Illness
8- Pressure from husband to stop borrowing
9- Other (Specify)
Microcredit information (continued) (For new borrowers only)
211a 212a 213a
How much of the loan do you hope to spend on the
following:
1. Recapitalize microenterprise...........UGX
2. Paying school fees & related expenses
………………………………………..UGX
3. Food consumption...........................UGX
4.Paying for medical expenses ...........UGX
5. Buying land ......... ..........................UGX
6. Building and or general home.........UGX
7. Start new enterprise.........................UGX
8.Other (specify) .................................UGX
Who will make the final
decision on how to spend the
loan?
1. Self
2. Spouse
3. Self and spouse
4. Other(Specify)
If you will decide with your
spouse, What will be the level of
your influence?
1. More than my husband
2. Me and my husband equally
3. Less than my husband
Microcredit information (continued)
214a 214ab 214ac 215
Who will be responsible for
managing the loan funded
microenterprise?
1. Self
2. Spouse
3. Self and spouse
4. Self and other
(specify).................
5. Other (Specify)............................
Do you have any
one (Husband or
other relative), who
makes significant
monetary and non-
monetary
contributions
towards your ME 1.
Yes
2.No
If yes, what is the
nature of the
contribution?
1. Provided start-up
capital
2. Re-injects funds
into ME
3. Provides labour
and time
For drop-outs and resting borrowers:
why did you stop/rest borrowing from
BRAC?
1- Difficulties with loan repayment
2- Interest rate too high
3- Frequency of payment too high
4- Time for processing new loans and
loan renewals too long
5- Loan renewal procedure too
complicated
6- Stopped the ME/ME closed
7- Illness
8- Pressure from husband to stop
borrowing
9- Other (Specify
Information from BRAC: (Loan history, amounts, dates, and how much they have to repay)

209
SECTION 3: INCOME AND INCOME SOURCES
Loan-funded enterprises (type, ownership and labour allocation)
(Drop-outs with no running ME proceed to 336)
301(For OB and NB) 302 303 (All MEs) 304 305
Did you ever engage in income
generating activities to earn
independent income? (before
joining BRAC)
1. Yes
2. No
For controls: Do you engage in
any Income generating
activities to earn income
1. Yes
2. No
What type of
ME are you
running?
How would you
describe the
ownership of the
ME?
1. Exclusively mine
2. Co-owned with
husband/family
member/friend (tick
where appropriate)
Type of( loan
funded) agricultural
ME
1. Crop
2. Animal
If crop go to 305
If animal go to 315
If both answer 305 to
321
How much area
did you have under
cultivation of the
following in the
previous season
(Acres)
Code 302
1- Agricultural related ME proceed to 304
3- None proceed to 336
Code 305: 1.< half acre2. Half acre
3.half –acre 4.one acre 5. More than an acre
2- Trade-related ME proceed to 325
4-Both (Answer all questions)

210
A. AGRICULTURAL-RELATED ME
306 Expenditure on crop-related agricultural ME
How much did you spend on the following in the last season/month?
EC0 EC1 EC2 EC3 EC4 EC5 EC6 EC7 EC8
Type
of
crops
Number of
employees/
labourers
Cost of
labour for
weeding,
planting,
land clearing
(UGX)
Transport, to
buy crop-
related
inputs
Seeds
Purchase
Value of
seeds
planted
not
bought
Fertilizers
and
pesticides?
Rent or
lease of
agricult
ural
land?
Interest
on loan
invested
in the
ME?
1.
2.
3.
4.
307. Income from crop-related agricultural ME
How much cash and non-cash income did you get from the crops in the last season/ month?
IC 1 IC 2 IC 3 IC 4 IC 5 IC 6 IC 7 IC8
Type of
crops
cultivated
What
quantity
did you
produce?
Unit of
quantit
y
tins,
sacs or
litres)
Quantity of
crops
consumed
From last
season
Quantity sold
From last
season
Unit cost For seasonal
crops what
quantity of
produce do
you have
under
storage?
For non-
seasonal
crops
indicate Qty
in garden
and in
storage?
1. (Quantity) (unit) Qty
Unit
Qty Unit Qty Unit Qty
Unit
2. 1 1. 1.
3. 2 2. 2.
4. 3 3. 3.
5.
Code 306:1. Maize, 2.Vegetable (tomatoes,eggplant,cabbage,dodo,nakati,sukuma wiki), 3. Cassava
4. Coffee, 5. Bananas, 6.Yams, 7.Beans, 8.Potatoes, 9. Other (specify)
308. Compare your current total area under cultivation to before you got the loan
1- Area is less than before I got the first loan 2- Area is the same as before I got the first loan
3- Area is more than before I got the first loan

211
309. Expenses on animal-related agricultural ME
How much did you spend on the following in the previous month or season?
EA0 EA 1 EA 2 EA 3 EA 4 EA 5 EA 6 EA 7 EA 8
Type
Of
Animal
Transport
(UGX)
Veterinary
expenses
and food
supplements
(UGX)
Animal
feed/
fodder
(UGX)
Fuel
(paraffin or
firewood)
(UGX)
Labour
(UGX)
Repairs &
maintenanc
e
(UGX)
Livestock
purchases
(UGX)
Interest
on loan
invested
in ME
(UGX)
310. Income from animal-related agricultural ME
IA1 IA2 IA3 IA4 IA5 IA6
What type of
animals do you
keep?
(Type)
How many
animals do
you have?
(Number)
In the last month, what
quantity of animal
products/young ones did
you produce? (trays,
litres or kgs/ number)
Quantity of
product/
animals
consumed
past 1 month
Qty of
product/animal
sold
past 1 month
Number and
price of animals
bought and
resold
Item Qty Qty Price No Price
1. 1. 1.
2. 2. 2.
3. 3. 3.
4. 4. 4.
5. 5. 5.
Code 315
1. Local chicken
5.Zero grazing cattle
2. Pigs
6. Local cattle
3. Exotic chicken
7. Sheep
4. Goats
8. Ducks
9. Rabbits
General comments on agricultural-related microenterprises
311 312 313(Skip for NB and
control)
What is the total value of sales from
agriculture?
From crops =...............(last season)
From animals=............... (last month) (per
month/year)(UGX)
Do you think last season’s level of
crop production was:
1. Below normal
2. Normal
3. Above normal
Compare your current level of
agricultural production to
what you produced before you
got the first loan?
Tick appropriate time period)
Code 324: 1. Production is less than before I got the loan
2. Production is the same as before I got the loan
3. Production is more than before I got the loan

212
B. TRADE-RELATED MICROENTERPRISES
314 .What type of trade ME do you deal in? (List all MES)______________________________
Codes for 325: 1. Sale of small shop, 2. Stall in weekly markets, 3. Permanent stall in market,
4. Tailor, 5. Hair salon, 6. Brewing and or selling alcohol, 7. Runs small restaurant /cooked food business, 8.
Hawking, 9. Secretarial bureau, 10. Sell airtime and phone accessories, 11. Other
315. What is the monetary value of your business? ______________________________(UGX)
316. How many people do you employ for micro enterprise activities?_____________________
317. Business expenses and business income
I would like you to tell me how much you spend and how much you earn for different aspects of your business per
month/week/day.
A. Cost information (for All )
B. Cost information for traders only (Non-traders skip to C)
i) Restocking days = _______________________(days)
ii) In which time period? 1. Week 2. Month 3. Year(7 days a week means daily)
iii) How much do you usually spend to restock your business on restocking days? ________________
Costs of doing business Time period per: 1.Day 2.Week
3.Month 4.Year
Amount
(a) Paid Labour/ salary (month)
(b) Paid labour piece workers
(c) Rent
(d) Transport for inputs/ restocking
(e) Transport for final product/ for sales
(f) Electricity / paraffin(for business)
(g) Water (for business)
(h) Charcoal/firewood(for business)
(i) Tax and license
(j) Telephone costs (for business)
(k) Repairs and service
(l) Cost of credit (loan repayment)
(m) Other
(n) Other

213
C. Cost information for non- traders (Manufacturer, repairs or service) if trader skip to D
Costs of different business
Inputs/ supplies e.g. Raw
materials and raw foods
Time period
1.Day 2.Week
3.Month
4.Year
Cost Costs of different
business
inputs/ supplies
Time period
1. Day 2.Week
3.Month 4.Year
Cost
A.
....
J.
D. Income and sales information (For all)
318
Compare your current level of trade today to before you got the first loan?
Code 331: 1. trade is less than before I got the loan, 2. It is the same as before I got the loan,
3. It is more than before I got the loan
Income from trade-related microenterprise (continued)
319.(a) What is the money value of the stock items that you consume?
Time period 1. Day 2.Week 3.Month 4. Year
Item
Time Period
Quantity
Amount
319(b)(i). Do you use some of the money you get from this business for yourself, or for your household? If yes,
How much money do you normally use for yourself or for your household? _______________________UGX
(ii)Time period: 1. Day 2. Week 3.Month 4.Year
(This Qn is similar to similar to 335. Check them against each other).
319(c).(i)After making purchases for the business, (after the weekly loan payment)and after using some money for
yourself, or your household, is there usually any money left?
(After paying off the weekly loan payment)– on a typical restocking day 1.Yes 2. No
(ii)Time period: 1. Day 2. Week 3.Month 4.Year (Put Zero if no money is left)
(ii) If yes how much money do you usually have left after purchases for the business and using some of the money
for yourself or your household? _______________________________UGX
GO TO 333
Time allocation (food production versus ME)
333 334 (skip for new borrowers and controls, proceed to 335)
How much time do you spend on the following
on a typical day?
Compare the amount of time you spend on the following these
days and before you got the loan.
Item Time Period
1.Day 2.Week 3.Month 4.Year
Amount/ No of days
Number of business days
Number Of Months
Value of sales on a typical day
Value of stock at restocking day

214
1. I spend less time, 2. I spend same time,3. I spend more time
ME (days/wk) (days) ME ......................................
ME (hrs/working day) (hrs) Garden work ......................................
Garden work (ME Day) (hrs) Domestic work (excluded from
ME time)
......................................
Garden work (Non-ME day)
Domestic work (ME day) (hrs)
Domestic work (Non ME day)
Use of (loan)-funded enterprise income
335a. How much of ME income do you use each day/week for the following
(please list according to priorities)
Period /Item 1.Food
expenditures
2.Education
expenditures
3.Health
expenditures
4.Other
household
expenditures
5.Improvement
Build new house
Day
Week
Month
Term/Semester
335b. Did you ever buy land from your ME Income? 1. Yes, 2. No
336. Other income sources (FOR ALL)
How much income do
you, your husband and
other income earners in
the home get from
other activities? (Not
the ones discussed
above)
(Use code 999 for I
don’t know)
What is your husband’s
main occupation? (use
codes in the table)
Main non-loan related income sources: (circle all
income sources mentioned by household
Income per month/season
Woman Husband Other
1=Food crop production (e.g cereals, tubers)
2= Growing non-food cash crops (e.g. coffee
growers)
3= Livestock production (e.g. animal husbandry)
4= Selling animal products (e.g. eggs and milk)
5= Trading in Food Crop or Non Food crops.
6= Seller, commercial activity/petty trade
7= Bodaboda or special-hire driver
8= Unskilled wage labour
9= Agricultural labour
10= Handicrafts and hair dressing
11= Brewing and sale of local brew
12= Sale of Natural Resources (firewood, charcoal)
13= Remittance/ Kinship/relatives/neighbours
14= Salaries, wages, (employees) private/Govt
15= Rental of property like buildings and land
16= pension
17=Others (specify)
TOTAL
337. Are there other household members who contribute towards food expenditure?
1. Yes 2. No
If Yes, how much funds are provided by the different income earners for household food expenditures?
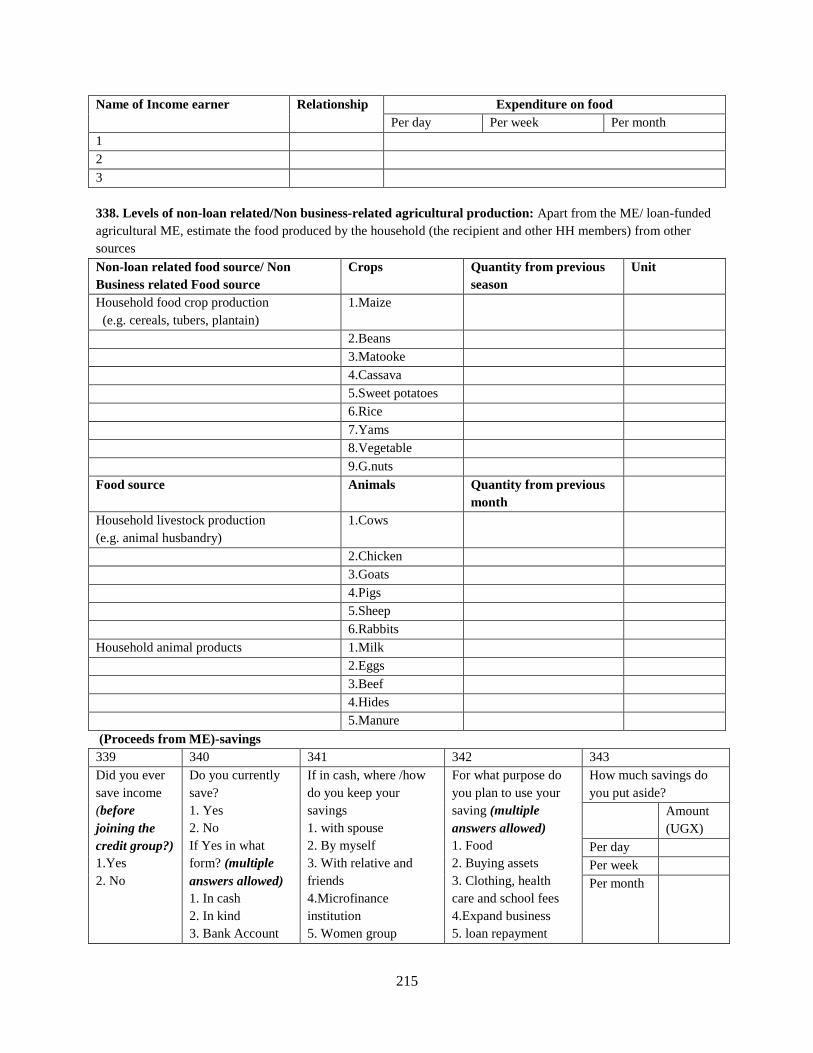
215
Name of Income earner
Relationship Expenditure on food
Per day Per week Per month
1
2
3
338. Levels of non-loan related/Non business-related agricultural production: Apart from the ME/ loan-funded
agricultural ME, estimate the food produced by the household (the recipient and other HH members) from other
sources
Non-loan related food source/ Non
Business related Food source
Crops Quantity from previous
season
Unit
Household food crop production
(e.g. cereals, tubers, plantain)
1.Maize
2.Beans
3.Matooke
4.Cassava
5.Sweet potatoes
6.Rice
7.Yams
8.Vegetable
9.G.nuts
Food source Animals Quantity from previous
month
Household livestock production
(e.g. animal husbandry)
1.Cows
2.Chicken
3.Goats
4.Pigs
5.Sheep
6.Rabbits
Household animal products 1.Milk
2.Eggs
3.Beef
4.Hides
5.Manure
(Proceeds from ME)-savings
339 340 341 342 343
Did you ever
save income
(before
joining the
credit group?)
1.Yes
2. No
Do you currently
save?
1. Yes
2. No
If Yes in what
form? (multiple
answers allowed)
1. In cash
2. In kind
3. Bank Account
If in cash, where /how
do you keep your
savings
1. with spouse
2. By myself
3. With relative and
friends
4.Microfinance
institution
5. Women group
For what purpose do
you plan to use your
saving (multiple
answers allowed)
1. Food
2. Buying assets
3. Clothing, health
care and school fees
4.Expand business
5. loan repayment
How much savings do
you put aside?
Amount
(UGX)
Per day
Per week
Per month
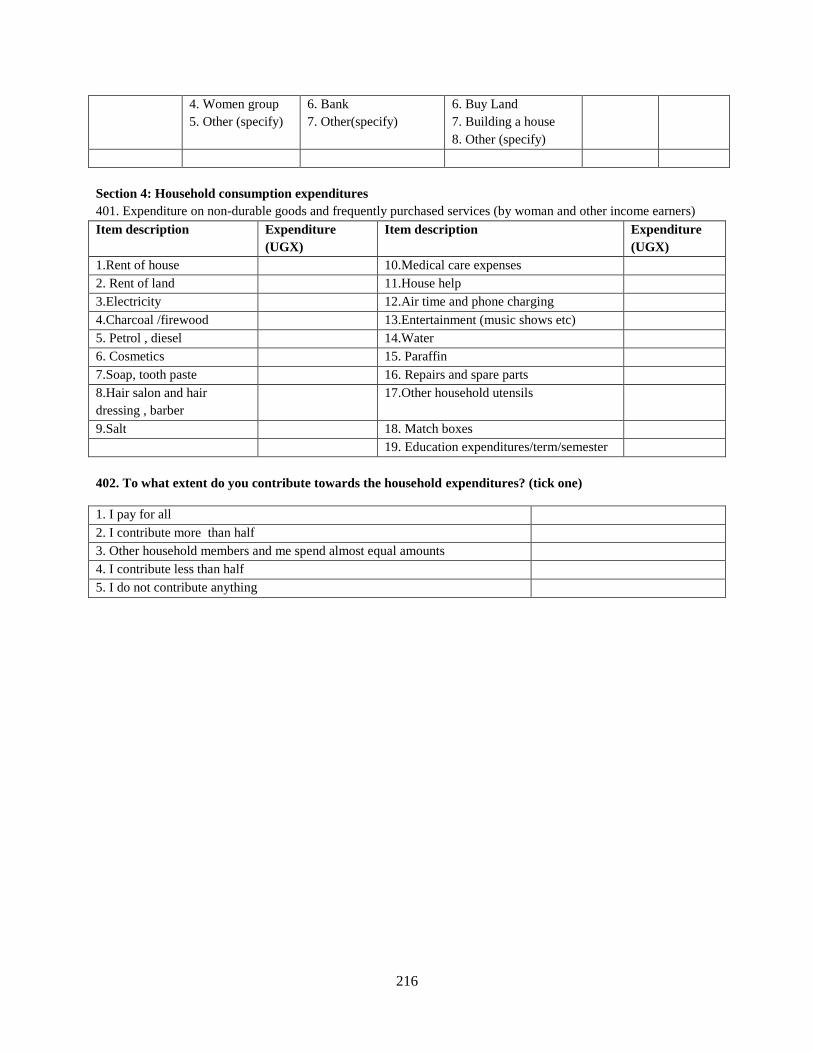
216
4. Women group
5. Other (specify)
6. Bank
7. Other(specify)
6. Buy Land
7. Building a house
8. Other (specify)
Section 4: Household consumption expenditures
401. Expenditure on non-durable goods and frequently purchased services (by woman and other income earners)
Item description Expenditure
(UGX)
Item description Expenditure
(UGX)
1.Rent of house 10.Medical care expenses
2. Rent of land 11.House help
3.Electricity 12.Air time and phone charging
4.Charcoal /firewood 13.Entertainment (music shows etc)
5. Petrol , diesel 14.Water
6. Cosmetics 15. Paraffin
7.Soap, tooth paste 16. Repairs and spare parts
8.Hair salon and hair
dressing , barber
17.Other household utensils
9.Salt 18. Match boxes
19. Education expenditures/term/semester
402. To what extent do you contribute towards the household expenditures? (tick one)
1. I pay for all
2. I contribute more than half
3. Other household members and me spend almost equal amounts
4. I contribute less than half
5. I do not contribute anything
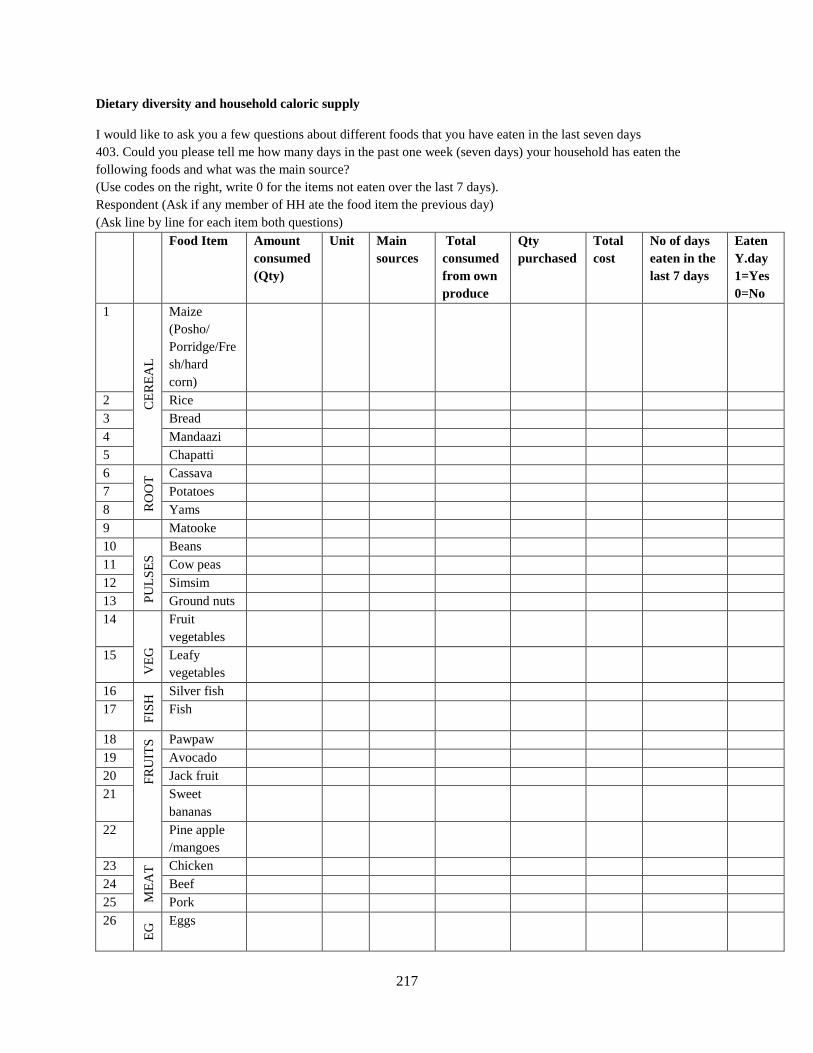
217
Dietary diversity and household caloric supply
I would like to ask you a few questions about different foods that you have eaten in the last seven days
403. Could you please tell me how many days in the past one week (seven days) your household has eaten the
following foods and what was the main source?
(Use codes on the right, write 0 for the items not eaten over the last 7 days).
Respondent (Ask if any member of HH ate the food item the previous day)
(Ask line by line for each item both questions)
Food Item Amount
consumed
(Qty)
Unit Main
sources
Total
consumed
from own
produce
Qty
purchased
Total
cost
No of days
eaten in the
last 7 days
Eaten
Y.day
1=Yes
0=No
1
CE
RE
AL
Maize
(Posho/
Porridge/Fre
sh/hard
corn)
2 Rice
3 Bread
4 Mandaazi
5 Chapatti
6
RO
OT
S
Cassava
7 Potatoes
8 Yams
9 Matooke
10
PU
LS
ES
Beans
11 Cow peas
12 Simsim
13 Ground nuts
14
VE
G
Fruit
vegetables
15 Leafy
vegetables
16
FIS
H
H
Silver fish
17 Fish
18
FR
UIT
S Pawpaw
19 Avocado
20 Jack fruit
21 Sweet
bananas
22 Pine apple
/mangoes
23
ME
AT
Chicken
24 Beef
25 Pork
26
EG
GS
Eggs
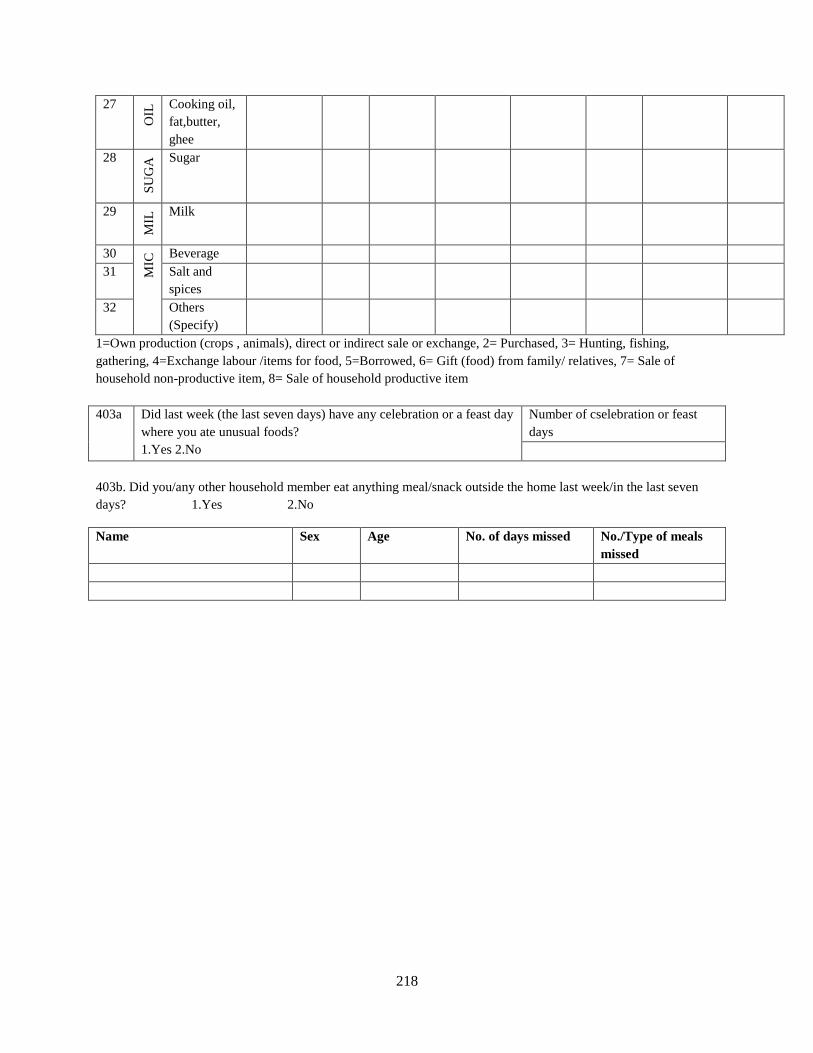
218
27
OIL
Cooking oil,
fat,butter,
ghee
28 S
UG
A R Sugar
29
MIL K
Milk
30
MIC
Beverage
31 Salt and
spices
32 Others
(Specify)
1=Own production (crops , animals), direct or indirect sale or exchange, 2= Purchased, 3= Hunting, fishing,
gathering, 4=Exchange labour /items for food, 5=Borrowed, 6= Gift (food) from family/ relatives, 7= Sale of
household non-productive item, 8= Sale of household productive item
403a Did last week (the last seven days) have any celebration or a feast day
where you ate unusual foods?
1.Yes 2.No
Number of cselebration or feast
days
403b. Did you/any other household member eat anything meal/snack outside the home last week/in the last seven
days? 1.Yes 2.No
Name Sex Age No. of days missed No./Type of meals
missed

219
403 c. Dietary diversity (foods categorisations).
Question
Number
Food Group Examples Yes/No
Cereal and cereal products Maize, rice,bread, mandazi and chapati,
Roots, tubers or their products Cassava, potatoes, yams, Irish potatoes, bucopa/koona
Vegetables Cabbage, doodo, nakati, buga, sukumawiiki, Jobyo,
ntula and biringanya
Fruits Pawpaws, avocado, Jackfruits, bananas, pine aple,
mango, guava,
Meat, poultry/offals Beef, chicken, pork, offals,
Eggs Eggs
Fish and sea food mukene, tilapia, Nile-perch
Pulses, legumes andnNuts Beans, peas, ground nuts, simsim
Milk and milk products Milk, yoghurt, Ice cream
Oils or fats Cooking oil or ghee
Sugar or honey Sugar and honey, sugar cane
Miscellaneous Condiments and spices
404. Qualitative measurements of household food security (household food Insecurity access scale)
Question: In the past month or in the past 4
weeks:
Code
1. Did you worry that your household would
not have enough to eat?
0= No (Skip to Q2)
1= Yes
1.a If yes, how often ? 1.Rarely (once or twice in the past four weeks)
2.Sometimes (three to ten times in the past four weeks
3.Often (more than ten times in the past four weeks)
2. Were you or any household member not
able to eat the kinds of foods you preferred to
eat because of lack of resources
0= No (Skip to Q3)
1= Yes
2.a If yes, how often? 1.Rarely (once or twice in the past four weeks)
2.Sometimes (three to ten times in the past four weeks
3.Often (more than ten times in the past four weeks)
3. Did you or any other household member eat
just a few kinds of food day after day due to
lack of resources?
0= No (Skip to Q4)
1= Yes
3.a. If yes, how often? 1.Rarely (once or twice in the past four weeks)
2.Sometimes (three to ten times in the past four weeks
3.Often (more than ten times in the past four weeks)
4. Did you or any household member eat food
that you did not want to eat because of lack of
resources to obtain other foods?
0= No (Skip to Q5)
1= Yes
4.a. If yes, how often? 1.Rarely (once or twice in the past four weeks)
2.Sometimes (three to ten times in the past four weeks
3.Often (more than ten times in the past four weeks)
5. Did you or any other household member eat
a smaller meal than you felt you needed
because there was not enough food?
0= No (Skip to Q6)
1= Yes

220
5.a. If yes how often? 1.Rarely (once or twice in the past four weeks)
2.Sometimes (three to ten times in the past four weeks
3.Often (more than ten times in the past four weeks)
6. Did you or any household member eat fewer
meals in a day because there was not enough
food?
0= No (Skip to Q7)
1= Yes
6.a. If yes how often? 1.Rarely (once or twice in the past four weeks)
2.Sometimes (three to ten times in the past four weeks
3.Often (more than ten times in the past four weeks)
7. Was there ever no food at all in the
household because there were no resources to
get more?
0= No (Skip to Q8)
1= Yes
7.a. If yes how often? 1.Rarely (once or twice in the past four weeks)
2.Sometimes (three to ten times in the past four weeks
3.Often (more than ten times in the past four weeks)
8. Did any household member go to sleep at
night hungry because there was not enough
food?
0= No (Skip to Q9)
1= Yes
8.a. If yes how often? 1.Rarely (once or twice in the past four weeks)
2.Sometimes (three to ten times in the past four weeks
3.Often (more than ten times in the past four weeks)
9. Did any household member go a whole day
without eating anything because there was not
enough food?
0= No
1= Yes
9.a. If yes how often? 1.Rarely (once or twice in the past four weeks)
2.Sometimes (three to ten times in the past four weeks
3.Often (more than ten times in the past four weeks)
405. Now I would like to ask you about your household's food supply during different
months of the year. In the past 12 months, were there months in which you did not have
enough food to meet your family's needs?
1-Yes
2-No
Which were the months in the past 12 months in which you did not have enough food to
meet your family needs?
(Do not read the list of months. Mark with a check-mark those that respondent mentions)
January
February
March
April
May
June
July
August
September
Household wealth and asset-ownership
412 Item Number Item Number
Does anyone in your household own
any of the following assets? If yes,
how many of each asset does the
household own?
(While asking, also observe)
1 Bed 11 Motor –boat
2 Table 12 Canoe
3 Chairs 13 Fishing nets
4 Mattress 14 Hoe
5 Generator 15 Ox-plough

221
6 Radio/tape 16 Motorcycle
7 Cell phone 17 Television
8 Sewing
machines
18 Tractor
9 Bicycle 19 Solar panel
10 Car 20
412a. Number of
rooms on house
1.One-roomed
2.Two-roomed
3.More than two
rooms
412b. House
ownership
1.Owned
2.Rented
412c. Electricity
1.Present
2.Not present
412d. Are walls
made of concrete?
1.Yes
2. No
412e.What are the
wall made of ?
1.Burnt bricks
2.Unburnt bricks
3.Mud walls
4.Concrete blocks
412f. Floor
is finished
with
cement?
1.Yes
2. No
412g. Type of
roof
1.Iron sheets
2.Tiles
3. Grass
413.(512) In general, how happy would you say you are?
1. Very happy 2. Pretty happy 3. Not too Happy
Section 5: MF recipient personality characteristics
Time preference
Could you please tell me whether you agree or disagree that these statements describe you personally
501 502 503
I only focus on the short term.
1. Agree
2. Disagree
I live more for the present day than for
tomorrow
1. Agree
2. Disagree
The future will take care of itself
1. Agree
2. Disagree
Do you agree/disagree with this
statement strongly or to some extent?
1. Strongly
2. To some extent
Do you agree/disagree with this
statement strongly or to some extent?
1. Strongly
2. To some extent
Do you agree/disagree with this
statement strongly or to some
extent?
1. Strongly
2. To some extent
Need for achievement motivation
For each of the following statements, indicate whether the statement is a true reflection of yourself.
504 505 506 507
I get restless /annoyed
when I feel am wasting
time
1.Agree
2.Disagree
I have always worked hard
in order to be among the
best in my village
1.Agree
2.Disagree
I am an ambitious person
1.Agree
2.Disagree
Improving my life is
important to me.
1.Agree
2.Disagree
Do you agree/disagree
with this statement
Do you agree/disagree
with this statement
Do you agree/disagree
with this statement
Do you agree/disagree
with this statement

222
strongly or to some extent?
1. Strongly
2. To some extent
strongly or to some extent?
1. Strongly
2. To some extent
strongly or to some extent?
1. Strongly
2. To some extent
strongly or to some extent?
1. Strongly
2. To some extent
Risk preference
In life, we may have to take decisions to participate in activities that have uncertain outcomes. One example is
investment of funds into activities even when we are not sure of the outcomes. The outcomes may be good and we
make profit. The outcomes may be bad and we lose all funds invested.
Another example of an uncertain outcome is also given here: An individual asks you for your chair, hoe, spraying
pump and promises to return it the next day with a one hundred thousand shilling. If he brings it back with the
money, you stand to gain. However he may not and you lose your items. In situations like these different people
decide differently.
The next questions assess how you deal with situations like these in life; that have uncertain outcomes.
508 509 510 511
I enjoy taking part in
decisions with uncertain
outcomes
1.Agree
2.Disagree
I avoid activities whose results
depend on chance or whose
outcomes are uncertain
1.Agree
2.Disagree
To gain high profits in
business one should take
decisions even when uncertain
of the outcomes.
1.Agree
2.Disagree
Would you invest
all of monthly
profit in a new
business venture
1. Yes 2. Not
sure
3. No
Do you agree/disagree
with this statement
strongly or to some
extent?
1. Strongly
2. To some extent
Do you agree/disagree with
this statement strongly or to
some extent?
1. Strongly
2. To some extent
Do you agree/disagree with
this statement strongly or to
some extent?
1. Strongly
2. To some extent
Do you
agree/disagree with
this statement
strongly or to some
extent?
1.Strongly
2.To some extent
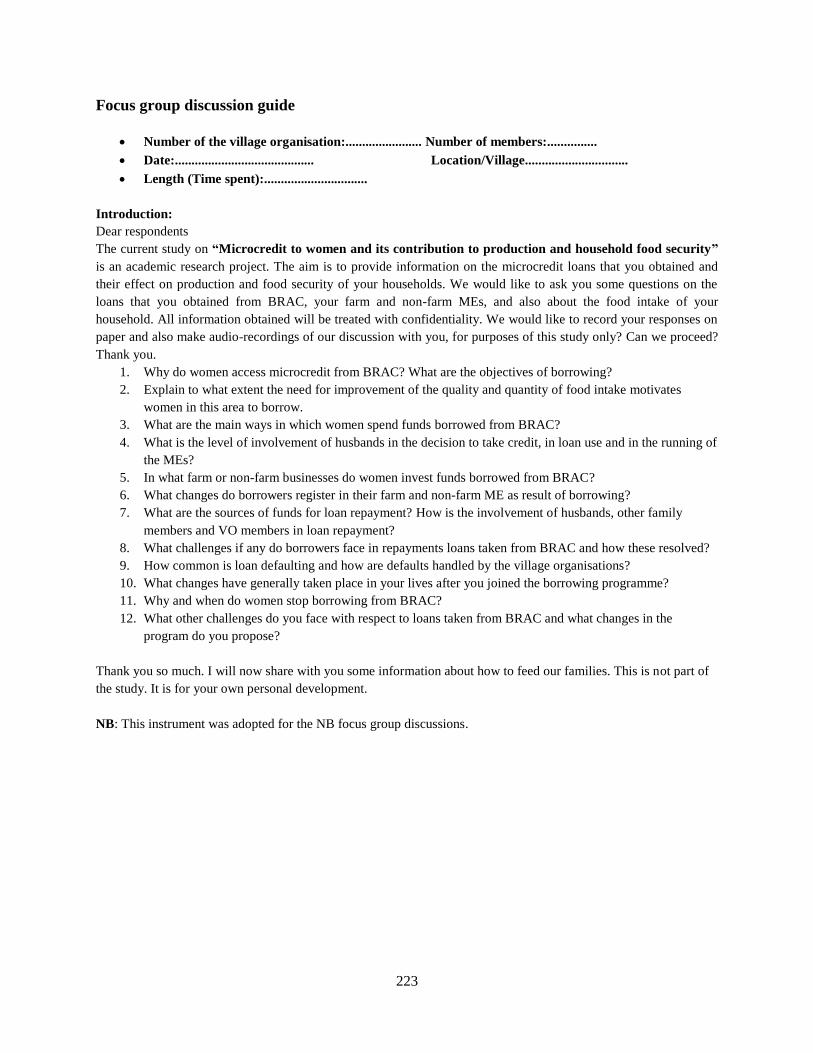
223
Focus group discussion guide
Number of the village organisation:....................... Number of members:...............
Date:.......................................... Location/Village...............................
Length (Time spent):...............................
Introduction:
Dear respondents
The current study on “Microcredit to women and its contribution to production and household food security”
is an academic research project. The aim is to provide information on the microcredit loans that you obtained and
their effect on production and food security of your households. We would like to ask you some questions on the
loans that you obtained from BRAC, your farm and non-farm MEs, and also about the food intake of your
household. All information obtained will be treated with confidentiality. We would like to record your responses on
paper and also make audio-recordings of our discussion with you, for purposes of this study only? Can we proceed?
Thank you.
1. Why do women access microcredit from BRAC? What are the objectives of borrowing?
2. Explain to what extent the need for improvement of the quality and quantity of food intake motivates
women in this area to borrow.
3. What are the main ways in which women spend funds borrowed from BRAC?
4. What is the level of involvement of husbands in the decision to take credit, in loan use and in the running of
the MEs?
5. In what farm or non-farm businesses do women invest funds borrowed from BRAC?
6. What changes do borrowers register in their farm and non-farm ME as result of borrowing?
7. What are the sources of funds for loan repayment? How is the involvement of husbands, other family
members and VO members in loan repayment?
8. What challenges if any do borrowers face in repayments loans taken from BRAC and how these resolved?
9. How common is loan defaulting and how are defaults handled by the village organisations?
10. What changes have generally taken place in your lives after you joined the borrowing programme?
11. Why and when do women stop borrowing from BRAC?
12. What other challenges do you face with respect to loans taken from BRAC and what changes in the
program do you propose?
Thank you so much. I will now share with you some information about how to feed our families. This is not part of
the study. It is for your own personal development.
NB: This instrument was adopted for the NB focus group discussions.

224
Summary
The general objective of this study was to assess the contribution of microcredit to women in
Uganda to production and household food security and to determine the factors that enhance or
limit food security outcomes.
Food insecurity as indicated by levels of food availability, food access and nutritional status
remain a big challenge in Uganda. While the majority of the population rely on subsistence
agricultural production as a source of food and livelihoods, food availability is hampered by
among others unpredictable weather patterns, depleted soils, and limited use of agricultural
inputs, that all impair optimal agricultural production. Food access on the other hand is hampered
by high food prices, and high levels of poverty. As a method of survival, people in rural areas
supplement agricultural activities with non-farm self-employment activities. Despite many
societal, cultural and economic limitations they face, women play key roles in household food
security and livelihood maintenance. They have thus attracted the attention of many government
and non-government partners, who aim at improving the welfare of the poor. With the majority
of the rural poor being unbanked, lack of credit is commonly cited as a hindrance to development
of agricultural and non-farm activities. Provision of microcredit to women in agrarian
communities is promoted as a means to transform rural livelihoods, leading to income and food
security. However, despite all the enthusiasm about the potential benefits of microcredit,
evidence for its beneficial effects remains mixed. Observed effects are context-specific, with
indications that microcredit may not be a silver bullet to transform the lives of the rural poor, and
may not be as beneficial as previously thought. The purpose of this study was to contribute to the
on-going debate by evaluating the contribution of microcredit to agricultural production,
microenterprise performance, food security, and the factors associated with recorded outcomes.
225
The study was conducted among female microcredit recipients of BRAC, one of the largest
micro lenders in Uganda, with operations in rural areas. To the best of our knowledge no such
study had been conducted among female agrarian borrowers in Uganda before. The study is
unique in its focus on rural agrarian female borrowers. Most studies on microcredit have been
done in Asia, where the microfinance movement started. The study entailed two alternative
methods of evaluating outcomes of microcredit. The overall study design was a panel approach,
involving two waves of data collection. In one analytical approach, baseline data for a group of
existing borrowers (Old borrowers=OB) and incoming borrowers (New borrowers=NB) before
they received their first loan, was used in a quasi-experimental cross-sectional design to assess
the effect of borrowing as the difference between the two groups using propensity score
matching.
In an alternative approach, two waves of data for the NB and a control group (CG) of women
who never borrowed from BRAC or other MFI, was subjected to difference-in-difference
analysis (DID), with Kernel matching, to assess differences between borrowers and non-
borrowers.
In Chapter 2 we investigate the extent to which the objectives and design of the BRAC
microfinance program match the expectations, context and characteristics of female borrowers.
We found that BRAC uses a modified ‘Grameen-like’ group-lending model to provide small,
high-interest rate production loans, and follows a rigorous loan processing and recovery
procedure. BRAC microfinance clients are mainly poor subsistence farmers who derive income
from diverse farming and non-farm activities. The major objective to borrow is to meet lump-
sum monetary needs usually for school fees and building expenses, and for investment in
informal small non-farm businesses. Many borrowers use diverse sources of funds to meet

226
repayment obligations. Although defaulting on loans is quite rare, stress caused by weekly loan
repayment and resolution of lump-sum cash needs were identified as reasons for women to stop
borrowing. Limited loan amounts, the diversion of loans to non-production activities, the size of
the businesses, and the weekly recovery program without a grace period were identified as
constraints which may diminish the contribution of microcredit to ME expansion and income
increase.
Chapter 3 provides results of our investigation of the effects of microcredit on the
performance of non-farm microenterprises (MEs) run by small-holder female farmers. We did
this for respondents with non-farm MEs. We compared parameters for new borrowers (NB),
before and after they received their first loan, and a control group (CG) of women who never
received credit. In an alternative approach, baseline data from current borrowers (OB) was
compared to NB data. Differences between OB to NB parameters were obtained using propensity
score matching (PSM). PSM revealed positive effects of microcredit on funds used to restock
businesses, and on the monetary value of the MEs. Furthermore, we found older, unmarried, and
risk-averse females to obtain relatively low profits from their MEs. No evidence of improvement
of profits from MEs, which is needed for food security improvement of households, was
recorded. This is probably due to the short time period of analysis.
In chapter 4 we assessed changes in expenditure and outputs for agricultural production (crop
and animal production) when women access microcredit. We used a quasi-experimental design
with both quantitative and qualitative survey methods to obtain socio-demographic, personality
and microenterprise (ME) characteristics of existing borrowers (OB) and incoming borrowers
(NB) before they received their first loan. To assess the effect of microcredit, we measured
production input expenditures for crop and animal production, crop harvests in the season before
227
the study, and the animal wealth for the respondents. We used propensity score matching to
assess differences between OB and NB groups. While the lack of credit is widely considered a
constraint to agricultural production for resource-constrained female farmers, PSM results
revealed lower recurrent crop production input expenditures for current borrowers than in-
coming borrowers. Current borrowers also spent more time on garden work and yet had lower
monetary value of harvested crops than in-coming borrowers. Likewise, we found no evidence of
increase in input expenditures for animal production after borrowing. The numbers of borrowers
that kept most of the common animal types was lower than that for non-borrowers. Monetary
worth of some commonly kept animals was also lower for borrowers. The subsistence nature of
female crop and animal production does not seem to have room for extra investment and
commercialisation. The nature of production, coupled with the risky nature of agricultural
enterprises, could be a discouraging investment of microloans in farming activities. The need for
weekly loan repayment may promote engagement in non-farm activities, at the expense of crop
production, leading to lower harvests among borrowers. The negative trend in animal production
was also probably for the same reasons. In addition, the sale of animals to obtain funds for loan
repayments may explain the depletion of animal stocks.
In chapter 5 we investigate the effects of participation of women in a microcredit program on
household food security parameters of female borrowers. We explore the modes of food
acquisition, dietary diversity, calorie and protein intake, and qualitative food insecurity measures
for different categories of respondents. Results revealed a decline in food security following the
uptake of microcredit. In particular, the analysis reveals robustly lower dietary diversity among
long-time borrowers than among new borrowers, and larger reductions in dietary diversity scores
among new borrowers, after one year, compared to controls. The reduction in dietary diversity
228
was traced to a reduction in animal-source food, fruit and sugar intake. This may be partly
explained by an apparent shift from own production to reliance on food purchase by households,
which is not accompanied by substantial increase in income. The burden of loan repayment and
other household members relegating the burden of food provision to women after borrowing may
further explain the observed result.
In chapter 6 we discuss the key findings of the study. While we find increase in monetary
value of borrowers non-farm MEs, investment in farming MEs and other ME performance
indicators did not improve. Overall, we find that taking microcredit did not lead to improved
farm and non-farm income or food security among the rural women borrowers studied. This may
be because of extreme poverty among borrowers and the loan conditions which are not
conducive for investment in agriculture. The periods covered by the analysis is relatively short (1
year for the DID analysis and average of 97 weeks for PSM). Studies over longer periods are
recommended to establish long term outcomes of microcredit in similar resource-constrained
settings.

229
Acknowledgements
I am highly indebted to the Netherlands government, under the Nuffic Programme, for
funding my PhD project and the SEPON Foundation for providing supplementary funding. I
sincerely thank Kyambogo University for granting me study leave to undertake the PhD project.
I thank my promotor Prof. Gerrit Antonides for taking me under his wing and guiding me on
the project. I appreciate all the support accorded to me in the different stages of the project; from
the time I applied for the PhD grant, to my promotion ceremony. I appreciate your dedication to
the advancement of my work, the timely and quality comments you always gave me, the
continuous guidance and the mentoring that enabled me to improve my scholarly, analytical and
writing skills. Your expertise, kindness and gentle demeanor were invaluable to successful
completion of my PhD.
I also acknowledge the support and contribution of my co-promotor Dr. Johan van Ophem.
Your valuable inputs in the many brainstorming; data analysis and drafts review sessions of my
work, greatly enriched this thesis. In addition, you and your family extended a hand of friendship
to me at the time when I needed it most. In this regard, I extend my heartfelt thanks to you,
madam Roelien Timmerman and Julia, for the kind hospitality, love and sharing that enriched
my experience of the Netherlands’ unique culture, including its special water management
systems.
Members of the committee, Prof. Dr Niehof, Prof. Dr Bulte, Prof. Dr Heijman and
Prof. Dr de Graaf, thank you for accepting to be part of the thesis reading committee and the
public defence.
I am also grateful to the research office of BRAC Uganda whose desire to improve the lives
of the poor women they serve, permitted me to work with their microcredit clients. Special

230
thanks go to Ricardo and Munshi and the loan officers of the Mukono 1 and Mukono 2,
Nkokonjeru, Buikwe, Kasawo and Lugazi, who linked us to the study respondents. I am very
grateful to the study respondents; who patiently sat through the long questionnaire interviews
and provided the data for the study.
Special thanks go our team of research assistants who braved the tropical weather and terrain
in search of study participants. The resilience of Seera, Namasaba, Afra, Enoch and Lwanga
Ausi, enabled us to obtain quality data. I also thank Hong, for her quality input in data analysis.
I am deeply indebted to the administrative team of the Economics of Consumers and
Households chair group; Karen, Dineke, Gre and Betty, for the enduring and warm welcome
each time I approached you. I greatly appreciate the support you accorded me on this project. I
also thank other colleagues in the friendly chair group of Economics of Consumers and
Households; Michelle, Pierre, Jannette and Anouk for the special and ever friendly chair group
support. Special thanks go to my office mates Muriel, Ernst-Jan, Jiaqi, and Lieke for making the
office a conducive place to work. Manon, I treasured the times we shared the office and our out
office interactions. Thank you for the friendship and the sharing. I would like to thank Corry for
support with End-note and Jack Peerlings for his support under the PhD mentoring program.
Special thanks go to Francesco, for the insightful discussions and contributions that enriched the
microfinance debate in the thesis and for his input in panel data analysis and the food security
chapter. I am also grateful to Muriel and Nico who reviewed my chapter drafts and provided
invaluable comments and suggestions. I thank Marion for the support with illustrations of my
work, Billy and Gerald for designing the thesis cover page.

231
Valerie, Aisha and Agbeko, I will always treasure your special and warm comradeship,
fellowship and support. Thanks to Prossy, John, Okello, TauB, Stella, Christina, Onzima,
Zacharia, Maria, Margaret, Dawitt, Florence, Leah, Daniel, Nsibo and Nsubuga for the support
and encouragement. Special thanks go to my bible study friends; Tabby, Nowella, Jaap, Doortje,
Felicidade, Chris and Tilly. Tabby and Ernst-Jan thanks for accepting to be my paranymphs.
I am ever grateful to my late father Charles Mayanja for believing in me. It hurts that you did
not live to see me graduate. Thanks go to my Kooki and Bulucheke families; Maria, Clet and
Sylivia, my mother, mother-in-law and father-in-law, and siblings. I also thank Immaculate,
Aida, Mujuzi, Lwanga, Kissa, Wambede, other members of the Cornerstone family and
colleagues at Kyambogo University for keeping the work we do together going in my absence.
Special thanks go to my friend and neighbour Allen for the unwavering motherly support to my
children. I also thank Shiwuma, Mercy, Otim and Florence for the support to my son Samwiri,
during my absence.
Last but not least I would like to thank my Khafu-Muyonga family for standing with me on
this journey. My children Atiila, Aliinda and Muyonga Samwiri, stood with me and kept me in
their thoughts and prayers, as they tried to make sense of my long absences because of my
scholarly pursuits. Having watched at close range my aspirations, struggles and achievements
leave me no doubt that you will emulate and strive for greater heights. The two Nakuya’s, thank
you for keeping-fort and taking care of my children, during my absence. In a special way, I
would like to express my profound and sincere gratitude to my husband John Muyonga. Thank
you for being a single-father to our children during my absence. Thank you for the emotional
support and mentoring during my study. You encouraged me, motivated me, rebuked me, and yet
held my hand from the beginning to the end of this journey.
232
About the author
Faith MM Namayengo was born in Masaka, Uganda. She attended Luwero Girls Primary
School, (Luwero) and St. John Bosco Katende Primary School, (Mpigi). She attained Uganda
Certificate of Education (UCE) and Uganda Advanced Certificate of Education (UACE) from
Kings College Budo, from where she enrolled into Makerere University and pursued BSc Food
Science and Technology. Upon graduation, she started her working life as Fisheries Officer in
the Ministry of Agriculture, Animal Industry and Fisheries, in which she worked as a Fisheries
Inspector, before settling down to an academic career as a lecturer, Department of Human
Nutrition, Kyambogo University.
In 1994, Faith graduated with a post graduate Diploma (Distinction), in Maternal and Child
Nutrition: The Prevention of the Main Nutrition Disorders in the World. This was supported by
the Netherlands Fellowship Program. In 1997, she was awarded UNU scholarship to pursue MSc
Applied Human Nutrition, University of Nairobi Kenya. Her M.Sc. research was entitled
“Substitution of milk with lactic-fermented maize and beans, in the diet for severely
malnourished children (6-59 months).” In 2004, under the Fulbright Fellowship Program, Faith
took post graduate Nutrition Science courses at the University of Alabama, Birmingham. In
2012, Faith enrolled as a PhD candidate in Wageningen University. She currently stays in
Kampala, Uganda with her family.

233
Completed Training and Supervision Plan
Wageningen School of Social Sciences (WASS)
M. Mayanja Faith Namayengo
Name of the learning activity Department/Institute Year ECTS*
A) Project related competences
Quantitative Research Methods and
Statistics, MAT 22306
WUR 2013 6
Qualitative Data Analysis, YRM 60806 WUR 2013 6
Summer school: Experiments in
developing countries
University of Groningen 2
B) General research related competences
WASS Introduction Course WASS 2012 1
‘Influence of microcredit on farming and
non-farming enterprises in rural agrarian
communities’
WASS PhD Day conference
and
Food in the bio-based economy,
Sustainable Provision and Access,
Wageningen
2015 1
Working with EndnoteX5 WUR Library 2012
Research Design and Research methods,
YRM 20806
WUR 2012 6
Research Methodology Course: Topic to
proposal
WASS 2012 4
Information Literacy for PhD including
Endnote
WUR Library 2013 0.6
Writing PhD Research Proposal WUR 2012/2013 6

234
C) Career related competences/personal development
Techniques of Writing and Presenting a
Scientific paper
WGS 2012 1.2
Project and Time management WGS 2012 1.5
Scientific Publishing WGS 2016 0.3
MCB/ECH/RME PhD Colloquia WUR 2012/2013 1
Economics cluster seminar series Economics 2012/2013 1
Total 37.6
*One credit according to ECTS is on average equivalent to 28 hours of study load

235
Funding
The research described in this thesis as well as printing and other associated costs was financially
supported by the Nuffic Netherlands Fellowship Program.
Financial support from the SEPON Foundation for longitudinal data collection is also
acknowledged.