Microcomputer application to compute a ship's draft and … · ·...
116
MICROCOMPUTER APPLICATION TO COMPUTE A SHIP'S DRAFT AND LONGITUDINAL STRESS Daniel Samuel Gomez
Transcript of Microcomputer application to compute a ship's draft and … · ·...

MICROCOMPUTER APPLICATION TOCOMPUTE A SHIP'S DRAFT AND
LONGITUDINAL STRESS
Daniel Samuel Gomez

WHWEWOOi

NAVAL POSTGRADUATE SCHOOL
Monterey, California
THESISMICROCOMPUTER APPLICATION TOCOMPUTE A SHIP'S DRAFT AND
LONGITUDINAL STRESS
by
Daniel Samuel Gomez
March 1977
Thesis Advisor: R . W . Hamming
Approved for public release; distribution unlimited.
T17710


SECURITY CLASSIFICATION OF THIS PAGE (Wnon Data 1Sntered)
REPORT DOCUMENTATION PAGE READ INSTRUCTIONSBEFORE COMPLETING FORM
t. REPORT NUMICR 2. GOVT ACCESSION NO. 1. RECIPIENT'S CATALOG NUMBER
4. TITLE (and Submit)
Microcomputer Application to Computea Ship's Draft and Longitudinal Stress
5. TYPE OF REPORT 4 PERIOD COVERED
Master's Thesis;March 1977
* PERFORMING ORG. REPORT NUMBER
7. AuTHORC»J
Daniel Samuel Gomez
• . CONTRACT OR GRANT NUMBER^
9. PERFORMING ORGANIZATION NAME ANO ADDRESS
Naval Postgraduate SchoolMonterey, California 93940
10. PROGRAM ELEMENT. PROJECT, TASKAREA * WORK UNIT NUMBERS
It. CONTROLLING OFFICE NAME AND ADDRESS
Naval Postgraduate SchoolMonterey, California 93940
12. REPORT DATE
March 197713. NUMBER OF PAGES54
14. MONITORING AGENCY NAME * AOORESSfl/ ditlarant from Controlling Offic»>
Naval Postgraduate SchoolMonterey, California 93940
IS. SECURITY CLASS, (ot thla raport)
Unclassified
11*. DECLASSIFICATION/ DOWNGRADINGSCHEDULE
l«. DISTRIBUTION STATEMENT (oi thlm Report)
Approved for public release; distribution unlimited.
17. DISTRIBUTION STATEMENT for tha aaatract antarad In Slock 30, It dlHarant ham Raport)
IS. SUPPLEMENTARY NOTES
19. KEY WORDS (Confirm* on rararaa alma II naeaaaarr and idantHy by 'lock nummor)
20. ABSTRACT (Continue on rarerae aim* It nacoeemry and Identity o? aleak rnmmoot)
The paper introduces an algorithm capable of computing a ship'sdraft and stress on a small computer system or programmable calcu-lator. The report has also demonstrated how the large amount ofdata in the ship's capacity tables can be effectively reduced forincorporation into the program. The algorithm was implemented inthe BASIC language and was intended to require the minimum of userinteraction while providing the maximum useful output.
DO ,^:M7, 1473
(Page 1)
EDITION OF 1 NOV «• IS OBSOLETES/N 0102-014-6601
|
SECURITY CLASSIFICATION OF THIS PAGE (Whan Data Bntared)

Microcomputer Application to
Compute a Ship's Draft andLongitudinal Stress
by
Daniel Samuel QpmezLieutenant, United States Navy
B.S., New Mexico State University, 1969
Submitted in partial fulfillment of therequirements for the degree of
MASTER OF SCIENCE IN COMPUTER SCIENCE
from the
NAVAL POSTGRADUATE SCHOOLMarch 1977
/

—-'WWIMTESCHOOl
ABSTRACT
The paper introduces an algorithm capable of computing
a ship's draft and stress on a small computer system or pro-
grammable calculator. The report has also demonstrated how
the large amount of data in the ship's capacity tables can
be effectively reduced for incorporation into the program.
The algorithm was implemented in the BASIC language and was
intended to require the minimum of user interaction while
providing the maximum useful output.

\

TABLE OF CONTENTS
I. INTRODUCTION 6
II. NEED FOR A COMPUTER APPLICATION - 8
III. BACKGROUND - 10
IV. NATURE OF THE PROBLEM --- 21
A. ANTICIPATED PROBLEM AREAS 21
B. PROPOSED SOLUTIONS - --- 25
V. PROGRAM IMPLEMENTATION --- 31
VI. PROGRAM TESTING -- 35
VII. CONCLUSIONS 37
APPENDIX A
APPENDIX B
PROGRAM LISTING - --- 40
SAMPLE PROGRAM RUN 50
APPENDIX C: SAMPLE OF INITIALIZING DATA 52
BIBLIOGRAPHY 53
INITIAL DISTRIBUTION LIST - 54


LIST OF FIGURES
1 Trochoidal Curve 15
2 Deadweight Scale/Trim Table 17
3 Table for Estimating Longitudinal Stress 18
4 Correction for Change in Displacement 20
5 Tank Shape vs. Capacity Curve Shape 24
6 General Difference Table 27
7 Sample Tank Difference Table 28
8 Memory Allocation Map 36

I. INTRODUCTION
This paper develops a computer application to enhance
the speed, accuracy and ease with which the calculation of
a ship's draft and longitudinal stress can be made. The
calculations are based on the user's input of the desired
loading of the ship.
This application was designed to allow the user to first
make any changes desired concerning the ship's load distribu-
tion, and then automatically calculate and display the ship's
new draft and stress condition based on these changes. The
program then queries the user if he desires a hard copy of
the present load distribution and the associated draft and
stress conditions. The program then loops back to the be-
ginning and asks if the user wishes to perform further
calculations or desires to terminate. The program redisplays
input values to the user to verify that the correct input
was entered.
The principle reason for using a computer in this area
is that it tends to reduce errors made in the recording,
computing and transferring of data in the numerous calcula-
tions. The amount of input information required from the
user is minimized in order to reduce human error.

The first step in this research was to find out how
to reduce the standard extensive table of numbers to a
volume small enough to be stored in a small computer system.
The word "computer" as used in this paper has been used to
refer to a small microcomputer system as well as the desk
top programmable calculators capable of having extended
memories. It was also necessary to provide the output in
a form acceptable for record keeping to eliminate errors
in transferring data.


II. NEED FOR A COMPUTER APPLICATION
The calculation of a ship's draft and stress condition
involves the extraction of information from various tables.
This information along with the ship's present load distri-
bution determines the ship's loading condition.
In principle the mathematics involved are relatively-
simple, but due to the number of calculations required,
along with the many table lookups and transfers of data, a
high probability exists that errors may occur. Depending
upon the number of changes occurring to the load distribu-
tion between calculations, the entire process could involve
140 table entries and transfer of data, 280 additions and
subtractions, and 280 multiplications and divisions.
In order to insure optimum loading of the ship in
situations where a proposed load change of the ship is
being anticipated, several different loading plans have to
be evaluated to find the best resultant draft and stress
conditions . Owing to the repetitive nature of the calcu-
lations , it is very easy to skip a line of computation or
even include the same line of computation more than once
in the final result. Furthermore, manual calculation time,
even for an experienced individual, can take over an hour
8

y

for each loading plan configuration (allowing for the check-
ing of all calculations) and thus restricts the number of
proposed load changes that can be considered. Unfortunately-
even after the calculations have been checked, it still
happens that an error passes undetected and can cause a
sizeable error in the final results.
A computer program which calls for the minimum amount
of input from the user can greatly reduce the chance of
human error as well as quickly provide a mathematically
correct answer. Another advantage is that the output can
be printed in a form suitable for record keeping.

III. BACKGROUND
The ship's data used in this paper was taken from the
AOR-1 class fleet replenishment oiler, with the tank capacity-
tables coming from the U.S.S. Wichita (AOR-1). This was
done for several specific reasons. The ship was undergoing
a restricted availability in San Francisco which meant it
would be stationary for an extended period of time, and as
the author's last duty station, access to the required
information was easy. The AOR-1 class ship represents a
specific case where an application, such as the one proposed
in this paper, is definitely needed. Being a cargo type ship,
the load condition of the ship can often change by large
amounts from day to day and even hour to hour. Prior to
any changes being made, the resultant draft and stress must
be computed and submitted to the commanding officer for his
approval. After the change is made, the actual resulting
draft and stress condition must again be calculated for
record purposes.
During the ship's construction in the late sixties, a
device called a "LODICATOR" was designed for the ship's
class as a draft and stress computer at a cost of $100,000.00
per device. The device allowed the user to enter the current
10


load distribution by entering the appropriate tonnage of
each space on the dial for each space. After all the load
information was entered, several switches and dials had to
be operated to obtain the desired results. All output
appeared on meters, and the results had to be copied by
the user. In January, 1973, it was determined by the Naval
Ship Systems Command that the "LODICATOR" only produces»
accurate results for Stillwater conditions and has no
validity for actual underway sea conditions. Therefore,
its use was discontinued leaving only strictly manual methods.
To date, no solution has been found that would correct the
problems and make the "LODICATOR" useful.
Since the basic principles for determining the draft
and stress were the same no matter what type ship is under
consideration, using the methods presented here, the same,
or equivalent computations can be done on small, inexpensive
computers
.
In simple terms, the draft of a ship is merely an indi-
cation of the number of feet and inches that the ship extends
below the surface of the water. The draft is determined
for both the forward and after ends of the vessel. The
trim is the difference in the drafts of the two ends of
the ship. The trim is said to be "by the stern" if the
after draft is greater than the forward draft and if the
1
1

\

opposite is true, the trim is said to be "by the head."
If the drafts, both forward and aft are the same, the ship
is said to be "on an even keel." It is of utmost importance
to know accurately the ship's draft in order to know the
amount of water under the vessel as well as how to expect
the ship to handle in various weather conditions.
It is obvious that it is also necessary to know the stress
on a ship in order to prevent structural damage and possible
loss of the ship in rough weather. Structural failure of
the ship's girder may be due to one or a combination of
cracking, fatigue failure and instability.
Within a ship, structural stresses are usually consid-
ered in two groups. First, hull girder stresses result
from the differences between the upward buoyancy forces of
the sea and the downward forces resulting from the distri-
bution of the various weights within the ship including the
ship structure itself. Second, local stresses are caused
by hydrostatic pressure, concentrated loads of equipment
and dynamic loading. It is hard to conceive of a situation
where the forces due to gravity and water pressure exactly
cancel out along the entire ship's length. Even in still-
water, this is exceedingly unlikely. There is, therefore,
an uneven loading along the ship and, because the ship is
an elastic structure, it bends. In a seaway, a vessel is


similar to a beam with supports and distributed loads. The
supports are the forces from the waves and the load is the
weight of the ship and its cargo.
The worst condition of loading and support for a ship
occurs when the ship heads into or away from the sea with
waves approximately equal in period to the length of the
ship. When a ship's bow and stern are each riding a crest,
and the midships is in a trough, then the ship will bend
with compression and the main deck and tension in the keel.
The ship is then said to be "sagging" and the main deck
tends to buckle due to compressive stress, while the keel
stretches due to tensile stress. When the wave is advanced
by half its length so that the crest is amidships, and the
bow and stern are in troughs, then the stresses are reversed.
The main deck is in tension and the keel area is in com-
pression. In this condition, the ship is said to be
"hogging." The stresses occurring when experiencing
hogging and sagging conditions are also known as "longitudinal
stress ."
It is important to understand that longitudinal stresses
also exist in still water conditions due solely to the
loading of the ship. However, a far greater concern arises
when the action of the waves adds to the Stillwater stresses.
It is supposed that a ship never meets a sea which imposes


more severe bending on the ship than that caused by a single
wave such that the distance from crest to crest is equal to
the length of the vessel. The ship is assumed to be momen-
tarily stationary, balanced on the wave with zero velocity
and acceleration, and the response of the sea is taken to
be that appropriate to static water. There is no universally
accepted standard ocean wave which may be assumed for the
standard longitudinal strength calculation. While the shape
of the troughs is agreed to be trochoidal, the ratio of
length to height varies. A trochoid is a curve produced
by a point at radius "r" within a circle of radius "R"
rolling on a flat surface (see Figure 1).
The starting point for determining a ship's draft and
stress condition is to find the location and magnitude of
all weights which are not actually part of the ship's
structure. This includes cargo, water, fuel and ammunition.
Determining the draft of the ship while not underway
requires only visual observation of the draft marks from
the pier or a ship's boat. This process becomes more diffi-
cult when the ship is underway for extended periods of time.
The most important step in accurately determining the draft
is determining the exact disposition of all weights on
board and obtaining an accurate visual draft just prior to
the ship getting underway. This information is recorded


DIRECTION OF MOTION
Figure 1. Trochoidal Curve
15

and is used as "day 1" data. Each day underway, the draft
is determined relative to the day 1 data. While underway,
all changes to the distribution of weights are recorded,
such as the amount of cargo transferred to other ships,
water consumed and produced on board, and the amount of
fuel consumed. The amount of change in long tons is deter-
mined for each location which has changed since day 1. Next,
the ship's "Deadweight Scale" or "Trim Tables" are entered.
These two names refer to the same table, which is con-
structed by the ship's builder. This table contains the
information to calculate the change in draft based on
changing a specific number of tons in a specific location.
Figure 2 represents a portion of the trim table/deadweight
scale for the U.S.S. Wichita (AOR-1)
.
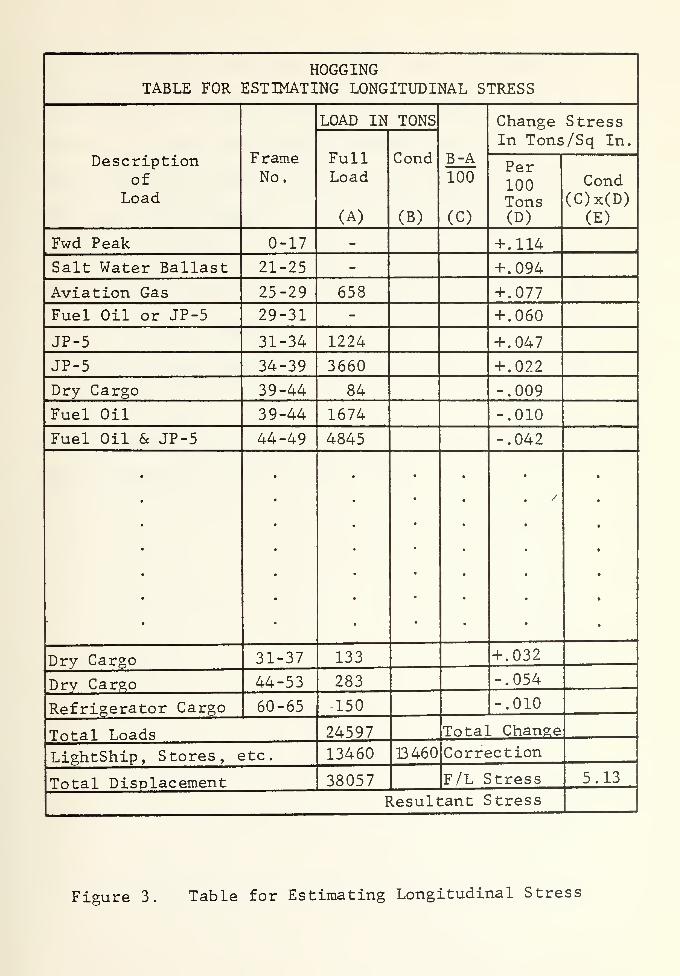
The stress of the ship is based upon the present load
distribution. Tables are provided in the ship's damage
control book for the calculation of longitudinal stress in
the Stillwater, hogging and sagging conditions. The three
tables are essentially the same except for column D which
represents the change in stress per 100 tons. Figure 3 is
a portion of one of the tables to help in the discussion of
the calculations . The present load in long tons was entered
into column B for each location. Column A was subtracted
from column B and the result divided by 100 and entered into
16


Hfa Hi< OS05 < CO
00 rH CM ON ^ m vO vOrH O O r^ o r^ <f CO
Q £ W CT> CO i—l CO 00 CO CM CM33
W Pd U r^« vO m <j\ ON vo r-l i—
1
O W 2 rH i—
i
CM CM i—l i—l
2 H M i 1 i i 1 1 1 1
pa <
Hfa COWECU53
Si
O2
cj
fa
I^» r-« -cl- CM LO r*» 0> P^r-l <r in <f o t-i r*» vOo vO CO CO p- CO CO CO
o> 00 r>» o <f rH CO CO
1
rH1
rH1
rH1
CO CO rH1
rH1
I
oio<
COOSw>wrJ
CO
aofa
Q<
aofa
W<
fa
o25
U
fa
< H 05
wo
oi
COwaco2
COwPCo2
CJ
fafa
Q CO
3 2O OrJ H
uo
CO
COCM
CMmONCM
oo
CO
vO0000
00CM
00COvO
oCO
o>o>
oo>
COvO
COrH CO
CO
o> mvO
o OCO
OCO
o>voCO
vOCO
CMCM
oCM
CMo>O
OCM
o>vO
CMCO
CMCO
CO m m pH CM VO oo r-lo CO co CO CO o> i—
i
<f
00 O <f r^ CM m 00 r-CO r^ o CO co CM 00 00CM m vO <f vo
rHoCM
00 00
0)
rH,0cd
H£•HUH0)
I—
I
CO
aco
•u
J2CO•H<1)
%cd
Q
CM
u
60•Hfa
OO
1 *-i •"3 -5 •-3 •"3• o •-> •n >-i >-) •-)
o ^ 1 i i 1 l 1
rS 3 O1
m o1
o OI
rH1
CM1
^ i 1—1 m o> rH <t <f *tf
Eh
< CM CM CM CO CO CO CO
vO vO vO vO vO vO vO vO

HOGGINGTABLE FOR ESTIMATING LONGITUDINAL STRESS
Descriptionof
Load
FrameNo.
LOAD IN TONS
B-A100
(C)
Change StressIn Tons/Sq In.
FullLoad
(A)
Cond
(B)
Per100Tons(D)
Cond(C)x(D)
(E)
Fwd Peak 0-17 - + .114
Salt Water Ballast 21-25 - + .094
Aviation Gas 25-29 658 +.077
Fuel Oil or JP-5 29-31 - + .060
JP-5 31-34 1224 +.047
JP-5 34-39 3660 + .022
Dry Cargo 39-44 84 -.009
Fuel Oil 39-44 1674 -.010
Fuel Oil 6c JP-5 44-49 4845 -.042
/
Dry Cargo 31-37 133 + .032
Dry Cargo 44-53 283 -.054
Refrigerator Cargo 60-65 150 -.010
Total Loads 24597 Total Change
Lightship, Stores, etc. 13460 33 460 Correction
Total Displacement 38057 F/L Stress 5. 13
Resultant Stress
Figure 3. Table for Estimating Longitudinal Stress


column C for each location. Column C was multiplied by
column D and the result entered into column E. All the
values in column E were added together and the sum is the
total change in stress. Column B was totaled to produce
the ship's displacement. The ship's displacement was used
to enter the tables for change in displacement to determine
the correction factor to be applied (see Figure 4). The
total change in stress, the correction factor and the full
load stress were added to give the resultant stress which
must be less than or equal to a maximum limiting value.
This limiting value depends on the class of ship, and for the
AOR-1 class is 8 tons per square inch.

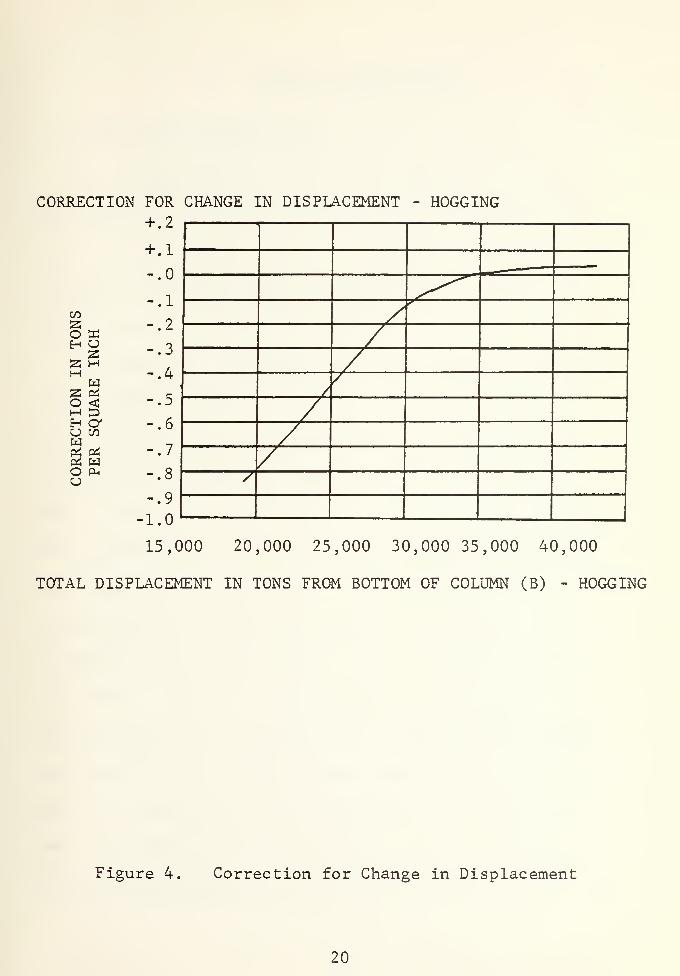
CORRECTION FOR CHANGE IN DISPLACEMENT - HOGGING
CO
o ash u2 Hw
2 2o <H DH CCJ COw3 wO Puu
+.1
-.0
-.1
-.2
-.3
-.4/
3±-. 5
r /-.6 /-.7
o /-.8 s-.9
i n
15,000 20,000 25,000 30,000 35,000 40,000
TOTAL DISPLACEMENT IN TONS FROM BOTTOM OF COLUMN (B) - HOGGING
Figure 4. Correction for Change in Displacement
20


IV. NATURE OF THE PROBLEM
A. ANTICIPATED PROBLEM AREAS
Past experience has shown that no matter how careful
one attempts to be while entering data, undetected errors
still manage to occur. One way to help this situation was
to require as little input as possible and to "echo" the
values back to the user for a check.
All tanks on a ship have associated capacity tables for
determining the amount contained in the tank. If a tank
has been fitted with a sounding tube, in which a tape can
be lowered to measure the depth of liquid ("sounding")
,
then a previously prepared table gives the capacity of the
tank corresponding to every inch of sounding. This table
was complicated by the fact that the sounding tube is
usually sloping, and may have bends in it, so that the
sounding tape does not show the vertical depth of liquid.
In order to construct this sounding table, a capacity curve,
to be explained later, must first be drawn. The sounding
tube itself was then measured and drawn on the same paper
and to the same scale as the capacity curve. The scale of
feet and inches was laid off on the sounding tube, and the
corresponding capacities read from the capacity curve. An
21

"ullage" is the distance from the tank top down to the
surface of the liquid in a tank. Since these measurements
deal with vertical distances, different tables must be pre-
pared. These tables are called ullage tables, and they
tabulate the capacity corresponding to a given ullage.
The type of tables used on a particular ship depends
on its construction and ships may in fact have both. In
either case, the capacity is recorded and the number of long
tons in the tank determined. This is merely the product
of the number of gallons times the density of the liquid
in the tank divided by 2240.
Each tank on each ship has its own unique capacity
table and each table contains anywhere from 100 up to
700 or more entries depending upon the depth of the tank.
From past personal experience, it is very easy to take the
wrong data from a table if great care is not used. Loca-
tion of the desired sounding/ullage is not difficult, but
the transferring of a five or six digit number can often
result in a transposed digit or wrong repeated digits.
Tank capacity curves are simply curves showing the
capacity corresponding to any depth of liquid. This curve
is made by calculating the volume of the tank up to a
sufficient number of levels, plotting these volumes against
a vertical scale of depth, and drawing a curve through the

calculated points. This curve will not necessarily be
smooth, for its slope depends on the area of the horizontal
planes through the tank. Figure 5 illustrates how the shape
of a capacity curve is affected by the shape of the tank.
All of the conditions shown will seldom be found in any
one tank.
One problem was how to develop an interpolating poly-
nomial that would accurately reproduce the tank capacity
curves and thus allow the sounding/ullage table data to
be regenerated rather than stored.
It should be realized that some error occurs in the
taking of the depth of liquid in the tank but that this can
be minimized by allowing only trained individuals to per-
form this important task, with a second person checking the
results of the first and comparing the results against the
capacity indicated by the tank level indicator.
To allow the input of the tank sounding/ullage so that
the user could be relieved of the responsibility of enter-
ing tables and correctly transferring data, the obvious
problem was how to reduce the size of the tables of tank
capacities to a small enough amount to be acceptable to a
small computer system. In order to store all the tank
capacity data just from the original tables for an AOR
class ship would require 70 K bytes of storage area,
23


Area Zero
Area Decreasing
Sudden ChangeIn Area *r
AreaConstant
AreaKnuckles
AreaIncreasing
Area Zero
Curve Straight
Curve Does Not Knuckle
Curve Concave Out
Curve Vertical
Curve of Area ofHorizontal Plane
Curve of Capacity
Figure 5. Tank Shape vs. Capacity Curve Shape
24

assuming four bytes per word. The original purpose of this
paper was to provide an algorithm that would require as
little memory as possible so that a small system could be
used, hopefully without the added cost of expensive
secondary storage devices.
B. PROPOSED SOLUTIONS
To reduce errors it was decided from the beginning
that user interaction would be kept to the absolute mini-
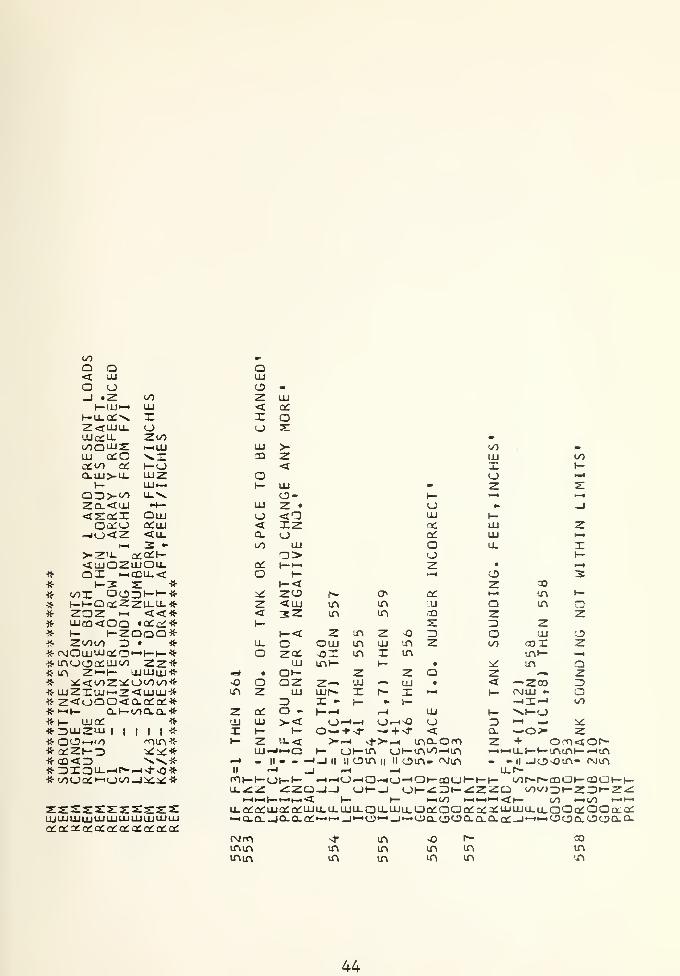
mum. Information supplied by the user includes the identi-
fication number of the space to be changed and the change
itself. Tanks would be changed by entering the new sounding/
ullage in feet and inches while cargo spaces would have the
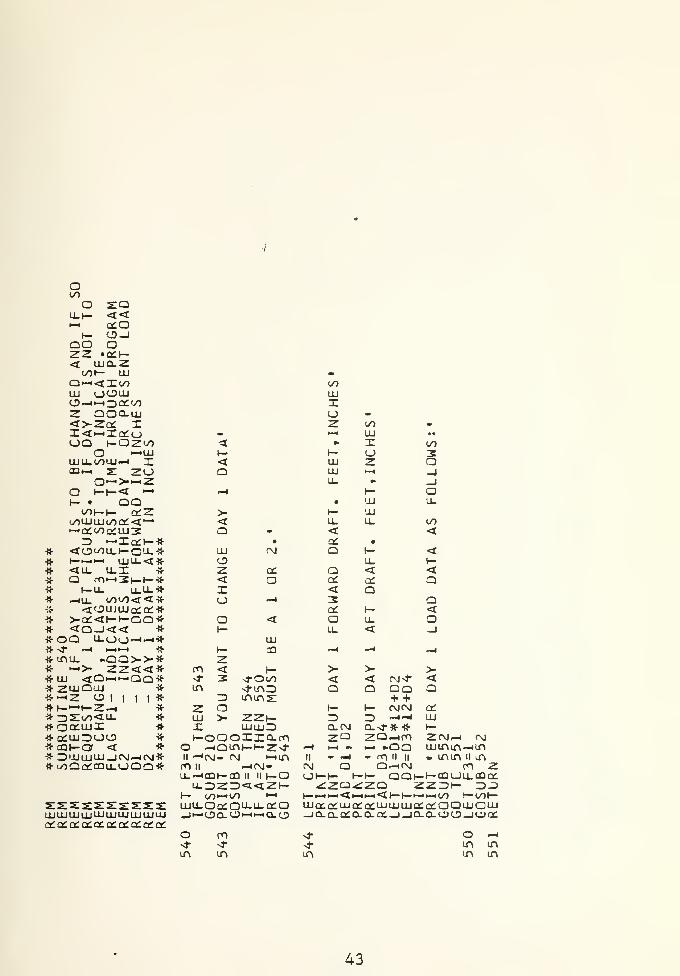
new tonnage entered. Also required would be the day 1 draft,
forward and aft, each time the day 1 data is changed.
In order to solve the reduction of the tank sounding
data, first the shipbuilders were contacted to gain some
insight as to how the tables were made. At first glance,
the tank capacity curves appeared to be a smooth curve -
possibly a quadratic or cubic equation, but this was not
the case. The naval architect contacted, explained that
the tank sounding tables were generated by a computer pro-
gram utilizing information from three separate curves:
tank capacity versus ship's trim; tank vertical center of
25

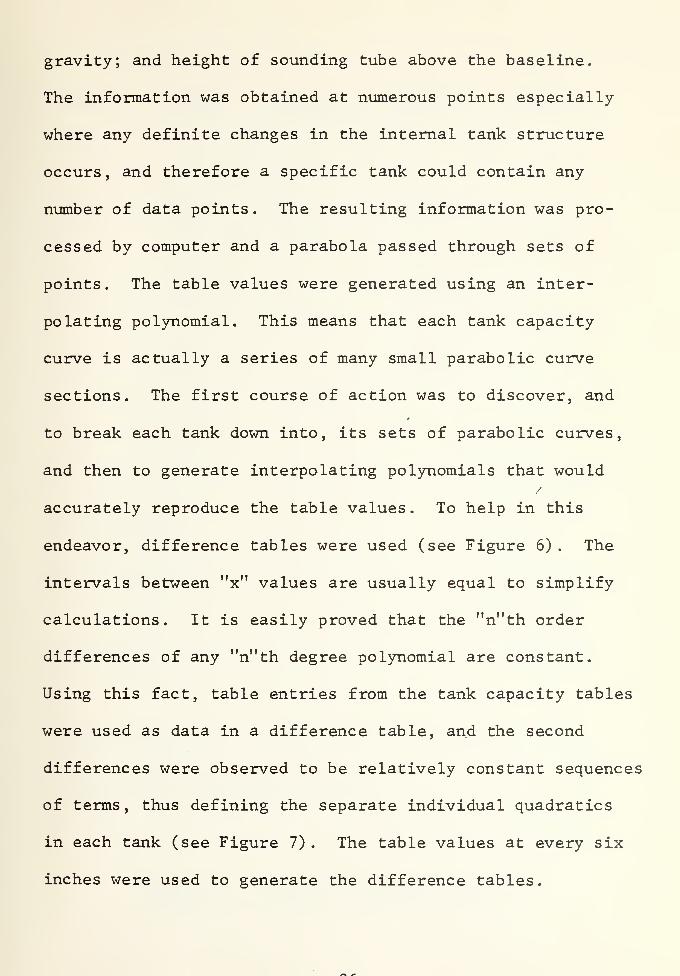
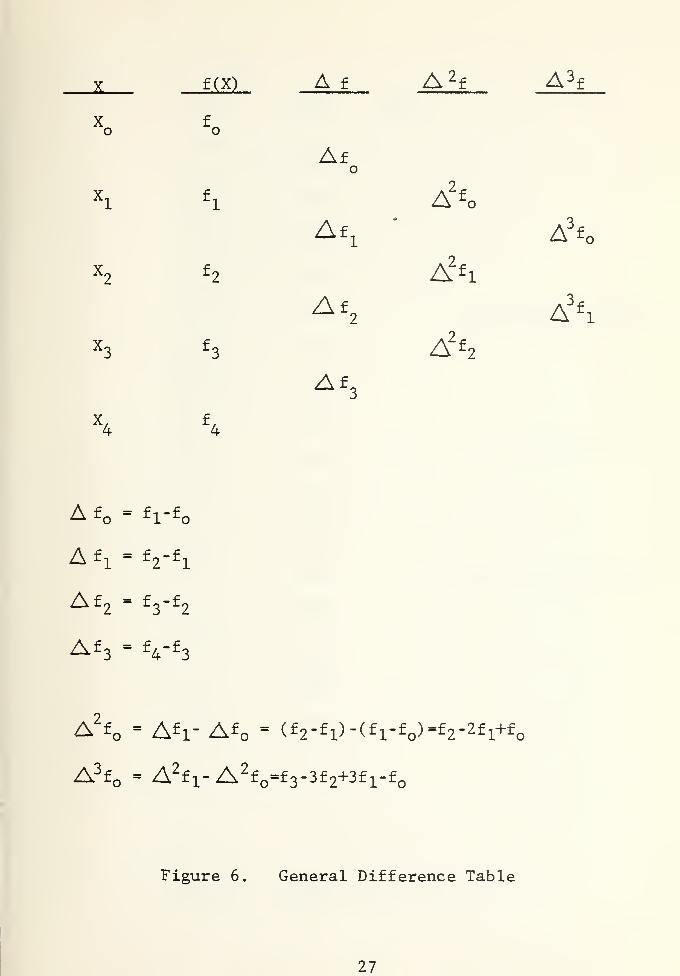
gravity; and height of sounding tube above the baseline.
The information was obtained at numerous points especially
where any definite changes in the internal tank structure
occurs, and therefore a specific tank could contain any
number of data points. The resulting information was pro-
cessed by computer and a parabola passed through sets of
points. The table values were generated using an inter-
polating polynomial. This means that each tank capacity
curve is actually a series of many small parabolic curve
sections. The first course of action was to discover, and
to break each tank down into, its sets of parabolic curves,
and then to generate interpolating polynomials that would
accurately reproduce the table values. To help in this
endeavor, difference tables were used (see Figure 6) . The
intervals between "x" values are usually equal to simplify
calculations. It is easily proved that the "n"th order
differences of any "n"th degree polynomial are constant.
Using this fact, table entries from the tank capacity tables
were used as data in a difference table, and the second
differences were observed to be relatively constant sequences
of terms, thus defining the separate individual quadratics
in each tank (see Figure 7). The table values at every six
inches were used to generate the difference tables.

JL £(x) A f A 2f A 3
;
Xo
fo
AfO
xi
fl A
^ fi A3
fQ
x2
f2
Afz
A2*i
Ax3
f3
3
A2f2
X4
f4
A f - f i-f
A fi = f2- f
i
Af2
= f3-f
2
Af3
- f4-f
3
A2f = Afi- Af = (f 2 -fi)-(fi-f )=f2- 2 fi+fo
A3f = A2
f i-A 2f =f 3 -3f 2+3f !-f
Figure 6. General Difference Table
27


(Feet) (Gallons)
X f(x)
2185
Af A2f
0.53959
1.0 61443998
39~^
1.5 101424037
39
2.0 141794076
39
2.5 182554114
38*
\ RELATIVELY CONSTANT3.0 22369
415440
f
ONE SUBCURVE
3.5 265234192
38
4.0 307154240
38^
4.5 349554880
640 * JOINING POINT
5.0 398354934
54^\
5.5 447694988
54j
6.0 497695042
54\
V RELATIVELY CONSTANT6.5 54799
509755 f
ONE SUBCURVE
7.0 598965151
54 ,
7.5 650475205
54
8.0 702525260
55J8.5 75512
Figure 7. Sample Tank Difference Table
28


After the approximate location of the end points of
each subcurve was determined, table values for each inch
were used in a second difference table to determine the
exact point where the subcurves were joined. A computer
program was developed to help in the processing of the
difference tables and provided output in the form of Figure
7. After each curve's end points were determined, the next
task was to generate an interpolating polynomial for each
subcurve in order to regenerate any desired value in the
tables. Newton's interpolation formula with divided dif-
ferences was selected because it does not require the inter-
val to be the same between points. To obtain the maximum
possible reduction of data, the three coefficients obtained
from Newton's method along with their respective points
were reduced to the basic polynomial form, ax + bx + c
,
so that only the three terms a, b and c need be stored in
order to regenerate any point within the interval covered
by the subcurve. Using this method of reduction, the
original 70 K bytes of capacity table data was reduced to
4.5 bytes. A separate program was written to test each
interpolating polynomial for every point in the interval.
In reviewing all the table entries, two obvious table
entry errors were located and five additional entries were
suspected of error in the original capacity tables. The
29

two obvious errors were clearly made in transferring the
numbers into the original table supplied by shipbuilders.
The suspected errors were felt to be due to the same reason,
but the variations from the true values were not large
enough to make the errors obvious. Thus another useful
purpose of breaking down the capacity curves is to check
the original table data for errors. Excluding the suspected
points, the interpolating polynomials generated values that
were within one gallon of the table value and the worst
computed point only produced an error of . l7o from the table
value.
30


V. PROGRAM IMPLEMENTATION
The program was written in the version of BASIC used
at the W.R. Church Computer Center, Naval Postgraduate
School. This version is an adaptation of the University
of Washington Basic Interpretive Compiler (UWBIC) . The
program was divided into two separate programs, one com-
puting the draft and the other the stress, because the
compiler was not of sufficient size to run the entire pro-
gram as it appears in appendix A. Another problem area
arose from the limited size of the data stack, so for the
draft program only six tanks were tested at a time.
The complete program requires 1627 constants be read
into four arrays in order to perform the subsequent calcu-
lations and compute the draft and stress. In the test
programs , the data were read in through the use of DATA
statements. In an actual operating system, it would seem
more logical to keep this data in a read only memory or
to access the data from a file stored on a secondary
storage device depending on the particular system used.
In more detail, array X contains all the interpolating
polynomial data for converting tank soundings into gallons
The array is really made up of a series of four elements.
31


The first element contains the upper endpoint of the par-
ticular subcurve and the next three elements contain the
interpolating coefficients a, b and c. The data were stored
in the same order as the' tanks appear in the tank capacity-
tables. For each specific tank the polynomials were stored
in ascending order of tank height.
Array Y contains the data necessary for the calculation
of the draft and stress as well as space to save values for
later output. Each row represents one of the forty-six
spaces on the ship and the columns represent the specific
constants pertaining to each space. The first six columns
contain data generated by the program and were stored for
later reference. Column one contains the day 1 tonnage,
column two the present tonnage, column three present gal-
lons, columns four and five the present sounding in feet
and inches respectively, and column six the present contents
in barrels. Columns three through six remain blank if the
space is not a tank. Columns seven through sixteen contain
the constants necessary for the changing of spaces' contents
and the draft and stress calculations. Column seven con-
tains the space I.D. reference number, column eight the
maximum sounding allowable in each tank, column nine the
specific gravity of the contents of the tank, columns ten
and eleven the change in draft per hundred tons change


forward and aft respectively, column twelve the data from
column A of Figure 3, columns thirteen through fifteen the
data from column D of Figure 3 for hogging, sagging and
Stillwater respectively, and column sixteen the starting
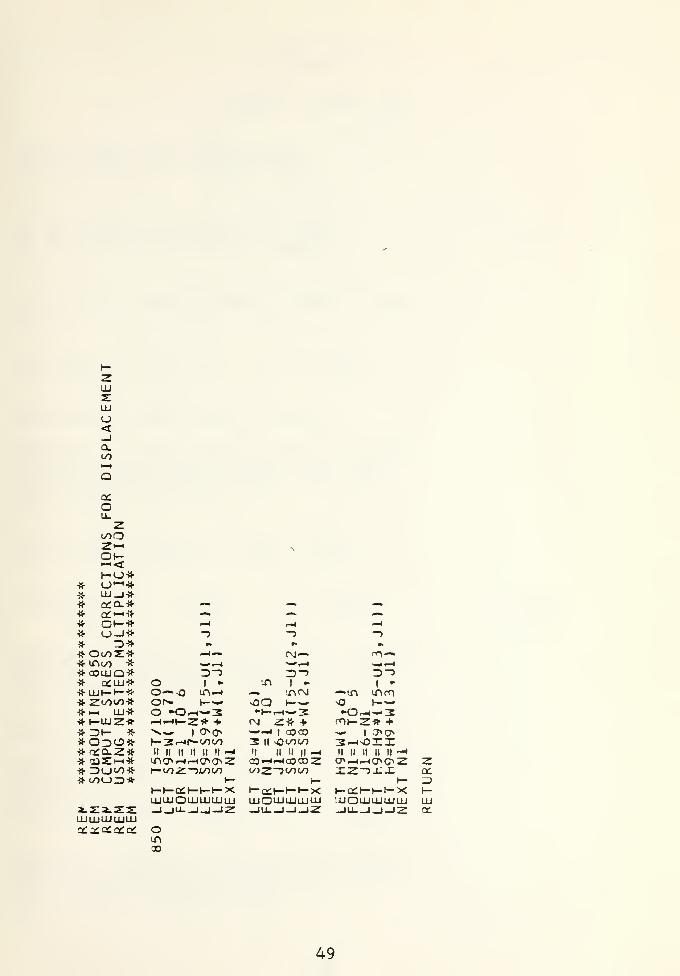
point in array X for each tank. Arrays W and U contain the
interpolating data for generating the hogging, sagging and
Stillwater displacement corrections in the stress calcula-
tions (see Figure 4)
.
In order to reduce human error, the program checks the
input to as great an extent as possible. When an incorrect
input value is detected, if the error was simple such as not
receiving a 1 or 2 for a yes or no question, a statement
to that effect will be displayed and the question will be
asked again. In other cases the user will be queried as to
whether or not he desires to see the instructions again
before the question is asked again.
In appendix A subroutine 200 was used in the test pro-
gram to fill the array data from DATA cards. It was left
blank here because how the data was accessed would depend
on the system. Another portion of the program not appearing
occurs at the end of subroutine 800. A method must be incor-
porated to save the data in columns one through six of array
Y so the user is not required to manually enter this data
each time the program is loaded.
TO


Appendix B is a sample program run and Appendix C is
a sample of how the required initializing data is stored
•3/.

VI. PROGRAM TESTING
Since the program was too large for the BASIC compiler
on the IBM 360, the 24K microcomputer development system
in the microcomputer laboratory at the Naval Postgraduate
School was used to obtain information concerning the pro-
gram size and feasibility of using a system of this size.
The system operates using BASIC -E which required some minor
changes to the program. The program was compiled and the
following statistics obtained: 7672 bytes of array area,
4356 bytes of run- time code, and 572 bytes of memory for
variable and constant storage for a total of 12.6 K bytes.
One must remember this figure does not include the 6.6 K
bytes of initializing data. The 12.6 K bytes of program was
too large to be executed on the 24 K. system as Figure 8
shows only about 8.5K available for user programs. If the
initializing data were stored on a secondary storage device,
the program could be executed on a 32K system. If the data
were stored in read only memory in the computer's main
memory space, some 35K bytes would be required.
35


OPERATING SYSTEM
AVAILABLE FORUSER PROGRAMS
BASICROUTINEPACKAGE
O/S BUFFER AND BOOTING
24K
2 OK
11. 5K
100 HEX
ARRAYS
STACK
VARIABLES
DATA
CODE
CONSTANTS
2 OK
11. 5K
Figure 8. Memory Allocation Map
36

VII. CONCLUSIONS
Currently, the proposed computer application is capable
of accurately computing the draft and stress conditions of
a ship.
One way to reduce the amount of initializing data
would be to require the user to enter the capacity tables
and enter the number of gallons in the tank rather than
the sounding/ullage. This would obviously eliminate the
need for the 4.5 K bytes of interpolating polynomial data,
but put much more responsibility on the user to correctly
convert the sounding/ullage and then to correctly transfer
the number into the system. Although a solution, it was
the intent of this paper to require the minimum of user
invo lvement
.
For the effective use of this application it would be
necessary to be able to save the volatile information con-
tained in array Y prior to terminating the program. This
would be necessary so that only the specific changes from
use to use need be entered into the system as they occur.
The interpolating data generated in this paper could
be easily produced by the shipbuilder at the same time
the data is processed to produce the tank capacity tables.
37

As to what types of systems would be feasible for this
application, three systems appear most likely.
First, there are desk-top programmable calculators al-
ready being manufactured that would be adequate. Commander
Naval Surface Force, U.S. Pacific Fleet, has recently com-
pleted a study where several 32K byte programmable calcu-
lators and associated peripherals were tested aboard Navy
ships for a period of six months. The systems were tasked
with performing storekeeper functions, celestial navigation,
maneuvering board solutions, etc. The results were excellent
from both performance and maintenance viewpoints. Second,
a dedicated system could be designed from available micro-
processor components. The memory could be mostly read only
memory with some random access memory for the volatile data
and some kind of terminal for the input and output of infor-
mation. This system would require no secondary memory.
Third, a general purpose microcomputer system could be used
to run this application on. The system could be large enough
to handle all the various applications aboard ship.
On large cargo ships such as the AOR-1 class ship, a
programmable calculator or a small dedicated system would
more than replace the "LODICATOR" and existing manual
methods
.
io

>
Another useful application along the lines of this
paper would be to use the data to compute other damage con-
trol information such as righting arms and reserve buoyancy
for use in the event of fire and flooding aboard ships.
Once adequate computing power is available on board ship,
many other applications, both old and new, can probably be
found
.
39


APPENDIX A
Program Listing
UJ
l-ZooO
• >C\i oOLU
OU_
z o< •
»—
•
Z 00—• *-y—
UJ QSZ(- ZOUJ< ujq:2:z. « * a. ujt—
1
• • uj2:i-—
>
2: CN cm QO<r*- a: •> C£\-
•» UJ a: a. cC QU.O0ro h- O a O-» i— IQ<3 O -^ 00 r-t l-<H-
QC *i 1— UJUJ<UJ —
»
< a < 2:0:01- * K- f«- • y-
3 •M- # •» H UJ UJ # UJU.-K-CL # * CO CO 1— CD * •CQO-M-S. * * w >- z # UJ «a * * 3 O ^— < 1— •« ccctuj-n-o fr *• » a. 00 3 OO * UJ—IOO-S-
* * »» •z. 3 3 # X33*00 * # O N"4 2! > Z * a #00 * £. -t •* _i # < > »>
UJ * £. r-l 'JJ UJ —i UJ # OH- CQ-M-
QC * ^<" r-4 3 3 < 3 * o<< *1- #2:* w z -J UJ _i -» (NjQ V- cC -*
00 #<»• X —
.
oo< a: oo< # <o** CC* ^ 1— iTirri> coin> # uj>o *
a *o* —» z •-t-^ 3 H-* * z< 0*z *o# a I— h- *'-Qi oo-t*
< # a:* -^ ZZD > ZZ3 * \~cc •*-*&fro.* «» UJUJQ. UJUJQ. #3<UJQ-*
i- # * Oinn II2(NjOQIIZOOO(NJ » Q oo^ttLL # z* <l-OOr-4t- r— 1—*-OQm H- 1— •-• ro <fOO # c£_JZ>uj-8-< •»• h-i-M- -—.
II <\l - - ,-«- <nj - --<ir\ao—
<
* cq_j a.*CC * <* >-»i <.-rr\j ^(N *3*-2<-K- zo * 2I* u-cxio*— 11 11 1—Of— ca 11 11 t— Qcoajo * oou.'-'t— * ko:
3 1—2 c_l <i<Z \—Z3<< <£ 1—33 1— Q- ^32IJ-O0 .-.< >— «—I0O •-• 000O O —iH-
2: 2:2:2 —•ujoOQi'-uu.u.QiacE:ou.u.a:cooot— 2:2:2:2:2:2: q£ujUJ IXJUJLU _j e> q. cr: —• •-• a. o. 1-"—
• q. 00 LUIUUJUJLULLl CLQicC CCCCCC ccccccccaicc
(M O O OO m in co O-H —t I-" —) (\J
40

V
ccUJ
LU
_)
- <
CCUJ00 U,3(3
LU^IO
>3CQO
LUh-X00 UJ
UJ31-QfOO •
LUOtiOOcc<->ccu-O
2 CCOUJa:O.XLUDH
h-0.03UJI-Q.V 2-JO
* cl-*cC#* OOOCUJ** -ia-f_.K.* Q U.-M-
* CX-H-* ujuj ** cC^CO*tf-O <002T*«• -* <<•«« (NJO0O0 -M-
#iuaO'-i<i##2-"-« c£#M- 1—-•— i— c^O-frtt-f-ooujo*#33300 a: *
tfoc^f- ** COOOOOUJUJ-H-#DZZII#•»• CO —IM|-|-#
UJ LU UJ UJ UJ UJ LUcccccccccccccc
U.U. UJO-H X
• » ^-• UJ
2Q Q •• »-• • -~>GC 2o <>-. OO UJ —I2- H- CO 00>—4 • ccz. LU2 3\-cC LU< ID-<o -2 • > • —a:u. X 03 00LU <2 Q<U t—Q.Q 1—
1
2 < Q - 2ujuj zz <s:lu UJ ..UJ -5OOlȣ hhcx: - cc >-- 2IH- -3
OO OcCOCC < • a£2O0< I-U- LULUU-O 200 OO< 2 SICQ LL OO u-oz\- 3>- CCT.O ~cc 1 1
2:3 OCD 03H-0 00 UJ UJUJaa Z u-z a: UJINl xa
m uz <Q • QUJ a !-*-•
00 t-H UJQC OO UJUJ INI 00
2 X UJJ-LU IH2I- UJ3 2 1 1
O 1— LU X<GQ <<< cc\- i-h
>—
•
-«2 HZS • oio < UJ1- «• 20 OD Qa-Oh > QZo • UJ»-«2 • _JQ^ oOCO » UJ<3 CNJ -1 2: OoO 1—iLU UJ ^. • hQCcC <t< 2UJUJ OOO 00 ZQ —i <LLl— cC ox <QU UJ<>—2 <UJ 200 o i-hK X < la •- 1-3 H- OO >4-
2 a: OOO Q. 1— 00 UJ O 3 •-.a: >4-
—
1
—4 LULU "-•OO •• OO 2_j Q. oo<xa: a uj<2 <_l 2 LU3
UJ < 30 1— UJUJ 00XQ.< IO >—
»
Qa:X zr OX X.h- 00 l-U_ a(— LU 0<H- 2 1- •• 00 U_
CO 00Z 2CL <OUJ>-H cCcC -1
1 1
1- -tlU HH00 3T l-ZIS UJUJ UJ ^2 h- X cc a >—If— XcQ 3 UJO< OO >-3 •-•uja: i/>2 * H-X 2 OLU3 003 3 ooXu. O-i-hQ. 03 HH <Q
(\jroz: a. 00 OJJ— t—iCQh-1OO 2 1— a.3 CNJ CNJ zuj Q a; X^Xa: 00 -^ '/Ol— ^o 1- •—1»—
1
ujuj 00Oo0< UJUJ O 00>- ZZ3 a: 2OC0 O UJ OS O Xuj
LULU a. _ih- uj<s: ai lucl. << 03-aonzo 02 XQ.3 C>-Xcl a. a: O <accOLO»— (—mh <LU 3002 U_C0t-< 00 u_ h~ jj_ja 1
- (\1 - CNJ
-HCNJ• - m — - •> m m m • • m
<m ~
h-CO II II KOI-h|-HI-l-l-(-HI-|-l-H|-HI-l-hH t— t-l— H-
H
H-h-Z3<<ZhZZZZZZZZZZZZZZZZi:ZZU/iZZZZ <iZmi/;QCC i
u- u_ ccO a: QC CC CC CC CC CC CC CC CC CC cc cC CC CC CC CC CC CC ou OlQiQCQialCXQiq-c:n-"-iaacLaaQ.Q.aQ.(iQ.aaaQ.aaQ.a.cLaa:Q.Q.Q.aQ.Q.a
o O—* rgCNJ CNJ


JJ-X .
>-o<*
t-iuCOfNl<x—a:U.LU
K-t-zLULULULL •O
rx.cc
LULUl-<NlzLULU
OL-<
CO • -V OcO •> •
• • - ZLU CO CM- «o Ml :sr-• locmo QUom^o zz _if^-
OfM^rn Z)i-« _i-*O *
CO CO CO CO co a! U.CNLULU LULU O O2: 2: 2:2: cc COooaa ai- <<*0000 LU OLULU LULU t-LU LUCO CO CO 33 LLUL 2:
< ~o:O oca: \->-O 2T QLU •»
• •« U.2T X Q>-
CO on.1 Oh Z<-
LU 31 IO 2m <QO—J 1 LOfSj |
~LU ••OCL O • | O a: LUOCNIs: 1 LTV^rO LUU- ^S-t< <CM^
1 t— •—
*
<X 1 I I m z • alu OvC^ LUCO
LU LU cc 1 1
LU *£ *:*£<_) zi LULULU21 zzz< LUO i-f-s:O <<<Q- IZ z<»-«CO 1—i—f— CO 2m aiQH« • • w « • M - - . z
t-h- t— H- H- t— h- 1— H- 1— h- 1— H- 1—3^.Z. Z2^Z2iJ2ZZZZZHH-(»—
1
»—•>—»>—<>—1>—
»
t—11 11 1 i—i t—1 1—1 >—1 LUQCi^ c^aiQioicccnctaiaiQCQCaia:Q.Q. CLQ.Q-CLQ-Q-Q.Ci.Q.Q.Q.Q.
OroCM
-X.
oZ
I
CO
LU
<XoI—
•
X3cozo
COLU
CO
co
co#CO*LU*O*O*C£*
*OCL#* LO -K-
-* CMC** I—
*
#LU ** ZUJ-fr* MQi'H'
*DO** a:o** COO*
-a-coa.*
2:2:2:2:LULU LULUcccccLa:
CM
3
LL.
a.
coLU>
<rzI— K- <X^zuo1—11—c<h-C£C£ LULUQlCLqCCX
oinCM
42

oooo so
llh- <<<-* cCO
(- O-lQO Ozz «a:i-< UJQ.Z
OOf— UJ
LLi OOLU LU
Z QOa-iu o-0--Z.CL X 2 </>KhIqJu - "I UJOQ HOZW <I • X oo
luu-oouj^ x < uj z achh-i s ZU Q uj i-h _j
0>—>"->Z u_ _i
O — \-< HH «h i— aH- • QQ • 'JJ U_
oo»— i— a:Z > h- ujoouJUJooa:< ,-' < u_ u. oo-«a£ooa:uJ3 Q • < <
X» «I^H# • c£ •
M- <O00U_l— C'J-* UJ C\J Q I— <•«• I— •-h'-i UJU-O O U_ I—* <u_ u_x * -z.ee a < <# a mi—isi— »— * < o ct ct q# t-u. U.U-* x < a* —«u_ oooo<r<x# o -^ s o* <<J)UJUJc£C£# CC I— <•* >a:<i-h-cQ* O < O u_ O* <Q_I<< * H- U. < -I#OQ U-OO-*-*-* UJfl. ^ —4 _.— -fr (—CO «-* —• —4#inu_ .oa»* z* >-•> zz«* m < i— > >• >-M- UJ <QmmQqj(. ^- 3 ^-OoO < < <M-t <•*2UJQUJ * in -tiTO Q Q QQ Q*hZ O I III* 3 i^ifiS + +#t-»-«t-Z^ * Z d I— I— CNJCN Ct*:ds:oo<u_ * uj > zz\- id x> -»»^ ujW-QQCUJX # X UJUJ3 Q-fNJ Q.^** H-•H-c£UJZ)00 # h-OOOXXQ-m ZQ ZQ-ifl ZC\J^ <\J
*co>— or <* # o —iQini— i— 2T>t *-• i-« •• «-i »oq turnin^m* :Dujujuj_ic\j—4(\j* li «^r\j- f\» Mir\ ii • f-< « rrj II || • mm n m*ooQoc:cqu_OQQ* rn || -^rsl- rg Q Q-hc\j cr> 2t
U_-*COt— CO II II H-O Oh- H- I— I— QQHt-CDULUCDctU.DZD«ZH -tCZ^-ttZCD ZZ3I- I3JI— o0"—»00 •—
•
I— h^i—i«ii—1»—i<th- 1— <—ii-400 h" 001—zztxzsszrs: uju_oa:au-u_a:o wctc^ouoc^ujujujcccrroaujaujujujujujujujujujujuj jtioaO'H'-'ao _)o.q.o:q.qlqi_i_iq.q.oo_jocc
o m >t © —
'
-4- -4" 4- mmmm m mm
43

OOQ<a
Qaj
O
2<ruju_UUQiU-ooqujs:aj oiOC£00 CCQ.UJ>U.
t—
2Q.<rUJ<SlcCT.oa:u
-*c_><2
UJXo—iLUMl-OUJ2
Qlu
<u_
>2'J- ^aTf—<UJOZUJOU.QI -4CQU-<
* 00X 00>H#* l-hQa:ZZu.Ll.*H- ZOZ •-• <<** ujcQ<Oo • aCai** h- hZDQQ*•* 2oOoO X> • ** f\jOUJLUC^Ot-»l— t—
*
•* mOOC^UJOO 2^"** in 2»-«H- ujujuj** *i< 002^00000*•fr UJ2XUJ»-<Z<UJUJ-**• z<uQO<Q.Qia:##•-•»— Q.f-COQ.0.**H- ujo: **Z>LU2UJ | | I | | *k-ooi-h/) <r>in-»-
*a:2l-D ^i«i*-frC0<O ^^*# oxa u-^ p- -^ >j- ^o*
UJUJUJUJUJUJUJUJUJUJUJCCCCCCcCCCcCCCCCcCCCCC
in
aUJ
<XoLUCO
<a.00
a:a
u_O
o
UJ
UJcC
O35:
UJO-2 •
<QIZo
UJ
ZO<UJ?zi-<oZDC
UJOt-QZ
UJ
O »><
inin
oujoxinn-
ujr-x -
inintn
UJx
inm
UJx
min
UJx
i—oUJcCcC
ao
cc•JJ
CO
Q
2 u_<UJ^I»-lQ
h-—« r-» UJ
o»— in ot—moo-*in
Xo
UJUJ
o
Q
Ooo
oo
COmin
UJCOXmt-m
oa.
—200CNJLU ••
>xl-0
a00
-4 . H - . —t_i it ii om ii n om- <MmII -* «j »H
—o>- 22 + o<-o<or-hmu.1- t— mini- *^in- »n_jo-o<n- f\im
rHH-l—UH- 1— r^<-tO-*O^HO—*a»— COUt— I— h- 00 P- P- CQ l_) I— CDO h- H-u.^c-<r ^2o_j_i oi——i ui--«:ai-^:2^o wvot-ZDf-z^
i—•»—(— i—<»_i<X f— H- i—«i/) i—«—n—«<IH- oo •—too >—"—*
u. a: a: uj cc cc uj u_ u_ uj u_a u- uj u_ Oa:oo cc cc c£luuju_u_oO ccOO a. cc—iclq iao.c£i->-_iMe)^i_)f-<(jcLOoaQ.Q.(i-J ,-"-'Oc3Q.ooaa
fNJPOin inmm
•4- m o r-in in in mm in in m
COin<n
44


00z.o
<QQ<O
oO
00
o-z.
o
oo
•-JJ
ooex:
LU
<a00
aLU
LU
1— LU ~
LO
in
2LUX
ll oo _|
c\JX>-O—i K-»< f^i
r-»> lo<no- - LO
ii
LUOOLUcCa.
LU
<Xo
a:o
LUCQ
oOCNiLOD
lolo
Qa<o
LU00LUa.a.
oo*:
a:LUZZD
LULUQ.OOXX2T-< 2rr>Qini-t-i-i'ON lulo- c\j - m ii - lo
—"f\i rg>-l— H- OCNJI— H- H- CO II IIH-OOHHO
ZQ Z^I~Ui:ZZJ«^H ^21-I—«^f~ I—If—I MH<t—tOO I—
•
h- •""•*"
«
ctujLua:cr;ou-cr:ct:Qc:OLi_LUQ:oLuct:cr:oo. ct _* a. o.o •-• ex o. o_ e> •-• i-i a.o —i Q- o. <jj
oo
Of—
'
LOo
C\J
Q<O
LU00-LUOOCtTlU
axu
zrzmqh-.^:
LOo
CM
>ZZ #OLU-*i -S-OLO
—.>> «4-^.<LU- sD^ •»
vOcvjtt-H- —• *£«—cDLUQ —^—»0-j- »r--f»- ro i rn u-a: lo i
lo^^tQQ (Nj^rO^I— - <r\j^LO^i »OZ—— —t'-^'-LL. 2h«^«—
h-^»+ + X,H-«-»t—<- CtV.(——»—|—
—i<\i >lovo mz-za: Ovoz-za.II II II II II II —t II II II II - - - II II II II
-LONOr-^r-iOvo^rn^ro.-o lo^ololo -z.Qozooa x.x.*:x.h- 1— t— x.x.x.x.h- »— ac
H- *— (X I— I— I—X I— I— h- h- «-• •-• *-* I— h- (— t— —* >-i I—LULUOLULULULULULULULUCCQiCtlLULULULUaCaCLU_) _J U. _J _l_JZ -J—I —J -J Q- 0. Q. _J _J —I _J Q- Q. QC
o O-iLO ^OvOLO IOLO LO
LO
LO
45


00
UJcc:
ac<CQ
Qz<ooZ.CCOUJI— OO—
>
a 00h-a _l
\— UJ00 QiZD CC.OX <_II_)OOCQ
# _JUJ.z ** < 13Z#* OQ(-m#* Z ** 1—<OQ#* qc :z<#* ai>QO*« > -l-J-fr* oz> ## 00<Zh** OOC-t'-*z*H- a: UJ*-« LUO<Q00** Zl- •<UJ-«-*mhi zoa:#•frf-UJ—.._1CL## 32 •»•
-* Ot-HUJ1 \ *
•M-ctt-o: *#CQDQ #K- DOK ^*froOOCOOh-CQ-*
as::zzs 5:2:2:LU UJ LU UJ UJ LU LUce.ccce.aL a. cccc
00
zo
<
00UJXo
UJUJO
CVJ
CM
— o aH— v0 —1 h*0
>-< II cQOU.11 *O—Z II II II II UJm•wCNJUJCNJ—»—»——
»
O •»
O—l O-l'-'i-«»H 00—
»
—O^ II OOOO - -JIIw It r-»w^»%-.». Z
I— I—> 'Ni CO >•>>> H- f— H- 1— CX.
z o zzzzz?a_ uj uj u. uj uj uj uj uj cc cc cc cc ujq 1
_i»-t_j_j _j_i_iQ_a.a_a.ee
*
*
*o
oU.IXI
OQC
ZOOauj
* —.O001—Z<00OOH-JQZW-J-JUJZ< —'OOU.OJa u-<1-XU-cD
UJ00>OZJ<Uh*Za_ #—• aiOoo-H-a<zi— •«
Z -«Z#DOI-uj*o»-<t-*00 _»Z*C.QO*
* m^ujQ-o*#vaZ»-a_ ** <zijj_'**uji— *-.(— z** z az<*# —IOOQ.I-IH-*
+
>x+
+
>x*r-00
+a —O -I
+Z m
>UJX
* DOC I
* OUJ*ct>-*CQZ
* 00O>
I***
*
X
*
oovO
LUUJUJUJUJUJUJcccccccccccccc
-o
OX +— m^^ooo>uj>m—»oII -J II nO'—orn m 11 z>r^>uocoa
o-> 1- _DX
)
H- H- H-t/)k-U_IU_UjOUJOUJ_i>-H_je>_iOcr;
O—t O
46

00zO
00za>—
«
(—
uzUJ
oOO00<UJ-IXO.h-OOoo •—
•
QUJUJCLX-.XXH-oO
LULUXX
*
* XO* ot-* u.* 00
•H- OOXK-Ooolu*OUJU_* COXUJto I— <XM-LUOO*Z 3«>-•COOB-H-UJZ*xh-
#X0_s-cqs:
•froOOH*
00
LU*oooox*oooot—
*
UJUJOO*XX #h-l-X*O0O0LU*
H--H-
CDO<*ZZ2#<-<"•_!#oo_j#<oi—#ooXoO-M-
I I I*to
<\J ^*toooxoo*
uu UJ UJUJ UJ UJ UJ UJ<x,xxx<x<xxcx
oo
»ro>tin
>ZZ2-I_ <\j
^0-.>>->
or*- oh- z^»>—*-»>-vo^mo —+ + + +4" »f-t »i—i^Xrvj-JH-r0>O »0 || w oooo~> ii m ii it ii ii ii ii fHII <M II **~*~* c\j*^ Z
h-I— I— k— I—X I— H- 1— I— H-XLULULuLUOUJLUUjLUUJUJ_J—»_J_JU-_|_J_I_J_IZ
oOas
aoOoooo+ +
Oc\j<-^mooooGO II II
ajoooOD00*-h-OUJUJo_i_i
zo
ZUJLU3!3TUJLUOo<<_l-I iXQ.OOCO»-»
wQQ-
•XZUJxl—•<02OO-J
001-ZooO-
zo>-><l-
OO -oO» ~*oO «»00
UJ* »
CX'OCvJH-O^OOOX •»
- - X
00X
00
UJooUJcXa.
u.
a>a.ooaX<X
XXao
UJ
x
xa>
c\jO<-*r\l>co QO
UJcX-JO.
XXXa. a. a.
xaia. _i
zzxLUUJQ-
aoxxzami— 1->—
t— CQ II II h-ZX<K^t-HOO •"<
xou_u_xQ.CJ3i—it—«CV
OCO
XXa>-
<xUJ
X>>a
UJI—<Q<xUJ
ox z—4tXJ UJCO- <A-
zOl— I—f-.20Z
axujeeoaoco.
(N—I
CO
47


ajj
m cCoo >—
•
cc cou LU vo o ccX <
oo LULL LU >o i—
•
-0. •»
00 Q mQ O >111 <cC ac QQ LU <*-2 1- 2ID 2 •—X i—
•
- Xcc 1—
2 Q. ZrOLn>—
»
OZHLL t s: - -
«» o >•- (\j-
LU gd -s:s: • • «»
>—
<
o Q -*h- 2 lu s:
m <.0C ••
s. CC a£ < 1 - 1
•JJJ LU OQ-LU LUCMh- 1— \- lui— 2:SZ 2 o<< _•LU LU —(Q.Q H-—*m m m II . - - -
t> -
CM H-2 2w LU
CO >- X•Z. - LU
o -. o
••cm a.2 — CO
_l — CM —•< > aO •« CM- — 2» in — -
•• > cCoo CM •• oo LULU 2 - LU t—X —o >
CM1- 2LU —LU >
~ •» O •»
LUOCM \- CM0^2 2< w (Mw
CO II CM II CM- CMt—2 CM»—
2
Z H- <t~* ZZ 22 2I— H-•— 21— h-t—l— h-t— I— t— '-'»— •—••— H-»-H- H-
I— I— »— I— <— «— I— I— I—CJ2U22CJ ZZ^Z^ZZZlXiX cccCX ZZZZZ^ZZZZiZZH-<l—i<t>—•»—<<XQLi—it—••—ii—ii—»>-ii—«i—"OQ-LU CJQ.LU i—it—ii <! <i—it—ii—n—ii—ii—|i—1»—it—ixujcCujcccCiuOcC^CccqCCCqccCcCil. 2 u_ z ccccccccccccccccccccccccccluac a. or; a. q_ a: 0.0.0.0.0.0.0.0.0. a. a. a. a. a. a. a. a. a. o. u. a. a. ^
X <o 22 _J—
t
-JW —
i
•men 1—- ^c^. 00\— •> •• •UJ^sO »lu:*^ •u_ - » CD• - * <l-a - CO ••
- an oo- •-«
i— <ocr 00 »coLU3LU lli- m<Qil- CCLD^iQiOLL. I-OooQii< oox ••
m - • - - X
<LU CC>o<ooo a:
O.LU—ILLcoO1—
«
oocu00 COox>a.
1—
LLX.-.LU
2••
ijjujqc:
a.coo<Z!U-H-2>
#o»-» *#H- >*# sk*•» cuac*•s-i-H-of:*«• 3oo<*H- Q-> *«• 1—OOU_**3 O*« oz *»• oo**o p*JM-OrH*»• 2 ** LU^CO**ZQZ*# mZ2#•M-t-LUXl*#DQ—l-fr 2M-auja* ac* (^CJCJ* ->
»—
LU2.3:2.2:2: ccLU LULU LULUcCcCcCcCcC O
CMCO
48

UJs:UJ
o<—IQ.
CCa
ooa
Ol--<<HO#
# o*-**-* UJ_|** cua.* —
•
-^ —.
# a:*-"-!* -» —
»
—«.
«• o»-* r^ f-4 r-»
»• u-i* "3 -3 -5
# X>* « •* •»
•H-OooS* -H-»» CM— r<-|—
.
-»• moo * —•.—• w^ Wli 1
S-COUJQ* z>-> =;-> z>->* cclu# O 1 * in i i -#UJh-l-# O—'-O m.-i —. srvtM —•in mm# zoouo* Of^ I— «~ vOQ K-^- ^O 1
'
* h-. LU# o *o rH^-2 -t— r-A^rs. •O^-—
3
*l—UJZ* .-l~*l—Z* + CM 2* > rOt-Z* +# OH- •* ^—
»
I a^av -»•-*I COCO -— 1 C7»0>
*ODO* H-2<-«f»oooo 3 if sQm<s> 3-hsOXX# OCCL2* II II II ii ii it -* II II II || -4 II II II II II
—
»
* COS>-«-K- in a* th i-h <j> <t>z CO «-^*-* CO COz o^—*i-tcr>cr>*z z* DUW# h-oO,2:~3i/1</> o^z-joooo XZ-3XX CC* 00<_>X>* t— 1— ^— ZD
— 1— (XI— 1— >—
X
t-Ctl—H-t—
X
t-c£l—t-l-X 1—UJUJOUJUJUJUJ LUOLUUJUJUJ IJJOUJLUUJUJ UJiZiZZ -I_JU-JJ-IZ -Ju i_i_|Z -JU U-JZ CC
LU UJ UJ UJ UJ
XLX.c£.cLaL oinCO
49


APPENDIX B
SAMPLE PROGRAM RUN
DO YOU WANT THE INSTRUCTIONSIF YES, INPUT 1. IF NO, INPUT 2.
2
DO YOU WANT TO CHANGE DAY 1 DATAIF YES, INPUT 1. IF NO, INPUT 2.
1
INPUT DAY 1 FORWARD DRAFT. FEET, INCHES25,
INPUT DAY 1 AFT DRAFT. FEET, INCHES25, 10
ENTER DAY 1 LOAD DATA AS FOLLOWS
ENTER NO. OF TANK OR SPACE TO BE CHANGEDIF YOU DO NOT WANT TO CHANGE ANY MORE
/
DATA, ENTER A NEGATIVE NO.310
INPUT TANK SOUNDING. FEET, INCHES17, 9
SPACE I.D. FEET INCHES GALLONS310 17 9 56328.2
ENTER NO. OF TANK OR SPACE TO BE CHANGEDIF YOU DO NOT WANT TO CHANGE ANY MOREDATA, ENTER A NEGATIVE NO.
3900
ENTER CONTENTS IN LONG TONS1525VALUES ENTERED- SPACE I.D. TONS
3900 1525
ENTER NO. OF TANK OR SPACE TO BE CHANGEDIF YOU DO NOT WANT TO CHANGE ANY MOREDATA, ENTER A NEGATIVE N0 o
-1
50


DO YOU WANT TO CHANGE PRESENT LOAD DATAIF YES, INPUT 1. IF NO, INPUT 2.
2
DRAFT BASED ON PRESENT LOAD ISFEET INCHES
FORWARD 25
AFT 25 10
STRESS IN TONS/SQ. IN., DISPLACEMENT IN LONG TONSHOG SAG STILL WATER DISPLACEMENT6.127 4.321 2.418 28420
DO YOU WANT A HARD COPY OF PRESENT STATUSIF YES, INPUT 1. IF NO, INPUT 2.
2
TO CONTINUE, INPUT 1. TO TERMINATE, INPUT 2
2
DO YOU REALLY WANT TO STOP?IF YES, INPUT 1. IF NO, INPUT 2
1
51


APPENDIX C
SAMPLE OF INITIALIZING DATA
ARRAY X
X(l)X(2)X(3)X(4)
X(5)X(6)X(7)X(8)
4.916725.305799.1423
=125.1719
TANK 6-A-O-W FIRST SUBCURVEFROM TO 1.25 FEET
TANK 6-A-O-W SECOND SUBCURVEFROM 1.25 TO 4.9167 FEET
ARRAY Y
DATA FOR 6-A-O -W
Y(l,7) = 00Y(l,8) = 45.1Y(l,9) = 8.5Y(l, 10) = 5.69Y(l,ll) - -2.326Y(l,12) =
Y(l,13) = .114Y(l,14) = - .11Y(l,15) = .114Y(l,16) = 1
I.D. NUMBERMAXIMUM SOUNDINGSPECIFIC GRAVITYCHANGE IN DRAFT FORWARD, INCHES/ 100 TONCHANGE IN DRAFT AFT, INCHES/ 100 TONSCOLUMN A, FIGURE 3
COLUMN D, FIGURE 3 (HOGGING)COLUMN D, FIGURE 3 (SAGGING)COLUMN D, FIGURE 3 (STILLWATER)STARTING POINT IN ARRAY X
52


BIBLIOGRAPHY
1. Rawson, K.J. and Tupper, E.C., Basic Ship Theory .
p. 176-180, American Elsevier, 1968.
2. Muckle, W., Strength of Ship's Structures , p. 70-83,Edward Arnold Ltd., London, 1967.
3. Baxter, B., Naval Architecture: Examples and Theory .
p. 106-126, Charles Griffin and Co., Ltd., 1967.
4
.
Eubanks , G . E ., Jr
., Microprocessor Implementation of
Extended Basic . Master's Thesis, Naval PostgraduateSchool, Monterey, California, 1976.
5. General Dynamics, Quincy Division, A0R-1 Booklet of TankSounding Tables . NAVSHIPS NUMBER A0R-1 845 2522016,1969.
6. General Dynamics, Quincy Division, Damage Control BookA0R-1 (AOR-1 Class Replenishment Oiler) , FSN 0988-092-8011, p. 11(a) l-II(a) 22, 1969.
7. Gerald, C.F., Applied Numerical Analysis , p. 34-40,Addison-Wesley, 1973.
53


INITIAL DISTRIBUTION LIST
No. Copies
1. Defense Documentation CenterCameron StationAlexandria, Virginia 22314
2. Library, Code 0212Naval Postgraduate SchoolMonterey, California 93940
3. Chairman, Computer Science Dept. Code 52Naval Postgraduate SchoolMonterey, California 93940
4. Professor R.W. Hamming, Code 52HgComputer Science DepartmentNaval Postgraduate SchoolMonterey, California 93940
5. Professor V.M. Powers, Code 52PwComputer Science DepartmentNaval Postgraduate SchoolMonterey, California 93940
6. Lt. Daniel S. Gomez, USN9740 Trefoil PlaceSalinas, California 93901
54


1683^3
J GomezMicrocomputer appli-
cation to compute a
ship's draft and longi-
,i> uttM^inal stress^ 60 5
5 OC102. 2886^HAR 22 «5
I
Gomez .
M i c rocompu te r app I»
-
cation to compute a_
ship's draft and longi-
tudinal stress.

thesG5468
Microcomputer application to compute a s
II III
II
3 2768 002 13079 1
DUDLEY KNOX LIBRARY