Microbiology lab 2017 - University of Ottawamysite.science.uottawa.ca/jbasso/microlab/micro...
25
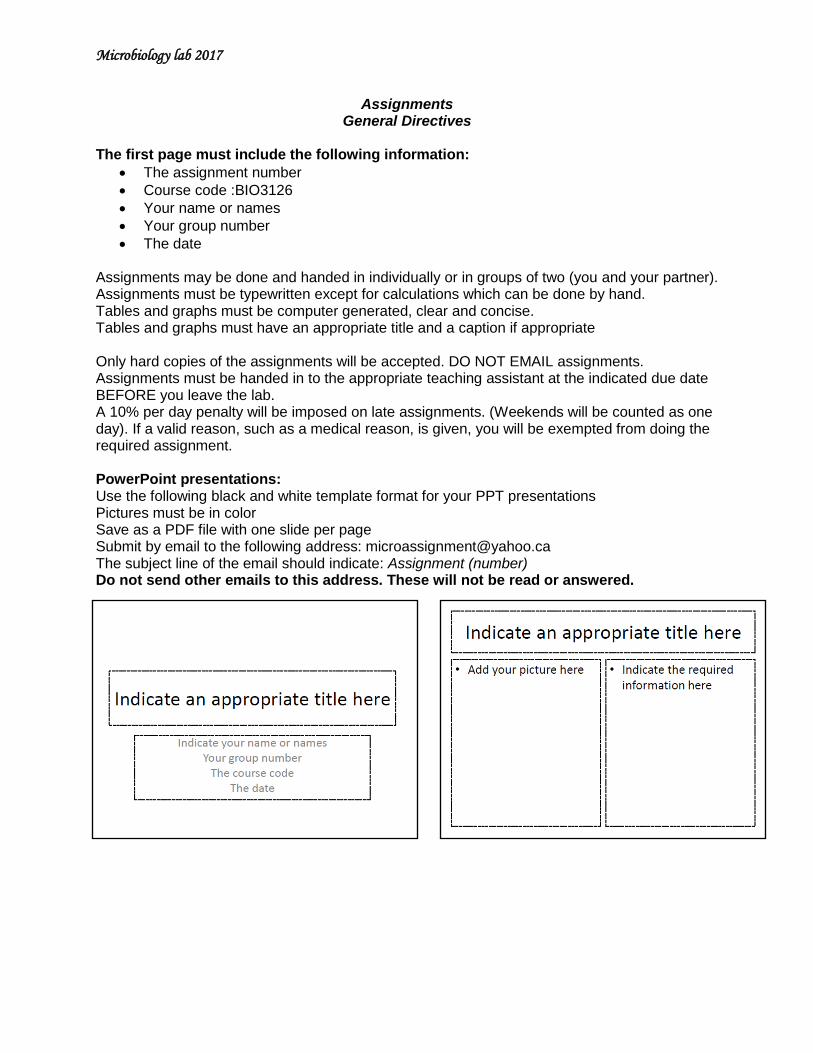
Microbiology lab 2017 Assignments General Directives The first page must include the following information: The assignment number Course code :BIO3126 Your name or names Your group number The date Assignments may be done and handed in individually or in groups of two (you and your partner). Assignments must be typewritten except for calculations which can be done by hand. Tables and graphs must be computer generated, clear and concise. Tables and graphs must have an appropriate title and a caption if appropriate Only hard copies of the assignments will be accepted. DO NOT EMAIL assignments. Assignments must be handed in to the appropriate teaching assistant at the indicated due date BEFORE you leave the lab. A 10% per day penalty will be imposed on late assignments. (Weekends will be counted as one day). If a valid reason, such as a medical reason, is given, you will be exempted from doing the required assignment. PowerPoint presentations: Use the following black and white template format for your PPT presentations Pictures must be in color Save as a PDF file with one slide per page Submit by email to the following address: [email protected] The subject line of the email should indicate: Assignment (number) Do not send other emails to this address. These will not be read or answered.
Transcript of Microbiology lab 2017 - University of Ottawamysite.science.uottawa.ca/jbasso/microlab/micro...
Microbiology lab 2017
Assignments General Directives
The first page must include the following information:
The assignment number
Course code :BIO3126
Your name or names
Your group number
The date
Assignments may be done and handed in individually or in groups of two (you and your partner). Assignments must be typewritten except for calculations which can be done by hand. Tables and graphs must be computer generated, clear and concise. Tables and graphs must have an appropriate title and a caption if appropriate Only hard copies of the assignments will be accepted. DO NOT EMAIL assignments. Assignments must be handed in to the appropriate teaching assistant at the indicated due date BEFORE you leave the lab. A 10% per day penalty will be imposed on late assignments. (Weekends will be counted as one day). If a valid reason, such as a medical reason, is given, you will be exempted from doing the required assignment. PowerPoint presentations: Use the following black and white template format for your PPT presentations Pictures must be in color Save as a PDF file with one slide per page Submit by email to the following address: [email protected] The subject line of the email should indicate: Assignment (number) Do not send other emails to this address. These will not be read or answered.
Microbiology lab 2017
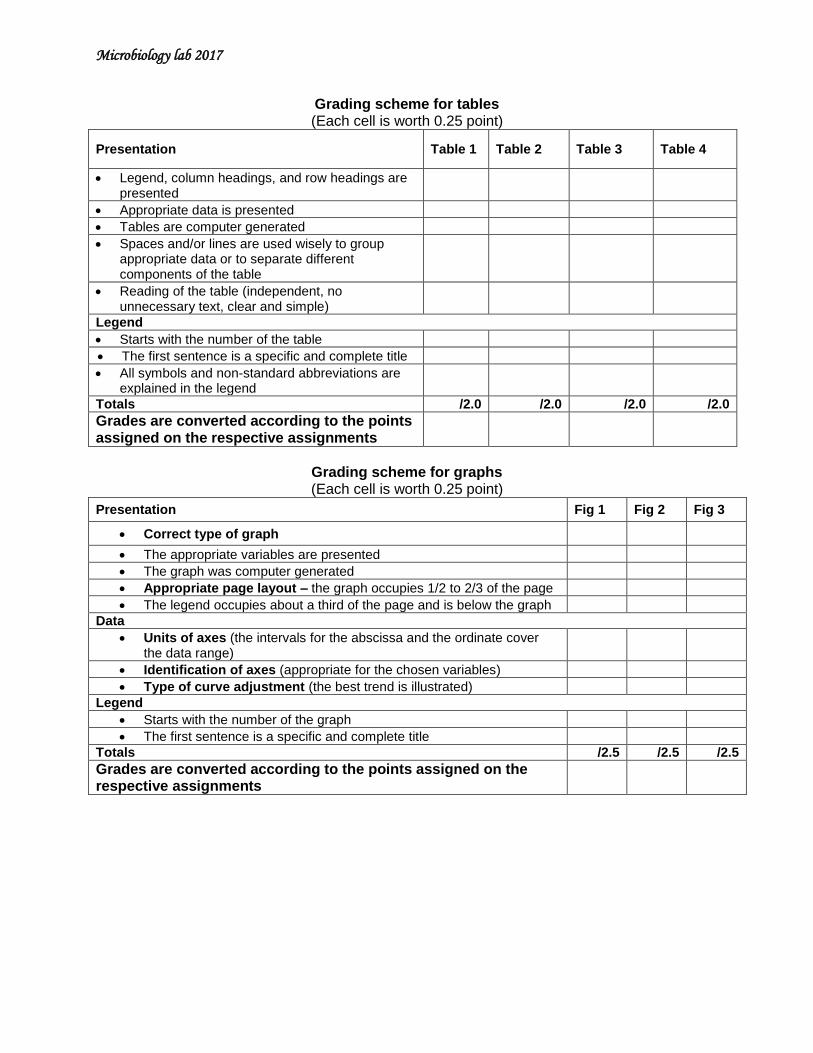
Grading scheme for tables (Each cell is worth 0.25 point)
Presentation Table 1 Table 2 Table 3 Table 4
Legend, column headings, and row headings are presented
Appropriate data is presented
Tables are computer generated
Spaces and/or lines are used wisely to group appropriate data or to separate different components of the table
Reading of the table (independent, no unnecessary text, clear and simple)
Legend
Starts with the number of the table
The first sentence is a specific and complete title
All symbols and non-standard abbreviations are explained in the legend
Totals /2.0 /2.0 /2.0 /2.0
Grades are converted according to the points assigned on the respective assignments
Grading scheme for graphs (Each cell is worth 0.25 point)
Presentation Fig 1 Fig 2 Fig 3
Correct type of graph
The appropriate variables are presented
The graph was computer generated
Appropriate page layout – the graph occupies 1/2 to 2/3 of the page
The legend occupies about a third of the page and is below the graph
Data
Units of axes (the intervals for the abscissa and the ordinate cover the data range)
Identification of axes (appropriate for the chosen variables)
Type of curve adjustment (the best trend is illustrated)
Legend
Starts with the number of the graph
The first sentence is a specific and complete title
Totals /2.5 /2.5 /2.5
Grades are converted according to the points assigned on the respective assignments
Microbiology lab 2017
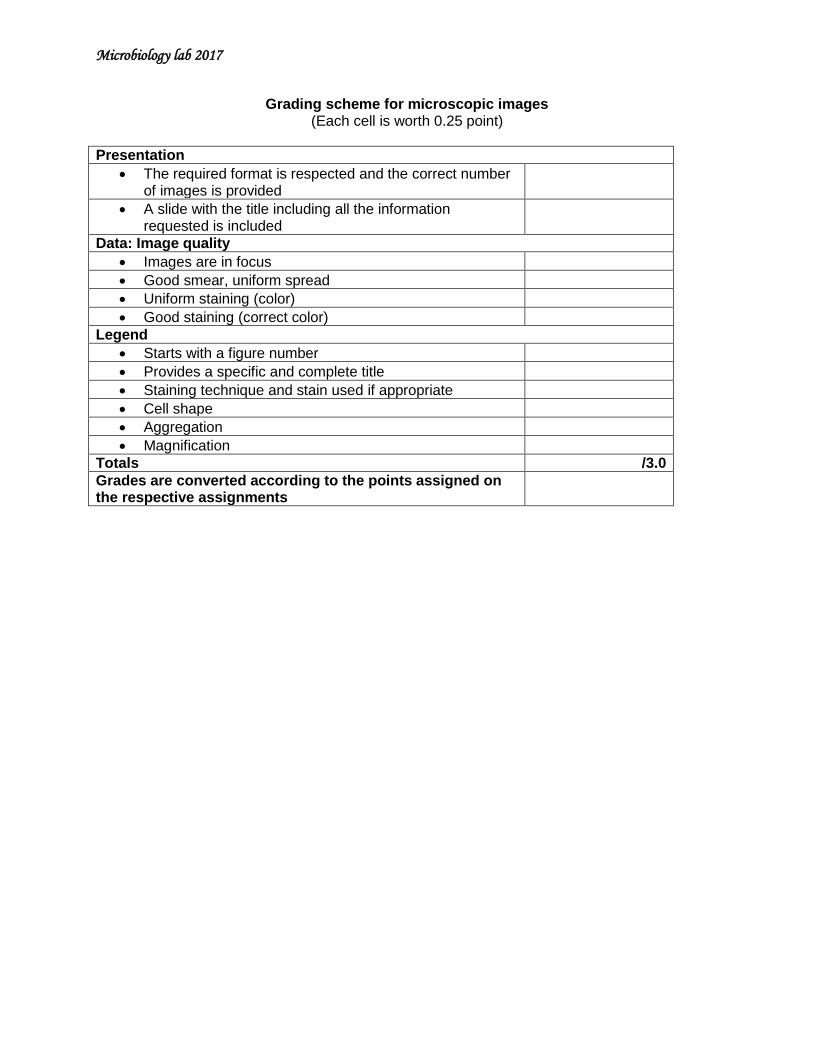
Grading scheme for microscopic images (Each cell is worth 0.25 point)
Presentation
The required format is respected and the correct number of images is provided
A slide with the title including all the information requested is included
Data: Image quality
Images are in focus
Good smear, uniform spread
Uniform staining (color)
Good staining (correct color)
Legend
Starts with a figure number
Provides a specific and complete title
Staining technique and stain used if appropriate
Cell shape
Aggregation
Magnification
Totals /3.0
Grades are converted according to the points assigned on the respective assignments
Microbiology lab 2017
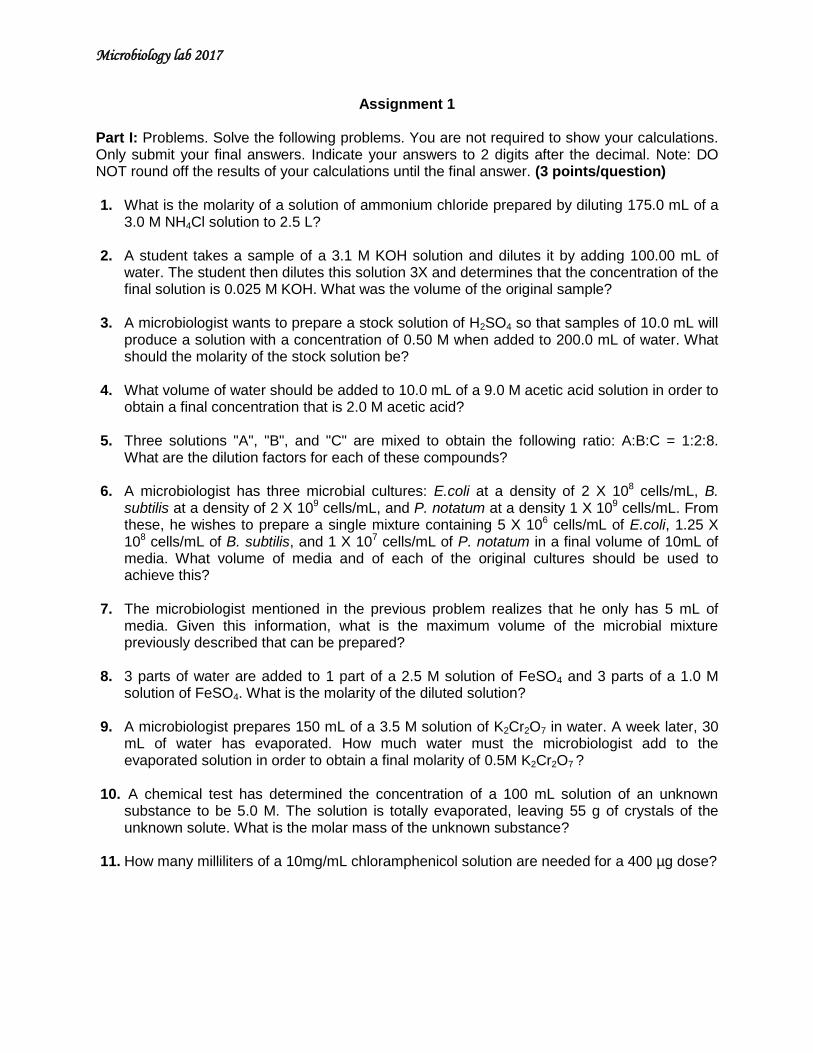
Assignment 1
Part I: Problems. Solve the following problems. You are not required to show your calculations. Only submit your final answers. Indicate your answers to 2 digits after the decimal. Note: DO NOT round off the results of your calculations until the final answer. (3 points/question) 1. What is the molarity of a solution of ammonium chloride prepared by diluting 175.0 mL of a
3.0 M NH4Cl solution to 2.5 L?
2. A student takes a sample of a 3.1 M KOH solution and dilutes it by adding 100.00 mL of water. The student then dilutes this solution 3X and determines that the concentration of the final solution is 0.025 M KOH. What was the volume of the original sample?
3. A microbiologist wants to prepare a stock solution of H2SO4 so that samples of 10.0 mL will produce a solution with a concentration of 0.50 M when added to 200.0 mL of water. What should the molarity of the stock solution be?
4. What volume of water should be added to 10.0 mL of a 9.0 M acetic acid solution in order to
obtain a final concentration that is 2.0 M acetic acid? 5. Three solutions "A", "B", and "C" are mixed to obtain the following ratio: A:B:C = 1:2:8.
What are the dilution factors for each of these compounds?
6. A microbiologist has three microbial cultures: E.coli at a density of 2 X 10⁸ cells/mL, B. subtilis at a density of 2 X 10⁹ cells/mL, and P. notatum at a density 1 X 10⁹ cells/mL. From these, he wishes to prepare a single mixture containing 5 X 10⁶ cells/mL of E.coli, 1.25 X 10⁸ cells/mL of B. subtilis, and 1 X 10⁷ cells/mL of P. notatum in a final volume of 10mL of media. What volume of media and of each of the original cultures should be used to achieve this?
7. The microbiologist mentioned in the previous problem realizes that he only has 5 mL of media. Given this information, what is the maximum volume of the microbial mixture previously described that can be prepared?
8. 3 parts of water are added to 1 part of a 2.5 M solution of FeSO4 and 3 parts of a 1.0 M
solution of FeSO4. What is the molarity of the diluted solution?
9. A microbiologist prepares 150 mL of a 3.5 M solution of K2Cr2O7 in water. A week later, 30 mL of water has evaporated. How much water must the microbiologist add to the evaporated solution in order to obtain a final molarity of 0.5M K2Cr2O7 ?
10. A chemical test has determined the concentration of a 100 mL solution of an unknown substance to be 5.0 M. The solution is totally evaporated, leaving 55 g of crystals of the unknown solute. What is the molar mass of the unknown substance?
11. How many milliliters of a 10mg/mL chloramphenicol solution are needed for a 400 µg dose?

Microbiology lab 2017
12. A pharmacist hands you a 1.0L bottle of a 10.8% (m/v) NaCl solution and asks that you mix it with sterile water to make as much of a 0.1M solution as possible. How much sterile water would you use? (MW of NaCl 58.0 g/mole)?
13. The following dilutions were performed to determine the concentration of bacteria in a
culture. What was the concentration of bacteria in the stock? 2 mL 1 mL 5 mL 10 mL stock 6 mL 8 mL 20 mL 10 mL 14. 50mL of sodium cyanide poison leaked from a bottle, which originally contained 100mL, into
a bucket of water containing 300mL of water. After the leak the concentration of poison in the bucket was found to be 0.1 M. If the molecular weight of sodium cyanide is 60g/mole, how many grams of sodium cyanide remain in the bottle?
15. Concentrated hydrochloric acid has a concentration of 37.7% (m/m). What is its molar concentration? (The density of the solution is 1.19 g/mL and MW of HCL: 36g/mole)
16. What volume of water would be required to prepare a solution containing 300 grams of a compound (M.W. 50g/mole; density: 1.5g/mL) which was at a final concentration of 3.0 M?
In the following problems, assume that the volume of solvent is equal to the volume of the solution. The following diagram represents two solutions (A and B) separated by a water permeable membrane which is impermeable to solutes. Use this as the initial condition to answer questions 17-20.
17. What are the osmolarities of solutions A and B in the original condition?
18. What is the osmotic relationship of solution A relatively to solution B?
19. What will be the osmolarity in compartment A once osmosis is complete?
20. What volume of water was displaced in or out of compartment A?
0.2 mL 150 colonies
A.
500 osmoles
10 litres
B.
300 osmoles
6 litres
Microbiology lab 2017
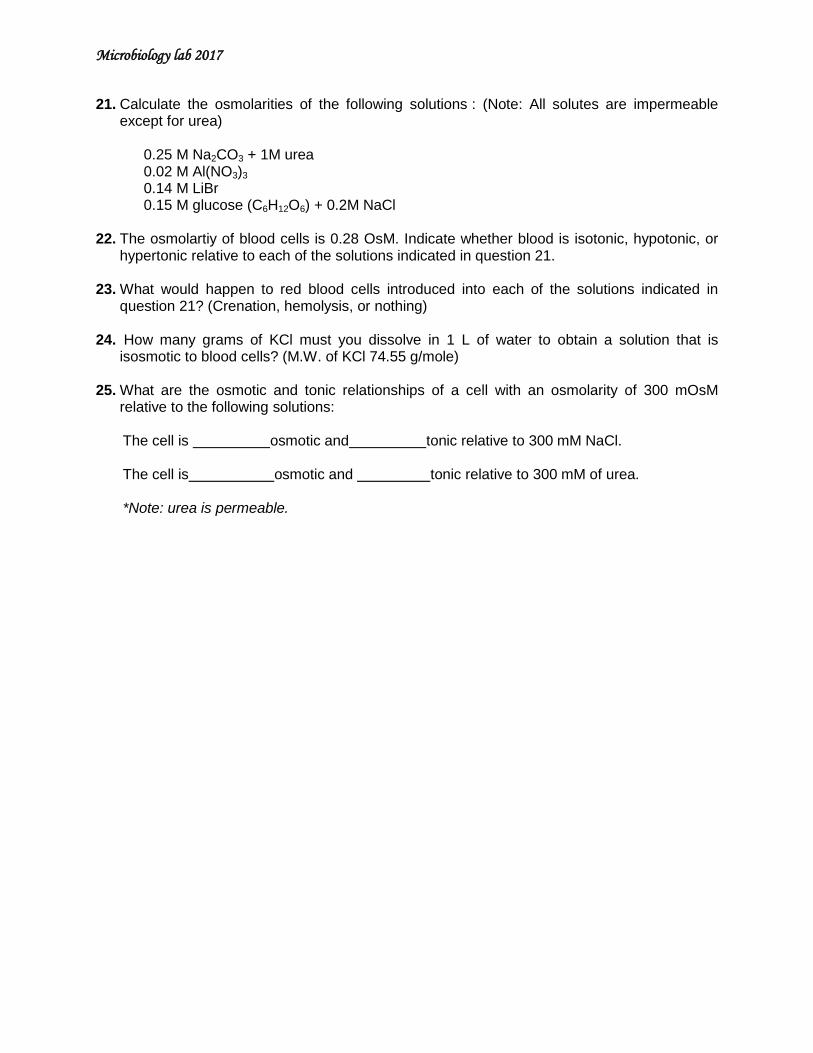
21. Calculate the osmolarities of the following solutions : (Note: All solutes are impermeable except for urea)
0.25 M Na2CO3 + 1M urea 0.02 M Al(NO3)3 0.14 M LiBr 0.15 M glucose (C6H12O6) + 0.2M NaCl
22. The osmolartiy of blood cells is 0.28 OsM. Indicate whether blood is isotonic, hypotonic, or hypertonic relative to each of the solutions indicated in question 21.
23. What would happen to red blood cells introduced into each of the solutions indicated in question 21? (Crenation, hemolysis, or nothing)
24. How many grams of KCl must you dissolve in 1 L of water to obtain a solution that is isosmotic to blood cells? (M.W. of KCl 74.55 g/mole)
25. What are the osmotic and tonic relationships of a cell with an osmolarity of 300 mOsM relative to the following solutions: The cell is osmotic and tonic relative to 300 mM NaCl. The cell is osmotic and tonic relative to 300 mM of urea. *Note: urea is permeable.
Microbiology lab 2017
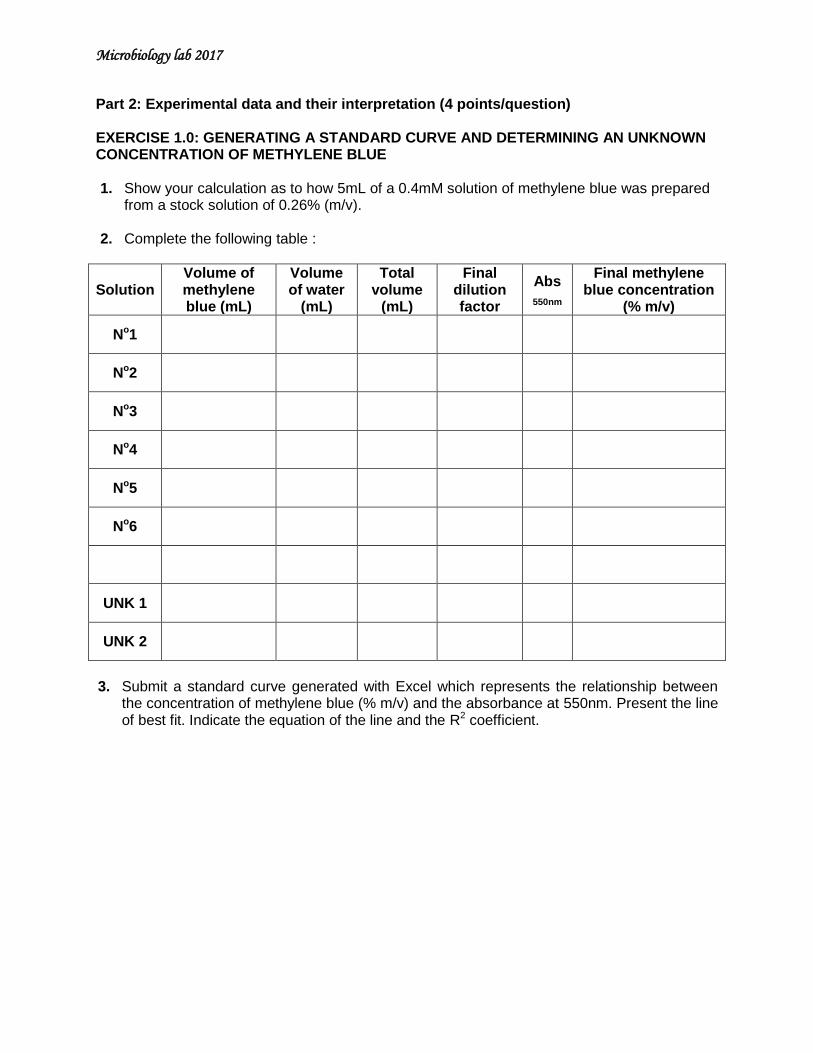
Part 2: Experimental data and their interpretation (4 points/question) EXERCISE 1.0: GENERATING A STANDARD CURVE AND DETERMINING AN UNKNOWN CONCENTRATION OF METHYLENE BLUE 1. Show your calculation as to how 5mL of a 0.4mM solution of methylene blue was prepared
from a stock solution of 0.26% (m/v). 2. Complete the following table :
Solution Volume of methylene blue (mL)
Volume of water
(mL)
Total volume
(mL)
Final dilution factor
Abs
550nm
Final methylene blue concentration
(% m/v)
No1
No2
No3
No4
No5
No6
UNK 1
UNK 2
3. Submit a standard curve generated with Excel which represents the relationship between
the concentration of methylene blue (% m/v) and the absorbance at 550nm. Present the line of best fit. Indicate the equation of the line and the R2 coefficient.
Microbiology lab 2017
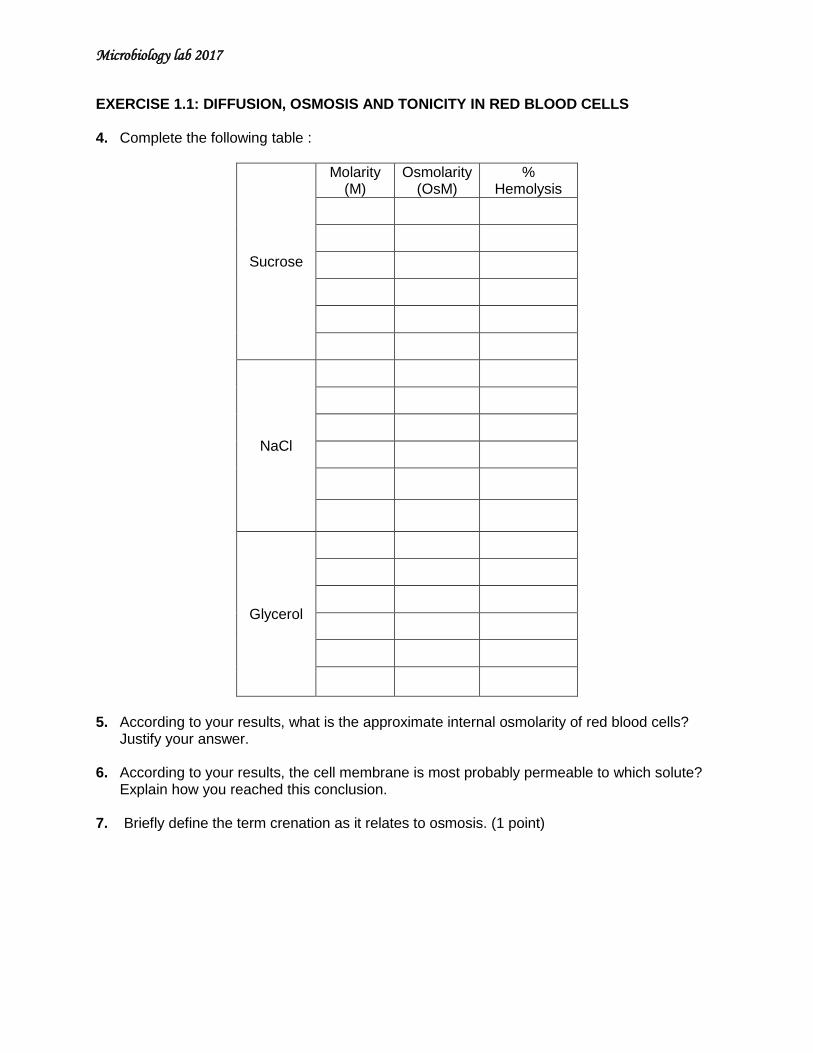
EXERCISE 1.1: DIFFUSION, OSMOSIS AND TONICITY IN RED BLOOD CELLS 4. Complete the following table :
Sucrose
Molarity (M)
Osmolarity (OsM)
% Hemolysis
NaCl
Glycerol
5. According to your results, what is the approximate internal osmolarity of red blood cells?
Justify your answer.
6. According to your results, the cell membrane is most probably permeable to which solute? Explain how you reached this conclusion.
7. Briefly define the term crenation as it relates to osmosis. (1 point)
Microbiology lab 2017
Assignment 2
Part 1: Problems and theoretical questions. You are not required to show your calculations. Only submit your final answers. Indicate your answers to 2 digits after the decimal. Note: DO NOT round off the results of your calculations until the final answer. (5 points/question) 1. To assess the number of bacteria in ground beef, a 10 g sample of meat is homogenized in
75mL of water resulting in a total volume of 85mL. A 3mL sample of the meat suspension is
then diluted by a factor of 104X. 1mL of the final dilution is then added to 2 mL of saline
from which 0.1mL was plated. If 100 colonies were observed on the plate, what was the
original number of bacteria/g of ground beef?
2. You perform the following serial dilutions: 1/12, 1/2.5, and 1:4. What are your final dilution
and your final dilution factor?
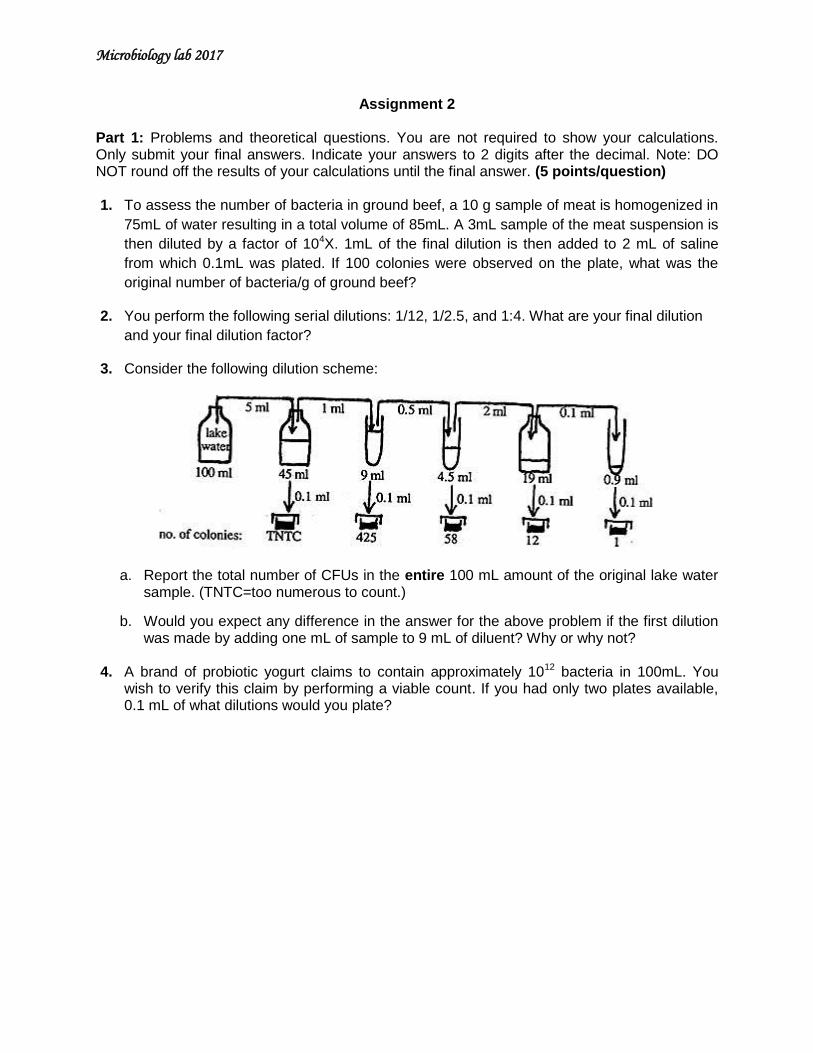
3. Consider the following dilution scheme:
a. Report the total number of CFUs in the entire 100 mL amount of the original lake water sample. (TNTC=too numerous to count.)
b. Would you expect any difference in the answer for the above problem if the first dilution was made by adding one mL of sample to 9 mL of diluent? Why or why not?
4. A brand of probiotic yogurt claims to contain approximately 1012 bacteria in 100mL. You
wish to verify this claim by performing a viable count. If you had only two plates available, 0.1 mL of what dilutions would you plate?
Microbiology lab 2017
5. You setup an MPN to determine the number of bacteria/gram of Camembert cheese. To do so, 10 g of cheese are homogenized in a final volume of 50mL. The suspension is then used to perform a three tubes MPN assay. You obtain the results indicated in the table below. You also perform a viable count from the same suspension. What dilution of the suspension should you plate to confirm the MPN result; assuming that you plate 0.1mL? Indicate the dilution and the expected number of colonies.
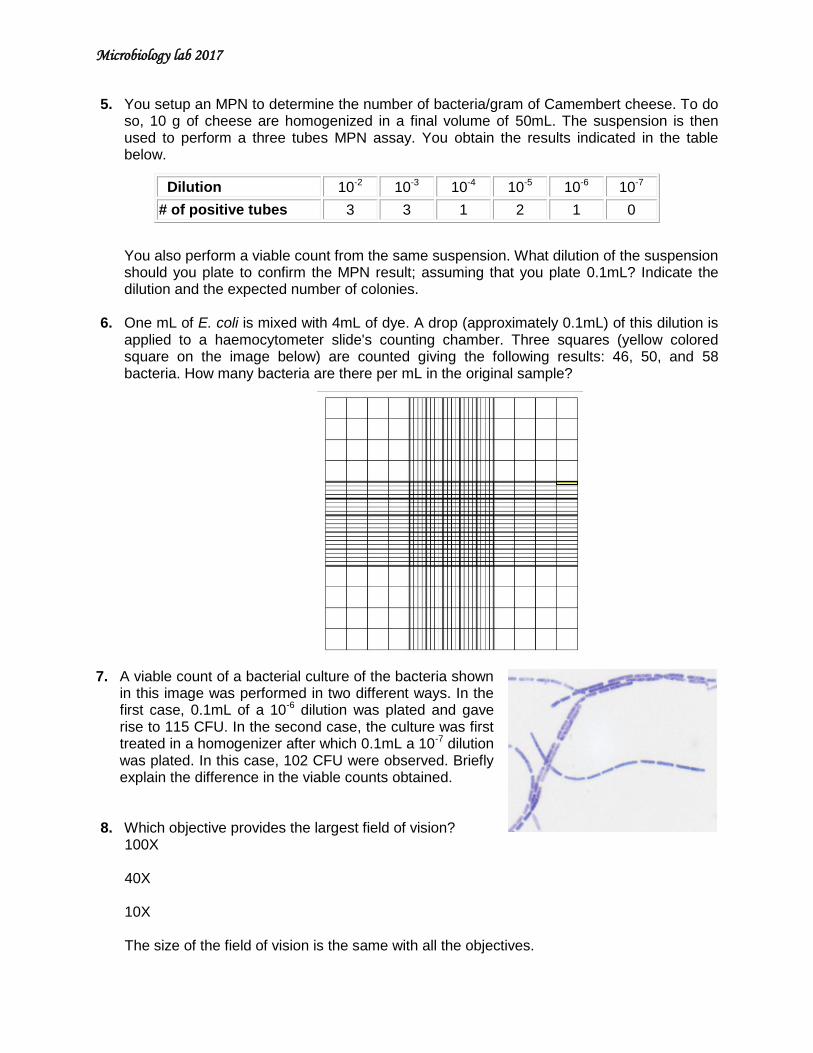
6. One mL of E. coli is mixed with 4mL of dye. A drop (approximately 0.1mL) of this dilution is applied to a haemocytometer slide's counting chamber. Three squares (yellow colored square on the image below) are counted giving the following results: 46, 50, and 58 bacteria. How many bacteria are there per mL in the original sample?
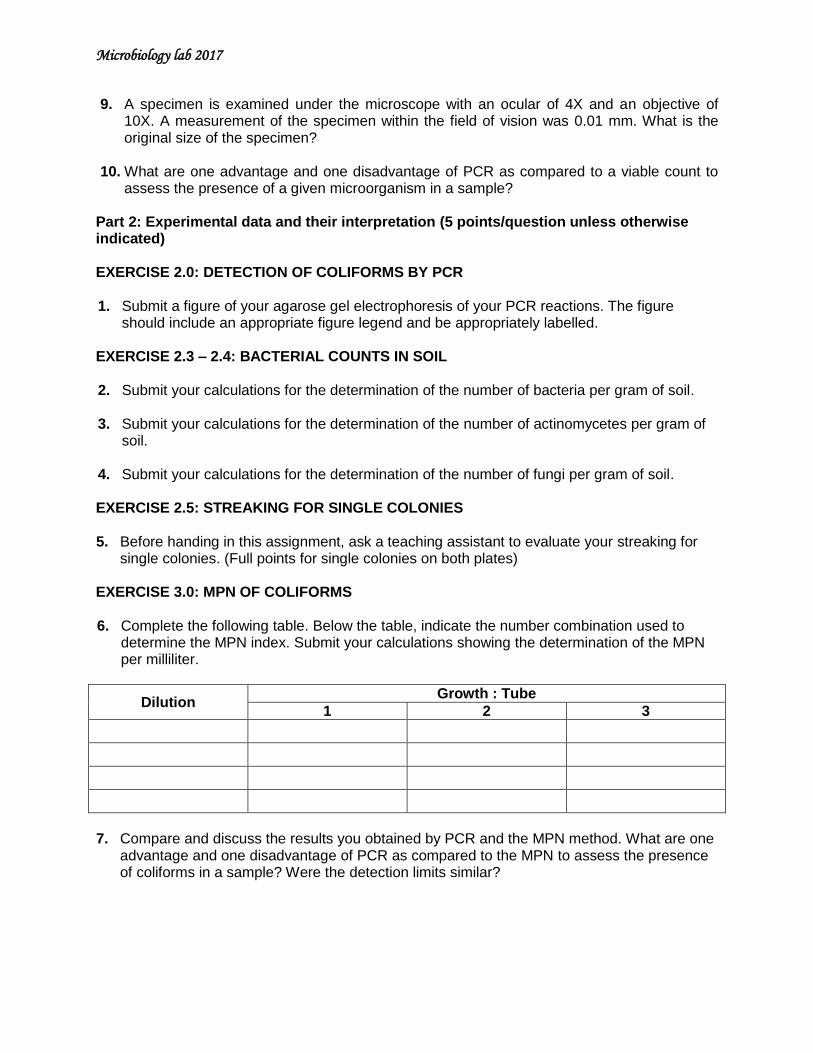
7. A viable count of a bacterial culture of the bacteria shown
in this image was performed in two different ways. In the first case, 0.1mL of a 10-6 dilution was plated and gave rise to 115 CFU. In the second case, the culture was first treated in a homogenizer after which 0.1mL a 10-7 dilution was plated. In this case, 102 CFU were observed. Briefly explain the difference in the viable counts obtained.
8. Which objective provides the largest field of vision?
100X 40X 10X The size of the field of vision is the same with all the objectives.
Dilution 10-2 10-3
10-4 10-5
10-6 10-7
# of positive tubes 3 3 1 2 1 0
Microbiology lab 2017
9. A specimen is examined under the microscope with an ocular of 4X and an objective of 10X. A measurement of the specimen within the field of vision was 0.01 mm. What is the original size of the specimen?
10. What are one advantage and one disadvantage of PCR as compared to a viable count to assess the presence of a given microorganism in a sample?
Part 2: Experimental data and their interpretation (5 points/question unless otherwise indicated) EXERCISE 2.0: DETECTION OF COLIFORMS BY PCR 1. Submit a figure of your agarose gel electrophoresis of your PCR reactions. The figure
should include an appropriate figure legend and be appropriately labelled. EXERCISE 2.3 – 2.4: BACTERIAL COUNTS IN SOIL 2. Submit your calculations for the determination of the number of bacteria per gram of soil.
3. Submit your calculations for the determination of the number of actinomycetes per gram of
soil.
4. Submit your calculations for the determination of the number of fungi per gram of soil. EXERCISE 2.5: STREAKING FOR SINGLE COLONIES
5. Before handing in this assignment, ask a teaching assistant to evaluate your streaking for
single colonies. (Full points for single colonies on both plates) EXERCISE 3.0: MPN OF COLIFORMS 6. Complete the following table. Below the table, indicate the number combination used to
determine the MPN index. Submit your calculations showing the determination of the MPN per milliliter.
Dilution Growth : Tube
1 2 3
7. Compare and discuss the results you obtained by PCR and the MPN method. What are one
advantage and one disadvantage of PCR as compared to the MPN to assess the presence of coliforms in a sample? Were the detection limits similar?
Microbiology lab 2017
EXERCISE 3.1: DIRECT COUNT OF A YEAST SUSPENSION 8. Submit your calculations for the determination of the number of yeast cells per milliliter in the
original suspension. Make sure to indicate the following information: Dimensions of the squares from which the counts were obtained, the three counts, and the average number of cells per square.
EXERCISE 3.3: MICROSCOPIC VISUALIZATION OF BACTERIA – SIMPLE STAINS (10 points) 9. Submit a PPT presentation of your simple stains as indicated in the general directives.

Microbiology lab 2017
Assignment 3 Part 1: Problems and theoretical questions. You are not required to show your calculations. Only submit your final answers. Indicate your answers to 2 digits after the decimal. Note: DO NOT round off the results of your calculations until the final answer. (5 points/question) 1. What color would bacteria of the genus Bacillus and bacteria of the genus Salmonella be if
the ethanol wash was not done in the Gram staining procedure?
Purple and red respectively Red and purple respectively Blue and red respectively Both would be red Both would be purple
2. Let’s assume that for a prolonged period of time your diet was deficient in niacin; an
essential vitamin which the human body cannot synthesize. What would be the direct effect of this deficiency on each of the following metabolic pathways? (A decrease in the activity, an increase in the activity or no effect)
Glycolysis The Krebs cycle Transfer of electrons through the electron transport chain
3. A bacterial culture is sampled at two time points representing an interval of 1 hour and 10 minutes. 3.2 x 10⁶ cells/mL were present in the first sample and 5.12 x 10⁷ cells/mL in the second sample. How many times did the population double within the time span examined?
4. Cultures from the tissues of a patient with syphilis are done on samples taken at an interval of one week. The first sample had 5000 CFUs, whereas the second sample had 32000 CFUs. Four days later, a third sample had 58000 CFUs. Is the population in exponential growth?
5. A biologist studies a newly discovered bacterial species. At time t = 0 h, he introduces one hundred bacteria in a favorable growth media. Six hours later, he counts 450 bacteria. Assuming exponential growth, what is the growth rate (µ) of these bacteria?
6. A bacterial population doubles every 3 hours. Given that there were initially 100 bacteria, how many bacteria would there be after one day and a half?
7. A sample of milk contains 107 cells/mL of B. cereus, which has a D value at 75oC of 30 seconds, and 109 cells/mL of S. sonnei, which has a D value at 75oC of 15 seconds. In order to pasteurize the milk, you wish to reduce the bacterial count to 106 bacteria/mL. According to this information, what is the minimum amount of time at 75oC required to achieve this goal?
8. A sample of chicken which initially contained 107 cells of S. typhimurium had 10 cells after a treatment of 1 hour at 90oC. According to this information, what is the D value of Salmonella at 90oC?
Microbiology lab 2017
9. A mouthwash claims to reduce 99.99% of the bacterial population in the mouth. The recommended use, asks that individuals rinse their mouths for a total of 2 minutes. Assuming an average initial bacterial load of 108 cells/mL, how much time would be required for the mouthwash to reduce the bacterial population by 90%?
10. Consider the information presented in the previous question. 0.1 mL of what tenfold dilution would you plate to verify the claims of this mouthwash?
Part 2: Experimental data and their interpretation (5 points/question) EXERCISE 5.0: E.COLI GROWTH CURVE 11. Submit a graph with two growth curves (room temperature and 37oC) which respects the
following criteria : o Changes in optical density as a function of time o Each curve must have 32 time points representing the interval T0 – T16h o Consider the cultures inoculated at 10 o’clock = T0, those inoculated at 11
o’clock =T1h, those inoculated at 12 o’cock = T2h and those inoculated at 1 o’clock = T2h
12. Determine from your profiles the generation time and the growth rates of the two cultures. EXERCISE 5.1: YEAST FERMENTATION BIOASSAY 13. Submit a graph with 4 curves illustrating the production of moles of ethanol as a function of
time with each of the quantities of glucose.
14. Submit a table presenting the rates of ethanol production (moles/min.) and the final yields of ethanol after one hour as a function of grams of glucose (moles of ethanol/g of glucose).
15. Submit a graph with 4 curves illustrating the production of moles of ethanol as a function of time for each of the volumes of the drink you were assigned.
16. Submit a table presenting the rates of ethanol production (moles/min.) and the final yields of ethanol after one hour as a function of volume of the drink you was assigned (moles of ethanol/mL of drink).
17. According to your results what is the approximate amount of sugar in the drink you were assigned. Briefly explain how you reached your conclusion.
EXERCISE 5.2: DIFFERENTIAL STAINS AND STERILIZATION 18. Submit a table which presents the following information: Exposure time to microwaves,
Number of viable cells/mL, percent of viable cells, and percent reduction in viability.
19. Submit a graph presenting the log of the number of viable cells/mL as a function of the time of exposure to microwaves. Present the line of best fit.
20. Use the following formula to determine the D value under the conditions tested. (D = t/(logNo – logN)). According to this D value, how much time would be required to reduce the population to 10-6 cells/mL?
Microbiology lab 2017
Assignment 4
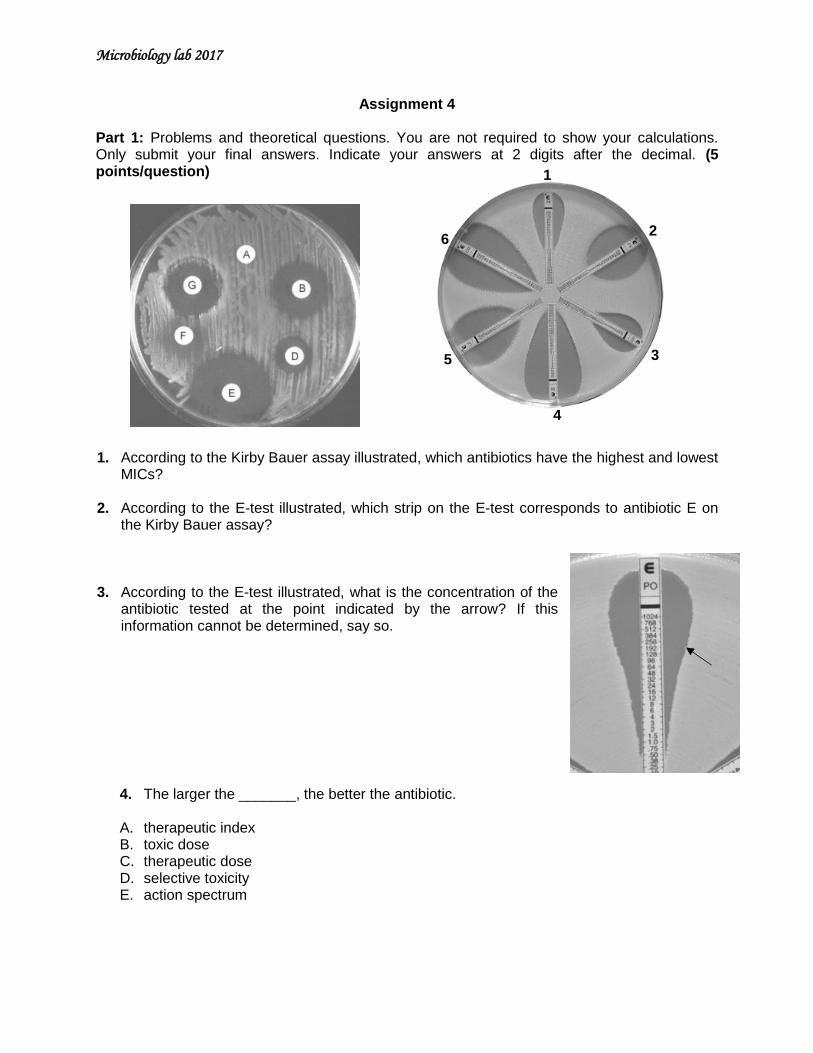
Part 1: Problems and theoretical questions. You are not required to show your calculations. Only submit your final answers. Indicate your answers at 2 digits after the decimal. (5 points/question) 1. According to the Kirby Bauer assay illustrated, which antibiotics have the highest and lowest
MICs?
2. According to the E-test illustrated, which strip on the E-test corresponds to antibiotic E on the Kirby Bauer assay?
3. According to the E-test illustrated, what is the concentration of the antibiotic tested at the point indicated by the arrow? If this information cannot be determined, say so.
4. The larger the _______, the better the antibiotic.
A. therapeutic index B. toxic dose C. therapeutic dose D. selective toxicity E. action spectrum
1
2
4
3
6
5
Microbiology lab 2017
5. An antibiotic which targets which of the following would be expected to have the lowest selective toxicity?
A. Synthesis of bacterial DNA. B. Synthesis of bacterial RNA. C. Synthesis of bacterial cell walls. D. Bacterial plasma membrane. E. Bacterial ribosomes.
6. Which of the following is a natural antibiotic with a beta-lactam ring? A. Cephalosporin B. Penicillin C. Tetracycline D. Chloramphenicol E. Streptomycin
7. Which antibacterial drug does not inhibit protein synthesis? A. Aminoglycoside B. Tetracycline C. Ampicillin D. Chloramphenicol E. Erythromycin
8. Antibiotics that inhibit synthesis of the bacterial cell wall are active only against what type of
cells? A. Gram negative B. Dormant C. Actively growing D. Endospores E. Gram positive
9. Which of the following antibiotics would be effective in treating a yeast infection? A. Cephalosporin B. Tetracycline C. Chloramphenicol D. Streptomycin E. None of them 10. Which of the following antibiotics is dependent on osmotic pressure to kill the cells? A. Cephalosporin B. Tetracycline C. Chloramphenicol D. Streptomycin E. None of them 11. Which of the following antibiotics has the highest selective toxicity? A. Cephalosporin B. Tetracycline C. Chloramphenicol D. Streptomycin E. Cyanide
Microbiology lab 2017
12. Lysozyme and penicillin are both antimicrobial compounds which act on the cell wall. Both of these compounds would be effective against what type of cells?
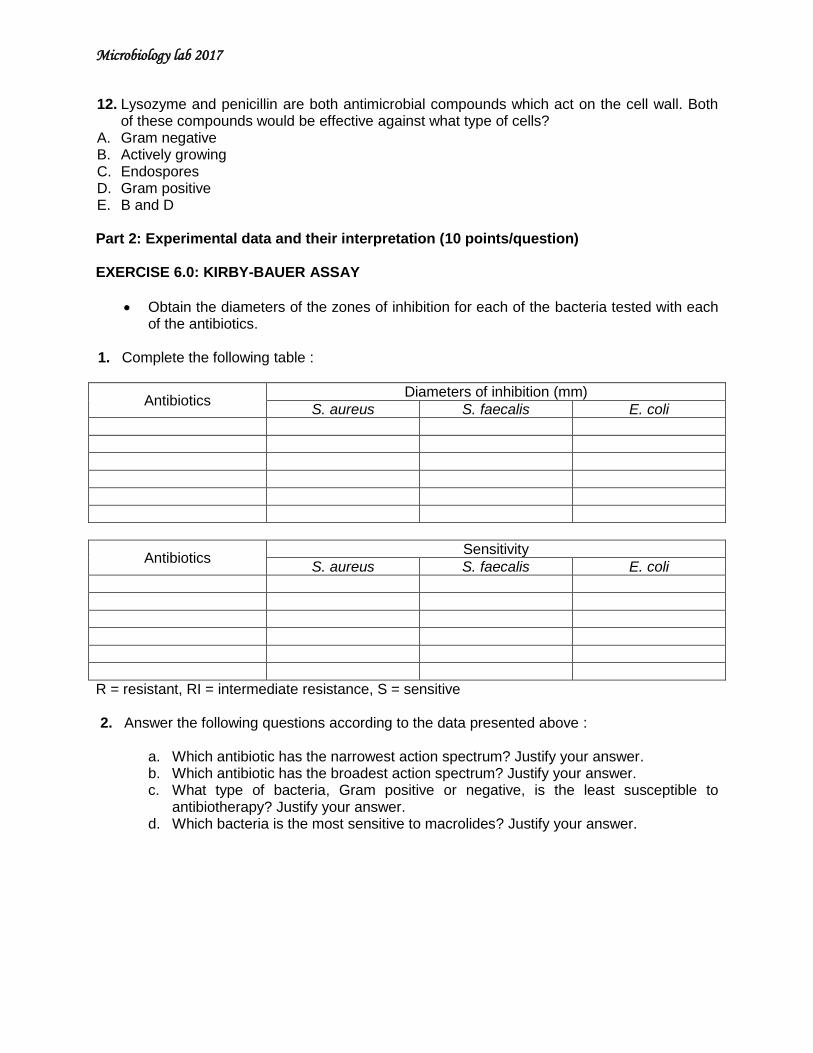
A. Gram negative B. Actively growing C. Endospores D. Gram positive E. B and D Part 2: Experimental data and their interpretation (10 points/question) EXERCISE 6.0: KIRBY-BAUER ASSAY
Obtain the diameters of the zones of inhibition for each of the bacteria tested with each of the antibiotics.
1. Complete the following table :
Antibiotics Diameters of inhibition (mm)
S. aureus S. faecalis E. coli
Antibiotics Sensitivity
S. aureus S. faecalis E. coli
R = resistant, RI = intermediate resistance, S = sensitive 2. Answer the following questions according to the data presented above :
a. Which antibiotic has the narrowest action spectrum? Justify your answer. b. Which antibiotic has the broadest action spectrum? Justify your answer. c. What type of bacteria, Gram positive or negative, is the least susceptible to
antibiotherapy? Justify your answer. d. Which bacteria is the most sensitive to macrolides? Justify your answer.
Microbiology lab 2017
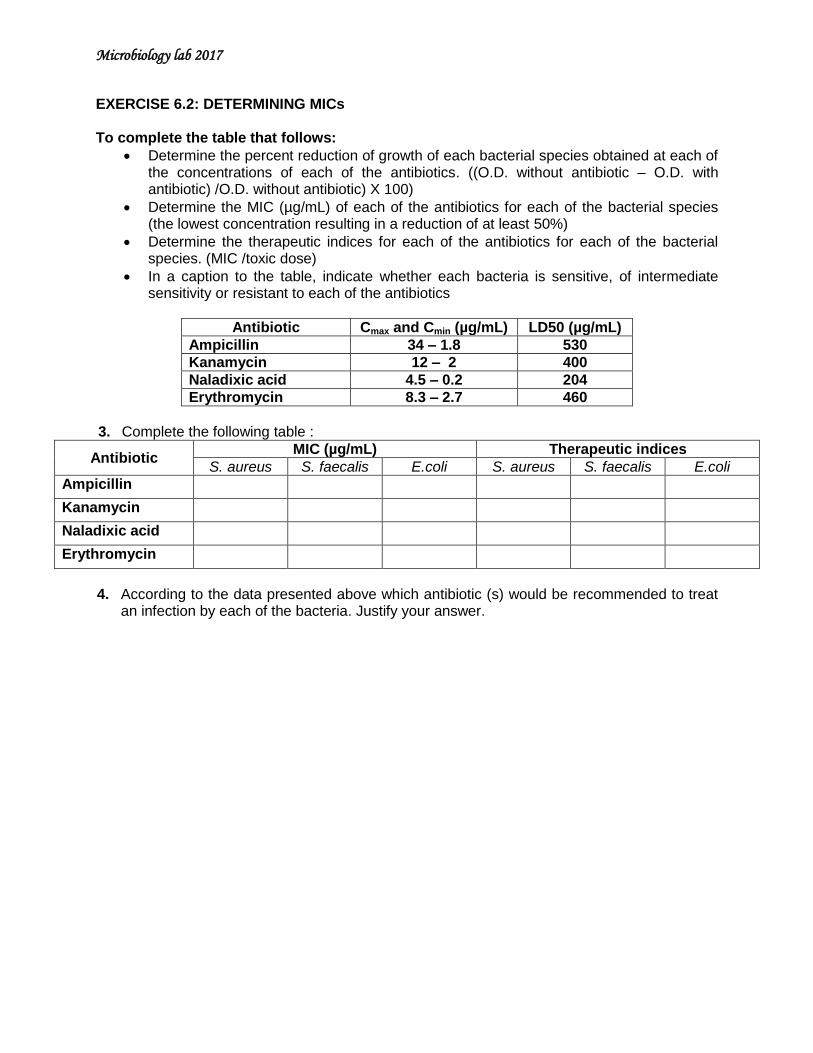
EXERCISE 6.2: DETERMINING MICs To complete the table that follows:
Determine the percent reduction of growth of each bacterial species obtained at each of the concentrations of each of the antibiotics. ((O.D. without antibiotic – O.D. with antibiotic) /O.D. without antibiotic) X 100)
Determine the MIC (µg/mL) of each of the antibiotics for each of the bacterial species (the lowest concentration resulting in a reduction of at least 50%)
Determine the therapeutic indices for each of the antibiotics for each of the bacterial species. (MIC /toxic dose)
In a caption to the table, indicate whether each bacteria is sensitive, of intermediate sensitivity or resistant to each of the antibiotics
Antibiotic Cmax and Cmin (µg/mL) LD50 (µg/mL)
Ampicillin 34 – 1.8 530
Kanamycin 12 – 2 400
Naladixic acid 4.5 – 0.2 204
Erythromycin 8.3 – 2.7 460
3. Complete the following table :
Antibiotic MIC (µg/mL) Therapeutic indices
S. aureus S. faecalis E.coli S. aureus S. faecalis E.coli
Ampicillin
Kanamycin
Naladixic acid
Erythromycin
4. According to the data presented above which antibiotic (s) would be recommended to treat
an infection by each of the bacteria. Justify your answer.
Microbiology lab 2017
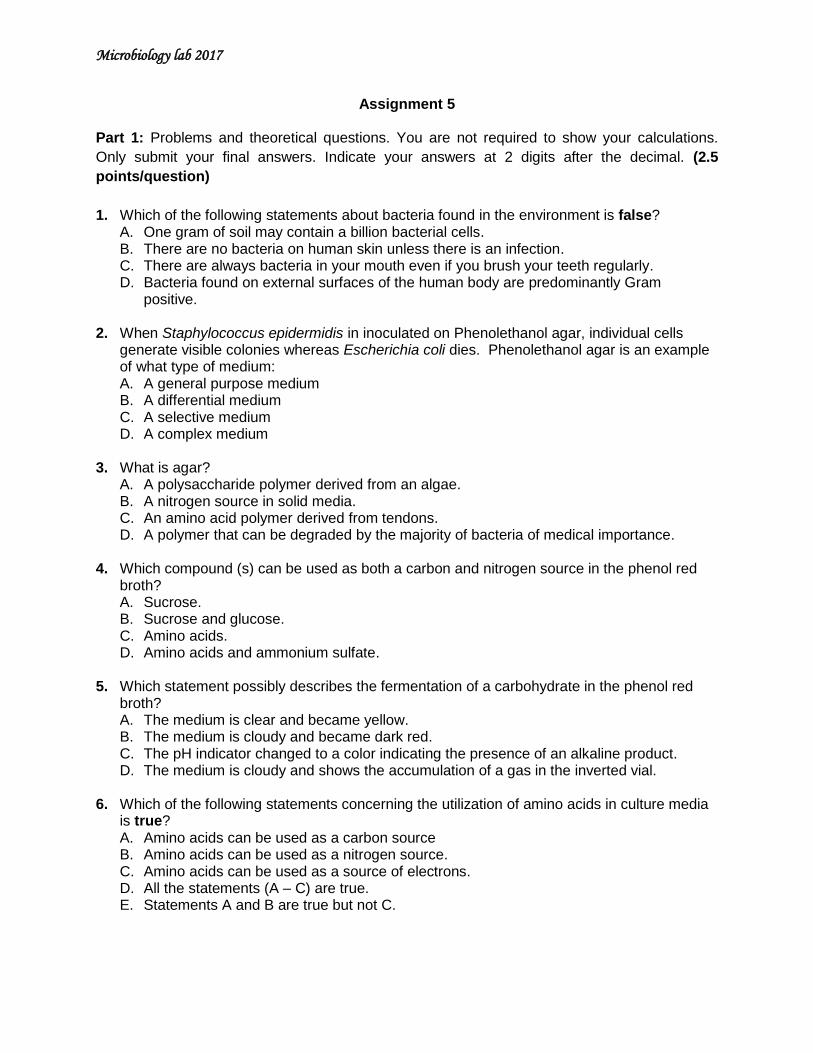
Assignment 5
Part 1: Problems and theoretical questions. You are not required to show your calculations.
Only submit your final answers. Indicate your answers at 2 digits after the decimal. (2.5
points/question)
1. Which of the following statements about bacteria found in the environment is false? A. One gram of soil may contain a billion bacterial cells. B. There are no bacteria on human skin unless there is an infection. C. There are always bacteria in your mouth even if you brush your teeth regularly. D. Bacteria found on external surfaces of the human body are predominantly Gram
positive.
2. When Staphylococcus epidermidis in inoculated on Phenolethanol agar, individual cells generate visible colonies whereas Escherichia coli dies. Phenolethanol agar is an example of what type of medium: A. A general purpose medium B. A differential medium C. A selective medium D. A complex medium
3. What is agar?
A. A polysaccharide polymer derived from an algae. B. A nitrogen source in solid media. C. An amino acid polymer derived from tendons. D. A polymer that can be degraded by the majority of bacteria of medical importance.
4. Which compound (s) can be used as both a carbon and nitrogen source in the phenol red
broth? A. Sucrose. B. Sucrose and glucose. C. Amino acids. D. Amino acids and ammonium sulfate.
5. Which statement possibly describes the fermentation of a carbohydrate in the phenol red
broth? A. The medium is clear and became yellow. B. The medium is cloudy and became dark red. C. The pH indicator changed to a color indicating the presence of an alkaline product. D. The medium is cloudy and shows the accumulation of a gas in the inverted vial.
6. Which of the following statements concerning the utilization of amino acids in culture media
is true? A. Amino acids can be used as a carbon source B. Amino acids can be used as a nitrogen source. C. Amino acids can be used as a source of electrons. D. All the statements (A – C) are true. E. Statements A and B are true but not C.

Microbiology lab 2017
7. You grow two bacteria on agar plates containing only starch as a carbon source and make the following observations:
Which conclusion is legitimate? A. Bacteria A and B secrete amylase. B. Bacteria A and B can use glucose as a carbon source. C. Bacteria A degrades agar. D. Bacteria B secretes amylase, but not bacteria A. 8. Which characteristic (s) is (are) common to the phenol red broth, the urea slant, and the TSI
slant? A. These media contain phenol red. B. They are media which allow the detection of fermentation. C. They are media which allow the detection of acid production. D. They are media that allow to determine the nitrogen source used.
9 – 12 match the appropriate answer to each of the statements. Some answers may be used more than once and some may not be used at all. A. Phenol red sucrose B. Milk agar C. Simmon’s citrate slant D. Phenylalanine agar slant E. SIM 9. Used to verify the degradation of tryptophan.
10. Used to verify the production of phenylpyruvic acid.
11. Used to verify the secretion of extracellular enzymes.
12. Used to verify the degradation of cysteine.
13 – 16 match each of the reagents or compound with its appropriate goal. Some answers may be used more than once and some may not be used at all. A. Kovacs reagent B. Ferric sulfate C. Sterile mineral oil D. Iodine E. Yeast extract 13. Used to detect the presence of H2S.
14. Used to reduce the availability of oxygen. 15. Used as a source of vitamins, amino acids and other nutrients.
A B A B
Microbiology lab 2017
16. Used to determine the presence of starch. 17 – 20 Match each of the bacteriological tests with the observations for a positive test. Some answers may be used more than once and some may not be used at all. Appearance of a positive test
A. Clear zone following the addition of a chemical reagent.
B. Clearing around the bacterial growth.
C. The medium turns blue.
D. The reagent becomes red following its addition. 17. Amylase test.
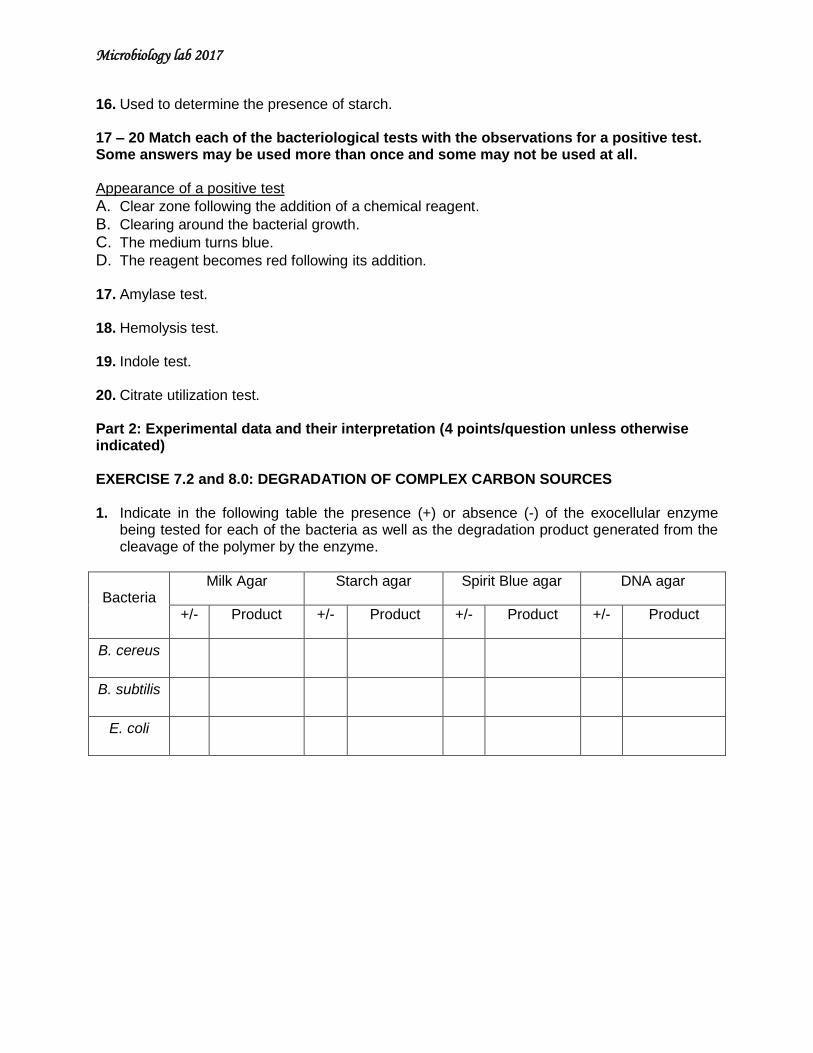
18. Hemolysis test. 19. Indole test. 20. Citrate utilization test. Part 2: Experimental data and their interpretation (4 points/question unless otherwise indicated) EXERCISE 7.2 and 8.0: DEGRADATION OF COMPLEX CARBON SOURCES 1. Indicate in the following table the presence (+) or absence (-) of the exocellular enzyme
being tested for each of the bacteria as well as the degradation product generated from the cleavage of the polymer by the enzyme.
Bacteria Milk Agar Starch agar Spirit Blue agar DNA agar
+/- Product +/- Product +/- Product +/- Product
B. cereus
B. subtilis
E. coli

Microbiology lab 2017
EXERCISE 7.3 and 8.1: METABOLISM IN PHENOL RED BROTH 2. Indicate in the following table the color of the medium, the presence (+) or absence (-) of
acid, and the metabolism (O: oxidative or F: fermentative) for each of the bacteria.
Bacteria
Glucose Lactose Sucrose
Color Gas Metabolism Color Gas Metabolism Color Gas Metabolism
P. miribalis
P. aeruginosa
E. coli
E. aerogenes
EXERCISE 7.4 and 8.2: GROWTH IN TSI 3. Indicate in the following table the color of the medium, the presence (+) or absence (-) of
acid, and the metabolism (O: oxidative or F: fermentative) for each of the bacteria.
Bacteria Slant Butt
Color metabolism Color Gas Metabolism
P. miribalis
P. aeruginosa
E. coli
EXERCISE 8.3 METHYL RED VOGUES PROSKAUER TEST 4. Indicate for each bacterium the observations recorded and the appropriate conclusions.
E. coli E. aerogenes

Microbiology lab 2017
EXERCISE 7.5 and 8.4 GROWTH ON SIMMON’S CITRATE AGAR SLANT 5. Indicate for each bacteria the observations recorded and the appropriate conclusions.
E. coli E. aerogenes EXERCISE 7.6 and 8.5: GROWTH ON UREA SLANT 6. Indicate for each bacteria the observations recorded and the appropriate conclusions.
E. coli P. mirabilis EXERCISE 7.7 and 8.6: DECARBOXYLASE AND DEAMINASE ASSAYS Indicate for each bacteria the observations recorded and the appropriate conclusions. 7. E. coli
Ornithine decarboxylase broth Phenylalanine agar slant Lysine agar slant with iron 8. P. mirabilis
Ornithine decarboxylase broth Phenylalanine agar slant Lysine agar slant with iron
Microbiology lab 2017
9. E. aerogenes
Ornithine decarboxylase broth Phenylalanine agar slant Lysine agar slant with iron EXERCISE 7.8 and 8.7: SIM TEST 10. Indicate for each bacteria the observations recorded and the appropriate conclusions. E. coli P. mirabilis E. aerogenes EXERCISE 7.9 and 8.8: NITRATE REDUCTION ASSAY 11. Indicate for each bacteria the observations recorded and the appropriate conclusions. E. coli P. aeruginosa P. mirabilis

Microbiology lab 2017
EXERCISE 7.10 and 8.9: ENTEROPLURI TEST 12. Complete the following table :
Group 1 Group 2 Group 3 Group 4 Group 5
Test 4 2 1 4 2 1 4 2 1 4 2 1 4 2 1
Positivity code
Result
Sum of the codes
Numerical code Microorganism:
EXERCISE 8.10 – 8.11: DIFFERENTIAL TESTS FOR THE IDENTIFICATION OF GRAM POSITIVE COCCI (2 points) 13. Number of your unknown:
Catalase reaction: Unknown’s identity: