MICROBIOLOGICAL EVALUATION OF FISH …staff.du.edu.eg/upfilestaff/355/researches/3355...for each...
12
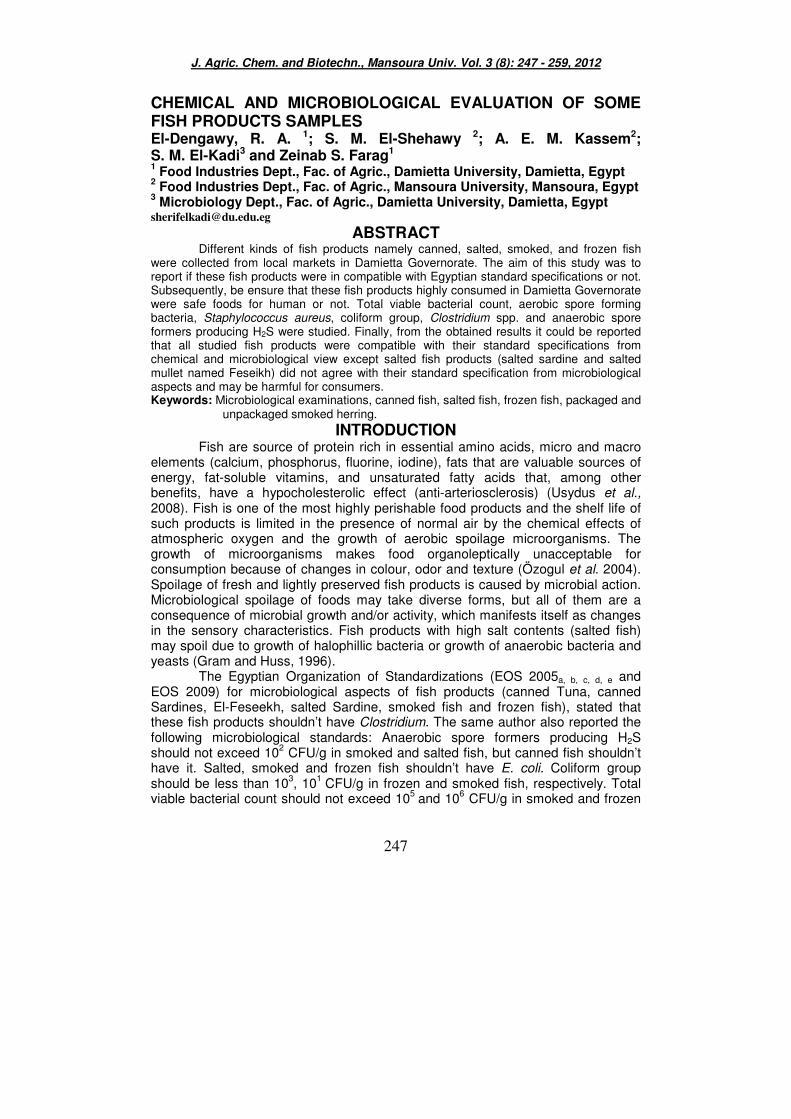
J. Agric. Chem. and Biotechn., Mansoura Univ. Vol. 3 (8): 247 - 259, 2012 247 CHEMICAL AND MICROBIOLOGICAL EVALUATION OF SOME FISH PRODUCTS SAMPLES El-Dengawy, R. A. 1 ; S. M. El-Shehawy 2 ; A. E. M. Kassem 2 ; S. M. El-Kadi 3 and Zeinab S. Farag 1 1 Food Industries Dept., Fac. of Agric., Damietta University, Damietta, Egypt 2 Food Industries Dept., Fac. of Agric., Mansoura University, Mansoura, Egypt 3 Microbiology Dept., Fac. of Agric., Damietta University, Damietta, Egypt [email protected] ABSTRACT Different kinds of fish products namely canned, salted, smoked, and frozen fish were collected from local markets in Damietta Governorate. The aim of this study was to report if these fish products were in compatible with Egyptian standard specifications or not. Subsequently, be ensure that these fish products highly consumed in Damietta Governorate were safe foods for human or not. Total viable bacterial count, aerobic spore forming bacteria, Staphylococcus aureus, coliform group, Clostridium spp. and anaerobic spore formers producing H2S were studied. Finally, from the obtained results it could be reported that all studied fish products were compatible with their standard specifications from chemical and microbiological view except salted fish products (salted sardine and salted mullet named Feseikh) did not agree with their standard specification from microbiological aspects and may be harmful for consumers. Keywords: Microbiological examinations, canned fish, salted fish, frozen fish, packaged and unpackaged smoked herring. INTRODUCTION Fish are source of protein rich in essential amino acids, micro and macro elements (calcium, phosphorus, fluorine, iodine), fats that are valuable sources of energy, fat-soluble vitamins, and unsaturated fatty acids that, among other benefits, have a hypocholesterolic effect (anti-arteriosclerosis) (Usydus et al., 2008). Fish is one of the most highly perishable food products and the shelf life of such products is limited in the presence of normal air by the chemical effects of atmospheric oxygen and the growth of aerobic spoilage microorganisms. The growth of microorganisms makes food organoleptically unacceptable for consumption because of changes in colour, odor and texture (Özogul et al. 2004). Spoilage of fresh and lightly preserved fish products is caused by microbial action. Microbiological spoilage of foods may take diverse forms, but all of them are a consequence of microbial growth and/or activity, which manifests itself as changes in the sensory characteristics. Fish products with high salt contents (salted fish) may spoil due to growth of halophillic bacteria or growth of anaerobic bacteria and yeasts (Gram and Huss, 1996). The Egyptian Organization of Standardizations (EOS 2005 a, b, c, d, e and EOS 2009) for microbiological aspects of fish products (canned Tuna, canned Sardines, El-Feseekh, salted Sardine, smoked fish and frozen fish), stated that these fish products shouldn’t have Clostridium. The same author also reported the following microbiological standards: Anaerobic spore formers producing H 2 S should not exceed 10 2 CFU/g in smoked and salted fish, but canned fish shouldn’t have it. Salted, smoked and frozen fish shouldn’t have E. coli. Coliform group should be less than 10 3 , 10 1 CFU/g in frozen and smoked fish, respectively. Total viable bacterial count should not exceed 10 5 and 10 6 CFU/g in smoked and frozen
Transcript of MICROBIOLOGICAL EVALUATION OF FISH …staff.du.edu.eg/upfilestaff/355/researches/3355...for each...
J. Agric. Chem. and Biotechn., Mansoura Univ. Vol. 3 (8): 247 - 259, 2012
247
CHEMICAL AND MICROBIOLOGICAL EVALUATION OF SOME FISH PRODUCTS SAMPLES El-Dengawy, R. A. 1; S. M. El-Shehawy 2; A. E. M. Kassem2; S. M. El-Kadi3 and Zeinab S. Farag1 1 Food Industries Dept., Fac. of Agric., Damietta University, Damietta, Egypt
2 Food Industries Dept., Fac. of Agric., Mansoura University, Mansoura, Egypt
3 Microbiology Dept., Fac. of Agric., Damietta University, Damietta, Egypt
[email protected] ABSTRACT
Different kinds of fish products namely canned, salted, smoked, and frozen fish were collected from local markets in Damietta Governorate. The aim of this study was to report if these fish products were in compatible with Egyptian standard specifications or not. Subsequently, be ensure that these fish products highly consumed in Damietta Governorate were safe foods for human or not. Total viable bacterial count, aerobic spore forming bacteria, Staphylococcus aureus, coliform group, Clostridium spp. and anaerobic spore formers producing H2S were studied. Finally, from the obtained results it could be reported that all studied fish products were compatible with their standard specifications from chemical and microbiological view except salted fish products (salted sardine and salted mullet named Feseikh) did not agree with their standard specification from microbiological aspects and may be harmful for consumers. Keywords: Microbiological examinations, canned fish, salted fish, frozen fish, packaged and
unpackaged smoked herring.
INTRODUCTION Fish are source of protein rich in essential amino acids, micro and macro
elements (calcium, phosphorus, fluorine, iodine), fats that are valuable sources of energy, fat-soluble vitamins, and unsaturated fatty acids that, among other benefits, have a hypocholesterolic effect (anti-arteriosclerosis) (Usydus et al., 2008). Fish is one of the most highly perishable food products and the shelf life of such products is limited in the presence of normal air by the chemical effects of atmospheric oxygen and the growth of aerobic spoilage microorganisms. The growth of microorganisms makes food organoleptically unacceptable for consumption because of changes in colour, odor and texture (Özogul et al. 2004). Spoilage of fresh and lightly preserved fish products is caused by microbial action. Microbiological spoilage of foods may take diverse forms, but all of them are a consequence of microbial growth and/or activity, which manifests itself as changes in the sensory characteristics. Fish products with high salt contents (salted fish) may spoil due to growth of halophillic bacteria or growth of anaerobic bacteria and yeasts (Gram and Huss, 1996).
The Egyptian Organization of Standardizations (EOS 2005a, b, c, d, e and EOS 2009) for microbiological aspects of fish products (canned Tuna, canned Sardines, El-Feseekh, salted Sardine, smoked fish and frozen fish), stated that these fish products shouldn’t have Clostridium. The same author also reported the following microbiological standards: Anaerobic spore formers producing H2S should not exceed 102 CFU/g in smoked and salted fish, but canned fish shouldn’t have it. Salted, smoked and frozen fish shouldn’t have E. coli. Coliform group should be less than 103, 101 CFU/g in frozen and smoked fish, respectively. Total viable bacterial count should not exceed 105 and 106 CFU/g in smoked and frozen

El-Dengawy, R. A. et al.
248
fish products, respectively. Saphylococcus should be less than 103, 102 and zero CFU/g in frozen, salted and smoked fish, respectively.
Sallam et al. (2007) reported that total volatile bases nitrogen (TVB-N) is a general term which includes the measurement of trimethylamine (TMA), dimethylamine (DMA), ammonia, and other volatile basic nitrogenous compounds associated with seafood spoilage. The same author stated that (NaCl) is added to foods for its effects on sensory, functional and preservation properties. NaCl inhibits microbial growth by restriction of the available water (i.e. lowers aw) in the meat and fish products.
Consumption of these types of fish increasing in spring season special (Spring Festival) and some cases of poisoning occurred in the absence of adequate control on it. So, the aim of this work was to (1) evaluate the collected fish products samples (canned, salted, smoked, and frozen fish) from microbiological view, (2) answer the question concerning with the human consumption validity of such products and (3) stated a fact related to the compatibly of these fish products with EOS.
MATERIALS AND METHODS Materials: Fish products collected:
Four different kinds of fish products used in this study were obtained from different local markets in Damietta Governorate. The samples were collected from six different cities in Damietta Governorate. Sixteen samples of fish products were examined namely, imported canned fish (two samples of canned tuna (CT), two samples of canned sardine, (CS) and two samples of canned Mackerel, (CM)) were collected in September 2011. CT1, CS1 and CM1 were from the same factory. Salted fish (two samples of salted sardine, (SS) and two samples of salted mullet (SM)) were collected in October 2011, smoked Herring (two vacuum packed samples of smoked herring, (VPSH) and two unpacked samples of smoked herring, (UPSH)) were collected in November 2011 and two samples of imported frozen mackerel were collected in December 2011. All of samples were collected during their shelf life and were placed in cold portable insulated boxes and transported to the laboratory for microbiological and chemical examinations. Methods: Chemical analyses: Percentage of moisture and sodium chloride were determined using methods in AOAC (2005) Water activity (aw) was theoretically calculated from the determined moisture and salt content using the following equation according to Demeyer, (1979).
If X<0.1775, aw =1.0014-0.6039x. If X>0.1775, aw =1.0288-0.7614x. Where: X = NaCl % / Moisture %.
Total volatile nitrogen (TVN) was determined according to the method mentioned by Pearson (1968). Results were expressed as mg nitrogen per 100g sample. Acid value (AV) of fish oil extracted from dried minced fish samples was carried out according to the method of AOAC (2005) and was expressed as mg KOH/g oil.

J. Agric. Chem. and Biotechn., Mansoura Univ. Vol. 3 (8), August, 2012
249
Microbiological examinations: The tested samples of fish products sample were aseptically opened and
10g of each sample was transferred to 90 ml of sterile water. The suspension was handily shacked for 5 minutes to prepare a 1:10 dilution. Further dilutions were prepared as needed appropriate dilution was and plated in triplicate (Özogul, et al., 2006). 1. Total viable bacterial count (TVBC):
Poured plate method of Anon, (1992) was used. After preparing ten serial dilutions of fish samples, the test tubes were aseptically inoculated and vigorously agitated then 1 ml was transferred into sterile glass petri dishes in triplicates. Approximately ten ml of melted nutrient agar medium (45-50°C) was poured in each plate, then thoroughly mixed and left 10 min for solidification. The plates were incubated at 30°C for 48 hours. After the incubation period, developed colonies were counted per each plate of the same dilution. The total colonies count per gram of samples was calculated as follows: Total viable bacterial count = average number of triplicate plates of the same dilution x reciprocal of the dilution used colony forming unit (CFU)/g sample. 2. Detection of coliform group:
This test was done in two stages, where in the first step to detect the presence of acid and gas “presumptive test", and to ascertain the presence of coliform bacteria in the second step “confirmed test”. 2.1. Presumptive test .
Coliform counts were estimated based on most probable number (MPN) technique using Mc crady´s tables for calculating the presumptive number. Three decimal dilutions for each sample in three replicate tubes were employed, and then incubated at 37ºC for 48 hours. The number of positive tubes showing acid and gas were recorded. The MPN of coliform bacteria per gram of sample was calculated from standard table according to FDA, (1992). 2.2. Confirmed test (APHA, 1998).
From positive presumptive tubes, inoculation was made onto Eosin Methylene Blue (EMB) agar plates. The metallic sheen colonies as well as typical coliform colonies were recorded as positive confirmed test. Confirmed organisms (typical coliform colonies) were transferred into MacConkey broth and onto agar slants. After incubation at 37°C for 24-48 hours, the production of acid and gas in the broth medium and the presence of Gram negative short rods in smears prepared from slants were considered as a positive test. 3. Detection of Staphylococcus aureus:
Staphylococci was determined as described in APHA (1998) by inoculation of 1.0 ml sample on the surface of Staph medium No. 110 (Oxoid, 2006) plates, then incubated at 37°C for 24 hours. The growing colonies had yellow zones, flat and 1.2 mm diameters. Identification tests of Staphylococci
Representative colonies were picked up and transferred to brain heart infusion broth tubes and incubated at 37°C for 48 hours. Two slants were made, one as a storing culture and the other for catalase test and other tests on nutrient agar. Isolates were microscopically examined after Gram staining to ensure purity. Catalase, coagulase, gelatinse and sugar fermentation tests were performed (Robert and Noel, 1981).

El-Dengawy, R. A. et al.
250
4. Detection of aerobic spore forming bacteria. The dilutions were pasteurized at 80°C for 20 min. in water bath, then the
dilutions from 10-3 to 10-6 were plated on nutrient agar medium and incubated at 30°C for 3 days (Kilinc and Cakli, 2004). 5. Detection of anaerobic spore forming bacteria.
Dilution frequency technique was adopted to determine the densities of anaerobic spore forming clostridia, using Cooked Meat Medium (CMM), in 5 tubes for each dilution. The inoculated tubes were sealed with sterile mixture of Vaseline and Paraffin oil in 1:1 ratio and incubated at 35±2ºC for up to 7 days. The presence of clostridia was detected at the end of the incubation period by accumulation of gases pushing the vaspar layer up (Difco, 1974). 6. Detection of anaerobic spore formers producing H2S:
Dilution frequency technique was adopted to determine the densities of anaerobic spore forming bacteria producing H2S, using peptone iron agar (PIA), in 5 tubes for each dilution. The inoculated tubes were sealed with sterile mixture of Vaseline and Paraffin oil in (1:1) ratio and incubated at 55 ºC for 3-5 days. After incubation period the number of black tubes was counted (Oxoid, 2006).
RESULTS AND DISCUSSION Chemical evaluation of canned fish samples:
Data in Table 1 show that moisture percentages in all canned fish samples ranged between 52.41±0.035 to 78.53±0.142 %. It could be observed that all canned fish samples had high values of water activity (0.990-0.999). Meanwhile, NaCl content ranged between 0.13±0.000 to 1.20±0.042 %. TVN values in canned fish samples ranged between 7.01±0.254 mg N/100g sample to18.04±0.593 mg N/100g sample. In addition, acid value of canned fish samples had the highest value of AV being 20.39±0.000 mg KOH/g oil in CM1. Table 1: Chemical characteristics of studied canned fish samples
Canned fish samples
Moisture %
Water activity NaCl % (W.W.)
TVN mg/100g
AV mg KOH/g oil
CT1 69.34±0.802 0.992±0.000 1.03±0.000 13.65±0.503 3.40±0.090 CT2 74.55±0.458 0.992±0.0003 1.12±0.052 10.58±0.277 5.01±0.170
T test -5.647** -1.000N.S -1.735N.S 5.344** -8.370** 52.41±0.035 0.988±0.001 1.13±0.013 17.69±0.597 2.78±0.085 CS1
CS2 53.07±0.992 0.999±0.000 0.13±0.000 18.04±0.593 1.52±0.095 T test -0.658N.S -8.875** 75.25** -0.416 N.S 9.963**
78.53±0.142 0.993±0.000 1.08±0.026 7.01±0.254 20.39±0.000 CM1 CM2 67.53±0.361 0.990±0.0003 1.20±0.042 8.38±0.207 9.78±0.065
T test 28.368** 8.000** -2.609* -4.194** 163.308** Mean values ± standard error (n=3). * means significant at P> 0.05, ** means significant at P> 0.01, N.S means there are no significant differences.
From results, it was clear that the main preservative factors in such canned products was thermal process and anaerobic conditions used during fish processing, so NaCl did not play any role in canned fish preservation. As for statistical analysis, there were highly significant differences between each couple of canned fish in acid value. In case of canned mackerel, there were significant differences between CM1 and CM2 in all chemical characteristics. These results are in disagreement with those obtained by USDA, (2011), while TVN values were in permissible limits stated by EOS (2005a and b).

J. Agric. Chem. and Biotechn., Mansoura Univ. Vol. 3 (8), August, 2012
251
Microbiological evaluation of canned fish samples: Values of microbiological examinations of canned fish samples are
presented in Table 2. Listed results showed that CT and CS samples had the lowest total viable bacterial count, but CM sample had the highest count being 2.5±0.088 ×10² and 4.6±0.208 ×10³ CFU/g in CM1 and CM2, respectively. Similarly, CM samples had the highest value of aerobic spore forming bacteria being 0.23±0.033 ×10² and 0.26±0.033 ×10² CFU/g in CM1 and CM2, respectively. Aerobic spore forming bacteria is not detected in CT samples. Staphylococcus aureus, coliform group, Clostridium sp. and anaerobic spore formers producing H2S were not detected in all samples. These results are in agreement with EOS (2005a and b). It was observed that, there was a relationship between the TBC and TVN; all canned samples had low values of TVN, this maybe due to low values of TBC. EOS (2005 a and b) stated that CT and CS shouldn't have Clostridium or anaerobic spore forming bacteria producing H2S. It was obvious that total viable count and aerobic spore formers had no significant differences for all samples, except total viable count for canned mackerel samples which had highly significant differences between the studied two samples. Table 2: Microbiological evaluation of canned fish samples.
Bacterial count (CFU×102/g samples)
Canned tuna (CT)
Canned sardine (CS)
Canned mackerel
(CM)
Tested bacterial groups
CT1 CT2
T test
CS1 CS2
T test
CM1 CM2
T test
EOS
, 2005
Total viable count
(0.03± 0.033)
ND 1.00 N.S 0.06± 0.033
0.3± 0.100
-2.214 N.S 2.5±
0.088 4.6± 0.208
-8.994** --
Aerobic spore formers
ND ND -- 0.03± 0.033
0.03± 0.033 0.000 N.S 0.23±
0.033 0.26± 0.033
-0.707 N.S --
Anaerobic spore formers producing H2S
ND ND -- ND ND -- ND ND -- Free
Staphylococcus aureus
ND ND -- ND ND -- ND ND -- --
Coliform group ND ND -- ND ND -- ND ND -- -- Clostridium
spp. ND ND -- ND ND -- ND ND -- Free
: ND = Not detected. Mean values ± standard error (n=3). * means significant at P> 0.05, while ** means significant at P> 0.01, N.S means there are no significant differences.
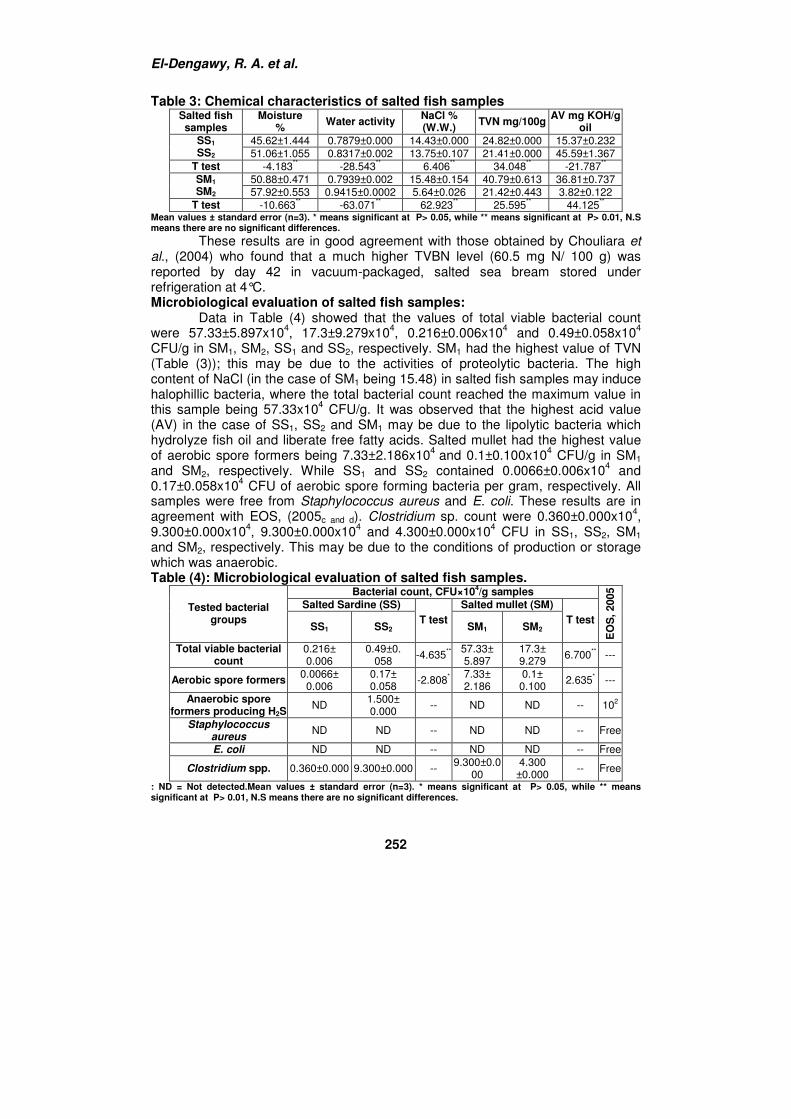
Chemical evaluation of salted fish samples: Moisture content of different salted fish samples ranged from 45.62±1.444
to 57.92±0.553 % as given in Table 3. It was clear relationship between moisture content, NaCl % and consequently water activity, where increasing of NaCl content of fish flesh, decreasing of moisture content and water activity. So, it was clear that SM2 had the highest content of moisture, the least value of salt (5.64%) and directly the highest value of water activity (0.9415). SM1 had the highest value of TVN (40.79mg/100g). All salted samples had high value of AV except SM2 sample which had a value of 3.82±0.122 mg KOH/g oil.
As for statistical analysis, there were highly significant differences between each couple of salted fish in moisture content, water activity, NaCl%, TVN and AV. These results mean that there were no homogeneity or standard rules in these salted fish manufacturing.
El-Dengawy, R. A. et al.
252
Table 3: Chemical characteristics of salted fish samples Salted fish samples
Moisture %
Water activity NaCl % (W.W.)
TVN mg/100g AV mg KOH/g
oil
45.62±1.444 0.7879±0.000 14.43±0.000 24.82±0.000 15.37±0.232 SS1
SS2 51.06±1.055 0.8317±0.002 13.75±0.107 21.41±0.000 45.59±1.367 T test -4.183** -28.543** 6.406** 34.048** -21.787**
50.88±0.471 0.7939±0.002 15.48±0.154 40.79±0.613 36.81±0.737 SM1
SM2 57.92±0.553 0.9415±0.0002 5.64±0.026 21.42±0.443 3.82±0.122 T test -10.663** -63.071** 62.923** 25.595** 44.125**
Mean values ± standard error (n=3). * means significant at P> 0.05, while ** means significant at P> 0.01, N.S means there are no significant differences.
These results are in good agreement with those obtained by Chouliara et al., (2004) who found that a much higher TVBN level (60.5 mg N/ 100 g) was reported by day 42 in vacuum-packaged, salted sea bream stored under refrigeration at 4°C. Microbiological evaluation of salted fish samples:
Data in Table (4) showed that the values of total viable bacterial count were 57.33±5.897x10⁴, 17.3±9.279x10⁴, 0.216±0.006x10⁴ and 0.49±0.058x10⁴ CFU/g in SM1, SM2, SS1 and SS2, respectively. SM1 had the highest value of TVN (Table (3)); this may be due to the activities of proteolytic bacteria. The high content of NaCl (in the case of SM1 being 15.48) in salted fish samples may induce halophillic bacteria, where the total bacterial count reached the maximum value in this sample being 57.33x10⁴ CFU/g. It was observed that the highest acid value (AV) in the case of SS1, SS2 and SM1 may be due to the lipolytic bacteria which hydrolyze fish oil and liberate free fatty acids. Salted mullet had the highest value of aerobic spore formers being 7.33±2.186x10⁴ and 0.1±0.100x10⁴ CFU/g in SM1 and SM2, respectively. While SS1 and SS2 contained 0.0066±0.006x10⁴ and 0.17±0.058x10⁴ CFU of aerobic spore forming bacteria per gram, respectively. All samples were free from Staphylococcus aureus and E. coli. These results are in agreement with EOS, (2005c and d). Clostridium sp. count were 0.360±0.000x10⁴, 9.300±0.000x10⁴, 9.300±0.000x10⁴ and 4.300±0.000x10⁴ CFU in SS1, SS2, SM1 and SM2, respectively. This may be due to the conditions of production or storage which was anaerobic. Table (4): Microbiological evaluation of salted fish samples.
Bacterial count, CFU×104/g samples
Salted Sardine (SS) Salted mullet (SM) Tested bacterial groups
SS1 SS2 T test
SM1 SM2 T test
EO
S,
2005
Total viable bacterial count
0.216± 0.006
0.49±0. 058
-4.635** 57.33± 5.897
17.3± 9.279
6.700** ---
Aerobic spore formers 0.0066± 0.006
0.17± 0.058
-2.808* 7.33± 2.186
0.1± 0.100
2.635* ---
Anaerobic spore formers producing H2S
ND 1.500± 0.000
-- ND ND -- 102
Staphylococcus aureus
ND ND -- ND ND -- Free
E. coli ND ND -- ND ND -- Free
Clostridium spp. 0.360±0.000 9.300±0.000 -- 9.300±0.0
00 4.300
±0.000 -- Free
: ND = Not detected.Mean values ± standard error (n=3). * means significant at P> 0.05, while ** means significant at P> 0.01, N.S means there are no significant differences.

J. Agric. Chem. and Biotechn., Mansoura Univ. Vol. 3 (8), August, 2012
253
Anaerobic spore forming bacteria producing H2S was 1.500±0.000x10⁴ CFU in SS2, while it was not detected in other samples. These results are in agreement with those obtained by Nassar (2001) who found that TVBC reached to 0.8×10⁶ CFU of pre-fermented mullet with 25% dry salting at the end of storage period.
As for statistical analysis, there were highly significant differences (P>0.01) between each couple of salted fish in case of total viable bacterial count, but there were significant differences (P>0.05) between each couple of salted fish in case of aerobic spore formers. EOS, (2005c and d) stated that salted sardine and salted mullet shouldn't have Clostridium and E. coli, while both of anaerobic spore-forming bacteria producing H2S and staphylococcus shouldn’t exceed 102 CFU/g. Chemical evaluation of smoked fish samples:
Data illustrated in Table (5) showed that moisture content, water activity, NaCl%, TVN and AV in smoked fish samples. Moisture content and water activity ranged from 57.03±0.224 to 63.32±0.845 and from 0.923±0.001 to 0.945±0.001, respectively. VPSH1 had the highest value of TVN (42.11±0.000 mg/100g). All of herring samples ranged from 20.92±0.517 to 26.24±0.512 mg KOH/g oil for AV. As for statistical analysis, there were significant differences (P>0.05) between all smoked fish in all studied chemical parameters except in case of TVN. These results are in good agreement with those obtained by El-Sherbieny (2003) who found that water activity (aw) decreased from 0.989 to 0.882 in smoked herring.
Table 5: Chemical evaluation of smoked fish samples Smoked fish
samples
Moisture (%)
Water activity NaCl (%)
As wet weight TVN mg/100g
AV mg KOH/g oil
UPSH1 57.04b±1.059 0.929c±0.001 6.82b±0.050 26.22±0.000 26.24a±0.512 UPSH2 63.32a±0.845 0.945a±0.001 5.96c±0.043 24.65±0.000 22.54b±0.519 VPSH1 57.03b±0.224 0.923d±0.001 7.43a±0.072 42.11±0.000 26.11a±0.475 VPSH2 62.07a±0.838 0.934b±0.001 6.88b±0.023 25.49±0.000 20.92c±0.517
Means of treatments having the same letter(s) within a column are not significantly different (P> 0.05).
Microbiological evaluation of smoked fish samples: From tabulated data in Table 6, Unpackaged smoked herring samples had
higher total viable bacterial count more than vacuum packaged smoked herring samples. (UPSH) samples 1 and 2 had the highest total count being 246±8.800x10⁴ and 109±7.40x10⁴ CFU/g, respectively. Meanwhile, VPSH1 and VPSH2 samples had 128±11.400x10⁴ and 2.45±0.029x10⁴ CFU/g, respectively. It was observed that, VPSH1 sample had the highest value of aerobic spore forming and TVN (Table 5) being 4.3±2.404x10⁴ CFU/g and 42.11mg%, respectively. This may be due to the proteolytic bacteria. Table 6: Microbiological evaluation of smoked fish samples.
Bacterial count, CFU x104/g samples
Unpackaged smoked herring (UPSH)
Vacuum packaged smoked herring (VPSH)
Tested bacterial groups
UPSH1 UPSH2 VPSH1 VPSH2
EOS, 2005
Total viable bacterial count 246a±8.800 109b±7.400 128b±11.400 2.45c±0.029 <105 Aerobic spore forming 0.0166b±0.006 0.040 b±0.031 4.3a±2.404 0.0033b±0.003 ---
Anaerobic spore formers producing H2S
ND ND ND ND <102
Staphylococcus aureus ND ND 0.010±0.006 ND Free E. coli ND ND ND ND Free
Clostridium sp. ND ND 24.0±0.000 ND Free : ND = Not detected. Means of treatments having the same letter(s) within a column are not significantly different (P> 0.05).

El-Dengawy, R. A. et al.
254
The count of Staphylococcus aureus and Clostridium sp. for VPSH1 sample were 0.010±0.006x10⁴ and 24.0±0.000x10⁴ CFU/g, respectively, this maybe due to the anaerobic conditions of VPSH samples. Other samples were free from Staphylococcus aureus and Clostridium sp. Also, E. coli and anaerobic spore forming produce H2S count were not detected in all samples. These results are in agreement with those obtained by Dondero et al., (2004).
As for statistical analysis, there were significant differences (P>0.05) between all smoked fish in case of total viable bacterial count and aerobic spore formers. EOS, (2005e) stated that smoked fish shouldn't have Clostridium, staphylococcus and E. coli, while aerobic bacteria and anaerobic spore forming produce H2S shouldn’t exceed 105 and 102 CFU/g, respectively. Chemical evaluation of frozen fish samples:
Moisture content, water activity and NaCl% of collected frozen mackerel were shown in Table 7. From tabulated data, it could be noticed that moisture content was 69.45±0.437 and 68.66±0.905 in FM1 and FM2, respectively. Frozen mackerel samples had low content (%) of NaCl (0.23±0.000) in FM1 and (0.31±0.0000) in FM2 as wet weight. TVN values of all frozen samples did not exceed the permissible limit of the EOS (2009) which reported that, total volatile nitrogen of frozen fish must not be more than 25 mgN/100g sample. Acid value for frozen mackerel samples were 14.87±0.434 of FM1 and 20.28±0.195 of FM2. There were significant differences between the two frozen sample in case of TVN and AV. These results are in agreement with EOS (2009), but in disagreement with those obtained by Sahari et al., (2009). Table (7): Chemical evaluation of frozen fish samples:
Frozen Mackerel samples
Moisture %
Water activity NaCl % As wet weight
TVN mg/100g AV mg KOH/g
oil
69.45±0.437 0.999±0.000 0.23±0.000 13.34±0.000 14.87±0.434 FM1
FM2 68.66±0.905 0.998±0.000 0.31±0.000 16.23±0.000 20.28±0.195 T test 0.783N.S --- --- -111.929** -11.358**
EOS, (2009) 25 Mean values ± standard error (n=3). * means significant at P> 0.05, while ** means significant at P> 0.01, N.S means there are no significant differences.
Microbiological evaluation of frozen fish samples: Table 8 show that, frozen mackerel samples had total viable bacterial
count less than the permissible limit (106 CFU/g), these values were 4.7±6.250x10³and 99±1.800 x10³ CFU/g FM1 and FM2 samples, respectively. These results are in agreement with EOS (2009). Aerobic spore forming bacteria were 0.044±0.044x10³and 1.30±0.760x10³ CFU/g for FM1 and FM2 samples, respectively. There was a relationship between the high content of TVBC and aerobic spore forming bacteria and the high value of AV, this may be due to the activities of lipolytic bacteria. Staphylococcus aureus, E. coli and Clostridium sp. were not detected in all samples. Anaerobic spore forming bacteria producing H2S reached the highest count being 1.380±0.000x10³ CFU/g in FM2. These results were in agreement with those obtained by Kilinc and Cakli (2004) and Özogul et al., (2004).
Statistical analysis showed that there were significant differences between the two frozen sample in total viable count. (EOS) 2009 stated that frozen fish shouldn't have Clostridium and E. coli, while aerobic bacteria and staphylococcus aureus shouldn’t exceed 106 and 103 CFU/g, respectively.

J. Agric. Chem. and Biotechn., Mansoura Univ. Vol. 3 (8), August, 2012
255
Table 8: Microbiological evaluation of frozen fish samples. Bacterial count, CFU x10
3/g samples
Frozen mackerel (FM) Tested bacterial groups
FM1 FM2 T test
EOS, 2009
Total viable bacterial count 4.7±6.250 99±1.800 -7.056** <106
Aerobic spore formers 0.044±0.044 1.30±0.760 -1.000N.S No limit Anaerobic spore formers
producing H2S ND 1.380±0.000 -- No limit
Staphylococcus aureus ND ND -- 103
E. coli ND ND -- Free Clostridium sp ND ND -- Free
: ND = Not detected. Mean values ± standard error (n=3). * means significant at P> 0.05, while ** means significant at P> 0.01, N.S means there are no significant differences.
Staphylococci identification from studied fish product samples: Biochemically identified as shown in Table (9). Typical colonies
representing staphylococci growth, white, yellow or orange colored colonies, were picked up and streaked onto nutrient agar slant. After growth, Gram positive, spherical cells, arranged in irregular clusters, catalase producer growth were considered as Staphylococcus isolates. Confirmed staphylococci isolates biochemically identified as shown in Table(9) according to Bergey’s Manual of Determinative Bacteriology (Holt et al. 1994). Accordingly, the species were identified as S. aureus and S. epidermidis (Queck and Otto, 2008). Table 9: Morphological and biochemical reaction of Staphylococcus spp of
studied fish product samples.
Strain S. epidermidis S. aureus Colony color White Yellow
Gram stain + + Catalase + +
Coagulase - + Oxidase + + Mannitol - + Lactose + + Glucose + +
Gelatinase - + CONCLUSION
Finally it could be concluded that Staphylococcus aureus, coliform group, Clostridium sp. and anaerobic spore-forming bacteria producing H2S were not detected in all canned fish samples. E.coli and anaerobic spore-forming bacteria producing H2S count were not detected in all smoked samples. Frozen mackerel samples had total viable bacterial count less than the permissible limit. Salted fish samples were not compatible with EOS (2005 c and d) from microbiological view, where it contained Clostridium spp. and these salted fish may be harmful in human nutrition.
REFERENCES
Anon. (1992). Compendium Of Methods For The Microbiological Examination Of Foods. 3rd ed., American Public Health Association. Washington, D.C., USA

El-Dengawy, R. A. et al.
256
AOAC (2005). Association of Official Analytical Chemist, Official Methods of Analysis 18th Ed., AOAC international, suite 500, 481 north frederick avenue, gaithersburg, Maryland 20877-2417, USA.
APHA, American Public Health Association (1998). Standard Methods for the Examination of Water and Wastewater, The 20th Ed. APHA, Inc. New York, USA.
Chouliara, I.; Savvaidis, I. N.; Panagiotakis, N. and Kontominas, M. G. (2004). Preservation of salted, vacuum-packaged, refrigerated sea bream (Sparus aurata) fillets by irradiation: microbiological, chemical and sensory attributes. Food Microbiology, 21: 351–359.
Demeyer, D. (1979). Comparison between calculated and measured values of water activity ( aw) in dry sausage. Fleischwirt, 59(7):973.
Difco. (1974). Dehydrated Culture Media, Reagents and procedures. Pub. Difco Laboratory Incorporated Detroit, I., Michigen, 48: 201, U.S.A.
Dondero, M.; Cisternas, F.; Carvajal, L. and Simpson, R. (2004). Changes in quality of vacuum-packed cold-smoked salmon (Salmo salar) as a function of storage temperature. Food Chemistry, 87: 543–550.
(EOS) Egyptian Organization for Standardization (2005a). Canned Tuna and Bonito. Egyptian Organization for Standardization and Quality, Arab Republic of Egypt. No. 804.
(EOS) Egyptian Organization for Standardization (2005b). Canned Sardines. Egyptian Organization for Standardization and Quality, Arab Republic of Egypt. No. 287.
(EOS) Egyptian Organization for Standardization (2005c). Salted Fish, Part: 1 Fesiekh, Egyptian Organization for Standardization and Quality, Arab Republic of Egypt. No. 1725-1.
(EOS) Egyptian Organization for Standardization (2005d). Salted Fish, Part: 2 Salted Sardine, Egyptian Organization for Standardization and Quality, Arab Republic of Egypt. No. 1725-2.
(EOS) Egyptian Organization for Standardization (2005e). Smoked Fish, Egyptian Organization for Standardization and Quality, Arab Republic of Egypt. No. 288.
(EOS) Egyptian Organization for Standardization (2009). Frozen Fish, Part: 1 Whole Fish, Egyptian Organization for Standardization and Quality, Arab Republic of Egypt. No. 889-1.
El-Sherbieny, Sherien M. R. (2003). Studies on chemical and microbiological changes occurred in protein compounds in some preserved foods. M. Sc. Thesis, Food Sci. Dept., Fac. of Agric., Mansoura Univ., Egypt.
FDA. (1992). Bacteriological Analytical Manual. Arlington, VA:AOAC International. Gram, L. and Huss, H. H. (1996). Microbiological spoilage of fish and fish products.
Food Microbiology, 33: 121-137. Holt, J. G.; Krieg, N. R.; Sneath, P. H. A.; Stanley, J. T. and Williams, S. T. (1994).
Bergey’s Manual of Determinative Bacteriology, 9th ed., Williams and Wilkins, Baltimore.
Kilinc, B. and Cakli, S. (2004). Chemical, microbiological and sensory changes in thawed frozen fillets of sardine (Sardina pilchardus) during marination. Food Chemistry, 88:275–280.

J. Agric. Chem. and Biotechn., Mansoura Univ. Vol. 3 (8), August, 2012
257
Nassar, U. A. E. M. (2001). Studies on Mugilidae fish salting in Egypt. M. Sc. Thesis, Faculty of Agriculture, Mansoura University, Egypt.
Oxoid (2006). The Oxoid Manual. 9th ed., by OXOID Limited, Wade Road, Basingstoke, Hampshire RG24 8PW, England,UK.
Özogul, F.; Polata, A. and Özogul, Y. (2004). The effects of modified atmosphere packaging and vacuum packaging on chemical, sensory and microbiological changes of sardines (Sardina pilchardus). Food Chemistry, 85: 49–57.
Özogul, Y.; Özogul, F.; Kuley, E.; Özkutuk, A. S.; Gökbulut, C. and Köse, S. (2006). Biochemical, sensory and microbiological attributes of wild turbot(Scophthalmus maximus), from the black sea, during chilled storage. Food Chemistry, 99: 752–758.
Queck, S.Y. and Otto, M. (2008). Staphylococcus epidermidis and other coagulase-negative Staphylococci. Staphylococcus: Molecular Genetics. Caister Academic Press.
Robert, M. S. and Noel, R. K. (1981). General characterization, chapter 20 pp. 409-433. In : Manual of methods for General Bacteriology.
Sahari, M. A.; Nazemroaya, S. and Razaei, M. (2009). Fatty acid and biochemical changes in mackerel ( Scomberomorus commerson ) and shark ( Carcharhinus dussumieri ) fillets during frozen storage. American – Eurasian J. of Sustainable Agriculture, 3(3): 519-527.
Sallam, Kh. I.; Ahmed, A. M.; Elgazzar, M.M. and Eldaly, E. A. (2007). Chemical quality and sensory attributes of marinated Pacific saury (Cololabis saira) during vacuum-packaged storage at 4ºC. Food Chemistry, 102: 1061–1070.
USDA, (2011). United States Department of Agriculture. USDA National Nutrient Database for Standard Reference (Release 24; release numbers change as new versions are released): Nutrient data laboratory homepage.
Usydus, Z.; Szlinder-Richert, J.; Polak-Juszczak, L.; Kanderska, J.; Adamczyk, M.; Malesa-Ciecwierz, M. and Ruczynska, W. (2008). Food of marine origin: between benefits and potential risks. Part I. Canned fish on the Polish market. Food Chemistry, 111: 556–563.
التقييم الكيماوي و الميكروبيولوجى لعينات من منتجات األسماك ،٢أحمــد عــزت منصــور قاســم، ٢ ، شــادي محمــد الشــهاوي١رزق أحمــد الــدنجاوي
١زينب صبري فرج و ٣شريف محمد القاضي مصر– دمياط جامعة– كلية الزراعة - قسم الصناعات الغذائية ١ مصر– جامعة المنصورة – كلية الزراعة - قسم الصناعات الغذائية ٢ مصر– دمياط جامعة – كلية الزراعة – قسم الميكربيولوجي ٣
المملحة و المعلبة و هي األسماك المصنعة تم تجميع أربعة أنواع من منتجات األسماك و تهدف الدراسة إلى تقرير مـا . و المدخنة و المجمدة من األسواق المحلية لمدن محافظة دمياط
و بالتالي التأكد مـن أن . إذا كانت هذه المنتجات متوافقة مع المواصفات القياسية المصرية أم ال تـم فقد.هذه المنتجات الغذائية التي تستهلك بكثرة في محافظة دمياط أثناء عيد الربيع آمنة غذائياً
، Bacillus sppلهوائيــة المتجرثمــةدراســة العــد الكلــي للبكتريــا الحيــة ، البكتريــا اStaphylococcus aureus ، مجموعة بكتريا القولون ، Clostridium spp. و البكتريا
أن جميـع المنتجـات قد أوضحت النتائج و .المتجرثمة الالهوائية المنتجة لكبريتيد الهيدروجين الخاصة بها من الناحيـة المصرية متوافقة مع المواصفات القياسية كانت السمكية تحت الدراسة

El-Dengawy, R. A. et al.
258
البـوري –السـردين المملـح (لمنتجات السمكية المملحة فيما عدا ا والميكروبيولوجية الكيميائية و قد تكـون من الناحية الميكروبيولوجية ال تتوافق مع المواصفة القياسية ) المملح المسمى الفسيخ
.ضارة للمستهلكين قام بتحكيم البحث
����/ د .أ�� ���رة–آ��� ا��را� ���� ��� ا��� د���ط ���� –آ��� ا��را� &�% $� ا# �"�� ا��!���/ د .أ