
MICRO, SMALL AND MEDIUM ENTERPRISES SURVEY IN NIGERIA BY SMEDAN
183
PRELIMINARY REPORT
Transcript of MICRO, SMALL AND MEDIUM ENTERPRISES SURVEY IN NIGERIA BY SMEDAN
8/22/2019 MICRO, SMALL AND MEDIUM ENTERPRISES SURVEY IN NIGERIA BY SMEDAN
http://slidepdf.com/reader/full/micro-small-and-medium-enterprises-survey-in-nigeria-by-smedan 1/182
PRELIMINARY REPORT

8/22/2019 MICRO, SMALL AND MEDIUM ENTERPRISES SURVEY IN NIGERIA BY SMEDAN
http://slidepdf.com/reader/full/micro-small-and-medium-enterprises-survey-in-nigeria-by-smedan 2/182
2010 NATIONAL MSME COLLABORATIVE SURVEY
Foreword
The Small and Medium Enterprises Development Agency of Nigeria (SMEDAN) was
established in 2003, to facilitate the promotion and development of a structured and
efficient Micro, Small, and Medium Enterprises (MSMEs) Sector that will enhancesustainable economic development in Nigeria. The Agency is the apex and coordinating
institution for all matters relating to starting, resuscitating and growing MSMEs in Nigeria.
The Agency is also saddled with the responsibility of contributing to the attainment of Vision
20-2020, the Transformation Agenda of the present administration and the Cluster
Development Approach of the Ministry of Trade and Investment. We provide the following
Services:
Generation and dissemination of Business information
Business Awareness creation
Business Development Services
Access to Market and Finance
Advancing Entrepreneurship Education
Stimulating Entrepreneurship/Enterprise Development
Enterprise cooperation and clustering
Policy Advocacy for improved Business Operating Environment,
with the overall objective of alleviating poverty, expanding gainful employment
opportunities, wealth creation and sustainable economic growth and development.
The Micro, Small and Medium Enterprises are globally acknowledged as the oil required to
lubricate the engine of socio-economic transformation of any nation. The MSME sector is
strategically positioned to absorb up to 80% of jobs, improve per capita income, increase
value addition to raw materials supply, improve export earnings and step up capacity
utilisation in key industries. The sector is structured across other key sectors, including
Agriculture, Mining and Quarrying, Building and Construction, Manufacturing, Solid
Minerals, etc, and thus has strong linkages with the entire range of economic activities in the
country.
It is therefore on the above premise that this Survey was conceived as our concerted
response to the challenges of building a credible and reliable MSME database required to
strategically reposition the sector. The dearth and paucity of credible and reliable database
is one of the main constraints to the development of the MSME Sector in Nigeria. Due to theabsence of a robust MSME database, the Agency and other principal stakeholders could not
proactively evolve sustainable intervention strategies toward repositioning and creating
efficient and sustainable MSME sector in Nigeria.
In addition to the afore-mentioned, The Agency recognizes the importance of credible and
reliable data for Planning and Decision-Making. Consequently, some of the key deliverables
of the survey include:
Contribution of the sector to the Gross Domestic Product;
Contribution to employment;
8/22/2019 MICRO, SMALL AND MEDIUM ENTERPRISES SURVEY IN NIGERIA BY SMEDAN
http://slidepdf.com/reader/full/micro-small-and-medium-enterprises-survey-in-nigeria-by-smedan 3/182
2010 NATIONAL MSME COLLABORATIVE SURVEY
Determine the number of MSMEs in Nigeria on geo-political and sectoral
basis;
Identify the challenges and constraints confronting the operations of MSMEs
in Nigeria;
Identify the skill gaps within the sector; Determine the grow rate of MSMEs; among others.
It is in this regard that we undertook this Collaborative Survey with the Bureau, as a key
Public Sector Institution with distinct competence and wide experience in data collection,
collation and analysis. The Survey was conducted in the 36 States of the Federation and the
Federal Capital Territory after the Pre-test in Lagos and Kano States.
I salute the Statistician-General, Dr. Yemi Kale and his management team as well as some of
his predecessors who were involved at the inception of this project for their dedication,
tenacity and commitment to the success of this survey. I also commend the Business
Membership Organisations and Chambers of Commerce who constituted majority of therespondents for their cooperation, unalloyed support and input that enhanced the quality
and credibility of the survey.
I call on both local and foreign investors to leverage on the MSME database and invest in this
sector. I also implore the development partners, public and private sectors to collaborate
and partner with the Agency to advance the course of the sector.
This National MSME Survey is what we are all waiting for to revolutionalise the sector. The
survey will in no doubt assist the Agency in evolving a Strategic Action Plan towards the
emergence of virile and vibrant MSMEs that will stimulate and facilitate socio-economic
development of Nigeria in accordance with the Agency’s Enabling Act.
Muhammad Nadada Umar
Director-General/CEO
SMEDAN

8/22/2019 MICRO, SMALL AND MEDIUM ENTERPRISES SURVEY IN NIGERIA BY SMEDAN
http://slidepdf.com/reader/full/micro-small-and-medium-enterprises-survey-in-nigeria-by-smedan 4/182
2010 NATIONAL MSME COLLABORATIVE SURVEY
Preface
The contribution of the Micro, Small and Medium Enterprises (MSME’s) to the
economic growth of a nation is well recognized. In developing countries like Nigeria, the
contribution of MSME’s towards employment generation is significant because they
• tend to use more labour intensive production processes than large enterprises,
boosting employment and leading to more equitable income distribution
• provide livelihood opportunities through simple, value adding processing
activities in agriculturally based economies;
• nurture entrepreneurship; and
• support the building up of systemic productive capacities and the creation of
resilient economic systems, through linkages between small and large enterprises
Study findings on MSME in other developing countries have indicated that countries
with larger share of MSME employment have higher economic growth than their
counterparts. In fact it is suggested that one of the significant characteristics of a
flourishing and growing economy is a booming and blooming MSMEs sector. MSME
therefore play an important role in the development of a country by aforementioned,
creating employment for rural and urban growing labor force, providing desirable
sustainability and innovation in the economy as a whole .In addition to that, a large
number of people rely on the small and medium enterprises directly or indirectly. Most
of the current larger enterprises in Nigeria and indeed in the world have their origin in
small and medium enterprises. In fact it can be said that MSMEs are different from large
scale enterprises in three main aspects: uncertainty, innovation and evolution.
According to the United Nations Industrial Development Organization UNIDO, for
developing countries, integration into the global economy through economic
liberalization, deregulation, and democratization is seen as the paramount way to triumph
over poverty and inequality. Important to this process, is the development of an
animated private sector, in which small and medium enterprises can play a central role.
Because MSMEs have a propensity to employ more labor-intensive production processes
than large enterprises, they contribute significantly to the provision of productive
employment opportunities, the generation of income and, eventually, the reduction of
poverty. According to the statistics, in industrialized countries, MSMEs are majorcontributors to private sector employment. Empirical studies have shown that SMEs

8/22/2019 MICRO, SMALL AND MEDIUM ENTERPRISES SURVEY IN NIGERIA BY SMEDAN
http://slidepdf.com/reader/full/micro-small-and-medium-enterprises-survey-in-nigeria-by-smedan 5/182
2010 NATIONAL MSME COLLABORATIVE SURVEY
contribute to over 55% of GDP and over 65% of total employment in high income
countries .MSMEs and informal enterprises, account for over 60% of GDP and over
70% of total employment in low income countries, while they contribute about 70% of
GDP and 95% of total employment in middle income countries. MSMEs also play
significant contribution in the transition of agriculture-led economies to industrial ones
furnishing plain opportunities for processing activities which can generate sustainable
source of revenue and enhance the development process. MSMEs shore up the
expansion of systemic productive capability. They help to absorb productive resources at
all levels of the economy and add to the formation of flexible economic systems in which
small and large firms are interlinked. Such linkages are very crucial for the attraction of
foreign investment. MSMEs are therefore a distinctive mainstay of the economy that
requires owing attentiveness.
Despite an understanding of the importance of MSME in Nigeria in particular, there is a
dearth of information about their number, people they employ and sectors they operate
in Nigeria. While the development of the MSME is unarguably the mandate of Small and
Medium Enterprises Development Agency of Nigeria (SMEDAN), The National Bureau
of Statistics (NBS) according to the Statistics Act, 2007 is the main National Agency
responsible for the development and management of official statistics, the authoritativesource and custodian of official statistics in Nigeria. The NBS is responsible for
coordinating the National Statistical System (NSS); advising Federal, States and Local
Governments on all matters relating to statistical developments; developing and
promoting the use of statistical standards and appropriate methodologies in the system
among other responsibilities. Accordingly, NBS in collaboration with the SMEDAN
conducted a survey on Micro, Small and Medium Enterprises aimed at providing
adequate and reliable baseline data for the development of the sector, based on activities
that occurred in 2010.
This study seeks to assess the Micro, Small and Medium Enterprises (MSMEs)
objectively by presenting certain key data on the sector. Such data include MSMEs
contribution to Gross Domestic Product (GDP), the number and structure of operatives
in the sector and the main challenges and constraints confronting the sector. It also goes
further to proffer solutions to the challenges, making policy recommendations to
government for the development of the sector.
8/22/2019 MICRO, SMALL AND MEDIUM ENTERPRISES SURVEY IN NIGERIA BY SMEDAN
http://slidepdf.com/reader/full/micro-small-and-medium-enterprises-survey-in-nigeria-by-smedan 6/182
2010 NATIONAL MSME COLLABORATIVE SURVEY
Chapter one gives a background to the study, providing a brief history of MSMEs in the
country, outlining its relevance, importance and structure. It shows the important role of
MSMEs as catalysts for the economic transformation. The main reason espoused in the
report for this is the low level of capital required to establish them and their labour
intensive modes of operation which guarantees employment for a large number of
people. Chapter two of the report provides an overview of the MSMEs in Nigeria. It
provides some history of MSMEs dating back from the colonial days, showing some of
the efforts and policies introduced by various governments to develop the sector and
attract Foreign Direct Investment (FDI). A recent effort by the government to develop
the sector was the Microfinance Policy Regulatory Framework, which is aimed at
providing sustainable and credible microfinance bank, capable of channelling funds to
the sector. The chapter also sheds some light on the agency responsible for the
promotion and development of the sector that is the Small and Medium Enterprises
Development Agency, SMEDAN, highlighting its functions and performance since its
inception in 2004.
Chapter three follows with details of the survey design, methodology and coverage of the
survey. The survey was conducted in all 36 states of the Federation including the FederalCapital Territory, Abuja. Divided into household and agric and business components,
300 micro enterprise households per state were visited while 4000 small and medium
enterprises cutting across 12 sectors of the economy were covered. This sample provides
estimates robust enough to compute the data. Chapter four provides analyses the
findings of the survey data. Parameters such as number of enterprises by state and sector,
start-up capital, ownership status by sector and gender are used to analyse the findings.
The analysis of the data revealed that MSMEs play a very big role in the Nigerian
economy, contributing about 46% of the Gross Domestic Product (GDP). Other
interesting data on MSMEs in Nigeria are shown, providing a basis for well-informed
decisions among planners, researchers and policy makers. Its show the significance and
the potential for growth in the sector if the properly developed, particular as the nation
aspires to be among the top twenty economies in the world by the year 2020.
The Report concludes by highlighting the challenges facing the MSME sector in Nigeria.
With weak infrastructure, lack of access to finance and inconsistent government policies

8/22/2019 MICRO, SMALL AND MEDIUM ENTERPRISES SURVEY IN NIGERIA BY SMEDAN
http://slidepdf.com/reader/full/micro-small-and-medium-enterprises-survey-in-nigeria-by-smedan 7/182
2010 NATIONAL MSME COLLABORATIVE SURVEY
listed as the main challenges. Many MSMEs lack knowledge of the various laws, policies
or statutes that protect them and can help them expand and grow. MSMEs are a major
employer in Nigeria, it is therefore important that they are made aware of what is
available to them
The NBS is delighted to have been associated with this study, as it provides adequate
data that goes toward populating our statistical database and makes available, relevant
data required for the development of the sector. This project could not have been put
successful without the hard work of the management and staff of the NBS and
SMEDAN. In particular, the dynamic role and commmitment of the Director-General of
SMEDAN, Alhaji Muhammad N. Umar, needs a special mention. Finally, I would like to
convey my sincere gratitude to all producers and providers of data all around the country,
whose valuable inputs made the publication of the report possible.
Dr Yemi Kale
Statistician General of the Federation and Chief Executive Officer
National Bureau of Statistics

8/22/2019 MICRO, SMALL AND MEDIUM ENTERPRISES SURVEY IN NIGERIA BY SMEDAN
http://slidepdf.com/reader/full/micro-small-and-medium-enterprises-survey-in-nigeria-by-smedan 8/182
2010 NATIONAL MSME COLLABORATIVE SURVEY
Acknowledgement
The implementation of this survey is the combined efforts of key stakeholders of National
Bureau of statistics (NBS) and Small and Medium Enterprise Development Agency of Nigeria
(SMEDAN).
The funding of the project by Small and Medium Enterprise Development Agency of Nigeria
(SMEDAN) and her efforts in defining the concepts and other valuable contributions are
acknowledged.
The technical support of the NBS was pertinent for the success of the survey.
Our profound appreciation is also for the Statistician General (NBS) and the Chief Executive
Officer (CEO), Dr. Yemi Kale for his tenacity of purpose and steadfastness to the success of
the survey.
Our many thanks also go to the Director General and Chief Executive Officer of Small andMedium Enterprises Development Agency of Nigeria (SMEDAN), Muhammad Nadada Umar
for his unbending support to driving the project to successful end.
The efforts of the staff of both organizations who were actively involved in the planning and
implementation of the survey are commended and they are C. O. Moneke, HOD Real Sector
and Household Department, (Retired), Mr. N. B. Nwokoro, Head of Agric. Business Enterprise
Statistics Division Mr. Olawale Fasanya, Director, Strategic Planning, Policy and Coordination
(SMEDAN) Dr. Friday Okpara, Deputy Director (SMEDAN) and Mrs. Ime E. Andy (SMEDAN).
Our special thanks also go to the following members of NBS and SMEDAN staff who took
active part in analysis and writing of the report. Ademola Adegbie, S. D. Oladunjoye, SanusiAhmed, Akpan M. O, Adeyinka A, Adeniji Beatrice Olayioye, Abubakar Aliyu, Ijomah
Eberechukwu Felix, Muoboghare Anthony and host of other staff from both organizations.
Finally, we thank all those who space would not permit us to mention for their invaluable
contributions to the conduct of this survey.
N. G. Oparaku
HOD (RSHSD)
NBS

8/22/2019 MICRO, SMALL AND MEDIUM ENTERPRISES SURVEY IN NIGERIA BY SMEDAN
http://slidepdf.com/reader/full/micro-small-and-medium-enterprises-survey-in-nigeria-by-smedan 9/182
2010 NATIONAL MSME COLLABORATIVE SURVEY
ABBREVIATIONS AND ACRONYMS
BMOS - Business Membership Organisations
AIDS - Acquired Immune Deficiency Syndrome
BOI - Bank of Industry
BDS - Business Development Services
BICs - Business Information Centres
BPC - Business Plan Competition
BSCs - Business Support Centres
CBN - Central Bank of Nigeria
CCSS - Challenges Capital Subsidy Scheme
CEO - Chief Executive Officer
CD - Compact Disk
CEDP - Corper's Entrepreneurship Development Programme
CTG - Cotton, Textile and Garment
CGS - Credit Guarantee Scheme
EDPs - Entrepreneurship Development Programmes
ETPs - Entrepreneurship Training Programmes
EAs - Enumeration Areas
FBI - Faith Based Initiative
FSS 2020 - Financial System Strategy 2020
FDI - Foreign Direct Investment
GEDP - General Entrepreneurship Development Programme
GHAIN - Global HIV/AIDS Initiative Nigeria
GDP - Gross Domestic Product
HOD - Head of Department
HHs - Households
HIV - Human Immune Deficiency Virus
IDCs - Industrial Development CentresIID - Industrial Infrastructure Development
IOM - International Organisation for Migration
JICA - Japan International Cooperation Agency
LGAs - Local Government Areas
MAN - Manufacturers Association of Nigeria
MDA - Marketing Development Assistant
MSI - Medium Scale Industries
MOU - Memorandum of Understanding

8/22/2019 MICRO, SMALL AND MEDIUM ENTERPRISES SURVEY IN NIGERIA BY SMEDAN
http://slidepdf.com/reader/full/micro-small-and-medium-enterprises-survey-in-nigeria-by-smedan 10/182
2010 NATIONAL MSME COLLABORATIVE SURVEY
MSMED - Micro, Small and Medium Enterprises Development
MSMEs - Micro, Small and Medium Enterprises
MCP - Microfinance Certification Programme
MDAs - Ministries, Departments and Agencies
NAFDAC - National Agency for food and Drug Administration and Control
NASENI - National Agency for Science and Engineering Infrastructure
NACCIMA - National Association of Chambers of Commerce, Industry, Mines and Agriculture
NASME - National Association of Small and Medium Enterprises
NASSI - National Association of Small Scale Industrialists
NBTE - National Board of Technical Education
NBS - National Bureau of Statistics
NDLEA - National Drug law Enforcement Agency
NERFUND - National Economic Reconstruction Fund
NISH - National Integrated Survey of Household
NISE - National Integrated Survey of Establishment
NOTAP - National Office for Technology Acquisition Promotion
NPOPC - National Population Commission
NUC - National Universities Commission
NEPC - Nigeria Export Promotion Council
NEXIM - Nigeria Export, Import Bank
NCFR - Nigerian Commission for Refugees
NGO - Non Governmental Organisation
OLOP - One Local Government One Product
PSL - Priority Sector Lending
PPP - Private Public Partnership
PAT - Profit After Tax
RMRDC - Raw Material Research Development Council
RSHSD - Real Sector and Household Statistics Department
REDI - Rural Enterprise Development Initiative
RUFIN - Rural Financial Institute Building
RUWEDEP - Rural Women Enterprise Development Programme
SMEDAN - Small and Medium Enterprises Development Agency of Nigeria
SMEEIS - Small and Medium Enterprises Equity Investment Scheme
SMIDA - Small and Medium Industry Development Agency

8/22/2019 MICRO, SMALL AND MEDIUM ENTERPRISES SURVEY IN NIGERIA BY SMEDAN
http://slidepdf.com/reader/full/micro-small-and-medium-enterprises-survey-in-nigeria-by-smedan 11/182
2010 NATIONAL MSME COLLABORATIVE SURVEY
SMIEIS - Small and Medium Industry Equity Investment
SMI - Small and Medium Enterprises
SME - Small and Medium Enterprises
SMSEGS - Small and Medium Scale Enterprises Guarantee Scheme
SEDF - Small Enterprises Development Fund
SIDBI - Small Industries Development Bank of India
SIDO - Small Industries Development Organisation
SSI - Small Scale Industries
SSI & ARI - Small Scale Industries and Agro/Rural Industries
SON - Standard Organization of Nigeria
SFCs - State Financial Corporations
SIDCS - State Industrial Development Corporations
SAP - Structural Adjustment Programme
SAGE - Students for the Advancement of Global Entrepreneurship
SPX - Sub-Contracting and Partnership Exchange
TRATOW - Train to Work
TOT - Training of Trainers
UK - United Kingdom
UNHCR - United Nations High Commission for Refugees
UNIDO - United Nation industrial Development Organization
USA - United States of America
WEDP - Women Entrepreneurship Development Programme
WASME - World Association for Small and Medium Enterprises
WTO - World Trade Organisation
YCEDP - Youth Corpers Entrepreneurship Development Programme
YOU WIN - Youth Enterprise with Innovation in Nigeria YEDP - Youth Entrepreneurship Development Programme
8/22/2019 MICRO, SMALL AND MEDIUM ENTERPRISES SURVEY IN NIGERIA BY SMEDAN
http://slidepdf.com/reader/full/micro-small-and-medium-enterprises-survey-in-nigeria-by-smedan 12/182
May 2012
Contents Page
1 Executive Summary 12
2 Introduction 15 2.1 Preamble ...................................................................................................... 15
2.2 Background to the Study .............................................................................. 16
2.3 Objectives of the Study ................................................................................ 17
2.4 Definition ..................................................................................................... 18
2.5 Relevance of MSMEs ..................................................................................... 18
2.6 Structure of the Report ................................................................................. 19
3 Overview of the MSME Sector 21
3.1 Introduction ................................................................................................. 21
3.2 Recent Efforts by Government to Stimulate the MSME Sector ........................ 25 3.3 The Small and Medium Enterprises Development Agency of Nigeria (SMEDAN)
Introduction ................................................................................................. 29
3.4 THE ROLE OF SMEDAN- INTERVENTION AND STRATEGY ............................... 30
3.5 SMEDAN’s Scorecard .................................................................................... 34
3.6 Entrepreneurship Development and Education in our Educational System .... 35
3.7 Business Development Services (BDS) ........................................................... 36
3.8 Entrepreneurship Training Programmes (EDPs) ............................................ 37
3.9 Barry University, Miami, Florida/Africa-Diaspora Partnership for
Empowerment & Development (ADPED)/SMEDAN Partnership ...................... 37
3.10 Enterprise Linkages, Cooperation & Clustering .................................... 40
3.11 Advocacy and Operating Environment ................................................. 41
3.12 Access to Finance ................................................................................ 41
3.13 National Policy on MSMEs .................................................................... 42
3.14 Conversion of the IDCs to Clusters ...................................................... 42

8/22/2019 MICRO, SMALL AND MEDIUM ENTERPRISES SURVEY IN NIGERIA BY SMEDAN
http://slidepdf.com/reader/full/micro-small-and-medium-enterprises-survey-in-nigeria-by-smedan 13/182
May 2012
3.15 Collaboration with Japan International Cooperation Agency (JICA) on
One Local Government One Product (OLOP) Programme: ............................. 44
3.16 Implementation of the Sub-Contracting and Partnership Exchange (SPX):
a SMEDAN/UNIDO Collaboration .................................................................. 44
3.17 Collaboration with Ondo State Government on Akure IDC: .................. 45
3.18 Peter Akinola Foundation Collaboration: .............................................. 45
3.19 Industrial Project Profile on Sachet Water Production ........................... 46
3.20 Some Country Experiences in MSME Development ............................... 46
4 Methodology 54
4.1 Survey Design for the Study ......................................................................... 54 4.2 Survey Objectives ......................................................................................... 54
4.3 Coverage ...................................................................................................... 55
4.4 SCOPE .......................................................................................................... 55
4.5 Sample Design ............................................................................................. 55
4.6 Pretest .......................................................................................................... 57
4.7 Survey Instrument ........................................................................................ 57
4.8 Training for Fieldwork .................................................................................. 57
4.9 Fieldwork Arrangement ................................................................................ 58
4.10 Data Processing ................................................................................... 58
4.11 Report writing ...................................................................................... 59
4.12 Documentation/Dissemination/Archiving ............................................ 59
5 Data Analysis: The Formal Sector – Small and Medium Enterprises 60
5.1 The Formal Sector – Small and Medium Enterprises ...................................... 60

8/22/2019 MICRO, SMALL AND MEDIUM ENTERPRISES SURVEY IN NIGERIA BY SMEDAN
http://slidepdf.com/reader/full/micro-small-and-medium-enterprises-survey-in-nigeria-by-smedan 14/182
May 2012
5.2 Data Analysis: The Informal Sector – Micro Enterprises ................................ 84

8/22/2019 MICRO, SMALL AND MEDIUM ENTERPRISES SURVEY IN NIGERIA BY SMEDAN
http://slidepdf.com/reader/full/micro-small-and-medium-enterprises-survey-in-nigeria-by-smedan 15/182
May 2012
5.3 Contribution of MSMEs to the Gross Domestic Product (GDP) ....................... 97
6 Key Findings, Conclusions And Policy Recommendations 107
6.1 Key Findings ............................................................................................... 107
6.2 Conclusion ................................................................................................. 110
6.3 Policy Recommendations ............................................................................ 111
Appendix 114

8/22/2019 MICRO, SMALL AND MEDIUM ENTERPRISES SURVEY IN NIGERIA BY SMEDAN
http://slidepdf.com/reader/full/micro-small-and-medium-enterprises-survey-in-nigeria-by-smedan 16/182
May 2012
Table of FiguresFigure 1 Total Number of Small and Medium Enterprises by Sector ...................................... 60
Figure 2 Start-Up Capital .......................................................................................................... 61
Figure 3 Total Capital by Enterprises as at December 2010 ................................................... 62
Figure 4 Gender of Owner (Sole Proprietorship) ..................................................................... 64
Figure 5 Age of Owner (Sole Proprietorship) ........................................................................... 64
Figure 6 Highest Qualification Attained by Owner .................................................................. 65
Figure 7 Initial Total Assets at Inception .................................................................................. 65
Figure 8 Total Asset Value as at December 2010 .................................................................... 66
Figure 9 Source of Capital ........................................................................................................ 66
Figure 10 Business Monthly Sales (Turnover) 2009 ................................................................. 67
Figure 11 Business Monthly Sales (Turnover) 2010 ................................................................. 67
Figure 12 Business Monthly Cost of Operation ....................................................................... 68
Figure 13 Promotional Media Used by the Enterprise ............................................................ 68
Figure 14 Business Insurance ................................................................................................... 69
Figure 15 Employment by Sex at Commencement of Business............................................... 70
Figure 16 Employment by Sex as at December 2010.............................................................. 71
Figure 17 Educational Qualification of Employees ................................................................. 72
Figure 18 Market Channel of Product(s) .................................................................................. 72
Figure 19 Export of Product/Services ...................................................................................... 73
Figure 20 Business Association ................................................................................................ 73
Figure 21 Business Patent Right by Sector ............................................................................... 74
Figure 22 Own Patent Right by Form of Ownership ................................................................ 75
Figure 23 Registered Patent Right by Sector ........................................................................... 75
Figure 24 Own Patent Right by Form of Ownership ................................................................ 76
Figure 25 Skills Gap by Sector .................................................................................................. 77
Figure 26 Skill Gap by Form Ownership ................................................................................... 77
Figure 27 Major Government Policy that Affect Businesses Most Favorably ......................... 78
8/22/2019 MICRO, SMALL AND MEDIUM ENTERPRISES SURVEY IN NIGERIA BY SMEDAN
http://slidepdf.com/reader/full/micro-small-and-medium-enterprises-survey-in-nigeria-by-smedan 17/182
May 2012
Figure 28 Major Government Policy that Affect Businesses Most Unfavourably ................... 78
Figure 29 Top Priority Areas of Assistance .............................................................................. 79
Figure 30 Awareness of SMEDAN ............................................................................................ 80
Figure 31 Awareness of SMEDAN by State .............................................................................. 80
Figure 32 Awareness of SMEDAN by Sector ............................................................................ 81
Figure 33 Benefit from SMEDAN Services ............................................................................... 81
Figure 34 Export of Products/Services .................................................................................... 82
Figure 35 Banking Relationship ................................................................................................ 83
Figure 36 Business Registration ............................................................................................... 83
Figure 37 Business Plan ............................................................................................................ 84
Figure 38 Number of Enterprises by Economic Sector ........................................................... 85
Figure 39 Total Capital as at December 2010 ......................................................................... 86
Figure 40 Enterprise by Ownership Status .............................................................................. 86
Figure 41 Highest Qualification Obtained by Owners ............................................................. 88
Figure 42 Source of Capital ...................................................................................................... 89
Figure 43 Promotional Media .................................................................................................. 90
Figure 44 Market Channel of Product ...................................................................................... 91
Figure 45 Own Patent Right by Form of Ownership ................................................................ 92
Figure 46 Skill Gap by Form of Ownership ............................................................................... 93
Figure 47 Awareness of SMEDAN by Form of Ownership ....................................................... 94
Figure 48 Personal Banking Relationship of Owners ............................................................... 96
Figure 49 Sectoral Contribution of MSMEs to GDP ................................................................ 98
Figure 50 MSMEs Contribution to Agriculture GDP ................................................................. 99
Figure 51 MSMEs Contribution to Mining & Quarrying GDP ................................................... 99
Figure 52 MSMEs Contribution to Manufacturing GDP ......................................................... 100
Figure 53 MSMEs Contribution to Building & Construction GDP .......................................... 101
Figure 54 MSMEs Contribution to Wholesale & Retail Trade GDP ........................................ 102
8/22/2019 MICRO, SMALL AND MEDIUM ENTERPRISES SURVEY IN NIGERIA BY SMEDAN
http://slidepdf.com/reader/full/micro-small-and-medium-enterprises-survey-in-nigeria-by-smedan 18/182
May 2012
Figure 55 MSMEs Contribution to Hotels & Restaurants GDP .............................................. 102
Figure 56 MSMEs Contribution to Transport, Storage & Communications GDP ................... 103
Figure 57 MSMEs Contribution to Financial Intermediation GDP ......................................... 104
Figure 58 MSMEs Contribution to Real Estate, Renting & Business Services GDP ................ 104
Figure 59 MSMEs Contribution to Education Sector GDP ..................................................... 105
Figure 60 MSMEs Contribution to Health & Social Work GDP .............................................. 105
Figure 61 MSMEs Contribution to Other Community, Social & Personal Services Sector GDP
............................................................................................................................................... 106
Table of TablesTable 1 Summary of the Activities on Information, Advisory Services and Sensitization at the
Head Office & Other Centres for the Year 2010 .................................................................... 114
Table 2 Distribution of Workload and Fieldstaff by Zone and State for Informal and Formal
Components of the Survey .................................................................................................... 114
Table 3 Number of Small and Medium Enterprises by State ................................................. 117
Table 4 Total Number of Small and Medium Enterprises by Sector ...................................... 118
Table 5 Number of Enterprise by State and Sector ............................................................... 119
Table 6 Initial Start-Up Capital ............................................................................................... 119
Table 7 Initial Start-Up Capital by Sector ............................................................................... 120
Table 8 Total Capital by Enterprises as at December 2010 ( national) .................................. 120
Table 9 Total Capital by State as at December 2010 ............................................................. 121
Table 10 Total Capital by Sector as at December 2010 ......................................................... 121
Table 11 Ownership Status .................................................................................................... 122
Table 12 Ownership Status by Sector .................................................................................... 123
Table 13 Gender of Owner (Sole Proprietorship) .................................................................. 123
Table 14 Age of Owner (Sole Proprietorship) ........................................................................ 124
Table 15 Highest Qualification Attained by Owner ............................................................... 124
Table 16 Initial Total Assets at Inception ............................................................................... 124
8/22/2019 MICRO, SMALL AND MEDIUM ENTERPRISES SURVEY IN NIGERIA BY SMEDAN
http://slidepdf.com/reader/full/micro-small-and-medium-enterprises-survey-in-nigeria-by-smedan 19/182
May 2012
Table 17 Total Asset Value as at December 2010 .................................................................. 125
Table 18 Source of Capital ..................................................................................................... 125
Table 19 Business Monthly Sales (Turnover) 2009 ................................................................ 125
Table 20 Business Monthly Sales (Turnover) 2010 ................................................................ 126
Table 21 Business Monthly Cost of Operation....................................................................... 126
Table 22 Promotional Media by the Enterprise ..................................................................... 126
Table 23 Business Insurance .................................................................................................. 127
Table 24 Daily Useage of Alternative Source of Power ......................................................... 128
Table 25 Employment by Sex as at Commencement of Business ......................................... 128
Table 26 Employment by Sector as at Commencement ........................................................ 129
Table 27 Employment by Sex as at December 2010 .............................................................. 130
Table 28 Employment by Sector as December 2010 ............................................................. 130
Table 29 Educational Qualification of Employees ................................................................. 131
Table 30 Market Channel of Product(s) ................................................................................. 131
Table 31 Export of Products/Services .................................................................................... 131
Table 32 Business Association ............................................................................................... 132
Table 33 Business Patent Right by Sector .............................................................................. 132
Table 34 Own Patent Right by Form of Ownership ............................................................... 133
Table 35 Registered Patent Right by Sector........................................................................... 133
Table 36 Own Patent Right by Form of Ownership ............................................................... 134
Table 37 Skills Gap by Sector ................................................................................................. 134
Table 38 Skills Gap by Form of Ownership ............................................................................ 135
Table 39 Major Government Policy That Affect Businesses Most Favourably ...................... 135
Table 40 Major Government Policy That Affect Businesses Most Unfavourably .................. 135
Table 41 Top Priority Areas of Assistance .............................................................................. 136
Table 42 Capacity Utilization in Manufacturing ..................................................................... 137
Table 43 Capacity Utilization: Mining & Quarrying................................................................ 140
8/22/2019 MICRO, SMALL AND MEDIUM ENTERPRISES SURVEY IN NIGERIA BY SMEDAN
http://slidepdf.com/reader/full/micro-small-and-medium-enterprises-survey-in-nigeria-by-smedan 20/182
May 2012
Table 44 Awareness of SMEDAN ........................................................................................... 141
Table 45 Awareness of SMEDAN by State ............................................................................. 141
Table 46 Awareness of SMEDAN by Sector ........................................................................... 142
Table 47 Benefit from SMEDAN Service ................................................................................ 143
Table 48 Benefit from SMEDAN Service by States ................................................................. 143
Table 49 Ranking of SMEDAN Service .................................................................................... 144
Table 50 Rank of Problems Militate Against Enterprises Development in Nigeria ............... 144
Table 51 Measures by SMEDAN to Alleviate Problems ......................................................... 145
Table 52 Export of Product/Services...................................................................................... 145
Table 53 Value of Export by Sector (Naira) ............................................................................ 146
Table 54 Banking Relationship ............................................................................................... 146
Table 55 Business Registration .............................................................................................. 147
Table 56 Business Plan ........................................................................................................... 147
Table 57 Number of Micro Enterprises by State.................................................................... 147
Table 58 Number of Micro Enterprises by Sector .................................................................. 148
Table 59 Initial Start-Up Capital at Inception (N’000) ............................................................ 149
Table 60 Initial Start-Up Capital by Sector (000).................................................................... 150
Table 61 Total Capital as at December 2010 ......................................................................... 151
Table 62 Ownership Status .................................................................................................... 151
Table 63 Ownership Status by Sector .................................................................................... 152
Table 64 Sex of Owners by Economic Sector ......................................................................... 152
Table 65 Age of Owner (sole Proprietorship) ........................................................................ 153
Table 66 Highest Qualification Attained by Owners .............................................................. 153
Table 67 Initial Total Assets at Inception ............................................................................... 154
Table 68 Source of Capital ..................................................................................................... 154
Table 69 Business Capacity Turnover 2009 ........................................................................... 155
Table 70 Business Capacity Monthly Average 2010 .............................................................. 155
8/22/2019 MICRO, SMALL AND MEDIUM ENTERPRISES SURVEY IN NIGERIA BY SMEDAN
http://slidepdf.com/reader/full/micro-small-and-medium-enterprises-survey-in-nigeria-by-smedan 21/182
May 2012
Table 71 Business Monthly Cost of Operation....................................................................... 155
Table 72 Promotional Media ................................................................................................. 156
Table 73 Business Insurance .................................................................................................. 156
Table 74 Daily Useage of Alternative Source of Power by Sector ......................................... 157
Table 75 Employment by Sector at Commencement ............................................................ 158
Table 76 Employment by Sector as at December 2010 ......................................................... 158
Table 77 Market Channel of Product ..................................................................................... 159
Table 78 Business Registration by Sector .............................................................................. 159
Table 79 Support Received from Association ........................................................................ 160
Table 80 Own Patent Right by Sector .................................................................................... 160
Table 81 Own Patent Right by Form of Ownership ............................................................... 161
Table 82 Patent Right Registered by Sector .......................................................................... 161
Table 83 Skills Gap by Sector ................................................................................................. 162
Table 84 Skills Gap by Form of Ownership ............................................................................ 162
Table 85 Major Government Policy That Affect Business Most Favourably ......................... 163
Table 86 Major Government Policy That Affect Business Most Unfavourably ..................... 163
Table 87 Top Priority of Assistance ........................................................................................ 164
Table 88 Awareness of SMEDAN by Form of Ownership ...................................................... 164
Table 89 Awareness of SMEDAN by State ............................................................................. 164
Table 90 Benefit from SMEDAN Services by State ................................................................. 165
Table 91 Benefitted from SMEDAN by Form of Ownership .................................................. 166
Table 92 Ranking of SMEDAN Services Received ................................................................... 167
Table 93 Ranking of Major Problem Militating Against Businesses in Nigeria ...................... 167
Table 94 Personal Insurance of Owners ................................................................................ 168
Table 95 Personal Banking Relationship of Owners .............................................................. 168
Table 96 Qualification Attained by Workers .......................................................................... 168
Table 97 What SMEDAN Can do to Alleviate Some of the Problems .................................... 169

8/22/2019 MICRO, SMALL AND MEDIUM ENTERPRISES SURVEY IN NIGERIA BY SMEDAN
http://slidepdf.com/reader/full/micro-small-and-medium-enterprises-survey-in-nigeria-by-smedan 22/182
May 2012
Table 98 Business Plan by Ownership .................................................................................... 169
Table 99 Membership of Association .................................................................................... 169
Table 100 Micro, Small, Medium Enterprises (MSMEs) Nominal GDP (Naira million) .......... 170
Table 101 Contribution to Each GDP Economic Activity (%).................................................. 170
Table 102 Initial Start-Up Capital at Inception (N '000) ......................................................... 171
Table 103 Personal Insurance Owners................................................................................... 171

8/22/2019 MICRO, SMALL AND MEDIUM ENTERPRISES SURVEY IN NIGERIA BY SMEDAN
http://slidepdf.com/reader/full/micro-small-and-medium-enterprises-survey-in-nigeria-by-smedan 23/182
May 2012
12
1 EXECUTIVE SUMMARY
The dearth and paucity of credible and reliable MSME database is one of the
main constraints to evolving a strategic action plan towards an efficient and
sustainable MSME sector. Consequently, SMEDAN undertook this collaborative
survey with the National Bureau of Statistics to produce this National MSME
database to aid planning and decision making.
The survey covered business enterprises in Nigeria employing below 200 persons
(Micro, Small and Medium Enterprises). The survey was conducted in all the 36
States of the Federation and the Federal Capital Territory, Abuja. The pre-test was
conducted in Lagos and Kano states. For micro enterprises (employing 1-9
persons) data were canvassed through the National Integrated Survey of
Household (NISH) Schedule. Also rural and urban areas where small (employing
10-49 persons) and medium (employing 50-199 persons) enterprises are located
were covered through the National Integrated Survey of Establishment (NISE)
Module.
Thirty Enumeration Areas comprising of 3 replicates in which each replicates
contain 10 EAs were selected per state and FCT, Abuja. These replicates are
subsets of twenty (20) which each state of the Federation and FCT, Abuja had.
Ten micro enterprises were systematically selected per EA making a total of 300
micro enterprises visited in each state and FCT, Abuja. For the establishment
component, 4,000 small and medium enterprises were visited covering the twelve
selected sectors.
In view of the above, therefore, some of the findings of the survey are as follows:
The total number of enterprises stood at 17,284,671 (micro-17,261,753,
small- 21,264, and medium-1,654).
The initial start-up capital of micro enterprises were predominantly less
than fifty thousand Naira, while small and medium enterprises were
predominantly less than ten million Naira.
8/22/2019 MICRO, SMALL AND MEDIUM ENTERPRISES SURVEY IN NIGERIA BY SMEDAN
http://slidepdf.com/reader/full/micro-small-and-medium-enterprises-survey-in-nigeria-by-smedan 24/182
May 2012
13
Lagos state has the highest number of small and medium enterprises
(4,535) while Osun state has the least (100).
Lagos state has the highest number of micro enterprises (880,805),
followed by Kano state (872,552), while FCT recorded the least (272,579).
The main challenges confronting the operations of MSMEs in Nigeria as
revealed by the survey are access to finance and poor infrastructure.
The total number of persons employed by the MSME sector as at
December, 2010 stood at 32,414,884.
The female entrepreneurs accounted for 42.1% in the ownership
structure of microenterprises as against 13.57% in small and medium
enterprises.
Most of the entrepreneurs interviewed are not aware of SMEDAN and their
services. The beneficiaries of SMEDAN Services are very minimal in
virtually all the states.
Over 70% of the entrepreneurs do not have patent right, hence their
intellectual property are not protected.
The ownership structure by age showed that the age bracket of 24-50
dominates. Hence youth entrepreneurs are dominant.
The three priority areas of assistance to MSMEs are access to finance,
provision of infrastructure and regular supply of power and water.
Most of the MSMEs are not covered by any insurance policy. That is most
of them are not insured.
The skills gap by sector showed that qualified artisans are readily available
in most of the sectors surveyed.
In terms of average capacity utilisation, most of the MSMEs are operating
below optimum capacity.
Most of the enterprises are operating without a business plan and most of
them do not belong to any business membership association.
MSMEs contribution to the Nation‟s Gross Domestic Product in nominal
terms stood at 46.54% as at the period under review.
The survey recommended that a strategic action plan to address the six key
constraints confronting the sector should be put in place urgently. These
constraints are access to finance, weak infrastructure, and inconsistency in
government policies, lack of work place, multiple taxation and obsolete
technology.

8/22/2019 MICRO, SMALL AND MEDIUM ENTERPRISES SURVEY IN NIGERIA BY SMEDAN
http://slidepdf.com/reader/full/micro-small-and-medium-enterprises-survey-in-nigeria-by-smedan 25/182
May 2012
14
8/22/2019 MICRO, SMALL AND MEDIUM ENTERPRISES SURVEY IN NIGERIA BY SMEDAN
http://slidepdf.com/reader/full/micro-small-and-medium-enterprises-survey-in-nigeria-by-smedan 26/182
May 2012
15
2 INTRODUCTION
2.1 Preamble
In a developing economy like Nigeria, Micro, Small, and Medium Enterprises playtremendous role in reengineering the socio-economic landscape of the country.
These enterprises largely represent a stage in industrial transition from traditional
to modern technology. The variation in transitional nature of this process is
reflected in the diversity of these enterprises. Most of the small enterprises use
simple skills and machinery as well as local raw materials and technology. Micro,
Small, and Medium Enterprises are vital in developing the Nigerian economy for
the following reasons: social and political role in local employment creation,
balanced resources utilization, income generation, utilization of local technology
and raw materials and in helping to promote change in a gradual and peaceful
manner.
There is growing realization on the part of the Government that instead of the
promotion of large-scale enterprises, it should incentively promote micro, small,
and medium enterprises. Until recently, the micro, small and medium enterprises
were virtually neglected in the Nigerian Economic Development Strategy. The
economic reforms being carried out by the present administration has however
placed greater emphasis on micro, small and medium enterprises development
through the National Policy on micro, small and medium enterprises. The
Government is striving on the creation of an enabling and friendly environment in
which Micro, Small and Medium Enterprises would flourish, and entrepreneurial
instincts aroused so that the entrepreneurs may get maximum output and
rewards from their efforts. Radical liberalization and deregulation have been
introduced to make the Nigerian economy progressively market-oriented andintegrated with the emerging global economic structure in a sustainable manner.
In view of the above, the Government has realized the importance of this sector
as a catalyst for the growth, productivity and competitiveness of the economy. Not
only are they the seedbed for wealth creation, employment generation and
poverty reduction, they have been recognized as critical breeding and nurturing
grounds for domestic entrepreneurial capacities, technical skills, technological
innovativeness and managerial competencies for the development of a vibrant
and productive economy.
8/22/2019 MICRO, SMALL AND MEDIUM ENTERPRISES SURVEY IN NIGERIA BY SMEDAN
http://slidepdf.com/reader/full/micro-small-and-medium-enterprises-survey-in-nigeria-by-smedan 27/182
May 2012
16
The long-term policy imperative of the country is to achieve inclusive growth. The
present socio-economic development challenges confronting Nigeria is
exacerbated by the changing demographic profile of the country. The number of
unemployed is on the increase, of which the proportion of the educated youth will
also continue to rise. Therefore, the need for strong, accelerated economic
growth and development are now more acute than ever.
Nigerian‟s economic growth has been led by the service sector in the last decade,
particularly, in the information technology and telecommunication. The
agricultural, agro-allied and service sectors offer huge potential for job creation.
Moreover, the importance of Micro, Small and Medium Enterprises in the growth
process is considered to be a key engine of economic growth and development in
Nigeria. Hence, the development and promotion of this sector holds the key to
inclusive growth and plays a critical role in Nigeria‟s future.
2.2 Background to the Study
The Small and Medium Enterprises Development Agency of Nigeria (SMEDAN)
was established in 2003, to facilitate the promotion and development of the
Micro, Small and Medium Enterprises (MSMEs) sector in an efficient andsustainable manner. The Agency is saddled with the responsibility of contributing
to the realisation of the Transformation Agenda of the present Administration and
the cluster development Approach of the Ministry of Trade and Investment
With the overall objective of reducing poverty through wealth and job creation and
facilitating national economic development, the Micro, Small and Medium
Enterprise are perceived as the oil required to lubricate the engine of socio-
economic transformation. The death and paucity of credible and reliable
database is one of the main constraints in the development of this sub sector.
In light of the above, the need for an adequate and reliable data base for MSMEs
in Nigeria is imperative. Hence the importance of this survey, however, SMEDAN
had made concerted effort in the past to build a credible MSME database through
private consultants, but the result was not desirable. Due to the absence of a
robust MSME database, the Agency could not adequately evolve a strategic plan

8/22/2019 MICRO, SMALL AND MEDIUM ENTERPRISES SURVEY IN NIGERIA BY SMEDAN
http://slidepdf.com/reader/full/micro-small-and-medium-enterprises-survey-in-nigeria-by-smedan 28/182
May 2012
17
and programme towards vibrant and virile MSMEs that will stimulate and trigger
economic development in Nigeria.
To address these constraints, the National Bureau of Statistics (NBS) in
collaboration with the Small and Medium Enterprises Development Agency of
Nigeria (SMEDAN) conducted this National MSME Survey.The survey is to produce
a credible and reliable MSME database in Nigeria. The pretest was conducted in
Lagos and Kano states in March, 2010 through a purposeful sampling.
2.3 Objectives of the Study
The main objective of the survey is to establish a credible baseline data/database
for the micro, small and medium enterprises (MSMEs) sector in Nigeria. Other
specific objectives are:
To determine the contribution of micro, small and medium enterprises
sector to Gross Domestic Product (GDP) in Nigeria;
To determine the number of micro, small and medium enterprises in Nigeria
by sector and by state;
To identify the main challenges and constraints confronting the operations of
MSMEs in Nigeria;
To determine the contribution of MSMEs to employment generation;
To determine the contribution of MSMEs to export;
To identify the number of MSMEs owned by Women and Men;
To identify the ownership structure of MSMEs by age;
To identify the skill gaps within the sector;
To determine the capacity utilization within the sector;
To ascertain the top priority areas of intervention and assistance to the
sector;
To identify the financing windows for the MSME sector for raising low cost
finance.
8/22/2019 MICRO, SMALL AND MEDIUM ENTERPRISES SURVEY IN NIGERIA BY SMEDAN
http://slidepdf.com/reader/full/micro-small-and-medium-enterprises-survey-in-nigeria-by-smedan 29/182
May 2012
18
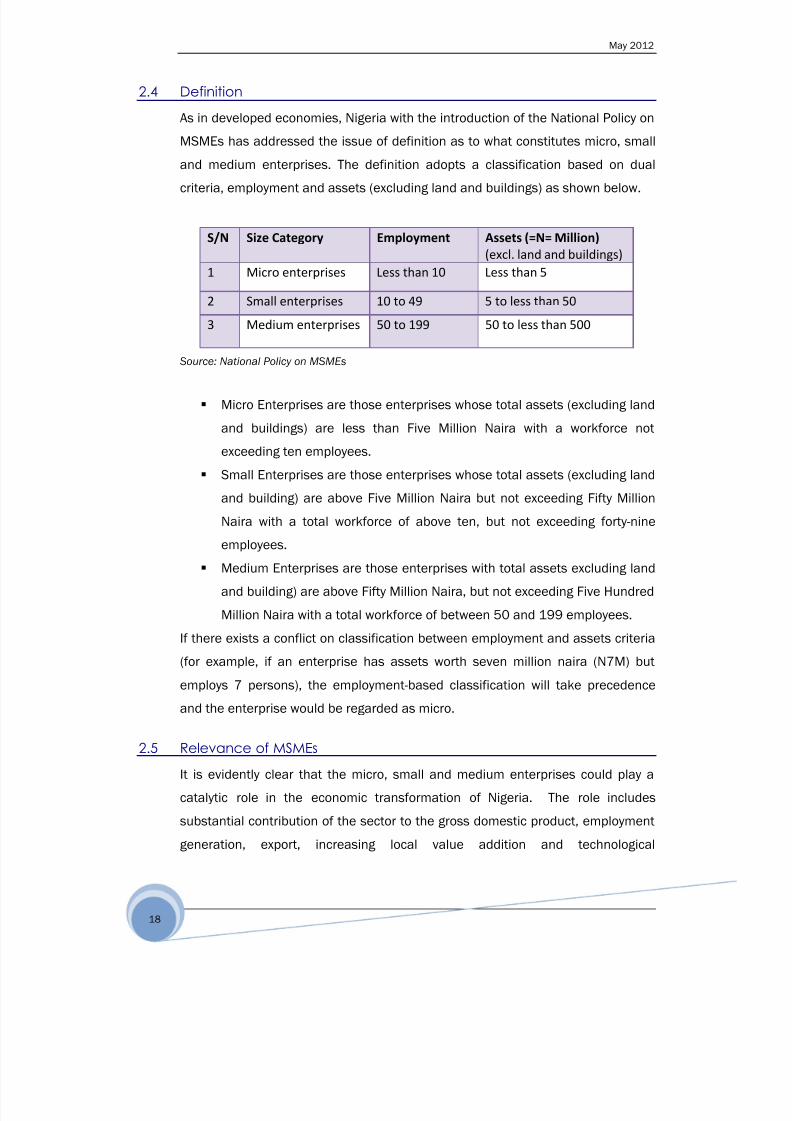
2.4 Definition
As in developed economies, Nigeria with the introduction of the National Policy on
MSMEs has addressed the issue of definition as to what constitutes micro, small
and medium enterprises. The definition adopts a classification based on dualcriteria, employment and assets (excluding land and buildings) as shown below.
S/N Size Category Employment Assets (=N= Million)
(excl. land and buildings)
1 Micro enterprises Less than 10 Less than 5
2 Small enterprises 10 to 49 5 to less than 50
3 Medium enterprises 50 to 199 50 to less than 500
Source: National Policy on MSMEs
Micro Enterprises are those enterprises whose total assets (excluding land
and buildings) are less than Five Million Naira with a workforce not
exceeding ten employees.
Small Enterprises are those enterprises whose total assets (excluding land
and building) are above Five Million Naira but not exceeding Fifty Million
Naira with a total workforce of above ten, but not exceeding forty-nine
employees.
Medium Enterprises are those enterprises with total assets excluding land
and building) are above Fifty Million Naira, but not exceeding Five Hundred
Million Naira with a total workforce of between 50 and 199 employees.
If there exists a conflict on classification between employment and assets criteria
(for example, if an enterprise has assets worth seven million naira (N7M) but
employs 7 persons), the employment-based classification will take precedence
and the enterprise would be regarded as micro.
2.5 Relevance of MSMEs
It is evidently clear that the micro, small and medium enterprises could play a
catalytic role in the economic transformation of Nigeria. The role includes
substantial contribution of the sector to the gross domestic product, employment
generation, export, increasing local value addition and technological

8/22/2019 MICRO, SMALL AND MEDIUM ENTERPRISES SURVEY IN NIGERIA BY SMEDAN
http://slidepdf.com/reader/full/micro-small-and-medium-enterprises-survey-in-nigeria-by-smedan 30/182
May 2012
19
advancement. Other measures advanced by the advocates of micro, small and
medium enterprises development in the country include:
i. The low level of capital required in the establishment of the enterprises.
ii. The large number of the establishment and their labour intensive modes of
operation guarantees employment for a large number of persons (labourintensive).
iii. Inventions, adaptations, and general technological development are
common in these enterprises.
iv. A more equitable distribution of income is usually achieved in this sector.
v. Industrial diversification and a relatively more balanced regional
development are assured.
vi. The evolution of indigenous enterprise is common amongst these
establishments.
vii. General enhancement of the tempo of industrial development is visible
among these enterprises.
viii. Tendency among these enterprises to become feeders of large-scale
enterprises and service products made by the latter.
2.6 Structure of the Report
In order to provide credible and reliable data for appropriate policy prescriptions
to strategically reposition the MSME Sector, the report is organised into five
chapters. The introductory chapter covers the definitional overview of micro, small
and medium enterprises, the background and objectives of the survey. It also
provides an insight into the relevance of MSMEs in Nigeria. Chapter two provides
an overview of MSMEs in Nigeria, highlighting the pivotal role of SMEDAN in the
promotion and development of MSMEs in Nigeria. It also highlights the functions
and scorecard of the Agency and some country experiences in MSME
development. In chapter three, the survey examines the methodology, highlighting
the survey design, coverage and sample.
Chapter four analyses the national survey data with a view to evaluating the
challenges and constraints of the sector. The analyses are classified into two
sections - Formal Sector (Small and Medium Enterprises) and Informal Sector
(Micro Enterprises). Parameters, such as number of enterprises by State and
Sector, Start-up Capital, Ownership Status by Sector and Gender, Age of Owners,
Contribution to Employment and Gross Domestic Product. The analyses include
the assessment of skills and the skill gaps within the sector. Membership ofAssociations, Business/Personal insurance of entrepreneurs/enterprises, daily
8/22/2019 MICRO, SMALL AND MEDIUM ENTERPRISES SURVEY IN NIGERIA BY SMEDAN
http://slidepdf.com/reader/full/micro-small-and-medium-enterprises-survey-in-nigeria-by-smedan 31/182
May 2012
20
assuage of alternative sources of power, market channels of product/service,
business registration, ownership of patent right, major government policy that
affect business favourably and unfavourably. Area of assistance required by the
entrepreneurs/enterprises, ranking of SMEDAN services received, etc.
Capacity utilization, problem militating against enterprise development in Nigeria
were also articulated in chapter four, while chapter five presents the key findings,
conclusion and policy recommendations for MSME growth and development in
Nigeria.
8/22/2019 MICRO, SMALL AND MEDIUM ENTERPRISES SURVEY IN NIGERIA BY SMEDAN
http://slidepdf.com/reader/full/micro-small-and-medium-enterprises-survey-in-nigeria-by-smedan 32/182
May 2012
21
3 OVERVIEW OF THE MSME SECTOR
3.1 Introduction
Micro, Small and Medium Enterprises (MSMEs) sector plays a pivotal role throughseveral pathways that goes beyond job creation. They are growth-supporting
sector that not only contribute significantly to improve living standards, but also
bring substantial local capital formation and achieve high level of productivity of
Micro, Small, and Medium enterprises.
In Nigeria, the history of MSMEs dated back more than six decades ago during the
colonial era in 1946 with a ten year development plan. The plan was for the then
colonial administration to lay groundwork for the welfare and development of
Nigeria. But despite the intensions, the colonial administration implicitly had
preference for large scale industries in a push for industrialization. During the
period, trade, price, tax, and exchange rate policies as well as enabling
environment were prioritized in favour of the large firms to pave way for large
industries as catalyst for Nigeria‟s industrialization. Despite these, the large
manufacturing sector could not drive the economy. The economy was a buyer‟s
market for outside economies and seller‟s market for raw materials. Thus the
policy of local sourcing of raw materials were hardly pursued as a result easy
availability of cheap exchange rate to import foreign components; these situations
hampered the development of MSMEs.
The import substitution policy of the post-colonial period posted a picture that
tolled the anti MSMEs policy. It emphasised on industries that could undertake
mass production of consumer goods. In addition, credit and incentives weregranted to industries that could not go beyond first step of producing consumer
goods. To attract Foreign Direct Investment FDI, policies such as profit tax
holidays, import duty relief which allows firms to import raw designated materials
under duty free and concessional arrangements, accelerated depreciation on
capital investment and tariff protection. There were also monetary incentives such
as the establishment of financial institutions for loans and subsidies. A number of
financial institutions were drafted to oversee these arrangements such as, Nigeria
Industrial Development Bank, and Nigeria Bank for commerce and Industry.

8/22/2019 MICRO, SMALL AND MEDIUM ENTERPRISES SURVEY IN NIGERIA BY SMEDAN
http://slidepdf.com/reader/full/micro-small-and-medium-enterprises-survey-in-nigeria-by-smedan 33/182
May 2012
22
Generally, both trade and infrastructural policies favoured the large scale
industries.
In spite of these incentives, the manufacturing sector remains in comatose. The
problem of large scale manufactures was further aggravated by the collapse of
the international oil market in the 1980s. The associated unemployment and low
capacity utilization created balance of payment problem which forced Nigerian
government to seek for a bailout from international credit institutions,
International Monetary Fund and World Bank. As one of the pre-conditions and
requirements for such credit facilities, the economy embarked on Structural
Adjustment Programme (SAP). In other to drive home the policy objectives of the
SAP, an inward-looking policy that emphasises the use of local raw materials was
introduced to encourage local producers, particularly Small and Medium
Enterprises (SMEs).
To harness the potentials of the MSMEs, the sector became particularly a focus of
attention during the era of the Structural Adjustment Programme (SAP) in 1986.
Thus, the Structural Adjustment Policy of 1986 saw the rising profile of increased
number of MSMEs. As form of encouragement, policies were adopted to use the
sector as stepping stone for both job creation and industrialization. Industrial
development centres, industrial estates, World Bank assisted programmes were
put in place to encourage the sector. Various SMEs institutions were also
established, small scale industrial scheme, the National Economic Reconstruction
Fund, the small and medium scale loan scheme, the people‟s bank of Nigeria,
and National Directorate of Employment were also established. These institutions
were however not sustained because they were products of political regimes and
went into extinction as soon as the regimes were brought to an end. Moreover,
there were no enabling laws to formally establish MSMEs in Nigeria; as they
suffered neglects, constraint to effective development, and funds starvation.
To address the problems of access to credits and establish MSMEs as polar axis
for Nigeria‟s industrialization, Small and Medium Industry Equity Investment
Scheme (SMIEIS) was initiated by the Central Bank of Nigeria in collaboration with
Bankers Committee in June 19, 2001. This was in response to the Federal
8/22/2019 MICRO, SMALL AND MEDIUM ENTERPRISES SURVEY IN NIGERIA BY SMEDAN
http://slidepdf.com/reader/full/micro-small-and-medium-enterprises-survey-in-nigeria-by-smedan 34/182
May 2012
23
Government‟s concerns and policy measures for the promotion of Small and
Medium Enterprises (SMEs) as vehicles for rapid industrialisation, sustainable
economic development, poverty alleviation and employment generation.
Consequently, on August 21, 2001 the scheme was launched by the Obasanjo
administration. The main purpose is to salvage and develop the SME sector, by
addressing the problems of limited access to long-term credit; remove burden of
interest rate charges; and eliminate other charges associated with normal bank
lendings. It requires that all banks in Nigeria develop and package viable
industries with private investors and to set aside 10% of their pre-tax profit for
equity investment in SMEs. In addition, banks are expected to provide financial,
advisory, technical and managerial support for the SMIs in which they have
invested. Ten percent (10%) of the fund set aside goes to the microfinance
enterprises. Every legal business activity is covered under the scheme (Micro,
Small and Medium Enterprises) with the exception of trading/merchandising and
financial services.
Given the successful establishment of funding window for MSMEs, it was
imperative to take census of the size of MSMEs in Nigeria as a further step
towards having efficient funding. In addressing the problems of non-availability of
comprehensive information on SMEs, the CBN commissioned Universities in
Nigeria to conduct a nation-wide baseline economic study of MSMEs in 2004. The
number of persons employed by the SMIs has generally risen over the years. The
number employed by small scale industries (SSI) rose from 33,843 at inception to
53,686 at the time of the survey in 2004. Similarly, the number of persons
employed by medium scale industries (MSI) increased from 15,308 at inception
to 40,130 in the same period.
Several factors were found to be major hindrances to the realization of the SMI in
Nigeria. These factors include, production technology, cost structure and
financing, entrepreneurship, firm characteristics, management structure, and
marketing strategies, poor infrastructures (roads, electricity, energy,
communication, manufacturing environment); economic environment (venture
capital, fluctuating value of the Naira, etc); production inputs (raw materials,
equipment, land, energy, etc); government policies; and political considerations. It
8/22/2019 MICRO, SMALL AND MEDIUM ENTERPRISES SURVEY IN NIGERIA BY SMEDAN
http://slidepdf.com/reader/full/micro-small-and-medium-enterprises-survey-in-nigeria-by-smedan 35/182
May 2012
24
is the complex interaction of these factors and variables that determines the
success or failure of both SMI operations and the attendant public policy
interventions.
The current survey is an attempt to conceptually define the size and compositions
of the MSMEs, determine the incidence of MSME, identify the problems
bedevilling the sector, and possibly identify the finance gap. Formally the size of
the MSMEs in Nigeria is estimated at about 17,284,671. The breakdown shows
that micro industries constitutes about 17,261,753 or 99.87%, the small
enterprises accounted for about 21, 264 or 0.12%, while the medium scale
enterprises is about 1, 654 or 0.01%. The size of the micro sector is relatively
large and instructive; and could be a reflection of the possibility that certain
economic conditions may have either forced small enterprises to go informal or
that more unemployed persons are engaged in informal activities.
Several factors may have led to such a huge gap between the micro enterprises
and the SMEs. The size of the SMEs firstly is directly related to the definitional
scope used. A decrease in the minimum number of employers and capital outlay
required for an enterprise to be classified as SME will increase the number of
SMEs. Secondly in Nigeria, the informal sector constitutes a very large proportion
of the economy. The micro enterprises (informal) are affected by excessive
regulation, high cost of entry into formal settings, high level of unemployment, low
level of education attainment, poor infrastructural development, and more
importantly poverty/low income level.
Harsh economic environment, particularly, poverty and poor infrastructural
development must have affected the SMEs and micro enterprises who are the
recipients of the vulnerable group from the MSMEs. The rising profile of poverty in
Nigeria could have accounted for the low size of SMEs and high size of the micro
enterprises – micro enterprises is the balancing sector in the equation of MSMEs.
Improvements in economic conditions reduce micro enterprises and increases
SMEs, otherwise enterprise falls from SMEs to micro enterprises. In 2004 when
similar survey was conducted by the CBN, relative poverty stood at about 54%,
but in 2010 poverty level rose to 69%; and by the NBS projection, it is expected to
further increase in 2011. In the same period, unemployment was about 13.4%
and has risen to 21.1% and 23.9% in 2010 and 2011 respectively. Implicitly, the
8/22/2019 MICRO, SMALL AND MEDIUM ENTERPRISES SURVEY IN NIGERIA BY SMEDAN
http://slidepdf.com/reader/full/micro-small-and-medium-enterprises-survey-in-nigeria-by-smedan 36/182
May 2012
25
chunk of SMEs, may have been forced to fall back to the micro enterprises, as a
result of these unfavourable economic conditions, hence the fall in the size of the
SMEs.
3.2 Recent Efforts by Government to Stimulate the MSME Sector
The Micro, Small and Medium Enterprises Sub-sector has been identified as one
of the critical elements to the achievement of the country‟s vision 20-2020. The
sub-sector has been globally acknowledged as the engine that drives the socio-
economic transformation of both the developing and developed countries. A
nurtured and well structured MSME sector contributes significantly to
employment generation, wealth creation, poverty reduction and sustainable
economic growth and development.
Various attempts have been made by successive Government to stimulate the
growth and development of the MSME sector in Nigeria after many years of
neglect. The call for a coordinating Agency for the MSMEs sub-sector dated back
to 1987, when a study by the World Bank made the recommendation. Efforts by
the Government to actualize it failed until 2003, when the Small and Medium
Scale Industry Development Agency (Establishment) Act, enacted by the National
Assembly created the Small and Medium Industry Development Agency (SMIDA).
The National Assembly passed the SMIDA amendment bill in December, 2004.
The Act changed the name of SMIDA to the Small and Medium Enterprises
Development Agency of Nigeria (SMEDAN).
The Agency is today, the country‟s apex institution with the statutory responsibility
of facilitating the creation, resuscitation and stimulation of the growth and
development of the Micro, Small and Medium Enterprises sector of the Nigerian
economy. The establishment of SMEDAN is a giant stride by the Federal
Government in repositioning the sector and realigning it into mainstream of the
Nigerian economy.
Other recent government efforts to stimulate the sector include the following:
I. The Microfinance Policy, Regulatory and Supervisory Framework for
Nigeria.
The Government through the Central Bank of Nigeria (CBN) launched theMicrofinance Policy, Regulatory and Supervisory Framework for Nigeria in 2005.

8/22/2019 MICRO, SMALL AND MEDIUM ENTERPRISES SURVEY IN NIGERIA BY SMEDAN
http://slidepdf.com/reader/full/micro-small-and-medium-enterprises-survey-in-nigeria-by-smedan 37/182
May 2012
26
The policy provided the legal and regulatory framework for microfinance banking
in Nigeria. The objective is to create a sustainable and credible microfinance
banks capable of mobilizing and channelisating funds to the MSME sub-sector.
The policy, however, resulted in the establishment of new microfinance banks and
the conversion of some existing community banks to microfinance banks. Today,
the microfinance banks have provided the financing widow to address the
inadequate access to finance confronting the micro and small enterprises in
Nigeria.
II. The Small and Medium Enterprises Equity Investment Scheme (SMEEIS)
The SMEEIS initiative was in response to the Federal Government‟s concerns and
policy measure towards the aggressive and radical transformation of the sub-
sector through the provision of adequate and cheaper funding. All the commercial
banks operating in Nigeria were required to set aside 10% of their profit after tax
(PAT) for equity investment in small and medium enterprises in Nigeria. The
cumulative sum set aside by the banks under the scheme as at December, 2009
was #42 billion. However, the scheme did not achieve the desired impact as most
SMEs were not interested in the equity participation for fear of losing control of
their enterprises. Even then, most of them lack the 60% equity contribution which
resulted in delay disbursement as the borrowers were deemed to be
uncooperative. Also, most SMEs lack proper bankable business plan, marketing
strategy, no sound accounting systems and do not run their transactions through
the banking system.
III. The N200 billion Small and Medium Scale Enterprises Guarantee Scheme
(SMECGS)
The scheme was established in 2010 to fast track the development of the sector,
set the pace for the industrialization of the economy and increase access to credit
by small and medium enterprises and entrepreneurs. The scheme provided
guarantees on loans by banks to the sector in order to absorb the risks that had
inhibited banks from lending to the sector. The beneficiaries of the scheme are
small and medium enterprises with total assets not exceeding #500 million and a
labour force of 11 to 300 staff. A maximum amount of #100 million would be

8/22/2019 MICRO, SMALL AND MEDIUM ENTERPRISES SURVEY IN NIGERIA BY SMEDAN
http://slidepdf.com/reader/full/micro-small-and-medium-enterprises-survey-in-nigeria-by-smedan 38/182
May 2012
27
guaranteed which could be in form of working capital, term loan for refurbishment
or equipment upgrade or expansion and overdraft.
IV. The N200 billion SME Restructuring/Refinancing Fund
The Fund was established by the Government through the Central Bank of
Nigeria. The purpose of the Fund was for re-financing or re-structuring of bank‟s
existing loan portfolios to the sector. The Fund was sourced from the #500 billion
debenture stock issued by the Bank of Industry. However, the main objective of
the Fund is to enhance access to credit by the small and medium enterprises and
improve the financial position of the commercial banks. The scheme is managed
by the Bank of Industry who disburses the Fund to the Participating banks for
restructuring of their loan portfolio.
V. The N100 billion Cotton, Textile and Garment (CTG) Fund
The Fund was established by the Government through the Central Bank of Nigeria
for on-lending to small and medium enterprises engaged in the cotton, textile and
garment value chain. The main objective of the fund is to resuscitate, revive, and
set the textile industry on the path of economic recovery, as well as bring back the
lost glory of the industry in accordance with the transformation agenda of the
Federal Government.
VI. The N2 billion NERFUND Facility
The National Economic Reconstruction Fund (NERFUND) is now being
repositioned to contribute to the growth and development of the MSME sector.
The Federal Government has recently released #2 billion to the Fund for direct
lending to the MSME sub-sector. In disbursing the Fund, NERFUND signed an
MoU with SMEDAN and other principal stakeholders within the sector to channel
application with a bankable business plan from their clients to ensure adequate
outreach. The objective is to stimulate the MSMEs and realign them towards the
economic aspirations of the Government.
VII. The N5 billion Dangote Fund for MSMEs
In their determined effort to stimulate the MSME sub-sector, the Government is
entering into collaboration and partnership with the private sector. One of such

8/22/2019 MICRO, SMALL AND MEDIUM ENTERPRISES SURVEY IN NIGERIA BY SMEDAN
http://slidepdf.com/reader/full/micro-small-and-medium-enterprises-survey-in-nigeria-by-smedan 39/182
May 2012
28
collaboration is the #5 billion Dangote Fund to the Bank of Industry for on-lending
to micro, small and medium enterprises in Nigeria.
VIII. The Counterpart Funding Scheme of the Bank of Industry
The Bank of Industry has emerged with various strategies and schemes to provide
finance to the MSME sector in accordance with her mandate. One of the major
challenges facing the Nigerian MSME sector is finance. Finance is considered to
be the key driver of any organization. The bank of industry in realization of the
importance of finance to the MSMEs has provided adequate access to finance to
the sector through its various schemes, especially, their counterpart funding
scheme with the state government. Some state governments have provided one
billion Naira to the bank for on-lending to micro, small and medium enterprises in
such state. The Bank will then match such fund with additional one billion Naira.
The scheme has gone a long way in solving the challenge of adequate finance
confronting many MSMES in the various states.
IX. The Youth Enterprise with Innovation in Nigeria (You Win) Programme
The Youth Enterprise with Innovation in Nigeria (You WiN!) Programme is a
collaboration of the Ministry of Finance, the Ministry of Communication
Technology (CT), and the Ministry of Youth Development that launched an annual
Business Plan Competition (BPC) for aspiring young entrepreneurs in Nigeria, in
line with the Federal Government‟s drive to create more jobs for Nigerians. The
programme is been implemented in partnership with Nigeria‟s private sector, who
are be requested to provide the funding support. The main objective of the Youth
Enterprise with Innovation in Nigeria (You WiN!) Programme is to generate jobs by
encouraging and supporting aspiring entrepreneurial youth in Nigeria to develop
and execute business ideas that will lead to job creation. The programme will
provide aspiring youth with a platform to show case their business acumen, skills
and aspirations to business leaders, investors and mentors in Nigeria. SMEDAN is
the monitoring Agency of the programme. The rationale is to stimulate the MSME
sector in accordance with the present administration‟s economic aspirations in
employment generation.
X. Train to Work (TRATOW) Initiative

8/22/2019 MICRO, SMALL AND MEDIUM ENTERPRISES SURVEY IN NIGERIA BY SMEDAN
http://slidepdf.com/reader/full/micro-small-and-medium-enterprises-survey-in-nigeria-by-smedan 40/182
May 2012
29
The TRATOW Initiative of the Federal Ministry of Trade and Investment is targeted
at equipping young Nigerians with the skills required to establish and manage
their small businesses. The MSME sub-sector has been experiencing some skill
gaps necessary to grow the sector. This initiative will close such gaps and lead to
the establishment of new enterprises and the expansion of existing ones. The
required vocational, entrepreneurial and managerial skills have been provided. It
must be emphasized that many MSMEs lack proper management capabilities and
technical and managerial deficits are the main factors militating against the
growth and development of MSMEs in Nigeria.
XI. Campaign for Patronage of Made-in-Nigeria Products
The buy made in Nigeria Products Initiative of the Federal Government is another
laudable scheme to stimulate the MSME sector. The campaign has provided
adequate market for made in Nigeria products. The initiative has led to the
market and marketing of the products/services of the sector through renewed
vigor and aggressive strategy in the packaging and quality of the products. It has
provided access to market by enhancing the turnover of the MSMEs and making
them more competitive.
3.3 The Small and Medium Enterprises Development Agency of Nigeria
(SMEDAN) Introduction
In its continued search for solutions towards a vibrant and virile micro, small, and
medium enterprises sector, and to entrench the sector into the main stream of
the Nigerian economy, the Small and Medium Enterprises Development Agency of
Nigeria (SMEDAN) was established in 2003. The Agency is a “one stop shop” for
nursing and nurturing micro, small, and medium enterprises in Nigeria.
Consequently, the Small and Medium Enterprises Development Agency of Nigeria
(SMEDAN) has since inception been in the forefront of developing and promoting
Micro, Small and Medium enterprises and entrepreneurs in Nigeria.
The mission of SMEDAN is “to facilitate the access of micro, small, and medium
entrepreneurs/investors to all resources required for their development.”
8/22/2019 MICRO, SMALL AND MEDIUM ENTERPRISES SURVEY IN NIGERIA BY SMEDAN
http://slidepdf.com/reader/full/micro-small-and-medium-enterprises-survey-in-nigeria-by-smedan 41/182
May 2012
30
The vision of SMEDAN is “to establish a structured and efficient micro, small, and
medium enterprises sector that will enhance sustainable economic development
of Nigeria.”
The Functions of SMEDANThe functions of the Agency as enunciated in the SMIDA Act, 2003 are listed below:
1. Initiating and articulating policy ideas for micro, small, and medium enterprises
growth and development;
2. Stimulating, Monitoring and Coordinating the development of the MSMEs sector;
3. Promoting and facilitating development programmes, instruments and support
services to accelerate the development and modernization of MSMEs;
4. Serving as a vanguard for rural industrialization, poverty reduction, and job
creation and thus facilitating enhanced sustainable livelihoods;5. Linking MSMES to internal and external sources of finance, appropriate
technology, technical skills as well as to large enterprises;
6. Overseeing monitoring and coordinating the development of the MSMEs sector;
7. Promoting and providing access to industrial infrastructure, such as layouts
incubators and industrial parks;
8. Providing assistance to MSMEs in marketing their products.
9. Mobilizing internal and external resources, including technical assistance, for the
development of MSMEs;10. Promoting the familiarization, sub-contracting, networking, and crosscutting
strategic linkages between MSMEs and other economic sub-sectors;
11. Creating beneficial linkages between MSMEs and research institutes/universities;
12. Providing extension services to MSMEs;
13. Monitoring implementation of government directives, incentives and facilities for
MSMEs development;
14. Recommending to government required amendments to business regulatory
frameworks for ease of enterprise development.
15. Working in concert with other institutions in both public and private
sectors to create a good enabling environment of business in general, and
MSMEs activities in particular
3.4 THE ROLE OF SMEDAN- INTERVENTION AND STRATEGY
Conscious of her mandate and the strategic position she occupies in fostering a
viable and vibrant MSMEs in Nigeria. SMEDAN is collaborating and partnering

8/22/2019 MICRO, SMALL AND MEDIUM ENTERPRISES SURVEY IN NIGERIA BY SMEDAN
http://slidepdf.com/reader/full/micro-small-and-medium-enterprises-survey-in-nigeria-by-smedan 42/182
May 2012
31
with the various States and Chambers of commerce in the realization of their
goals and objectives. SMEDAN‟s intervention strategies centre on the following
areas:
I. Sourcing, Processing and Disseminating Business Information by creating and
regularly updating the Agency‟s databank on MSMEs, raw materials, markets,
available local technologies/machinery, and prototypes.
II. Policy Development
Formulate and ensure due approval and implementation of an MSMEs policy
for Nigeria, conduct impact assessment studies and use same to recommend
improvements in policy intervention and conduct regular stakeholders‟ fora.
III. Establish Business Support Centres and Business Information Services (BSCs
and BICs)
The centres provide the following services:
Model business-planning skills
Mentoring professional services such as Accounting, Financing and Book-
Keeping
Industrial Dynamics and Technology Assessment
Legal and taxation advisory services
Demonstration models to private sector service providers
General business consultation
IV. Capacity Building and Promotional Services
Vertical linkage of MSMEs with large enterprises
Organisation of MSMEs into clusters and co-operatives to enhance their
productivity and have easier access to factors of production,
Arrangement/facilitation of trade and technology exposition
Provision of market support information system
Encouragement and facilitation of new investments in designated priority
areas in each state of the federation
V. Encourage Establishment of Industrial Parks
SMEDAN, through public-private partnership and public-public partnership, is
facilitating the establishment of Industrial Parks and Regional MSMEs
Development Centres. Each park comes with industrial buildings, and offers

8/22/2019 MICRO, SMALL AND MEDIUM ENTERPRISES SURVEY IN NIGERIA BY SMEDAN
http://slidepdf.com/reader/full/micro-small-and-medium-enterprises-survey-in-nigeria-by-smedan 43/182
May 2012
32
MSMEs common facilities on a cost-sharing basis- security, electricity, water,
buying centres, service providers, petrol station, and capital-intensive
technologies.
VI. Enhance MSMEs Access to Finance
Liaise with financial institutions to harness and pool resources for utilization
by MSMEs. Assisting in sharpening their business plans for possible financial
assistance from Micro-finance banks and development banks. Constantly
liaise with other institutions for the establishment and operation of MSMEs
Credit Guarantee Scheme.
VII. Networking
We are collaborating with Trade Groups, NGOs, Government Ministries and
Agencies, Research and Technological Institutions and Multilateral/Donor
Agencies etc to create a dynamic network of stakeholders in the development
of MSMEs sub-sector of the economy. The Agency‟s continued talks on a
number of strategic partnerships with both private and public sector
institutions to advance the course of MSMEs in Nigeria.
VIII. The National Policy on Micro, Small and Medium Enterprises.
In view of the critical importance of an MSME national policy to the
sustainable development of the MSME sub-sector, the Agency in partnership
with UNIDO have developed a National Policy on MSMEs geared towards the
development of MSMEs in Nigeria in a structured and efficient manner.
IX. Inculcating Entrepreneurship Education through Entrepreneurship
Development Programmes (EDPs)
The Agency have trained many Entrepreneurs in our various EDPs tailored
towards the required needs of the beneficiaries. The Programmes include the
following:
General Entrepreneurship Development Programme (GEDP).
This programme exposes potential entrepreneurs to the rudiments of
starting and managing their business enterprises. The programme has the
potential of training and facilitating the establishment of new businesses
and the expansion of existing enterprises.
Youth Entrepreneurship Development Programme (YEDP)
The programme is targeted at the youth, which constitute the major part of
the population. This programme can train and facilitate the establishment

8/22/2019 MICRO, SMALL AND MEDIUM ENTERPRISES SURVEY IN NIGERIA BY SMEDAN
http://slidepdf.com/reader/full/micro-small-and-medium-enterprises-survey-in-nigeria-by-smedan 44/182
May 2012
33
of youth owned enterprises. The Agency supports the formation of
entrepreneurship clubs in primary, secondary and tertiary institutions.
Women Entrepreneurship Development Programme (WEDP)
This is a gender based programme aimed at transforming the Women into
successful entrepreneurs. The programme seeks to economically empower
the Nigerian Women through conscious engagement and development of
entrepreneurial capacities. Over the years, SMEDAN has assisted in the
economic empowerment of women. Today, we have many business
enterprises owned and managed by women.
Youth Entrepreneurship Development Programme (YEDP)
The programme is targeted at fresh school leavers. Entrepreneurship
lectures are organized to prepare them towards business ownership and
management. The participants are expected to prepare and submit
business plans at the end of the training programme. The business plans
are sent to micro-finance banks for financial assistance.
Rural Enterprise Development Initiative (REDI)
This programme is aimed at stimulating entrepreneurship/enterprise
development in the rural communities. The rural areas have in abundant
natural resources that can generate employment, create wealth and
reduce poverty. The Agency is committed in re-engineering rural economic
transformation through this programme. It is a cluster based support
programmes that provide the capacity towards business ownership and
management. Through this programme, the Agency encourages and
nudges them into Cooperative Societies and Self-Help Groups and assists
them with registration, business plan preparation and access to finance.
Cluster Development
SMEDAN embarked on the strategic action of developing enterprises
clusters at different parts of the country. The rationale behind it is that
working with MSMEs located within a cluster allows the Agency to impact
on a larger group of entrepreneurs towards increased competitiveness. To
this end, the Agency commenced Business Development Service with the
clusters and assist in the provision of common facility centres.
The list of Clusters SMEDAN had identified and impacted on are:
1. Cane weavers in Lagos
8/22/2019 MICRO, SMALL AND MEDIUM ENTERPRISES SURVEY IN NIGERIA BY SMEDAN
http://slidepdf.com/reader/full/micro-small-and-medium-enterprises-survey-in-nigeria-by-smedan 45/182
May 2012
34
2. Fish and Irrigation farmers Alao in Borno State
3. Cat fish in Calabar
4. Cassava cluster in Taraba State
5. Ginger in Kwoi Local Gov‟t in Kaduna
6. Shea butter cluster in Agbaeku-eji
7. Black soap cluster in Osun State
8. Aba leather cluster in Aba
9. Women Mat weavers in Ekiti State
10. Abakaliki rice cluster in Ebonyi State
X. Seminars, Conferences and Workshops
We have over the years organized seminars, conferences, and workshops to
sensitize the public towards being their own bosses as well as inculcating the
spirit and culture of entrepreneurialism among the students, youths, and women.
XI. Trade Fairs and Trade Exhibitions
We have since inception organized various MSMEs trade fairs and exhibitions to
create markets for micro and small businesses in Nigeria.
3.5 SMEDAN’s Scorecard
3.5.1 Information, Training, Advisory Services and Business Sensitization
The Agency provided information on raw materials, machinery, general business,
advisory services, business sensitization, access to finance, markets and
business counselling through our offices and consultants to a total of 29,993
prospective MSMEs in 2010 (see Table 1). Analysis of quarterly activities is as
specified below.
Information dissemination was through prints & electronic devices such as The A-
Z of Doing Business, What can SMEDAN do for you, SMEDAN at a glance,
Information on SMEDAN‟S Business Support and Business Information Centres,
How to Start a Small Business, and Answers to frequently asked questions (FAQs)
regarding starting and Running a Business etc. Distribution channels include the
Business Support Centres (BSCs), Business Information Centres (BICs), Head
8/22/2019 MICRO, SMALL AND MEDIUM ENTERPRISES SURVEY IN NIGERIA BY SMEDAN
http://slidepdf.com/reader/full/micro-small-and-medium-enterprises-survey-in-nigeria-by-smedan 46/182
May 2012
35
Office front desk and business clinic sessions, meetings, conferences, workshops,
high traffic points such as trade fairs, public institutions, etc.
To date, SMEDAN has a total of 15 Business Support Centres (BSCs) and 37
Business Information Centres (BICs) and we have opened Zonal Offices in the 6
geo-political zones to oversee activities in the states under their Jurisdiction. The
BSCs and BICs are institutional channels for delivering SMEDAN services for
growth of small businesses in Nigeria. In addition, We have equipped the Zonal
Offices to effectively oversee activities of Business Support Centres (BSCs),
Business Information Centres (BICs) and Industrial Development Centres (IDCs)
for effective service delivery to MSMEs. The zonal offices are located in the 6 Geo-
political zones as follows:
Lokoja (Kogi State) North Central
Bauchi (Bauchi State) North East
Kano (Kano State) North West
Yenegoa (Bayelsa State) South South
Enugu (Enugu State) South East
Lagos (Lagos State) South West
3.6 Entrepreneurship Development and Education in our Educational
System
Today‟s education should be predicated on the philosophy of creating jobs, i.e.
transforming the students from job seekers to job creators. The cardinal objective
should be the creation and management of new enterprises. The Agency
spearheaded the campaign to ensure that entrepreneurship education is given apride of place in our educational system. The Agency collaborated with the
National Universities Commission (NUC), National Board for Technical Education
(NBTE) and the Federal Ministry of Education to promote the inclusion of
entrepreneurship in the curriculum of the nation‟s secondary schools and tertiary
institutions in Nigeria. The Agency has visited many Schools and tertiary
institutions to sensitize them on business ownership and management. The
objective is to inculcate entrepreneurialism into them and changing their mindset.

8/22/2019 MICRO, SMALL AND MEDIUM ENTERPRISES SURVEY IN NIGERIA BY SMEDAN
http://slidepdf.com/reader/full/micro-small-and-medium-enterprises-survey-in-nigeria-by-smedan 47/182
May 2012
36
3.7 Business Development Services (BDS)
3.7.1 ONESIMUS Project
Under the Faith–based Initiative, the Agency intensified its efforts to promote
entrepreneurial activities amongst members of various religious groups through
provision of entrepreneurship awareness for existing/ prospective entrepreneurs.
The Agency trained prison inmates via the collaboration with the Prisons
Fellowship of Nigeria, Covenant University and the Nigerian Prison Service for the
training of prison inmates on entrepreneurship under the „Onesimus project‟.
Within the year, the Agency, under the prisons partnership, trained 23 prison
inmates in the kirikiri, Apapa-Lagos prisons and 35 prison inmates in the Keffi,
Nasarawa State prisons. The aim of the programme is to empower the inmates tostart their own small businesses.
3.7.2 Corpers’ Entrepreneurship Development Programme (CEDP)
The Agency undertook the sensitization of youth corps members at 23 orientation
camps within the 6 geo-political zones in the country. 4,000 corps members were
impacted in 2010. The event was aimed at inculcating the spirit of
entrepreneurship in the corps members preparatory to a full-fledged capacity
building which will empower the corps members to start their own small
businesses.
3.7.3 Rural Women Enterprise Development Programmes
Despite the huge economic potentials in Nigeria, the rural women are faced with
overwhelming challenges that militate against their realization of these huge
latent potentials. The exploration and exploitation of these huge latent potentials
is the objective of this programme. It is structured to empower the rural women in
terms of her socio-economic potentials. The initiative, championed by the Office of
the First Lady of Nigeria and driven by SMEDAN has been escalated to cover the
entire 36 States of Nigeria with possible assistance/partnership from the World
Bank and other reputable international Development Partners. In an attempt to
rightly position the rural women to take full advantage of the intervention,
SMEDAN has trained rural women groups in twelve (12) pilot States.
8/22/2019 MICRO, SMALL AND MEDIUM ENTERPRISES SURVEY IN NIGERIA BY SMEDAN
http://slidepdf.com/reader/full/micro-small-and-medium-enterprises-survey-in-nigeria-by-smedan 48/182
May 2012
37
Towards ensuring an inclusive and sustainable program implementation, the
Agency is working with eight (8) other MDAs i.e Standards Organization of Nigeria
(SON), Nigeria Export Promotion Council (NEPC), Bank of Agriculture, National
Office for Technology Acquisition and Promotion (NOTAP), National Agency for
Science and Engineering Infrastructure (NASENI), Nigeria Export-Import Bank
(NEXIM), Raw Material Research and Development Council (RMRDC) and National
Agency for Food and Drug Administration and Control (NAFDAC) .
3.8 Entrepreneurship Training Programmes (EDPs)
3.8.1 Capacity building
The Agency trained a total of 78,480 existing business owners and start-ups in
2010 under its various Entrepreneurship Development Programmes (EDPs) such
as General EDP, Youth EDP, Corper‟s EDP (NYSC/SMEDAN/MDG), Women EDP,
and other Enterprise Support Services (Training the Trainers). The training was
conducted in conjunction with some partnering institutions. These programmes
were run at various locations across the 36 States of the Federation. At the end of
the training, the business will be expected to be grouped into cooperative society
and post training will include packaging the enterprises for BOI loans. The
Entrepreneurship Development Programme is necessary to encourage enterprise
development in the country, which in turn is expected to trigger entrepreneurial
activities among groups and individuals to improve and sharpen their business
skills. This will ultimately provide employment for the nation‟s growing population.
3.9 Barry University, Miami, Florida/Africa-Diaspora Partnership for
Empowerment & Development (ADPED)/SMEDAN Partnership
The US State Department under its Young Entrepreneurs Programme Partnered
with Barry University‟s Andreas School of Business, Africa Diaspora Partnership
for Empowerment and Development (ADPED) and SMEDAN to run a Nigeria Youth
Entrepreneurship Program with the theme: “Connecting People, Creating
understanding”. The program, aimed at training 20 young existing and potential
entrepreneurs after participating in an intensive boot camp in Abuja, was to
engender entrepreneurship and business development training to young
Nigerians between the ages of 22-35 years. It also sought to promote
entrepreneurial thinking, job creation, and business planning and management
8/22/2019 MICRO, SMALL AND MEDIUM ENTERPRISES SURVEY IN NIGERIA BY SMEDAN
http://slidepdf.com/reader/full/micro-small-and-medium-enterprises-survey-in-nigeria-by-smedan 49/182
May 2012
38
skills for emerging young professionals. The training programme for the 20 young
Nigerians was undertaken at the Barry University, Miami, Florida between 11th
November, 2010 and 8th December, 2010. Within the period under review,
based on request, 15 of the 20 young people trained have received funding from
the National Economic Reconstruction Fund (NERFUND) and have started their
various businesses.
3.9.1 SMEDAN/International Organization for Migration (IOM) partnership
Under this partnership, the Agency trained 44 voluntary returnees in Benin in
order to empower them to start their own small businesses. These returnees have
since started their businesses.
3.9.2 SMEDAN/Global HIV/AIDS Initiative Nigeria (GHAIN) partnership
Under this partnership, the Agency trained 53 care givers in Abuja and 68 care
givers in Sokoto. The aim of the training programme is to build the capacity of
individuals so that they would be in the position to effectively take care of people
living with HIV/AIDS.
3.9.3 SMEDAN/United Nations High Commission for Refugees (UNHCR)/Nigerian
Commission for Refugees (NCFR) partnership
The agency facilitated entrepreneurship training in collaboration with the UNHCR
& NCFR targeted at refugees at camps located in Lagos and Ijebu-Ode. 70
refugees were trained in Ijebu-Ode while 68 refugees were trained in Lagos.
3.9.4 SMEDAN/WIDOWS Initiative
Under this initiative, the Agency trained a total of 32 widows in entrepreneurship
in Abuja while 13 widows and 9 widows out of this number were trained in poultry
keeping and soap making respectively. Within this period, a total of 225 widows
were sensitized in Abakaliki, Ebonyi State on entrepreneurship and small
business management.
3.9.5 SMEDAN/NDLEA partnership
Within this period, the Agency sensitized 35 people from the NDLEA rehabilitation
centre in Bauchi under the partnership.
8/22/2019 MICRO, SMALL AND MEDIUM ENTERPRISES SURVEY IN NIGERIA BY SMEDAN
http://slidepdf.com/reader/full/micro-small-and-medium-enterprises-survey-in-nigeria-by-smedan 50/182
May 2012
39
3.9.6 Faith Based Initiative (FBI)
Religion is a powerful mobiliser of men and women and having identified this, a
faith based initiative was conceptualized by the Agency so as to trigger and
stimulate entrepreneurial activities among the various religion groups in the
country. Under this initiative, the Agency has sensitized and trained over 25,880
members of various Faiths including Muslims and Christians. Many of them have
started their businesses.
3.9.7 SMEDAN/CBN/NDIC/CIBN/Micro Finance Certification Programme (MCP)
Access to finance is a major challenge confronting the operators of the MSMEs.
Towards bridging this gap, the Central bank of Nigeria introduced the Micro
Finance Policy that guided the establishment of MFBs across the country. As a
result of the several hiccups encountered in the operation of the MFBs, there was
the obvious need for the capacity building of the operators of the MFBs. This is to
enable them understand the workings of the MFBs and even the clients they are
to serve. In continuation of the Microfinance Certification Programme (MCP), as
part of the overall Microfinance Development Strategy for Nigeria, the CBN
approved the commencement of the second level of the training from September
5th - 16th, 2011. The training programme was facilitated by SMEDAN as theMicrofinance Training Service Provider (MTSP).
The objective of the certification programme is to continue to build a sustainable
skilled labour force for the microfinance sub-sector through the certification of
operators and non-executive directors of microfinance banks in Nigeria. A total of
40 persons participated in the programme.
3.9.8 SMEDAN/RUFIN Partnership
A four day entrepreneurship training programme was structured and implemented
for rural SMEs by Rural Finance Institution Building Programme (RUFIN) and Small
and Medium Enterprise Development of Nigeria (SMEDAN) at 12 states: Benue,
Nasarawa, Edo, Anambra, Lagos, Oyo, Imo, Akwa Ibom, Bauch, Zamfara,
Adamawa and Kastina States. Three Local Governments in each state was
selected for impact with a class size of 40 persons who were representing 20
already existing cooperative groups. This programme was based on the initiativeof International Fund for Agricultural Development (IFAD) to outsource the

8/22/2019 MICRO, SMALL AND MEDIUM ENTERPRISES SURVEY IN NIGERIA BY SMEDAN
http://slidepdf.com/reader/full/micro-small-and-medium-enterprises-survey-in-nigeria-by-smedan 51/182
May 2012
40
entrepreneurial component of the RUFIN programme to relevant organizations
with the competence to implement its content.
The objective of the training was to sharpen/deepen the knowledge base of its
participants to the realities of how to maximize opportunity and to start/manage
business successfully. The target sectors were women groups, youth groups, men
groups and the physically challenged that are already doing one business or
another.
A minimum of 1,440 persons have been impacted with capacity building in
entrepreneurship who are leaders or core representative of cooperatives that
exist in their different localities who are already doing one business or the other.
3.10 Enterprise Linkages, Cooperation & Clustering
Realising the principal role of enterprise linkages, cooperation & clustering, the
Agency commenced the identification of Agro and non-Agro allied clusters around
the country. This renewed focus has brought a wide range of benefits to MSMEs,
such as:
Increased access to business development services; Realization of potentials for economies of scale and improved information
flows;
Improved access to finance and other pertinent resource/ export services.
Other potential areas of benefit the Agency foresees are:
Pooled sourcing of raw materials;
Equipment sharing;
Deeper inter-firm learning and co-operation;
Linkages of complementary skills to bid for work that would have beenbeyond their reach as individual units;
The Agency is also perfecting interventions aimed at moving clusters that have
benefited from capacity enhancement to address the other identified gaps.
Working with NERFUND and Bank of Industry, such interventions have included
access to finance to expand and/or create new businesses, credit to acquire
common facilities, and encouraging them to form Cooperatives/Associations
where none previously existed. The above-mentioned services are available and
on-going to Rice, Cassava, Catfish, Leather, Machine Fabricators Automobile,

8/22/2019 MICRO, SMALL AND MEDIUM ENTERPRISES SURVEY IN NIGERIA BY SMEDAN
http://slidepdf.com/reader/full/micro-small-and-medium-enterprises-survey-in-nigeria-by-smedan 52/182
May 2012
41
Waste-to-Wealth, Garment, Tie and Dye, Shea butters, Cane Weavers, and Raffia
clusters.
3.11 Advocacy and Operating Environment
The Agency, as the voice of the MSMES in Nigeria, continued its advocacy on
behalf of MSMEs. Notable activities during the period under review were
collaboration between the Agency and the National Economic Reconstruction
Fund (NERFUND), BOI, Central Bank of Nigeria (CBN), and the Nigeria Research
Institute for Chemical Technology (NARICT) Zaria, and other stakeholders to
explore partnership possibilities in order to advance the course of MSMEs in
Nigeria.
The Agency also worked and contributed to the work of different Committees
constituted by the Federal Government for the improvement of MSMEs sector
namely:
Financial System Strategy (FSS) 2020
Inter Ministerial Committee of the 7th D-8 Summit held in Nigeria
Technical Committee on MSME Data Survey: collaboration with National
Bureau of Statistics (NBS).
Presidential Committee on Amnesty
Campaign for patronage of Made- In- Nigeria Products
3.12 Access to Finance
Aside the collaboration with NERFUND and Bank of Industry (BOI) already
discussed (see Enterprise Linkages, Cooperation & Clustering above), the Agency
has continued to refer several interested MSMEs with bankable business plans to
these financial institutions for finance.
Within the period under review, the Agency reviewed about 500 business plans
submitted by various existing & potential entrepreneurs and forwarded same to
Bank of Industry (BOI) and the National Economic Reconstruction Fund
(NERFUND) for the provision of finance.
The Agency also worked with the office of the Special Assistant to Vice President
on SMEs to involve all Stakeholders in the review of the National Credit Guarantee
Scheme draft document for MSMEs.

8/22/2019 MICRO, SMALL AND MEDIUM ENTERPRISES SURVEY IN NIGERIA BY SMEDAN
http://slidepdf.com/reader/full/micro-small-and-medium-enterprises-survey-in-nigeria-by-smedan 53/182
May 2012
42
3.13 National Policy on MSMEs
SMEDAN has produced a National Policy for the MSME sector. The thrust of the
National Policy is to provide an enabling environment for micro, small, and
medium enterprises to grow and increase competitiveness on both local andglobal markets. This is anchored around a number of key principles, namely:
policy regulation, credit and complementary financial services, information and
business development services, market development, Research and
Development, legal and regulatory issues.
The Agency embarked on stakeholders‟ retreat on the review of the Policy within
the six (6) geo-political zones for the purpose of gathering stakeholders‟ input into
the review process. The retreats were well attended and were held as follows:
South East (Enugu)
North East (Bauchi)
North Central (Minna)
North West (Kano)
South West (Lagos)
South South (Port Harcourt)
The inputs of the stakeholders will be subjected to validation workshops across
the geo-political zones within the first quarter of 2012. Final draft will be
forwarded to the Honourable Minister for further polishing and processing.
3.14 Conversion of the IDCs to Clusters
Consequent upon the handing over of the Twenty Four (24) Industrial
Development Centres (IDCs) to the Agency and the Federal Ministry of Trade and
Investment directive that they should be made functional on a sustainable basis
for the benefit of MSMEs and emergence of viable clusters. A Project Delivery
Team (PDT) was constituted on 21st February, 2011. The constitution of the PDT
is part of the effort to convert the Industrial Development Centres into World Class
Cluster Parks through Public – Private Partnership. The membership of the PDT
includes:
i. Federal Ministry of Trade and Investment
ii. Small & Medium Enterprises Development Agency of Nigeria
(SMEDAN)iii. Infrastructure Concession and Regulatory Commission (ICRC)

8/22/2019 MICRO, SMALL AND MEDIUM ENTERPRISES SURVEY IN NIGERIA BY SMEDAN
http://slidepdf.com/reader/full/micro-small-and-medium-enterprises-survey-in-nigeria-by-smedan 54/182
May 2012
43
iv. Raw Materials Research and Development Council (RMRDC)
A Steering Committee had been constituted to provide policy guidelines and
general direction to the Project Delivery Team. Membership of the Steering
Committee shall include; SME Department of the Vice – President Office, Federal
Ministry of Commerce and Industry, Nigeria Export Import(NEXIM) Bank, Raw
Materials Research and Development Council(RMRDC), Bank of Industry(BoI),
Manufacturers Association of Nigeria(MAN) and representatives of Business
Membership Organizations(BMOs).
The project Delivery Team, recently conducted assessment visits to the IDCs.
Based on the outcome of the exercise, the Agency in collaboration with theInfrastructure Concession Regulatory Commission (ICRC) shall engage the
services of reputable Consultants to function as Outline Business Case (OBC)
Advisors for the Industrial Development Centres in order to determine their
respective viability. The IDCs locations being considered are as follows:
i. Idu, FCT – Abuja
ii. Zaria, Kaduna State
iii. Bauchi, Bauch State
iv. Oshogbo, Osun State
v. Owerri, Imo State
vi. Port – Harcourt, Rivers State
3.14.1 Job creation through access to credit: Collaboration with Bank of Industry
(BOI) on Osun East Senatorial District Micro Credit Scheme
The Agency entered into partnership (via a Memorandum of Understanding) with
the Bank of Industry (BOI) for the implementation of the N50 million Osun East
Senatorial District Constituency Micro Credit Scheme Project in 2010. The
scheme was designed to develop SMEs using Cooperative Society structures
through Micro Credit Revolving Scheme. The disbursement of the loans is usually
preceded by entrepreneurship training. Within the period under review, 10 (ten)
cooperative societies benefited from this scheme at the rate of between N3
million and N5 million per society. Indeed, some of the cooperative societies have
started repaying the loan. As a follow-up to this initiative, the Agency has written
to all distinguished Senators and Honourable Members of the House of
8/22/2019 MICRO, SMALL AND MEDIUM ENTERPRISES SURVEY IN NIGERIA BY SMEDAN
http://slidepdf.com/reader/full/micro-small-and-medium-enterprises-survey-in-nigeria-by-smedan 55/182
May 2012
44
Representatives requesting them to utilize their constituency projects towards
developing the MSMEs sector along this platform.
3.14.2 SMEDAN/Students for the Advancement of Global Entrepreneurship (SAGE)partnership
The Agency co-sponsored and provided training for the participation of Zamani
International College, Kaduna and Junior Secondary School, Jikwoyi, Abuja at the
SAGE world competition held in New York, USA between July 22-26, 2011. The
two schools won the first position in two different categories.
3.15 Collaboration with Japan International Cooperation Agency (JICA) on
One Local Government One Product (OLOP) Programme:
The One local Government One Product (OLOP) is collaboration between the
Federal Government of Nigeria (represented by the Federal Ministry of Trade and
Investment) and the Japanese Government through Japanese International
Cooperation Agency (JICA). The primary objective of the initiative is to provide
policy options and institutional framework for implementing the OLOP programme
in Nigeria in order to revitalize rural communities through the development of
local businesses. The programme is targeting the development of selected agro
and allied products along cluster lines. The Pilot Projects had been implemented
in Kano and Niger states. Three clusters among three products were developed in
each of the two pilot states. The products are rice, leather and groundnut oil for
Kano State while yam, Shea butter and groundnut oil are for Niger State. The pilot
draft final report (DFR) had been presented to stakeholders at a seminar held in
October 2011. The final report is expected to be presented by the Japan
International Cooperation Agency (JICA) before the year runs out. Consultation has
continued with all States and Local Governments to tidy up for the full blown
proposal/scheme to be flagged off at a date agreed for national implementation.
3.16 Implementation of the Sub-Contracting and Partnership Exchange
(SPX): a SMEDAN/UNIDO Collaboration
The Agency signed a Memorandum of Understanding (MOU) with the United
Nations Industrial Development Programme (UNIDO) on the Sub-Contracting and
Partnership Exchange (SPX) Programme. The Programme is a unique enterprises-
linkage tool by UNIDO for promoting investments, sub-contracting, out-sourcing

8/22/2019 MICRO, SMALL AND MEDIUM ENTERPRISES SURVEY IN NIGERIA BY SMEDAN
http://slidepdf.com/reader/full/micro-small-and-medium-enterprises-survey-in-nigeria-by-smedan 56/182
May 2012
45
and match making for products and enterprises in the MSME sector. It links the
MSME sub-sector in a host country to a credible global database of manufacturing
concerns that is beneficial to both manufacturers and buyers of goods both within
and outside the country. UNIDO is to provide technical assistance while the
Agency provides office space, furniture and human resources. In line with this, the
Business Support Centre (BSC) Matori, Lagos is hosting the SPX Project. UNIDO
commenced the Nigeria investor Survey which will feed into the overall Africa
Investor Survey and provide the parameters for the operations of the SPX
programme. The programme commenced with the capacity building of SPX staff.
The Agency has concluded the profiling of companies in Lagos and the pilot run
will start early in the New Year.
3.17 Collaboration with Ondo State Government on Akure IDC:
The Agency is collaborating with the Ondo State Government on the Industrial
Development Centre (IDC), Akure. A Memorandum of Understanding (MOU) was
signed between the Agency and Ondo State Government for this purpose. During
the period under review, the State Government reactivated the existing machines
and even went ahead to buy new machines/equipment. The various workshops
were renovated for the intake of a new set of trainees into the various trades. Thevocational skills training were complemented by the delivery of entrepreneurship
training. The Agency intends to use this partnership to showcase the efficacy of
public-public-partnership (PPP) in the resuscitation and management of public
infrastructure for the development of the MSMEs sub-sector and its resultant job
creation capacity in Nigeria.
3.18 Peter Akinola Foundation Collaboration:
The Agency is into collaboration with Peter Akinola Foundation on the upgrading
and use of the Industrial Development Center (IDC), Abeokuta. We arrived at a
major conclusion for the two parties to enter into a Memorandum of
Understanding (MOU). The MOU has been signed and renovation work is on-going
at the instance of Peter Akinola Foundation. Training is expected to start in the 1st
quarter of 2012.

8/22/2019 MICRO, SMALL AND MEDIUM ENTERPRISES SURVEY IN NIGERIA BY SMEDAN
http://slidepdf.com/reader/full/micro-small-and-medium-enterprises-survey-in-nigeria-by-smedan 57/182
May 2012
46
3.19 Industrial Project Profile on Sachet Water Production
The Agency has been working on developing an Industrial Project Profile on
sachet water production. During the period under review, the Agency obtained
field data and completed the draft Industrial Project Profile, ready for presentationfor dissemination to prospective investors.
The existence of SMEDAN is to prepare and equip the Nigerian Entrepreneurs of
today-and tomorrow- to meet the challenges and complex demands associated
with the global dynamics and business environment. The significant way of
achieving this is through the stimulation and facilitation of the development of
Micro, Small and Medium Enterprises in Nigeria.
3.20 Some Country Experiences in MSME Development
In this section, the study reviews MSMEs in some economies; with emphasis on
some emerging market economies that are examples of complete success story
in industrial revolution. Not only are these countries a benchmark for Nigeria‟s
economic development drive, but have strong trade relations with Nigeria - a
situation that has implication for the vision 20:2020 policy agenda.
3.20.1 China
In China, MSMEs account for 60% of industrial output, 55% of its GDP and 75% of
employment. The most remarkable aspect of China's small and medium
enterprises is their rapid growth despite their inability to tap the official financial
system. Two factors predispose even faster development in the near term. One is
their suitability for the post-WTO accession economy. MSMEs in China will
continue to thrive as more responsive partners of foreign companies than large
state firms. They will also have the opportunity to move into market segments
once dominated by state firms. The other factor is that the policy environment for
MSMEs appears to be improving steadily. The MSME Promotion Law will help,
especially if it leads to better access to bank lending, as would improvement, in
and expansion of the credit guarantee system. An important indicator to will be
whether the 16th Party Congress builds on the progress made at the previous two
Congresses in fostering an ideological framework conducive to MSMEs.

8/22/2019 MICRO, SMALL AND MEDIUM ENTERPRISES SURVEY IN NIGERIA BY SMEDAN
http://slidepdf.com/reader/full/micro-small-and-medium-enterprises-survey-in-nigeria-by-smedan 58/182
May 2012
47
An MSME promotion law has been instituted codifying the official definition of
SMEs and clarifying what support government will be making available to them
and in the 1990s the Government created a network of credit guarantee agencies
for MSMEs which ensures loan repayment to banks and assisting them in relaxing
their financial constraints.
3.20.2 India
India has one of the most successful and well developed MSMEs in the world, and
headquarters of World Association for Small and Medium Enterprises (WASME).
There are three important phases that characterised the development of the
Micro, Small and Medium enterprises in India. The first phase was the periods
1948 to 19991; second phase the periods 1991 to 2006; and the third phase
the periods from 2006 till date.
The periods 1948 to 1991 provided the supportive measures that nurtured the
sustenance and future growth of MSMEs, in the form of reservation of items for
their exclusive manufacture, access to bank credit on priority through the Priority
Sector Lending Programme of commercial banks, excise exemption, reservation
under the Government Purchase Programme and 15% price preference in
purchases, infrastructure development and establishment of institutes for
entrepreneurial and skill development. MSME – Development Institutes [earlier
known as Small Industries Service Institute (SISI)] were set up all over India to
train youth in skills/entrepreneurship. Tool Rooms were established with German
and Danish assistance for providing technical services essential to MSEs as also
for skill training. At the State level, District Industries Centres were set up all over
the country.
In all the policy resolution within these periods, recognition was given to the
MSMEs, termed as an effective tool to expand employment opportunities, ensure
equitable distribution of national income and facilitate effective mobilization of
private sector resources of capital and skill. Thus, to ensure the growth and
sustenance of the scheme the Micro, Small and Medium Enterprises
Development Organisation [earlier known as Small Industries DevelopmentOrganization (SIDO)] was set up in 1954 as an apex body for sustained and
8/22/2019 MICRO, SMALL AND MEDIUM ENTERPRISES SURVEY IN NIGERIA BY SMEDAN
http://slidepdf.com/reader/full/micro-small-and-medium-enterprises-survey-in-nigeria-by-smedan 59/182
May 2012
48
organised growth of micro, small and medium enterprises. Many of the older
restrictions on business ownership were removed and fewer clearances are now
required for foreign partnership and direct investment.
In the second phase, government introduced a new Policy for Small, Tiny and
Village Enterprises in August, 1991. The policy laid the framework that replaced
protection of the sector with competitiveness so as to infuse more vitality and
growth to MSEs in the face of foreign competition and open market. Supportive
measures concentrated on improving infrastructure, technology and quality.
Testing Centres were set up for quality certification and new Tool Rooms as well
as Sub-contracting Exchanges were established. The Small Industries
Development Bank of India (SIDBI) and a Technology Development and
Modernisation Fund were also created to accelerate finance and technical
services to the sector. A Delayed Payment Act was enacted to facilitate prompt
payment of dues to MSEs and an Industrial Infrastructure Development (IID)
scheme was launched to set mini industrial estates for small industries. 1999
onwards: The Ministry of MSME [formerly known as Ministry of Small Scale
Industries and Agro & Rural Industries (SSI & ARI)] was established in 1999 to
provide the needed attention for the development and promotion of the sector.
To address the challenges of finance (particularly access to credit), infrastructure,
technology and marketing, a new policy package was introduced in August 2000.
Two credit-linked programmes were introduced to address these challenges,
Capital Subsidy Scheme (CCSS) launched to upgrade the existing technology in
the sector and a Credit Guarantee Scheme (CGS) to provide collateral-free loans,
particularly the first generation entrepreneurs. The exemption limit for relief from
payment of Central Excise duty was raised to $0.25 million and a Market
Development Assistance Scheme was introduced. In consultation with
stakeholders, the list of products reserved for production in the MSE sector was
gradually reduced each year.
The year 2006 was remarkable and marked the solidification of the existing
policies on MSMEs. The Micro, Small and Medium Enterprises Act was passed in
2006 to facilitate and fast track development and ensure competitiveness of
these enterprises; and in March, 2007, a third Package which sought the

8/22/2019 MICRO, SMALL AND MEDIUM ENTERPRISES SURVEY IN NIGERIA BY SMEDAN
http://slidepdf.com/reader/full/micro-small-and-medium-enterprises-survey-in-nigeria-by-smedan 60/182
May 2012
49
promotion of Micro and Small Enterprises in view of the fast changing economic
environment was announced.
The Act is the first legal framework for recognition of the concept of “enterprise”
comprising both manufacturing and service entities. It defines medium
enterprises for the first time and seeks to integrate the three tiers of these
enterprises, namely, micro, small and medium.
It among other things provided for:
a) establishment of specific Funds for the promotion, development and
enhancing competitiveness of these enterprises;
b) progressive credit policies and practices, preference in Government
procurement to products and services of the micro and small enterprises;
and
c) more effective mechanisms for mitigating the problems of delayed
payments to micro and small enterprises and assurance of a scheme for
easing the closure of business by these enterprises.
There are also other implicit provisions in the act which are either reduced or
done away with as a result. They include:
d) With the 2006 Act, the Foreign Direct Investment (FDI) Policy which
provides for restrictive 24% ceiling for equity holding by industrial
undertakings, whether domestic or foreign, in the MSEs has been done
away with and MSEs are defined solely on the basis of investment in plant
and machinery (manufacturing enterprises) and equipment (service
enterprises).
e)
To encourage further investments for technological up-gradation and
higher productivity in the sector, about 654 items have been taken off the
list of items reserved for exclusive manufacture by the manufacturing
micro and small enterprises– reducing it to 21 at present. This has paved
way and furthered the scale of operations of larger enterprises in the
manufacture of these products in keeping with the global best practices
and standards.
f) Priority is now given to existing credit/finance policy for the MSMEs. Part of
the existing credit policy include:
8/22/2019 MICRO, SMALL AND MEDIUM ENTERPRISES SURVEY IN NIGERIA BY SMEDAN
http://slidepdf.com/reader/full/micro-small-and-medium-enterprises-survey-in-nigeria-by-smedan 61/182
May 2012
50
i. Priority Sector Lending (PSL):- under PSL scheme 40% of the net public
and private bank net credit is earmarked for the priority sector, while
32% of the foreign banks net credit is set aside for the priority sector,
of which 10% is for the MSE sector. In addition any shortfall in such
lending by the foreign banks has to be deposited in the Small
Enterprise Development Fund (SEDF) to be set up by the Small
Industries Development Bank of India (SIDBI).
ii. Institutional Arrangement:- The institutional arrangement is such that
the Small Industries Development Bank of India (SIDBI) is the principal
financial institution responsible for promotion, financing, development
of the MSE sector, and coordinates the functions of institutions
engaged in similar activities. Its major operation involves, refinance
assistance, direct lending, and development and support services.
Commercial banks also play important complementary roles as
channels of credit dispensation and financing the working capital
requirements, besides providing term loans (in the form of composite
loans). At the sub-national level, State Financial Corporations (SFCs)
and twin-functional State Industrial Development Corporations (SIDCs)
are the main sources of long-term finance for the MSE sector.
Soon after the 2006 MSMED Act, government introduced various policies to
further the development of the sector. The following are some of the policies:
National Manufacturing Competitiveness Programme initiated by the
National Manufacturing Competitiveness Council in 2007-2008. The
objective of the scheme is to develop global competitiveness among Indian
MSMEs.
Export promotion from the MSE sector to help MSEs in exporting their
products. It involves the use of facilities or incentives such as, display of
products of MSE exporters in international exhibitions; Government
reimbursement of expenditure incurred by the MSEs;
acquainting/familiarising MSE exporters with latest packaging standards,
and techniques; training programme on packaging for exporters are
organised in various parts of the country in association with the Indian
Institute of Packaging; and providing the MSE with assistance for
8/22/2019 MICRO, SMALL AND MEDIUM ENTERPRISES SURVEY IN NIGERIA BY SMEDAN
http://slidepdf.com/reader/full/micro-small-and-medium-enterprises-survey-in-nigeria-by-smedan 62/182
May 2012
51
participation in overseas fairs/exhibitions under Marketing Development
Assistance (MDA) Scheme, overseas study tours, or tours of individuals as
member of a trade delegation going abroad.
There was also full excise exemption up to turnover of $375 thousand per
annum provided to enterprises having annual turnover of up to $1 million
under the General Excise Exemption Scheme. However, the limits of excise
exemptions have encouraged tendency among MSEs to go in for horizontal
expansion (i.e. fragmentation) rather than vertical expansion and upward
graduation into medium and large enterprises. For incentivising such
graduation of small to medium/large enterprises so as to enable them to
achieve economies of scale, extension of excise exemptions to the
graduating medium enterprises on a tapering scale is under consideration
of the Government.
With these supports and incentives in place, India has been able to unleash the
potentials of its MSMEs. In 1994 MSMEs contributed about 94% to the total
number of industrial establishment and about 31% of industrial employment. In
terms of output it accounted for about 40% of industrial output, equivalent to 35%
of industrial value added. Currently, it is estimated that the sector accounts for
about 39% of the manufacturing output and around 33% of the total export of the
country. Furthermore, in recent years the MSE sector has consistently registered
higher growth rate compared to the overall industrial sector. The major advantage
of the sector is its employment potential at low capital cost. Available official
estimated statistics shows there about 3.6 million MSMEs granted permanent
registration in India an increase of about 78.5% from about 2.0 million in 1995. It
employs an estimated 31 million persons spread over 12.8 million enterprises
and the labour intensity is estimated to be almost 4 times higher than the large
enterprises.
3.20.3 United Kingdom
The UK has a well developed MSME sector -99.9% of businesses are SMEs
providing 54.1% of employment and contributing over 50% of the country‟s
annual GDP. There are 3.7 million MSMEs in the UK, that is, one enterprise for
every ten people of working age. From 1983 to 1988, the British Government

8/22/2019 MICRO, SMALL AND MEDIUM ENTERPRISES SURVEY IN NIGERIA BY SMEDAN
http://slidepdf.com/reader/full/micro-small-and-medium-enterprises-survey-in-nigeria-by-smedan 63/182
May 2012
52
administered a credit guarantee scheme of 750 million pounds in business
expansion and tax relief to entrepreneurs in quoted companies; and effectively
linked MSMES with appropriate technologies and educational institutions. 19,000
MSMES benefited from the program.
3.20.4 South Korea
The Korean government initially placed the burden of industrial development on
the giant industries, but over time the government realized the importance of a
dynamic, flexible and efficient MSME sector that can provide specialized
subcontracting services to the large firms. Laws were passed to promote MSMEs,
leading to a perceptible rise in their share of economic activity. The system of
policy support was crucial to the reversal in their performance. The policy options
covered the setting up of specialized banks to finance MSMEs and the promotion
of subcontracting by large-scale industries.
3.20.5 Taiwan
There are about 700 thousand MSMEs in Taiwan, accounting for 70% of
employment, 55% of GDP and 62% of total manufactured exports. The industrial
structure is dominated by MSMEs and programs to promote subcontracting have
been of special significance of the country's industrial development.
In 1982, the government set up the Medium and Small Business Administration
to coordinate the efforts of several support agencies that provided financial,
management, accounting, technological and marketing assistance to the MSMEs.
The Taiwan Medium Business Bank, the Bank of Taiwan, the Small and Medium
Business Credit Guarantee Fund, and the Small Business Integrated Assistance
Centre also provide targeted financial assistance to MSMEs.
In Taiwan, a large number of small and medium sized enterprises specialize in a
variety of skilled intensive and flexible operations aimed at world markets but
most are too small to conduct their own research and development. The
government helped them with a range of technological support measures:
One of the most important has been to transfer to MSMEs, production-
ready technology that the government has imported and adapted.
8/22/2019 MICRO, SMALL AND MEDIUM ENTERPRISES SURVEY IN NIGERIA BY SMEDAN
http://slidepdf.com/reader/full/micro-small-and-medium-enterprises-survey-in-nigeria-by-smedan 64/182
May 2012
53
There is development in the use of MSMEs to implement local content
measures, but more effective have been measures to raise the efficiency
of local firms through programs of technical assistance and quality
enhancement.
A number of institutions were set up to provide credit, technology and marketing
assistance. The China Productivity Centre is the best known for its efforts to
promote automation in industry to cope with rising wages and increasing needs
for precision and quality.

8/22/2019 MICRO, SMALL AND MEDIUM ENTERPRISES SURVEY IN NIGERIA BY SMEDAN
http://slidepdf.com/reader/full/micro-small-and-medium-enterprises-survey-in-nigeria-by-smedan 65/182
May 2012
54
4 METHODOLOGY
4.1 Survey Design for the Study
In order to build a consistent and reliable database for evaluating the impact ofpolicies and government programmes in developing appropriate responses, it is
important to give a clear definition of Micro, Small and Medium enterprise.
Individual countries‟ circumstances determine how MSME is being defined in that
country for instance some countries define it (MSME) by the total assets, others
by employment, turnover, or paid-up capital.
However, in Nigeria, the current classification is based on the number of
employees and assets (excluding land and buildings).
Sector Micro Small Medium Large
Employment Band ‹ 10 10-49 50-199 200 and
above
In practice, the number of employees is the most common standard used in
National SME policies worldwide. The criteria/ classification to be adopted for this
survey is as stated above.
4.2 Survey Objectives
The main objective of this survey is to establish a credible database for the Micro,
Small and Medium Enterprises (MSME) sub-sector in Nigeria so as to provide
infrastructure that will stimulate and trigger the growth and development of the
sector in accordance with SMEDAN‟s mandate.
Other Objectives are:
1 To determine the contribution of Micro, Small and Medium enterprises
(MSMEs) sub-sector e.g. manufacturing, building and construction etc. to
GDP in Nigeria
2 To determine the number of Micro, Small and Medium Enterprises (MSME)
in Nigeria on the basis of geopolitical zones, states and LGAs
3 To identify the challenges and constraints facing the operation of Micro,
Small and Medium enterprises in Nigeria

8/22/2019 MICRO, SMALL AND MEDIUM ENTERPRISES SURVEY IN NIGERIA BY SMEDAN
http://slidepdf.com/reader/full/micro-small-and-medium-enterprises-survey-in-nigeria-by-smedan 66/182
May 2012
55
4 To identify the number of people employed in the MSMEs sub - sector
5 To identify the number of MSMEs owned by women and men towards
gender equity
6 To identify the ownership structure of MSMEs within age bracket
7 To determine the number of MSMEs by categories and sizes
8 To identify the number of MSMEs that are not registered
9 To determine the growth rate of MSMEs
10 And lastly, to identify the number of clusters in Nigeria
4.3 Coverage
The survey was conducted in all the 36 states of the Federation and the Federal
Capital Territory (FCT), Abuja. For household component, both urban and rural
enumeration areas (EAs) with Micro enterprises were canvassed through the
National Integrated Survey of Household (NISH) schedule. Also, rural and urban
areas where small and medium enterprises are located were covered through the
National Integrated Survey of Establishment (NISE) module.
4.4 SCOPE
The subject areas covered in the two (2) modules among others include:
a. Holding identification
b. Business Status
c. Free Entry and Competition
d. Input, Output, Expenditure and Receipts
e. Technical Support Services/Enterprises growth
f. Level of employment
g. Educational Qualification of workers
h. Total revenue/Turnover
i. Capacity Utilization
j. Inventory
k. Production
l. Source of working capital etc.
4.5 Sample Design
The frame of Enumeration Areas (EAs/Clusters) of 2006 Housing and PopulationCensus conducted by the National Population Commission (NpopC) were used.

8/22/2019 MICRO, SMALL AND MEDIUM ENTERPRISES SURVEY IN NIGERIA BY SMEDAN
http://slidepdf.com/reader/full/micro-small-and-medium-enterprises-survey-in-nigeria-by-smedan 67/182
May 2012
56
However, the National integrated Survey of Households (NISH) which is the
vehicle for conducting all household based surveys in NBS, the 2007/2012
edition were adopted for Household component where the Micro enterprises
households were selected. Likewise, the frame of Small and Medium enterprises
with the Agric and Business Enterprises Statistics Division of NBS were used for
the establishment component. Thirty (30) EAs comprising of 3 replicates in which
each replicate contain 10 EAs were selected per state and FCT, Abuja. These
replicates are sub-sets of twenty (20) which each state of the federation and FCT,
Abuja had. It should be noted that the 3 replicates were different from state to
state depending on the concentration of Micro Enterprises in the states.
Furthermore, ten (10) Micro enterprises were systematically selected per EA
making a total of 300 Micro enterprises to be visited in each state and FCT, Abuja.
This sample is large enough to give a robust estimate at the state level. However,
Zonal and National estimates were aggregated.
For the establishment component, 4000 Small and Medium enterprises were
visited. The 12 sectors and sub-sectors covered include:
Manufacturing
Wholesale and Retail trade
Hotel and Restaurants
Mining and Quarrying
Building and Construction Real Estate, Renting and Business activity
Financial Intermediation
Health and Social works
Organized road transport, storage and communication
Other Community, Social and Personal service activities
Educational Services and
Agriculture (Corporate Farms)
The criteria used to select the enterprises with non-zero probabilities include
employment size, contribution to the Gross Domestic Product (GDP), a priori
knowledge of the performance of the sectors in the economy and response status
of the enterprise.

8/22/2019 MICRO, SMALL AND MEDIUM ENTERPRISES SURVEY IN NIGERIA BY SMEDAN
http://slidepdf.com/reader/full/micro-small-and-medium-enterprises-survey-in-nigeria-by-smedan 68/182
May 2012
57
4.6 Pretest
A pretest was carried out to test the adequacy of the survey instruments i.e.
Questionnaires and instruction manual. It was also, used to test the field logistics
and it helped to prepare for the main survey. The coverage for the pretest was two(2) states i.e. Kano (North) and Lagos (South).
4.7 Survey Instrument
A generic questionnaire was adopted for both micro and the formal enterprises to
allow easy administration of the questionnaire in the field. A very comprehensive
manual of instruction that explained in details all that were required to fill the
questionnaire properly were adopted and It also served as reference materials for
the field staff.
4.8 Training for Fieldwork
There were two (2) levels of training, the 1stlevel, the training of trainers (TOT)
and the 2nd, the zonal training.
The 1st level training was the training of trainers (TOT) and it was held at NBS
Headquarters, Abuja. The training comprised of trainers (24), monitoring officers
(37) and coordinators (12). In all, 55 officers were trained. The training lasted for
one (1) day.
The 2nd level training was held at the six (6) NBS zonal offices. The trainees
include: Interviewers (348), Supervisors (114), State Officers (37) and Zonal
Controllers (6) The training lasted for one (1) day as well.
The distribution of states to zones of the 2nd level training was thus:
NORTH CENTRAL: Niger, FCT, Benue, Plateau, Kogi, Nasarawa
NORTH EAST: Gombe, Bauchi, Borno, Adamawa, Yobe and Taraba
NORTH WEST: Kaduna, Kano, Kebbi, Sokoto, Jigawa, Katsina and Zamfara
SOUTH EAST: Enugu, Abia, Anambra, Ebonyi, Imo and Delta
SOUTH SOUTH: Cross Rivers, Rivers, Bayelsa, Akwa-Ibom
SOUTH WEST: Oyo, Ondo, Osun, Ekiti, Lagos, Ogun, Kwara and Edo
The underlined and coloured states were the zonal training centres
8/22/2019 MICRO, SMALL AND MEDIUM ENTERPRISES SURVEY IN NIGERIA BY SMEDAN
http://slidepdf.com/reader/full/micro-small-and-medium-enterprises-survey-in-nigeria-by-smedan 69/182
May 2012
58
4.9 Fieldwork Arrangement
4.9.1 For Household (Micro) Enterprises) component
A team comprises of two (2) interviewers and one (1) supervisor in each of the
states of the federation and Abuja (FCT). Given that each interviewer will complete
between 6-8 questionnaires per day, the fieldwork was completed within thirteen
(13) days including travel time within enumeration areas.
4.9.2 Formal (Small and Medium Enterprises) Component
Since 4,000 formal enterprises were visited nationwide, a total of 200
interviewers were deployed in addition to 40 supervisors. The work load in each
state varies depending on the number of formal enterprises allocated to the state.
Each interviewer lodged and retrieved between 4-6 questionnaires, the fieldwork
was completed within thirteen (13) days including callbacks.
4.9.3 Monitoring of Fieldwork
There were two (2) layers of monitoring exercises. The first layer involved the NBS
State Officers and Zonal Controllers. This took place immediately after the
commencement of the fieldwork and it ran throughout the data collection period.
The second layer monitoring exercise involved the NBS/SMEDAN headquartersstaff; it was organized in such a way that it coincided with the end of the
fieldwork. It lasted for four (4) days and thirty-seven (37) officers were involved.
4.9.4 Coordination
High level senior staff of NBS/SMEDAN coordinated the activities of the survey.
Activities coordinated include Zonal Training and Fieldwork. Twelve (12)
Coordinators were involved while coordination lasted two (2) days.
4.9.5 Retrieval
All completed questionnaires were properly edited and returned by the monitoring
officers to NBS Headquarters in Abuja for data processing. Records were batched
enumeration area by enumeration area and sector by sector.
4.10 Data Processing
Data processing and analysis were carried out at NBS Headquarters, Abuja
8/22/2019 MICRO, SMALL AND MEDIUM ENTERPRISES SURVEY IN NIGERIA BY SMEDAN
http://slidepdf.com/reader/full/micro-small-and-medium-enterprises-survey-in-nigeria-by-smedan 70/182
May 2012
59
These involved system development, Data Editing, Data Entry, Data Cleaning and
Table Tabulation/ Generation.
4.11 Report writing
A committee made up of NBS/SMEDAN staff wrote the report. The report is
written in a very simple language devoid of technical terminology for easy
understanding and to make it useful to the Users, Policy Makers, Planners,
Researchers, development partners, etc.
4.12 Documentation/Dissemination/Archiving
The data management toolkit was used to Document and Disseminate data. A
day dissemination workshop was held to discuss the results/findings with theprincipal stakeholders within the MSME sectors. The results will be published and
written on CD and hosted on NBS and SMEDAN websites for further
dissemination thereafter.
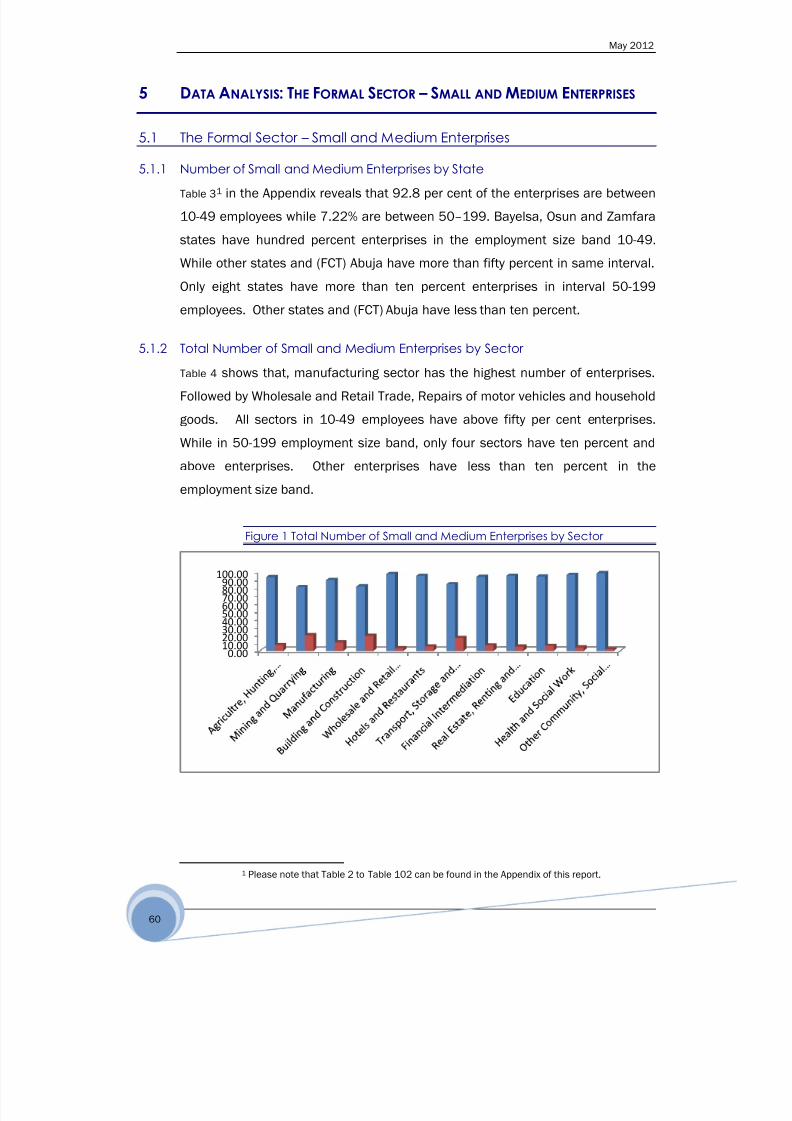
8/22/2019 MICRO, SMALL AND MEDIUM ENTERPRISES SURVEY IN NIGERIA BY SMEDAN
http://slidepdf.com/reader/full/micro-small-and-medium-enterprises-survey-in-nigeria-by-smedan 71/182
May 2012
60
5 DATA ANALYSIS: THE FORMAL SECTOR – SMALL AND MEDIUM ENTERPRISES
5.1 The Formal Sector – Small and Medium Enterprises
5.1.1 Number of Small and Medium Enterprises by State
Table 31 in the Appendix reveals that 92.8 per cent of the enterprises are between
10-49 employees while 7.22% are between 50–199. Bayelsa, Osun and Zamfara
states have hundred percent enterprises in the employment size band 10-49.
While other states and (FCT) Abuja have more than fifty percent in same interval.
Only eight states have more than ten percent enterprises in interval 50-199
employees. Other states and (FCT) Abuja have less than ten percent.
5.1.2 Total Number of Small and Medium Enterprises by Sector
Table 4 shows that, manufacturing sector has the highest number of enterprises.
Followed by Wholesale and Retail Trade, Repairs of motor vehicles and household
goods. All sectors in 10-49 employees have above fifty per cent enterprises.
While in 50-199 employment size band, only four sectors have ten percent and
above enterprises. Other enterprises have less than ten percent in the
employment size band.
Figure 1 Total Number of Small and Medium Enterprises by Sector
1 Please note that Table 2 to Table 102 can be found in the Appendix of this report.
0.0010.0020.0030.0040.0050.0060.0070.0080.0090.00
100.00
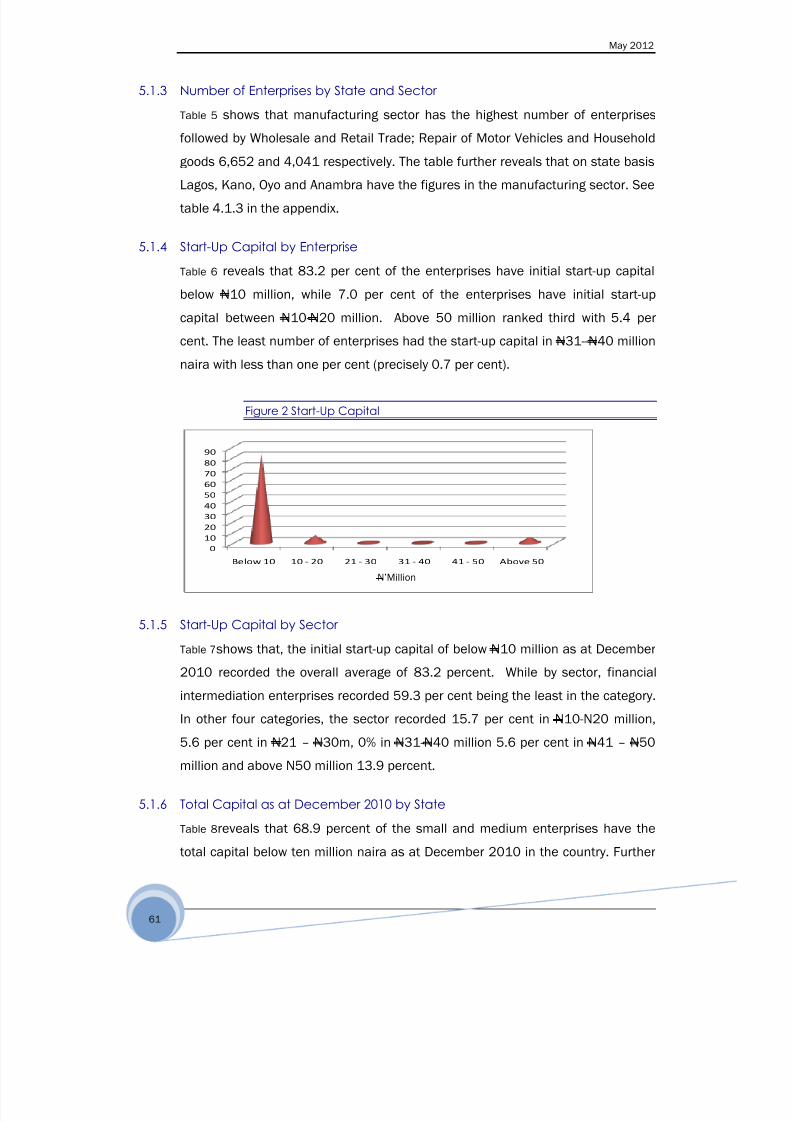
8/22/2019 MICRO, SMALL AND MEDIUM ENTERPRISES SURVEY IN NIGERIA BY SMEDAN
http://slidepdf.com/reader/full/micro-small-and-medium-enterprises-survey-in-nigeria-by-smedan 72/182
May 2012
61
5.1.3 Number of Enterprises by State and Sector
Table 5 shows that manufacturing sector has the highest number of enterprises
followed by Wholesale and Retail Trade; Repair of Motor Vehicles and Household
goods 6,652 and 4,041 respectively. The table further reveals that on state basis
Lagos, Kano, Oyo and Anambra have the figures in the manufacturing sector. See
table 4.1.3 in the appendix.
5.1.4 Start-Up Capital by Enterprise
Table 6 reveals that 83.2 per cent of the enterprises have initial start-up capital
below N10 million, while 7.0 per cent of the enterprises have initial start-up
capital between N10-N20 million. Above 50 million ranked third with 5.4 per
cent. The least number of enterprises had the start-up capital in N31--N40 million
naira with less than one per cent (precisely 0.7 per cent).
Figure 2 Start-Up Capital
0
10
20
30
40
50
60
70
80
90
Below 10 10 - 20 21 - 30 31 - 40 41 - 50 Above 50
5.1.5 Start-Up Capital by Sector
Table 7shows that, the initial start-up capital of below N10 million as at December
2010 recorded the overall average of 83.2 percent. While by sector, financial
intermediation enterprises recorded 59.3 per cent being the least in the category.
In other four categories, the sector recorded 15.7 per cent in N10-N20 million,
5.6 per cent in N21 – N30m, 0% in N31-N40 million 5.6 per cent in N41 – N50
million and above N50 million 13.9 percent.
5.1.6 Total Capital as at December 2010 by State
Table 8reveals that 68.9 percent of the small and medium enterprises have the
total capital below ten million naira as at December 2010 in the country. Further
N‟Million

8/22/2019 MICRO, SMALL AND MEDIUM ENTERPRISES SURVEY IN NIGERIA BY SMEDAN
http://slidepdf.com/reader/full/micro-small-and-medium-enterprises-survey-in-nigeria-by-smedan 73/182
May 2012
62
study of the table, shows that enterprises in all states except Kwara state, Taraba
state and Federal Capital Territory (FCT) Abuja recorded total capital below fifty
percent. While 12.3 percent of the enterprises have the total capital in the range
of ten to twenty million naira. See Table 9 in the appendix for details.
Table 6 reveals that 68.9 per cent of the enterprises have the total capital falls
below N10m. While 12.3 per cent of the enterprises have theirs fall between N10
– N20 million. 9.5 per cent of the enterprises fall in above N50 million. While the
least constitutes 1.5 per cent in N41 – N50 million.
Figure 3 Total Capital by Enterprises as at December 2010
0
10
20
30
40
50
60
70
80
Below 10 10 - 20 21 - 30 31. 40 41 - 50 Above 50
5.1.7 Total Capital by Sector as at December 2010
Table 10 shows that, manufacturing sector has the highest total capital as at
December 2010, with the concentration in below N10 million naira size bands of
about 73.4 percent. Followed by size band (N10m – N20m) with 10.3 per cent.
5.1.8 Ownership Status
The form of business ownership structure is predominantly in the soleproprietorship with 57.5 percent. The second dominance of ownership status in
the country is private Limited Liability, accounting for 27.2 percent. See Table 11.
N‟Million

8/22/2019 MICRO, SMALL AND MEDIUM ENTERPRISES SURVEY IN NIGERIA BY SMEDAN
http://slidepdf.com/reader/full/micro-small-and-medium-enterprises-survey-in-nigeria-by-smedan 74/182
May 2012
63
5.1.9 Ownership Status by Sector
In the ownership status by sector, manufacturing sector is the dominance. Within
the sector, the sole proprietorship has 28.4 percent followed by the private
Limited Liability with 26.1 percent.
The second dominant sector is the wholesale and Retail Trade, Repairs of motor
vehicles and Household Goods with 21.9 percent and within the sector, the sole
proprietorship ownership of business leads, Followed by private Limited Liability
ownership status with 13.2 percent. See Table 12
5.1.10 Gender of Owner (Sole Proprietorship)
The survey revealed that female accounts for 13.57 per cent as against 86.43
per cent for male in the ownership structure (Sole proprietorship) of the
0.0
10.020.030.040.050.060.070.0
0
50
100
150
1 2 3 4 5 6 7 8 9 10 11 12
Sole Proprietorship
Partnership
Private, Hunting, Forestry and Fishing
Cooperative
Faith Based Organisation
Others

8/22/2019 MICRO, SMALL AND MEDIUM ENTERPRISES SURVEY IN NIGERIA BY SMEDAN
http://slidepdf.com/reader/full/micro-small-and-medium-enterprises-survey-in-nigeria-by-smedan 75/182
May 2012
64
enterprises. Most of the sectors are dominated by male with percentages higher
than the sectoral average of 86.43 per cent. Three sectors recorded percentages
lower than the sectoral average - Hotels and Restaurants (76.56%); Education
(62.12%) and Other Community, Social and Personal Service Activities (62.77%).
See Table 13.
Figure 4 Gender of Owner (Sole Proprietorship)
5.1.11 Age of Owner (Sole Proprietorship)
In terms of Age distribution of owners, Table 14shows that the age bracket of 36-
50 dominates, accounting for 43.60 per cent as against 13.40 per cent for under
36 years of age. However, 51-60 years of age account for 26.86 per cent, while
above 60 years of age recorded 16.0 percent.
Figure 5 Age of Owner (Sole Proprietorship)
0.0020.0040.0060.0080.00
100.00120.00
A g r i c u l t r e , H u n t i n g , F
o r e s t r y
a n d F i s h i n g
M i n i n g a n d Q u
a r r y i n g
M a n u f a
c t u r i n g
B u i l d i n g a n d C o n s t r u c t i o n
W h o l e s a l e a n d R e t a i l
T r a d e ;
R e p a i r o f M o t o r V e h i c
l e s a n d
H H
H o t e l s a n d R e s t a u r a n t s
T r a n s p o r t , S t o r a g e a n d
C o m m u n i c a
t i o n
F i n a n c i a l I n t e r m e
d i a t i o n
R e a l E s t a t e , R e n t i n g a n d
B u s i n e s s A c t i v i t i e s
E d
u c a t i o n
H e a l t h a n d S o c i a l W o r k
O t h e r C o m m u n i t y , S o c i a l a n d
P e r s o n a l S e r v i c e A c t
i v i t i e s
Male
Female
0.0
10.0
20.0
30.0
40.0
50.0
Below 20 20 - 25 26 - 35 36 - 50 51 - 60 Above 60

8/22/2019 MICRO, SMALL AND MEDIUM ENTERPRISES SURVEY IN NIGERIA BY SMEDAN
http://slidepdf.com/reader/full/micro-small-and-medium-enterprises-survey-in-nigeria-by-smedan 76/182
May 2012
65
5.1.12 Highest Qualification Attained by Owner
In the categorisation of sole proprietorship business by the highest academic
qualification attained, as shown in Table 15, BSc/HND recorded the highest in the
country with 30.9 percent, followed by Senior Secondary School Certificate
owners with 21.3 percent.
Figure 6 Highest Qualification Attained by Owner
5.1.13 Initial Total Assets at Inception
The initial total assets at inception of the enterprises have its concentration inbelow ten million naira with about 78.5 per cent. The second dominance is above
N50 million with 8.2 percent. See Table 16
Figure 7 Initial Total Assets at Inception
0
10
20
30
40
50
60
70
80
90
Below 10 10 - 20 21 - 30 31 - 40 41 - 50 Above 50
5.1.14 Total Asset Value as at December 2010
Table 17shows the total asset value as at December 2010, concentrated in below
N10 million naira with 66.1 percent. The second dominance size band is N10 to
N20 million naira with 12.4 percent.
0.05.0
10.015.020.025.030.035.0
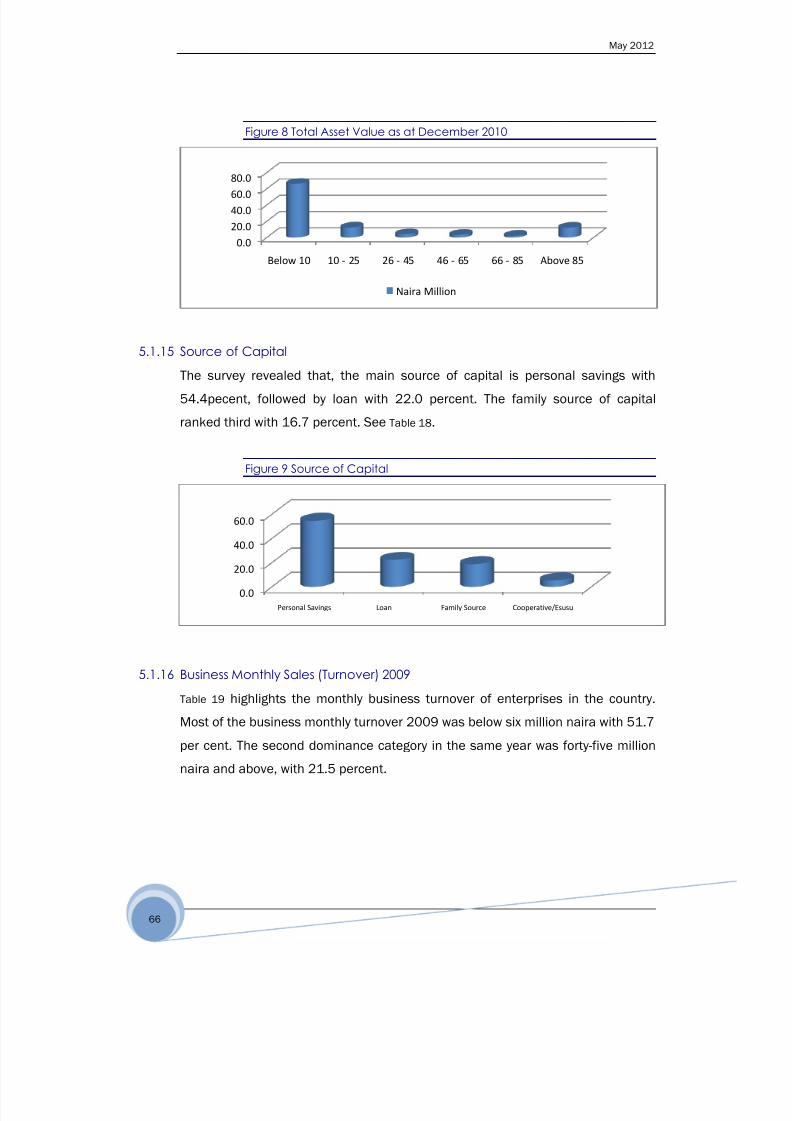
8/22/2019 MICRO, SMALL AND MEDIUM ENTERPRISES SURVEY IN NIGERIA BY SMEDAN
http://slidepdf.com/reader/full/micro-small-and-medium-enterprises-survey-in-nigeria-by-smedan 77/182
May 2012
66
Figure 8 Total Asset Value as at December 2010
5.1.15 Source of Capital
The survey revealed that, the main source of capital is personal savings with
54.4pecent, followed by loan with 22.0 percent. The family source of capital
ranked third with 16.7 percent. See Table 18.
Figure 9 Source of Capital
5.1.16 Business Monthly Sales (Turnover) 2009Table 19 highlights the monthly business turnover of enterprises in the country.
Most of the business monthly turnover 2009 was below six million naira with 51.7
per cent. The second dominance category in the same year was forty-five million
naira and above, with 21.5 percent.
0.0
20.0
40.0
60.0
80.0
Below 10 10 - 25 26 - 45 46 - 65 66 - 85 Above 85
Naira Million
0.0
20.0
40.0
60.0
Personal Savings Loan Family Source Cooperative/Esusu

8/22/2019 MICRO, SMALL AND MEDIUM ENTERPRISES SURVEY IN NIGERIA BY SMEDAN
http://slidepdf.com/reader/full/micro-small-and-medium-enterprises-survey-in-nigeria-by-smedan 78/182
May 2012
67
Figure 10 Business Monthly Sales (Turnover) 2009
5.1.17 Business Monthly Sales 2010
Table 20 highlights the business turnover of the enterprises in the country. The
enterprises maintain the trend of turnover in 2009 and in 2010, with below six
million naira, recording 78.7 per cent concentration. There was remarkable
improvement in the monthly turnover of enterprises in 2010, when compared with
2009 in the same size band.
The second dominance category in 2010 is above forty-five million naira with 7.9
per cent. In comparison with 2009, there is a drop of 13.6 percentage points.
Figure 11 Business Monthly Sales (Turnover) 2010
5.1.18 Business Monthly Cost of Operation
Table 21on cost of operation reveals that, 89.2 percent of enterprises in the
country in (2010) have their operational monthly cost below ten million naira
0.0
20.0
40.0
60.0
Below 6 6 - 15 16 - 25 26 - 35 36 - 45 Above 45
Naira Million
0.0
20.0
40.0
60.0
80.0
Below 6 6 - 15 16 - 25 26 - 35 36 - 45 Above 45
N‟Million

8/22/2019 MICRO, SMALL AND MEDIUM ENTERPRISES SURVEY IN NIGERIA BY SMEDAN
http://slidepdf.com/reader/full/micro-small-and-medium-enterprises-survey-in-nigeria-by-smedan 79/182
May 2012
68
while the second dominance category is six to fifteen million naira, representing
5.2 per cent.
Figure 12 Business Monthly Cost of Operation
5.1.19 Promotion Media Used by the Enterprise
The promotional medium mostly used by enterprises in the country in 2010 was
person-to-person with about 25.0 percent. The second dominance was handbill
distribution by enterprises with 17.4 percent. The least used promotional medium
in the businesses was sales discount with 1.0 per cent. See Table 22.
Figure 13 Promotional Media Used by the Enterprise
5.1.20 Business Insurance by Sector
Table 23 shows that, as at December 2010, only about 42.5 percent of the
enterprises in the country were insured. Within the business sector,
manufacturing sector insured only 36.2 percent of the enterprises while
wholesale and Retail Trade, Repairs of motor vehicles and Household Goods
0.0
20.0
40.0
60.0
80.0
100.0
Below 6 6 - 15 16 - 25 26 - 35 36 - 45 Above 45
0.05.0
10.015.020.025.0
N‟ Million
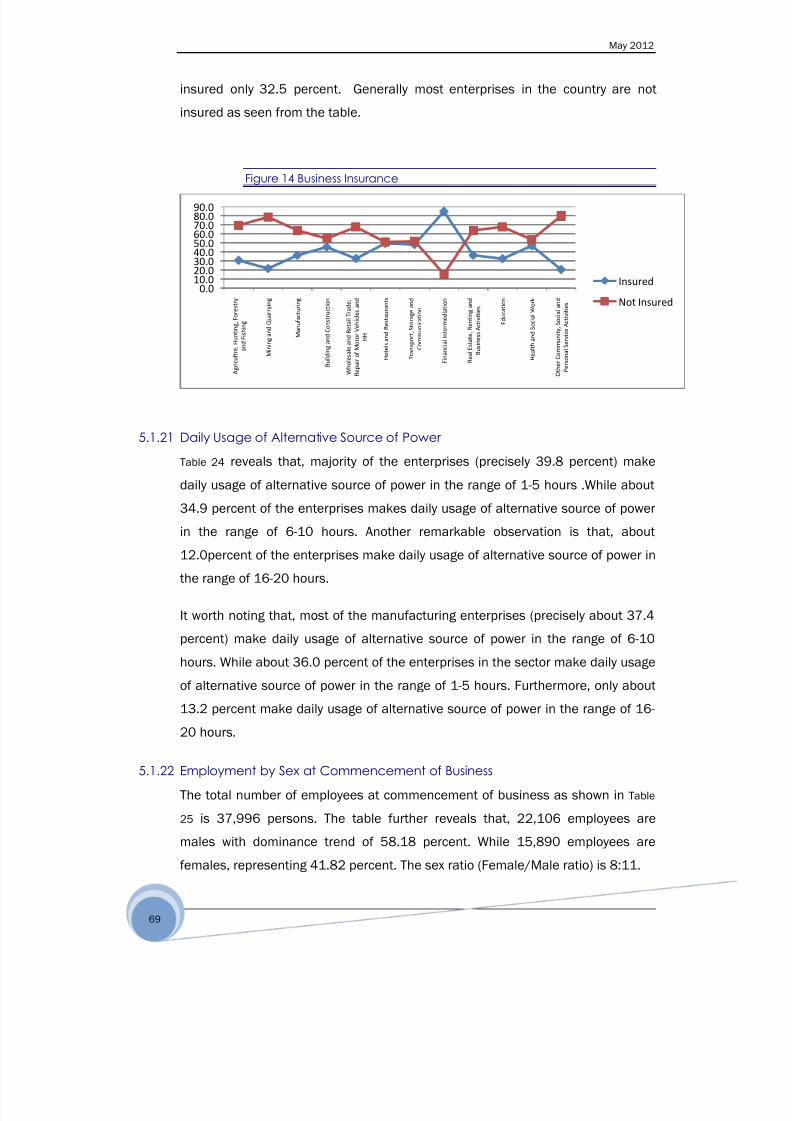
8/22/2019 MICRO, SMALL AND MEDIUM ENTERPRISES SURVEY IN NIGERIA BY SMEDAN
http://slidepdf.com/reader/full/micro-small-and-medium-enterprises-survey-in-nigeria-by-smedan 80/182
May 2012
69
insured only 32.5 percent. Generally most enterprises in the country are not
insured as seen from the table.
Figure 14 Business Insurance
5.1.21 Daily Usage of Alternative Source of Power
Table 24 reveals that, majority of the enterprises (precisely 39.8 percent) make
daily usage of alternative source of power in the range of 1-5 hours .While about
34.9 percent of the enterprises makes daily usage of alternative source of power
in the range of 6-10 hours. Another remarkable observation is that, about
12.0percent of the enterprises make daily usage of alternative source of power in
the range of 16-20 hours.
It worth noting that, most of the manufacturing enterprises (precisely about 37.4
percent) make daily usage of alternative source of power in the range of 6-10
hours. While about 36.0 percent of the enterprises in the sector make daily usage
of alternative source of power in the range of 1-5 hours. Furthermore, only about
13.2 percent make daily usage of alternative source of power in the range of 16-
20 hours.
5.1.22 Employment by Sex at Commencement of Business
The total number of employees at commencement of business as shown in Table
25 is 37,996 persons. The table further reveals that, 22,106 employees are
males with dominance trend of 58.18 percent. While 15,890 employees are
females, representing 41.82 percent. The sex ratio (Female/Male ratio) is 8:11.
0.010.020.030.040.050.060.070.080.090.0
A g r i c u l t r e , H u
n t i n g , F o r e s t r y
a n d F i s h i n g
M i n i n g
a n d Q u a r r y i n g
M a n u f a c t u r i n g
B u i l d i n g a n
d C o n s t r u c t i o n
W h o l e s a l e a n d R e t a i l T r a d e ;
R e p a i r o f M o t o r V e h i c l e s a n d
H
H
H o t e l s a
n d R e s t a u r a n t s
T r a n s p o
r t , S t o r a g e a n d
C o m
m u n i c a t i o n
F i n a n c i a l
I n t e r m e d i a t i o n
R e a l E s t a t e , R e n t i n g a n d
B u s i n e
s s A c t i v i t i e s
E d u c a t i o n
H e a l t h a
n d S o c i a l W o r k
O t h e r C o m m u n i t y , S o c i a l a n d
P e r s o n a l S e r v i c e A c t i v i t i e s
Insured
Not Insured

8/22/2019 MICRO, SMALL AND MEDIUM ENTERPRISES SURVEY IN NIGERIA BY SMEDAN
http://slidepdf.com/reader/full/micro-small-and-medium-enterprises-survey-in-nigeria-by-smedan 81/182
May 2012
70
Figur
e 15
Empl
oyme
nt by
Sex
at
Com
menc
emen
t of
Busin
ess
5.1.23 Employment by Sector at Commencement of Business
As shown in Table 26, manufacturing sector employed the highest number of
5,867 males and 3,327 females at commencement of business. The sex ratio
(female/male) is 1:2. The second dominance is the wholesale and Retail Trade,
Repairs of motor vehicles and Household Goods with 4,019 males and 2,414
females. The sex ratio (female /male) is 1:2.
5.1.24 Employment by Sex as at December 2010
The total number of employees as at December 2010 was 39,478 persons as
shown in Table 27. The table further reveals that, male employees dominated with
22,139 persons, representing 56.08 percent while the female counterpart was
17,339 persons, representing 43.92 percent. The sex ratio is 17:22.
Male
Female
96.697.6
3.4
2.4
'10-49 50-199
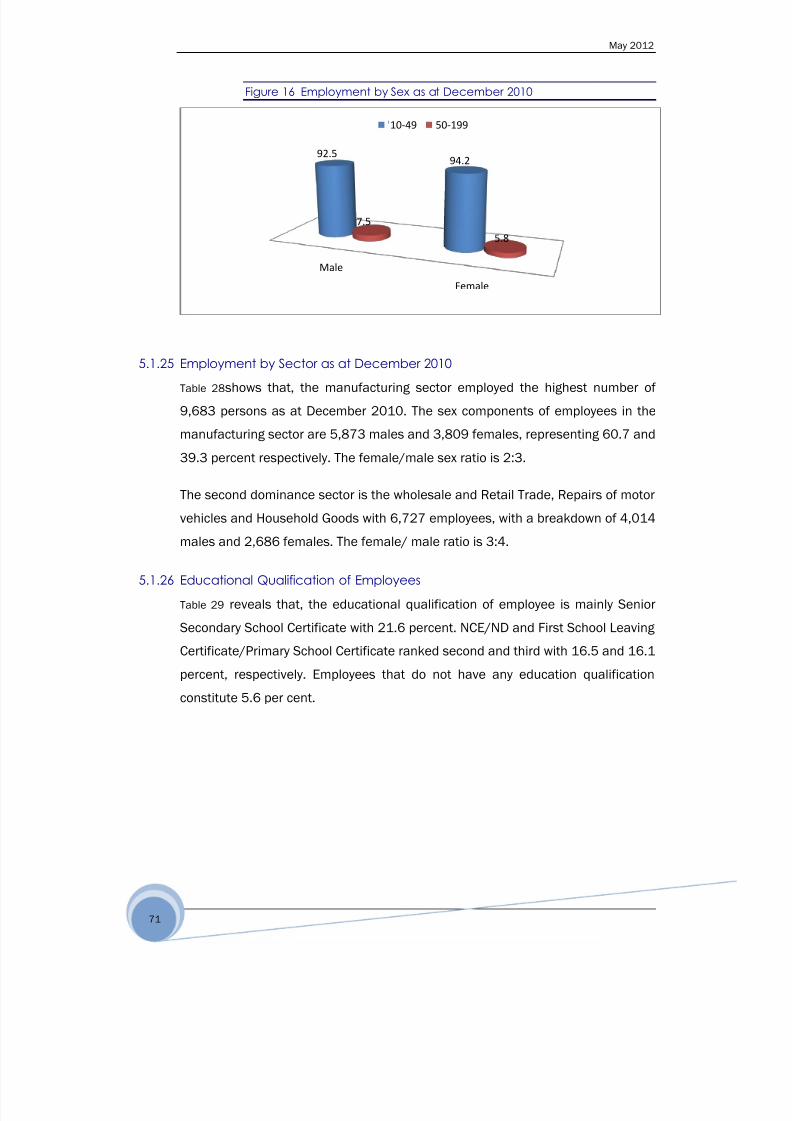
8/22/2019 MICRO, SMALL AND MEDIUM ENTERPRISES SURVEY IN NIGERIA BY SMEDAN
http://slidepdf.com/reader/full/micro-small-and-medium-enterprises-survey-in-nigeria-by-smedan 82/182
May 2012
71
Figure 16 Employment by Sex as at December 2010
5.1.25 Employment by Sector as at December 2010
Table 28shows that, the manufacturing sector employed the highest number of
9,683 persons as at December 2010. The sex components of employees in the
manufacturing sector are 5,873 males and 3,809 females, representing 60.7 and
39.3 percent respectively. The female/male sex ratio is 2:3.
The second dominance sector is the wholesale and Retail Trade, Repairs of motor
vehicles and Household Goods with 6,727 employees, with a breakdown of 4,014
males and 2,686 females. The female/ male ratio is 3:4.
5.1.26 Educational Qualification of Employees
Table 29 reveals that, the educational qualification of employee is mainly Senior
Secondary School Certificate with 21.6 percent. NCE/ND and First School Leaving
Certificate/Primary School Certificate ranked second and third with 16.5 and 16.1
percent, respectively. Employees that do not have any education qualificationconstitute 5.6 per cent.
Male
Female
92.594.2
7.5
5.8
'10-49 50-199
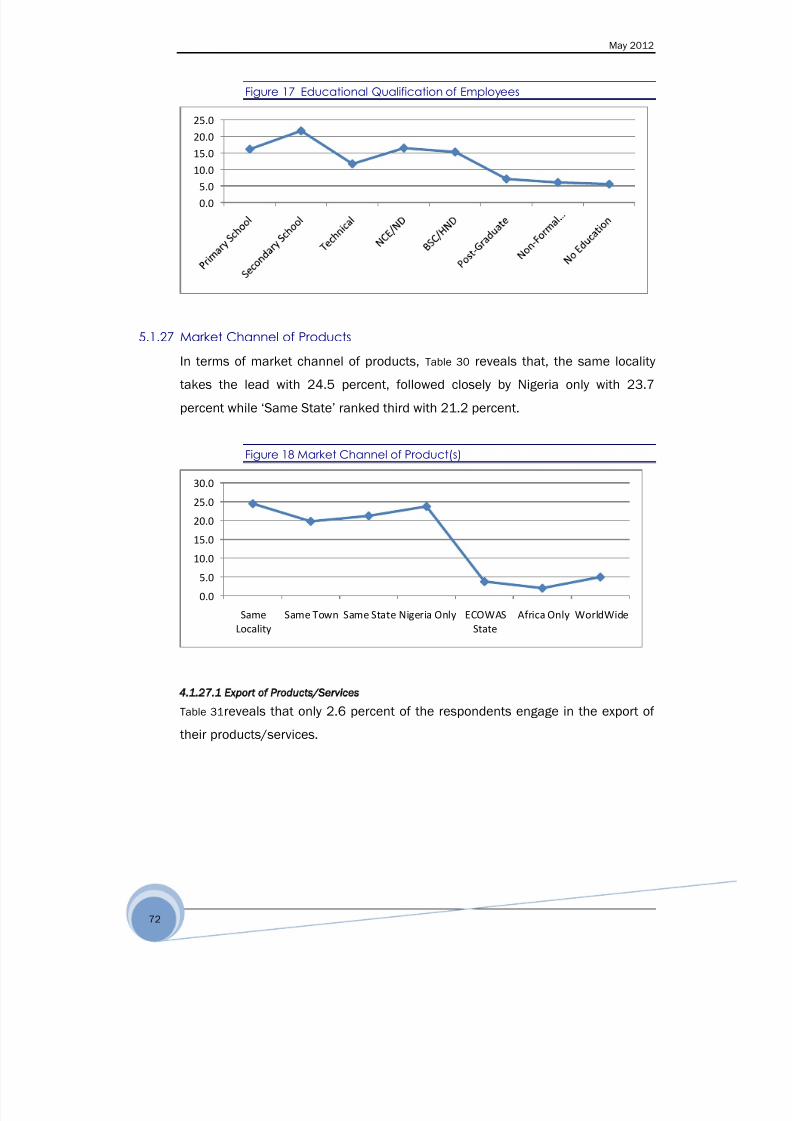
8/22/2019 MICRO, SMALL AND MEDIUM ENTERPRISES SURVEY IN NIGERIA BY SMEDAN
http://slidepdf.com/reader/full/micro-small-and-medium-enterprises-survey-in-nigeria-by-smedan 83/182
May 2012
72
Figure 17 Educational Qualification of Employees
5.1.27 Market Channel of Products
In terms of market channel of products, Table 30 reveals that, the same locality
takes the lead with 24.5 percent, followed closely by Nigeria only with 23.7
percent while „Same State‟ ranked third with 21.2 percent.
Figure 18 Market Channel of Product(s)
4 1 27 1 Export of Products/Services
Table 31reveals that only 2.6 percent of the respondents engage in the export of
their products/services.
0.0
5.010.0
15.0
20.0
25.0
0.0
5.0
10.0
15.0
20.0
25.0
30.0
Same
Locality
Same Town Same State Nigeria Only ECOWAS
State
Africa Only WorldWide
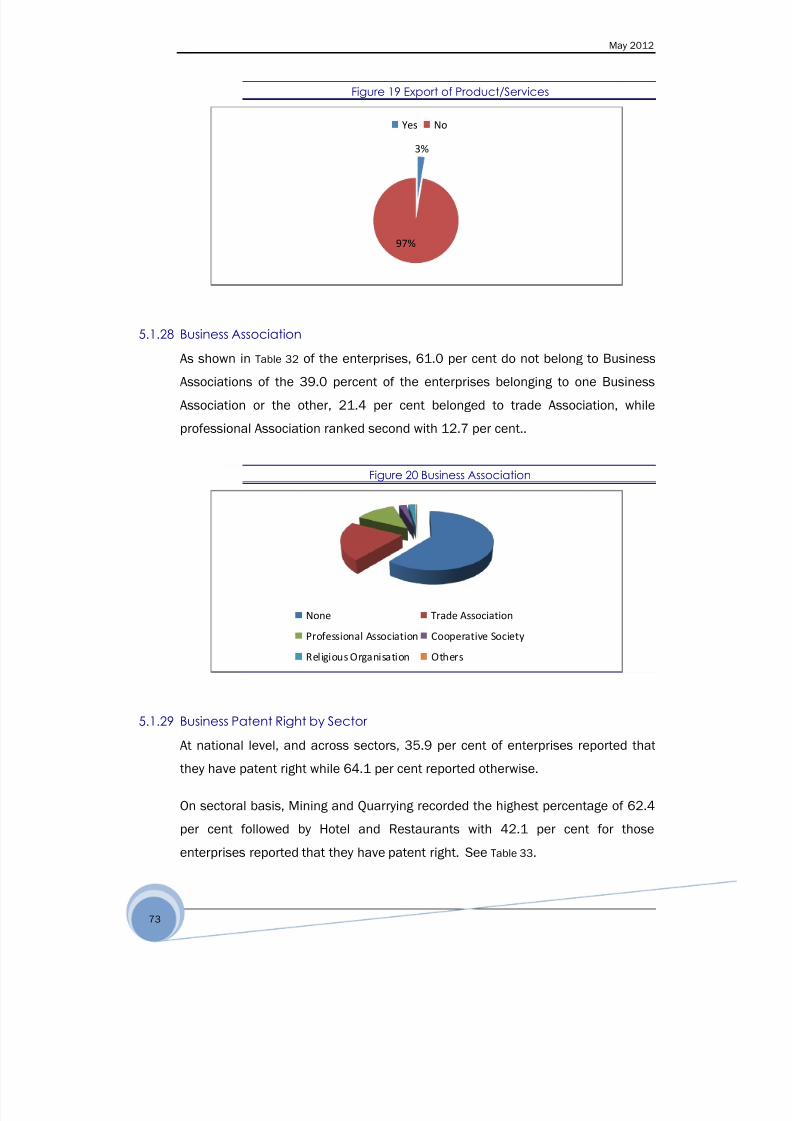
8/22/2019 MICRO, SMALL AND MEDIUM ENTERPRISES SURVEY IN NIGERIA BY SMEDAN
http://slidepdf.com/reader/full/micro-small-and-medium-enterprises-survey-in-nigeria-by-smedan 84/182
May 2012
73
Figure 19 Export of Product/Services
5.1.28 Business AssociationAs shown in Table 32 of the enterprises, 61.0 per cent do not belong to Business
Associations of the 39.0 percent of the enterprises belonging to one Business
Association or the other, 21.4 per cent belonged to trade Association, while
professional Association ranked second with 12.7 per cent..
Figure 20 Business Association
5.1.29 Business Patent Right by Sector
At national level, and across sectors, 35.9 per cent of enterprises reported that
they have patent right while 64.1 per cent reported otherwise.
On sectoral basis, Mining and Quarrying recorded the highest percentage of 62.4
per cent followed by Hotel and Restaurants with 42.1 per cent for those
enterprises reported that they have patent right. See Table 33.
3%
97%
Yes No
None Trade Association
Professional Association Cooperative Society
Religious Organisation Others

8/22/2019 MICRO, SMALL AND MEDIUM ENTERPRISES SURVEY IN NIGERIA BY SMEDAN
http://slidepdf.com/reader/full/micro-small-and-medium-enterprises-survey-in-nigeria-by-smedan 85/182
May 2012
74
Table 33 further shows that most of the sectors enterprises do not have patent
right and this accounted for over fifty per cent across sectors except Mining and
Quarrying.
Five (5) sectors – Namely Agriculture, Hunting, Forestry and Hunting; wholesale
and Retail Trade, and Household goods, Real Estate, Renting and Business
Activities; Education; and Other Community, social and Personal Service Activity
recorded less than the national average of 35.9 per cent.
Figure 21 Business Patent Right by Sector
5.1.30 Own Patent Right by Form of Ownership
Table 34 shows the overall average of enterprises owned patent right and no
patent right of 35.9 and 64.1 per cent respectively. Sole proprietorship,
partnership, Limited liability and religious organisations accounted for over fifty
per cent that have no patent.
0.010.020.030.040.050.060.070.080.0
Patent Right
No Patent Right
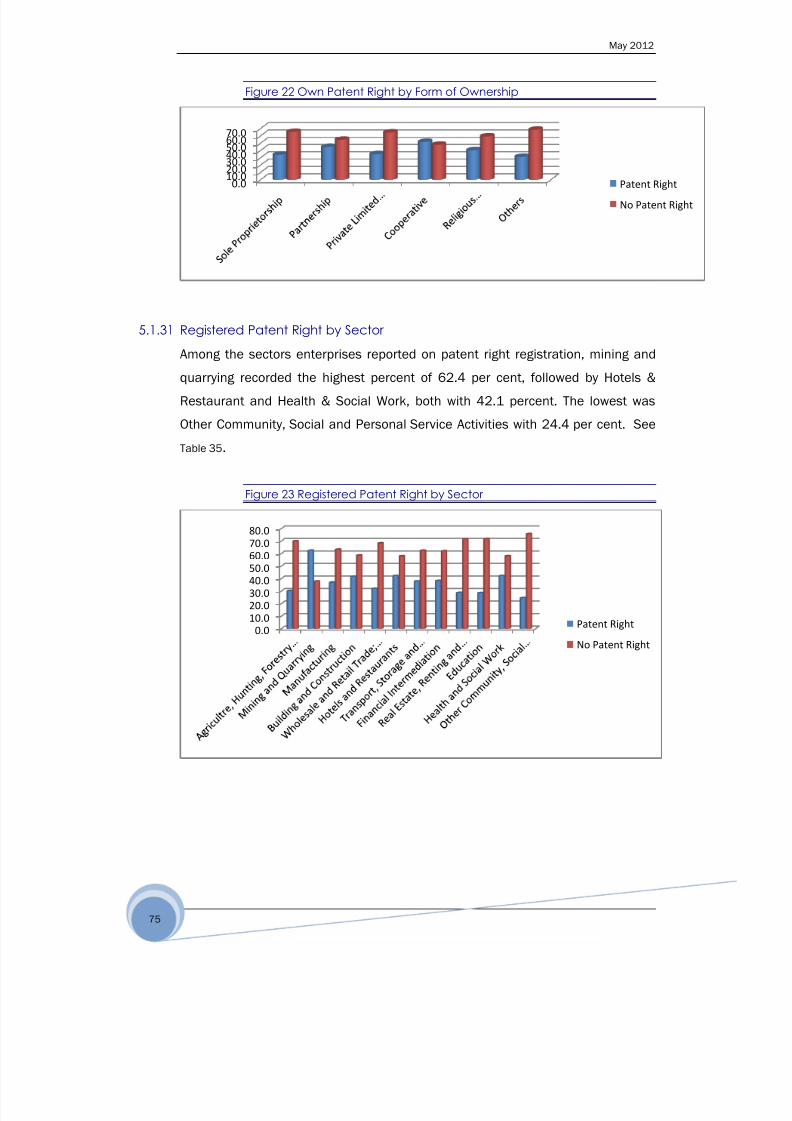
8/22/2019 MICRO, SMALL AND MEDIUM ENTERPRISES SURVEY IN NIGERIA BY SMEDAN
http://slidepdf.com/reader/full/micro-small-and-medium-enterprises-survey-in-nigeria-by-smedan 86/182
May 2012
75
Figure 22 Own Patent Right by Form of Ownership
5.1.31 Registered Patent Right by Sector
Among the sectors enterprises reported on patent right registration, mining and
quarrying recorded the highest percent of 62.4 per cent, followed by Hotels &
Restaurant and Health & Social Work, both with 42.1 percent. The lowest was
Other Community, Social and Personal Service Activities with 24.4 per cent. See
Table 35.
Figure 23 Registered Patent Right by Sector
0.010.020.030.040.050.060.070.0
Patent Right
No Patent Right
0.010.020.030.040.050.060.070.080.0
Patent Right
No Patent Right

8/22/2019 MICRO, SMALL AND MEDIUM ENTERPRISES SURVEY IN NIGERIA BY SMEDAN
http://slidepdf.com/reader/full/micro-small-and-medium-enterprises-survey-in-nigeria-by-smedan 87/182
May 2012
76
5.1.32 Registered Own Patent Right by Form of Ownership
Out of 8225 enterprises across the sectors, that own Patent Right 7244 (88.1 per
cent) had registered their patent right while 981 (11.9 per cent) had not
registered.
All the components of form of ownership recorded above 80 percent. However,
Cooperative, Religious Organisation and Private Limited Liability recorded less
than 10 per cent for non-registration with 3.8, 4.4 and 7.0 per cent respectively.
See Table 36.
Figure 24 Own Patent Right by Form of Ownership
5.1.33 Skills Gap by Sector
Enterprises in the Mining and Quarrying Sector recorded the highest percentage
of 80.6 percent for the availability of qualified artisan, followed by Building and
Construction with 69.8 per cent.
On the other hand, the non availability of qualified artisans is about 46.1 per cent
in Education, followed by Financial Intermediation. 42.5 per cent and Real Estate,
Renting and Business Activities (42.5 per cent). See Table 37.
0.0020.0040.0060.0080.00
100.00
Patent Right Registered
No Patent Right Registered
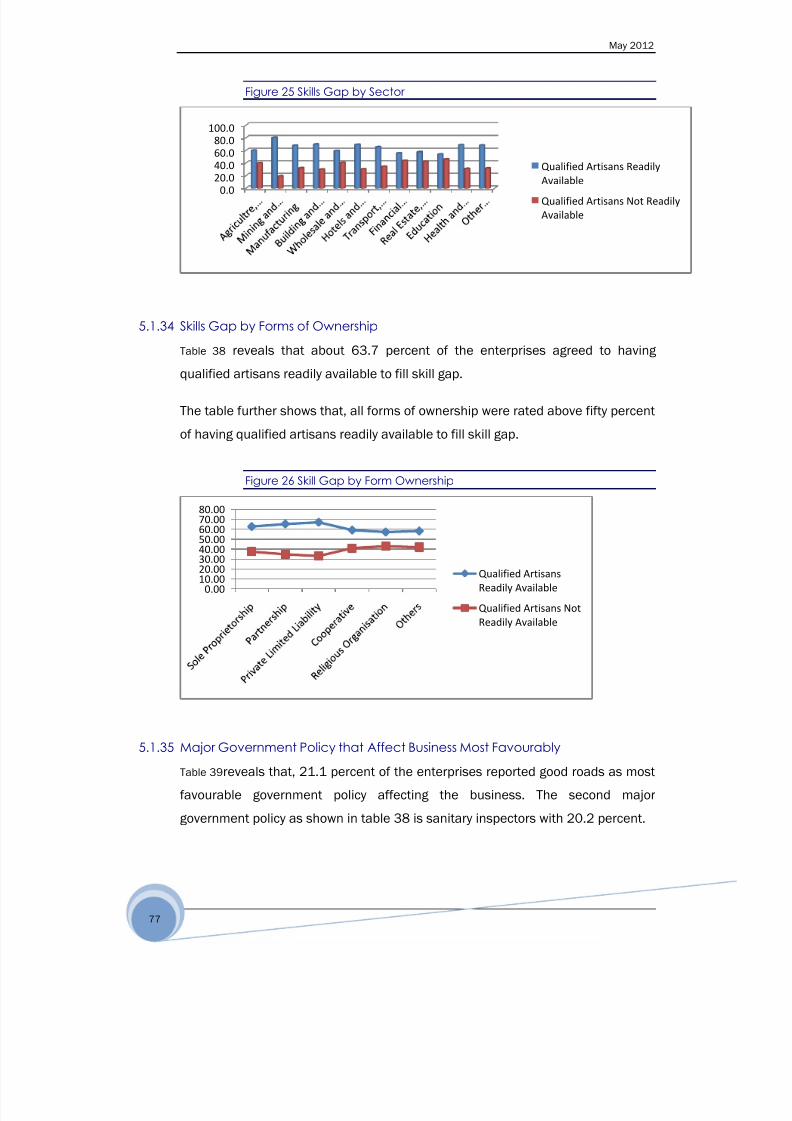
8/22/2019 MICRO, SMALL AND MEDIUM ENTERPRISES SURVEY IN NIGERIA BY SMEDAN
http://slidepdf.com/reader/full/micro-small-and-medium-enterprises-survey-in-nigeria-by-smedan 88/182
May 2012
77
Figure 25 Skills Gap by Sector
5.1.34 Skills Gap by Forms of Ownership
Table 38 reveals that about 63.7 percent of the enterprises agreed to having
qualified artisans readily available to fill skill gap.
The table further shows that, all forms of ownership were rated above fifty percent
of having qualified artisans readily available to fill skill gap.
Figure 26 Skill Gap by Form Ownership
5.1.35 Major Government Policy that Affect Business Most Favourably
Table 39reveals that, 21.1 percent of the enterprises reported good roads as most
favourable government policy affecting the business. The second major
government policy as shown in table 38 is sanitary inspectors with 20.2 percent.
0.020.040.0
60.080.0
100.0
Qualified Artisans ReadilyAvailable
Qualified Artisans Not Readily
Available
0.0010.0020.0030.0040.0050.0060.0070.0080.00
Qualified Artisans
Readily Available
Qualified Artisans Not
Readily Available

8/22/2019 MICRO, SMALL AND MEDIUM ENTERPRISES SURVEY IN NIGERIA BY SMEDAN
http://slidepdf.com/reader/full/micro-small-and-medium-enterprises-survey-in-nigeria-by-smedan 89/182
May 2012
78
Figure 27 Major Government Policy that Affect Businesses Most Favorably
5.1.36 Major Government Policy that Affect Businesses Most Unfavourably
Table 40 reveals excess taxes as the major government policy that affect business
most unfavourably in 2010 with about 33.6 percent.
Figure 28 Major Government Policy that Affect Businesses Most
Unfavourably
5.1.37 Top Priority Areas of Assistance
In areas of assistance, Table 41 shows that 24.7 percent of the enterprises most
needed area of assistance is in financing/financial assistance with 24.7 per cent.
Second priority area of assistance as revealed in the table was the provision of
infrastructure (like access roads, market work space etc.) with 19.0 percent
0.00
5.00
10.00
15.00
20.00
25.00
0.005.00
10.0015.0020.0025.0030.0035.0040.00
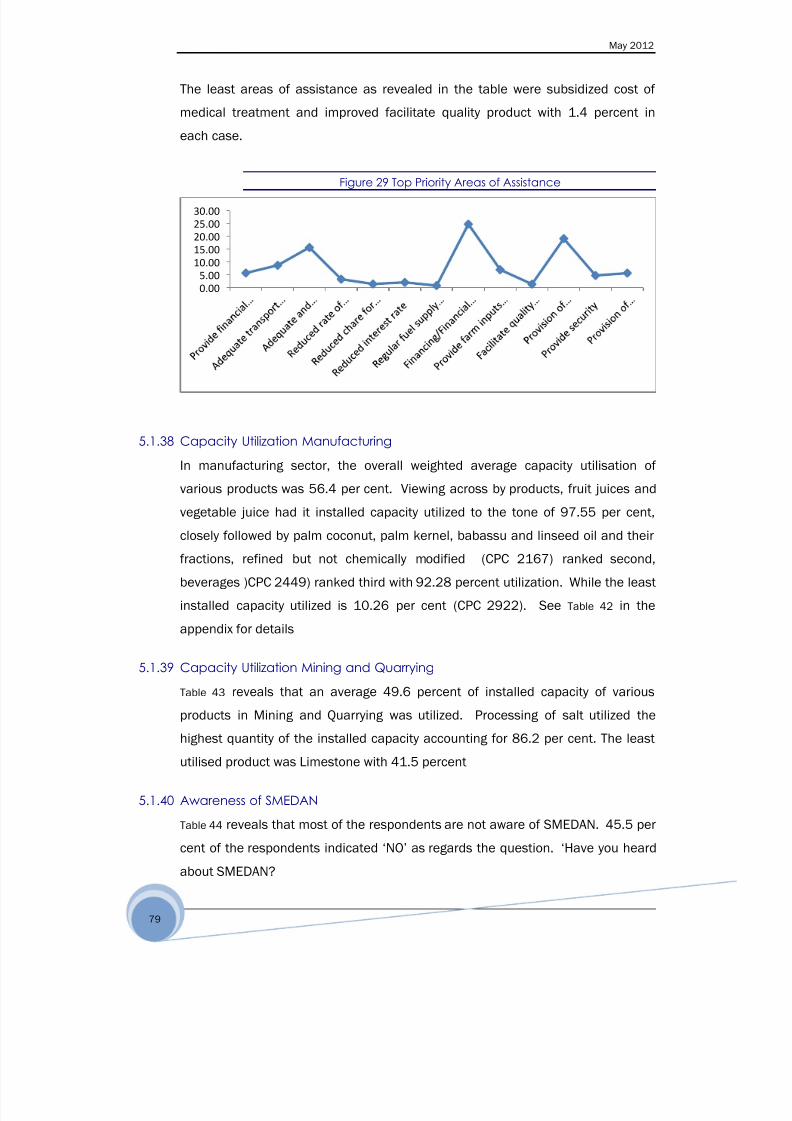
8/22/2019 MICRO, SMALL AND MEDIUM ENTERPRISES SURVEY IN NIGERIA BY SMEDAN
http://slidepdf.com/reader/full/micro-small-and-medium-enterprises-survey-in-nigeria-by-smedan 90/182
May 2012
79
The least areas of assistance as revealed in the table were subsidized cost of
medical treatment and improved facilitate quality product with 1.4 percent in
each case.
Figure 29 Top Priority Areas of Assistance
5.1.38 Capacity Utilization Manufacturing
In manufacturing sector, the overall weighted average capacity utilisation of
various products was 56.4 per cent. Viewing across by products, fruit juices and
vegetable juice had it installed capacity utilized to the tone of 97.55 per cent,
closely followed by palm coconut, palm kernel, babassu and linseed oil and their
fractions, refined but not chemically modified (CPC 2167) ranked second,
beverages )CPC 2449) ranked third with 92.28 percent utilization. While the least
installed capacity utilized is 10.26 per cent (CPC 2922). See Table 42 in the
appendix for details
5.1.39 Capacity Utilization Mining and Quarrying
Table 43 reveals that an average 49.6 percent of installed capacity of various
products in Mining and Quarrying was utilized. Processing of salt utilized the
highest quantity of the installed capacity accounting for 86.2 per cent. The least
utilised product was Limestone with 41.5 percent
5.1.40 Awareness of SMEDAN
Table 44 reveals that most of the respondents are not aware of SMEDAN. 45.5 per
cent of the respondents indicated „NO‟ as regards the question. „Have you heard
about SMEDAN?
0.00
5.00
10.00
15.00
20.00
25.00
30.00

8/22/2019 MICRO, SMALL AND MEDIUM ENTERPRISES SURVEY IN NIGERIA BY SMEDAN
http://slidepdf.com/reader/full/micro-small-and-medium-enterprises-survey-in-nigeria-by-smedan 91/182
May 2012
80
Figure 30 Awareness of SMEDAN
5.1.41 Awareness of SMEDAN by State
As shown in Table 45, Ogun State recorded the highest „NO‟ of 78.6 per cent,
followed by Jigawa state 73.7 per cent while Borno state ranked third with 70.68
per cent. The awareness is more in the FCT and Delta State representing 76.9 per
cent and 69.7 per cent respectively.
Figure 31 Awareness of SMEDAN by State
5.1.42 Awareness of SMEDAN by Sector
The awareness by sector is not encouraging either as indicated in Table 46Table 46.
Building Construction, Other Community, Social and Personal Service activities
recorded 65.09 percent and 67.5% respectively.
46%
54%
Yes No
0.00
20.00
40.00
60.00
80.00
100.00
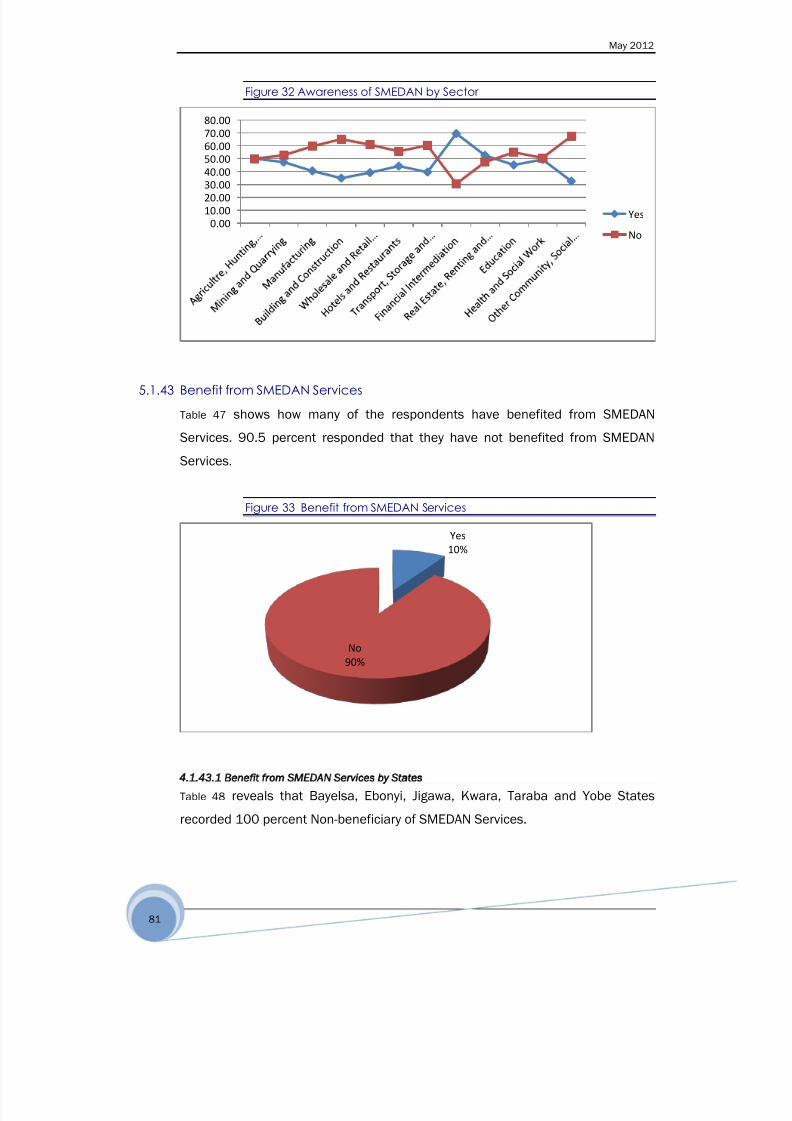
8/22/2019 MICRO, SMALL AND MEDIUM ENTERPRISES SURVEY IN NIGERIA BY SMEDAN
http://slidepdf.com/reader/full/micro-small-and-medium-enterprises-survey-in-nigeria-by-smedan 92/182
May 2012
81
Figure 32 Awareness of SMEDAN by Sector
5.1.43 Benefit from SMEDAN Services
Table 47 shows how many of the respondents have benefited from SMEDAN
Services. 90.5 percent responded that they have not benefited from SMEDAN
Services.
Figure 33 Benefit from SMEDAN Services
4 1 43 1 Benefit from SMEDAN Services by States
Table 48 reveals that Bayelsa, Ebonyi, Jigawa, Kwara, Taraba and Yobe States
recorded 100 percent Non-beneficiary of SMEDAN Services.
0.00
10.00
20.00
30.0040.00
50.00
60.00
70.00
80.00
Yes
No
Yes
10%
No
90%

8/22/2019 MICRO, SMALL AND MEDIUM ENTERPRISES SURVEY IN NIGERIA BY SMEDAN
http://slidepdf.com/reader/full/micro-small-and-medium-enterprises-survey-in-nigeria-by-smedan 93/182
May 2012
82
5.1.44 Ranking of SMEDAN Services
To rank the SMEDAN Services, the respondents have benefited, Entrepreneurship
Training and Vocational Skill upgrading were ranked as most important
respectively. While Facilitation of product quality control and certification,
facilitation of access to market and finance followed in that order as shown in
Table 49
5.1.45 Rank of Problems Militating Against Enterprises’ Development in Nigeria
To diagnose the major problems militating against business in Nigeria,
respondents were asked to rank the identified problem in order of severity; clearly
as Table 50 shows, lack of access to finance ranks the most severe followed by
weak infrastructure and inconsistency in government policy.
5.1.46 Measures Taken by SMEDAN to Alleviate Problems
Respondents were asked to rank what SMEDAN can do to alleviate some of the
identified problems in order of severity. Most of the respondents ranked
facilitation of access to finance and entrepreneurship training as most severe
shown in Table 51.
5.1.47 Export of Product/Services
The survey reveals that only 2.6 percent of the respondents engage in the export
of their products/services.
Figure 34 Export of Products/Services
3%
97%
Yes No
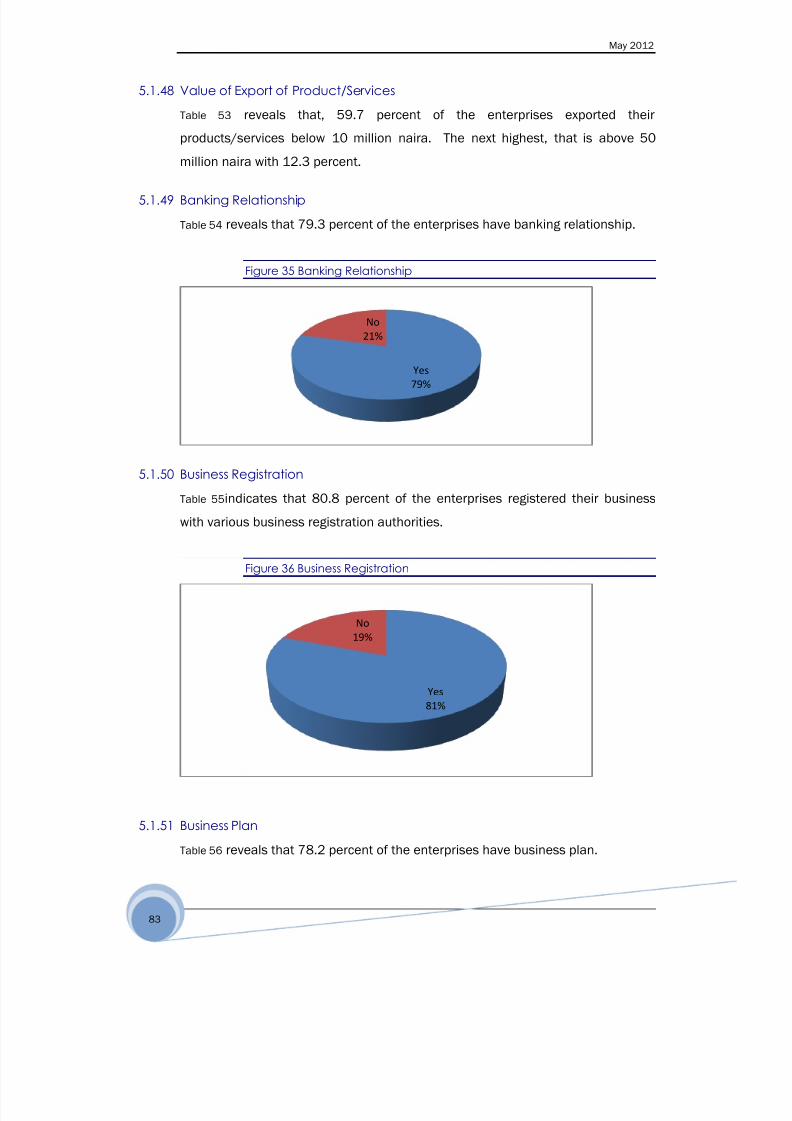
8/22/2019 MICRO, SMALL AND MEDIUM ENTERPRISES SURVEY IN NIGERIA BY SMEDAN
http://slidepdf.com/reader/full/micro-small-and-medium-enterprises-survey-in-nigeria-by-smedan 94/182
May 2012
83
5.1.48 Value of Export of Product/Services
Table 53 reveals that, 59.7 percent of the enterprises exported their
products/services below 10 million naira. The next highest, that is above 50
million naira with 12.3 percent.
5.1.49 Banking Relationship
Table 54 reveals that 79.3 percent of the enterprises have banking relationship.
Figure 35 Banking Relationship
5.1.50 Business Registration
Table 55indicates that 80.8 percent of the enterprises registered their business
with various business registration authorities.
Figure 36 Business Registration
5.1.51 Business Plan
Table 56 reveals that 78.2 percent of the enterprises have business plan.
Yes
79%
No
21%
Yes
81%
No
19%
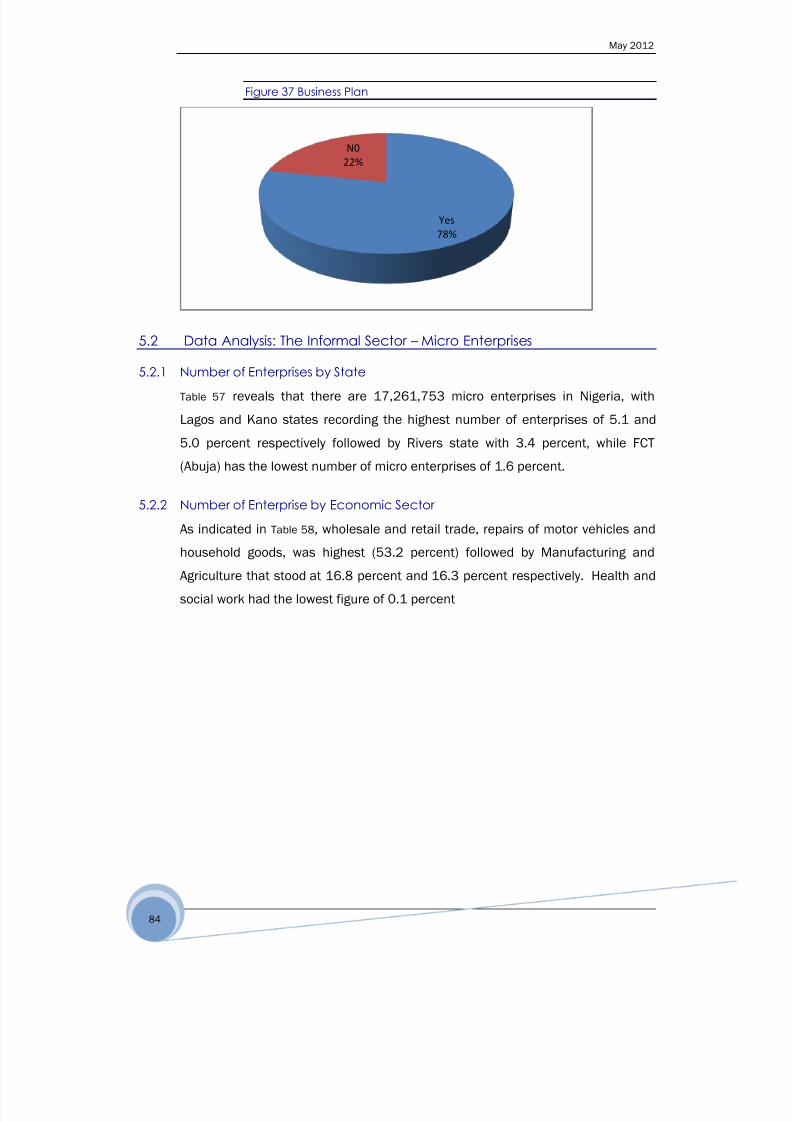
8/22/2019 MICRO, SMALL AND MEDIUM ENTERPRISES SURVEY IN NIGERIA BY SMEDAN
http://slidepdf.com/reader/full/micro-small-and-medium-enterprises-survey-in-nigeria-by-smedan 95/182
May 2012
84
Figure 37 Business Plan
5.2 Data Analysis: The Informal Sector – Micro Enterprises
5.2.1 Number of Enterprises by State
Table 57 reveals that there are 17,261,753 micro enterprises in Nigeria, with
Lagos and Kano states recording the highest number of enterprises of 5.1 and
5.0 percent respectively followed by Rivers state with 3.4 percent, while FCT
(Abuja) has the lowest number of micro enterprises of 1.6 percent.
5.2.2 Number of Enterprise by Economic SectorAs indicated in Table 58, wholesale and retail trade, repairs of motor vehicles and
household goods, was highest (53.2 percent) followed by Manufacturing and
Agriculture that stood at 16.8 percent and 16.3 percent respectively. Health and
social work had the lowest figure of 0.1 percent
Yes
78%
N0
22%

8/22/2019 MICRO, SMALL AND MEDIUM ENTERPRISES SURVEY IN NIGERIA BY SMEDAN
http://slidepdf.com/reader/full/micro-small-and-medium-enterprises-survey-in-nigeria-by-smedan 96/182
May 2012
85
Figure 38 Number of Enterprises by Economic Sector
5.2.3 Initial Start-Up Capital at Inception (N’000)
Table 59 in the Appendix indicates that majority (80.6 percent) of micro enterprises
covered started with initial capital of less than N50, 000 (Fifty thousand naira),
while 13.1 percent started with N50, 000-N100, 000.
5.2.4 Initial Start-Up Capital by Sector (N’000)
Table 60 shows that Wholesale and Retail Trade, Repair of Motor Vehicles and
Household Goods had the highest number of persons (7, 216, 934) that started
their businesses with initial start-up capital of below N50, 000 followed by the
manufacturing sector (2, 459, 001), while Health and social work sector had the
lowest (9,458).
5.2.5 Total Capital as at December 2010
Table 61 reveals that more than half (53.7 percent) of micro enterprises ownersengaged in business activities operated with total capital less than N50,000 as at
the end of December 2010. Next to this are those operating with total capital
between N50-100,000 representing 25.6 percent.

8/22/2019 MICRO, SMALL AND MEDIUM ENTERPRISES SURVEY IN NIGERIA BY SMEDAN
http://slidepdf.com/reader/full/micro-small-and-medium-enterprises-survey-in-nigeria-by-smedan 97/182
May 2012
86
Figure 39 Total Capital as at December 2010
5.2.6 Ownership Status
Table 62 reveals that the ownership status of micro enterprises were
predominately sole proprietorship, accounting for 97.4 percent, while partnership
followed by 2.4 percent.
Figure 40 Enterprise by Ownership Status
5.2.7 Ownership Status by Sector
Table 63in the appendix, reveals that the ownership status of micro enterprises by
economic activities (sector) is dominated by wholesale and Retail Trade, Repair of
Motor Vehicles and Household goods, (8,727,053 enterprises.), followed by
Manufacturing (2,772,225 enterprises) and Agriculture (2,545,781 enterprises).
0.00
10.00
20.00
30.00
40.0050.00
60.00P
e
r
c
e
n
t
Amount (000)
Fig.4.2.5: Total Capital As At 2010
Fig.4.2.6: Enterprise by Ownership Status
Sole Proprietorship
Partnership
Cooperative
Faith Based Organisation
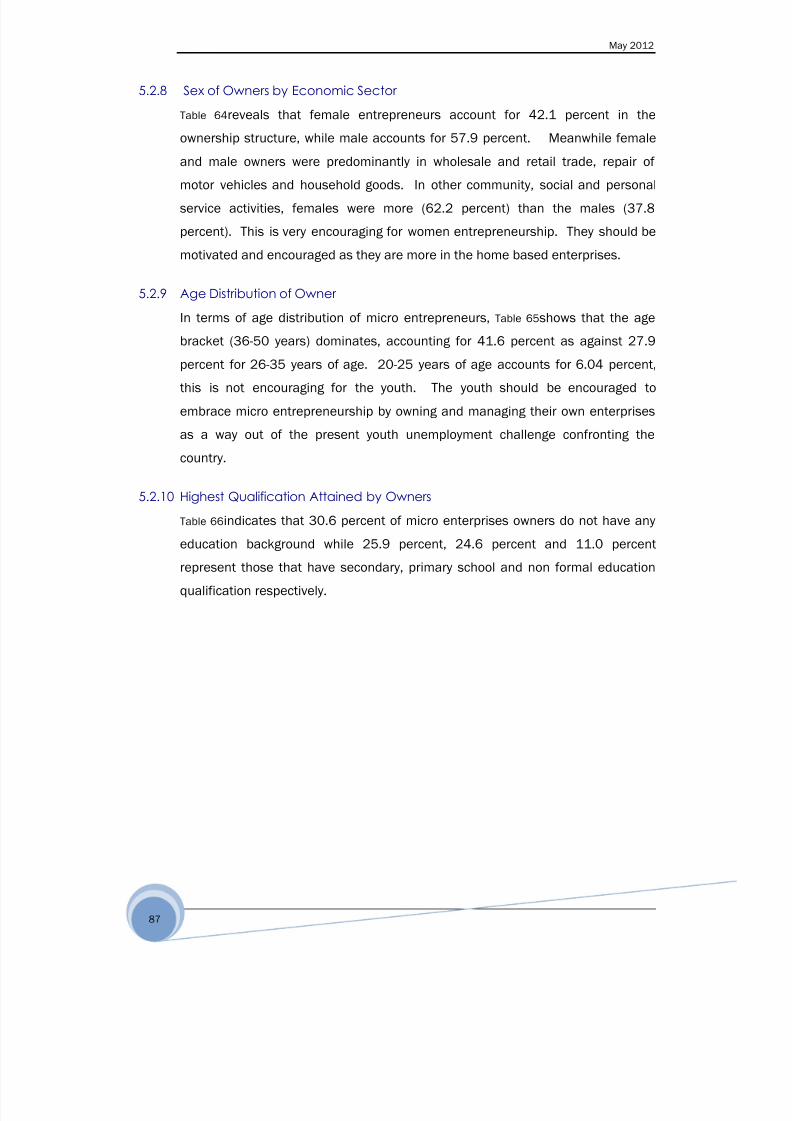
8/22/2019 MICRO, SMALL AND MEDIUM ENTERPRISES SURVEY IN NIGERIA BY SMEDAN
http://slidepdf.com/reader/full/micro-small-and-medium-enterprises-survey-in-nigeria-by-smedan 98/182
May 2012
87
5.2.8 Sex of Owners by Economic Sector
Table 64reveals that female entrepreneurs account for 42.1 percent in the
ownership structure, while male accounts for 57.9 percent. Meanwhile female
and male owners were predominantly in wholesale and retail trade, repair of
motor vehicles and household goods. In other community, social and personal
service activities, females were more (62.2 percent) than the males (37.8
percent). This is very encouraging for women entrepreneurship. They should be
motivated and encouraged as they are more in the home based enterprises.
5.2.9 Age Distribution of Owner
In terms of age distribution of micro entrepreneurs, Table 65shows that the age
bracket (36-50 years) dominates, accounting for 41.6 percent as against 27.9
percent for 26-35 years of age. 20-25 years of age accounts for 6.04 percent,
this is not encouraging for the youth. The youth should be encouraged to
embrace micro entrepreneurship by owning and managing their own enterprises
as a way out of the present youth unemployment challenge confronting the
country.
5.2.10 Highest Qualification Attained by Owners
Table 66indicates that 30.6 percent of micro enterprises owners do not have any
education background while 25.9 percent, 24.6 percent and 11.0 percent
represent those that have secondary, primary school and non formal education
qualification respectively.
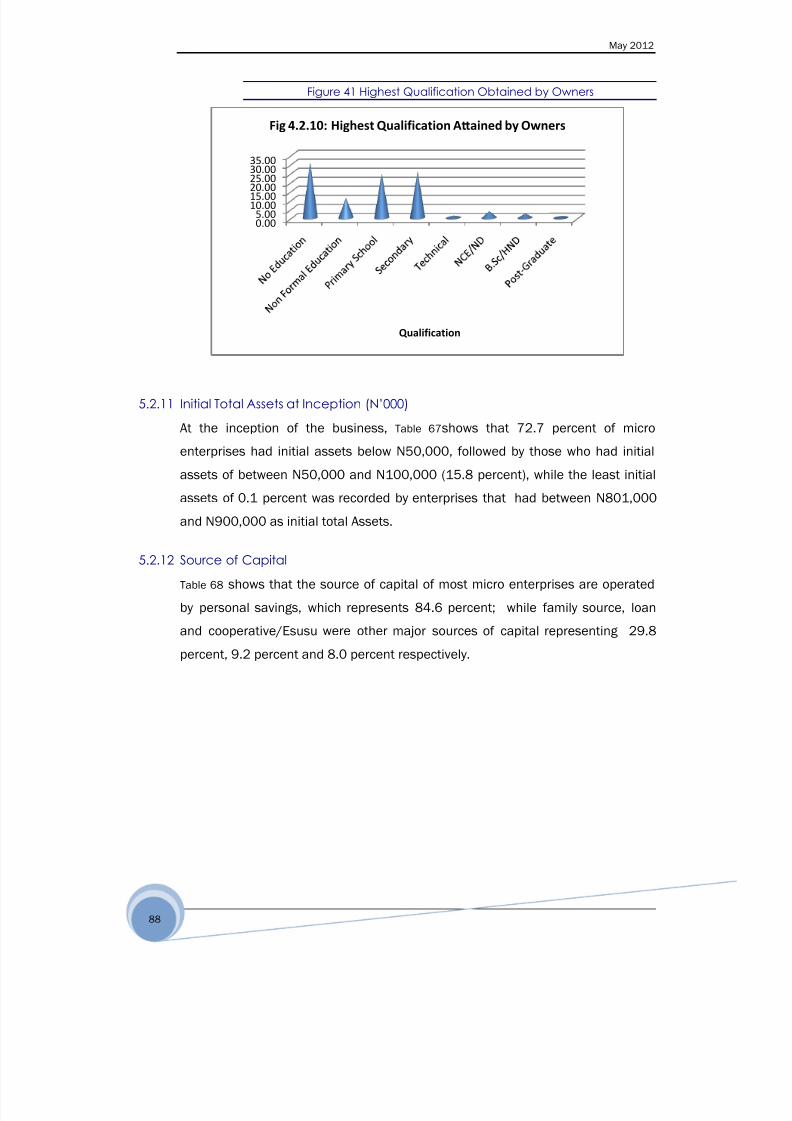
8/22/2019 MICRO, SMALL AND MEDIUM ENTERPRISES SURVEY IN NIGERIA BY SMEDAN
http://slidepdf.com/reader/full/micro-small-and-medium-enterprises-survey-in-nigeria-by-smedan 99/182
May 2012
88
Figure 41 Highest Qualification Obtained by Owners
5.2.11 Initial Total Assets at Inception (N’000)
At the inception of the business, Table 67shows that 72.7 percent of micro
enterprises had initial assets below N50,000, followed by those who had initial
assets of between N50,000 and N100,000 (15.8 percent), while the least initial
assets of 0.1 percent was recorded by enterprises that had between N801,000
and N900,000 as initial total Assets.
5.2.12 Source of Capital
Table 68 shows that the source of capital of most micro enterprises are operated
by personal savings, which represents 84.6 percent; while family source, loan
and cooperative/Esusu were other major sources of capital representing 29.8
percent, 9.2 percent and 8.0 percent respectively.
0.005.00
10.0015.0020.0025.0030.00
35.00
Qualification
Fig 4.2.10: Highest Qualification Attained by Owners

8/22/2019 MICRO, SMALL AND MEDIUM ENTERPRISES SURVEY IN NIGERIA BY SMEDAN
http://slidepdf.com/reader/full/micro-small-and-medium-enterprises-survey-in-nigeria-by-smedan 100/182
May 2012
89
Figure 42 Source of Capital
5.2.13 Business Capacity (Turnover) 2009Table 69indicates that 82.5 percent of micro enterprises had turnover of below
N50,000 in 2009, while 11.6 percent of the enterprises had turnover of between
N50,000 and N100,000.
5.2.14 Business Capacity Monthly Average (Turnover) 2010
Table 70shows that as at 2010, 76.9 percent of micro enterprises reported a
monthly average turnover below N50,000, followed by those that recorded
monthly average turnover of between N50,000 and N100,000 (13.9 percent),
while the least figure of 0.1 percent was recorded by establishments that had
between N 801,000 and N 1,000,000 monthly average turnover.
5.2.15 Monthly Cost of Operation
Table 71 reveals the monthly cost of operations. The operational cost of the
enterprises were mainly below N50,000 representing 92.7 percent while 5.3
percent were from N50,000 to N100, 000.
5.2.16 Promotional Media
Table 72 shows that micro enterprises used more of person-to-person as a medium
to promote their product and services, which accounts for 97.4 percent. While
Radio advertisement, Billboard and Handbill distribution followed with 6.3
percent, 5.8 percent and 3.7 percent respectively.
0.010.020.030.040.050.0
60.070.080.090.0 Fig. 4.2.12: Source of Capital

8/22/2019 MICRO, SMALL AND MEDIUM ENTERPRISES SURVEY IN NIGERIA BY SMEDAN
http://slidepdf.com/reader/full/micro-small-and-medium-enterprises-survey-in-nigeria-by-smedan 101/182
May 2012
90
Figure 43 Promotional Media
5.2.17 Business Insurance
Table 73 reveals that the Business Insurance is predominantly in the construction
sector; accounting for 6.5 percent, followed by Mining and Quarrying (4.5 percent)
and Hotels and Restaurants (3.5 percent). Most of the business enterprises are
not insured.
5.2.18 Daily Usage of Alternative Source of Power by Sector
Table 74 shows that greater percentage (74.5 percent) of micro enterprises use
alternative sources of power for between 1-5 hours, while 15.7 percent use
alternative sources for between 6-10 hours. Those that source for their
alternative power for between 11-15 hours and 16-20 hours recorded 5.5 percent
and 4.2 percent respectively. Energy remains a major challenge to the
enterprises.
5.2.19 Employment by Sector at Commencement
Table 75 shows that more males are employed in the micro enterprises,
representing 58.2 percent than females accounting for 41.8 percent. Meanwhile,
males and females are predominantly employed in Wholesale and Retail Trade,
Repair of Motor Vehicle and Household Goods; Agriculture and Manufacturing.
Television
1.15%
Newspaper
advertisement
0.32% Handbill
distribution
2.06%
Person-to-
Person
88.85%
Radio
advertisement
3.53%
Billboard
3.18%Business Card
0.91%
Fig 3.2.16: Promotional Media

8/22/2019 MICRO, SMALL AND MEDIUM ENTERPRISES SURVEY IN NIGERIA BY SMEDAN
http://slidepdf.com/reader/full/micro-small-and-medium-enterprises-survey-in-nigeria-by-smedan 102/182
May 2012
91
5.2.20 Employment by Sector as at December 2010
Table 76indicates that more males, 57.4 were employed in the micro enterprises
than females, 42.6 as at the end of 2010. But wholesale and retail trade; repair
of motor vehicles and household goods (50.0 Percent); manufacturing (20.4
percent); Hotels and Restaurants (3.1 percent) and other community, social and
personal services activities (3.8 percent) employed more females than their
female counterparts.
5.2.21 Market Channel of Product
In the micro entrepreneur, 89.8 percent reported that they used same locality to
market their products, 74.0 percent used same town, 43.1 percent used same
state, while 0.3 percent used ECOWAS channel to market their products. See Table
77.
Figure 44 Market Channel of Product
5.2.22 Business Registration by Sector
Table 78 reveals that 95.3 percent of micro enterprises are not registered with
Corporate Affair Commission while 4.7 percent registered their business.
5.2.23 Support Received from Association
Table 79 reveals that majority of micro enterprises (91.5 percent) in Nigeria did not
state the support received from the Association they belong. But 4.4percent
0.00
10.00
20.00
30.00
40.00
50.00
60.00
70.00
80.00
90.00
Fig. 4.2.21: Market Channel of Product

8/22/2019 MICRO, SMALL AND MEDIUM ENTERPRISES SURVEY IN NIGERIA BY SMEDAN
http://slidepdf.com/reader/full/micro-small-and-medium-enterprises-survey-in-nigeria-by-smedan 103/182
May 2012
92
reported that they enjoyed financial loan support, while 2.0 percent enjoyed
training support.
5.2.24 Own Patent Right by Sector
Table 80 indicates that ownership of patent right was highest for enterprises in
Transport, Storage and Communication (11.3 percent), followed by 9.2 percent
(Agriculture) and Construction (9.0 percent), while ownership was lowest in Real
Estate, Renting and Business Activities (1.5 percent).
5.2.25 Patent Right by Form of Ownership
Table 81 highlights that 94.7 percent of micro enterprises had no patent right,
while 5.3 percent had patent right. In other words, their intellectual property was
not protected. This calls for advocacy and encouragement.
Figure 45 Own Patent Right by Form of Ownership
5.2.26 Patent Right Registered by Sector
Table 82 reveals that 84.0 percent of micro enterprises did not register their patent
right. Distributing into economic sector, 54.4 percent registered their patent right
in construction, followed by establishment in Real Estate, Renting and business
activities (46.9 percent), while other community, social and personal service
activities recorded the least of registered patent right (9.8 percent).
5.2.27 Skills Gap by Sector
Table 83 shows that qualified Artisans are predominantly readily available inEducation sector (66.9 percent), followed by Health and Social Workers sector
0.00
20.00
40.00
60.00
80.00
100.00
120.00
Form of Ownership
Fig 4.2.25: Own Patent Right by Form of Ownership
No Patent Right
Have Patent Right

8/22/2019 MICRO, SMALL AND MEDIUM ENTERPRISES SURVEY IN NIGERIA BY SMEDAN
http://slidepdf.com/reader/full/micro-small-and-medium-enterprises-survey-in-nigeria-by-smedan 104/182
May 2012
93
(65.8 percent) and Construction Sector (56.4 percent), while the least availability
of qualified Artisans was recorded by Hotels and Restaurants (38.6 percent).
5.2.28 Skills Gap by Form of Ownership
Table 84 shows that 52.3 percent of micro enterprises did not have qualified
Artisans readily available in their businesses; whereas, qualified artisans are
predominant in sole proprietorship and partnership with 45.5 and 40.9 percent
respectively.
Figure 46 Skill Gap by Form of Ownership
5.2.29 Major Government Policy that Affect Business Most Favourably
Table 85reveals that 83.7 percent of micro enterprises in Nigeria did not state
categorically the major government policies that affected their businesses
favourably, while favourable atmosphere for business and Good roads
representing 5.2 percent and 3.1 percent respectively were identified as major
government policies that affected micro enterprises most favourably.
5.2.30 Major Government Policy that Affect Business Most Unfavourably
Table 86 shows that 55.0 percent of micro enterprises carrying out business
activities in Nigeria did not state categorically how government policies affected
their businesses unfavourably. While excess taxes and withdrawal of subsidies
representing 12.0 percent and 11.1 percent respectively were identified as major
government policies that affected micro businesses unfavourably.
0%
50%
100%
Form of Ownership
Fig. 4.2.28: Skill Gap by Form of Ownership
Qualified Artisans
Not Readily
Available
Qualified Artisans
Readily Available

8/22/2019 MICRO, SMALL AND MEDIUM ENTERPRISES SURVEY IN NIGERIA BY SMEDAN
http://slidepdf.com/reader/full/micro-small-and-medium-enterprises-survey-in-nigeria-by-smedan 105/182
May 2012
94
5.2.31 Top Priority of Assistance
Table 87 shows that the top priority of assistance of micro enterprises were mainly
in area of financing/financial assistance, accounting for 73.2 percent, followed by
provision of infrastructure (access roads, market, work space), representing 10.6
percent, while the least figure of 0.1 percent was in the area of facilitating quality
product.
5.2.32 Awareness of SMEDAN by Form of Ownership
At the national level, Table 88 reveals that more than nine in every ten micro
enterprise operators (95.2 percent) are not aware of SMEDAN and benefits they
can enjoy, while only 4.8 percent are aware of SMEDAN. Among those that are
aware of SMEDAN, majority (10.1 percent) belongs to Faith Based Organizations,
followed by cooperative (8.3 percent) and the least (4.7 percent) are sole
proprietorship.
Figure 47 Awareness of SMEDAN by Form of Ownership
5.2.33 Awareness of SMEDAN by State
Table 89 shows the awareness of SMEDAN by the micro enterprise operators by
state. It was revealed that most awareness was recorded by micro enterprise
operators in Nassarawa (31.0 percent), followed by Rivers (27.2 percent) and
Ekiti (18.5 percent). Kwara and Ogun states had the lowest awareness record of
SMEDAN, 0.2 percent each.
0%
10%
20%
30%
40%
50%
60%
70%
80%
90%
100%
Sole
Proprietorship
Partnership Cooperative Faith Based
OrganizationForm of Ownership
Fig 4.2.32: Awareness of Smedan by Form of Ownership
Not aware
Aware

8/22/2019 MICRO, SMALL AND MEDIUM ENTERPRISES SURVEY IN NIGERIA BY SMEDAN
http://slidepdf.com/reader/full/micro-small-and-medium-enterprises-survey-in-nigeria-by-smedan 106/182
May 2012
95
5.2.34 Benefit from SMEDAN Service by State
Table 90 shows the number of states that have benefited from SMEDAN Services.
It was revealed that Bauchi, Kaduna, Ondo and Zamfara recorded 100 percent
beneficiary of SMEDAN Services indicating that all operators that responded
benefitted while Bayelsa, Benue, Delta, Ebonyi, Imo, Jigawa, Kebbi, Kwara, Niger,
Ogun, Osun, Oyo, Rivers, Sokoto and FCT had 100 percent non-beneficiary of
SMEDAN services.
5.2.35 Benefitted from SMEDAN by Form of Ownership
Table 91reveals that 97.1 percent of micro enterprises owners did not benefit from
the SMEDAN services while 2.9 percent of micro enterprises owners benefited
from the services of SMEDAN. However, those that benefitted from SMEDAN
services are predominantly in sole proprietorship (3.0 percent)
5.2.36 Ranking of SMEDAN Services Received
The entrepreneurs were asked to rank SMEDAN services they enjoyed in order of
importance. As revealed in Table 92, that 6.3 percent of those that had received
entrepreneurship training ranked it as number one (1) while 91.7 percent ranked
it number two (2); 1.6 percent ranked vocational skill upgrading as number one
(1) while 94.6 percent rank it number two (2) among the services received from
SMEDAN. Facilitation of access to market was ranked number one (1) by 2.4
percent while 94.0 percent ranked it number two (2).
5.2.37 Ranking of Major Problem Militating Against Business in Nigeria
Table 93 indicates that 84.2 percent of micro enterprises that indentified lack of
access to finance as a major problem ranked it as number one (1). Also, 3.5
percent of those that identified lack of work space as a major problem ranked itas no1 while 50.2 percent ranked it as number two (2). Weak infrastructure was
ranked number one (1) by 4.6 percent while 37.6 percent ranked it as number
two (2). Equally, 3.6 percent of those that identified lack of entrepreneurship
education as a major problem ranked it as no 1 while 32.2 percent ranked it as
number two (2) problem.

8/22/2019 MICRO, SMALL AND MEDIUM ENTERPRISES SURVEY IN NIGERIA BY SMEDAN
http://slidepdf.com/reader/full/micro-small-and-medium-enterprises-survey-in-nigeria-by-smedan 107/182
May 2012
96
5.2.38 Personal Insurance of Owners
Only 1.7 percent of the owners of micro enterprises in Nigeria insured themselves
while 98.3 percent do not have any personal insurance policy. Meanwhile, micro
enterprises owners that did not insure themselves are predominately in the sole
proprietorship. See Table 94
5.2.39 Personal Banking Relationship of Owners
Table 95reveals that 82.6 percent of micro entrepreneurs had no personal banking
relationship to operate their business while 17.4 percent of micro enterprises had
personal banking relationship with the bank. However, sole proprietorship had
the highest no personal banking relationship (82.7 percent)
Figure 48 Personal Banking Relationship of Owners
5.2.40 Qualification Attained by Workers
Table 96 shows that 18.9 percent of micro entrepreneurship who engage in sole
proprietorship had no education. While 25.6 percent of those who operated in
partnership and 27.6 percent of those who operated in cooperative had primary
school education.
5.2.41 What SMEDAN Can Do to Alleviate Some of the Problems
Table 97reveals some of the activities SMEDAN can carry out to alleviate some of
the problems of micro enterprises. The measures are ranked based on the
priorities of the respondents and the results show that 21.9 percent of those who
prefer entrepreneurship training ranked it no 1 while 30.1 percent ranked it no 2;
6.9 percent of those who prefer vocational skill upgrading ranked it no 1 while
30.2 percent ranked it no 2. Also, 11.9 percent of those who prefer facilitation of
access to market ranked it no 1 while 42.2 percent ranked it no 2.
0
50
100
Sole Proprietorship Partnership CooperativeFaith Based Organization
Form of Ownership
Fig. 4.2.39: Personal Banking Relationship of Owners
No Personal Banking
Relationship
Had Personal Banking
Relationship

8/22/2019 MICRO, SMALL AND MEDIUM ENTERPRISES SURVEY IN NIGERIA BY SMEDAN
http://slidepdf.com/reader/full/micro-small-and-medium-enterprises-survey-in-nigeria-by-smedan 108/182
May 2012
97
5.2.42 Business Plan by Ownership Status
Table 98 is an indication of the proportion of micro enterprises in Nigeria that
prepare business plan and those that did not. About 44.5 percent of micro
enterprises in Nigeria prepare business plans while 55.5 percent did not prepare
business plan.
5.2.43 Member of Association
Table 99reveals that 86.5 percent of the micro enterprises in Nigeria did not
belong to any Business Membership Association. However, 8.0 percent and 3.4
percent belong to trade Association and Cooperative Societies respectively.
5.2.44 Total Number of Workers by Sector as at December 2010Workers comprise person who are engaged in the enterprise and the owners of
enterprise. A total number of 32,375,406 workers are engaged in the micro
enterprises. About 16.73 million are owners of the enterprise, while 15.64 million
are engaged in operation. 51.4 per cent work in the Wholesale and Retail Trade,
Repair of Motor vehicles and Household Goods. 16.9 per cent are engaged in the
Manufacturing Sector, while the least of the workers are in the Health and Social
Sector, representing 0.1 per cent.
5.3 Contribution of MSMEs to the Gross Domestic Product (GDP)
One of the key objectives of study was to ascertain the contribution of the MSMEs
to the nation‟s gross domestic product (GDP). To achieve this, data was collected
to reflect the structure of the economy especially as regards the major economic
sectors that has an element of micro, small and medium activities. The analysis
was carried out for twelve (12) activity sectors of the economy which include;
agriculture, hunting, forestry and fishing; mining and quarrying; manufacturing;
building and construction; wholesale and retail trade; hotel and restaurants;
transport, storage and communications; financial intermediation; real estate,
renting and business activities; education; heal and social work; and other
community, social and personal services.
At the end of the analysis which was carried out for the year 2010, it was found
that the MSMEs contributed 46.54 percent to Nigeria‟s GDP in nominal terms .

8/22/2019 MICRO, SMALL AND MEDIUM ENTERPRISES SURVEY IN NIGERIA BY SMEDAN
http://slidepdf.com/reader/full/micro-small-and-medium-enterprises-survey-in-nigeria-by-smedan 109/182
May 2012
98
The result further showed that in terms of contribution to each sector, MSMEs
made the highest contribution to other community, social, personal service
activities then followed by real estate, renting and business activities and
agricultural activities (Fig 50).
Figure 49 Sectoral Contribution of MSMEs to GDP
Following this sub-section is the analysis on the contribution of the MSMEs to
each activity sector.
5.3.1 Agriculture, Hunting, Forestry and Fishing
Agriculture in Nigeria can be broken into two major segments; private farmers and
corporate farms. The private farmers constitute the highest percentage both in
number and output and by definition they are classified as micro and small
enterprises while the corporate farms are largely medium enterprises while a
small percentage operates at large scale.
This study shows that MSMEs contribute 98.01 percent of the GDP produced in
this sector. Further breakdown of this result showed that the micro enterprises in
this sector contributed 69.58 percent to nominal GDP while the small and
medium enterprises contributed 25.27 and 3.16 percent of the GDP produced
from this sector.
0
50
10098.01
67.78 63.74
10.76
67.98
40.62 39.74
5.32
99.13
48
73.82
99.98
Fig 4.3.1: Sectoral Contribution of MSMEs to GDP
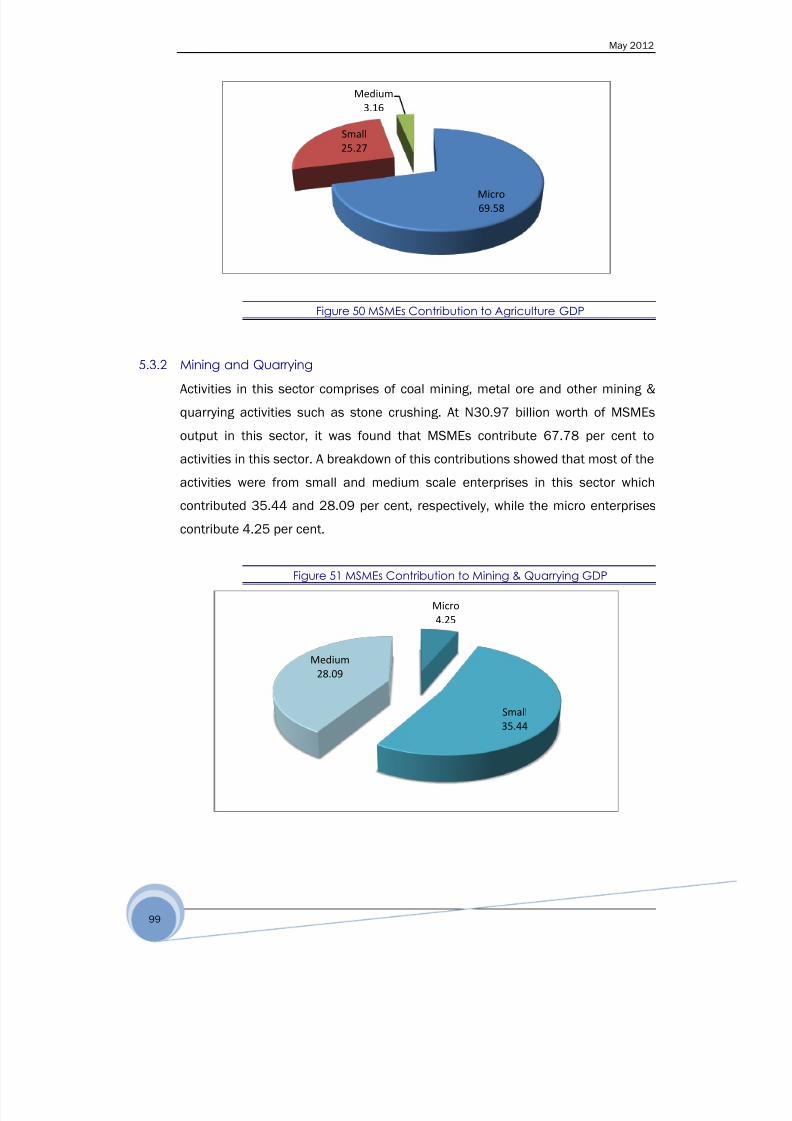
8/22/2019 MICRO, SMALL AND MEDIUM ENTERPRISES SURVEY IN NIGERIA BY SMEDAN
http://slidepdf.com/reader/full/micro-small-and-medium-enterprises-survey-in-nigeria-by-smedan 110/182
May 2012
99
Figure 50 MSMEs Contribution to Agriculture GDP
5.3.2 Mining and Quarrying
Activities in this sector comprises of coal mining, metal ore and other mining &
quarrying activities such as stone crushing. At N30.97 billion worth of MSMEs
output in this sector, it was found that MSMEs contribute 67.78 per cent to
activities in this sector. A breakdown of this contributions showed that most of the
activities were from small and medium scale enterprises in this sector which
contributed 35.44 and 28.09 per cent, respectively, while the micro enterprisescontribute 4.25 per cent.
Figure 51 MSMEs Contribution to Mining & Quarrying GDP
Micro
69.58
Small
25.27
Medium
3.16
Micro
4.25
Small
35.44
Medium
28.09
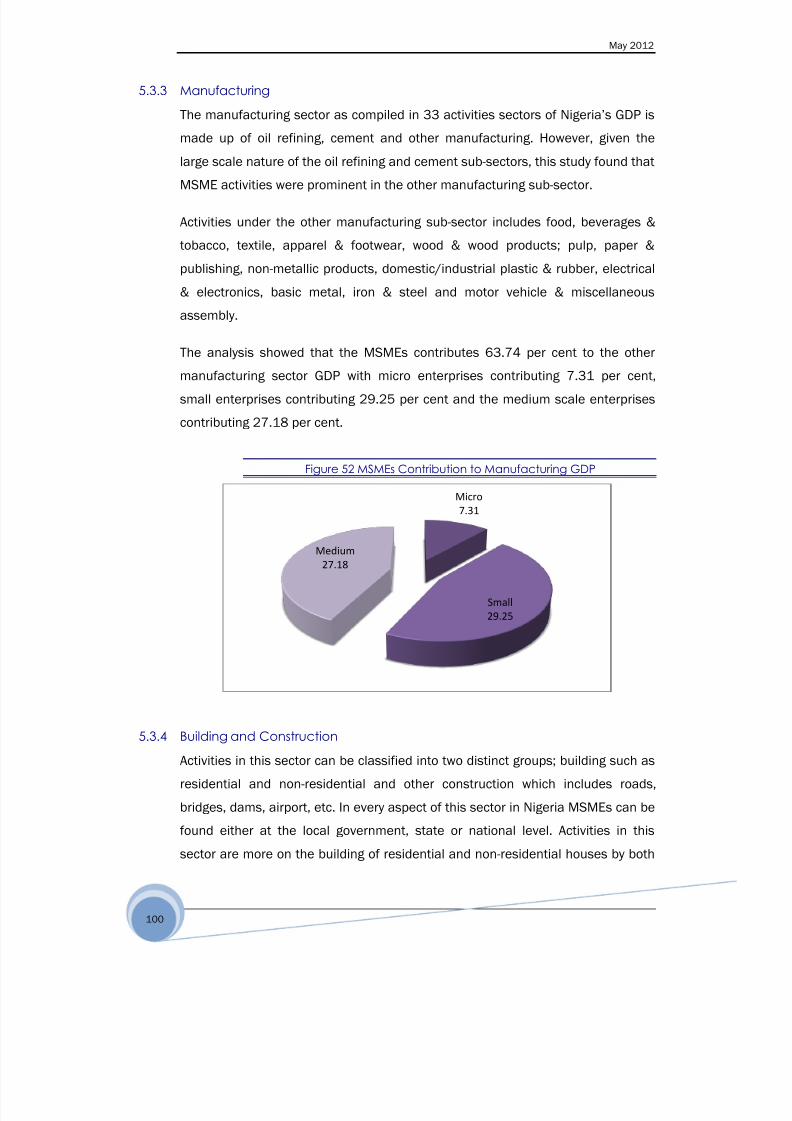
8/22/2019 MICRO, SMALL AND MEDIUM ENTERPRISES SURVEY IN NIGERIA BY SMEDAN
http://slidepdf.com/reader/full/micro-small-and-medium-enterprises-survey-in-nigeria-by-smedan 111/182
May 2012
100
5.3.3 Manufacturing
The manufacturing sector as compiled in 33 activities sectors of Nigeria‟s GDP is
made up of oil refining, cement and other manufacturing. However, given the
large scale nature of the oil refining and cement sub-sectors, this study found that
MSME activities were prominent in the other manufacturing sub-sector.
Activities under the other manufacturing sub-sector includes food, beverages &
tobacco, textile, apparel & footwear, wood & wood products; pulp, paper &
publishing, non-metallic products, domestic/industrial plastic & rubber, electrical
& electronics, basic metal, iron & steel and motor vehicle & miscellaneous
assembly.
The analysis showed that the MSMEs contributes 63.74 per cent to the other
manufacturing sector GDP with micro enterprises contributing 7.31 per cent,
small enterprises contributing 29.25 per cent and the medium scale enterprises
contributing 27.18 per cent.
Figure 52 MSMEs Contribution to Manufacturing GDP
5.3.4 Building and Construction
Activities in this sector can be classified into two distinct groups; building such as
residential and non-residential and other construction which includes roads,
bridges, dams, airport, etc. In every aspect of this sector in Nigeria MSMEs can be
found either at the local government, state or national level. Activities in this
sector are more on the building of residential and non-residential houses by both
Micro
7.31
Small
29.25
Medium
27.18

8/22/2019 MICRO, SMALL AND MEDIUM ENTERPRISES SURVEY IN NIGERIA BY SMEDAN
http://slidepdf.com/reader/full/micro-small-and-medium-enterprises-survey-in-nigeria-by-smedan 112/182
May 2012
101
the private and public sector. Most of the activities in this regard are carried out
at MSME level. However, a large chunk of activities in this sector is carried out in
construction activities which are usually high-valued government financed
projects executed by the various tiers of government in the country.
Analysis of the data collected from the sector for 2010 showed that the MSMEs
activities contribute 10.76 per cent of the total value of activities in this sector,
out of this portion the medium enterprises contributed 8.31 per cent which the
small and micro enterprises contributed 1.96 and 0.49 per cent respectively.
Figure 53 MSMEs Contribution to Building & Construction GDP
5.3.5 Wholesale and Retail Trade
The wholesale and retail trade activities constitute a dominant sector in business
activities engaged by majority of Nigerians. Due to the large population of the
country and the geographical spread, activities in this sector form a major
component of the people‟s means of economic sustenance. Operators in this
sector depending on their capital can engage in trading activities in various scales
either micro, small, medium of large.
However, given the definition of MSMEs adopted in this study it was found that
despite the large capital outlay used by most operators in this sector their
employment size still qualify them to be classified as small scale enterprises.
The study found that MSMEs in this sector contribute as much as 67.98 per cent
of total output from this sector; this was largely driven by the small scale
Micro0.49
Small
1.96
Medium
8.31

8/22/2019 MICRO, SMALL AND MEDIUM ENTERPRISES SURVEY IN NIGERIA BY SMEDAN
http://slidepdf.com/reader/full/micro-small-and-medium-enterprises-survey-in-nigeria-by-smedan 113/182
May 2012
102
enterprises which contribute 46.71 per cent while the medium scale and micro
enterprises contribute 17.33 and 3.94 per cent, respectively.
Figure 54 MSMEs Contribution to Wholesale & Retail Trade GDP
5.3.6 Hotels and Restaurants
The study found that the hotel component of the sector comprises of small,
medium and large scale enterprises while the restaurants component is
dominated by micro enterprises. The analysis showed that MSMEs contribute
40.62 per cent to activities in this sector‟s GDP. It further showed that 28.10 per
cent of this ratio comes from small scale enterprises, 8.31 per cent from medium
scale enterprises and 4.21 per cent from micro enterprises.
Figure 55 MSMEs Contribution to Hotels & Restaurants GDP
Micro
3.94
Small
46.71
Medium
17.33
Micro
4.21
Small
28.1
Medium
8.31
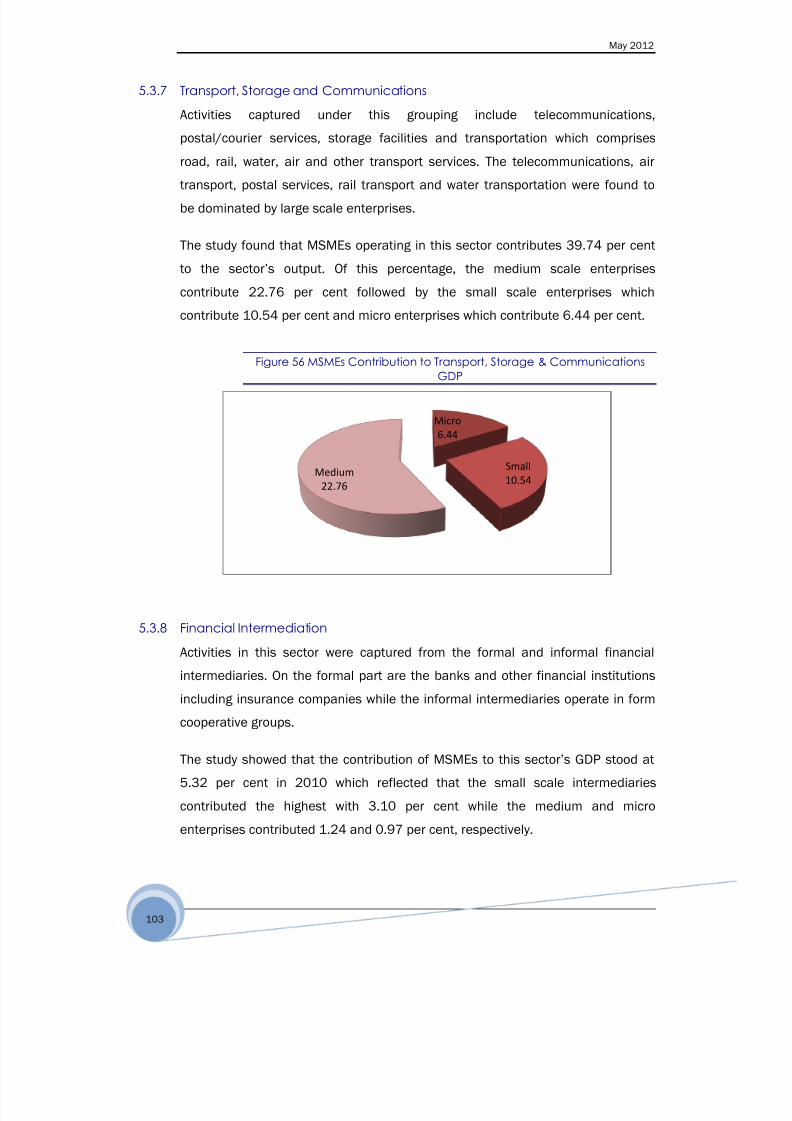
8/22/2019 MICRO, SMALL AND MEDIUM ENTERPRISES SURVEY IN NIGERIA BY SMEDAN
http://slidepdf.com/reader/full/micro-small-and-medium-enterprises-survey-in-nigeria-by-smedan 114/182
May 2012
103
5.3.7 Transport, Storage and Communications
Activities captured under this grouping include telecommunications,
postal/courier services, storage facilities and transportation which comprises
road, rail, water, air and other transport services. The telecommunications, air
transport, postal services, rail transport and water transportation were found to
be dominated by large scale enterprises.
The study found that MSMEs operating in this sector contributes 39.74 per cent
to the sector‟s output. Of this percentage, the medium scale enterprises
contribute 22.76 per cent followed by the small scale enterprises which
contribute 10.54 per cent and micro enterprises which contribute 6.44 per cent.
Figure 56 MSMEs Contribution to Transport, Storage & Communications
GDP
5.3.8 Financial Intermediation
Activities in this sector were captured from the formal and informal financial
intermediaries. On the formal part are the banks and other financial institutionsincluding insurance companies while the informal intermediaries operate in form
cooperative groups.
The study showed that the contribution of MSMEs to this sector‟s GDP stood at
5.32 per cent in 2010 which reflected that the small scale intermediaries
contributed the highest with 3.10 per cent while the medium and micro
enterprises contributed 1.24 and 0.97 per cent, respectively.
Micro
6.44
Small
10.54Medium
22.76

8/22/2019 MICRO, SMALL AND MEDIUM ENTERPRISES SURVEY IN NIGERIA BY SMEDAN
http://slidepdf.com/reader/full/micro-small-and-medium-enterprises-survey-in-nigeria-by-smedan 115/182
May 2012
104
Figure 57 MSMEs Contribution to Financial Intermediation GDP
5.3.9 Real Estate, Renting and Business Activities
The structure of activities in this sector in Nigeria is usually carried out on micro
scale level due to the capital and human resource requirements. Analysis of the
GDP from this sectors showed that MSMEs contribute 99.13 per cent of the total
output from this sector. This dominated by output from micro enterprises which
contributes 80.40 per cent. The data showed that small and medium enterprises
contributed 17.44 and 1.29 per cent, respectively to this sector‟s GDP in 2010.
Figure 58 MSMEs Contribution to Real Estate, Renting & Business ServicesGDP
5.3.10 Education
The micro, small and medium enterprises (MSMEs) operating in this sector were
found to contribute 48.00 per cent of the education sector GDP. A breakdown of
this ratio shows that medium scale enterprises contributed 25.00 per cent, the
Micro
0.97
Small
3.1
Medium
1.24
Micro
80.4
Small
17.44
Medium
1.29

8/22/2019 MICRO, SMALL AND MEDIUM ENTERPRISES SURVEY IN NIGERIA BY SMEDAN
http://slidepdf.com/reader/full/micro-small-and-medium-enterprises-survey-in-nigeria-by-smedan 116/182
May 2012
105
small scale enterprises contributed 15.00 per cent and the micro operators
contributed 8.00 per cent.
Figure 59 MSMEs Contribution to Education Sector GDP
5.3.11 Health and Social Work
The contribution of MSMEs to the total GDP from this sector in 2010 stood at
73.82 per cent which reflected that micro enterprises contributed 23.66 per cent,
small enterprises 24.53 per cent and medium scale enterprises 25.63 per cent.
Figure 60 MSMEs Contribution to Health & Social Work GDP
Micro
8
Small
15
Medium
25
Micro
23.66
Small
24.53
Medium
25.63

8/22/2019 MICRO, SMALL AND MEDIUM ENTERPRISES SURVEY IN NIGERIA BY SMEDAN
http://slidepdf.com/reader/full/micro-small-and-medium-enterprises-survey-in-nigeria-by-smedan 117/182
May 2012
106
5.3.12 Other Community, Social and Personal Services
Activities covered under sector include most informal service oriented activities
such as barbing saloon, hair-dressing, laundry services, etc. This sector is mostly
controlled by micro scale enterprises which contributed 99.94 per cent to the
sector‟s GDP while the small and medium scale enterprises contributed 0.02 per
cent each resulting in total contribution of 99.98 per cent by MSMEs.
Figure 61 MSMEs Contribution to Other Community, Social & Personal
Services Sector GDP
Micro
99.94
Small
0.02
Medium
0.02
8/22/2019 MICRO, SMALL AND MEDIUM ENTERPRISES SURVEY IN NIGERIA BY SMEDAN
http://slidepdf.com/reader/full/micro-small-and-medium-enterprises-survey-in-nigeria-by-smedan 118/182
May 2012
107
6 KEY FINDINGS, CONCLUSIONS AND POLICY RECOMMENDATIONS
6.1 Key Findings
The key findings as revealed in the 2010 National MSME Survey are as follows:
1. INITIAL START-UP CAPITAL.
The result of the survey shows that the initial start – up capital of micro
enterprises were predominantly less than fifty thousand Naira (81%). While Small
and Medium enterprises were predominantly less than ten Million Naira,
constituting 83.2%.
2. TOTAL NUMBER OF ENTERPRISES
The total number of micro enterprises stood at 17,261,753, Small 21,264 and
Medium 1,654, totaling 17,284,671.
3. TOTAL NUMBER OF ENTERPRISES BY SECTOR
The result of the survey revealed that for small and medium enterprises,
manufacturing sector has the highest number of enterprises, comprising 5,939
small enterprises and 713 medium enterprises, totalling 6,652 enterprises. The
lowest number of 134 small enterprises and 33 medium enterprises, totalling
167 enterprises comes from Mining and Quarrying. But for micro enterprises,
wholesale/retail trades, repair of motor vehicles and household goods had the
highest record of enterprises (53.2%), while health and social work had the lowest
figure of 0.1%.
4. TOTAL NUMBER OF ENTERPRISES BY STATE
The survey result showed that Lagos State has the highest number of small and
medium enterprises, comprising 4,146 small enterprises and 389 medium
enterprises, totalling 4,535 enterprises.The lowest number of enterprises is recorded in Bayelsa State with 134 small
enterprises and zero medium enterprise. In terms of micro enterprises, Lagos
state had the highest figure of 880,805 enterprises, followed by Kano (872,552
enterprises), while Abuja (FCT) had the lowest record of (272,579 enterprises).
5. THE MAIN CHALLENGES CONFRONTING THE OPERATIONS OF MSMEs IN
NIGERIA.
The main challenges and constraints confronting the operations of MSMEs in
Nigeria were ranked in order of severity as lack of access to finance, weak

8/22/2019 MICRO, SMALL AND MEDIUM ENTERPRISES SURVEY IN NIGERIA BY SMEDAN
http://slidepdf.com/reader/full/micro-small-and-medium-enterprises-survey-in-nigeria-by-smedan 119/182
May 2012
108
infrastructure and inconsistency of government policies, lack of work space, and
multiple taxation.
6. MSMEs CONTRIBUTION TO EMPLOYMENT
The survey reveals that, a total of 32,414,884 persons were employed by the
sector as at December 2010. This consists of 39,478 persons in the small and
medium enterprises, representing 22,139 males (56.1 percent) and 17,339
females (43.9 percent). The micro enterprises employed 32,375,406, comprising
18,662,943 males and 13,712,463 females representing 57.65 percent and
42.35 percent respectively.
7. OWNERSHIP STRUCTURE BY GENDER
The female entrepreneurs accounted for 42.1% in the ownership structure as
against 57.9% for male in micro enterprises. While female accounts for 13.57%
as against 86.43% for male in the Small and Medium Enterprises.
8. OWNERSHIP STRUCTURE BY AGE.
The Age bracket of 36-50years dominates, accounting for 41.6% as against
27.9% for 26-35 years and 6.6% below 25 years of age in the micro enterprises
category. In the small and medium enterprises category, 36 -50 years of age also
dominates, accounting for 43.6% as against of 13.40% for under 36 years of age.
9. SKILLS GAP BY SECTOR
Qualified artisans are predominantly readily available in the education sector
(66.9%), followed by Health and Social sector (65.9%) and transport, storage and
communication sector (56.9%) in the micro enterprises. In the Small and Medium
enterprises, qualified artisans not readily available stood at 46.1%, 40%, 32.0%,
and 30.2% for education, agriculture, Manufacturing and Building/Construction
respectively.
10. CAPACITY UTILIZATION
The average capacity utilization in manufacturing sector is 56.4%, while the
average in mining and quarrying sector is 49.6%. The mining and quarrying
sector is operating below optimum capacity.
11. PRIORITY AREAS OF ASSISTANCE
The survey revealed three priority areas of assistance to MSMEs as Access to
finance, provision of infrastructure (roads, market, and workspace) adequate and
regular power and water supply.

8/22/2019 MICRO, SMALL AND MEDIUM ENTERPRISES SURVEY IN NIGERIA BY SMEDAN
http://slidepdf.com/reader/full/micro-small-and-medium-enterprises-survey-in-nigeria-by-smedan 120/182
May 2012
109
12. OWNERSHIP OF PATENT RIGHTs
About 94.7% of the micro enterprise do not have patent right .Hence their
intellectual property are not protected. In the small and Medium enterprises
category about 64.1% do not have patent right too. They are also ignorant of the
availability of patent information, such patent information will advance and
improve their process and produce know-how making them to be globally
competitive.
13. BUSINESS INSURANCE OF MSMEs
Only 42.5% of the Small and Medium enterprises are insured, leaving 57.5% as
uninsured. In the micro enterprises, about 98.5% are not insured.
14. MEMBERSHIP OF ASSOCIATIONS
In the small and medium enterprises about 61.0% do not belong to any
association while for micro enterprises, 86.5% do not belong to any association.
15. SOURCES OF CAPITAL
The sources of capital for the enterprises are predominantly personal savings,
representing 84.6% for micro enterprises and 54.4% for small and medium
enterprises. Family sources and loan stood at 29.8% and 9.2% respectively for
small and medium enterprises as against 9.2.% and 29.8% for loan and family
sources respectively for micro enterprises.
16. MARKET CHANNEL OF PRODUCTS/SERVICES
The dominant market channel for the enterprises is the same locality, accounting
for 89.8% for micro enterprises and 89.2% for small and medium enterprises.
17. BENEFIACIARY OF SMEDAN SERVICES
Only 2.9% of micro enterprises benefited from SMEDAN services as against 9.5%
of Small and Medium enterprises within the period under review.
18. AWARENESS OF SMEDAN
About 5% of the micro enterprises are aware of SMEDAN, while 45.5% of the
Small and Medium enterprises are also aware of SMEDAN .In some states ,the
awareness of SMEDAN is very embarrassing recording 100% of non-awareness.
19. BUSINESS REGISTRATION
About 95.3% of the micro enterprises are not registered, while 19.22% of the
small and medium enterprises are not registered. This calls for mainstreaming the
informal economy into the formal assistance and intervention.

8/22/2019 MICRO, SMALL AND MEDIUM ENTERPRISES SURVEY IN NIGERIA BY SMEDAN
http://slidepdf.com/reader/full/micro-small-and-medium-enterprises-survey-in-nigeria-by-smedan 121/182
May 2012
110
20. BUSINESS TURNOVER
82.8% of micro enterprises had turnover below N50, 000.00 in 2009 as against
76.7% percent in 2010, reflecting an improvement of 6.1%. Business turnover of
between N50, 000.00 and N1000, 000.00 stood at 11.3% and 14.0% in 2009
and 2010 respectively, representing an increase of 2.7%. While in the small and
medium enterprises, the business turnover of below six million stood at 51.7%
and 78.7% in 2009 and 2010 respectively, an indication of a better performance
of 27% when compared. Turnover of between 6-15 million naira witnessed an
improvement in 2010, representing 14.7% and 7.4% in 2009 and 2010
respectively.
21. PREPARATION OF BUSINESS PLAN
21.76% of the small and medium enterprises do not prepared business plan,
while 55.5% of micro enterprises operate without a business plan.
22. MSMEs CONTRIBUTION TO THE GROSS DOMESTIC PRODUCT(GDP)
The survey reveals that MSMEs contributed 46.54 percent to the GDP in nominal
terms as at December 2010. However, other community, social and personal
services, real estate, renting and business activities and agricultural activities
recorded the highest, representing 99.98 percent, 99.13 percent and 98.01
percent respectively. While building, construction and financial intermediation
recorded the lowest, representing 10.76 percent and 5.32 percent respectively.
6.2 Conclusion
The survey covered Micro, Small and Medium enterprises employing 1-199
persons. The Micro aspect of the survey covered enterprises employing 1-9
person(s) and it is classified as informal sector. The formal sector (Small and
Medium) covered enterprises engaging 10-199 persons.
The survey generated a lot of data and the result is no doubt revealing,
considering the key findings. Micro enterprises dominated with highest number of
enterprises, while Small and Medium enterprises result showed strong correlation
in the number of enterprises recorded in states like Lagos, Kano to mention but
few.
The immense financial assistance received from the Small and Medium
Enterprise Development Agency of Nigeria (SMEDAN) on the survey did not only
8/22/2019 MICRO, SMALL AND MEDIUM ENTERPRISES SURVEY IN NIGERIA BY SMEDAN
http://slidepdf.com/reader/full/micro-small-and-medium-enterprises-survey-in-nigeria-by-smedan 122/182
May 2012
111
enhanced the capability of the National Bureau of Statistics (NBS) in achieving
high response rate but also gave a lot of credence to the result of the survey. The
calibre of officers used for the exercise accounted for the high achievement.
Adequate publicity was another factor that contributed to the success of the
survey.
On the other hand, the attitude of some enterprises who delayed their
questionnaire or outright refusal is regrettable. The adverse consequences of
these actions are far reaching to the nation in government‟s planning and
transformation programmes for the benefit of the people. The Government
economic programmes and policy formulation cannot be meaningfully achieved
without reliable data on Micro, Small and Medium Enterprises (MSMEs) in Nigeria.
This baseline survey report which is the first in its series has presented a vivid
statistical report on Micro, Small and Medium Enterprises (MSMEs) activities in
Nigeria in the year 2010. It has revealed relevant statistics on MSMEs. activities.
The report also presents the contribution of MSMEs to the nation‟s Gross
Domestic Product (GDP). It is expected that useful policy would emerge from the
major findings of this survey. The recommendations made in this report will assist
policy-makers in Nigeria in their ploy to move the economy forward.
Finally, this survey should be sustained in order to have series on economic
indicators.
6.3 Policy Recommendations
1. A proactive strategy is necessary to address the 6 key constraints faced by
thesector:
• Access to finance
• Weak infrastructure
• Inconsistency of Government Policies
• Lack of work space
• Multiple taxation
• Obsolete technology
2. There is an urgent need for renewal and upgrading of MSMEs
infrastructure located in the existing Industrial Development Centres through

8/22/2019 MICRO, SMALL AND MEDIUM ENTERPRISES SURVEY IN NIGERIA BY SMEDAN
http://slidepdf.com/reader/full/micro-small-and-medium-enterprises-survey-in-nigeria-by-smedan 123/182
May 2012
112
cluster development approach. The development process needs to be
implemented properly and should be strengthened with ample work space and
provision of cluster common infrastructure to enhance their productivity.
3. MSMEs generally lack the understanding and ability to determine the
competencies that are required by an employee to fulfil his/her role. These skill
gaps exist in all the sectors. MSMEs will need to invest in training and
development that leads to skill development and job enhancement. Government
through SMEDAN should strive to provide a solution to the skill gaps in the MSME
sub-sector. This makes the issue of capacity building an important area to focus
upon. The building of new and renovation of existing technical colleges is highly
advised.
4. The competitiveness of any economy depends on how efficient all the
resources in the process of production are utilized and how efficient these are
marketed, hence the entire chain of production has to be efficient. This means
that the process of production has to be cost efficient and meets quality needs of
the consumers. The operational cost of MSMEs should be addressed towards
attaining cost efficiency through the use of latest technology. The issue of power
outages and other basic infrastructure such as access roads and transportation
should also be addressed.
5. Most of the MSMEs do not have patent right and their intellectual property
are not protected. The Ministry of Trade and Investment, SMEDAN and NOTAP
should assist the MSMEs in this regard by setting up an intellectual property
facilitation cell, which will provide a range of intellectual property related services,
such as prior art search, patent landscape and interface for technology transfer.
6. SMEDAN services to MSMEs should be restructured for positive impact.
The Agency should be able to provide a wide spectrum of technical services to the
MSMEs. These should include common facilities for testing, tool room services,
technology up-gradation, modernization, quality improvement, training for
entrepreneurship development, a number of training for skill up-gradation,
preparation of project and product profiles, technical and managerial consultancy,
8/22/2019 MICRO, SMALL AND MEDIUM ENTERPRISES SURVEY IN NIGERIA BY SMEDAN
http://slidepdf.com/reader/full/micro-small-and-medium-enterprises-survey-in-nigeria-by-smedan 124/182
May 2012
113
assistance for exports and advocacy to government on issues affecting MSMEs in
Nigeria.
7. On access to finance by MSMEs, SMEDAN should critically address this
constraint by evolving a Credit Rating Scheme and Credit Guarantee Scheme for
the sub-sector. This will make financing the sub sector attractive to banks and
other investors.
8. Awareness/information dissemination of SMEDAN and SMEDAN activities
are very poor as revealed by the survey. The current knowledge dissemination
system is limited in its outreach. There is a need to develop a better
communication strategy and use of new age media tools.
9. Most of the MSMEs are not registered. Hence, creating a huge informal
economy with its adverse implication on Government policies and programmes.
SMEDAN should strive to mainstream these huge informal enterprises to the
formal economy.
10. Most of the sectors are operating below optimum capacity. SMEDAN
should endeavour to enhance their capacity.

8/22/2019 MICRO, SMALL AND MEDIUM ENTERPRISES SURVEY IN NIGERIA BY SMEDAN
http://slidepdf.com/reader/full/micro-small-and-medium-enterprises-survey-in-nigeria-by-smedan 125/182
May 2012
114
Appendix
Table 1 Summary of the Activities on Information, Advisory Services and
Sensitization at the Head Office & Other Centres for the Year 2010
LOCATION 1ST QUARTER 2ND QUARTER 3RD QUARTER 4TH QUARTER TOTAL
Head Office 152 255 159 169 735
BSCs 444 423 182 338 1,387
BICs 49 65 212 47 373
Other States 10,262 2,404 415 14,417 27,498
Total 10,907 3,147 968 14,971 29,993
Table 2 Distribution of Workload and Fieldstaff by Zone and State for
Informal and Formal Components of the Survey
N ZONE STATE NO. Of EAs to
be covered
NO. HH
Enterprises to
be covered
No.
Interviewers for
Informal (HH
Enterprises)
No. Of
Supervisors for
Informal (HH
Enterprises)
No. Of
Establishm
ent to be
covered
No. Of
Intervie
wer for
Formal
No. Of
Supervis
ors for
formal
North Central Plateau
Benue
Nasarawa
Kogi
Kwara
Niger
FCT Abuja
30
30
30
30
30
30
30
300
300
300
300
300
300
300
4
4
4
4
4
4
4
2
2
2
2
2
2
2
142
54
63
58
51
76
124
7
3
3
3
3
4
6
1
1
1
1
1
1
1
Sub-Total 210 2100 28 14 568 29 7
North.
East
Borno
Yobe
Bauchi
Adamawa
Gombe
Taraba
30
30
30
30
30
30
300
300
300
300
300
300
4
4
4
4
4
4
2
2
2
2
2
2
29
29
89
40
55
37
1
1
4
2
3
2
-
-
1
1
1
1
Sub-Total 180 1800 24 12 279 13 4
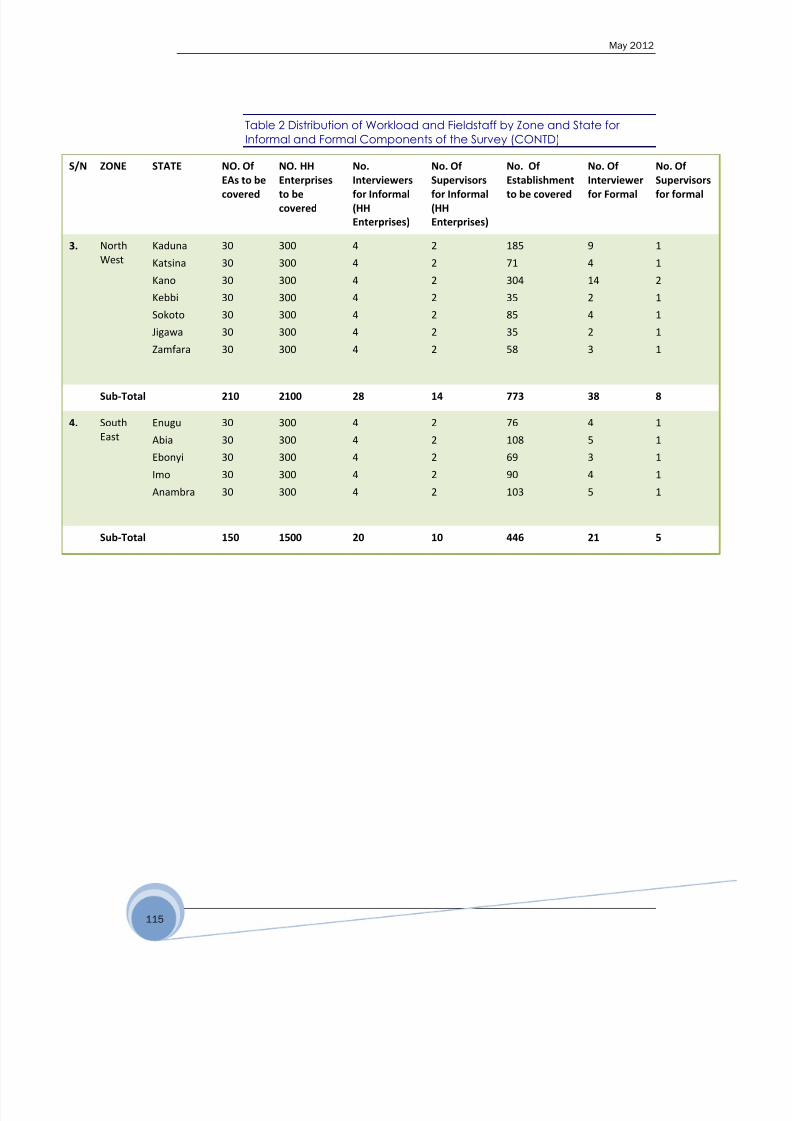
8/22/2019 MICRO, SMALL AND MEDIUM ENTERPRISES SURVEY IN NIGERIA BY SMEDAN
http://slidepdf.com/reader/full/micro-small-and-medium-enterprises-survey-in-nigeria-by-smedan 126/182
May 2012
115
Table 2 Distribution of Workload and Fieldstaff by Zone and State for
Informal and Formal Components of the Survey (CONTD)
/N ZONE STATE NO. OfEAs to be
covered
NO. HHEnterprises
to be
covered
No.Interviewers
for Informal
(HH
Enterprises)
No. OfSupervisors
for Informal
(HH
Enterprises)
No. OfEstablishment
to be covered
No. OfInterviewer
for Formal
No. OfSupervisors
for formal
. North
West
Kaduna
Katsina
Kano
Kebbi
Sokoto
Jigawa
Zamfara
30
30
30
30
30
30
30
300
300
300
300
300
300
300
4
4
4
4
4
4
4
2
2
2
2
2
2
2
185
71
304
35
85
35
58
9
4
14
2
4
2
3
1
1
2
1
1
1
1
Sub-Total 210 2100 28 14 773 38 8
. South
East
Enugu
Abia
Ebonyi
Imo
Anambra
30
30
30
30
30
300
300
300
300
300
4
4
4
4
4
2
2
2
2
2
76
108
69
90
103
4
5
3
4
5
1
1
1
1
1
Sub-Total 150 1500 20 10 446 21 5

8/22/2019 MICRO, SMALL AND MEDIUM ENTERPRISES SURVEY IN NIGERIA BY SMEDAN
http://slidepdf.com/reader/full/micro-small-and-medium-enterprises-survey-in-nigeria-by-smedan 127/182
May 2012
116
Table 2 Distribution of Workload and Fieldstaff by Zone and State for
Informal and Formal Components of the Survey (CONTD)
S/N ZONE STATE No. of EAs
to be
covered
NO. HH
Enterprises
to be
covered
No.
Interviewers
for Informal
(HH
Enterprises)
No. Of
Supervisors
for Informal
(HH
Enterprises)
No. Of
Establishment to
be covered
No. Of
Interviewer
for Formal
No. Of
Supervisors
For formal
5. South-
South
C/River
A/Ibom
Rivers
Bayelsa
Delta
Edo
30
30
30
30
30
30
300
300
300
300
300
300
4
4
4
4
4
4
2
2
2
2
2
2
67
55
148
20
100
180
3
3
7
1
5
9
1
1
1
-
1
1
Sub-Total 180 1800 24 12 570 28 5
6. South
West
Oyo
Ondo
Osun
Lagos
Ekiti
Ogun
30
30
30
30
30
30
300
300
300
300
300
300
4
4
4
4
4
4
2
2
2
2
2
2
213
92
74
830
41
114
11
5
4
43
2
6
1
1
1
6
1
1
Sub-Total 180 1800 24 12 1364 71 11
Grand Total 1,110 11,100 148 74 4,000 200 40

8/22/2019 MICRO, SMALL AND MEDIUM ENTERPRISES SURVEY IN NIGERIA BY SMEDAN
http://slidepdf.com/reader/full/micro-small-and-medium-enterprises-survey-in-nigeria-by-smedan 128/182
May 2012
117
Table 3 Number of Small and Medium Enterprises by State
STATE Employment Size Band
TOTAL0 - 49 50 - 199
Number Percentage Number Percentage
Abia 526 98.62 7 1.38 534
Adamawa 235 95.58 11 4.42 245Akwa Ibom 275 87.48 39 12.52 315Anambra 656 89.01 81 10.99 737Bauchi 497 91.02 49 8.98 545Bayelsa 134 100.00 0 0.00 134
Benue 357 95.63 16 4.37 374Borno 131 77.95 37 22.05 168Cross River 318 87.02 47 12.98 365
23`Delta 576 94.64 33 5.36 608Ebonyi 232 94.99 12 5.01 244Edo 899 96.83 29 3.17 929Ekiti 280 98.41 5 1.59 285Enugu 402 93.03 30 6.97 432
Gombe 225 88.02 31 11.98 255Imo 534 92.97 40 7.03 574Jigawa 217 93.81 14 6.19 231Kaduna 1,137 88.72 145 11.28 1,282Kano 1,740 96.21 69 3.79 1,808Katsina 464 86.86 70 13.14 535Kebbi 221 95.13 11 4.87 232Kogi 328 96.67 11 3.33 340Kwara 415 93.66 28 6.34 443Lagos 4,146 91.43 389 8.57 4,535Nassarawa 387 92.43 32 7.57 418Niger 433 90.48 46 9.52 478Ogun 506 92.73 40 7.27 546
Ondo 596 97.13 18 2.87 614Osun 100 100.00 0 0.00 100Oyo 1,300 93.26 94 6.74 1,394Plateau 613 92.56 49 7.44 663Rivers 662 91.65 60 8.35 723
Sokoto 562 96.68 19 3.32 581
Taraba 242 97.80 5 2.20 247 Yobe 150 96.50 5 3.50 156Zamfara 341 100.00 0 0.00 341FCT 427 84.17 80 15.83 507TOTAL 21,264 92.78 1,654 7.22 22,918
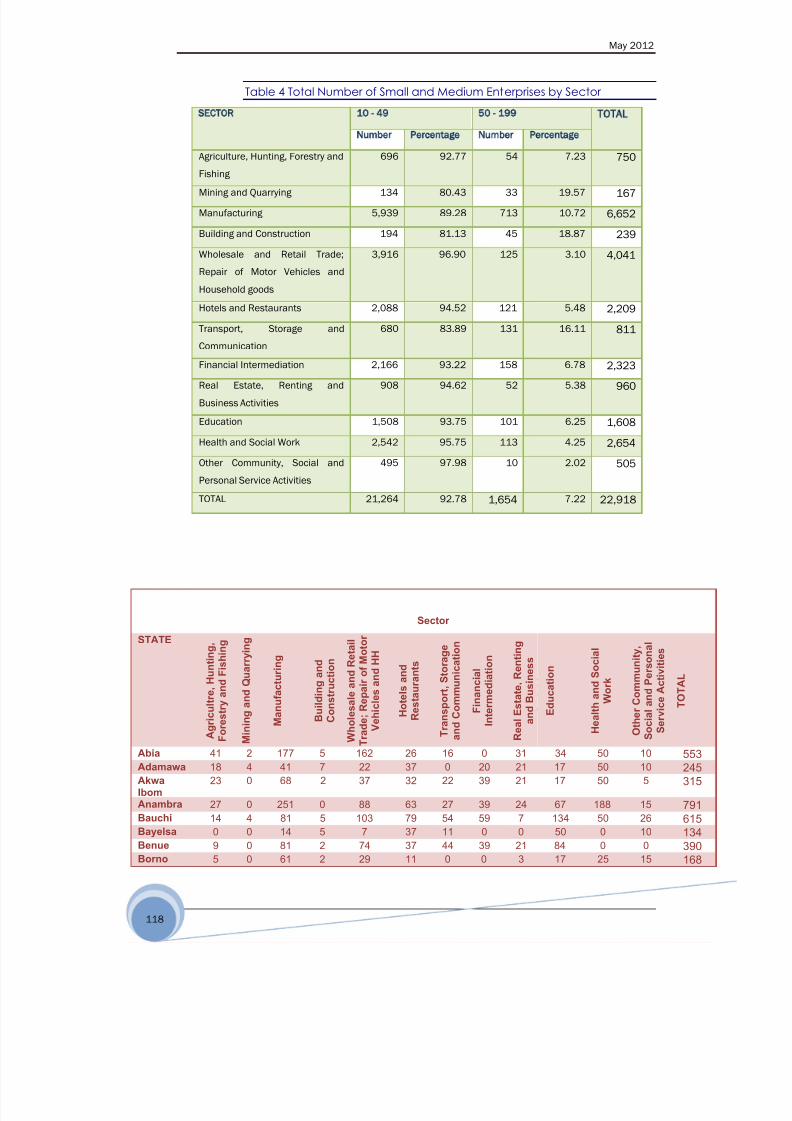
8/22/2019 MICRO, SMALL AND MEDIUM ENTERPRISES SURVEY IN NIGERIA BY SMEDAN
http://slidepdf.com/reader/full/micro-small-and-medium-enterprises-survey-in-nigeria-by-smedan 129/182
May 2012
118
Table 4 Total Number of Small and Medium Enterprises by Sector
SECTOR 10 - 49 50 - 199 TOTAL
Number Percentage Number Percentage
Agriculture, Hunting, Forestry and
Fishing
696 92.77 54 7.23 750
Mining and Quarrying 134 80.43 33 19.57 167
Manufacturing 5,939 89.28 713 10.72 6,652
Building and Construction 194 81.13 45 18.87 239
Wholesale and Retail Trade;
Repair of Motor Vehicles and
Household goods
3,916 96.90 125 3.10 4,041
Hotels and Restaurants 2,088 94.52 121 5.48 2,209
Transport, Storage and
Communication
680 83.89 131 16.11 811
Financial Intermediation 2,166 93.22 158 6.78 2,323
Real Estate, Renting and
Business Activities
908 94.62 52 5.38 960
Education 1,508 93.75 101 6.25 1,608
Health and Social Work 2,542 95.75 113 4.25 2,654
Other Community, Social and
Personal Service Activities
495 97.98 10 2.02 505
TOTAL 21,264 92.78 1,654 7.22 22,918
Sector
STATE
A g r i c u l t r e , H
u n t i n g ,
F o r e s t r y a n d
F i s h i n g
M i n i n g a n d Q u a r r y i n g
M a n u f a c t u
r i n g
B u i l d i n g a n d
C o n s t r u c
t i o n
W h o l e s a l e a n
d R e t a i l
T r a d e ; R e p a i r
o f M o t o r
V e h i c l e s a n
d H H
H o t e l s a
n d
R e s t a u r a
n t s
T r a n s p o r t , S
t o r a g e
a n d C o m m u n
i c a t i o n
F i n a n c i a l
I n t e r m e d i a t i o n
R e a l E s t a t e , R e n t i n g
a n d B u s i n
e s s
E d u c a t i o n
H e a l t h a n d S o c i a l
W o r k
O t h e r C o m m
u n i t y ,
S o c i a l a n d P e r s o n a l
S e r v i c e A c t
i v i t i e s
T O T A L
Abia 41 2 177 5 162 26 16 0 31 34 50 10 553Adamawa 18 4 41 7 22 37 0 20 21 17 50 10 245AkwaIbom
23 0 68 2 37 32 22 39 21 17 50 5 315
Anambra 27 0 251 0 88 63 27 39 24 67 188 15 791Bauchi 14 4 81 5 103 79 54 59 7 134 50 26 615Bayelsa 0 0 14 5 7 37 11 0 0 50 0 10 134
Benue 9 0 81 2 74 37 44 39 21 84 0 0 390Borno 5 0 61 2 29 11 0 0 3 17 25 15 168

8/22/2019 MICRO, SMALL AND MEDIUM ENTERPRISES SURVEY IN NIGERIA BY SMEDAN
http://slidepdf.com/reader/full/micro-small-and-medium-enterprises-survey-in-nigeria-by-smedan 130/182
May 2012
119
Table 5 Number of Enterprise by State and Sector
Table 6 Initial Start-Up Capital
Total Capital (N Million) No. of Enterprises Percentage
Below 10 17,199 83.2
10 – 20 1,441 7.0
21 – 30 414 2.0
31 – 40 147 0.7
41 – 50 358 1.7
Above 50 1,120 5.4
TOTAL 20,679 100.0
Cross
River9 5 81 2 59 63 11 39 10 17 88 10 395
Delta 41 0 109 2 74 79 16 158 14 50 100 5 647Ebonyi 14 13 75 0 44 21 16 20 10 34 0 41 287Edo 14 56 224 9 125 126 49 158 38 17 138 20 973Ekiti 14 0 95 0 59 11 0 20 7 50 25 5 285
Enugu 50 2 34 11 88 47 27 59 21 34 75 0 448Gombe 32 24 54 9 74 16 5 20 17 0 0 5 255Imo 27 2 88 5 96 47 27 79 52 34 125 10 591Jigawa 9 0 102 5 15 21 16 0 0 34 25 5 231Kaduna 45 2 272 29 287 116 33 177 76 34 200 26 1,295Kano 45 9 978 11 427 121 60 0 45 17 50 66 1,829Katsina 32 0 143 7 132 47 71 20 17 67 0 10 546Kebbi 27 0 68 2 81 37 0 0 7 0 25 0 247Kogi 18 0 88 0 22 53 11 79 17 0 63 0 350Kwara 5 0 68 5 59 26 33 177 24 50 0 0 446Lagos 72 9 1,195 36 545 295 71 335 200 452 526 128 3,862Nassarawa 23 5 143 2 118 42 0 39 10 0 50 0 432Niger 5 0 197 0 66 79 27 20 14 67 13 5 492Ogun 18 2 122 2 81 58 5 98 14 34 113 46 593Ondo 5 4 149 7 140 68 11 98 31 0 113 20 646Osun 0 0 68 0 22 0 0 0 10 0 0 0 100Oyo 32 7 272 20 294 121 54 177 110 117 200 61 1,467Plateau 0 16 20 11 155 142 5 39 28 50 175 20 663Rivers 5 0 156 18 140 95 27 138 10 34 100 15 738Sokoto 18 4 170 11 191 37 11 59 10 34 50 5 600Taraba 14 0 75 0 22 16 5 20 0 34 63 0 247
Yobe 14 0 34 0 22 26 16 39 3 0 0 5 160Zamfara 45 0 81 5 169 11 27 20 10 0 0 0 368FCT 5 0 75 2 81 132 27 39 55 34 38 26 512TOTAL 768 168 6,009 239 4,210 2,272 838 2,323 987 1,709 2,767 627 22,918
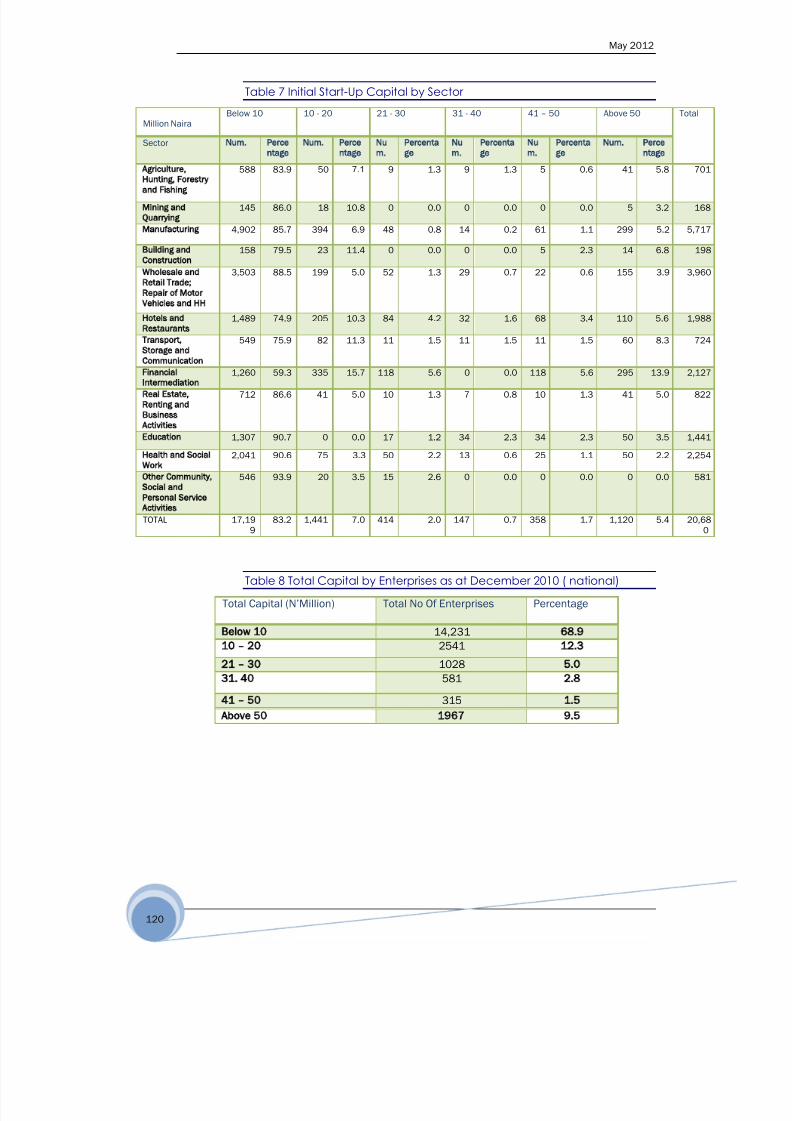
8/22/2019 MICRO, SMALL AND MEDIUM ENTERPRISES SURVEY IN NIGERIA BY SMEDAN
http://slidepdf.com/reader/full/micro-small-and-medium-enterprises-survey-in-nigeria-by-smedan 131/182
May 2012
120
Table 7 Initial Start-Up Capital by Sector
Million Naira
Below 10 10 - 20 21 - 30 31 - 40 41 – 50 Above 50 Total
Sector Num. Perce
ntage
Num. Perce
ntage
Nu
m.
Percenta
ge
Nu
m.
Percenta
ge
Nu
m.
Percenta
ge
Num. Perce
ntage
Agriculture,Hunting, Forestry
and Fishing
588 83.9 50 7.1 9 1.3 9 1.3 5 0.6 41 5.8 701
Mining and
Quarrying
145 86.0 18 10.8 0 0.0 0 0.0 0 0.0 5 3.2 168
Manufacturing 4,902 85.7 394 6.9 48 0.8 14 0.2 61 1.1 299 5.2 5,717
Building and
Construction
158 79.5 23 11.4 0 0.0 0 0.0 5 2.3 14 6.8 198
Wholesale and
Retail Trade;
Repair of Motor
Vehicles and HH
3,503 88.5 199 5.0 52 1.3 29 0.7 22 0.6 155 3.9 3,960
Hotels and
Restaurants
1,489 74.9 205 10.3 84 4.2 32 1.6 68 3.4 110 5.6 1,988
Transport,Storage and
Communication
549 75.9 82 11.3 11 1.5 11 1.5 11 1.5 60 8.3 724
Financial
Intermediation
1,260 59.3 335 15.7 118 5.6 0 0.0 118 5.6 295 13.9 2,127
Real Estate,
Renting and
Business
Activities
712 86.6 41 5.0 10 1.3 7 0.8 10 1.3 41 5.0 822
Education 1,307 90.7 0 0.0 17 1.2 34 2.3 34 2.3 50 3.5 1,441
Health and Social
Work
2,041 90.6 75 3.3 50 2.2 13 0.6 25 1.1 50 2.2 2,254
Other Community,
Social and
Personal Service
Activities
546 93.9 20 3.5 15 2.6 0 0.0 0 0.0 0 0.0 581
TOTAL 17,199
83.2 1,441 7.0 414 2.0 147 0.7 358 1.7 1,120 5.4 20,680
Table 8 Total Capital by Enterprises as at December 2010 ( national)
Total Capital (N‟Million) Total No Of Enterprises Percentage
Below 10 14,231 68.9
10 – 20 2541 12.3
21 – 30 1028 5.0
31. 40 581 2.8
41 – 50 315 1.5
Above 50 1967 9.5

8/22/2019 MICRO, SMALL AND MEDIUM ENTERPRISES SURVEY IN NIGERIA BY SMEDAN
http://slidepdf.com/reader/full/micro-small-and-medium-enterprises-survey-in-nigeria-by-smedan 132/182
May 2012
121
Table 9 Total Capital by State as at December 2010
Table 10 Total Capital by Sector as at December 2010
Num.
Percent
age Num.
Percent
age Num.
Percent
age Num.
Percent
age Num.
Percent
age Num.
Percent
age
Abia 455 86.7 41 7.8 22 4.2 0 0.0 5 0.9 2 0.4 525
Adamawa 148 63.0 25 10.5 12 4.9 17 7.3 0 0.0 34 14.3 235
Akwa Ibom 187 71.7 5 2.1 7 2.6 0 0.0 0 0.0 61 23.6 261
Anambra 499 63.7 108 13.8 54 6.9 25 3.2 17 2.2 81 10.3 784
Bauchi 361 77.1 12 2.6 12 2.6 20 4.2 7 1.6 56 11.9 468
Bayelsa 88 82.8 8 7.1 0 0.0 5 5.0 5 5.1 0 0.0 106
Benue 274 70.3 47 12.1 11 2.8 11 2.7 20 5.0 28 7.1 390
Borno 97 67.8 16 11.0 17 11.7 14 9.5 0 0.0 0 0.0 143
Cross River 272 74.6 43 11.8 0 0.0 7 1.9 5 1.4 38 10.3 364
Delta 304 53.7 103 18.2 53 9.3 20 3.5 18 3.1 69 12.3 566
Ebonyi 187 73.8 19 7.4 5 2.1 7 2.9 5 1.8 30 12.0 253
Edo 714 74.5 51 5.3 77 8.0 42 4.4 13 1.3 62 6.4 959
Ekiti 141 52.8 74 27.6 28 10.6 20 7.4 0 0.0 5 1.7 267
Enugu 198 60.2 36 11.0 24 7.3 20 6.0 0 0.0 51 15.5 330
Gombe 130 50.9 68 26.5 7 2.9 14 5.3 0 0.0 37 14.4 255
Imo 451 76.2 57 9.6 16 2.7 17 2.8 20 3.3 32 5.3 591
Jigawa 189 81.6 36 15.5 0 0.0 0 0.0 0 0.0 7 2.9 231Kaduna 527 52.9 103 10.4 118 11.8 33 3.3 32 3.2 184 18.5 997
Kano 1,519 87.0 123 7.0 34 1.9 20 1.1 11 0.6 41 2.3 1,746
Katsina 398 73.5 24 4.5 37 6.9 45 8.4 0 0.0 36 6.7 541
Kebbi 186 75.4 29 11.8 0 0.0 5 1.8 11 4.6 16 6.4 247
Kogi 225 66.7 69 20.5 0 0.0 35 10.3 5 1.6 3 1.0 338
Kwara 137 36.2 122 32.2 47 12.4 33 8.8 5 1.4 34 9.1 378
Lagos 2,287 62.1 518 14.1 159 4.3 82 2.2 79 2.1 556 15.1 3,680
Nassarawa 379 90.0 32 7.5 0 0.0 0 0.0 0 0.0 11 2.5 421
Niger 366 85.2 46 10.7 5 1.3 0 0.0 0 0.0 12 2.8 430
Ogun 436 77.8 48 8.5 26 4.7 0 0.0 11 1.9 40 7.1 560
Ondo 435 72.5 104 17.3 7 1.2 14 2.4 7 1.2 32 5.3 600
Osun 87 86.5 7 6.8 0 0.0 0 0.0 0 0.0 7 6.8 100
Oyo 864 77.6 113 10.1 67 6.0 25 2.2 7 0.6 38 3.4 1,113
Plateau 354 55.4 189 29.6 32 5.0 14 2.2 13 2.0 36 5.7 638
Rivers 279 51.3 73 13.3 69 12.8 14 2.5 0 0.0 109 20.1 544Sokoto 399 67.7 44 7.5 29 4.9 14 2.4 8 1.4 95 16.1 589
Taraba 91 48.7 30 15.7 53 28.3 7 3.6 0 0.0 7 3.6 188
Yobe 107 81.1 20 14.9 0 0.0 0 0.0 0 0.0 5 4.0 132
Zamfara 331 91.6 12 3.3 0 0.0 0 0.0 0 0.0 19 5.2 361
FCT 129 39.2 89 27.1 0 0.0 3 1.0 13 3.8 95 28.8 330
TOTAL 14,231 68.9 2,541 12.3 1,028 5.0 581 2.8 315 1.5 1,967 9.5 20,662
31 - 40 41 - 50 Above 50
TOTALSTATE
Below 10 10 - 20 21 - 30
Sector Below 10 10 - 20 21 - 30 31 - 40 41 - 50 Above 50 Total
Num. Percent
age
Num. Perce
ntage
Num. Perce
ntage
Num
.
Percen
tage
Nu
m.
Percenta
ge
Num. Perc
enta
ge
Agriculture,Hunting,Forestry andFishing
520 74.2 59 8.4 27 3.9 18 2.6 18 2.6 59 8.4 701
Mining andQuarrying
130 77.4 16 9.7 5 3.2 11 6.5 2 1.1 4 2.2 168
Manufacturing 4,189 73.4 591 10.3 170 3.0 136 2.4 61 1.1 564 9.9 5,710

8/22/2019 MICRO, SMALL AND MEDIUM ENTERPRISES SURVEY IN NIGERIA BY SMEDAN
http://slidepdf.com/reader/full/micro-small-and-medium-enterprises-survey-in-nigeria-by-smedan 133/182
May 2012
122
Table 11 Ownership Status
Form of Ownership Number Percent
Sole Proprietorship 13,169 57.5
Partnership 1,898 8.3
Private Limited Liability 6,239 27.2
Cooperative 298 1.3
Faith Based Organisation 1,081 4.7
Others 233 1.0
Total 22,918 100.0
Building andConstruction
108 54.5 36 18.2 5 2.3 11 5.7 2 1.1 36 18.2 198
Wholesale andRetail Trade;Repair of MotorVehicles andHH
3,069 77.5 316 8.0 155 3.9 52 1.3 66 1.7 302 7.6 3,960
Hotels andRestaurants
1,241 62.4 352 17.7 79 4.0 68 3.4 63 3.2 184 9.3 1,988
Transport,Storage andCommunication
441 61.8 103 14.5 44 6.1 27 3.8 27 3.8 71 9.9 713
FinancialIntermediation
571 26.9 473 22.2 413 19.4 177 8.3 59 2.8 433 20.4 2,127
Real Estate,Renting andBusinessActivities
612 74.5 100 12.1 17 2.1 14 1.7 3 0.4 76 9.2 822
Education 1,055 73.3 151 10.5 84 5.8 17 1.2 0 0.0 134 9.3 1,441
Health andSocial Work
1,753 77.8 313 13.9 25 1.1 50 2.2 13 0.6 100 4.4 2,254
OtherCommunity,Social andPersonalServiceActivities
541 93.0 31 5.3 5 0.9 0 0.0 0 0.0 5 0.9 581
TOTAL 14,231
68.9 2,541 12.3 1,028 5.0 581 2.8 315 1.5 1,967 9.5 20,662

8/22/2019 MICRO, SMALL AND MEDIUM ENTERPRISES SURVEY IN NIGERIA BY SMEDAN
http://slidepdf.com/reader/full/micro-small-and-medium-enterprises-survey-in-nigeria-by-smedan 134/182
May 2012
123
Table 12 Ownership Status by Sector
Proprietorship
Partnership Private Limited
Liability
Cooperative Religious Organisation Others TOTAL
Num. Percen
tage
Num. Percen
tage
Num. Percen
tage
Num
.
Percen
tage
Num. Perce
ntage
Num. Percen
tage
griculture, Hunting,restry and Fishing
533 4.1 36 1.9 163 2.6 32 10.6 5 0.4 0 0.0 768
ning and Quarrying 98 0.7 16 0.9 40 0.6 13 4.3 0 0.0 2 0.8 168
anufacturing 3,741 28.4 428 22.5 1,630 26.1 61 20.5 122 11.3 27 11.6 6,652
uilding and Construction 86 0.6 32 1.7 115 1.8 7 2.3 0 0.0 0 0.0 239
holesale and Retailade; Repair of Motor
ehicles and HH
2,878 21.9 397 20.9 824 13.2 15 4.9 66 6.1 29 12.6 4,041
otels and Restaurants 1,441 10.9 195 10.3 552 8.9 0 0.0 68 6.3 16 6.8 2,272
ansport, Storage and
ommunication
397 3.0 82 4.3 283 4.5 11 3.7 54 5.0 11 4.7 838
nancial Intermediation 295 2.2 118 6.2 1,556 24.9 118 39.6 177 16.4 59 25.3 2,323
eal Estate, Renting andusiness Activities
516 3.9 127 6.7 303 4.9 7 2.3 17 1.6 17 7.4 987
ducation 1,139 8.6 201 10.6 184 3.0 0 0.0 168 15.5 17 7.2 1,709
ealth and Social Work 1,565 11.9 225 11.9 513 8.2 25 8.4 388 35.9 50 21.5 2,767
her Community, Sociald Personal Servicetivities
479.4 3.6 40.8 2.1 76.5 1.2 10.2 3.4 15.3 1.4 5.1 2.2 627
13,169 100.0 1,898 100.0 6,239 100.0 298 100.0 1,081 100.0 233 100.0 22,918
Table 13 Gender of Owner (Sole Proprietorship)
Sector Male Female Total
Number Percentage Number Percentage
Agriculture, Hunting, Forestry and Fishing 488 92.31 41 7.69 529
Mining and Quarrying 96 98.15 2 1.85 98
Manufacturing 3,565 93.09 265 6.91 3,830
Building and Construction 83 97.37 2 2.63 86
Wholesale and Retail Trade; Repair of MotorVehicles and HH
2,576 89.51 302 10.49 2,878
Hotels and Restaurants 1,099 76.56 337 23.44 1,436
Transport, Storage and Communication 386 97.26 11 2.74 397
Financial Intermediation 256 92.86 20 7.14 276
Real Estate, Renting and Business Activities 468 90.67 48 9.33 516
Education 687 62.12 419 37.88 1,106
Health and Social Work 1,377 89.43 163 10.57 1,540

8/22/2019 MICRO, SMALL AND MEDIUM ENTERPRISES SURVEY IN NIGERIA BY SMEDAN
http://slidepdf.com/reader/full/micro-small-and-medium-enterprises-survey-in-nigeria-by-smedan 135/182
May 2012
124
Other Community, Social and Personal ServiceActivities
301 62.77 179 37.23 479
TOTAL 11,383 86.43 1,787 13.57 13,169
Table 14 Age of Owner (Sole Proprietorship)
Table 15 Highest Qualification Attained by Owner
Form of Ownership Number Percent
No Education
1,179 9.0
Non Formal Education 428 3.2
Primary School 1,347 10.2
Secondary 2,805 21.3
Technical 299 2.3
NCE/ND 1,692 12.8
B.Sc/HND 4,063 30.9
Post-Graduate 1,356 10.3
Total 13,169 100.0
Table 16 Initial Total Assets at Inception
Amount (N'Million) Number Percentage
Below 10 15,776 78.5
10 – 20 1,582 7.9
21 – 30 411 2.0
31 – 40 226 1.1
Age Frequency Percent
Below 20 77 0.6
20 - 25 131 1.0
26 - 35 1,570 11.9
36 - 50 5,742 43.6
51 - 60 3,538 26.9
Above 60 2,112 16.0
Total 13,169 100.0
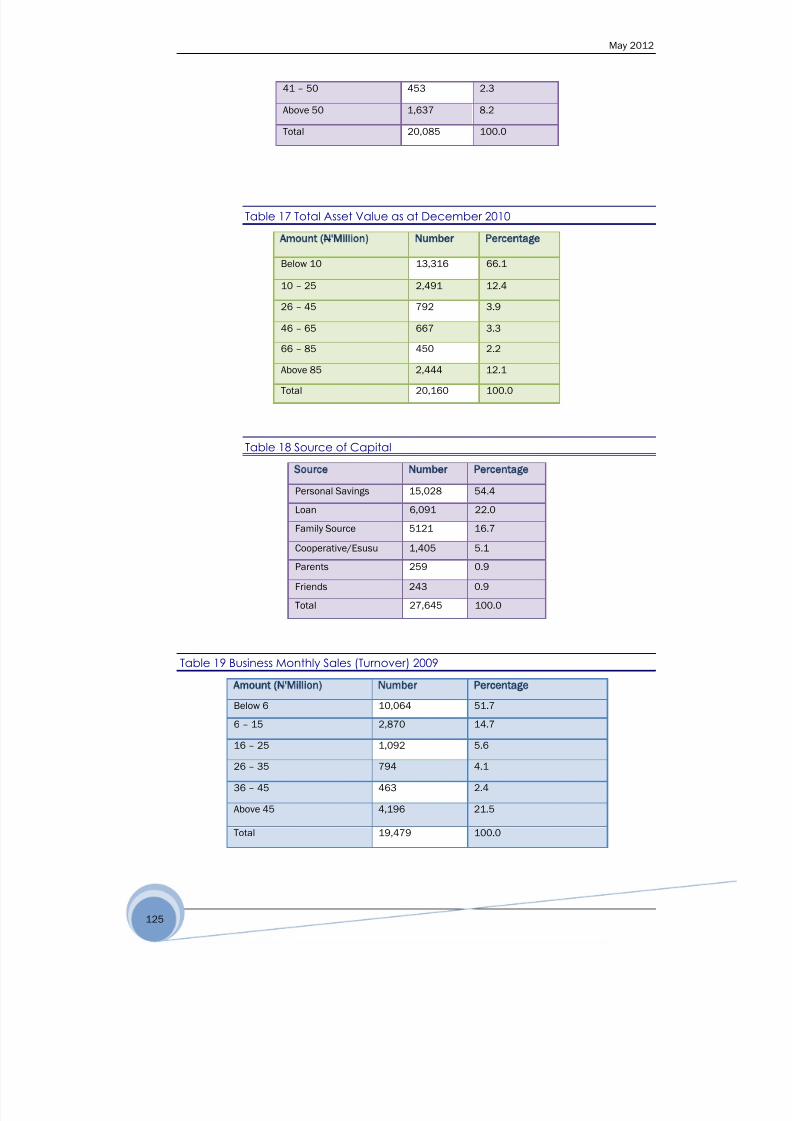
8/22/2019 MICRO, SMALL AND MEDIUM ENTERPRISES SURVEY IN NIGERIA BY SMEDAN
http://slidepdf.com/reader/full/micro-small-and-medium-enterprises-survey-in-nigeria-by-smedan 136/182
May 2012
125
41 – 50 453 2.3
Above 50 1,637 8.2
Total 20,085 100.0
Table 17 Total Asset Value as at December 2010
Amount (N'Million) Number Percentage
Below 10 13,316 66.1
10 – 25 2,491 12.4
26 – 45 792 3.9
46 – 65 667 3.3
66 – 85 450 2.2
Above 85 2,444 12.1
Total 20,160 100.0
Table 18 Source of Capital
Source Number Percentage
Personal Savings 15,028 54.4
Loan 6,091 22.0
Family Source 5121 16.7
Cooperative/Esusu 1,405 5.1
Parents 259 0.9
Friends 243 0.9
Total 27,645 100.0
Table 19 Business Monthly Sales (Turnover) 2009
Amount (N'Million) Number Percentage
Below 6 10,064 51.7
6 – 15 2,870 14.7
16 – 25 1,092 5.6
26 – 35 794 4.1
36 – 45 463 2.4
Above 45 4,196 21.5
Total 19,479 100.0
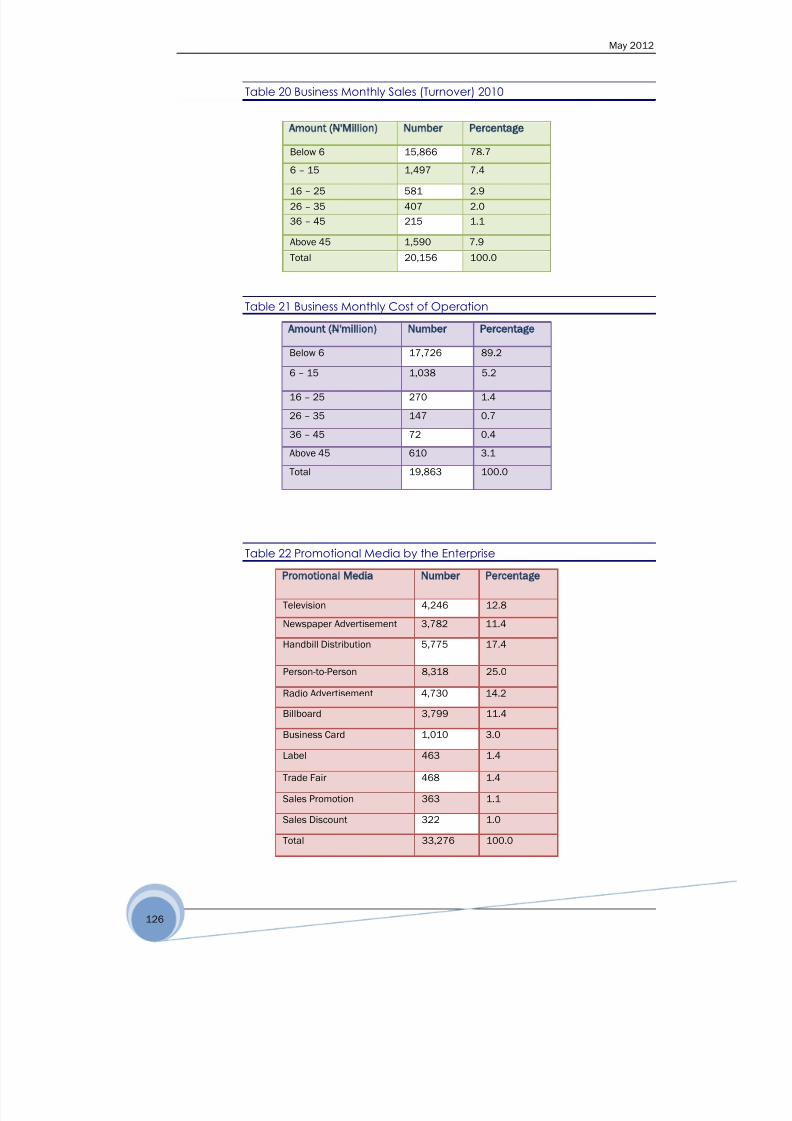
8/22/2019 MICRO, SMALL AND MEDIUM ENTERPRISES SURVEY IN NIGERIA BY SMEDAN
http://slidepdf.com/reader/full/micro-small-and-medium-enterprises-survey-in-nigeria-by-smedan 137/182
May 2012
126
Table 20 Business Monthly Sales (Turnover) 2010
Table 21 Business Monthly Cost of Operation
Amount (N'million) Number Percentage
Below 6 17,726 89.2
6 – 15 1,038 5.2
16 – 25 270 1.4
26 – 35 147 0.7
36 – 45 72 0.4
Above 45 610 3.1
Total 19,863 100.0
Table 22 Promotional Media by the Enterprise
Promotional Media Number Percentage
Television 4,246 12.8
Newspaper Advertisement 3,782 11.4
Handbill Distribution 5,775 17.4
Person-to-Person 8,318 25.0
Radio Advertisement 4,730 14.2
Billboard 3,799 11.4
Business Card 1,010 3.0
Label 463 1.4
Trade Fair 468 1.4
Sales Promotion 363 1.1
Sales Discount 322 1.0
Total 33,276 100.0
Amount (N'Million) Number Percentage
Below 6 15,866 78.7
6 – 15 1,497 7.4
16 – 25 581 2.9
26 – 35 407 2.0
36 – 45 215 1.1
Above 45 1,590 7.9
Total 20,156 100.0

8/22/2019 MICRO, SMALL AND MEDIUM ENTERPRISES SURVEY IN NIGERIA BY SMEDAN
http://slidepdf.com/reader/full/micro-small-and-medium-enterprises-survey-in-nigeria-by-smedan 138/182
May 2012
127
Table 23 Business InsuranceSECTOR INSURED NOT INSURED TOTAL
Number Percentage Number Percentage
Agricultre, Hunting, Forestry and Fishing 235 30.6 533 69.4 768
Mining and Quarrying 36 21.5 132 78.5 168
Manufacturing 2,173 36.2 3,836 63.8 6,009
Building and Construction 108 45.3 131 54.7 239
Wholesale and Retail Trade; Repair of Motor
Vehicles and Household goods
1,369 32.5 2,841 67.5 4,210
Hotels and Restaurants 1,120 49.3 1,152 50.7 2,272
Transport, Storage and Communication 403 48.1 435 51.9 838
Financial Intermediation 1,969 84.7 354 15.3 2,323
Real Estate, Renting and Business Activities 358 36.2 630 63.8 987
Education 553 32.4 1,156 67.6 1,709
Health and Social Work 1,290 46.6 1,477 53.4 2,767
Other Community, Social and Personal Service
Activities
128 20.3 500 79.7 627
TOTAL 9,741 42.5 13,177 57.5 22,918
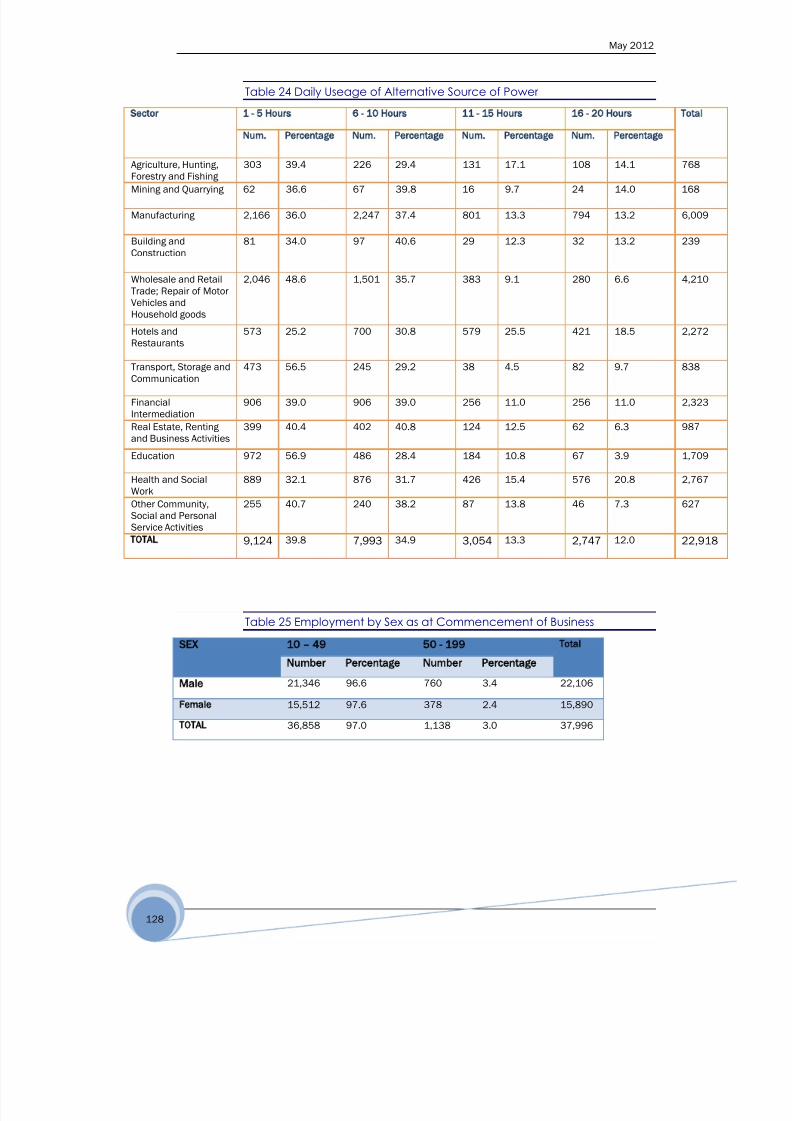
8/22/2019 MICRO, SMALL AND MEDIUM ENTERPRISES SURVEY IN NIGERIA BY SMEDAN
http://slidepdf.com/reader/full/micro-small-and-medium-enterprises-survey-in-nigeria-by-smedan 139/182
May 2012
128
Table 24 Daily Useage of Alternative Source of Power
Sector 1 - 5 Hours 6 - 10 Hours 11 - 15 Hours 16 - 20 Hours Total
Num. Percentage Num. Percentage Num. Percentage Num. Percentage
Agriculture, Hunting,Forestry and Fishing
303 39.4 226 29.4 131 17.1 108 14.1 768
Mining and Quarrying 62 36.6 67 39.8 16 9.7 24 14.0 168
Manufacturing 2,166 36.0 2,247 37.4 801 13.3 794 13.2 6,009
Building andConstruction
81 34.0 97 40.6 29 12.3 32 13.2 239
Wholesale and RetailTrade; Repair of MotorVehicles andHousehold goods
2,046 48.6 1,501 35.7 383 9.1 280 6.6 4,210
Hotels and
Restaurants
573 25.2 700 30.8 579 25.5 421 18.5 2,272
Transport, Storage andCommunication
473 56.5 245 29.2 38 4.5 82 9.7 838
FinancialIntermediation
906 39.0 906 39.0 256 11.0 256 11.0 2,323
Real Estate, Rentingand Business Activities
399 40.4 402 40.8 124 12.5 62 6.3 987
Education 972 56.9 486 28.4 184 10.8 67 3.9 1,709
Health and SocialWork
889 32.1 876 31.7 426 15.4 576 20.8 2,767
Other Community,Social and PersonalService Activities
255 40.7 240 38.2 87 13.8 46 7.3 627
TOTAL 9,124 39.8 7,993 34.9 3,054 13.3 2,747 12.0 22,918
Table 25 Employment by Sex as at Commencement of Business
SEX 10 – 49 50 - 199 Total
Number Percentage Number Percentage
Male 21,346 96.6 760 3.4 22,106
Female 15,512 97.6 378 2.4 15,890
TOTAL 36,858 97.0 1,138 3.0 37,996

8/22/2019 MICRO, SMALL AND MEDIUM ENTERPRISES SURVEY IN NIGERIA BY SMEDAN
http://slidepdf.com/reader/full/micro-small-and-medium-enterprises-survey-in-nigeria-by-smedan 140/182
May 2012
129
Table 26 Employment by Sector as at Commencement
Sector MALE FEMALE Total
10 - 49 50 – 199 Total 10 - 49 50 - 199
Num. Percent
age
Num. Percent
age
Num. Percent
age
Num. Percent
age
Agricultre, Hunting,
Forestry and
Fishing
705 96.9 23 3.1 728 470 96.30 18 3.70 488
Mining and
Quarrying
147 88.0 20 12.0 167 116 95.52 5 4.48 121
Manufacturing 5,534 94.3 333 5.7 5,867 3,198 96.12 129 3.88 3327
Building and
Construction
212 88.7 27 11.3 239 133 100.00 0 0.00 133
Wholesale and
Retail Trade;
Repair of Motor
Vehicles and HH
3,923 97.6 96 2.4 4,019 2,370 98.17 44 1.83 2414
Hotels and
Restaurants
2,172 97.6 53 2.4 2,225 1,936 99.46 11 0.54 1946
Transport, Storage
and
Communication
772 93.4 54 6.6 827 462 95.51 22 4.49 484
Financial
Intermediation
2,225 98.3 39 1.7 2,264 1,851 96.91 59 3.09 1910
Real Estate,
Renting and
Business Activities
932 96.8 31 3.2 963 722 99.06 7 0.94 729
Education 1,625 99.0 17 1.0 1,642 1,508 97.83 34 2.17 1541
Health and Social
Work
2,579 97.6 63 2.4 2,642 2,329 97.89 50 2.11 2379
Other Community,
Social and
Personal Service
Activities
520 99.0 5 1.0 525 418 100.00 0 0.00 418
TOTAL 21,34
6
96.6 760 3.4 22,10
6
15,512 97.62 378 2.38 15891

8/22/2019 MICRO, SMALL AND MEDIUM ENTERPRISES SURVEY IN NIGERIA BY SMEDAN
http://slidepdf.com/reader/full/micro-small-and-medium-enterprises-survey-in-nigeria-by-smedan 141/182
May 2012
130
Table 27 Employment by Sex as at December 2010
SEX 10 – 49 50 - 199 Total
Number Percentage Number Percentage
Male 20,485 92.5 1,654 7.5 22,139
Female 16,326 94.2 1,013 5.8 17,339
TOTAL 36,811 93.2 2,667 6.8 39,478
Table 28 Employment by Sector as December 2010
Sector MALE FEMALE M + F
10 - 49 50 – 199 Total 10 - 49 50– 199 Total
Num. Percent
age
Num. Percent
age
Num. Percentag
e
Num. Percenta
ge
TOTAL
Agriculture,
Hunting, Forestry
and Fishing
696 92.8 54 7.2 750 457 99.02 5 0.98 461 1,211
Mining and
Quarrying
134 80.4 33 19.6 167 121 95.71 5 4.29 127 293
Manufacturing 5,160 87.9 713 12.1 5,873 3,504 91.98 306 8.02 3,809 9,683
Building andConstruction 194 81.1 45 18.9 239 151 94.37 9 5.63 160 398
Wholesale and
Retail Trade;
Repair of Motor
Vehicles and HH
3,916 96.9 125 3.1 4,041 2,635 98.08 52 1.92 2,686 6,727
Hotels and
Restaurants
2,088 94.5 121 5.5 2,209 1,999 96.20 79 3.80 2,078 4,287
Transport,
Storage and
Communication
680 83.9 131 16.1 811 473 93.55 33 6.45 506 1,316
Financial
Intermediation
2,166 93.2 158 6.8 2,323 1,910 91.51 177 8.49 2,087 4,411
Real Estate,
Renting and
BusinessActivities
908 94.6 52 5.4 960 777 98.69 10 1.31 788 1,748
Education 1,508 93.8 101 6.3 1,608 1,524 93.81 101 6.19 1,625 3,233
Health and Social
Work
2,542 95.8 113 4.2 2,654 2,341 90.78 238 9.22 2,579 5,233
Other Community,
Social and
Personal Service
Activities
495 98.0 10 2.0 505 434 100.00 0 0.00 434 938
TOTAL 20,48
5
92.5 1,654 7.5 22,139 16,32
6
94.15 1,013 5.85 17,339 39,478

8/22/2019 MICRO, SMALL AND MEDIUM ENTERPRISES SURVEY IN NIGERIA BY SMEDAN
http://slidepdf.com/reader/full/micro-small-and-medium-enterprises-survey-in-nigeria-by-smedan 142/182
May 2012
131
Table 29 Educational Qualification of Employees
Educational Qualification Number Percentage
Primary School 12,615 16.12
Secondary School 16,944 21.65
Technical 9,151 11.69
NCE/ND 12,884 16.46
BSC/HND 11,954 15.27
Post-Graduate 5,586 7.14
Non-Formal Education 4,770 6.10
No Education 4,359 5.57
TOTAL 78,262 100.0
Table 30 Market Channel of Product(s)
Market Channel Number Percentage
Same Locality 7,944 24.5
Same Town 6,417 19.8
Same State 6,895 21.2
Nigeria Only 7,701 23.7
ECOWAS State 1,234 3.8Africa Only 667 2.1
World Wide 1,625 5.0
TOTAL 32,483 100.0
Table 31 Export of Products/Services
Item Number Percentage
Yes 603 2.63
No 22,315 97.37
Total 22,918 100.00

8/22/2019 MICRO, SMALL AND MEDIUM ENTERPRISES SURVEY IN NIGERIA BY SMEDAN
http://slidepdf.com/reader/full/micro-small-and-medium-enterprises-survey-in-nigeria-by-smedan 143/182
May 2012
132
Table 32 Business Association
Business Association Number Percentage
None 13,975 61.0
Trade Association 4,914 21.4
Professional Association 2,919 12.7
Cooperative Society 545 2.4
Faith Based Organisation 511 2.2
Others 54 0.2
Total 22,918 100.0
Table 33 Business Patent Right by Sector
SECTOR PATENT RIGHT NO PATENT RIGHT TOTAL
Number Percentage Number Percentage
Agriculture, Hunting, Forestry and
Fishing
231 30.0 538 70.0 768
Mining and Quarrying 105 62.4 63 37.6 168
Manufacturing 2,207 36.7 3,802 63.3 6,009
Building and Construction 99 41.5 140 58.5 239
Wholesale and Retail Trade; Repair
of Motor Vehicles and HH
1,340 31.8 2,870 68.2 4,210
Hotels and Restaurants 957 42.1 1,315 57.9 2,272
Transport, Storage and
Communication
316 37.7 522 62.3 838
Financial Intermediation 886 38.1 1,437 61.9 2,323
Real Estate, Renting and Business
Activities
282 28.6 705 71.4 987
Education 486 28.4 1,223 71.6 1,709
Health and Social Work 1,164 42.1 1,603 57.9 2,767
Other Community, Social and
Personal Service Activities
153 24.4 474 75.6 627
TOTAL 8,225 35.9 14,693 64.1 22,918

8/22/2019 MICRO, SMALL AND MEDIUM ENTERPRISES SURVEY IN NIGERIA BY SMEDAN
http://slidepdf.com/reader/full/micro-small-and-medium-enterprises-survey-in-nigeria-by-smedan 144/182
May 2012
133
Table 34 Own Patent Right by Form of Ownership
Form of Ownership PATENT RIGHT NO PATENT RIGHT TOTAL
Number Percent Number Percent
Sole Proprietorship 4,517 34.3 8,652 65.7 13,169
Partnership 854 45.0 1,044 55.0 1,898
Private Limited Liability 2,189 35.1 4,050 64.9 6,239
Cooperative 155 51.9 143 48.1 298
Faith Based Organisation 437 40.5 644 59.5 1,081
Others 73 31.5 160 68.5 233
Total 8,225 35.9 14,693 64.1 22,918
Table 35 Registered Patent Right by Sector
SECTOR PATENT RIGHT NO PATENT RIGHT TOTAL
Number Percentage Number Percentage
Agriculture, Hunting, Forestry and Fishing 231 30.0 538 70.0 768
Mining and Quarrying 105 62.4 63 37.6 168
Manufacturing 2,207 36.7 3,802 63.3 6,009
Building and Construction 99 41.5 140 58.5 239
Wholesale and Retail Trade; Repair of MotorVehicles and HH
1,340 31.8 2,870 68.2 4,210
Hotels and Restaurants 957 42.1 1,315 57.9 2,272
Transport, Storage and Communication 316 37.7 522 62.3 838
Financial Intermediation 886 38.1 1,437 61.9 2,323
Real Estate, Renting and Business Activities 282 28.6 705 71.4 987
Education 486 28.4 1,223 71.6 1,709
Health and Social Work 1,164 42.1 1,603 57.9 2,767
Other Community, Social and Personal ServiceActivities
153 24.4 474 75.6 627
TOTAL 8,225 35.9 14,693 64.1 22,918
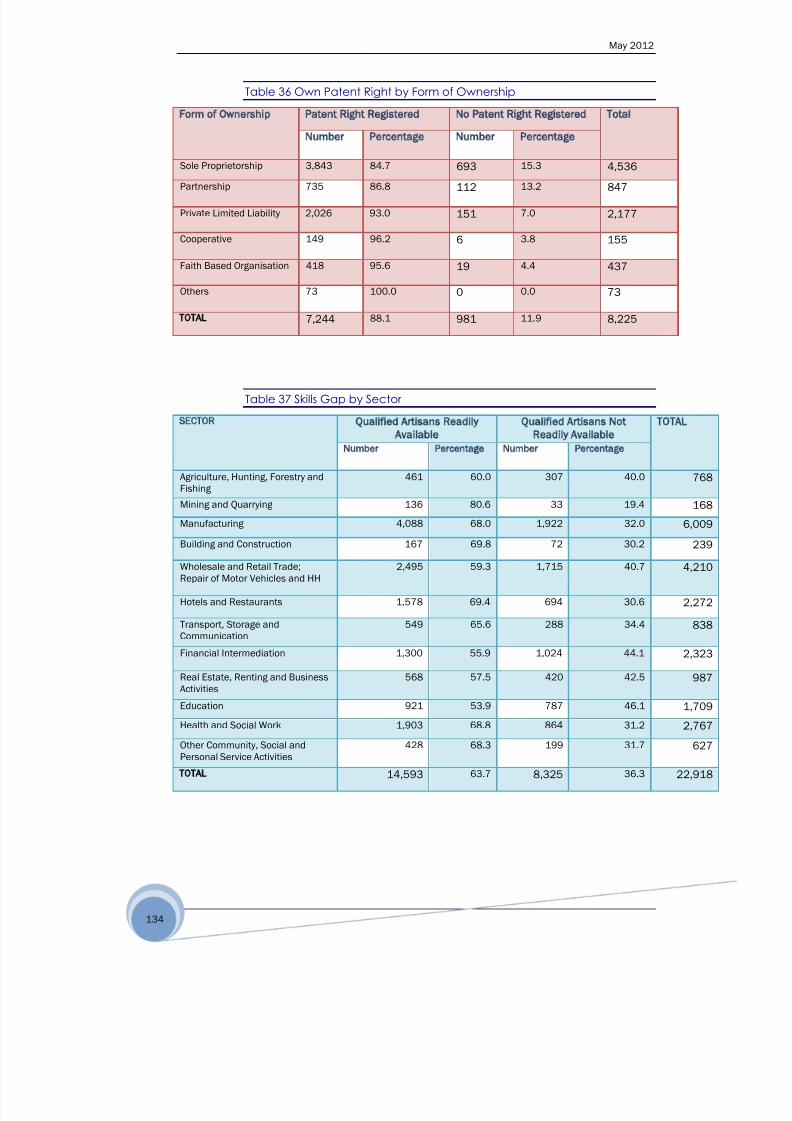
8/22/2019 MICRO, SMALL AND MEDIUM ENTERPRISES SURVEY IN NIGERIA BY SMEDAN
http://slidepdf.com/reader/full/micro-small-and-medium-enterprises-survey-in-nigeria-by-smedan 145/182
May 2012
134
Table 36 Own Patent Right by Form of Ownership
Form of Ownership Patent Right Registered No Patent Right Registered Total
Number Percentage Number Percentage
Sole Proprietorship 3,843 84.7 693 15.3 4,536Partnership 735 86.8 112 13.2 847
Private Limited Liability 2,026 93.0 151 7.0 2,177
Cooperative 149 96.2 6 3.8 155
Faith Based Organisation 418 95.6 19 4.4 437
Others 73 100.0 0 0.0 73
TOTAL 7,244 88.1 981 11.9 8,225
Table 37 Skills Gap by Sector
SECTOR Qualified Artisans Readily
Available
Qualified Artisans Not
Readily Available
TOTAL
Number Percentage Number Percentage
Agriculture, Hunting, Forestry andFishing
461 60.0 307 40.0 768
Mining and Quarrying 136 80.6 33 19.4168
Manufacturing 4,088 68.0 1,922 32.0 6,009
Building and Construction 167 69.8 72 30.2 239
Wholesale and Retail Trade;Repair of Motor Vehicles and HH
2,495 59.3 1,715 40.7 4,210
Hotels and Restaurants 1,578 69.4 694 30.6 2,272
Transport, Storage andCommunication
549 65.6 288 34.4 838
Financial Intermediation 1,300 55.9 1,024 44.1 2,323
Real Estate, Renting and BusinessActivities 568 57.5 420 42.5 987
Education 921 53.9 787 46.1 1,709
Health and Social Work 1,903 68.8 864 31.2 2,767
Other Community, Social andPersonal Service Activities
428 68.3 199 31.7 627
TOTAL 14,593 63.7 8,325 36.3 22,918

8/22/2019 MICRO, SMALL AND MEDIUM ENTERPRISES SURVEY IN NIGERIA BY SMEDAN
http://slidepdf.com/reader/full/micro-small-and-medium-enterprises-survey-in-nigeria-by-smedan 146/182
May 2012
135
Table 38 Skills Gap by Form of Ownership
Form of Ownership Qualified Artisans
Readily Available
Qualified Artisans Not
Readily Available
TOTAL
Number Percent Number Percent
Sole Proprietorship 8,246 62.6 4,923 37.4 13,169
Partnership 1,238 65.2 660 34.8 1,898
Private Limited Liability 4,180 67.0 2,059 33.0 6,239
Cooperative 176 59.0 122 41.0 298
Faith Based Organisation 618 57.1 463 42.9 1,081
Others 136 58.1 98 41.9 233
TOTAL 14,593 63.7 8,325 36.3 22,918
Table 39 Major Government Policy That Affect Businesses Most Favourably
Table 40 Major Government Policy That Affect Businesses Most
Unfavourably
Policy Most Unfavourable Policy
Number Percent
Power supply 2,161 18.50
Policy Most Favourable Policy
Number Percentage
Environment Sanitary 1,307 20.2
Road Maintenance 1,366 21.1
Importation of raw materials 341 5.3
Job creation 189 2.9
Taxation 308 4.8
Exchange rate 167 2.6
Intervention Fund 296 4.6
Power supply 461 7.1
Political stability 726 11.2
Banking reform 282 4.4
Fertilizer production 175 2.7
No Response
853 13.2
Total 6,471 100.0

8/22/2019 MICRO, SMALL AND MEDIUM ENTERPRISES SURVEY IN NIGERIA BY SMEDAN
http://slidepdf.com/reader/full/micro-small-and-medium-enterprises-survey-in-nigeria-by-smedan 147/182
May 2012
136
Taxes 3,922 33.58
Demolition 429 3.67
Traffic Control 218 1.87
Environmental Sanitation 154 1.32
Infrastructure/Social Amenities 922 7.89
Importation of Fuel 892 7.64
Trade Permit 407 3.48Withdrawal of Subsidies 858 7.35
Introduction of Sharia 282 2.42
Poverty Alleviation 213 1.83
Custom Duties 90 0.77
Banning of Importation of goods 160 1.37
Interest Rate 599 5.13
Pension 194 1.66
Embargo on Loan Facilities 178 1.52
Total 11,679 100.00
Table 41 Top Priority Areas of Assistance
Item Number Percentage
Provide financial institutions 2,570 5.7
Adequate transport facilities 3,919 8.7
Adequate and regular power and water supply 7,045 15.6
Reduced rate of taxation 1,483 3.3
Reduced care for medical treatment 649 1.4
Reduced interest rate 927 2.1
Regular fuel supply at approved rate 359 0.8
Financing/Financial assistance 11,151 24.7
Provide farm inputs ((seeding, equipment, fertilizer etc) 3,150 7.0
Facilitate quality product 618 1.4
Provision of infrastructure (access roads, market, work space 8,600 19.0
Provide security 2,131 4.7
Provision of equipment spare parts/raw materials 2,556 5.7
TOTAL 45,159 100.0
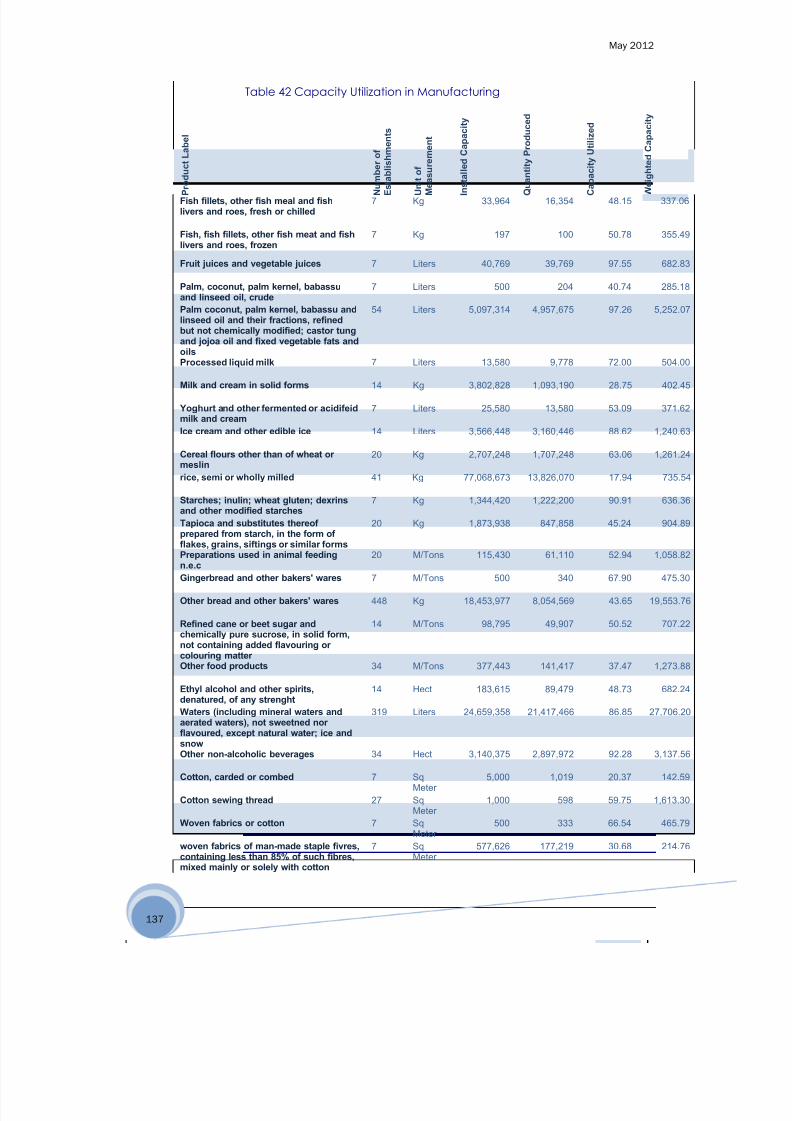
8/22/2019 MICRO, SMALL AND MEDIUM ENTERPRISES SURVEY IN NIGERIA BY SMEDAN
http://slidepdf.com/reader/full/micro-small-and-medium-enterprises-survey-in-nigeria-by-smedan 148/182
May 2012
137
Table 42 Capacity Utilization in Manufacturing
P r o d u c t L a b e l
N u m b e r o f
E s t a b l i s h m e n t s
U n i t o f
M e a s u
r e m e n t
I n s t a l l e d C a p a c i t y
Q u a n t i t y P r o d u c e d
C a p a c i t y U t i l i z e d
W e i g h t e d C a p a c i t y
Fish fillets, other fish meal and fishlivers and roes, fresh or chilled
7 Kg 33,964 16,354 48.15 337.06
Fish, fish fillets, other fish meat and fishlivers and roes, frozen
7 Kg 197 100 50.78 355.49
Fruit juices and vegetable juices 7 Liters 40,769 39,769 97.55 682.83
Palm, coconut, palm kernel, babassuand linseed oil, crude
7 Liters 500 204 40.74 285.18
Palm coconut, palm kernel, babassu andlinseed oil and their fractions, refinedbut not chemically modified; castor tung
and jojoa oil and fixed vegetable fats andoils
54 Liters 5,097,314 4,957,675 97.26 5,252.07
Processed liquid milk 7 Liters 13,580 9,778 72.00 504.00
Milk and cream in solid forms 14 Kg 3,802,828 1,093,190 28.75 402.45
Yoghurt and other fermented or acidifeidmilk and cream
7 Liters 25,580 13,580 53.09 371.62
Ice cream and other edible ice 14 Liters 3,566,448 3,160,446 88.62 1,240.63
Cereal flours other than of wheat ormeslin
20 Kg 2,707,248 1,707,248 63.06 1,261.24
rice, semi or wholly milled 41 Kg 77,068,673 13,826,070 17.94 735.54
Starches; inulin; wheat gluten; dexrins
and other modified starches
7 Kg 1,344,420 1,222,200 90.91 636.36
Tapioca and substitutes thereofprepared from starch, in the form offlakes, grains, siftings or similar forms
20 Kg 1,873,938 847,858 45.24 904.89
Preparations used in animal feedingn.e.c
20 M/Tons 115,430 61,110 52.94 1,058.82
Gingerbread and other bakers' wares 7 M/Tons 500 340 67.90 475.30
Other bread and other bakers' wares 448 Kg 18,453,977 8,054,569 43.65 19,553.76
Refined cane or beet sugar andchemically pure sucrose, in solid form,not containing added flavouring orcolouring matter
14 M/Tons 98,795 49,907 50.52 707.22
Other food products 34 M/Tons 377,443 141,417 37.47 1,273.88
Ethyl alcohol and other spirits,denatured, of any strenght
14 Hect 183,615 89,479 48.73 682.24
Waters (including mineral waters andaerated waters), not sweetned norflavoured, except natural water; ice andsnow
319 Liters 24,659,358 21,417,466 86.85 27,706.20
Other non-alcoholic beverages 34 Hect 3,140,375 2,897,972 92.28 3,137.56
Cotton, carded or combed 7 SqMeter
5,000 1,019 20.37 142.59
Cotton sewing thread 27 SqMeter
1,000 598 59.75 1,613.30
Woven fabrics or cotton 7 SqMeter
500 333 66.54 465.79
woven fabrics of man-made staple fivres,containing less than 85% of such fibres,mixed mainly or solely with cotton
7 SqMeter 577,626 177,219 30.68 214.76

8/22/2019 MICRO, SMALL AND MEDIUM ENTERPRISES SURVEY IN NIGERIA BY SMEDAN
http://slidepdf.com/reader/full/micro-small-and-medium-enterprises-survey-in-nigeria-by-smedan 149/182
May 2012
138
Carpets and other tectle floor coverings,tufted
7 SqMeter
250 197 78.76 551.35
Twine, cordage, rope and cabies 7 SqMeter
219,276 105,123 47.94 335.58
Wearing apparel, of textile fabric, notknitted or crocheted; brassieres,coresets, suspenders and similar
articles, whether or not knitted orcrocheted
95 Pieces 554,139 267,389 48.25 4,584.05
Luggage, handbags and the like, ofleather, composition leather, plasticsheeting, textile materials, vulcanizedfibre or paperboard; travel sets forpersonal toilet sewing or shoe or clothescleaning
14 M/Tons 204,284 20,954 10.26 143.60
Footwear with outer soles and uppers ofrubber orplastics, other than waterprroffootwear, sports footwear and footwearincorporating a protective metal toe-cap
27 Pairs 2,308,770 1,088,685 47.15 1,273.17
Footwear with uppers of leather, otherthan sports footwear incorporating aprotective metal toe-cap andmiscellaneous special footwear
7 Pairs 3,667 2,306 62.88 440.16
Wood, sawn or chipped lengthwise,sliced or peeled, of a thicknessexceeding 6mm; railway or tramwaysleepers (cross-ties) of wood, notimprenated
54 CubicMeter
264,131 36,223 13.71 740.56
Plywood consisting solely of sheets ofwood
14 CubicMeter
1,426 926 64.93 909.08
Packing cases, boxes, crates, drums andsimilar packings, of wood; cable-drumsof wood; pa;;ets, box pallets and otherload boards, of wood; casks, barrels,vat, tubs and othe rcoopers' productsand parts thereof, of wood
7 M/Tons 1,425,900 1,037,000 72.73 509.08
Other products of wood 7 M/Tons 3,056 1,630 53.33 373.33
Articles of cork and straw or otherplaiting materials; baskware andwickerwork
7 M/Tons 263,452,000 100,556,780 38.17 267.18
Printed books, brochures, leaflets andsimilar printed matter, in single sheets,other than advertising material
20 M/Tons 2,223,725 1,037,006 46.63 932.67
Newspapers, journals and periodicals,appearing at least four times a week
14 M/Tons 500,000 357,069 71.41 999.79
Other printed matter 14 M/Tons 341,537 125,747 36.82 515.45
Gas oils 7 Kg 1,000 679 67.90 475.30
Ethylene, propylene, butylene, butadieneand other petroleum gasses or gaseous
hydrocarbons, except natural gas
7 Kg 64,180 48,718 75.91 531.36
Chemical elements n.e.c inorganic acidsaxcept nitiric and sulphonitric; inorganicoxygen compounds of boron, silicon andsulphur halogen or sulphur compoundsof non-metals; sodium hydroxide;hydroxide andperoxide of magnesium;ocides, hydroxides
20 M/Tons 204,719 98,719 48.22 964.43
Synthetic organic colouring matter andpreparations based thereon; systheticorganic products of akind used asfluoescent brightening agents or as juminophore; colour lakes andpreparations based thereon
7 M/Tons 1,000 640 63.95 447.65
Nitric acid; sulphonitric acids; ammonia;ammonium chloride; nitrietes; nitrates ofpatassium; ammonium carbonates;mineral or chemical fertilzers
14 Kg 75,000 48,240 64.32 900.47

8/22/2019 MICRO, SMALL AND MEDIUM ENTERPRISES SURVEY IN NIGERIA BY SMEDAN
http://slidepdf.com/reader/full/micro-small-and-medium-enterprises-survey-in-nigeria-by-smedan 150/182
May 2012
139
Synthetic rubber and factice derivedfrom oils, and mixtures thereof withnatural rubber and similar natural gums,in primary forms or in plates, sheets orstrip
7 SqMeter
5,000 3,019 60.37 422.59
Paints and varnished (including enamelsand lacquers) prepared pigments,prepared opacifiers and prepared
colours, vitrifiable enamels and glazes,engobes, liquid lustres and similarpreparations, of a kind used in theceramic, enamelling or glass industry
20 Liters 167,007 93,363 55.90 1,118.07
Provitains, vitamins and hormones;glycosides and vegetable alkaloids andtheir salts, ethers, esters and otherderivatives, antibiotics
41 Dozen 25,814,223 20,428,919 79.14 3,244.67
Medicaments, for therapeutic orprophylactic uses
7 Kg 250 136 54.32 380.24
Other pharmaceutical products orarticles or articles for medical or surgicalpurposes
7 Kg 27,160 10,160 37.41 261.86
Soap and detergents, perfume and toiletpreparations
61 M/Tons 631,300 412,232 65.30 3,983.23
Sacks and bags, of plastics 14 Kg 210,490 102,700 48.79 683.07
Articles of plastics n.e.c 81 Pieces 3,888,341 2,356,298 60.60 4,908.52
Bricks, blocks, tiles and other ceramicgoods of siliceous earths
693 Pieces 284,930,481 148,693,684 52.19 36,164.86
Ceramic flags and paving, hearth or walltiles; ceramic mosaic cubes and the like
7 Pieces 47,530 26,790 56.36 394.55
Portland cement, aluminous cement,slag cement and similar hydrauliccements, except in the form of clinkers
7 Tons 4,753 2,753 57.92 405.45
Non-refractory mortars and concretes 7 Kg 543,200 350,870 64.59 452.15
Other articles of cement, concrete orartificial stone
7 Kg 2,037 815 40.00 280.00
Articles of asbestos-cement, cellulosefivre-cement or the like
14 M/Tons 815 547 67.12 939.69
Other furniture, of a kind used in offices 20 Pieces 142,726 17,111 11.99 239.77
Other wooden furniture, of a kind used inthe kitchen
7 Pieces 170 102 60.00 420.00
Other furniture n.e.c 122 Pieces 20,220,892 12,649,159 62.55 7,631.70
Mattress supports; mattresses, fittedwith springs or stuffed or internally fittedwith material or of cellular rubber orplastics, whether or not covered
258 Pieces 10,196,923 7,122,527 69.85 18,021.24
Other articles 7 Kg 1,000,000 679,000 67.90 475.30
Other flat-rolled products of iron or steel 7 M/Tons 6,790 4,790 70.54 493.81
Semi-finished products of lead, zinc andtin or their alloys
68 M/Tons 1,805,033 813,962 45.09 3,066.39
Door, windows and their frames andthresholds for doors, of iron, steel oraluminium
217 Pieces 1,761,407 767,804 43.59 9,459.11
Other structures (except prefabricatedbuildings) and parts of structures, ofiron, steel or aluminium; of a capacityexceeding 300 litres, not fitted withmechanical or themal equipment
20 M/Tons 208,331 106,294 51.02 1,020.43
Domestic metal products 20 M/Tons 845,518 543,753 64.31 1,286.20
Hand tools (including hand tools of akind used in agriculture, horticulture orforestry, hand saws, files pillers and
metal cutting shears, hand-operatedspanners blow-lamps and clamps)interchangeable tools for hand tools or
14 Pieces 67,153 50,061 74.55 1,043.66
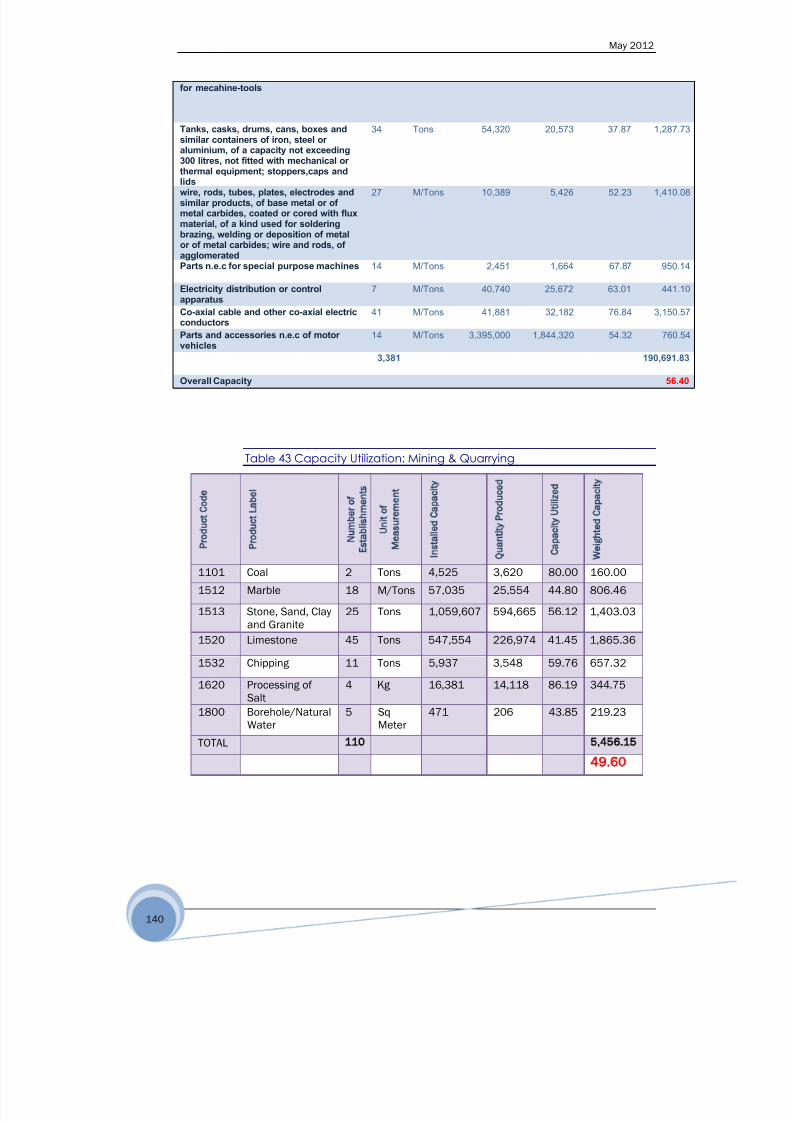
8/22/2019 MICRO, SMALL AND MEDIUM ENTERPRISES SURVEY IN NIGERIA BY SMEDAN
http://slidepdf.com/reader/full/micro-small-and-medium-enterprises-survey-in-nigeria-by-smedan 151/182
May 2012
140
for mecahine-tools
Tanks, casks, drums, cans, boxes andsimilar containers of iron, steel oraluminium, of a capacity not exceeding300 litres, not fitted with mechanical or
thermal equipment; stoppers,caps andlids
34 Tons 54,320 20,573 37.87 1,287.73
wire, rods, tubes, plates, electrodes andsimilar products, of base metal or ofmetal carbides, coated or cored with fluxmaterial, of a kind used for solderingbrazing, welding or deposition of metalor of metal carbides; wire and rods, ofagglomerated
27 M/Tons 10,389 5,426 52.23 1,410.08
Parts n.e.c for special purpose machines 14 M/Tons 2,451 1,664 67.87 950.14
Electricity distribution or controlapparatus
7 M/Tons 40,740 25,672 63.01 441.10
Co-axial cable and other co-axial electricconductors
41 M/Tons 41,881 32,182 76.84 3,150.57
Parts and accessories n.e.c of motorvehicles 14 M/Tons 3,395,000 1,844,320 54.32 760.54
3,381 190,691.83
Overall Capacity 56.40
Table 43 Capacity Utilization: Mining & Quarrying
Po
PoL
Nmbo
Eashmes
Uto
Meueme
Inae
ty
Q
tyPo
tyUze
Wege
ty
1101 Coal 2 Tons 4,525 3,620 80.00 160.00
1512 Marble 18 M/Tons 57,035 25,554 44.80 806.46
1513 Stone, Sand, Clayand Granite
25 Tons 1,059,607 594,665 56.12 1,403.03
1520 Limestone 45 Tons 547,554 226,974 41.45 1,865.36
1532 Chipping 11 Tons 5,937 3,548 59.76 657.32
1620 Processing ofSalt
4 Kg 16,381 14,118 86.19 344.75
1800 Borehole/NaturalWater
5 SqMeter
471 206 43.85 219.23
TOTAL 110 5,456.15
49.60

8/22/2019 MICRO, SMALL AND MEDIUM ENTERPRISES SURVEY IN NIGERIA BY SMEDAN
http://slidepdf.com/reader/full/micro-small-and-medium-enterprises-survey-in-nigeria-by-smedan 152/182
May 2012
141
Table 44 Awareness of SMEDAN
ITEM Number Percentage
Yes 10,436 45.5
No 12,482 54.5
Total 22,918 100.0
Table 45 Awareness of SMEDAN by State
State Yes No Total
Number Percentage Number Percentage
Abia 203 36.70 350 63.30 553
Adamawa 113 46.15 132 53.85 245
Akwa Ibom 153 48.66 162 51.34 315
Anambra 282 35.68 509 64.32 791
Bauchi 308 50.09 307 49.91 615
Bayelsa 63 47.05 71 52.95 134
Benue 192 49.15 199 50.85 390
Borno 49 29.32 119 70.68 168
Cross River 172 43.59 223 56.41 395
Delta 451 69.65 196 30.35 647
Ebonyi 97 33.91 190 66.09 287
Edo 544 55.90 429 44.10 973
Ekiti 107 37.70 178 62.30 285
Enugu 231 51.52 217 48.48 448
Gombe 143 55.85 113 44.15 255
Imo 212 35.92 379 64.08 591
Jigawa 61 26.31 170 73.69 231
Kaduna 681 52.59 614 47.41 1,295Kano 656 35.88 1,173 64.12 1,829
Katsina 287 52.61 259 47.39 546
Kebbi 95 38.57 152 61.43 247
Kogi 180 51.46 170 48.54 350
Kwara 224 50.29 222 49.71 446
Lagos 1,864 48.26 1,998 51.74 3,862
Nassarawa 217 50.19 215 49.81 432
Niger 246 49.99 246 50.01 492
Ogun 127 21.44 466 78.56 593

8/22/2019 MICRO, SMALL AND MEDIUM ENTERPRISES SURVEY IN NIGERIA BY SMEDAN
http://slidepdf.com/reader/full/micro-small-and-medium-enterprises-survey-in-nigeria-by-smedan 153/182
May 2012
142
Ondo 268 41.47 378 58.53 646
Osun 39 38.41 62 61.59 100
Oyo 476 32.48 990 67.52 1,467
Plateau 354 53.48 308 46.52 663
Rivers 435 59.01 302 40.99 738
Sokoto 202 33.73 398 66.27 600
Taraba 106 42.72 142 57.28 247
Yobe 85 52.88 75 47.12 160
Zamfara 117 31.87 251 68.13 368
FCT 394 76.88 118 23.12 512
TOTAL 10,436 45.54 12,482 54.46 22,918
Table 46 Awareness of SMEDAN by Sector
Sector Yes No Total
Number Percentage Number Percentage
Agricultre, Hunting, Forestry and
Fishing
384 50.00 384 50.00 768
Mining and Quarrying 80 47.31 89 52.69 168
Manufacturing 2,431 40.45 3,578 59.55 6,009
Building and Construction 83 34.91 155 65.09 239
Wholesale and Retail Trade; Repair
of Motor Vehicles and Household
goods
1,649 39.16 2,561 60.84 4,210
Hotels and Restaurants 1,005 44.21 1,268 55.79 2,272
Transport, Storage and
Communication
332 39.61 506 60.39 838
Financial Intermediation 1,615 69.49 709 30.51 2,323
Real Estate, Renting and Business
Activities
519 52.61 468 47.39 987
Education 771 45.10 938 54.90 1,709
Health and Social Work 1,365 49.32 1,402 50.68 2,767
Other Community, Social and
Personal Service Activities
204 32.52 423 67.48 627
TOTAL 10,436 45.54 12,482 54.46 22,918
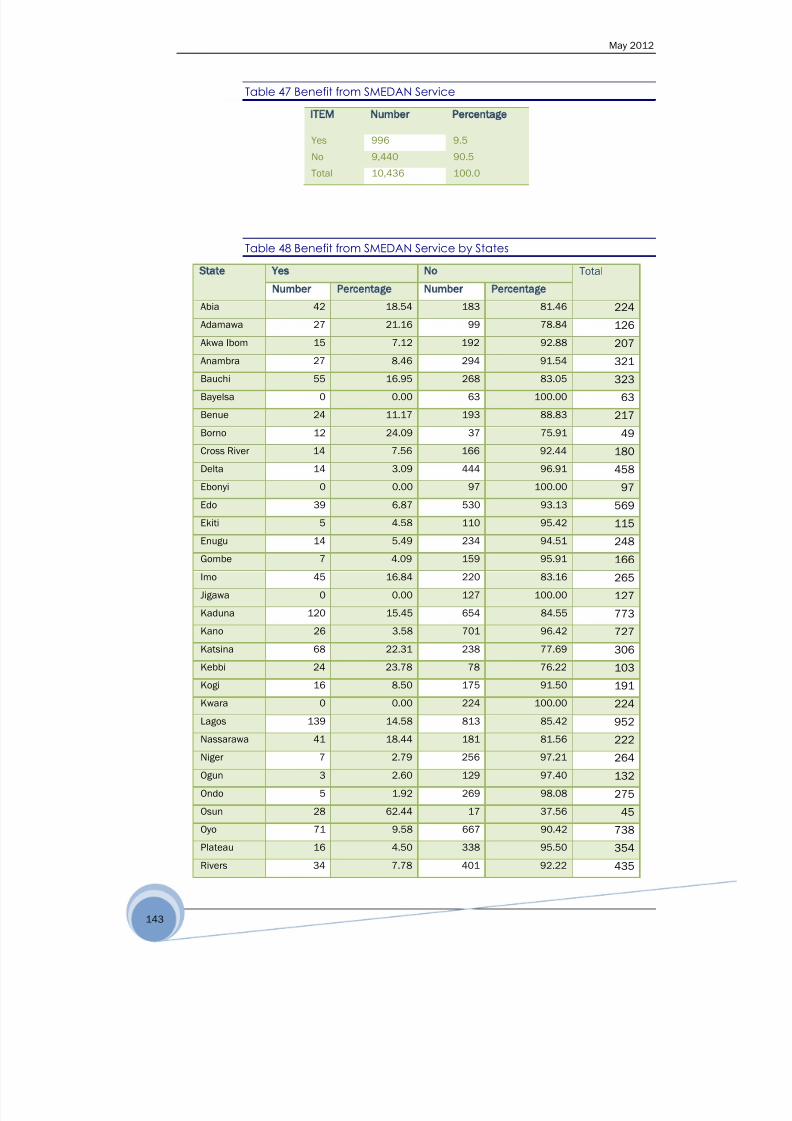
8/22/2019 MICRO, SMALL AND MEDIUM ENTERPRISES SURVEY IN NIGERIA BY SMEDAN
http://slidepdf.com/reader/full/micro-small-and-medium-enterprises-survey-in-nigeria-by-smedan 154/182
May 2012
143
Table 47 Benefit from SMEDAN Service
ITEM Number Percentage
Yes 996 9.5
No 9,440 90.5
Total 10,436 100.0
Table 48 Benefit from SMEDAN Service by States
State Yes No Total
Number Percentage Number Percentage
Abia 42 18.54 183 81.46 224
Adamawa 27 21.16 99 78.84 126
Akwa Ibom 15 7.12 192 92.88 207
Anambra 27 8.46 294 91.54 321
Bauchi 55 16.95 268 83.05 323
Bayelsa 0 0.00 63 100.00 63
Benue 24 11.17 193 88.83 217
Borno 12 24.09 37 75.91 49
Cross River 14 7.56 166 92.44 180
Delta 14 3.09 444 96.91 458
Ebonyi 0 0.00 97 100.00 97
Edo 39 6.87 530 93.13 569Ekiti 5 4.58 110 95.42 115
Enugu 14 5.49 234 94.51 248
Gombe 7 4.09 159 95.91 166
Imo 45 16.84 220 83.16 265
Jigawa 0 0.00 127 100.00 127
Kaduna 120 15.45 654 84.55 773
Kano 26 3.58 701 96.42 727
Katsina 68 22.31 238 77.69 306
Kebbi 24 23.78 78 76.22 103
Kogi 16 8.50 175 91.50 191
Kwara 0 0.00 224 100.00 224
Lagos 139 14.58 813 85.42 952
Nassarawa 41 18.44 181 81.56 222
Niger 7 2.79 256 97.21 264
Ogun 3 2.60 129 97.40 132
Ondo 5 1.92 269 98.08 275
Osun 28 62.44 17 37.56 45
Oyo 71 9.58 667 90.42 738
Plateau 16 4.50 338 95.50 354Rivers 34 7.78 401 92.22 435

8/22/2019 MICRO, SMALL AND MEDIUM ENTERPRISES SURVEY IN NIGERIA BY SMEDAN
http://slidepdf.com/reader/full/micro-small-and-medium-enterprises-survey-in-nigeria-by-smedan 155/182
May 2012
144
Sokoto 14 6.99 188 93.01 202
Taraba 0 0.00 106 100.00 106
Yobe 0 0.00 111 100.00 111
Zamfara 25 19.26 103 80.74 128
FCT 20 5.12 374 94.88 394
TOTAL 996 9.54 9,440 90.46 10,436
Table 49 Ranking of SMEDAN Service
Rank
Services 1 2 3 4 5 6 7 8
Entrepreneurship Training 759 5218 71 35 50 22 18
Vocational skill upgrading 367 3809 69 67 26 30 23
Facilitation of access to market 258 3730 137 47 88 33 5
Facilitation of access to
Finance
387 3720 84 66 20 68 5 5
Business
counseling/Monitoring
247 3705 57 61 96 29 63
Facilitation of product quality
control & Certification
185 3764 63 62 59 77 54
Facilitation of access toinformation
245 3658 77 62 49 55 89 7
Others 338 3608 11 12 36 14 15 91
Table 50 Rank of Problems Militate Against Enterprises Development in
Nigeria
Services Rank
1 2 3 4 5 6 7 8
Lack of access to finance 13,273 2,200 1,168 607406 228 268 19
Lack of work space 1,212 4,312 2,116 1,664 1,553 1,733 2,512 132
Weak infrastructure 2,619 5,435 4,493 1,851 1,487 830 586 66
Lack of entrepreneurship/vocationaltraining
1,178 2,801 2,832 3,908 2,163 2,245 909 46
Obsolete equipment 884 1,526 2,005 2,403 4,061 2,597 1,640 54
Lack of access to research &development
875 1,392 2,329 2,892 2,646 3,302 1,903 113
Inconsistent policies 1,903 1,975 2,710 2,092 1,690 1,722 3,606 222
Transportation 501 619 357 222 230 166 392 1,270Lack of gov't support 237 363 193 149 151 186 104 142
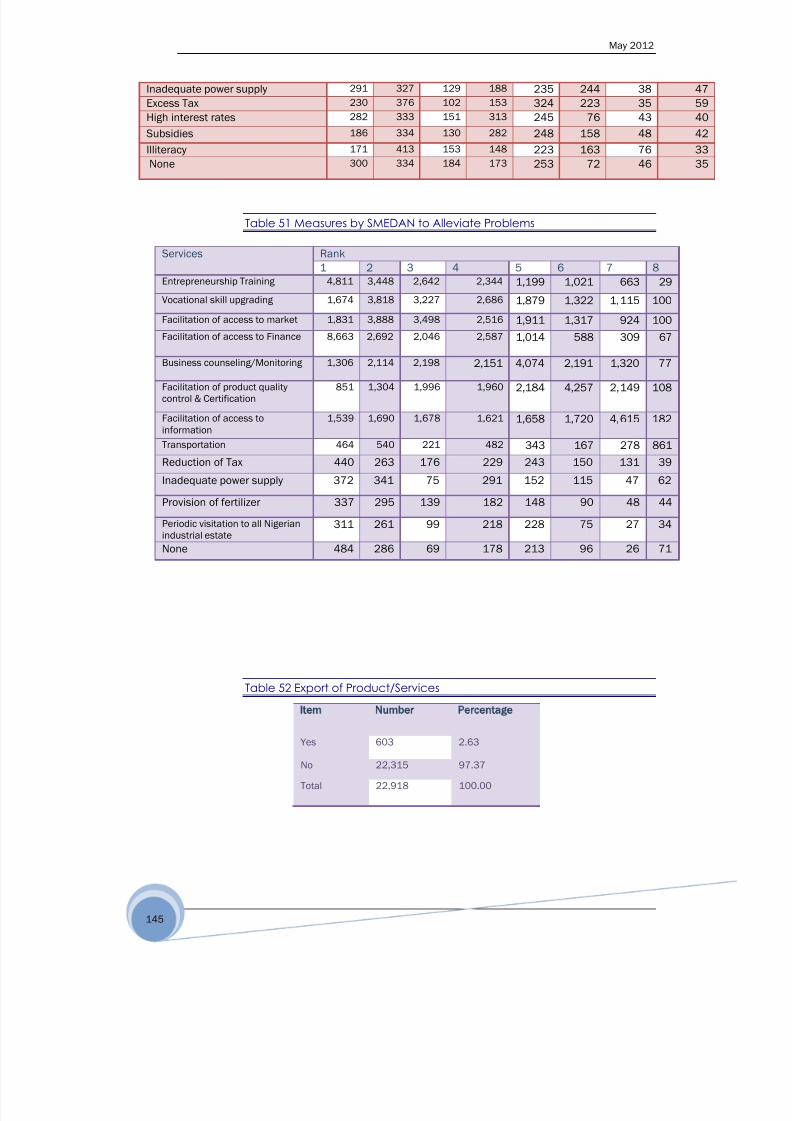
8/22/2019 MICRO, SMALL AND MEDIUM ENTERPRISES SURVEY IN NIGERIA BY SMEDAN
http://slidepdf.com/reader/full/micro-small-and-medium-enterprises-survey-in-nigeria-by-smedan 156/182
May 2012
145
Inadequate power supply 291 327 129 188 235 244 38 47
Excess Tax 230 376 102 153 324 223 35 59
High interest rates 282 333 151 313 245 76 43 40
Subsidies 186 334 130 282 248 158 48 42
Illiteracy 171 413 153 148 223 163 76 33
None 300 334 184 173 253 72 46 35
Table 51 Measures by SMEDAN to Alleviate Problems
Table 52 Export of Product/Services
Item Number Percentage
Yes 603 2.63
No 22,315 97.37
Total 22,918 100.00
Services Rank
1 2 3 4 5 6 7 8Entrepreneurship Training 4,811 3,448 2,642 2,344 1,199 1,021 663 29
Vocational skill upgrading 1,674 3,818 3,227 2,686 1,879 1,322 1,115 100
Facilitation of access to market 1,831 3,888 3,498 2,516 1,911 1,317 924 100
Facilitation of access to Finance 8,663 2,692 2,046 2,587 1,014 588 309 67
Business counseling/Monitoring 1,306 2,114 2,198 2,151 4,074 2,191 1,320 77
Facilitation of product qualitycontrol & Certification
851 1,304 1,996 1,960 2,184 4,257 2,149 108
Facilitation of access toinformation
1,539 1,690 1,678 1,621 1,658 1,720 4,615 182
Transportation 464 540 221 482 343 167 278 861
Reduction of Tax 440 263 176 229 243 150 131 39
Inadequate power supply 372 341 75 291 152 115 47 62
Provision of fertilizer 337 295 139 182 148 90 48 44
Periodic visitation to all Nigerianindustrial estate
311 261 99 218 228 75 27 34
None 484 286 69 178 213 96 26 71
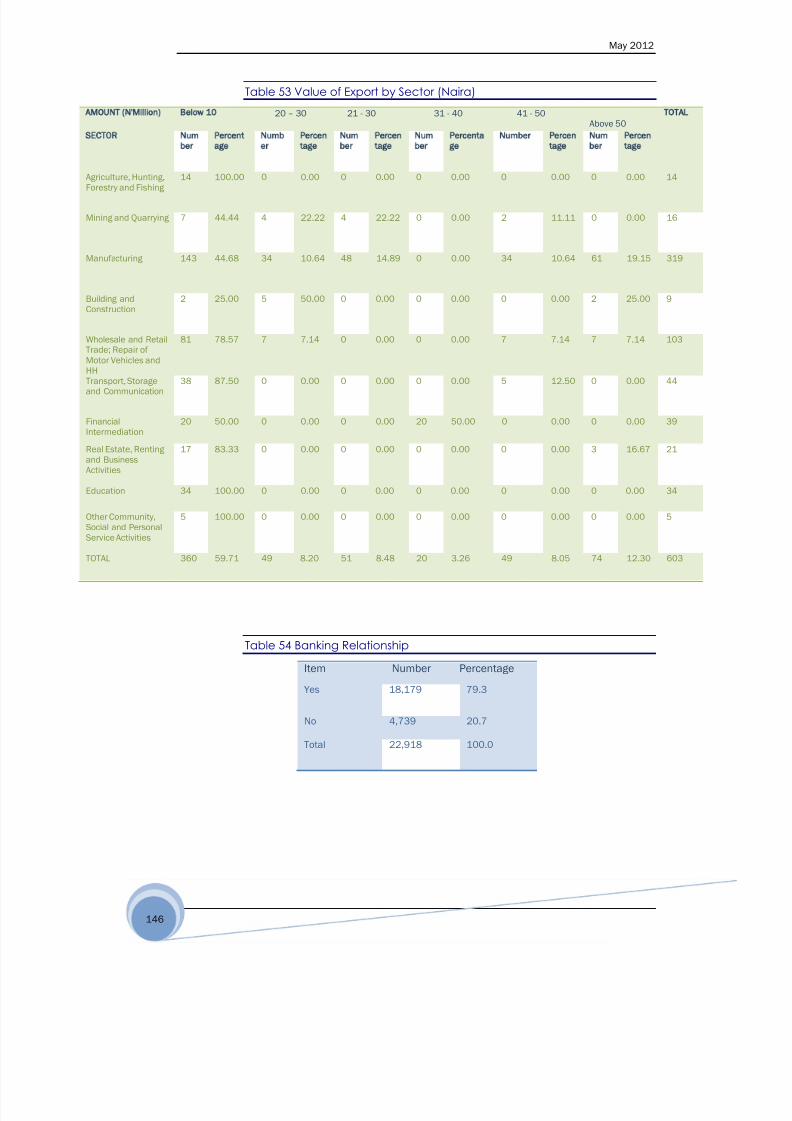
8/22/2019 MICRO, SMALL AND MEDIUM ENTERPRISES SURVEY IN NIGERIA BY SMEDAN
http://slidepdf.com/reader/full/micro-small-and-medium-enterprises-survey-in-nigeria-by-smedan 157/182
May 2012
146
Table 53 Value of Export by Sector (Naira)
AMOUNT (N'Million) Below 10 20 – 30 21 - 30 31 - 40 41 - 50Above 50
TOTAL
SECTOR Num
ber
Percent
age
Numb
er
Percen
tage
Num
ber
Percen
tage
Num
ber
Percenta
ge
Number Percen
tage
Num
ber
Percen
tage
Agriculture, Hunting,Forestry and Fishing
14 100.00 0 0.00 0 0.00 0 0.00 0 0.00 0 0.00 14
Mining and Quarrying 7 44.44 4 22.22 4 22.22 0 0.00 2 11.11 0 0.00 16
Manufacturing 143 44.68 34 10.64 48 14.89 0 0.00 34 10.64 61 19.15 319
Building andConstruction
2 25.00 5 50.00 0 0.00 0 0.00 0 0.00 2 25.00 9
Wholesale and RetailTrade; Repair ofMotor Vehicles andHH
81 78.57 7 7.14 0 0.00 0 0.00 7 7.14 7 7.14 103
Transport, Storageand Communication
38 87.50 0 0.00 0 0.00 0 0.00 5 12.50 0 0.00 44
FinancialIntermediation
20 50.00 0 0.00 0 0.00 20 50.00 0 0.00 0 0.00 39
Real Estate, Rentingand BusinessActivities
17 83.33 0 0.00 0 0.00 0 0.00 0 0.00 3 16.67 21
Education 34 100.00 0 0.00 0 0.00 0 0.00 0 0.00 0 0.00 34
Other Community,Social and PersonalService Activities
5 100.00 0 0.00 0 0.00 0 0.00 0 0.00 0 0.00 5
TOTAL 360 59.71 49 8.20 51 8.48 20 3.26 49 8.05 74 12.30 603
Table 54 Banking Relationship
Item Number Percentage
Yes 18,179 79.3
No 4,739 20.7
Total 22,918 100.0

8/22/2019 MICRO, SMALL AND MEDIUM ENTERPRISES SURVEY IN NIGERIA BY SMEDAN
http://slidepdf.com/reader/full/micro-small-and-medium-enterprises-survey-in-nigeria-by-smedan 158/182
May 2012
147
Table 55 Business Registration
Item No. Percent
Yes 18,513 80.78
No 4,405 19.22
Total 22,918 100.00
Table 56 Business Plan
Table 57 Number of Micro Enterprises by State
STATE Number PERCENT
Abia 407,428 2.36
Adamawa 405,261 2.35
Akwa Ibom 447,589 2.59
Anambra 499,070 2.89
Bauchi 460,186 2.67
Bayelsa 420,233 2.43
Benue 436,391 2.53
Borno 463,009 2.68
Cross River 472,291 2.74
Delta 486,0232.82
Ebonyi 416,508 2.41
Edo 491,220 2.85
Ekiti 421,770 2.44
Enugu 423,006 2.45
Gombe 416,183 2.41
Imo 408,761 2.37
Jigawa 438,502 2.54
Kaduna 548,467 3.18
Item No. Percent
Yes 17,930 78.24
N0 4,988 21.76
Total 22,918 100.00

8/22/2019 MICRO, SMALL AND MEDIUM ENTERPRISES SURVEY IN NIGERIA BY SMEDAN
http://slidepdf.com/reader/full/micro-small-and-medium-enterprises-survey-in-nigeria-by-smedan 159/182
May 2012
148
Kano 872,552 5.05
Katsina 525,742 3.05
Kebbi 386,714 2.24
Kogi 473,882 2.75
Kwara 427,668 2.48
Lagos 880,805 5.10Nassarawa 468,985 2.72
Niger 423,866 2.46
Ogun 471,772 2.73
Ondo 490,761 2.84
Osun 481,351 2.79
Oyo 523,209 3.03
Plateau 424,079 2.46
Rivers 585,241 3.39
Sokoto 379,507 2.20
Taraba 360,682 2.09
Yobe 364,806 2.11
Zamfara 385,654 2.23FCT 272,579 1.58
Total 17,261,753 100
Table 58 Number of Micro Enterprises by Sector
Table 4.2.2: NUMBER OF ENTERPRISE BY SECTOR
SECTOR Number Percent
Agriculture 2,633,041 16.27
Mining and Quarrying 27,365 0.16
Manufacturing 2,831,642 16.79
Construction 556,133 3.12
Wholesale and Retail Trade; Repair of Motor Vehicles
and Household Goods
8,884,265 53.24
Hotels and Restaurants 300,324 1.81
Transport, Storage and Communications 635,203 3.74
Real Estate, Renting and Business Activities 210,115 1.24
Education 33,259 0.28
Health and Social Work 12,712 0.08
Other Community, Social and Personal Service
Activities
1,137,694 7.0
Total 17,261,753 100

8/22/2019 MICRO, SMALL AND MEDIUM ENTERPRISES SURVEY IN NIGERIA BY SMEDAN
http://slidepdf.com/reader/full/micro-small-and-medium-enterprises-survey-in-nigeria-by-smedan 160/182
May 2012
149
Table 59 Initial Start-Up Capital at Inception (N’000)
AMOUNT(N‟000) TOTAL NUMBER PERCENTAGE
Below 50 13,781,578 80.63
50-100 2,231,550 13.06
101-200 541,515 3.17
201-300 189,201 1.11301-400 85,888 0.5
401-500 111,522 0.65
501-600 20,016 0.12
601-700 15,884 0.09
701-800 14,830 0.09
801-900 8,397 0.05
901-1000 38,088 0.22
Above 1000 53,671 0.31
Total 17,092,140 100
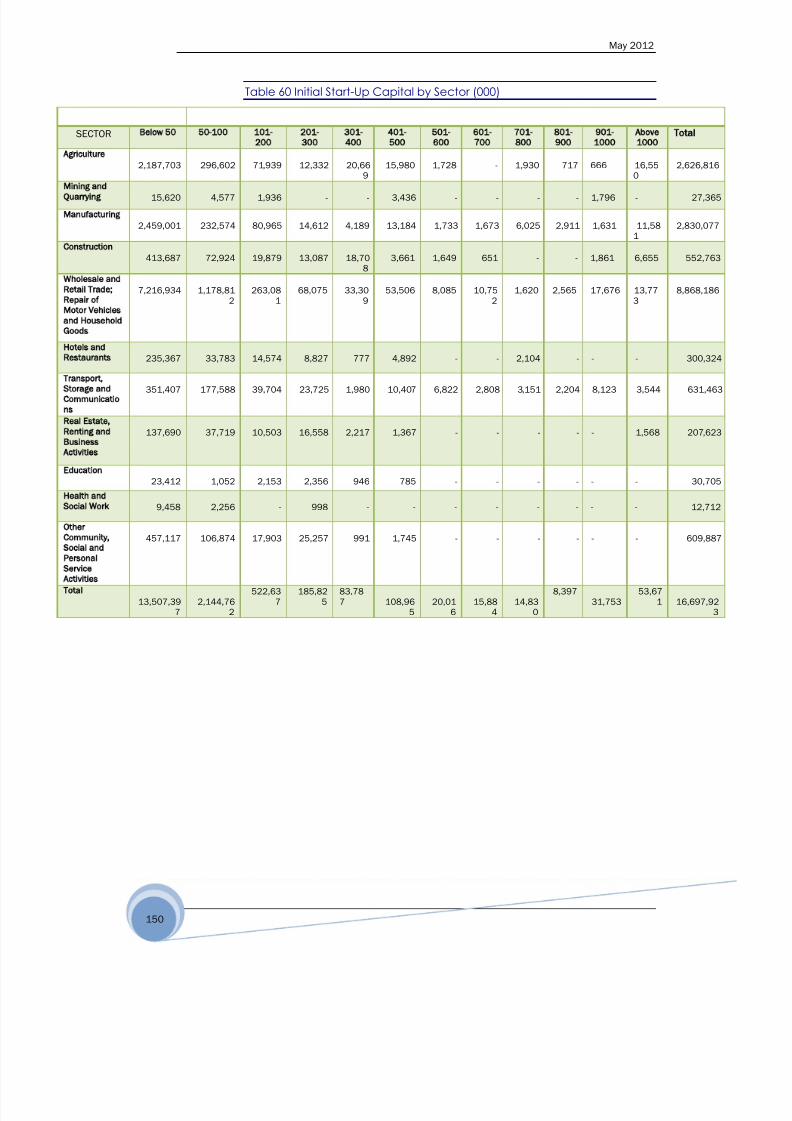
8/22/2019 MICRO, SMALL AND MEDIUM ENTERPRISES SURVEY IN NIGERIA BY SMEDAN
http://slidepdf.com/reader/full/micro-small-and-medium-enterprises-survey-in-nigeria-by-smedan 161/182
May 2012
150
Table 60 Initial Start-Up Capital by Sector (000)
SECTOR Below 50 50-100 101-
200
201-
300
301-
400
401-
500
501-
600
601-
700
701-
800
801-
900
901-
1000
Above
1000Total
2,187,703 296,602 71,939 12,332 20,669 15,980 1,728 - 1,930 717 666 16,550 2,626,816
15,620 4,577 1,936 - - 3,436 - - - - 1,796 - 27,365
2,459,001 232,574 80,965 14,612 4,189 13,184 1,733 1,673 6,025 2,911 1,631 11,581
2,830,077
413,687 72,924 19,879 13,087 18,708
3,661 1,649 651 - - 1,861 6,655 552,763
7,216,934 1,178,812
263,081
68,075 33,309
53,506 8,085 10,752
1,620 2,565 17,676 13,773
8,868,186
235,367 33,783 14,574 8,827 777 4,892 - - 2,104 - - - 300,324
351,407 177,588 39,704 23,725 1,980 10,407 6,822 2,808 3,151 2,204 8,123 3,544 631,463
137,690 37,719 10,503 16,558 2,217 1,367 - - - - - 1,568 207,623
23,412 1,052 2,153 2,356 946 785 - - - - - - 30,705
9,458 2,256 - 998 - - - - - - - - 12,712
457,117 106,874 17,903 25,257 991 1,745 - - - - - - 609,887
13,507,397
2,144,762
522,637
185,825
83,787 108,96
520,01
615,88
414,83
0
8,39731,753
53,671 16,697,92
3
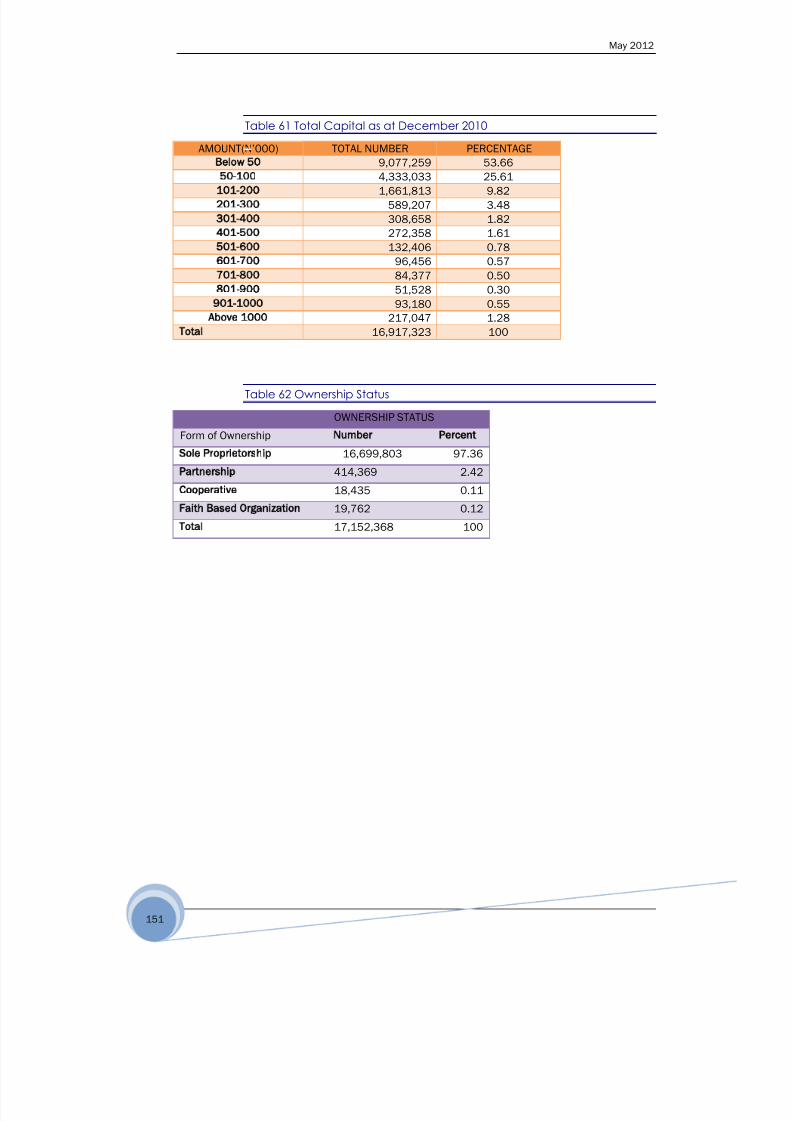
8/22/2019 MICRO, SMALL AND MEDIUM ENTERPRISES SURVEY IN NIGERIA BY SMEDAN
http://slidepdf.com/reader/full/micro-small-and-medium-enterprises-survey-in-nigeria-by-smedan 162/182
May 2012
151
Table 61 Total Capital as at December 2010
AMOUNT(N‟000) TOTAL NUMBER PERCENTAGE
Below 50 9,077,259 53.66
50-100 4,333,033 25.61
101-200 1,661,813 9.82
201-300 589,207 3.48
301-400 308,658 1.82
401-500 272,358 1.61
501-600 132,406 0.78
601-700 96,456 0.57
701-800 84,377 0.50
801-900 51,528 0.30
901-1000 93,180 0.55
Above 1000 217,047 1.28
Total 16,917,323 100
Table 62 Ownership Status
OWNERSHIP STATUS
Form of Ownership Number Percent
Sole Proprietorship 16,699,803 97.36
Partnership 414,369 2.42
Cooperative 18,435 0.11
Faith Based Organization 19,762 0.12Total 17,152,368 100

8/22/2019 MICRO, SMALL AND MEDIUM ENTERPRISES SURVEY IN NIGERIA BY SMEDAN
http://slidepdf.com/reader/full/micro-small-and-medium-enterprises-survey-in-nigeria-by-smedan 163/182
May 2012
152
Table 63 Ownership Status by Sector
OWNERSHIP STATUS BY SECTOR
SECTOR Sole Proprietorship Partnership Private Limited
Liability
Cooperative Religious
Organization
Number Percent Number Percent Number Percent Number Percent Number
Agriculture 2,545,781 96.95 78,012 2.97 1,506 0.05 1,359 0.05 736
Mining and
Quarrying
27,365 100 - 0 - 0 - -
Manufacturing 2,772,225 97.95 56,692 2.00 422 0 1,459 0.05 -
Construction 509,259 91.57 46,874 8.43 1,346 0.25 - - -
Wholesale and
Retail Trade;
Repair of
Motor Vehicles
and
Household
Goods
8,727,053 98.51 118,323 1.34 2,062 0 8,458 0.10 4,784
Hotels and
Restaurants
300,324 100 - - - 0 - 0 -
Transport,
Storage and
Communicatio
ns
594,454 93.58 27,043 4.26 3,770 0.58 - 0 13,706
Real Estate,
Renting and
Business
Activities
205,008 97.57 5,107 2.43 6,677 3.13 - 0 -
Education 30,911 98.30 - - - 0 - 0 535
Health and
Social Work
9,328 73.37 3,385 26.63 - 0 - 0 -
Other
Community,
Social and
Personal
Service
Activities
596,923 97.87 12,965 2.13 - 0 - 0 -
Total 16,318,630
97.73 348,401 2.09 15,783 0.09 11,277 0.07 19,762
Table 64 Sex of Owners by Economic Sector
SEX OF OWNERS BY ECONOMIC SECTOR
SECTOR Male Female Total
Number Percent Number Percent
Agriculture 2,269,705 86.20 363,336 13.80 2,633,041
Mining and Quarrying 19,671 71.88 7,694 28.12 27,365
Manufacturing 1,409,325 49.77 1,422,316 50.23 2,831,642
Construction 461,134 82.92 94,999 17.08 556,133
Wholesale and Retail
Trade; Repair of Motor
Vehicles and Household
Goods
4,525,266 50.94 4,358,999 49.06 8,884,265
Hotels and Restaurants 78,163 26.03 222,161 73.97 300,324
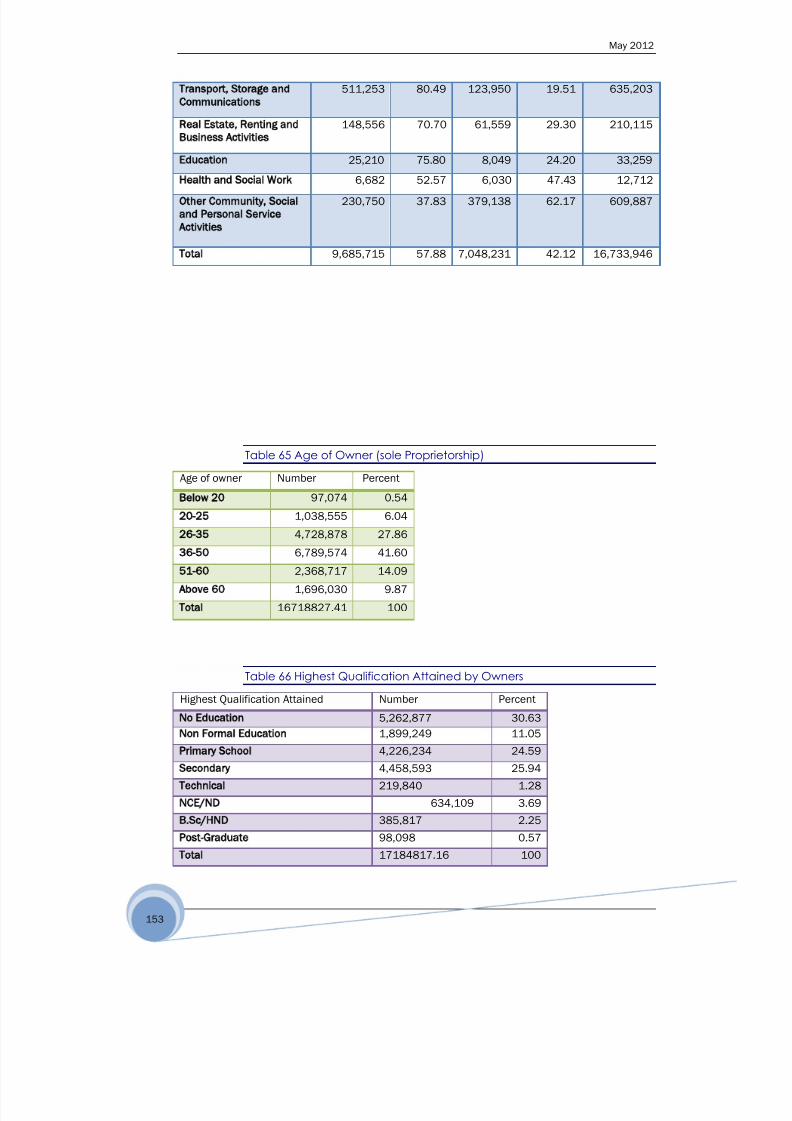
8/22/2019 MICRO, SMALL AND MEDIUM ENTERPRISES SURVEY IN NIGERIA BY SMEDAN
http://slidepdf.com/reader/full/micro-small-and-medium-enterprises-survey-in-nigeria-by-smedan 164/182
May 2012
153
Transport, Storage and
Communications
511,253 80.49 123,950 19.51 635,203
Real Estate, Renting and
Business Activities
148,556 70.70 61,559 29.30 210,115
Education 25,210 75.80 8,049 24.20 33,259
Health and Social Work 6,682 52.57 6,030 47.43 12,712
Other Community, Social
and Personal Service
Activities
230,750 37.83 379,138 62.17 609,887
Total 9,685,715 57.88 7,048,231 42.12 16,733,946
Table 65 Age of Owner (sole Proprietorship)
Age of owner Number Percent
Below 20 97,074 0.54
20-25 1,038,555 6.04
26-35 4,728,878 27.86
36-50 6,789,574 41.60
51-60 2,368,717 14.09
Above 60 1,696,030 9.87
Total 16718827.41 100
Table 66 Highest Qualification Attained by Owners
Highest Qualification Attained Number Percent
No Education 5,262,877 30.63
Non Formal Education 1,899,249 11.05
Primary School 4,226,234 24.59
Secondary 4,458,593 25.94
Technical 219,840 1.28
NCE/ND 634,109 3.69
B.Sc/HND 385,817 2.25
Post-Graduate 98,098 0.57
Total 17184817.16 100

8/22/2019 MICRO, SMALL AND MEDIUM ENTERPRISES SURVEY IN NIGERIA BY SMEDAN
http://slidepdf.com/reader/full/micro-small-and-medium-enterprises-survey-in-nigeria-by-smedan 165/182
May 2012
154
Table 67 Initial Total Assets at Inception
Table 68 Source of Capital
Source Number Percent
Personal savings 13,661,185 84.56
Loan 1,068,228 9.17
Family Source 3,708,361 29.83
Cooperative/Esusu 923,047 7.98
Husband 187,509 1.69
Partnership 13,201 0.18
Parents 17,612 0.24
Friends 18,285 0.25
Children 6,423 0.09
AMOUNT N : K (000) Number Percent
Below 50 12,319,311 72.66
50-100 2,681,832 15.82
101-200 940,331 5.55
201-300 286,473 1.69
301-400 191,547 1.13
401-500 151,319 0.89
501-600 35,991 0.21
601-700 54,487 0.32
701-800 56,579 0.33
801-900 21,097 0.12
901-1000 80,059 0.47
Above 1000 135,107 0.80
Total 16740121.9 100
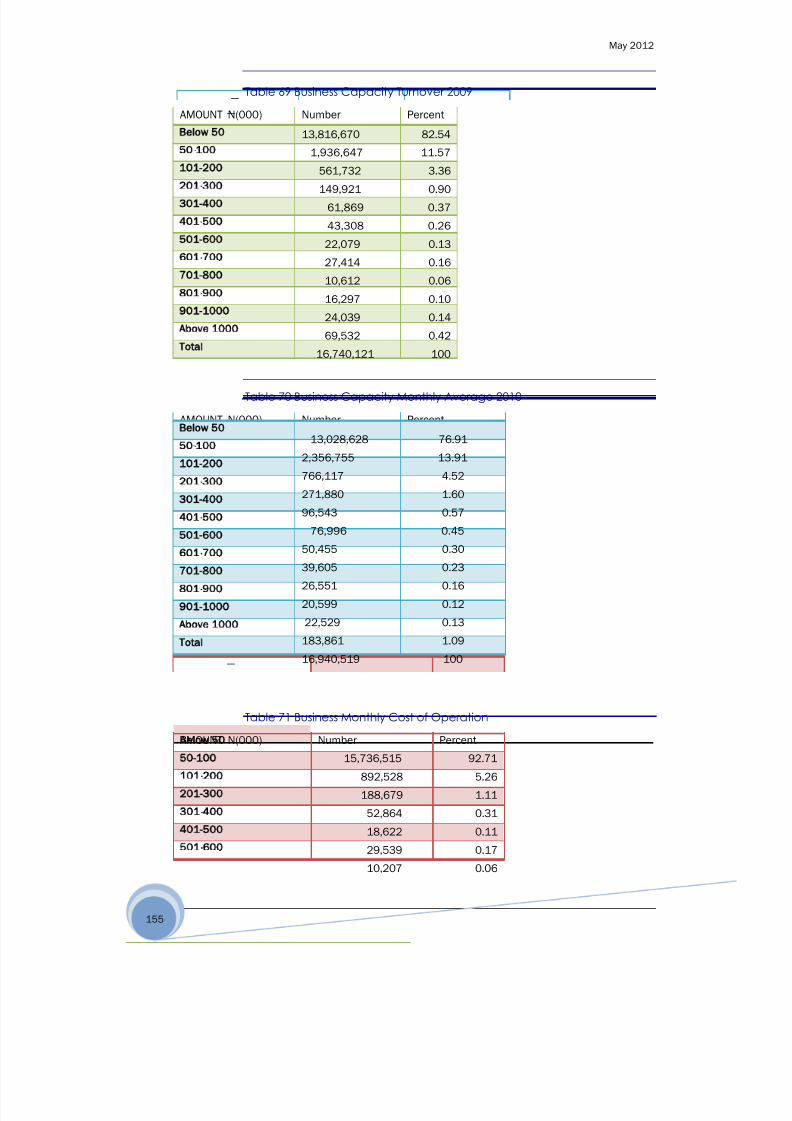
8/22/2019 MICRO, SMALL AND MEDIUM ENTERPRISES SURVEY IN NIGERIA BY SMEDAN
http://slidepdf.com/reader/full/micro-small-and-medium-enterprises-survey-in-nigeria-by-smedan 166/182
May 2012
155
Table 69 Business Capacity Turnover 2009
AMOUNT N(000) Number Percent
Below 50 13,816,670 82.54
50-100 1,936,647 11.57
101-200 561,732 3.36
201-300 149,921 0.90
301-400 61,869 0.37
401-500 43,308 0.26
501-600 22,079 0.13
601-700 27,414 0.16
701-800 10,612 0.06
801-900 16,297 0.10
901-1000 24,039 0.14
Above 1000 69,532 0.42Total 16,740,121 100
Table 70 Business Capacity Monthly Average 2010
AMOUNT N(000) Number Percent
Below 50 13,028,628 76.91
50-100 2,356,755 13.91
101-200 766,117 4.52
201-300 271,880 1.60
301-400 96,543 0.57
401-500 76,996 0.45
501-600 50,455 0.30
601-700 39,605 0.23
701-800 26,551 0.16
801-900 20,599 0.12
901-1000 22,529 0.13
Above 1000 183,861 1.09
Total 16,940,519 100
Table 71 Business Monthly Cost of Operation
AMOUNT N(000) Number Percent
Below 50 15,736,515 92.71
50-100 892,528 5.26
101-200 188,679 1.11
201-300 52,864 0.31
301-400 18,622 0.11
401-500 29,539 0.17
501-600 10,207 0.06
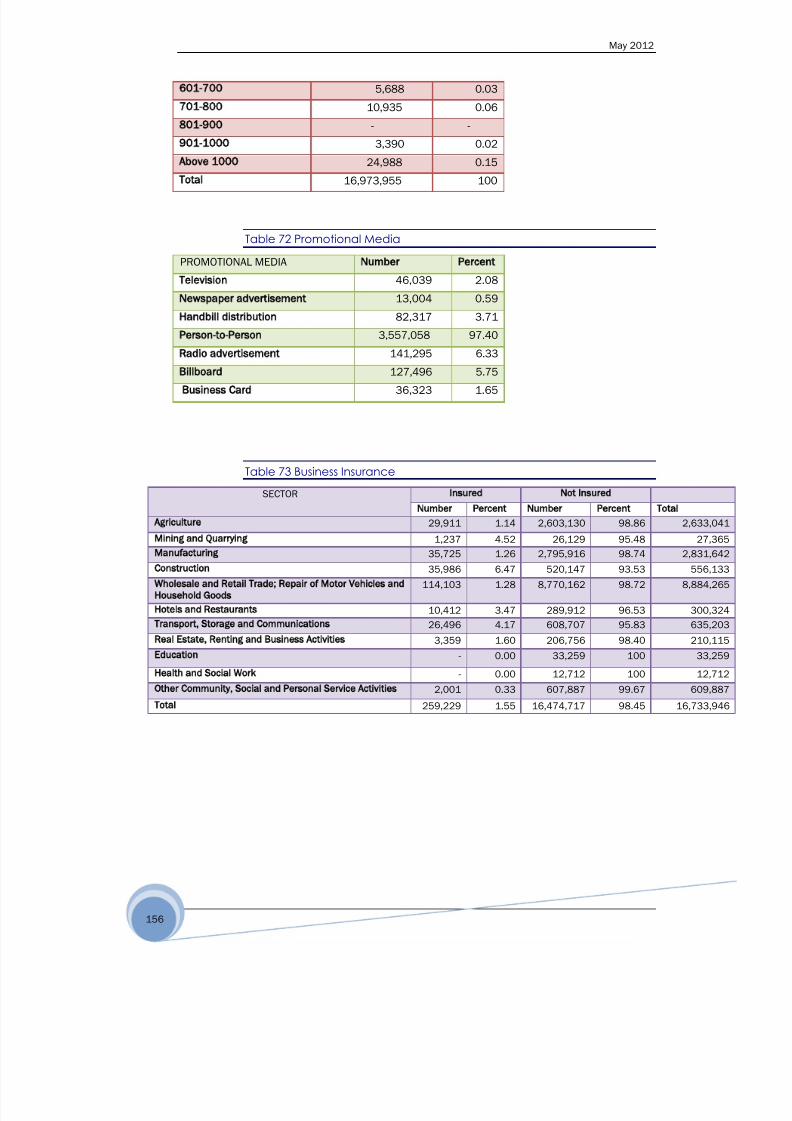
8/22/2019 MICRO, SMALL AND MEDIUM ENTERPRISES SURVEY IN NIGERIA BY SMEDAN
http://slidepdf.com/reader/full/micro-small-and-medium-enterprises-survey-in-nigeria-by-smedan 167/182
May 2012
156
601-700 5,688 0.03
701-800 10,935 0.06
801-900 - -
901-1000 3,390 0.02
Above 1000 24,988 0.15
Total 16,973,955 100
Table 72 Promotional Media
PROMOTIONAL MEDIA Number Percent
Television 46,039 2.08
Newspaper advertisement 13,004 0.59
Handbill distribution 82,317 3.71
Person-to-Person 3,557,058 97.40Radio advertisement 141,295 6.33
Billboard 127,496 5.75
Business Card 36,323 1.65
Table 73 Business Insurance
SECTOR Insured Not Insured
Number Percent Number Percent TotalAgriculture 29,911 1.14 2,603,130 98.86 2,633,041
Mining and Quarrying 1,237 4.52 26,129 95.48 27,365
Manufacturing 35,725 1.26 2,795,916 98.74 2,831,642
Construction 35,986 6.47 520,147 93.53 556,133
Wholesale and Retail Trade; Repair of Motor Vehicles and
Household Goods
114,103 1.28 8,770,162 98.72 8,884,265
Hotels and Restaurants 10,412 3.47 289,912 96.53 300,324
Transport, Storage and Communications 26,496 4.17 608,707 95.83 635,203
Real Estate, Renting and Business Activities 3,359 1.60 206,756 98.40 210,115
Education - 0.00 33,259 100 33,259
Health and Social Work - 0.00 12,712 100 12,712
Other Community, Social and Personal Service Activities 2,001 0.33 607,887 99.67 609,887
Total 259,229 1.55 16,474,717 98.45 16,733,946
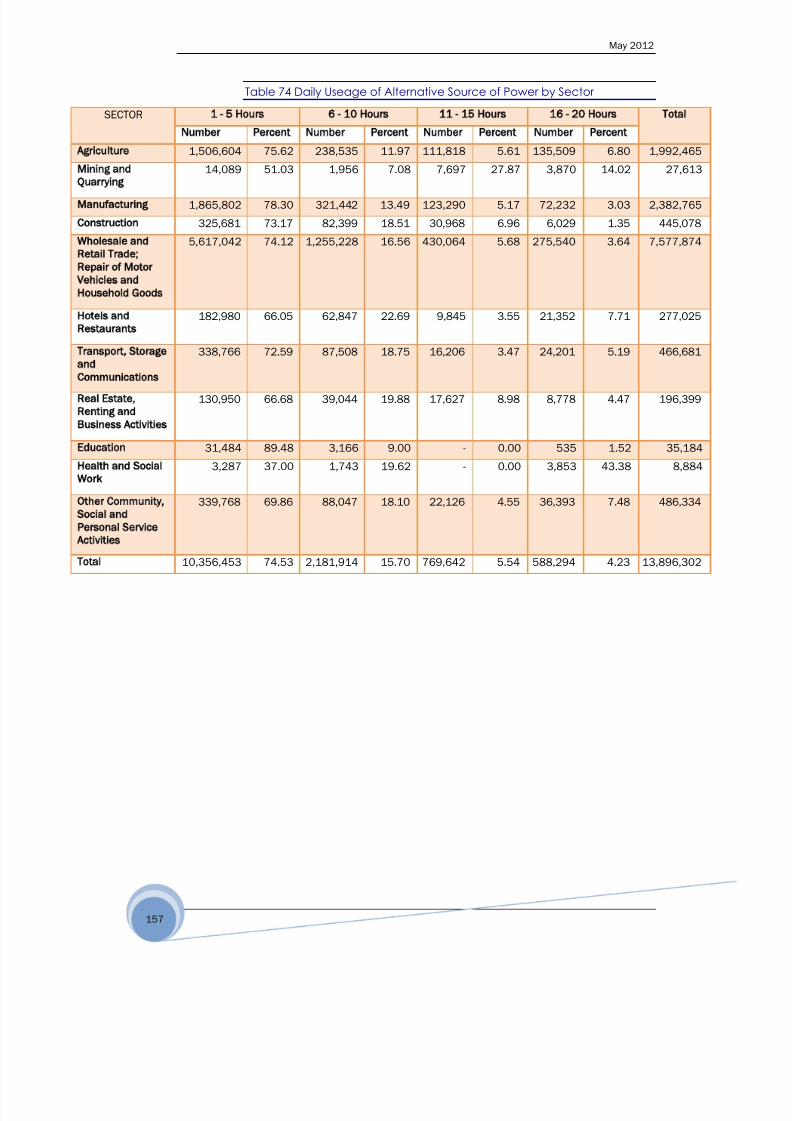
8/22/2019 MICRO, SMALL AND MEDIUM ENTERPRISES SURVEY IN NIGERIA BY SMEDAN
http://slidepdf.com/reader/full/micro-small-and-medium-enterprises-survey-in-nigeria-by-smedan 168/182
May 2012
157
Table 74 Daily Useage of Alternative Source of Power by Sector
SECTOR 1 - 5 Hours 6 - 10 Hours 11 - 15 Hours 16 - 20 Hours Total
Number Percent Number Percent Number Percent Number Percent
Agriculture 1,506,604 75.62 238,535 11.97 111,818 5.61 135,509 6.80 1,992,465
Mining andQuarrying
14,089 51.03 1,956 7.08 7,697 27.87 3,870 14.02 27,613
Manufacturing 1,865,802 78.30 321,442 13.49 123,290 5.17 72,232 3.03 2,382,765
Construction 325,681 73.17 82,399 18.51 30,968 6.96 6,029 1.35 445,078
Wholesale and
Retail Trade;
Repair of Motor
Vehicles and
Household Goods
5,617,042 74.12 1,255,228 16.56 430,064 5.68 275,540 3.64 7,577,874
Hotels and
Restaurants
182,980 66.05 62,847 22.69 9,845 3.55 21,352 7.71 277,025
Transport, Storage
and
Communications
338,766 72.59 87,508 18.75 16,206 3.47 24,201 5.19 466,681
Real Estate,
Renting and
Business Activities
130,950 66.68 39,044 19.88 17,627 8.98 8,778 4.47 196,399
Education 31,484 89.48 3,166 9.00 - 0.00 535 1.52 35,184
Health and Social
Work
3,287 37.00 1,743 19.62 - 0.00 3,853 43.38 8,884
Other Community,
Social and
Personal Service
Activities
339,768 69.86 88,047 18.10 22,126 4.55 36,393 7.48 486,334
Total 10,356,453 74.53 2,181,914 15.70 769,642 5.54 588,294 4.23 13,896,302

8/22/2019 MICRO, SMALL AND MEDIUM ENTERPRISES SURVEY IN NIGERIA BY SMEDAN
http://slidepdf.com/reader/full/micro-small-and-medium-enterprises-survey-in-nigeria-by-smedan 169/182
May 2012
158
Table 75 Employment by Sector at Commencement
SECTOR MALE FEMALE
NUMBER PERCENTAGE NUMBER PERCENTAGE
Agriculture 2,228,761 24.6 1,105,969 17
Mining and Quarrying 16,945 0.2 9,462 0.1
Manufacturing 1,232,618 13.6 1,304,744 20.1
Construction 376,803 4.2 60,933 0.9
Whole & Retail, Trade;
Repair of Motor vehicles
and Household Goods
4,335,612 47.9 3,295,406 50.6
Hotel & Restaurant 76,375 0.8 187,449 2.9
Transport, Storage of
Communications
404,395 4.6 196,170 3.0
Real Estate, Renting and
Business Activities
11,924 1.2 75,844 1.2
Education 33,688 0.4 11,533 0.2
Health & Social Work 7,287 0.1 - -
Other community, social
and personal service
activities
219,379 2.4 258,170 4.0
Total
9,043,788 100 6,505,679 100
58.2% 41.8%
Table 76 Employment by Sector as at December 2010
SECTOR
MALE FEMALE
TOTAL NO PERCENTAGE TOTAL NO PERCENTAGE
Agriculture 2,087,779 23.3 1,168,380 17.5
Mining & Quarrying 16,302 0.2 14,246 0.2
Manufacturing 1,271,654 14.2 1,357,976 20.4
Construction 378,795 4.2 70,990 1.1
Wholesale & Retail Trade,
Repair of Motor Vehicles
and household goods
4,413,204 49.2 3,335,112 50
Hotels and Restaurants 93,844 1.0 205,855 3.1
Transport, Storage and
Communications
348,008 3.8 172,972 2.6
Real estate, Renting and
business activities
108,700 1.2 77,961 1.2
Education 30,743 0.3 6,581 0.1
Health and social work 5,672 0.1 667 -
Other community, social &
personal service activities
222,528 2.5 253,492 3.8
Total
8,977,228 100 6,664,232 100
57.4 42.6
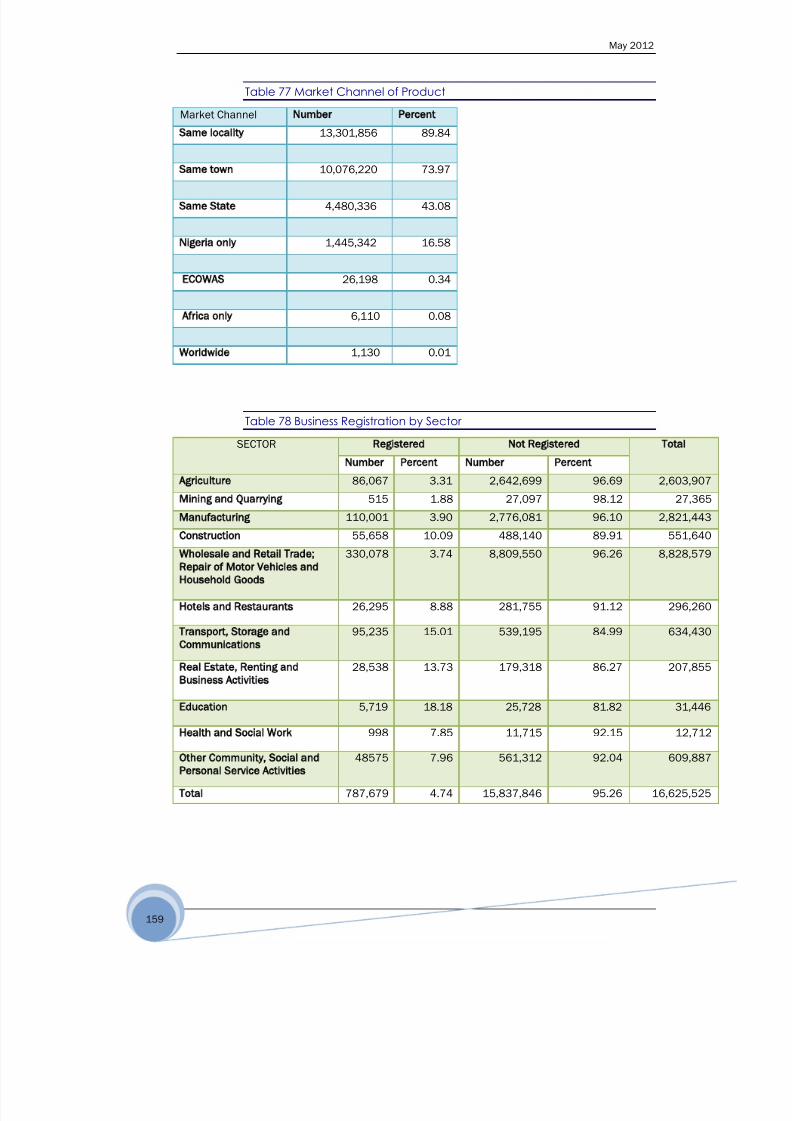
8/22/2019 MICRO, SMALL AND MEDIUM ENTERPRISES SURVEY IN NIGERIA BY SMEDAN
http://slidepdf.com/reader/full/micro-small-and-medium-enterprises-survey-in-nigeria-by-smedan 170/182
May 2012
159
Table 77 Market Channel of Product
Market Channel Number Percent
Same locality 13,301,856 89.84
Same town 10,076,220 73.97
Same State 4,480,336 43.08
Nigeria only 1,445,342 16.58
ECOWAS 26,198 0.34
Africa only 6,110 0.08
Worldwide 1,130 0.01
Table 78 Business Registration by Sector
SECTOR Registered Not Registered Total
Number Percent Number Percent
Agriculture 86,067 3.31 2,642,699 96.69 2,603,907
Mining and Quarrying 515 1.88 27,097 98.12 27,365
Manufacturing 110,001 3.90 2,776,081 96.10 2,821,443
Construction 55,658 10.09 488,140 89.91 551,640
Wholesale and Retail Trade;
Repair of Motor Vehicles and
Household Goods
330,078 3.74 8,809,550 96.26 8,828,579
Hotels and Restaurants 26,295 8.88 281,755 91.12 296,260
Transport, Storage and
Communications
95,235 15.01 539,195 84.99 634,430
Real Estate, Renting and
Business Activities
28,538 13.73 179,318 86.27 207,855
Education 5,719 18.18 25,728 81.82 31,446
Health and Social Work 998 7.85 11,715 92.15 12,712
Other Community, Social and
Personal Service Activities
48575 7.96 561,312 92.04 609,887
Total 787,679 4.74 15,837,846 95.26 16,625,525

8/22/2019 MICRO, SMALL AND MEDIUM ENTERPRISES SURVEY IN NIGERIA BY SMEDAN
http://slidepdf.com/reader/full/micro-small-and-medium-enterprises-survey-in-nigeria-by-smedan 171/182
May 2012
160
Table 79 Support Received from Association
Support Number Percent
Loan 752,303 4.36
Training 347,110 2.01
Joint Permit from government 73,021 0.42
Facilitation of access to quality product 17,536 0.10
Moral 56,058 0.32
Police protection 51,802 0.30
Bulk purchases 4,926 0.03
Motivation 27,016 0.16
Dissemination of information on govt policies 36,479 0.21
Education 2,270 0.01
Advise 69,290 0.40
Monitoring and Regulation 8,611 0.05Support member against gov‟t harassment 13,414 0.08
Awareness for best practices 14,006 0.08
Not Stated 15,789,250 91.46
Total 17263091.32 100
Table 80 Own Patent Right by Sector
SECTOR PATENT RIGHT NO PATENT RIGHT Total
Number Percent Number Percent
Agriculture 241,098 9.16 2,391,943 90.84 2,633,041
Mining and Quarrying 781 2.86 26,584 97.14 27,365
Manufacturing 89,957 3.18 2,741,685 96.82 2,831,642
Construction 50,090 9.01 506,043 90.99 556,133
Wholesale and Retail Trade; Repair of Motor
Vehicles and Household Goods
337,811 3.80 8,543,219 96.20 8,881,029
Hotels and Restaurants 6,815 2.27 293,509 97.73 300,324
Transport, Storage and Communications 71,949 11.33 563,254 88.67 635,203
Real Estate, Renting and Business Activities 3,176 1.51 206,938 98.49 210,115
Education 2,833 8.52 30,426 91.48 33,259Health and Social Work - 0.00 12,712 100.00 12,712
Other Community, Social and Personal Service
Activities
47,588 7.80 562,300 92.20 609,887
Total 852,097 5.09 15,878,613 94.91 16,730,710
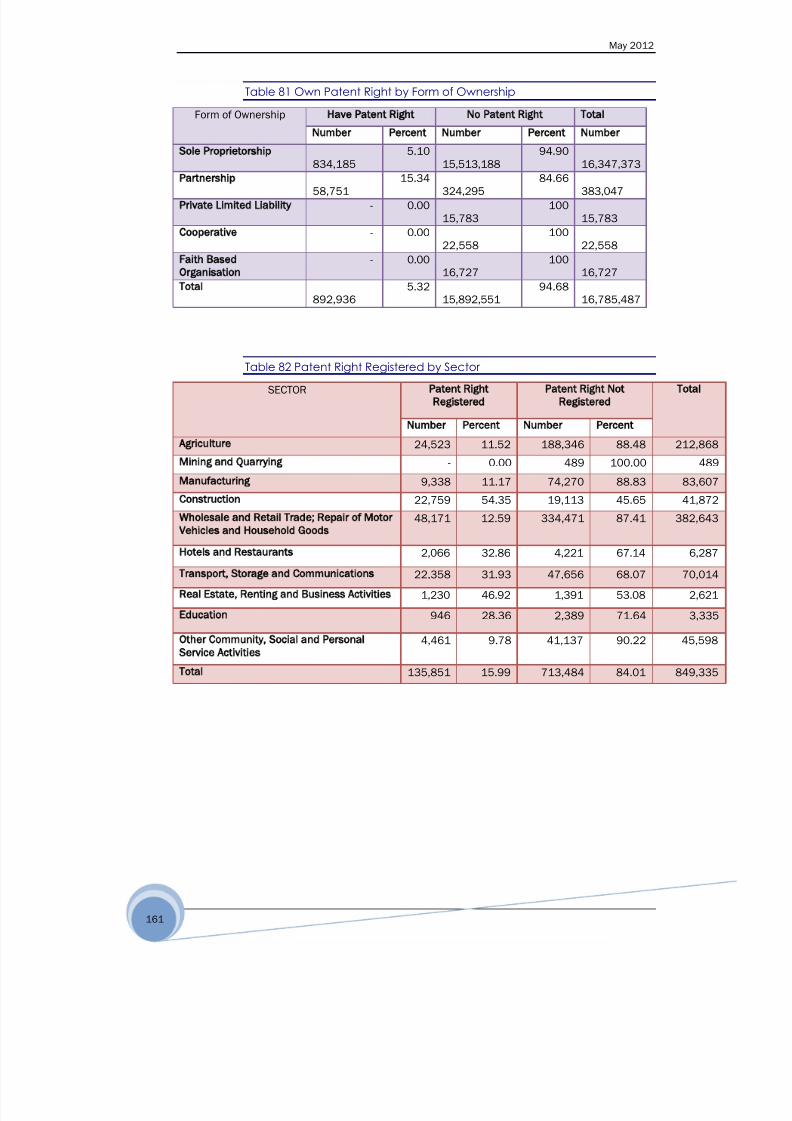
8/22/2019 MICRO, SMALL AND MEDIUM ENTERPRISES SURVEY IN NIGERIA BY SMEDAN
http://slidepdf.com/reader/full/micro-small-and-medium-enterprises-survey-in-nigeria-by-smedan 172/182
May 2012
161
Table 81 Own Patent Right by Form of Ownership
Form of Ownership Have Patent Right No Patent Right Total
Number Percent Number Percent Number
Sole Proprietorship
834,185
5.10
15,513,188
94.90
16,347,373Partnership
58,75115.34
324,29584.66
383,047
Private Limited Liability - 0.0015,783
10015,783
Cooperative - 0.0022,558
10022,558
Faith Based
Organisation
- 0.0016,727
10016,727
Total
892,9365.32
15,892,55194.68
16,785,487
Table 82 Patent Right Registered by Sector
SECTOR Patent Right
Registered
Patent Right Not
Registered
Total
Number Percent Number Percent
Agriculture 24,523 11.52 188,346 88.48 212,868
Mining and Quarrying - 0.00 489 100.00 489
Manufacturing 9,338 11.17 74,270 88.83 83,607
Construction 22,759 54.35 19,113 45.65 41,872
Wholesale and Retail Trade; Repair of Motor
Vehicles and Household Goods
48,171 12.59 334,471 87.41 382,643
Hotels and Restaurants 2,066 32.86 4,221 67.14 6,287
Transport, Storage and Communications 22,358 31.93 47,656 68.07 70,014
Real Estate, Renting and Business Activities 1,230 46.92 1,391 53.08 2,621
Education 946 28.36 2,389 71.64 3,335
Other Community, Social and Personal
Service Activities
4,461 9.78 41,137 90.22 45,598
Total 135,851 15.99 713,484 84.01 849,335

8/22/2019 MICRO, SMALL AND MEDIUM ENTERPRISES SURVEY IN NIGERIA BY SMEDAN
http://slidepdf.com/reader/full/micro-small-and-medium-enterprises-survey-in-nigeria-by-smedan 173/182
May 2012
162
Table 83 Skills Gap by Sector
SECTOR Qualified Artisans
Readily Available
Qualified Artisans Not
Readily Available
Total
Number Percent Number Percent
Agriculture 1,252,744 47.58 1,380,297 52.42 2,633,041Mining and Quarrying 12,752 46.60 14,614 53.40 27,365
Manufacturing 1,506,077 53.19 1,325,564 46.81 2,831,642
Construction 313,854 56.44 242,279 43.56 556,133
Wholesale and Retail Trade; Repair of Motor
Vehicles and Household Goods
3,951,572 44.48 4,932,692 55.52 8,884,265
Hotels and Restaurants 115,839 38.57 184,486 61.43 300,324
Transport, Storage and Communications 361,099 56.85 274,104 43.15 635,203
Real Estate, Renting and Business Activities 102,670 48.86 107,445 51.14 210,115
Education 22,257 66.92 11,002 33.08 33,259Health and Social Work 8,370 65.85 4,342 34.15 12,712
Other Community, Social and Personal
Service Activities
330,255 54.15 279,633 45.85 609,887
Total 7,977,488 47.67 8,756,457 52.33 16,733,946
Table 84 Skills Gap by Form of Ownership
Form of Ownership Qualified Artisans
Readily Available
Qualified Artisans Not
Readily Available
Total
Number Percent Number Percent
Sole Proprietorship 7,931,205 45.53 9,348,434 54.47
17,162,053Partnership 217,826 40.87 285,247 59.13 482,440
Cooperative 6,304 34.19 12,132 65.81 18,435
Faith Based Organization 19,762 100 - 0.00 19,762
Total 8,175,096 47.66 8,977,272 52.3417,152,368

8/22/2019 MICRO, SMALL AND MEDIUM ENTERPRISES SURVEY IN NIGERIA BY SMEDAN
http://slidepdf.com/reader/full/micro-small-and-medium-enterprises-survey-in-nigeria-by-smedan 174/182
May 2012
163
Table 85 Major Government Policy That Affect Business Most Favourably
Policy Number Percent
Sanitary inspectors 168,141 0.97
Good roads 539,898 3.13
Importation of raw materials 70,174 0.41
Job creation 34,914 0.20
Reduced tax 219,251 1.27
Exchange rate 44,301 0.26
Intervention Fund 322,287 1.87
Improved Power supply 237,087 1.37
Political stability 93,315 0.54
Banking reform 62,925 0.36
Policy on fertilizer production 132,917 0.77
Favourable atmosphere for business 888,608 5.15Not Stated 14,449,273 83.70
Total 17263091.32 100
Table 86 Major Government Policy That Affect Business Most Unfavourably
Policy Number Percent
Inadequate power supply 717,595 4.16
Excess Taxes 2,070,216 11.99
Demolition 167,363 0.97
Traffic Officials 39,137 0.23
Sanitation Official 126,160 0.73
Lack of Infrastructure 431,655 2.50
High cost of transport 293,867 1.70
High cost of petrol 397,003 2.30
High cost of permit 103,546 0.60
Withdrawal of subsidies 1,910,880 11.07
Introduction of sharia 46,633 027
High cost of living 295,523 1.71
Seizure of goods 29,601 00.17
Lack of social amenities 616,695 3.57
Banning goods 5059,767 0.35
Introduction of GSM 3,079 0.02
High cost of fund 251,552 1.46
Gov't policy of pension 36,308 0.21
Embargo on loans facilities 156,297 0.91
From bank 6,859 0.04
Not Stated 9,503,357 55.05
Total 17,263,091 100`
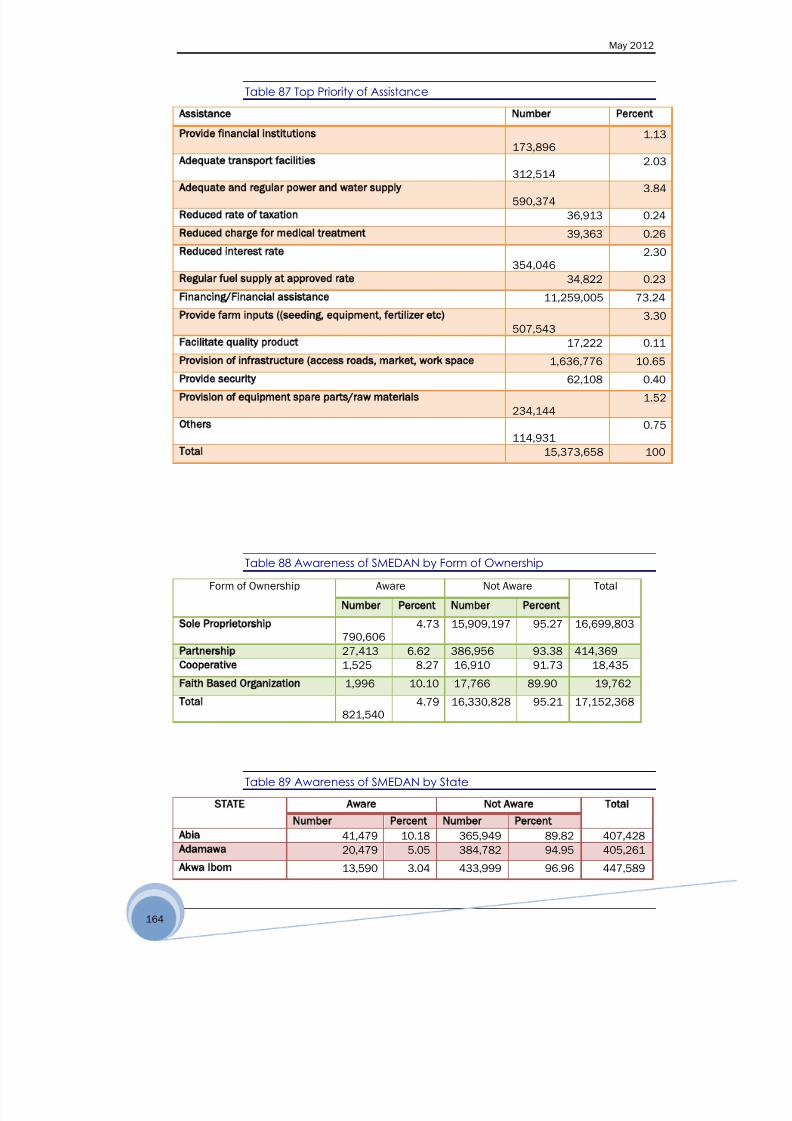
8/22/2019 MICRO, SMALL AND MEDIUM ENTERPRISES SURVEY IN NIGERIA BY SMEDAN
http://slidepdf.com/reader/full/micro-small-and-medium-enterprises-survey-in-nigeria-by-smedan 175/182
May 2012
164
Table 87 Top Priority of Assistance
Assistance Number Percent
Provide financial institutions
173,8961.13
Adequate transport facilities
312,5142.03
Adequate and regular power and water supply
590,3743.84
Reduced rate of taxation 36,913 0.24
Reduced charge for medical treatment 39,363 0.26
Reduced interest rate
354,0462.30
Regular fuel supply at approved rate 34,822 0.23
Financing/Financial assistance 11,259,005 73.24
Provide farm inputs ((seeding, equipment, fertilizer etc)
507,5433.30
Facilitate quality product 17,222 0.11
Provision of infrastructure (access roads, market, work space 1,636,776 10.65
Provide security 62,108 0.40
Provision of equipment spare parts/raw materials
234,1441.52
Others
114,9310.75
Total 15,373,658 100
Table 88 Awareness of SMEDAN by Form of Ownership
Form of Ownership Aware Not Aware Total
Number Percent Number Percent
Sole Proprietorship
790,6064.73 15,909,197 95.27 16,699,803
Partnership 27,413 6.62 386,956 93.38 414,369
Cooperative 1,525 8.27 16,910 91.73 18,435
Faith Based Organization 1,996 10.10 17,766 89.90 19,762
Total
821,5404.79 16,330,828 95.21 17,152,368
Table 89 Awareness of SMEDAN by State
STATE Aware Not Aware Total
Number Percent Number Percent
Abia 41,479 10.18 365,949 89.82 407,428
Adamawa 20,479 5.05 384,782 94.95 405,261
Akwa Ibom 13,590 3.04 433,999 96.96 447,589

8/22/2019 MICRO, SMALL AND MEDIUM ENTERPRISES SURVEY IN NIGERIA BY SMEDAN
http://slidepdf.com/reader/full/micro-small-and-medium-enterprises-survey-in-nigeria-by-smedan 176/182
May 2012
165
Anambra - 0.00 499,070 100.0 499,070
Bauchi 1,889 0.41 458,297 99.59 460,186
Bayelsa 12,213 2.91 408,021 97.09 420,233
Benue 4,087 0.94 432,304 99.06 436,391
Borno 10,544 2.28 452,465 97.72 463,009
Cross River - 0.00 472,291 100.0 472,291
Delta 21,237 4.37 464,786 95.63 486,023
Ebonyi 10,152 2.44 406,357 97.56 416,508
Edo - 0.00 491,220 100.0 491,220
Ekiti 77,898 18.47 343,872 81.53 421,770
Enugu - 0.00 423,006 100.0 423,006
Gombe 2,994 0.72 413,190 99.28 416,183
Imo 11,011 2.69 397,750 97.31 408,761
Jigawa 46,626 10.63 391,876 89.37 438,502
Kaduna 3,723 0.68 544,743 99.32 548,467Kano 35,732 4.10 836,820 95.90 872,552
Katsina - 0.00 525,742 100.0 525,742
Kebbi 14,171 3.66 372,543 96.34 386,714
Kogi 14,327 3.02 459,554 96.98 473,882
Kwara 804 0.19 426,865 99.81 427,668
Lagos 14,918 1.69 865,886 98.31 880,805
Nassarawa 145,173 30.95 323,811 69.05 468,985
Niger 42,852 10.11 381,014 89.89 423,866
Ogun 1,066 0.23 470,706 99.77 471,772
Ondo 1,251 0.25 489,509 99.75 490,761
Osun 9,449 1.96 471,902 98.04 481,351
Oyo 2,636 0.50 520,573 99.50 523,209
Plateau - 0.00 424,079 100.0 424,079
Rivers 159,096 27.18 426,145 72.82 585,241
Sokoto 46,595 12.28 332,912 87.72 379,507
Taraba 39,571 10.97 321,111 89.03 360,682
Yobe - 0.00 364,806 100.0 364,806
Zamfara 968 0.25 384,686 99.75 385,654
FCT 19,046 6.99 253,533 93.01 272,579
Total 825,576 4.78 16,436,177 95.22 17,261,753
Table 90 Benefit from SMEDAN Services by State
STATE Benefitted Not Benefitted Total
Number Percent Number Percent
Abia - 0.0 41478.9 100.0 41478.9
Adamawa 1400.086 6.8 19079.35 93.2 20479.44
Akwa Ibom 776.1018 5.7 12813.69 94.3 13589.79
Bauchi 1888.971 100.0 - 0.0 1888.971

8/22/2019 MICRO, SMALL AND MEDIUM ENTERPRISES SURVEY IN NIGERIA BY SMEDAN
http://slidepdf.com/reader/full/micro-small-and-medium-enterprises-survey-in-nigeria-by-smedan 177/182
May 2012
166
Bayelsa - 0.0 12212.67 100.0 12212.67
Benue - 0.0 4087.403 100.0 4087.403
Borno 3000.638 28.5 7543.272 71.5 10543.91
Delta - 0.0 21236.73 100.0 21236.73
Ebonyi - 0.0 10151.51 100.0 10151.51Ekiti 1866.957 2.4 76030.65 97.6 77897.6
Gombe 672.3094 22.45 2321.194 77.5 2993.504
Imo - 0.0 11010.8 100.0 11010.8
Jigawa - 0.0 46625.96 100.0 46625.96
Kaduna 3723.205 100.0 - 0.0 3723.205
Kano 9608.739 26.8 26123.09 73.1 35731.83
Kebbi - 0.0 14170.83 100.0 14170.83
Kogi 976.4352 6.8 13350.89 93.2 14327.32
Kwara - 0.0 803.6366 100.0 803.6366
Lagos 1880.798 12.6 13037.67 87.4 14918.47
Nassarawa 628.9914 0.4 144544.5 99.6 145173.5
Niger - 0.0 42852.48 100.0 42852.48
Ogun - 0.0 1065.751 100.0 1065.751
Ondo 1251.363 100.0 - 0.0 1251.363
Osun - 0.0 9448.913 100.0 9448.913
Oyo - 0.0 2635.969 100.0 2635.969
Rivers - 0.0 159095.9 100.0 159095.9
Sokoto - 0.0 46595.09 100.0 46595.09Taraba 513.9082 1.2 39057.35 98.7 39571.26
Zamfara 967.8296 100 - 0.0 967.8296
FCT - 0.0 19045.81 100.0 19045.81
Total 29156.33 3.5 796420 96.46837 825576.4
Table 91 Benefitted from SMEDAN by Form of Ownership
Form of Ownership Benefitted Not Benefitted Total
Number Percent Number Percent
Sole Proprietorship 25,658 3.0 822,305 97.0 847,962
Partnership 0 0 28,387 100 28,387
Cooperative 0 0 1,525 100 1,525
Faith Based Organization 0 0 1,996 100 1,996
Total 25,658 2.9 854,213 97.1 879,870

8/22/2019 MICRO, SMALL AND MEDIUM ENTERPRISES SURVEY IN NIGERIA BY SMEDAN
http://slidepdf.com/reader/full/micro-small-and-medium-enterprises-survey-in-nigeria-by-smedan 178/182
May 2012
167
Table 92 Ranking of SMEDAN Services Received
Ranking Entrepreneurship Training
Vocational SkillUpgrading
Facilitation ofAccess to
Market
Facilitation oAccess toFinance
BusinessCounseling/M
onitoring
Facilitation ofProduct Quality
Control &Certification
Facilitation ofAccess to
Information
Others
No. % No. % No. % No. % No. % No. % No. % No. %
1 57,039 6.3 13,941 1.6 21,232 2.4 21,163 2.4 901 0.1 825,353
97.3 3,540 0.4 62,339 6.9
2 835,612
91.7 832,627 94.6 838,167
94.0 836,278
94.3 828,130
96.9 1,265 0. 822,718
96.7 827,528
91.7
3 14,149 1.6 4,602 0.5 14,143 1.6 6,863 0.8 2,403 0.3 3,155 0.4 3,023 0.4 901 0.1
4 1,447 0.2 11,449 1.3 9,375 1.1 7,514 0.8 4,714 0.6 5,285 0.6 4,354 0.5 1,971 0.2
5 1,730 0.2 9,242 1.0 2,176 0.2 5,782 0.7 7,608 0.9 2,075 0.2 6,906 0.8 1,099 0.1
6 - 0.0 6,547 0.7 3,316 0.4 5,697 0.6 2,850 0.3 5,839 0.7 4,824 0.6 5,518 0.6
7 838 0.1 2,113 0.2 2,930 0.3 3,014 0.3 8,421 1.0 3,789 0.4 3,340 0.4 2,821 0.3
8 - 0 - 0 - 0 - 0 - 0 - 0 1,099 0.1 - 0
Total 910,815
100 880,521 100 891,340
100 901 0.1 855,027
100 1,099 0.1 969 0.1 902,176
100
Table 93 Ranking of Major Problem Militating Against Businesses in Nigeria
4.2.37 Ranking of Major Problem Militating Against Business in Nigeria
ack ofccess
tonance
Lack ofwork
space
WeakInfrastructure
Lack ofEntrepreneurshi
p
Obsolete
Equipment
Lackof
access to
R& D
Inconsistent
policies
Transportation
Lackof
government
Suppor
t
Inadequate
PowerSupply
ExcessTax
HighIntere
stRate
Subsidies
Illiteracy
None
84.2 3.5 4.6 3.6 1.9 2.1 2.4 2.7 2.7 4.0 4.5 4.8 10.4 11.3 17.6
12.1 50.2 37.6 32.2 16.2 14.8 13.9 34.7 37.8 38.2 41.0 44.7 48.3 60.1 48.9
1.8 12.1 34.4 18.4 12.7 14.4 10.3 1.9 0.8 1.6 2.6 3.7 14.2 6.4 8.9
0.9 9.2 9.3 25.8 12.2 17.0 10.4 1.9 1.8 21.3 6.8 9.6 5.4 4.6 5.7
0.4 6.3 6.5 8.1 33.5 14.1 10.2 1.2 2.8 5.8 33.5 16.6 10.9 8.3 10.0
0.3 6.6 5.3 9.5 14.9 27.2 11.1 0.9 1.4 15.2 6.5 16.9 6.2 5.3 4.5
0.3 11.7 2.1 2.4 8.1 9.3 32.9 5.8 25.6 4.3 0.4 0.6 0.4 0.7 0.8
0.1 0.3 0.1 0.0 0.3 0.7 1.1 49.2 8.3 2.6 1.8 1.9 2.2 1.4 1.3
0.0 0.0 0.1 0.1 0.2 0.5 7.6 1.8 18.8 7.0 2.9 1.3 2.1 2.0 2.4
100 100 100 100 100 100 100 100 100 100 100 100 100 100 100

8/22/2019 MICRO, SMALL AND MEDIUM ENTERPRISES SURVEY IN NIGERIA BY SMEDAN
http://slidepdf.com/reader/full/micro-small-and-medium-enterprises-survey-in-nigeria-by-smedan 179/182
May 2012
168
Table 94 Personal Insurance of Owners
Form of Ownership Insured Self Did Not Insure Self
Number Percent Number Percent
Sole Proprietorship 278,849 1.66 16,524,207 98.34 16,803,056
Partnership 11,454 3.23 343,596 96.77 355,050
Cooperative - 0 14,487 100 14,487
Faith Based
Organization
1,996 11.93 14,731 88.07 16,727
Total 292,299 1.7 16,897,022 98.3 17,189,320
Table 95 Personal Banking Relationship of Owners
Form of Ownership Had Personal BankingRelationship
No Personal BankingRelationship
Number Percent Number Percent
Sole Proprietorship 2,899,873 17.26 13,903,183 82.74 16,803,056
Partnership 76,587 21.57 278,463 78.43 355,050
Cooperative 12,420 85.73 2,067 14.27 14,487
Faith Based Organization 4,284 25.61 12,443 74.39 16,727
Total 2,993,164 17.41 14,196,157 82.59 17,189,320
Table 96 Qualification Attained by Workers
orm of Ownership Primary Secondary Technical NCE/ND B.Sc/HND PostGraduate
Non-FormalEducation
NoEducation
16.44 15.64 8.78 9.00 8.54 8.58 14.14 18.89 100
25.55 25.28 3.22 4.57 3.68 2.87 11.51 23.32 100
27.56 26.42 5.92 13.50 5.92 5.92 8.84 5.92 100
20.53 10.51 12.02 12.02 12.02 12.02 12.02 8.85 100
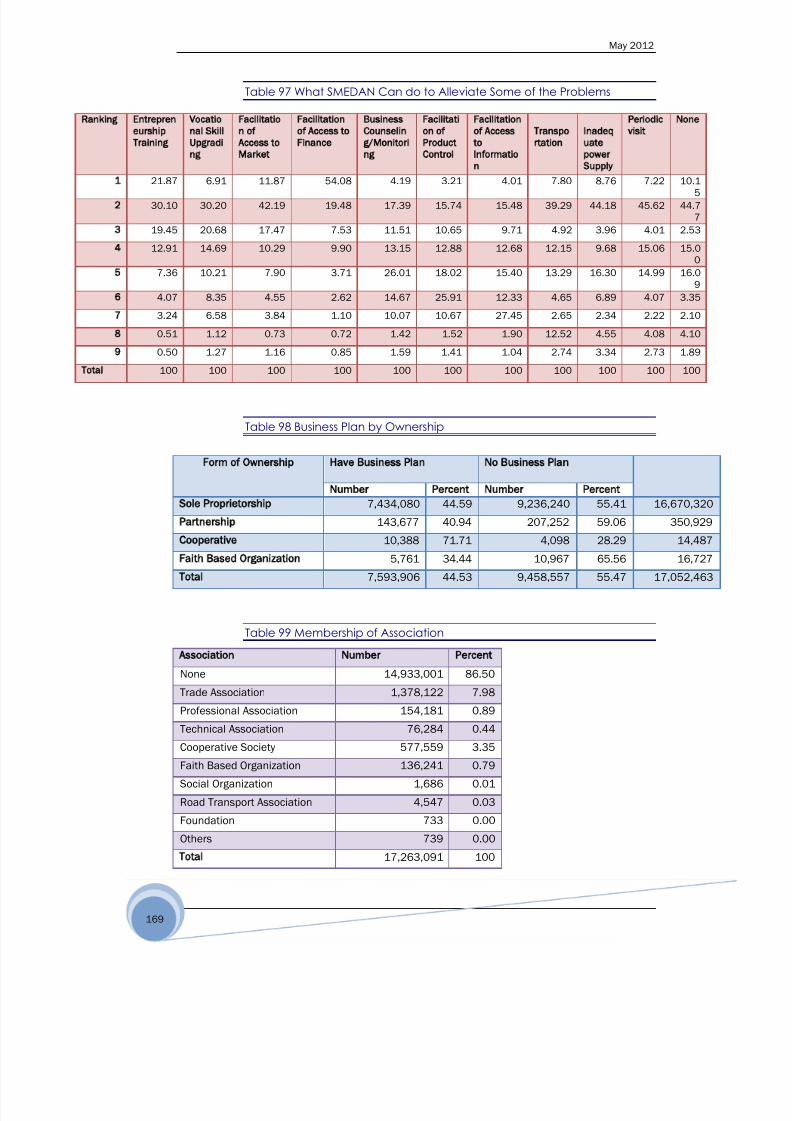
8/22/2019 MICRO, SMALL AND MEDIUM ENTERPRISES SURVEY IN NIGERIA BY SMEDAN
http://slidepdf.com/reader/full/micro-small-and-medium-enterprises-survey-in-nigeria-by-smedan 180/182
May 2012
169
Table 97 What SMEDAN Can do to Alleviate Some of the Problems
Ranking Entrepren
eurship
Training
Vocatio
nal Skill
Upgradi
ng
Facilitatio
n of
Access to
Market
Facilitation
of Access to
Finance
Business
Counselin
g/Monitori
ng
Facilitati
on of
Product
Control
Facilitation
of Access
to
Informatio
n
Transpo
rtation
Inadeq
uate
power
Supply
Periodic
visit
None
1 21.87 6.91 11.87 54.08 4.19 3.21 4.01 7.80 8.76 7.22 10.15
2 30.10 30.20 42.19 19.48 17.39 15.74 15.48 39.29 44.18 45.62 44.77
3 19.45 20.68 17.47 7.53 11.51 10.65 9.71 4.92 3.96 4.01 2.53
4 12.91 14.69 10.29 9.90 13.15 12.88 12.68 12.15 9.68 15.06 15.00
5 7.36 10.21 7.90 3.71 26.01 18.02 15.40 13.29 16.30 14.99 16.09
6 4.07 8.35 4.55 2.62 14.67 25.91 12.33 4.65 6.89 4.07 3.35
7 3.24 6.58 3.84 1.10 10.07 10.67 27.45 2.65 2.34 2.22 2.10
8 0.51 1.12 0.73 0.72 1.42 1.52 1.90 12.52 4.55 4.08 4.10
9 0.50 1.27 1.16 0.85 1.59 1.41 1.04 2.74 3.34 2.73 1.89
Total 100 100 100 100 100 100 100 100 100 100 100
Table 98 Business Plan by Ownership
Form of Ownership Have Business Plan No Business Plan
Number Percent Number Percent
Sole Proprietorship 7,434,080 44.59 9,236,240 55.41 16,670,320
Partnership 143,677 40.94 207,252 59.06 350,929
Cooperative 10,388 71.71 4,098 28.29 14,487
Faith Based Organization 5,761 34.44 10,967 65.56 16,727
Total 7,593,906 44.53 9,458,557 55.47 17,052,463
Table 99 Membership of Association
Association Number Percent
None 14,933,001 86.50
Trade Association 1,378,122 7.98
Professional Association 154,181 0.89
Technical Association 76,284 0.44
Cooperative Society 577,559 3.35
Faith Based Organization 136,241 0.79
Social Organization 1,686 0.01
Road Transport Association 4,547 0.03
Foundation 733 0.00
Others 739 0.00
Total 17,263,091 100

8/22/2019 MICRO, SMALL AND MEDIUM ENTERPRISES SURVEY IN NIGERIA BY SMEDAN
http://slidepdf.com/reader/full/micro-small-and-medium-enterprises-survey-in-nigeria-by-smedan 181/182
May 2012
170
Table 100 Micro, Small, Medium Enterprises (MSMEs) Nominal GDP (Naira
million)
SECTOR Micro Small Medium Total MSME
GDP
Total GDP by
Sector
MSME
Ratio to
Total ( )
Agriculture, Hunting, Forestryand Fishing
7,174,496.33 2,605,244.95 325,377.40 10,105,118.68 10,310,655.64 98.01
Mining and Quarrying 1,943.25 16,193.79 12,833.55 30,970.60 45,691.79 67.78
Manufacturing 47,023.02 188,092.08 174,809.83 409,924.93 643,070.22 63.74
Building and Construction 1,934.61 7,738.45 32,777.55 42,450.62 394,666.15 10.76
Wholesale and Retail Trade:Repair of Motor Vehicles andHousehold goods
183,075.18 2,171,612.18 805,530.81 3,160,218.17 4,648,696.98 67.98
Hotels and Restaurants 4,795.50 31,970.00 9,452.01 46,217.51 113,791.81 40.62
Transport, Storage andCommunications
51,010.97 83,464.61 180,116.21 314,591.79 791,543.34 39.74
Financial Intermediation 4,925.75 15,762.40 6,304.96 26,993.10 507,799.25 5.32
Real Estate, Renting andBusiness Activities
1,083,974.42 235,130.77 17,392.13 1,336,497.32 1,348,226.89 99.13
Education 4,487.28 8,413.66 14,022.76 26,923.70 56,091.04 48.00
Health and Social Work 2,950.98 3,058.62 3,195.60 9,205.20 12,470.22 73.82
Other Community, Social andPersonal Service Activities
308,578.37 59.91 62.60 308,700.88 308,764.84 99.98
Totals by MSME classification 8,869,195.68 5,366,741.41 1,581,875.41 15,817,812.50 19,181,468.17
Total GDP at Current Basic
Prices (Nominal)
33,984,754.13 46.54
Table 101 Contribution to Each GDP Economic Activity (%)
Table 4.3.2: Contribution of MSME to Each GDP Economic Activity (Percentage)
SECTOR Micro Small Medium Total
1 Agriculture, Hunting, Forestry and Fishing 69.58 25.27 3.16 98.01
2 Mining and Quarrying 4.25 35.44 28.09 67.78
3 Manufacturing 7.31 29.25 27.18 63.74
4 Building and Construction 0.49 1.96 8.31 10.76
5 Wholesale and Retail Trade: Repair of MotorVehicles and Household goods
3.94 46.71 17.33 67.98
6 Hotels and Restaurants 4.21 28.10 8.31 40.62
7 Transport, Storage and Communications 6.44 10.54 22.76 39.74
8 Financial Intermediation 0.97 3.10 1.24 5.32
9 Real Estate, Renting and Business Activities 80.40 17.44 1.29 99.13
10 Education 8.00 15.00 25.00 48.00
11 Health and Social Work 23.66 24.53 25.63 73.82
12 Other Community, Social and Personal ServiceActivities
99.94 0.02 0.02 99.98

8/22/2019 MICRO, SMALL AND MEDIUM ENTERPRISES SURVEY IN NIGERIA BY SMEDAN
http://slidepdf.com/reader/full/micro-small-and-medium-enterprises-survey-in-nigeria-by-smedan 182/182
May 2012
Table 102 Initial Start-Up Capital at Inception (N '000)
AMOUNT (N‟000 TOTAL NUMBER PERCENTAGE
Below 50 14,062,562 8050-100 2,340,052 13.3101-200 589,533 3.4201-300 191,853 1.1301-400 90,557 0.5401-500 125,480 0.7501-600 23,702 0.1601-700 20,109 0.1701-800 18,279 0.1801-900 12,279 0.1901-1000 50,964 0.3
Above 1000 61,135 0.3
Total 17,586,352 100
Table 103 Personal Insurance Owners
Form of Ownership Self Insured Not Self Insured TOTAL


![Power Sector Challenges, Reforms and Opportunities in · PDF filePower Sector Challenges, Reforms ... and privatisation in Nigeria] ... • Mixed-capital enterprises](https://static.fdocuments.us/doc/165x107/5a9dd5a47f8b9a0d5a8cc1f4/power-sector-challenges-reforms-and-opportunities-in-sector-challenges-reforms.jpg)

