Micro Mag Power
10
88 October 2007 1527-3342/07/$25.00©2007 IEEE Power-Handling Capability for RF Filters Ming Yu M odern high-performance RF (radio frequency + microwave) filters are widely used in com- munication and radar transmit- ter systems, where there are demands for the estimation of power-handling capabilities. Since increasing transmitter power levels is the simplest way to boost system range and capability, based on developments in the last decade one can only predict that future systems will require designs with even higher power lev- els. Typical hardware examples include satellite output filters and multiplexers, wireless or radio base station transmitter filters and diplexers, and transmitter filters in radar systems. Market force also continuously demands volume and mass reduction and presents more and more challeng- ing power requirements. When designing a filter for these high-power operations, one often has to take into account the following effects: • multipaction breakdown • ionization breakdown • passive intermodulation (PIM) interferences • thermal-related high-power breakdown and detuning. Multipaction [1] is an RF vacuum breakdown mech- anism in which there is resonant growth of free electron space charge between two surfaces. The intensity of the applied field is such that the electrons bombarding the walls cause continuous release of secondary electrons. Multipaction has occurred not only in RF components designed for operations in space, but in klystrons, cyclotrons, and accelerators. Ionization breakdown [2] is an RF gas (such as air) breakdown phenomenon where an initially low electron density increases in an avalanche-like manner, thus Ming Yu ([email protected]) is with COM DEV Ltd, Cambridge, Ontario, Canada and the University of Waterloo. Digital Object Identifier 10.1109/MMM.2007.904712 © ARTVILLE
Transcript of Micro Mag Power

88 October 20071527-3342/07/$25.00©2007 IEEE
Power-HandlingCapability for
RF FiltersMing Yu
Modern high-performance RF(radio frequency + microwave)filters are widely used in com-munication and radar transmit-ter systems, where there are
demands for the estimation of power-handlingcapabilities. Since increasing transmitter powerlevels is the simplest way to boost system rangeand capability, based on developments in the lastdecade one can only predict that future systemswill require designs with even higher power lev-els. Typical hardware examples include satelliteoutput filters and multiplexers, wireless or radiobase station transmitter filters and diplexers, andtransmitter filters in radar systems. Market forcealso continuously demands volume and massreduction and presents more and more challeng-ing power requirements. When designing a filterfor these high-power operations, one often has totake into account the following effects:
• multipaction breakdown• ionization breakdown• passive intermodulation (PIM) interferences• thermal-related high-power breakdown and
detuning.Multipaction [1] is an RF vacuum breakdown mech-
anism in which there is resonant growth of free electronspace charge between two surfaces. The intensity of theapplied field is such that the electrons bombarding the
walls cause continuous release of secondary electrons.Multipaction has occurred not only in RF componentsdesigned for operations in space, but in klystrons,cyclotrons, and accelerators.
Ionization breakdown [2] is an RF gas (such as air)breakdown phenomenon where an initially low electrondensity increases in an avalanche-like manner, thus
Ming Yu ([email protected]) is with COM DEV Ltd, Cambridge, Ontario, Canada and the University of Waterloo.
Digital Object Identifier 10.1109/MMM.2007.904712
© ARTVILLE
October 2007 89
turning an isolating gas into conducting plasma.Ionization breakdown occurs at higher pressures thanmultipaction. Breakdown must be considered for ground-based and some space-bound components, because RFcomponents designed for operations in space often mustbe tested on the ground at full power or are required tooperate during launch for telemetry purposes.
Multipaction and ionization breakdown are distinctfields of the RF failure mode that have been studied formany years [1]–[2]. In this article, a comprehensive engi-neering approach to breakdown analysis will be pre-sented with a focus on RF filters. Guidelines for improv-ing peak power-handling capacities will also be covered.
PIM level cannot be predicted accurately for mostmicrowave filters. PIM is largely a workmanship-relatedissue in production. Techniques for reducing PIM at thedesign stage [3] are beyond the scope of this article.
Under RF power, RF filters dissipate a significantamount of heat, which leads to an overall temperaturerise and local hot spots. In this article, breakdownanalysis will be performed for peak power only, whiletemperature is treated equivalently as an environmen-tal factor. A good thermal engineering design must alsoensure an acceptable increase and distribution in thetemperature, which is beyond the scope of this article.Other failure modes under high RF power such asdetuning, cracking of dielectric resonator or filler mate-rial, and added stress can be found in literature [4].
Analyzing the RF breakdown in a filter will includethe following steps:
• Determine the breakdown threshold.• Perform field or circuit analysis to obtain max
field or voltage values.• Compare the worst-case values against the break-
down threshold.• Determine and apply the safety margins.• Conduct thermal analysis for extremely high-
power devices.It is desirable in the early design stage that the above
process be followed so that the most suitable technolo-gy and structure are selected for a given specification.In the following sections, details of the above steps willbe presented except for the thermal analysis.
Multipaction Breakdown Susceptibility ThresholdThe multipaction effect is a vacuum discharge pro-duced by an RF field between a pair of surfaces.Breakdown in filters is a failure mode that results innoise, harmonics, increased out-gassing, and eveneventual gas discharge (when not properly vented). Inmultipaction breakdown, the pressure is often suffi-ciently low (< 10−5 torr) that the mean free path (aver-age random collision distance of particles) is largerthan the conducting surface separation distance (gap).Under an RF field, electrons can travel freely and accel-erate to bombard the conducting surface and generate
secondary electrons. At an odd multiple of one-halfcycle, the multipaction (avalanche) effect will occur.Each of these odd numbers is often referred to as theorder of multipaction modes. Many researchers havedone extensive theoretical and experimental studies toobtain the breakdown threshold as a function of the fre-quency ( f ) and gap (size: d) product f × d (where f isin GHz and d is in mm). Use of this product f × dallows scaling of the breakdown threshold betweenresults made at different frequencies and with differentgap sizes. The data is then used to establish multi-paction design curves (susceptibility zones) for thedesign of high-power RF components.
Waveguide Structure – Parallel Plate ModelThe parallel plate model is the most common approachfor establishing a multipaction threshold for wave-guide structures. It is developed by the European SpaceAgency (ESA) [1] via a series of experiments with dif-ferent gap sizes and waveguide geometries. Since vac-uum discharge produced by an RF field often requiresa pair of surfaces to set up, this model is widely used(at least conservatively) for waveguide filters. In theo-ry, the model is only applied to parallel plate geometryof infinite size, but it is used in many different wave-guide structures with different sizes and shapes. It isnoted that all ESA tests were done using a reduced-height waveguide section with limited sizes.
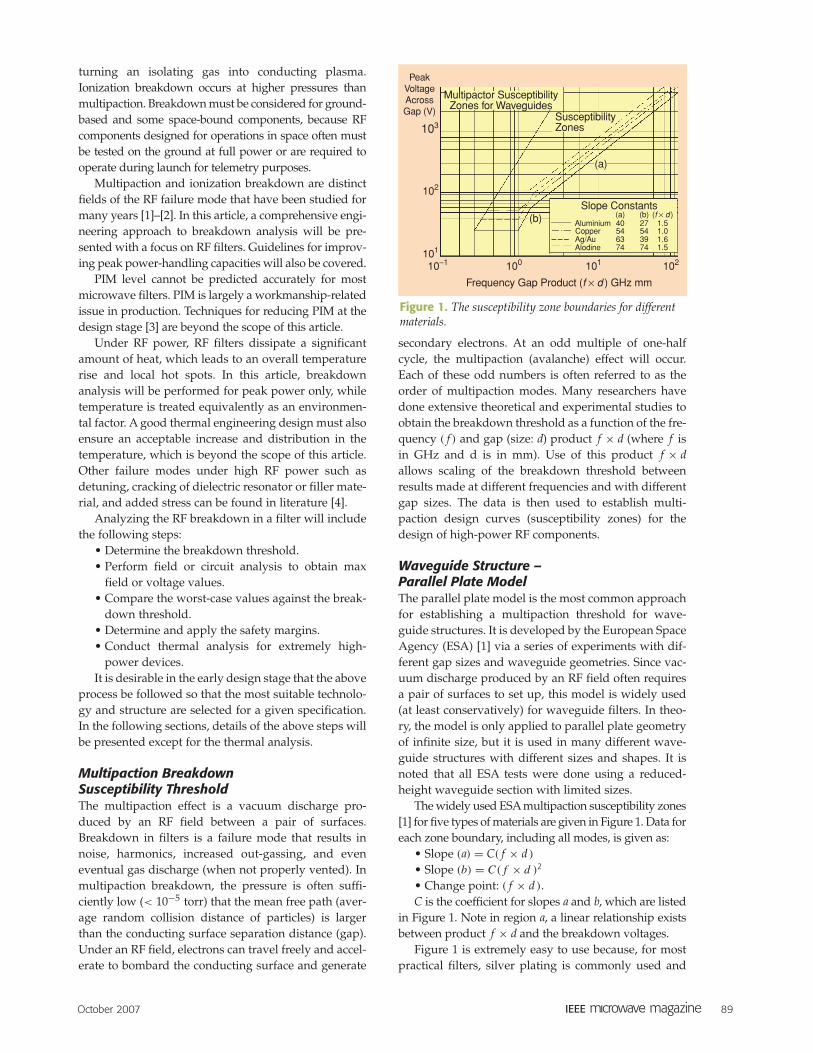
The widely used ESA multipaction susceptibility zones[1] for five types of materials are given in Figure 1. Data foreach zone boundary, including all modes, is given as:
• Slope (a) = C( f × d )
• Slope (b) = C( f × d )2
• Change point: ( f × d ).C is the coefficient for slopes a and b, which are listed
in Figure 1. Note in region a, a linear relationship existsbetween product f × d and the breakdown voltages.
Figure 1 is extremely easy to use because, for mostpractical filters, silver plating is commonly used and
Figure 1. The susceptibility zone boundaries for differentmaterials.
PeakVoltageAcrossGap (V)
Multipactor SusceptibilityZones for Waveguides
Frequency Gap Product (f × d ) GHz mm
103
102
101
10−1 100 101 102
AluminiumCopperAg/AuAlodine
Slope Constants(a)40546374
27543974
1.51.01.61.5
(b) (f × d)
(a)
(b)
SusceptibilityZones
90 October 2007
f × d > 1. Once the frequency ( f ) and gap (size: d)product f × d is obtained, simply multiplying it byconstant C = 63 would result in the maximum peakvoltage across the gap. For example, at 10 GHz, a 1-mmgap can take up to a 630 V peak voltage. Figure 1 alsopoints out that when f × d < 0.3 (0.7 in [2]), no multi-paction effect will occur.
Coaxial StructureFor a coaxial structure of low impedance (under 50 �),the multipaction susceptibility threshold was similar tothat of the parallel plate case as shown in the last section.For higher-impedance structures, Woo’s curve of NASAin [2] can be used as shown in Figure 2. Although simplyincreasing the impedance level in a coaxial line will notalways result in an improvement in power-handlingcapability, it is equally wrong to simply analyze a high-impedance structure using the parallel plate model.
In Figure 2, b is the outer diameter and a is the innerdiameter. Note that Woo’s curve uses root mean square(RMS) value for voltage while the ESA curve in Figure1 uses peak value. The product f × d in Woo’s curve isin MHz cm. Within 2.3 < b/a < 9.13, different b/a val-ues can be interpolated from this one.
SummaryIn summary, multipaction relies only on secondaryelectron emission from conducting surfaces. To analyzea real device, voltages across the conducting surfaceunder a specified input power have to be derived fromthe integration of electrical field components. This willbe discussed in the “Obtain Field Strength and VoltageValues” section. Factors like type of gas or pressurelevel will not impact the breakdown mechanism aslong as the pressure is low enough that the mean freepath will be larger than the gap between conductingsurfaces. Venting is another critical aspect of multi-paction analysis that is not covered here [1]. Althoughthe multipaction effect is considered complex, and dif-ficult to predict and test, it is actually one of the moreconsistent and simpler breakdown mechanisms whencompared with ionization breakdown.
Gas Ionization Breakdown ThresholdThe most common gas one encounters is, of course, air.The ionization of air (or any other gas, without loss of
generality) is caused by electron impacts under an RFfield [2], [5]. Contrary to multipaction, the mean freepath of air is often much smaller than most physicaldimensions (like gaps), which enables a more localizedeffect. If the energy level (thanks to the RF field) is suf-ficient to cause ionization of neutral molecules and thetotal free electrons created by ionization exceed thetotal loss due to attachment and recombination, theexponential growth of electron density results in elec-tron plasma and eventual breakdown.
The most accurate method for analyzing ionizationbreakdown involves the kinetic theory and uses a sta-tistical approach and particle distribution equations.The electrodynamic interaction is governed by well-known Maxwell equations. With full boundary condi-tions applied to complex geometries, extensive numer-ical modeling is required and is still beyond the reachof most real-life microwave engineers. A semianalyticalapproximation exists using the variational method [6],[7]. The following equation can be used to calculate theair ionization breakdown threshold (electrical fieldstrength in RMS value, V/cm) as a function of frequen-cy (Hz), pressure (torr), and pulse length (s)
Ep = 3.75p
(1 + ω2
25 × 1018
) 12
×(
106
p2Lef f2 + 6.4 × 10⁴ + 20
pτp
) 316
, (1)
where
p = po273
273 + To,
wherepo: air pressure in torrTo: temperature in ◦Cω : angular frequencyLeff = effective diffusion length in cmτρ: pulse length in s.
The effective diffusion length Leff [8] can only bederived analytically for limited geometries. For practi-cal purposes, one often approximates it as half of thegap size or simply omits the term (at higher pressure)associated with it in the above equation. Note that at 1atmosphere pressure (760 torr), one would get an elec-trical field strength of about 22.8 KV/cm (RMS), whichis often used as a rule of thumb within the microwaveengineering community. At high altitude H (ft), thisformula is often used to convert height to pressure
po = 758.19 − 28.0924H + 0.3937H2 − 0.002009H3. (2)
At low pressure, there is more space (larger meanfree path) for particles. Eventually, the mean free pathis increased to equal the limit d (gap size) where
Multipaction is an RF vacuumbreakdown mechanism in whichthere is resonant growth of freeelectron space charge between two surfaces.

October 2007 91
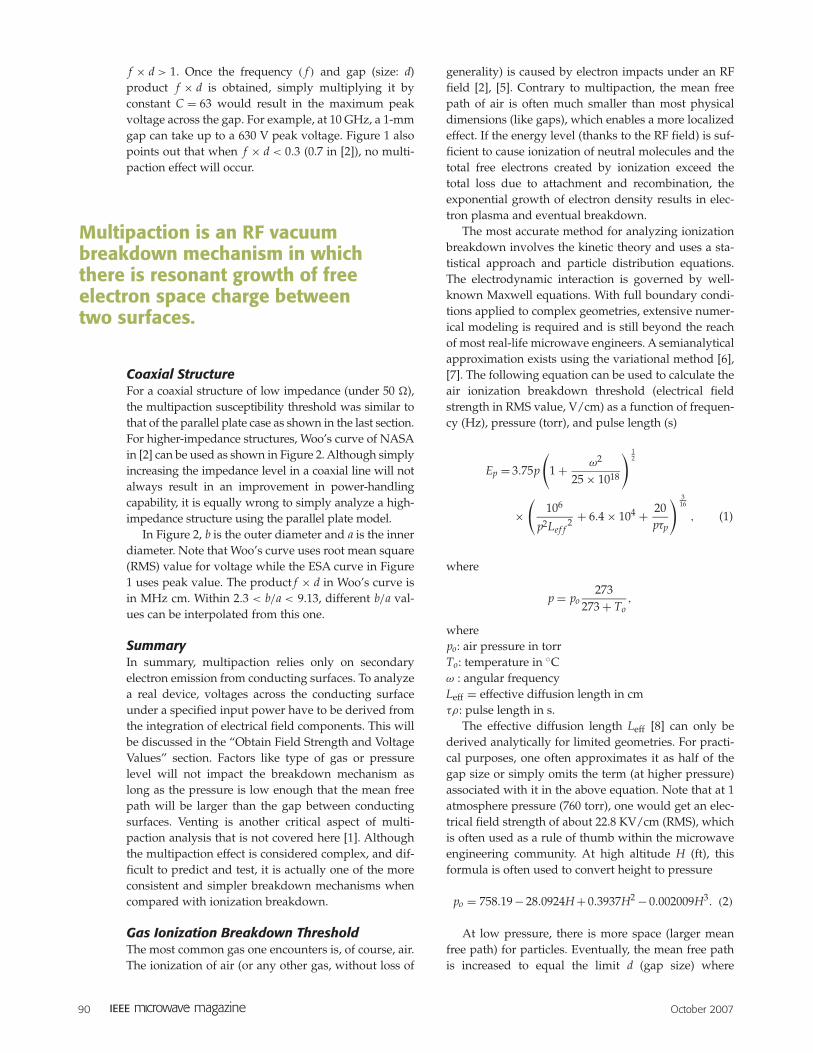
multipaction starts to be susceptible. The mean freepath limit separates the ionization and multipactionbreakdowns. Generally speaking, reducing pressureleads to lower power-handling capability until it reach-es a minimum point, often called the critical pressure.After that, the power-handling capability starts toincrease. Figure 3 captures this phenomenon in the so-called Paschen curve [5] with both diffusion length andpulse width as parameters.
One obvious application of Figure 3 is that when asufficient peak power level cannot be achieved in thetest facilities, one may perform an equivalent test at alower pressure. On the other hand, tests are oftenrequired at reduced pressures because operating at ele-vated altitude is another common request for wirelessapplications.
Multipaction and ionization breakdown are closelylinked phenomena. It is widely believed that theobserved multipaction damage may actually be due toa multipaction-induced gas discharge, because ioniza-tion is much more energetic and is known to be able tophysically damage microwave components such as inleaving burn marks and melting away solder joints.Multipaction damage of this extent is very rarebecause if the detection system were very sensitive, thetest would have been stopped before it had reachedsuch a stage. Multipaction is known to be able to trig-ger ordinary gas discharges, either by increasing theout-gassing from the component or just by startingbreakdown at a very low pressure (such as 10−2 torr).At a field strength that is susceptible to multipaction,ionization is not even expected unless out-gassingfrom multipaction breakdown increases the pressurelevel at a certain local area. Since gas breakdown canbe sustained at a much lower voltage around criticalpressure, ionization breakdown occurs as a result ofmultipaction breakdown. Because the ionizationthreshold is closely related to the temperature asshown in the above formula, the multipaction thresh-old is also related to temperature. Another theory isthat both multipaction and ionization breakdown hap-pen at the same time at very low pressure (beforereaching hard vacuum).
With the established breakdown threshold, it istime to look into field analysis for multipaction (whichrequires voltage values) and ionization (whichrequires electrical field strength). The threshold valueswill be revisited in later sections with more practicalconsiderations.
Obtain Field Strength and Voltage ValuesFor any homogenous transmission line system such asa waveguide or coaxial line, peak voltages Vo can beeasily derived as a function of input power Po and char-acteristic impedance Zo
Vo =√
2Zo Po.
This value is used at an input port as the excitationvoltage. Electrical field values are mode dependent andcan be derived based on formulas commonly found inmicrowave engineering textbooks. In most practicalcases, high-Q and narrow-band filters are often used.Inside those narrow-band high-Q resonators, electricalfield strength or voltages can reach to orders of magni-tude higher than input values. This phenomenon iscalled voltage magnification. For very wideband filters
Figure 3. Paschen curve for pulsed microwave breakdownin air.
105
104
103
102
E (
V/c
m)
10−1 100 101 102 103
p (torr)
τp = 10 μs
τp = 10 ns
Air, f = 10 GHz
Leff = 0.01 cm
Leff = 1 cmLeff = 0.1 cm
Figure 2. Multipaction region for coaxial transmissionlines with varying values of Zo.
103
102
Bre
akdo
wn
Vol
tage
(m
s V
)
700600
500
400
300
200
150
100908070
60
50
40
3060 80 100 150 200 300
*After 2 min ofOutgassing
Frequency x Electrode Separation Distance fd, MHz
b/o zo,Ω505091
132.5174
d.cm2.002.002.763.143.34
2.30
4.56
18.269.13
2.30*

92 October 2007
(>20%), the same voltage value as at the input may bedirectly used inside filters due to low voltage amplifi-cation and the extra margins to be discussed in the“Practical Considerations” section.
An exact analysis of the electrical field distributioninside an RF filter involves the three-dimensional (3-D)analysis of the filter structure using either private elec-tromagnetic (EM) codes or commercial tools such as
Ansoft HFSS or CST Microwave Studio (MWS).Voltages are simply the results of a line integration ofcalculated electrical field strength. However, suchanalyses are possible but extremely time consumingand are even a bit impractical if the filter in questionhas a very narrow bandwidth, owing to the extremesensitivity of the filter performance versus dimensions.One often has to waste time to tune the simulated filterresponse in EM tools to ensure an accurate prediction.
Analyzing a filter’s internal voltage using a circuitmodel was first proposed by Young [12] for inductiveiris filters using the Chebyshev prototype. He also sug-gested the intrinsic connection between stored energyand filter group delay. The works in [13] and [14] veri-fied Young’s suggestion by directly establishing therelationship between stored energy and group delay,
Figure 4. EM and circuit analysis of a one pole combline filter.
0
−5
−10
−15
−20
−25
−30
−35
−40
RL
and
ILs
(dB
)
880 885 890 895 900
Legend
S1,1S1,2
Frequency (MHz) Fri 25 May 16:05:06 2007
Match
17
Cha
nnel
1 R
eso
Sto
red
Ene
rgy
(nJ/
W)
880 885 890 895 900
Frequency (MHz) Fri 25 May16:10:39 2007
Match
LegendW1
78
910111213
141516
E Field [V/m]
6.7982e+0046.3450e+0045.8918e+0045.4386e+0044.9854e+0044.5321e+0044.0789e+0043.6257e+0043.1725e+0042.7193e+0042.2661e+0041.8129e+0041.3596e+0049.0643e+0034.5321e+0030.0000e+000
7.2514e+004
(a) (b)
(c) (d)
Ionization breakdown is an RF gas (such as air) breakdownphenomenon where an initially lowelectron density increases in an avalanche-like manner.
October 2007 93
while [15] proposed general voltage formulation forgeneral cross-coupled filters by using a simple scalingbetween lumped and distributed circuits. References[16] and [17] introduced scaling from stored energy at asingle resonator level. In summary, this process (usingelectrical field strength as an example) can be summa-rized as the following:
• Define input power as Po.• Use a general multiple coupled circuit model (nor-
malized) to represent a given filter design usingsource voltage 2 V and source resistor 1 �.
• Calculate stored energy for every resonator Wc,i(ith ). It is most convenient to use units in nJ. Thesum of all stored energy will equal the filter groupdelay (in ns) since the maximum available poweris also normalized to 1.
• Create a most representative EM model of a singleresonator including all geometrical details.Perform eigen mode analysis and find the maxi-mum electrical field strength or voltages of inter-est. (Note in HFSS, field values in eigen modesolutions are normalized to 1 V/m, and the inter-nal integration calculator must be used to obtainstored energy. In CST MWS, field strength is moreconveniently calculated by normalizing storedenergy to 1 J). Normalize field value to storedenergy in nJ. Eem is then obtained.
• The maximum electrical field strength in the ithresonator for input power Po can then be scaled to
Emax,i =√
PoWc,i Eem.
• Similar to electrical field strength, the internalvoltage for the ith resonator is
Vmax,i =√
PoWc,iVem.
Vem is calculated following exactly the same processabove, except an extra line integration of the E field isadded. This is the most general approach for analyzingpeak field or voltage values by only performing theeigen mode solution for one resonator. Extensive com-putational effort over a complete filter structure can beavoided. This approach can also be applied to diplexersand even multiplexers to achieve an even greaterefficiency improvement.
A simple one-pole coaxial res-onator (combline) shown inFigure 4(a) is modeled using boththe circuit model (couplingmatrix) and the HFSS drivenmodel to demonstrate that a cir-cuit model can predict the storedenergy very accurately. The para-meters are found in Table 1.
Once EM data is acquired,the circuit model is adjusted to
fit the EM model so both have the same s-parameterresponse as shown in Figure 4(c). The stored energy cal-culation from the circuit model is 16.25 nJ (the groupdelay is also 16.25 ns) as shown in Figure 4(d). Using theHFSS internal field calculator to integrate the E fieldover the whole structure, the stored energy is found tobe 16.46 nJ. The difference is less than 1.3%. The E fieldmagnitude is shown in Figure 4(b). This process can bedone for multiresonator filters to draw similar conclu-sions. Since the circuit model gives good representationof the EM model for stored energy, it is used as the baseof scaling.
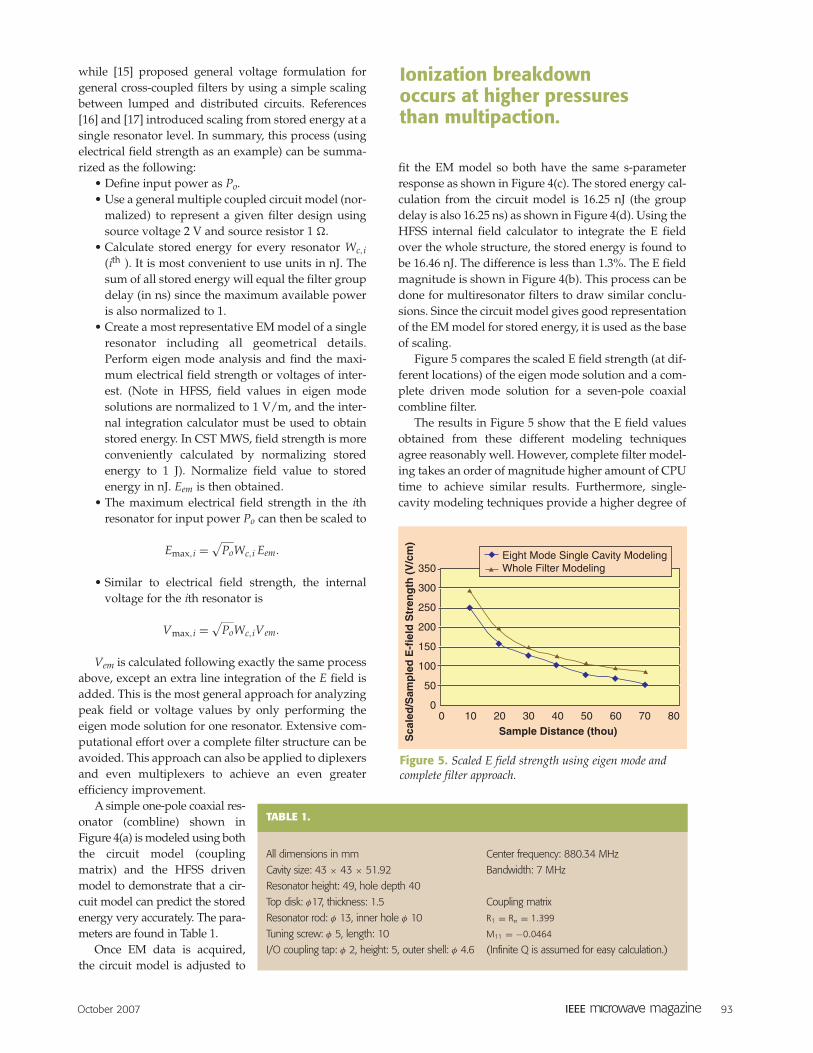
Figure 5 compares the scaled E field strength (at dif-ferent locations) of the eigen mode solution and a com-plete driven mode solution for a seven-pole coaxialcombline filter.
The results in Figure 5 show that the E field valuesobtained from these different modeling techniquesagree reasonably well. However, complete filter model-ing takes an order of magnitude higher amount of CPUtime to achieve similar results. Furthermore, single-cavity modeling techniques provide a higher degree of
Figure 5. Scaled E field strength using eigen mode andcomplete filter approach.
0 10 20 30 40 50 60 70 80
350
300
250
200
150
100
50
0
Sample Distance (thou)
Sca
led
/Sam
ple
d E
-fie
ld S
tren
gth
(V
/cm
)
Eight Mode Single Cavity ModelingWhole Filter Modeling
TABLE 1.
All dimensions in mm Center frequency: 880.34 MHz
Cavity size: 43 × 43 × 51.92 Bandwidth: 7 MHz
Resonator height: 49, hole depth 40
Top disk: φ17, thickness: 1.5 Coupling matrix
Resonator rod: φ 13, inner hole φ 10 R1 = Rn = 1.399
Tuning screw: φ 5, length: 10 M11 = −0.0464
I/O coupling tap: φ 2, height: 5, outer shell: φ 4.6 (Infinite Q is assumed for easy calculation.)
Ionization breakdown occurs at higher pressures than multipaction.
94 October 2007
confidence than whole filter modeling because themeshes on a single cavity model can be refined exten-sively due to comparably small volume and simplifiedEM effort.
For most waveguide filters, the voltage estimationprocedure based on the lumped-element prototype net-work can be further simplified [15], [18]. No EM mod-eling is actually required in many cases. Voltages and
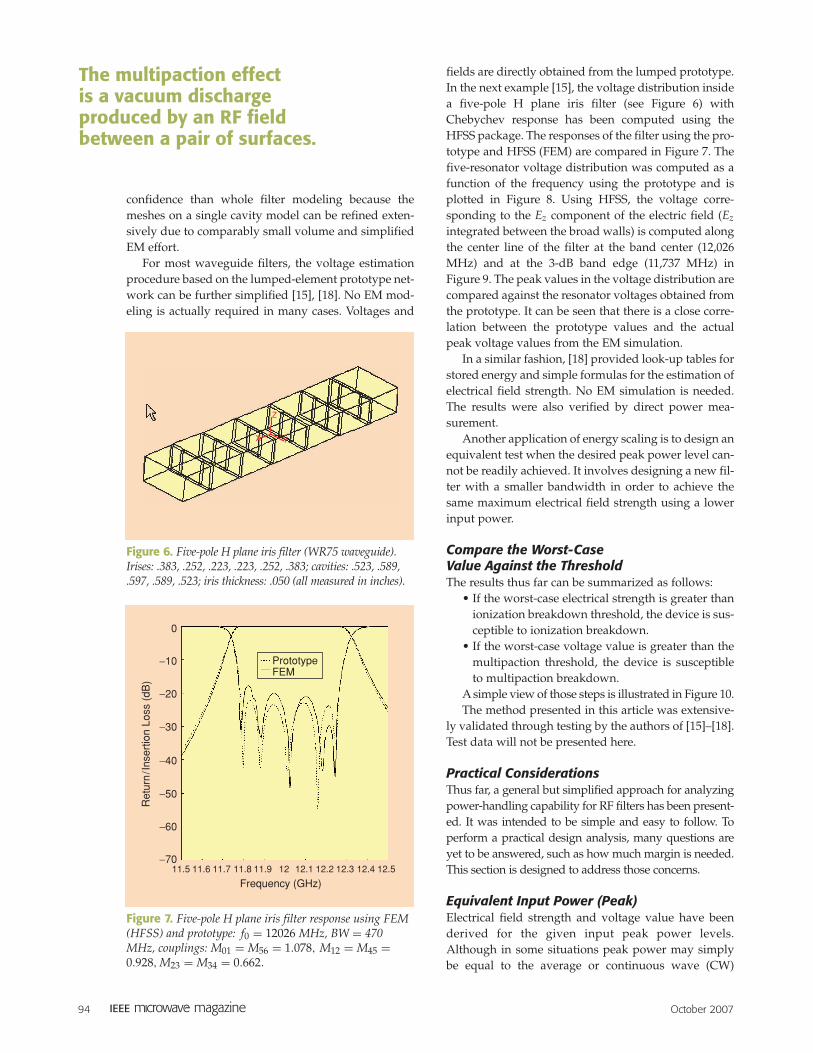
fields are directly obtained from the lumped prototype.In the next example [15], the voltage distribution insidea five-pole H plane iris filter (see Figure 6) withChebychev response has been computed using theHFSS package. The responses of the filter using the pro-totype and HFSS (FEM) are compared in Figure 7. Thefive-resonator voltage distribution was computed as afunction of the frequency using the prototype and isplotted in Figure 8. Using HFSS, the voltage corre-sponding to the Ez component of the electric field (Ez
integrated between the broad walls) is computed alongthe center line of the filter at the band center (12,026MHz) and at the 3-dB band edge (11,737 MHz) inFigure 9. The peak values in the voltage distribution arecompared against the resonator voltages obtained fromthe prototype. It can be seen that there is a close corre-lation between the prototype values and the actualpeak voltage values from the EM simulation.
In a similar fashion, [18] provided look-up tables forstored energy and simple formulas for the estimation ofelectrical field strength. No EM simulation is needed.The results were also verified by direct power mea-surement.
Another application of energy scaling is to design anequivalent test when the desired peak power level can-not be readily achieved. It involves designing a new fil-ter with a smaller bandwidth in order to achieve thesame maximum electrical field strength using a lowerinput power.
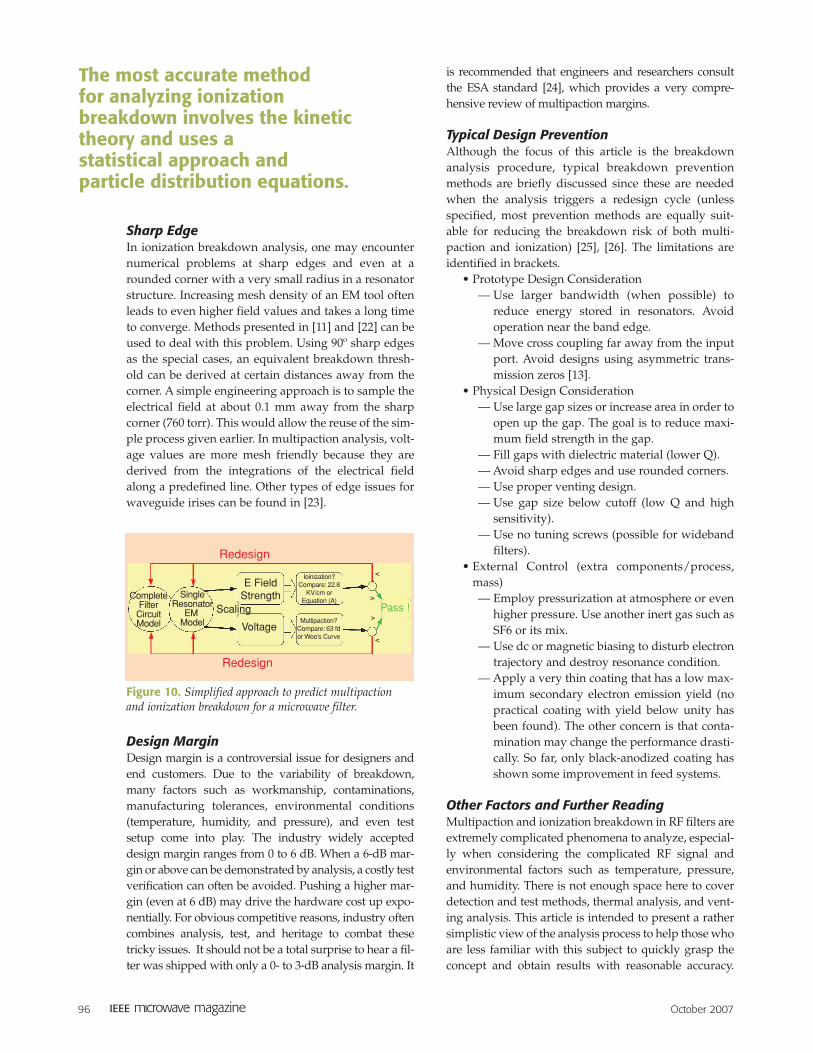
Compare the Worst-Case Value Against the ThresholdThe results thus far can be summarized as follows:
• If the worst-case electrical strength is greater thanionization breakdown threshold, the device is sus-ceptible to ionization breakdown.
• If the worst-case voltage value is greater than themultipaction threshold, the device is susceptibleto multipaction breakdown.
A simple view of those steps is illustrated in Figure 10.The method presented in this article was extensive-
ly validated through testing by the authors of [15]–[18].Test data will not be presented here.
Practical ConsiderationsThus far, a general but simplified approach for analyzingpower-handling capability for RF filters has been present-ed. It was intended to be simple and easy to follow. Toperform a practical design analysis, many questions areyet to be answered, such as how much margin is needed.This section is designed to address those concerns.
Equivalent Input Power (Peak)Electrical field strength and voltage value have beenderived for the given input peak power levels.Although in some situations peak power may simplybe equal to the average or continuous wave (CW)
Figure 7. Five-pole H plane iris filter response using FEM(HFSS) and prototype: f0 = 12026 MHz, BW = 470MHz, couplings: M01 = M56 = 1.078, M12 = M45 =0.928, M23 = M34 = 0.662.
0
−10
−20
−30
−40
−50
−60
−7011.5 11.6 11.7 11.8 11.9 12 12.1 12.2 12.3 12.4 12.5
Frequency (GHz)
Ret
urn
/Ins
ertio
n Lo
ss (
dB)
PrototypeFEM
The multipaction effect is a vacuum discharge produced by an RF field between a pair of surfaces.
Figure 6. Five-pole H plane iris filter (WR75 waveguide).Irises: .383, .252, .223, .223, .252, .383; cavities: .523, .589,.597, .589, .523; iris thickness: .050 (all measured in inches).
X
Z
Y

October 2007 95
power Po specified, peak power level is usually deter-mined based on possible failure modes, modulationschemes, mismatch conditions, and the number of car-riers. The peak power value used in the analysis isoften raised to an equivalent (higher) value Pe to reflectthose practical concerns.
• Mismatch: Raise input peak power level
Pe = (1 + |�|)2Po,
when � = −1 (short circuit), Pe = 4Po.
• Different modulation schemes (or air interfaces) willresult in very diverse peak-to-average ratios. Codedivision multiple access (CDMA) is considered oneof the bad cases in that aspect. Often, a CDMA sys-tem with only 70 W input power has to be analyzedfrom Pe = 700 to 1,000 W of peak power. Peak-to-average ratio values for different modulation/cod-ing schemes are listed in Table 2 [19].
Multicarrier OperationIn general, the worst-case equivalent peak power Pe forN carriers of equal power Po is
Pe = N2Po.
When N is small (up to four), the above formulaprovides a reasonable worst-case estimation of Pe.When N gets larger, the phase mismatch between Ncarriers (as they are usually random in nature) willreduce the dwell time of in-phase conditions [20], [21].When a large number of carriers with different fre-quencies (even different steps sizes) and amplitudesare added together, the voltage envelope is no longersinusoidal with constant amplitude. Instead, itdepends on the relative phase of each carrier andbecomes time dependent. For example, at one point,when the carriers are all in phase, they produce highfield/voltage values; at another, when the carriers are
all out of phase, they produce values close to zero.This phenomenon severely limits the possibility of theinitialization of any breakdown process, because thefield amplitude in a multicarrier component willrarely exceed the threshold. Even if the thresholdwere exceeded, it might not hold long enough to sus-tain the growth of electron population that wouldeventually lead to breakdown. For ionization break-down analysis, one may use either reduced pulsewidths together with (1) or apply proper deratingfrom [20]. For multipaction breakdown, a differentmode order must be considered in detail [21] togetherwith 20-gap crossing rules (T20) [1]. By using opti-mization, modes exceeding T20 will be selected andpresented with newly reduced multipaction break-down thresholds.
Figure 8. Resonator voltages (4) as a function of frequencyfor the five-pole iris filter.
8
7
6
5
4
3
2
0
1
Vol
tage
Rat
io
10.8 11 11.211.411.611.8 12 12.212.412.612.8 13 13.2
Frequency (GHz)
Cavity-1Cavity-2Cavity-3Cavity-4Cavity-5
TABLE 2. Peak-to-average ratio for different modulation/coding schemes.
Air Interface Typical Peak to Average Ratio (dB)
AMPS Single Carrier 0
GSM Single Carrier 1.5
TDMA Single Carrier 3.5
IS-95 CDMA Single Carrier 10
WCDMA/UMTS Single Carrier 8-9
IS-95 CDMA Multicarrier 10.5
WCDMA/UMTS Multicarrier 12.2
Edge Multicarrier 9
The parallel plate model is the most common approach forestablishing a multipaction threshold for waveguide structures.
Figure 9. Voltage distribution along the center line of thefilter using FEM and a comparison of the peak values to thevalues obtained using the prototype method.
Band Center (FEM)
Band Edge (Circuit Model)
Band Center (Circuit Model)
Band Edge (FEM)
8
7
6
5
4
3
2
1
0
Vol
tage
Rat
io
−0.5 0 0.5 1 1.5 2 2.5 3 3.5 4 4.5
Distance from feed point (in)
96 October 2007
Sharp EdgeIn ionization breakdown analysis, one may encounternumerical problems at sharp edges and even at arounded corner with a very small radius in a resonatorstructure. Increasing mesh density of an EM tool oftenleads to even higher field values and takes a long timeto converge. Methods presented in [11] and [22] can beused to deal with this problem. Using 90º sharp edgesas the special cases, an equivalent breakdown thresh-old can be derived at certain distances away from thecorner. A simple engineering approach is to sample theelectrical field at about 0.1 mm away from the sharpcorner (760 torr). This would allow the reuse of the sim-ple process given earlier. In multipaction analysis, volt-age values are more mesh friendly because they arederived from the integrations of the electrical fieldalong a predefined line. Other types of edge issues forwaveguide irises can be found in [23].
Design MarginDesign margin is a controversial issue for designers andend customers. Due to the variability of breakdown,many factors such as workmanship, contaminations,manufacturing tolerances, environmental conditions(temperature, humidity, and pressure), and even testsetup come into play. The industry widely accepteddesign margin ranges from 0 to 6 dB. When a 6-dB mar-gin or above can be demonstrated by analysis, a costly testverification can often be avoided. Pushing a higher mar-gin (even at 6 dB) may drive the hardware cost up expo-nentially. For obvious competitive reasons, industry oftencombines analysis, test, and heritage to combat thesetricky issues. It should not be a total surprise to hear a fil-ter was shipped with only a 0- to 3-dB analysis margin. It
is recommended that engineers and researchers consultthe ESA standard [24], which provides a very compre-hensive review of multipaction margins.
Typical Design PreventionAlthough the focus of this article is the breakdownanalysis procedure, typical breakdown preventionmethods are briefly discussed since these are neededwhen the analysis triggers a redesign cycle (unlessspecified, most prevention methods are equally suit-able for reducing the breakdown risk of both multi-paction and ionization) [25], [26]. The limitations areidentified in brackets.
• Prototype Design Consideration— Use larger bandwidth (when possible) to
reduce energy stored in resonators. Avoidoperation near the band edge.
— Move cross coupling far away from the inputport. Avoid designs using asymmetric trans-mission zeros [13].
• Physical Design Consideration— Use large gap sizes or increase area in order to
open up the gap. The goal is to reduce maxi-mum field strength in the gap.
— Fill gaps with dielectric material (lower Q).— Avoid sharp edges and use rounded corners.— Use proper venting design.— Use gap size below cutoff (low Q and high
sensitivity).— Use no tuning screws (possible for wideband
filters).• External Control (extra components/process,
mass)— Employ pressurization at atmosphere or even
higher pressure. Use another inert gas such asSF6 or its mix.
— Use dc or magnetic biasing to disturb electrontrajectory and destroy resonance condition.
— Apply a very thin coating that has a low max-imum secondary electron emission yield (nopractical coating with yield below unity hasbeen found). The other concern is that conta-mination may change the performance drasti-cally. So far, only black-anodized coating hasshown some improvement in feed systems.
Other Factors and Further ReadingMultipaction and ionization breakdown in RF filters areextremely complicated phenomena to analyze, especial-ly when considering the complicated RF signal andenvironmental factors such as temperature, pressure,and humidity. There is not enough space here to coverdetection and test methods, thermal analysis, and vent-ing analysis. This article is intended to present a rathersimplistic view of the analysis process to help those whoare less familiar with this subject to quickly grasp theconcept and obtain results with reasonable accuracy.
Figure 10. Simplified approach to predict multipactionand ionization breakdown for a microwave filter.
CompleteFilter
CircuitModel
SingleResonator
EM Model
Scaling
E FieldStrength
Voltage
Ioinization?Compare: 22.8
KV/cm orEquation (A)
Multipaction?Compare: 63 fdor Woo’s Curve
Pass !
vv
vv
Redesign
Redesign
The most accurate method for analyzing ionization breakdown involves the kinetictheory and uses a statistical approach and particle distribution equations.

October 2007 97
Readers are encouraged to consult the references to gainmore insight. ESA and NASA documents [1], [2], [24],[25] should be consulted first to gain historic perspec-tives. The most referenced work from Hatch andWilliams [27] is also provided for thoroughness.
ConclusionsA simplified method for evaluating the power-handlingcapability inside an RF filter has been introduced basedon the general cross-coupled prototype network theory,modern EM modeling techniques, and well-establishedbreakdown threshold analysis. The electrical fieldstrength and voltages evaluated using either the single-cavity resonator (eigen mode) model or simply the pro-totype model have been presented and comparedagainst the direct EM computation of the complete filterstructure. Close agreement has been found between thefull EM modeling and the scaling of a single resonatoror even prototype network analysis only. This proce-dure is expected to simplify the multipaction and ion-ization breakdown analysis of filters and filter-baseddiplexers and multiplexers. The method presented isgeneral and is applicable to all filter types that can bedescribed in a circuit model. Practical issues such as themulticarrier operation, sharp edge condition, designmargin, and prevention techniques are also covered.
AcknowledgementThe author would like to acknowledge many usefuldiscussions and some material provided by A.Panariello, T. Olsson, Y. Wang, and Q. Shi.
References[1] A. Woode and J. Petit, “Diagnostic investigations into the multi-
pactor effect, Susceptibility zone measurements and parametersaffecting a discharge,” Eur. Spacy Agency, Noordwijk, TheNetherlands, ESTEC Working Paper 1556, Nov. 1989.
[2] R. Woo, “Final report on RF voltage breakdown in coaxial trans-mission lines,” Jet Propulsion Lab, CA, U.S.A., Tech. Rep. 32-1500,Oct. 1970.
[3] G. Schennum and G. Rosati; “Minimizing passive intermodula-tion product generation in high power satellites,” in Proc. IEEEAerospace Applications Conf., Feb. 3–10 1996, vol. 3, pp. 155–164.
[4] M. Yu, “Introduction to practical aspects of microwave filterdesign and realization,” in Proc. IEEE Int,l Microwave Symp.,Workshop WMB: “Filter II: Practical Aspects of Microwave FilterDesign and Realization,” Long Beach, Jun. 2005
[5] A.D. MacDonald, Microwave Breakdown in Gases. New York: Wiley, 1966.
[6] D. Anderson, U. Jordan, M. Lisak, T. Olsson, and M. Ahlander“Microwave breakdown in resonators and filter,” IEEE Trans.Microwave Theory Tech., vol. 47, no. 12, pp. 2547–2556, 1999.
[7] J. Puech, M. Merecki, D. Anderson, M. Buyanova, D. Doroshkina,U. Jordan, L. Lapierre, M. Lisak, V.E. Semenov, J. Sombrin, and R.Udilijak, “Microwave discharge research activities within the con-test of the Chalmers University (Sweden)/Institute of AppliedPhysics (Russia)/CNES (France) project,” in Proc. 4th Int.Workshop on Multipactor, Corona and Passive Intermodulation inSpace RF Hardware (MULCOPIM 2003), ESTEC Noordwijk, theNetherlands, Sep. 2003.
[8] U. Jordan, D. Anderson, L. Lapierre, M. Lisak, T. Olsson, J. Puech,V. Semenov, J. Sombrin, and R. Tomala, “On the effective diffusion
length for microwave breakdown,” IEEE Trans. Plasma Science,vol. 34, no. 2, pp. 421–430, Apr. 2006.
[9] D. Doroshkina, V.E. Semenov, T. Olsson, D. Anderson, U. Jordan,J. Puech, L. Lapierre, and M. Lisak, “Investigation of time delaysin microwave breakdown initiation,” Phys. Plasma, vol. 13, p.013506, 2006.
[10] D.G. Anderson, M. Lisak, and P.T. Lewin “Thermal lowering ofthe threshold for microwave breakdown in airfilled waveguides,“IEEE Trans. Microwave Theory Tech., vol. 35, no. 7, pp. 653–656, 1987.
[11] T. Olsson, U. Jordan, D.S. Dorozhkina, V. Semenov, D.Anderson, M. Lisak, J. Puech, I. Nefedov, and I. Shereshevskii,“Microwave breakdown in RF devices containing sharp cor-ners,” Microwave Symp. Dig., IEEE MTT-S Int., pp. 1233–1236,June 2006.
[12] L. Young, “Peak internal fields in direct-coupled-cavity fil-ters,” IEEE Trans. Microwave Theory Tech., vol. 8, no. 6, pp.612–616, 1960.
[13] C. Ernst and V. Postoyalko, “Comparison of the stored energydistributions in a QC-type and a TC-type prototype with the samepower transfer function,” in IEEE MTT-S Int. Microwave Symp.Dig., Jun. 1999, vol. 3, pp. 1339–1342.
[14] C. Ernst, V. Postoyalko, and N. Khan, “Relationship betweengroup delay and stored energy in microwave filters,” IEEE Trans.Microwave Theory Tech., vol. 49, no. 1, pp. 192–196, Jan. 2001.
[15] A. Sivadas, M. Yu, and R. Cameron, “A simplified analysis forhigh power microwave bandpass filter structures,” in Proc. Int.Symp. IEEE Microwave Theory and Techniques, Boston, MA, June2000, vol. 3, pp. 1771–1774.
[16] A.R. Harish and R.J. Cameron, “Peak voltage analysis in highpower microwave filters,” in Proc. IEE Colloquium on MicrowaveFilters and Multiplexers, Nov. 2000, pp. 10/1–10/5.
[17] C. Wang and K. Zaki; “Analysis of power handling capacity ofband pass filters,” in IEEE MTT-S Int. Microwave Symp. Dig., May20–25, 2001, vol. 3, pp. 1611–1614.
[18] C. Ernst and V. Postoyalko, “Prediction of peak internal fields indirect-coupled-cavity filters,” IEEE Trans. Microwave Theory Tech.,vol. 51, no. 1, pp. 64–73, Jan. 2003.
[19] P. Burns, Software Defined Radio for 3G. Dedham, MA: ArtechHouse, 2002.
[20] U. Jordan, V.E. Semenov, D. Anderson, M. Lisak, and T. Olsson,“Microwave breakdown in air for multi-carrier, modulated or sto-chastically time varying RF fields,” J. Physics D: Applied Physics,vol. 36, no. 2003, pp. 861–867, 2003.
[21] A.J. Marrison, R. May, J.D. Sanders, A.D. Dyne, A.D. Rawlins,and J. Petit, “A study of multipaction in multicarrier RF compo-nents,” rep. AEA/TYKB/31761/01/RP/05, no. 1, Jan. 1997.
[22] A. Panariello, M. Yu, and T. Olsson, “Modeling and valida-tion of microwave filter breakdown in air,” in Proc. Int.Workshop on Microwave Filters, Oct. 16–18, 2006, CNES,Toulouse, France.
[23] Hughes Aircraft Company, “The study of multipactor break-down in space electronic systems,” Culver City, CA, U.S.A.,NASA Report CR-448, contract NAS 5-3916.
[24] “Multipaction design and test,” European Space Agency,Noorwijk, The Netherlands, ECSS-E-20-01A, May 5, 2003.
[25] G. Matthaei, L. Young, and E.M.T. Jones, Microwave Filters,Impedance-Matching Networks and Coupling Structures. Dedham,MA: Artech House, 1980, ch. 15.
[26] R. Cameron, R. Mansour and C. Kudsia, Microwave Filters forCommunication Systems Fundamentals, Design and Applications, 1sted. New York: Wiley, 1997, ch. 20.
[27] A.J. Hatch and H.B. Williams, “Multipacting modes of high fre-quency gaseous breakdown,” The Physical Rev. (2nd Series), vol.112, no. 3, pp. 681–685, Nov. 1958.
As some of the references may be hard to find, the readers may find themat http://ece.uwaterloo.ca/~mingyu